office and retail markets in downtown burlington · group and burlington city council with...
TRANSCRIPT

Office & Retail MarketsDowntown Burlington

© Deloitte & Touche LLP and affiliated entities.
May 2, 2012
Mr. Kyle BenhamBurlington Economic Development Corporation414 Locust Street, Suite 203Burlington, Ontario L7S 1T7
Re: Office and Retail Markets in Downtown Burlington
Deloitte Real Estate is pleased to submit our findings regarding office and retail markets in Downtown Burlington. We would like to thank you for engaging us to undertake this work and hope that it will provide the Downtown Task Group and Burlington City Council with insightful analysis to guide the update of the Downtown strategy and important decisions affecting the future of Downtown Burlington.
We would also like to thank the Downtown Task Group and other local stakeholders who provided their time and insights during the preparation of this analysis.
Sincerely,
Sheila Botting, FCMC, FRICS, AACI (Hon) Sean Finlay, MBAPartner & National Leader Manager, Real Estate AdvisoryDeloitte Real Estate Deloitte Real Estate
1
Deloitte & Touche LLPSuite 1400, Brookfield Place181 Bay StreetToronto, ON M5J 2V1
Tel: 416-601-4686Fax: 416-601-6690www.deloitte.ca

© Deloitte & Touche LLP and affiliated entities.
Table of Contents
1. Background 2. Office market trends
• GTA office market trends• GTA West office market trends• Burlington office in context• Comparative office location costs
3. Downtown Burlington office development• Parking lots 4 & 5• Benchmark development costs
4. Retail market trends• Downtown Burlington retail• Other shopping locations• Comparative costs of retail
5. Downtown Burlington competitive environment• Impact of transformation / densification• Comparison with other downtowns• Criteria for office development
2

© Deloitte & Touche LLP and affiliated entities.
Background
3 Office & Retail Markets in the Downtown

© Deloitte & Touche LLP and affiliated entities.
Scope of Study
Background
Downtown Burlington has become a vibrant community, revitalized by a range of initiatives including the intensification of condominium development, focus on tourism and related retail activity. The City of Burlington has developed a thoughtful Downtown strategy to ensure the sustainable and viable downtown community.
The City of Burlington is considering using its real estate assets, namely a strategically located parking lot, to enhance further economic development potential. The City is weighing the opportunity of developing an office building that would attract employers and add a day-time population and further economic activity. Deloitte Real Estate was engaged to assist the Burlington Economic Development Corporation in exploring the market opportunity for this office project.
4
© Deloitte & Touche LLP and affiliated entities.
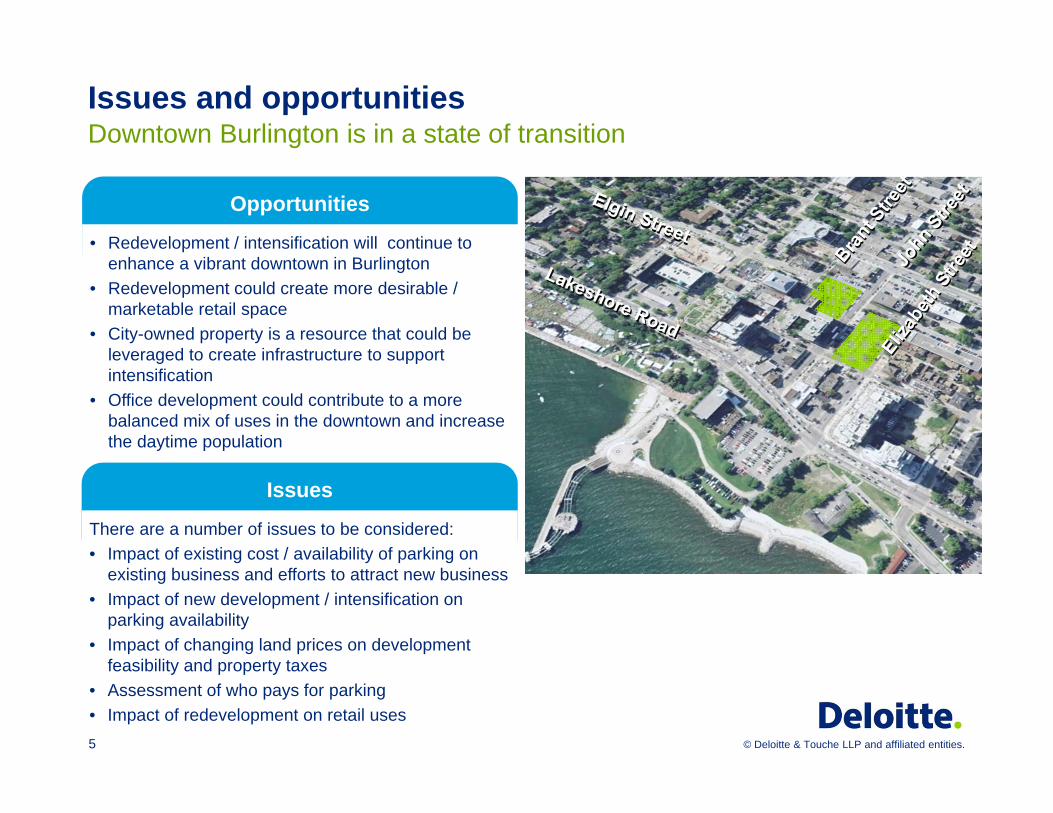
Issues and opportunitiesDowntown Burlington is in a state of transition
5
Opportunities
• Redevelopment / intensification will continue to enhance a vibrant downtown in Burlington
• Redevelopment could create more desirable / marketable retail space
• City-owned property is a resource that could be leveraged to create infrastructure to support intensification
• Office development could contribute to a more balanced mix of uses in the downtown and increase the daytime population
Issues
There are a number of issues to be considered:• Impact of existing cost / availability of parking on
existing business and efforts to attract new business• Impact of new development / intensification on
parking availability• Impact of changing land prices on development
feasibility and property taxes• Assessment of who pays for parking• Impact of redevelopment on retail uses

© Deloitte & Touche LLP and affiliated entities.
Project objectivesDowntown strategy update and review of parking lots #4 and #5
6
Questions for market opportunity
• What is the demand/opportunity for office development in the downtown?
• How do costs compare for office and retail space in the downtown versus suburban locations?
• What are the financial pressures affecting retail tenants in the downtown?
• What other factors affect decisions of office and retail tenants in considering whether or not to locate in the downtown?
• How competitive is the downtown as a place to do business?
Parking Lot #4 & #5 Development
• What are the opportunities for the Lot #4 and #5 site from an office perspective?
• Is office development feasible?• How much office space can be
supported?• What are reasonable expectations for
rents and operating expenses?• What factors / levers are required to
facilitate a downtown office project?

© Deloitte & Touche LLP and affiliated entities.
Office market trends
7 Office & Retail Markets in the Downtown

© Deloitte & Touche LLP and affiliated entities.
GTA office market trendsOffice market tightening despite continued economic uncertainty
8
Economic Trends Driving Office Demand
• GDP is growing albeit modestly• Still a significant degree of economic uncertainty• Companies are looking for opportunities to cut costs, including real estate• Government spending forecast to decline considerably• Business investment forecast to moderate which is key driver for office demand
Real GDP: Canada & U.S.
Source: BMO Economics, 2012
-4%
-2%
0%
2%
4%
6%
2001 2003 2005 2007 2009 2011 2013f
CanadaUSA
Business Investment & Gov’t Spending
0.0%
2.0%
4.0%
6.0%
8.0%
10.0%
12.0%
14.0%
2010 2011 2012f 2013f
GovernmentSpendingBusinessInvestment

© Deloitte & Touche LLP and affiliated entities.
GTA Office Market (All Classes)Declining vacancy and positive absorption
9
In the GTA, vacancy rates have declined since 2009 to 6.7% today and reflect “balanced” market conditions between supply and demand.
Cushman & Wakefield. Reflects office buildings 20,000 sf+ in size, excluding owner occupied buildings.
0.0%
2.0%
4.0%
6.0%
8.0%
10.0%
12.0%
-2,000,000
-1,000,000
0
1,000,000
2,000,000
3,000,000
4,000,000
5,000,000
2001 2002 2003 2004 2005 2006 2007 2008 2009 2010 2011 2012YTD
Vaca
ncy
Rat
e (%
)
Net
Abs
orpt
ion
/ Con
stru
ctio
n C
ompl
etio
ns (s
f)
Annual Absorption Construction Completions Vacancy Rate
11.2%
6.7%

© Deloitte & Touche LLP and affiliated entities.
Greater TorontoVacancy rates relatively low and declining
10
Cushman & Wakefield Q4, 2011. Office buildings > 20,000 sf, excl. owner occupied.
0.0%
2.0%
4.0%
6.0%
8.0%
10.0%
12.0%
GTA GTACentral
GTAEast
GTAWest
GTANorth
Vaca
ncy
Rat
e
Q4 2009Q4 2010Q4 2011
Vacancy rates have trended down across the GTA. GTA West has remained higher due to new construction activity.
GTA Central
84.7 m sf50.3%
GTA East 33.0 m sf
19.6%
GTA West36.3 m sf
21.5%
GTA North
14.6 m sf8.6%
GTA west is the largest concentration of office space after GTA central with 21.5% share
Total GTA Inventory: 168,455,835 sf
© Deloitte & Touche LLP and affiliated entities.
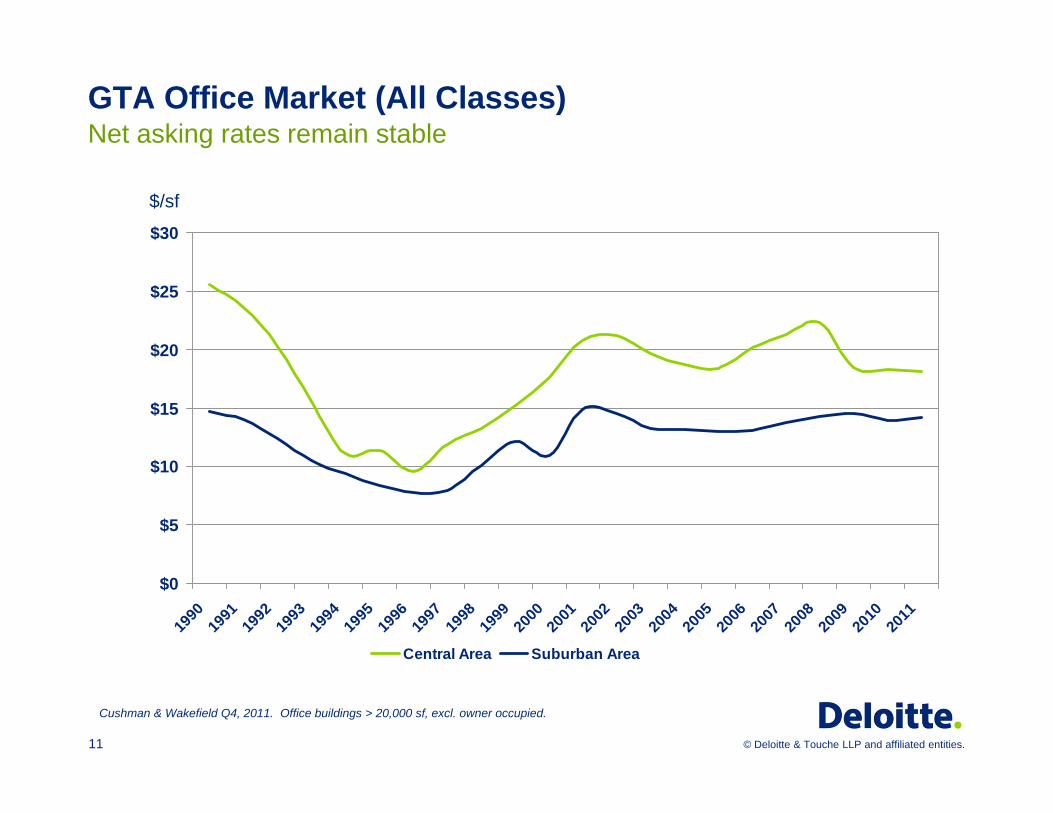
GTA Office Market (All Classes)Net asking rates remain stable
11
$0
$5
$10
$15
$20
$25
$30
1990
1991
1992
1993
1994
1995
1996
1997
1998
1999
2000
2001
2002
2003
2004
2005
2006
2007
2008
2009
2010
2011
Central Area Suburban Area
$/sf
Cushman & Wakefield Q4, 2011. Office buildings > 20,000 sf, excl. owner occupied.

© Deloitte & Touche LLP and affiliated entities.
GTA WestNet asking rates by Class
12Cushman & Wakefield Q4, 2011.
$8
$10
$12
$14
$16
$18
$20
Q3 2004 Q1 2005 Q3 2005 Q1 2006 Q3 2006 Q1 2007 Q3 2007 Q1 2008 Q3 2008 Q1 2009 Q3 2009 Q1 2010 Q3 2010
Net R
ent (
$/sf/y
r)
Class A Class B Class C All ClassesSource: Cushman & Wakefield Ltd.

© Deloitte & Touche LLP and affiliated entities.
GTA West Office Market (All Classes)Stable vacancy and moderating absorption
13
In the GTA West, vacancy rates have remained at 10% with demand moderating due to weakened US demand that continues to affect US subsidiaries with offices in west markets.
Cushman & Wakefield. Reflects office buildings 20,000 sf+ in size, excluding owner occupied buildings.
0.0%
2.0%
4.0%
6.0%
8.0%
10.0%
12.0%
14.0%
16.0%
-500,000
0
500,000
1,000,000
1,500,000
2,000,000
2001 2002 2003 2004 2005 2006 2007 2008 2009 2010 2011 2012YTD
Annual Absorption Construction Completions Vacancy Rate
13.4%
10.1%
© Deloitte & Touche LLP and affiliated entities.
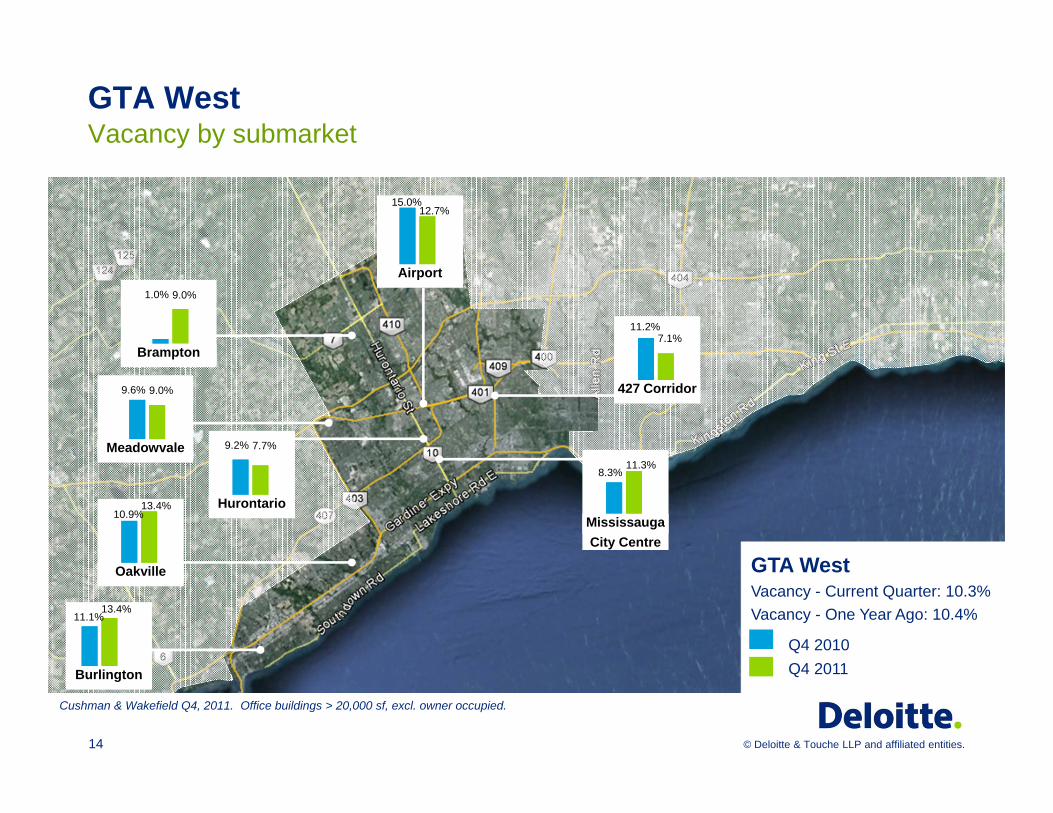
GTA West Vacancy by submarket
14
10.9%13.4%
Oakville
11.1%13.4%
Burlington
11.2%7.1%
427 Corridor
9.2% 7.7%
Hurontario
15.0%12.7%
Airport
9.6% 9.0%
Meadowvale
8.3%11.3%
MississaugaCity Centre
1.0% 9.0%
Brampton
GTA West Vacancy - Current Quarter: 10.3%Vacancy - One Year Ago: 10.4%
Q4 2011Q4 2010
Cushman & Wakefield Q4, 2011. Office buildings > 20,000 sf, excl. owner occupied.

© Deloitte & Touche LLP and affiliated entities.15
GTA West Office Inventory – All ClassesSubmarket Floor Area (sf) % of TotalBloor & Islington 1,113,184 2.8%
Hwy 27 Corridor 2,471,465 6.3%
Airport 11,415,574 29.0%
Hurontario 4,016,961 10.2%
Mississauga City Ctr. 3,457,523 8.8%
Cooksville 642,639 1.6%
Sheridan 885,205 2.2%
Meadowvale 5,238,162 13.3%
Oakvile 2,581,910 6.5%
Brampton 2,219,011 5.6%
St. Clair West 418,838 1.1%
Western Fringe 1,794,733 4.6%
Subtotal GTA West 36,255,205 92.0%
Burlington 3,163,754 8.0%
Total GTA West Markets 39,418,959 100.0%
GTA WestInventory by Submarket

© Deloitte & Touche LLP and affiliated entities.
Factors driving new office development in the GTATenants seeking cost efficiency
16
Tenant Perspective
• Focus on cost efficiency driving focus on consolidation and removal of redundant and ineffective space.
• Preference for green/sustainable buildings with lower operating costs and ability to deliver corporate social responsibility metrics.
• Changing work environments not conducive to legacy buildings / floor-plates especially for large tenants.
• Accessibility to employees / talent pool crucial.
• Changing demographics and technology drive new workplace requirements.
• Fuel costs and congestion contributing to renewed interest in transit hubs. Union station accessibility has become an increasing tenant requirement.
• In the 905, surface parking is a requirement and reflected in net rent.

© Deloitte & Touche LLP and affiliated entities.
Factors driving new office development in the GTAOffice development driven by tenants and capital seeking safe assets
17
Owner / Investor Perspective
• Flight to safety has produced strong investment appetite for high-quality assets.
• Large developers sponsored by pension plans seek yield/returns.
• Institutions driving investment, reducing speculative development.
• Projects not moving ahead without tenant commitments.
• Drive toward LEED and sustainability as influenced by Corporate Social Responsibility guidelines from major space users.
• Pressure to retrofit existing buildings to meet cost and performance requirements of newer buildings, particularly for larger tenants.

© Deloitte & Touche LLP and affiliated entities.
GTA West Office DevelopmentExamples of major tenants seeking to consolidate
Tenant / Developer Location Details
Tenant:Siemens Canada Developer: First Gulf Corporation and Sun Life Financial
• Oakville • QEW & Ford
Drive (North Service Road)
• 110,000 sf, 5 storey building• LEED Gold• Highway visibility / access• Gateway location (Oakville-Mississauga)• Corporate headquarters (consolidation)
housing 800 employees• Asking $19.50 psf net + $7 psf TMI
Tenant: Canadian Tire Financial Services Developer: PaulsProperties Corporation
• Oakville• Great Lakes
Business Park• Burloak and
QEW
• Class A, 65,000 sf, single storey building• 320 employees• Asking $17.95 psf net
Tenant: PricewaterhouseCoopers LLPDeveloper: First Gulf Corporation
• Midtown Oakville
• QEW/Trafalgar• GO Station
• Class A , 150,000 sf, 6 storey building• 25,000 sf floor plates• LEED Gold• Highway visibility / access• Consolidation
18
© Deloitte & Touche LLP and affiliated entities.
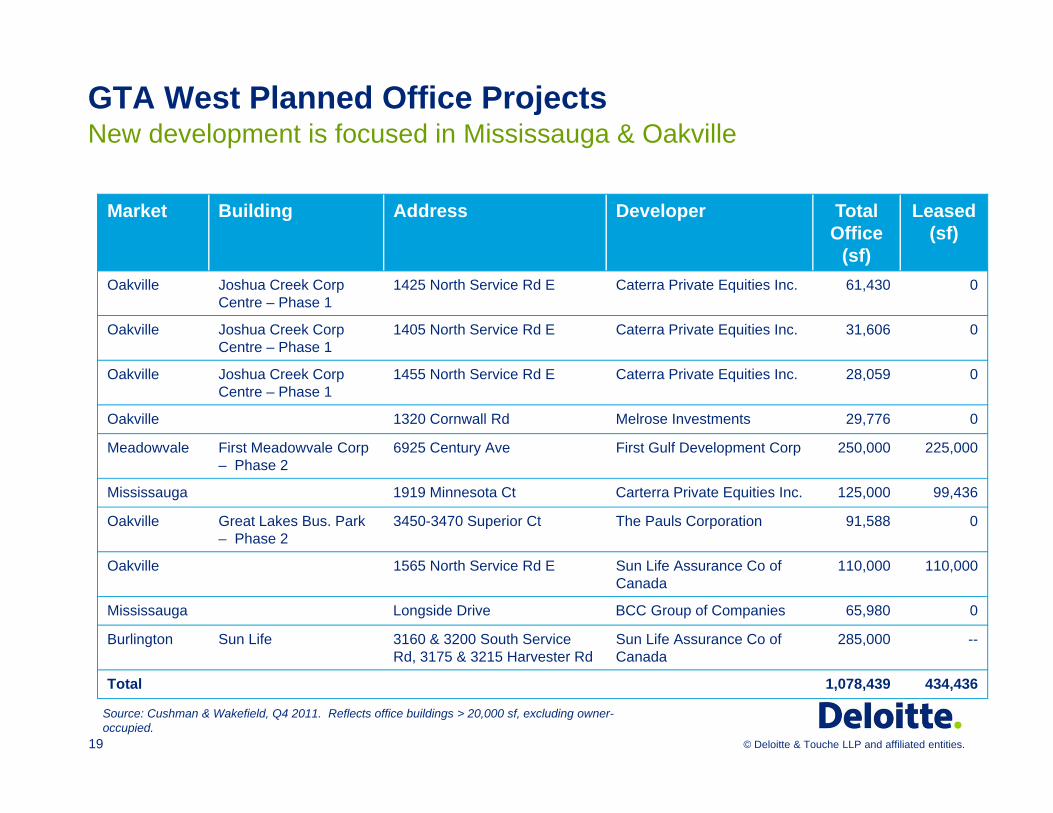
GTA West Planned Office ProjectsNew development is focused in Mississauga & Oakville
19
Market Building Address Developer Total Office
(sf)
Leased (sf)
Oakville Joshua Creek Corp Centre – Phase 1
1425 North Service Rd E Caterra Private Equities Inc. 61,430 0
Oakville Joshua Creek Corp Centre – Phase 1
1405 North Service Rd E Caterra Private Equities Inc. 31,606 0
Oakville Joshua Creek Corp Centre – Phase 1
1455 North Service Rd E Caterra Private Equities Inc. 28,059 0
Oakville 1320 Cornwall Rd Melrose Investments 29,776 0
Meadowvale First Meadowvale Corp – Phase 2
6925 Century Ave First Gulf Development Corp 250,000 225,000
Mississauga 1919 Minnesota Ct Carterra Private Equities Inc. 125,000 99,436
Oakville Great Lakes Bus. Park – Phase 2
3450-3470 Superior Ct The Pauls Corporation 91,588 0
Oakville 1565 North Service Rd E Sun Life Assurance Co of Canada
110,000 110,000
Mississauga Longside Drive BCC Group of Companies 65,980 0
Burlington Sun Life 3160 & 3200 South Service Rd, 3175 & 3215 Harvester Rd
Sun Life Assurance Co of Canada
285,000 --
Total 1,078,439 434,436
Source: Cushman & Wakefield, Q4 2011. Reflects office buildings > 20,000 sf, excluding owner-occupied.

© Deloitte & Touche LLP and affiliated entities.
Burlington Office Market (All Classes)Decreasing vacancy and flat rents, consistent with overall trends
20
Vacancy has increased since 2010 and is higher than the GTA West avg. (10.1%)
Asking rents remain flat and are in line with suburban GTA average
Source: DTZ Barnicke. Reflects office space > 20,000 sf, excluding owner-occupied buildings.
$0.00
$5.00
$10.00
$15.00
$20.00
$25.00
$30.00
Q1 Q2 Q3 Q4 Q1 Q2 Q3 Q4 Q1 Q2 Q3 Q4
Ave
rage
Ask
ing
Ren
t ($
/ sf)
Additional Rent Net Rent
20112009 2010
0.0%
2.0%
4.0%
6.0%
8.0%
10.0%
12.0%
14.0%
16.0%
(200,000)
(150,000)
(100,000)
(50,000)
0
50,000
100,000
150,000
200,000
Q1 Q2 Q3 Q4 Q1 Q2 Q3 Q4 Q1 Q2 Q3 Q4V
acan
cy R
ate
Net
Abs
orpt
ion
(sf)
Net Absorption Vacancy Rate
20112009 2010
13.4%14.7%

© Deloitte & Touche LLP and affiliated entities.
Burlington in ContextOffice space by class and location
21
0
500,000
1,000,000
1,500,000
2,000,000
2,500,000
3,000,000
3,500,000
4,000,000
Total Class A Class B Class C
GLA
(squ
are
feet
)
Source: Cushman & Wakefield, 2011. Reflects office buildings > 20,000 sf, excluding owner-occupied.
0
500
1,000
1,500
2,000
2,500
3,000
3,500
4,000
4,500
5,000
Downtown Burlington Greenfield Burlington
GLA
(squ
are
feet
)
Class A accounts for the majority of office space and is largely located on QEW corridor with highway visibility
Office space in downtown Burlington accounts for a fraction of total space

© Deloitte & Touche LLP and affiliated entities.
Class A Office SpaceAsking rents and Vacancy
22
# Address Name Size (sf) Year Built Typical Floor (sf)
No. of Floors
RentalRate ($/sf)
Lease Type
TOH($/sf)
Vacant (Q42011)
A1 390 Brant Street Sims Square 65,000 1989 10,000 6 $17.50 Net $12.09 0
A2 760 Brant Street Burlington Square 68,114 1975 34,057 1 0.00 Net $8.90 23,123*
A3 1100 Burloak Drive 124,363 1990 20,000 7 $16.50 Net $11.58 23,147
A4 3115 Harvester Road 80,088 2008 20,542 4 $17.95 Net $10.70 9,174
A5 3150 Harvester Road 20,920 2006 10,460 2 $17.50 Net $8.50 0
A6 4281 Harvester Road 68,000 2002 17,000 4 $20.00 Gross N/A 0
A7 1111 International Blvd. Westbury Bus. Park - P1 128,700 2000 18,500 7 $18.75 Net $11.00 22,896
A8 1122 International Blvd. Westbury Bus. Park - P2 133,805 2002 19,115 7 $18.75 Net $11.15 0
A9 1425 Norjohn Court Norjohn Bus. Park Inc 63,500 2010 (blank) 1 $15.95 Net $5.00 5,790
A10 4475 North Service Road Voortman Office Tower 66,612 2005 12,000 6 $15.00 Net $11.35 28,081
A11 5420 North Service Road Burloak Corp. Tower 130,000 1993 26,000 5 $16.50 Net $11.21 21,903
A12 5500 North Service Road International Tower 205,000 2001 22,600 11 $20.00 Net $10.48 52,734
A13 5515 North Service Road Burloak Bus. Park 97,239 1997 25,000 4 $16.50 Net $11.73 24,161
A14 5575 North Service Road Reimer Tech Park Tower 100,000 1999 15,000 6 $16.50 Net $11.10 16,772
A15 649 North Service Road Simcoe Erie Group 122,250 1991 40,000 3 $11.61 Net $9.00 0
A16 1005 Skyview Drive Princess Park 95,706 1998 35,000 3 $16.00 Net $11.73 8,413
A17 3310 South Service Road 63,000 1986 21,000 3 $12.00 Net $7.92 4,558
A18 5035 South Service Road Appleby Bus. Centre -P2 80,000 1999 15,000 5 $17.00 Net 30,000
A19 5045 South Service Road Appleby Bus. Centre -P1 73,439 1999 15,300 5 $17.00 Net $11.96 8,841
Total Class A 1,785,736 279,593
Source: Cushman & Wakefield, Q4 2011. Reflects office buildings > 20,000 sf, excluding owner-occupied.
* Martell Commercial, May 2012.

© Deloitte & Touche LLP and affiliated entities.
Class A Office SpaceConcentrated at Burlington-Oakville gateway
23
407
403403
QEW
A1
A2
A3
A4A5 A6
A9
A10
A11
A8
A7
A12A13
A14
A15A16
A17 A19
A18
Burloak Dr. &North Service Rd.Floor Area 919,107 sf
Existing Class A Office Space
# Address Floor Area (sf)
A1 390 Brant Street 65,000
A2 760 Brant Street 68,114
A3 1100 Burloak Drive 124,363
A4 3115 Harvester Road 80,088
A5 3150 Harvester Road 20,920
A6 4281 Harvester Road 68,000
A7 1111 International Blvd. 128,700
A8 1122 International Blvd. 133,805
A9 1425 Norjohn Court 63,500
A10 4475 North Service Rd 66,612
A11 5420 North Service Rd 130,000
A12 5500 North Service Rd 205,000
A 13 5515 North Service Rd 97,239
A14 5575 North Service Rd 100,000
A15 649 North Service Rd 122,250
A16 1005 Skyview Drive 95,706
A17 3310 South Service Rd 63,000
A18 5035 South Service Rd 80,000
A19 5045 South Service Rd 73,439
Total 1,785,736
P1
Proposed Class A Office Space
# Address
P1 3160 South Service RdSun Life, 5-storey office building

© Deloitte & Touche LLP and affiliated entities.
Class B Office SpaceAsking rents and vacancy
24
# Address Name Size (sf) Year Built Typical Floor (sf)
No. of Floors
RentalRate ($/sf)
Lease Type
TOH($/sf)
Vacant (Q4 2011)
B1 3600 Billings Court Scott Batenchuk & Co. 60,000 1973 20,000 3 $8.52 Net $10.50 0B2 460 Brant Street Upper Canada Place 63,000 1976 20,000 3 $10.00 Net $12.04 0B3 1001 Champlain Avenue 61,500 1989 15,000 4 $13.50 Net $10.09 3,813B4 2289 Fairview Street Fairview Bus. Park 1 65,900 1973 65,900 1 $0.01 Negotiable $4.65 0B5 3027 Harvester Road Sun Life Building 56,223 1974 11,245 5 $12.00 Net $12.25 12,464B6 3050 Harvester Road Canron Building 30,000 1974 15,000 2 $18.50 Gross $9.69 0B7 3425 Harvester Road Design Centre 3000 1979 24,000 2 $0.01 Negotiable $7.47 0B8 3450 Harvester Road ABB Automation 160,000 2001 45,000 2 0B9 1375 Kerns Road 70,000 1960 35,000 2 $0.01 Negotiable 0B10 880 Laurentian Drive Marcam Building 52,000 1994 26,000 2 $15.00 Net $10.00 8,600B11 3060 Mainway Drive Mainway Bus. Ctr. – 2 30,000 1991 10,000 3 $10.00 Net $9.95 0B12 4145 North Service Road 62,385 1991 15,952 4 $13.50 Net $10.99 7,830B13 5063 North Service Road 39,948 1990 19,975 2 $13.50 Net $9.99 0B14 3228 South Service Road Interchange 1 66,000 1973 32,000 2 $19.00 Gross $9.87 12,842B15 3350 South Service Road Harvester Exec. Park 65,000 1976 22,000 3 $17.00 Gross $3.65 10,570B16 3370 South Service Road Harvester Exec. Park 58,427 1977 19,475 3 $17.00 Gross $3.32 3,298B17 3380 South Service Road 65,000 1988 26,425 2 $18.50 Gross $6.30 14,575B18 3390 South Service Road Harvester Exec. Park 66,439 1981 22,146 3 $18.00 Gross $3.48 6,050B19 3410 South Service Road 50,325 1987 21,907 2 $12.00 Net $6.64 7,707B20 3430 South Service Road 30,689 1989 15,345 2 $12.00 Net $8.00 4,808B21 5050 South Service Road Citicorp Leasing Cda Ltd 66,248 1972 24,648 2 $15.00 Net $10.25 0B22 5230 South Service Road Harvester Exec. Centre 110,653 1978 110,653 1 $16.00 Gross $2.48 16,287B23 5360 South Service Road 41,200 1979 N/A 2 $14.00 Gross $8.00 4,303B24 1016A Sutton Drive Sutton Bus. Ctr. Bldg. A 25,508 1991 12,754 2 $0.01 Negotiable $6.43 0B25 1016B Sutton Drive Sutton Bus. Ctr. Bldg. B 25,508 1991 12,754 2 $10.00 Net $6.55 0B26 1100 Walkers Line Butler Building 65,000 1970 15,500 3 $19.00 Net $10.00 31,096Total Class B 1,489,953 144,243
Source: Cushman & Wakefield, Q4 2011. Reflects office buildings > 20,000 sf, excluding owner-occupied.

© Deloitte & Touche LLP and affiliated entities.
Class C Office SpaceAsking Rents and Vacancy
25
# Address Name Size (sf) Year Built Typical Floor (sf)
No. of Floors
RentalRate ($/sf)
Lease Type
TOH($/sf)
Vacant (Q4 2011)
C1 440 Elizabeth Street CAC Building 60,000 1969 7,500 6 $12.00 Net $8.90 0Total Class C 60,000 0
Source: Cushman & Wakefield, Q4 2011. Reflects office buildings > 20,000 sf, excluding owner-occupied.

© Deloitte & Touche LLP and affiliated entities.
Office building classificationsDefinitions of Class A, B and C
26
A
Most prestigious buildings competing for premier office users with rents above average for the area.
Buildings have high quality standard finishes, state of the art systems, exceptional accessibility and a
definite market presence.
B
Buildings competing for a wide range of users with rents in the average range for the area. Building finishes are fair to good for the area. Building
finishes are fair to good for the area and systems are adequate, but the building does not compete
with Class A at the same price.
C Buildings competing for tenants requiring functional space at rents below the average for the area.
BOMA Office Class Definitions
Source: Building Owners and Managers Association (BOMA) International, 2012.
• Subjective and market-specific• Reflects competitive ability of each
building to attract similar tenant types
• Considerations:– Rent– Quality of building finishes– Systems and efficiency– Building amenities– Location and accessibility– Tenant mix– Age

© Deloitte & Touche LLP and affiliated entities.
General office market environmentGTA and GTA West market are recovering
• Construction completions peaked in 2009, reflecting a lag changes in the economic environment and its effect on new projects
• Vacancy rates have declined from 2009-2010 as space has been absorbed into the market
• Asking rents remain steady• Developers are moving forward with new projects, but cautiously
27
Conclusion: While the office market has shown signs of improvement, the environment for new development remains cautious.

© Deloitte & Touche LLP and affiliated entities.
Downtown Burlington Office Development
28 Office & Retail Markets in the Downtown

© Deloitte & Touche LLP and affiliated entities.
Parking lots #4 and #5Location and physical considerations
29
#5#4
Source: Google earth, 2012

© Deloitte & Touche LLP and affiliated entities.
Parking lots #4 and #5Location and physical considerations for office development
Lot #4 Lot #5
Highway / Transit Access
× Distance from QEW and GO Station restrict regional access
× Distance from QEW and GO Station restrict regional access
Parking× Limited off-site parking× U/G parking likely not economically viable
× Limited off-site parking× U/G parking likely not economically viable
Retail / Service Amenities Access to downtown stores and services Access to downtown stores and services
Size / Shape
Lot 4 better suited to accommodate a standard, rectangular floor plate (20-25,000 sf)
× Little/no opportunity for substantial on-site surface parking
× Easement and site size restrict floor plate size / flexibility
× No opportunity for on-site surface parking
Observations Better suited than lot #5 for office building or other development given size / shape
× Not suitable for an office building Potentially suitable for structured parking Brant Street frontage an important
consideration in future use
30
Conclusion: The major locational barriers to the development of new office space in the downtown are lack of parking and distance from a major transit hub.

© Deloitte & Touche LLP and affiliated entities.
ParkingWhile not required in the by-law, parking is essential to office tenants
31
Floor Area(gross)
Minimum Parking
Standards*
No. of Stalls
Office* 75,000-100,000 sf 3.5 / 100 m2
(1,076 sf)244-325
Retail 15,000 sf 4 / 100m2
(1,076 sf)56
Financial Service
10,000 sf 6 / 100m2
(1,076 sf)55
Total 100,000-125,000 sf 355-436
• While Lots #4 and #5 are subject to the parking exemption, abundant dedicated parking will be a requirement for office tenants
• 355-436 parking stalls required if the City’s parking standards applied
• Applying typical workspace densities, it is reasonable to plan for an office component will accommodate 375-555 employees
Parking based on Municipal Standards
Floor Area(net)
Employment Density
No. of Stalls
Office 67,500-90,000 sf 180 sf – 200 sf / employee
338-500
Employees
Conclusion: A downtown office development of say 75-90,000 sf would require, at a minimum, 250-325 dedicated parking stalls for office tenants.
* Assumes no medical office component.

© Deloitte & Touche LLP and affiliated entities.
Considerations affecting new/existing office spaceSignificant barriers need to be overcome to attract new office tenants/jobs
32
Strengths Weaknesses
• No available Class A space in the Downtown
• Proximity to retail and services• Burlington’s quality of life• Proximity to high income households
along the Lakeshore (financial services)• Consistent with multi-use nature • Complimentary to the general trend
towards higher density development
• No major tenants to drive the opportunity• Distance from the GO Station • Parking availability and cost• Regional access and visibility would
discourage some tenants (e.g. corporate headquarters)
• Parking is a constraint in marketing existing small-scale office space, resulting in vacancy or underutilized space
Opportunities Threats
• Strong investment appetite for office assets / development
• Positive impact on vitality of retail and service component of the downtown
• Development could fund new parking, depending on approach to transaction
• Competing with QEW sites• New office development could exacerbate
parking issue• Further redevelopment / intensification
could exacerbate parking issue

© Deloitte & Touche LLP and affiliated entities.
Considerations for New Office Space in the DowntownProject would require a commitment of a major tenant
• Tenant demand drives development• Government or institutions are candidates for downtown sites
• Algoma College in Brampton• Sheridan Campus in Mississauga• Waterloo School of Pharmacy in Kitchener• Waterloo School of Architecture in Cambridge
• Private companies have looked for space in downtown Burlington in the past but were discouraged by lack of suitable space and parking costs
• Dedicated parking will be a requirement for any office project .
33
Conclusion: An office project could be an attractive addition to the downtown, but only if there is demonstrated tenant interest and if parking requirements can be addressed.

© Deloitte & Touche LLP and affiliated entities.
Considerations for New Office Space in the DowntownParking requirements significant affect cost structure & net rent required
• Site # 4 requires underground parking, making it more expensive than a comparable suburban building
• Suburban buildings with surface parking typically benefit from lower overall cost structure, which allow for lower Floor Area Ratios (i.e. height) and more competitive asking rents relative to downtown locations
• In the downtown, a developer will require higher net rents (relative to suburban locations) to justify higher capital costs associated with parking
• The differential in rent requirements relative to suburban locations presents a challenge in marketing to prospective tenants
• Options with respect to a office building or mixed use building will need to be decided
• Integration of transit facilities within an office building may reduce value from a developer’s perspective
34
Conclusion: Parking requirements will significantly affect project economics and competitiveness relative to suburban locations with surface parking.

© Deloitte & Touche LLP and affiliated entities.
Market soundingsNER for a downtown project versus QEW office locations
35
Conclusion: The Net Effective Rent required to compensate for u/g parking costs makes a downtown project less competitive than comparable suburban projects.
Net EffectiveRent (NER)1
Comments
Downtown Project with Structured Parking
$20-22 psf • Higher NER required as a result of structured parking requirement
• Medical and wealth management / financial service tenants might pay in this range
Actual Net Effective Rents in Downtown
$12-16 psf • Existing downtown NERs significantly lower than $20-22 psf
QEW Corridor $18-20 psf • NERs in QEW Class A also more competitive
1. Net Effective Rent is the true Rent related to a certain lease transaction, based on the present value using the common discount rate, of all Rent receivable by a landlord over the initial fixed term, less the present value of all tenant inducements, free rent periods and commissions payable, with such remainder present value then amortized over the fixed initial lease term).

© Deloitte & Touche LLP and affiliated entities.
Decision TimeDetermining the priority of office development
36
Conclusion: While office uses may be a desirable addition to the downtown, timing and risks need to be considered.
Go Ahead Wait and See (do nothing)
• Potential benefits to downtown tenants make the addition of office space attractive
• While there is an appetite for new projects, investors/developers are proceeding conservatively – not a boom market
• Will need to overcome barriers, which will require providing public investment to attract tenants/developers
• No obvious anchor tenants
• Passive/opportunistic approach to identifying a tenant opportunity
• There is a risk is that the initiative may stall / lose momentum

© Deloitte & Touche LLP and affiliated entities.
Office project criteria for successA well-planned approach is critical to the success of the project
• A sound understanding of project economics is required before tendering to developers. Quality submissions will respond when financials and sufficient underwriting details are provided for the investment.
• Tenant strategy needs to be considered:– Will require an anchor tenant– Tenant pool is primarily existing businesses in Burlington– Potential private sector tenants may include professional services,
medical services, financial services and back-office• Explore options to address project challenges:
– Sale likely more attractive than land lease – Options with respect to a office building or mixed use building will need
to be decided
37
Conclusion: If it is determined that the office project should be explored further, several issues need to be addressed prior to issuing an RFP.

© Deloitte & Touche LLP and affiliated entities.
Retail market trends
38 Office & Retail Markets in the Downtown

© Deloitte & Touche LLP and affiliated entities.
Canadian retail marketRising sales driven by rising population and disposable income
39
30
31
32
33
34
35
36
37
$300
$350
$400
$450
$500
$550
Can
adia
n po
pula
tion
(M)
Ann
ual r
etai
l sal
es (B
)
$5,000
$15,000
$25,000
$35,000
2000 2002 2004 2006 2008 2010
Per c
apita
val
ue
Sources: (1) Statistics Canada; (2) Economist Intelligence Unit
Disposable income
Retail sales
Key insights• Disposable income – disposable income has risen for the
past decade, allowing Canadians to increase their per capita retail spending
• Population – Canadian population growth closely correlates with retail spending growth (correlation coefficient = 0.99). It has been growing at 1.2% per year for the past 5 years and is projected to grow at 1.2% per year until 2015(1)
• Distribution and growth – the majority of Canada’s population (86%) is located in Ontario, Quebec, British Columbia, and Alberta with the western provinces forecasted to be the main drivers of population growth
Per capita retail sales and disposable income
Canadian annual retail sales and population Canadian population distribution and growth by province(1)Forecasted population
CAGR (2011-2015)(1): 1.2%Forecasted retailCAGR (2011-2015)(2): 2.1%
0.0%
0.5%
1.0%
1.5%
2.0%
2.5%
3.0%
0
2
4
6
8
10
12
14
ON QC BC AB MB SK NS NB NL PEI
5-ye
ar C
AG
R (2
009-
2013
)
Province

© Deloitte & Touche LLP and affiliated entities.
Canadian retail marketCanadians have caught up with Americans in per capita spending
40
Per Capita Retail Spending ($US)

© Deloitte & Touche LLP and affiliated entities.
Retail sales productivitySales are directly correlated with population growth, led by immigration
41
Retail Sales Productivity – Canadian Malls
Source: ICSC Research
Seasonally-Adjusted Annual Rate

© Deloitte & Touche LLP and affiliated entities.
Canadian retail marketCanada has less shopping centre space compared to the U.S.
42
0
5
10
15
20
25
Canada U.S.
Sho
ppin
g C
entre
Spa
ce p
er C
apita
(sf)
Retail Space (Square Feet) per Capita

© Deloitte & Touche LLP and affiliated entities.
New retail entrantsNew U.S. and international retailers are coming to Canada
43
American Retailers
European Retailers

© Deloitte & Touche LLP and affiliated entities.
Canadian retail marketConsumer debt and a rise in interest rates could impact retailers
44
Sources: (1) Statistics Canada; (2) Economist Intelligence Unit
0%
1%
2%
3%
4%
5%
6.4%
6.8%
7.2%
7.6%
8.0%
8.4%
8.8%
2007 2008 2009 2010 2011
Ban
k ra
te
Deb
t ser
vice
ratio
80%93% 99%
128%147%
1991 1996 2001 2006 2011
Sources: (1) Statistics Canada; (2) Statistics Canada, Bank of Canada
Household debt-to-income has reached record levels in 2011 since 1991(1)
Household debt service ratio correlates with the bank rate from 2007 to 2011(2)
Consumer debt continues to escalate as the Canadian population takes advantage of continued low interest rates. This is worrisome to economists and government officials who threaten to increase interest rates and tighenlending policies.

© Deloitte & Touche LLP and affiliated entities.
Canadian retail marketIncreasing transport and food costs are eroding discretionary spending
45
The cost of transportation and food has outpaced the overall rise in Consumer Price Index (“CPI”) over the past 2.5 years(1)
Canadian consumer confidence has fallen to its lowest point since 2008, despite the Canadian economy adding 223,000 jobs (1.3%) over the past 12 months(2)
74.770
75
80
85
90
95
100
Jun-09 Sep-09 Dec-09 Mar-10 Jun-10 Sep-10 Dec-10 Mar-11 Jun-11
Can
adia
n co
nsum
er
conf
iden
ce
Sources: (1) Statistics Canada; (2) HRM Guide, Conference Board of Canada
9095
100105110115120
2009 2010 2011
CPI
Total CPI Food Household
Clothing and footwear Transportation Health and personal care0.7%
0.8%
2.2%
5.2%
8.1%
3.5%
Clothing and footwear
Health and personal care
Household
Food
Transportation
Total CPI
Index 2002 = 100
Canadian seasonally adjusted CPI by category (indexed to 100 from Jan 2009)(2)
Canadian seasonally adjusted CPI by category (YoY change Aug 2010 to Aug 2011)(1)
Note: Transportation includes vehicle purchases and rentals, insurance premiums, gasoline, and air travel

© Deloitte & Touche LLP and affiliated entities.
Retail location costsCosts affecting retail tenants include direct and indirect costs
• We have reviewed :– net rent– additional rent costs (taxes, maintenance, insurance)– Location-specific taxes (e.g. parking levy)
• Issues affecting tenants:– Increases in rent costs– Relative affordability / attractiveness of other retail locations– Indirect costs (e.g. staff and patron parking, travel times)
46

© Deloitte & Touche LLP and affiliated entities.
Downtown comparisonCosts for retail space in the downtown lower than shopping centres
47
Address Name / Centre Size (sf) Net Asking Rent ($/sf)
T.M.I.($/sf)
Notes
2045 Pine Street Village Square 1,000-6,280 sf $18.00 psf $6.16 psf1445 Elgin Street 4,862 sf $24.00 psf -- Now for sale601 Brant Street Brant Plaza ~4,000 sf $30.00 psf $11.75 psf Freestanding pad w parking
(former Blockbuster)489 Brant Street ~1,500 sf $25 psf $8.50 psf Ground floor retail453 Brant Street 1,775 sf $22 psf $6.50 psf442 Brant Street 2,600 sf $22 psf $9.50 psf Scrivners, TMI incl. utilities442 Brant
Other Retail Locations:3230 Fairview Street -- $24.00 psf -- Average Non-Anchor Rent3455 Fairview Street Fairview Place -- $17.00 psf -- Average Non-Anchor Rent4460-90 Fairview Street Appleby Square 5,000 sf $17.00 psf $7.50 psf4460-90 Fairview Street Appleby Square 5,025 sf $22.00 psf $7.50 psf5493 Fairview Street 5,943 sf $9.00 psf $7.69 psf Office/retail unitUnit 9, 1220 & 1250 Brant St Burlington Power Centre 8,102 sf $16.00 psf $10.00 psfUnit 3B 1220 & 1250 Brant St Burlington Power Centre 3,000 sf $22.00 psf $10.00 psf4125 Upper Middle ~1,000 sf $28-30 psf $8-10.00 psfUpper Middle Millcroft Centre $22-25 psf $8-10.00 psf
Shopping Centres (Typical):Power Centres 1,500 sf $28-35.00 psf $8-10.00 psfPower Centres 5,000 sf $24-28.00 psf $10-12.00 psfRegional Enclosed 1,000 sf $50-60.00 psf $20-30 psf Excludes mgt. fees or % salesRegional Enclosed 5,000 sf $25-30.00 psf $25-30.00 psf Excludes mgt. fees or % sales
Conclusion: Asking rents and additional rent costs are in-line with other retail areas in Burlington, but still well below typical regional shopping centre rents.

© Deloitte & Touche LLP and affiliated entities.
Illustrative comparison of costsDowntown Burlington versus other areas for a 1,500 retail unit
Downtown Other Retail Areas Regional Power Centre
Enclosed Regional Shopping Centre
Net Rent $17 – 25 psf $20-25 psf $28-30 psf $50-60 psf
Property Taxes $5-8 psf3 $6-8 psf $6-9 psf $12-16 psf
Other Rent $1-2 psf $2-3 psf $2-3 psf $8-14 psf
Parking Levy $0.50-0.60 psf4 -- -- --
BIA Fee $0.80-$1 psf5 -- -- --
Admin Cost -- -- -- $3-4.50 psf
Utilities1 n/a n/a n/a n/a
Total Cost $23-35 psf $28-36 psf $36-42 psf $73-95 psf6
Order of Magnitude Sales Performance2
$180-200 psf $200-250 psf $300-400 psf $500-600 psf
48
Conclusion: The parking levy and BIA contributions add $1.30 to $1.60 psf. Asking rents remain the largest cost and, in theory, should reflect these levies.
1. Utility costs have not been included in any of the categories. 2. Sales performance is for illustrative purposes only and reflective of broad, national averages. Performance may vary depending on location and
type of store or service.3. CT Tax Rate of 0.02194345 applied to assessed value of $400,000-500,000.4. 2011 parking levy of 0.00183912 applied to an assessed value of $400,000-500,000.5. BDBA levy of 0.00296768 applied to an assessed value of $400,000 to 500,000.6. Does not include additional rent paid through percentage sales, or management fees.

© Deloitte & Touche LLP and affiliated entities.
Downtown comparisonBurlington has less public parking relative to neighbouring municipalities
Retail(net, asking)
Office(net, asking)
Public Parking EstablishmentsRatio
(public parking to establishments)
Burlington
• $17 – 25 psf • $14-18 psf • 1,527 spaces total– 351 structured– 871 above ground– 305 on street
• 393 businesses– 248 retail/service– 145 office
• 3.8 spaces / establishment
Oakville
• $40 – 65 psf • $14-22 psf • 1,950 spaces total– 750 on street– 1,200 in municipal
lots
• 450 businesses– 225 retail / service– 225 office
• 5.4 spaces / businesses
Brampton
• $12-25 psf • $12-20 psf • 1,930 spaces– 1,401 underground– 317 above ground– 212 on street
• 325 businesses– 175 retail/service– 150 office
• 5.9 spaces / business
49
Conclusion: Burlington has a lower ratio of public parking relative to its number of business establishments.

© Deloitte & Touche LLP and affiliated entities.
Downtown comparisonBrampton expanding its City offices, while Oakville is expanding parking
Office Inventory Initiatives
Burlington
- Sims Square: 65,000 sf, built in 1989. Sold for $6.15 mm under power of sale in 1998. Tenants include Investors Group and municipal offices.
- Burlington Square: 68,000 sf. - 440 Elizabeth Street: 60,000 sf, built in 1969.
Sold in receivership for $1.3 mm in 1997. Subsequently tenanted with Federal Government tenants.
Oakville
• Two office buildings: one medical, one multi-tenant. Multi-tenant at Lakeshore/Trafalgar includes RBC, CIBC Wood Gundy and a range of financial, medical & service firms.
• City recently purchased former post office site for $11mm for parking.
• For office, the Town is focusing efforts on Midtown / GO Station.
Brampton
• Existing Class A, 75,000 sf Market Square Business Centre: Asking $20 psf + $10.50 addl. Major tenants incl. the City, BDC, Business Enterprise Centre, Law Firm, Investors Group & Algoma College.
• City of Brampton office expansion: 165,000 sf of new office space, 16,000 sf of retail & u/g parking (425 stalls), awarded to Dominus Construction Group (Cityzen). Construction costs of $94 million to be funded by developer. City to lease for 25-year term, with ownership reverting to the City.
50
Conclusion: Oakville is an example of a vibrant downtown without significant major office presence.

© Deloitte & Touche LLP and affiliated entities.
Evaluation:Downtown Burlington Competitive Environment
51 Office & Retail Markets in the Downtown

© Deloitte & Touche LLP and affiliated entities.
Downtown BurlingtonDevelopment activity – a state of transition
52
• New residential development projects and land assemblies are contributing to appreciation in downtown land values
• Intensification will provide potential benefits, but may create challenges over the short-term
• Potential impacts on retail tenants:– Exposure to property tax increases
as CVA catches up to market values– Owners’ perception of leaseholds as
an interim use may impact motivation to market or maintain space
Reichman Seniors Housing
Medica One(Proposed)

© Deloitte & Touche LLP and affiliated entities.
CVA adjustments on commercial propertySignificant CVA adjustments will result in property tax appreciation
Address Floor Area January 1, 2005 CVA
January 1, 2008 CVA % Increase CAGR
612 Brant Street 1,227 sf $269,000 $541,000 101.1% 26.2%
518 Brant Street 1,824 sf $253,000 $728,000 187.7% 42.2%
620 Brant Street $391,000 $947,000 142.2% 34.3%
590 Brant Street $464,000 $964,000 107.8% 27.6%
53
Conclusion: As property tax adjustments are phased-in, owner-occupiers and tenants who pay property tax expenses will be exposed to significant increases.

© Deloitte & Touche LLP and affiliated entities.
Considerations affecting new/existing retail spaceIntensification creates challenges for retail that need to be addressed
54
Strengths Weaknesses
• A number of tenants with a long history in the downtown
• Redevelopment momentum• Residential development / intensification• Wide mix of uses• Waterfront location / recreation• Rents are competitive
• Cost and availability of parking for patrons• Cost of parking to tenants• Distance from population growth in
Northeast Burlington• Unsuccessful legacy projects (e.g. Village
Square, Upper Canada Place)
Opportunities Threats
• Redevelopment can produce newer / more marketable retail space
• Entry of new tenants from U.S. and elsewhere could drive shopping centrerents higher
• Increasing CVA could result in significant increases in property taxes over time
• Further redevelopment / intensification could exacerbate parking issue
• Redevelopment does not always produce attractive / affordable retail space
• Entry of new tenants / formats will strengthen shopping centres and competing locations

© Deloitte & Touche LLP and affiliated entities.
Conclusions and preliminary recommendationsChallenges associated from intensification will need to be addressed
• Intensification objectives will put pressure on existing parking and infrastructure
• Parking should be a priority and is necessary to support long-term intensification objectives
• Parking levy should be reviewed, however, net rents generally reflect what tenants are willing to pay (i.e. accounting for these costs)
• Review policies to ease impact of CVA adjustments on tenants• Policies for new higher density forms should emphasize the creation of
functional/marketable retail space• Identify mechanisms to reduce burden of property tax increases borne
by tenants• If development of a new office building is to occur:
– Focus first on identifying a tenant(s)– Abundant, dedicated parking will need to be provided
55

© Deloitte & Touche LLP and affiliated entities.
Disclaimer
56
• “Report” means the appraisal or consulting report and conclusions stated therein, to which these Assumptions and Limiting Conditions are annexed.
• “Property” means the City-owned properties identified in the Report.
• “DELOITTE” means Deloitte & Touche LLP or its subsidiary that issued the Report.
• This report has been prepared at the request of Burlington Economic Development Corporation for general strategic and planning purposes. It is not reasonable for any person other than the person or those to whom this report is addressed to rely upon this report without first obtaining written authorization from the client and the author of this report. This report has been prepared on the assumption that no other person will rely on it for any other purpose and all liability to all such persons is denied.
• This report has been prepared at the request of the Burlington Economic Development Corporation and for the exclusive (and confidential) use of the recipients as named herein and for the specific purpose and function as stated herein. All copyright is reserved to the author and this report is considered confidential by the author and the client. Possession of this report, or a copy thereof, does not carry with it the right to reproduction or publication in any manner, in whole or in part, nor may it be disclosed, quoted from or referred to in any manner, in whole or in part, without the prior written consent and approval of the author as to the purpose, form and content of any such disclosure, quotation or reference.
• Without limiting the generality of the foregoing, neither all nor any part of the contents of this report shall be disseminated or otherwise conveyed to the public in any manner whatsoever or through any media whatsoever or disclosed, quoted from or referred to in any report, financial statement, prospectus, or offering memorandum of the client, or in any documents filed with any governmental agency without the prior written consent and approval of the author as to the purpose, form and content of such dissemination, disclosure, quotation or reference.
• References to rental rates and other costs contained in this report is founded upon a thorough and diligent examination and analysis of information gathered and obtained from numerous sources. Certain information has been accepted at face value; especially if there was no reason to doubt its accuracy. Other empirical data required interpretive analysis pursuant to the objective of this appraisal. Certain inquiries were outside the scope of this mandate.
• The author of this report cannot accept responsibility for legal matters, questions of survey, opinions of title, hidden or unapparent conditions of the property, toxic wastes or contaminated materials, soil or sub-soil conditions, environmental, engineering or other technical matters which might render this property more or less valuable than as stated herein. If it came to our attention as the result of our investigation and analysis that certain problems may exist, a cautionary note has been entered in the body of the report.
• Further, it is assumed that all rents referred to in this report represent the rental arrangements stipulated in the leases, agreements to lease or other contractual agreements pertaining to the tenants’ occupancy, to the extent that such rents have not been prepaid, abated, or inflated to reflect extraordinary circumstances, and are fully enforceable notwithstanding that such documentation may not be fully executed by the parties thereto as at the date of this report, unless such conditions have been identified and noted in this report.
• The data and statistical information contained herein were gathered from reliable sources and are believed to be correct. However, these data are not guaranteed for accuracy, even though every attempt has been made to verify the authenticity of this information as much as possible.
