office 2003 introductory concepts and techniques m i c r o s o f t excel project 1 creating a...
Post on 21-Dec-2015
213 views
TRANSCRIPT

Office 2003Introductory Concepts
and Techniques
M i c r o s o f t
Excel Project 1
Creating a Worksheet and an Embedded Chart
2Excel Project 1: Creating a Worksheet and an Embedded Chart
Objectives
• Start and Quit Excel
• Describe the Excel worksheet
• Enter text and numbers
• Use the AutoSum button to sum a range of cells
• Copy a cell to a range of cells using the fill handle

3Excel Project 1: Creating a Worksheet and an Embedded Chart
Objectives
• Copy a cell to a range of cells using the fill handle
• Format a worksheet
• Create a 3-D Clustered column chart
• Save a workbook and print a worksheet

4Excel Project 1: Creating a Worksheet and an Embedded Chart
Objectives
• Open a workbook
• Use the AutoCalculate area to determine statistics
• Correct errors on a worksheet
• Use the Excel Help system to answer questions

5Excel Project 1: Creating a Worksheet and an Embedded Chart
Starting Excel
• Click the Start button on the Windows taskbar, point to All Programs on the Start menu, point to Microsoft Office on the All Programs submenu, and then point to Microsoft Office Excel 2003 on the Microsoft Office submenu
• Click Microsoft Office Excel 2003• If the Excel window is not maximized,
double-click its title bar to maximize it

6Excel Project 1: Creating a Worksheet and an Embedded Chart
Starting Excel

7Excel Project 1: Creating a Worksheet and an Embedded Chart
Customizing the Excel Window
• Right-click the Language bar
• Click Close the Language bar
• Click the Getting Started task pane Close button in the upper-right corner of the task pane
• If the toolbars are positioned on the same row, click the Toolbar Options button
• Click Show Buttons on Two Rows

8Excel Project 1: Creating a Worksheet and an Embedded Chart
Customizing the Excel Window

9Excel Project 1: Creating a Worksheet and an Embedded Chart
Entering the Worksheet Titles
• Click cell A1
• Type Extreme Blading in cell A1 and then point to the Enter box in the formula bar
• Click the Enter box to complete the entry
• Click cell A2 to select it. Type Second Quarter Sales as the cell entry. Click the Enter box to complete the entry

10Excel Project 1: Creating a Worksheet and an Embedded Chart
Entering the Worksheet Titles

11Excel Project 1: Creating a Worksheet and an Embedded Chart
Entering Column Titles
• Click cell B3
• Type Direct Mail in cell B3
• Press the RIGHT ARROW key
• Repeat the last two steps for the remaining column titles in row 3, as shown on the following slide

12Excel Project 1: Creating a Worksheet and an Embedded Chart
Entering Column Titles

13Excel Project 1: Creating a Worksheet and an Embedded Chart
Entering Row Titles
• Click cell A4. Type Inline Skates and then press the DOWN ARROW key
• Repeat the previous step for the remaining row titles in column A, as shown on the following slide

14Excel Project 1: Creating a Worksheet and an Embedded Chart
Entering Row Titles

15Excel Project 1: Creating a Worksheet and an Embedded Chart
Entering Numbers
• Click cell B4• Type 58835.35 and then press the RIGHT
ARROW key• Enter 97762.50 in cell C4, 71913.73 in cell
D4, and 85367.37 in cell E4• Click cell B5• Enter the remaining fourth quarter sales
provided on the next slide for each of the three remaining product groups in rows 5, 6, and 7

16Excel Project 1: Creating a Worksheet and an Embedded Chart
Entering Numbers

17Excel Project 1: Creating a Worksheet and an Embedded Chart
Summing a Column of Numbers
• Click cell B8• Click the AutoSum
button on the Standard toolbar
• Click the AutoSum button a second time

18Excel Project 1: Creating a Worksheet and an Embedded Chart
Copying a Cell to Adjacent Cells in a Row• With cell B8 active,
point to the fill handle• Drag the fill handle to
select the destination area, range C8:E8
• Release the mouse button

19Excel Project 1: Creating a Worksheet and an Embedded Chart
Determining Multiple Totals at the Same Time• Click cell F4
• With the mouse pointer in cell F4 and in the shape of a block plus sign, drag the mouse pointer down to cell F8
• Click the AutoSum button on the Standard toolbar
• Select cell A9 to deselect the range F4:F8

20Excel Project 1: Creating a Worksheet and an Embedded Chart
Determining Multiple Totals at the Same Time

21Excel Project 1: Creating a Worksheet and an Embedded Chart
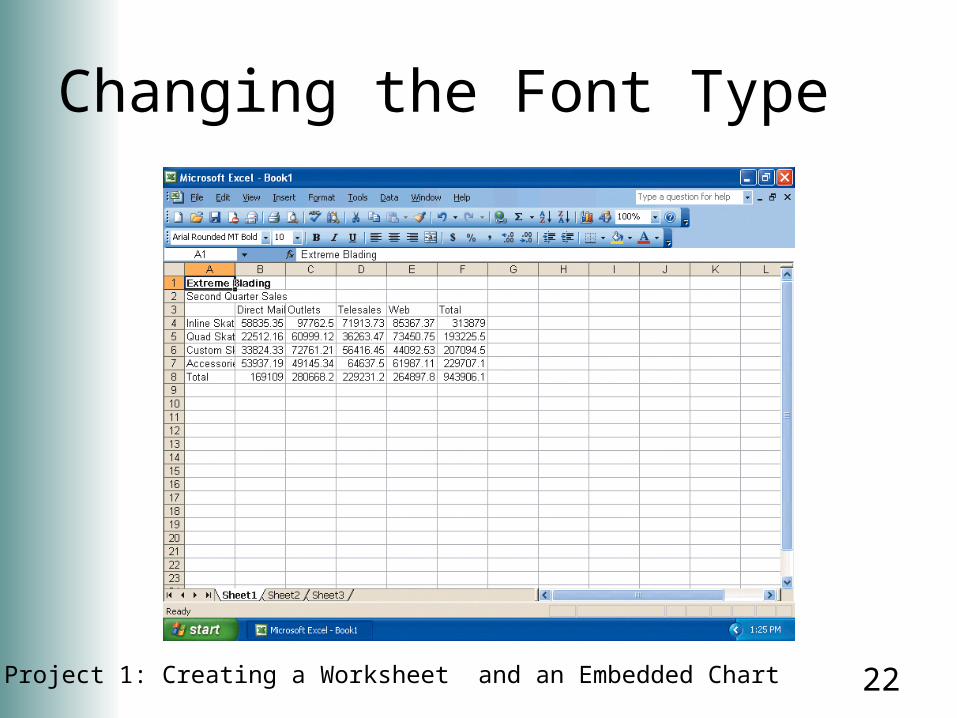
Changing the Font Type
• Click cell A1 and then point to the Font box arrow on the Formatting toolbar
• Click the Font box arrow and then point to Arial Rounded MT Bold
• Click Arial Rounded MT Bold
22Excel Project 1: Creating a Worksheet and an Embedded Chart
Changing the Font Type
23Excel Project 1: Creating a Worksheet and an Embedded Chart
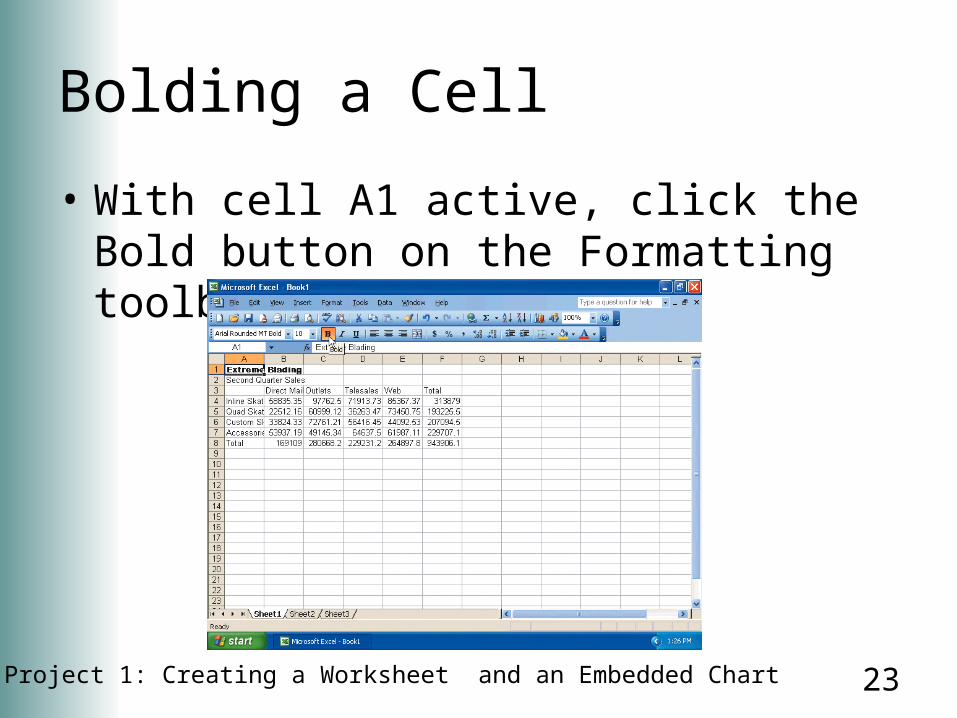
Bolding a Cell
• With cell A1 active, click the Bold button on the Formatting toolbar

24Excel Project 1: Creating a Worksheet and an Embedded Chart
Increasing the Font Size of a Cell Entry• With cell A1 selected,
click the Font Size box arrow on the Formatting toolbar
• Click 24 in the Font Size list

25Excel Project 1: Creating a Worksheet and an Embedded Chart
Changing the Font Color of a Cell Entry• With cell A1 selected,
click the Font Color button arrow on the Formatting toolbar
• Click Violet (column 7, row 3) on the Font Color palette

26Excel Project 1: Creating a Worksheet and an Embedded Chart
Centering a Cell Entry across Columns by Merging Cells• With cell A1 selected,
drag to cell F1• Click the Merge and
Center button on the Formatting toolbar

27Excel Project 1: Creating a Worksheet and an Embedded Chart
Formatting the Worksheet Subtitle
• Select cell A2• Click the Font box arrow on the Formatting
toolbar and then click Arial Rounded MT Bold• Click the Bold button on the Formatting toolbar• Click the Font Size box arrow on the Formatting
toolbar and then click 16• Click the Font Color button on the Formatting
toolbar

28Excel Project 1: Creating a Worksheet and an Embedded Chart
Formatting the Worksheet Subtitle
• Select the range A2:F2 and then click the Merge and Center button on the Formatting toolbar
29Excel Project 1: Creating a Worksheet and an Embedded Chart
Using AutoFormat to Format the Body of a Worksheet• Select cell A3, the upper-left corner cell of
the rectangular range to format• Drag the mouse pointer to cell F8, the
lower-right corner cell of the range to format
• Click Format on the menu bar• Click AutoFormat on the Format menu• When Excel displays the AutoFormat
dialog box, click the Accounting 2 format

30Excel Project 1: Creating a Worksheet and an Embedded Chart
Using AutoFormat to Format the Body of a Worksheet• Click the OK button• Select cell A10 to
deselect the range A3:F8
31Excel Project 1: Creating a Worksheet and an Embedded Chart
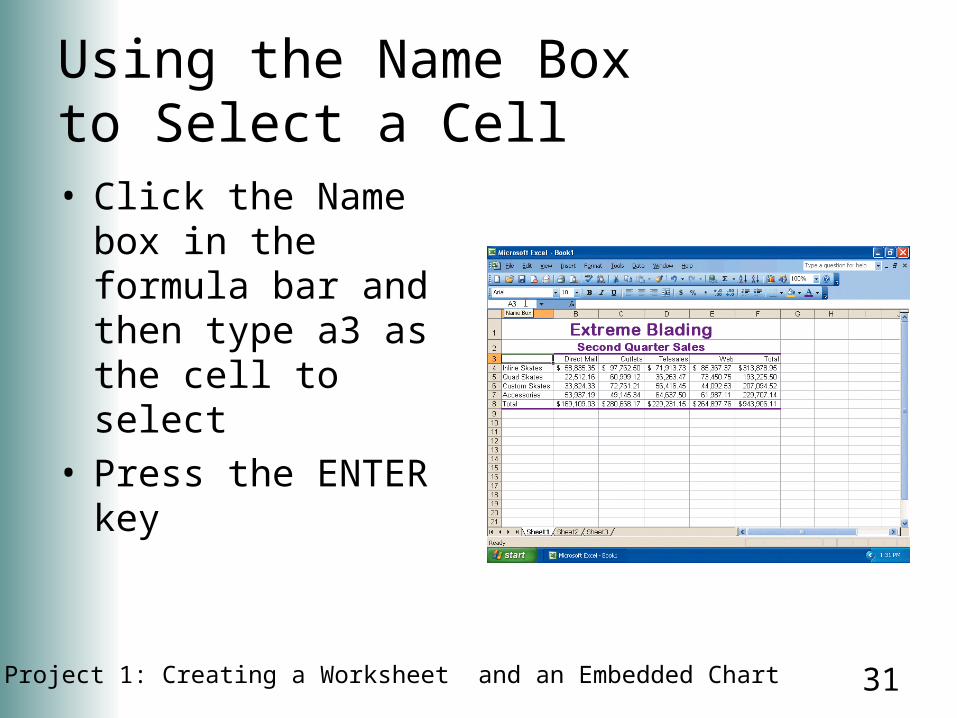
Using the Name Box to Select a Cell• Click the Name box in
the formula bar and then type a3 as the cell to select
• Press the ENTER key

32Excel Project 1: Creating a Worksheet and an Embedded Chart
33Excel Project 1: Creating a Worksheet and an Embedded Chart
Adding a 3-D Clustered Column Chart to the Worksheet• With cell A3 selected, position the block plus sign mouse
pointer within the cell’s border and drag the mouse pointer to the lower-right corner cell (cell E7) of the range to chart (A3:E7
• Click the Chart Wizard button on the Standard toolbar• When Excel displays the Chart Wizard – Step 1 of 4 –
Chart Type dialog box and with Column selected in the Chart style list, click Clustered column with a 3-D visual effect (column 1, row 2) in the Chart sub-type area
• Click the Finish button• If the Chart toolbar appears, click its Close button
34Excel Project 1: Creating a Worksheet and an Embedded Chart
Adding a 3-D Clustered Column Chart to the Worksheet• When Excel displays the chart, point to an open
area in the lower-right section of the chart area so the ScreenTip, Chart Area, appears next to the mouse pointer
• Drag the chart down and to the left to position the upper-left corner of the dotted line rectangle over the upper-left corner of cell A10
• Release the mouse button• Point to the middle sizing handle on the right
edge of the selection rectangle
35Excel Project 1: Creating a Worksheet and an Embedded Chart
Adding a 3-D Clustered Column Chart to the Worksheet• While holding down the ALT key, drag the
sizing handle to the right edge of column F
• If necessary, hold down the ALT key and drag the lower-middle sizing handle down to the bottom border of row 20
• Click cell H20 to deselect the chart

36Excel Project 1: Creating a Worksheet and an Embedded Chart
Adding a 3-D Clustered Column Chart to the Worksheet

37Excel Project 1: Creating a Worksheet and an Embedded Chart
Saving a Workbook
• With a floppy disk in drive A, click the Save button on the Standard toolbar
• Type Extreme Blading 2nd Quarter Sales in the File name box
• Click the Save in box arrow
• Click 3½ Floppy (A:) in the Save in list
• Click the Save button in the Save As dialog box

38Excel Project 1: Creating a Worksheet and an Embedded Chart
Saving a Workbook
39Excel Project 1: Creating a Worksheet and an Embedded Chart
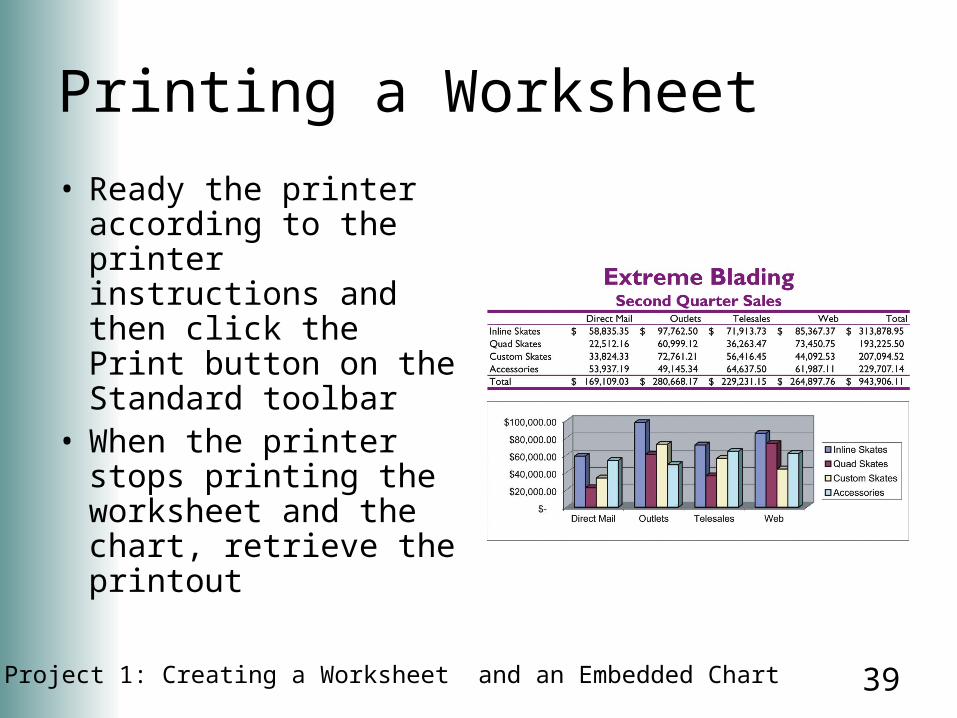
Printing a Worksheet
• Ready the printer according to the printer instructions and then click the Print button on the Standard toolbar
• When the printer stops printing the worksheet and the chart, retrieve the printout

40Excel Project 1: Creating a Worksheet and an Embedded Chart
Quitting Excel
• Point to the Close button on the right side of the title bar
• Click the Close button• Click the No button

41Excel Project 1: Creating a Worksheet and an Embedded Chart
Starting Excel and Opening a Workbook• With your floppy disk in drive A, click the Start
button on the Windows taskbar, point to All Programs on the Start menu, point to Microsoft Office on the All Programs submenu, and then click Microsoft Office Excel 2003 on the Microsoft Office submenu
• Click Extreme Blading 2nd Quarter Sales in the Open area in the Getting Started task pane

42Excel Project 1: Creating a Worksheet and an Embedded Chart
Starting Excel and Opening a Workbook

43Excel Project 1: Creating a Worksheet and an Embedded Chart
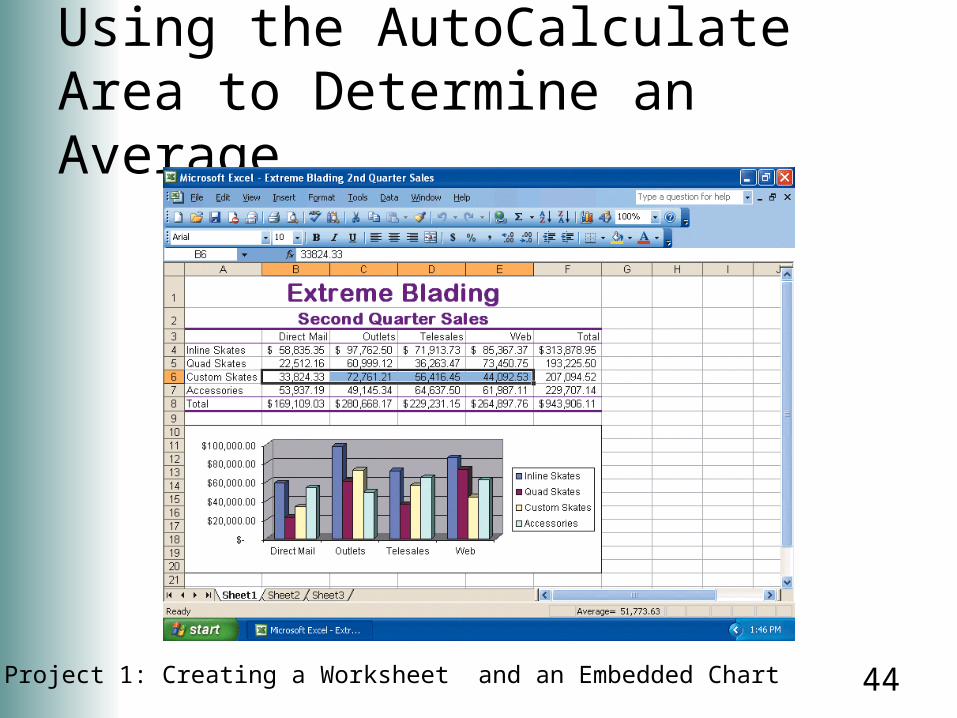
Using the AutoCalculate Area to Determine an Average• Select the range B6:E6 and then right-click
the AutoCalculate area on the status bar
• Click Average on the shortcut menu
• Right-click the AutoCalculate area and then click Sum on the shortcut menu
44Excel Project 1: Creating a Worksheet and an Embedded Chart
Using the AutoCalculate Area to Determine an Average
45Excel Project 1: Creating a Worksheet and an Embedded Chart
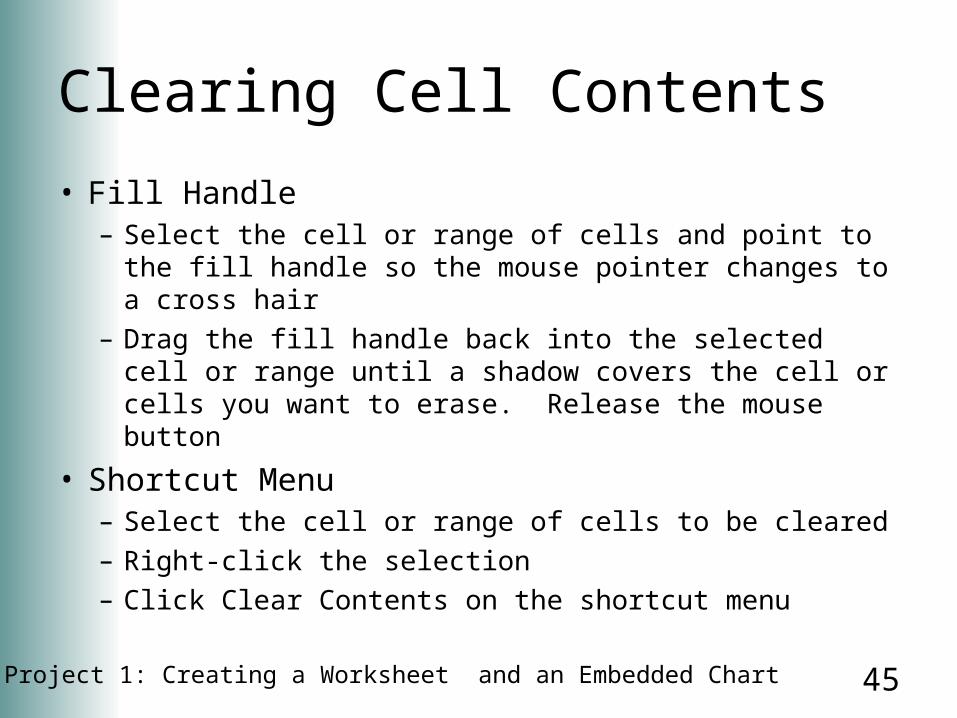
Clearing Cell Contents
• Fill Handle– Select the cell or range of cells and point to the fill
handle so the mouse pointer changes to a cross hair– Drag the fill handle back into the selected cell or
range until a shadow covers the cell or cells you want to erase. Release the mouse button
• Shortcut Menu– Select the cell or range of cells to be cleared– Right-click the selection– Click Clear Contents on the shortcut menu

46Excel Project 1: Creating a Worksheet and an Embedded Chart
Clearing Cell Contents
• Delete Key– Select the cell or range of cells to be cleared– Press the DELETE key
• Clear Command– Select the cell or range of cells to be cleared– Click Edit on the menu bar and then point to
Clear– Click All on the Clear submenu

47Excel Project 1: Creating a Worksheet and an Embedded Chart
Clearing the Entire Worksheet
• Click the Select All button on the worksheet
• Press the DELETE key or click Edit on the menu bar, point to Clear and then click All on the Clear submenu

48Excel Project 1: Creating a Worksheet and an Embedded Chart
Deleting an Embedded Chart
• Click the chart to select it
• Press the DELETE key

49Excel Project 1: Creating a Worksheet and an Embedded Chart
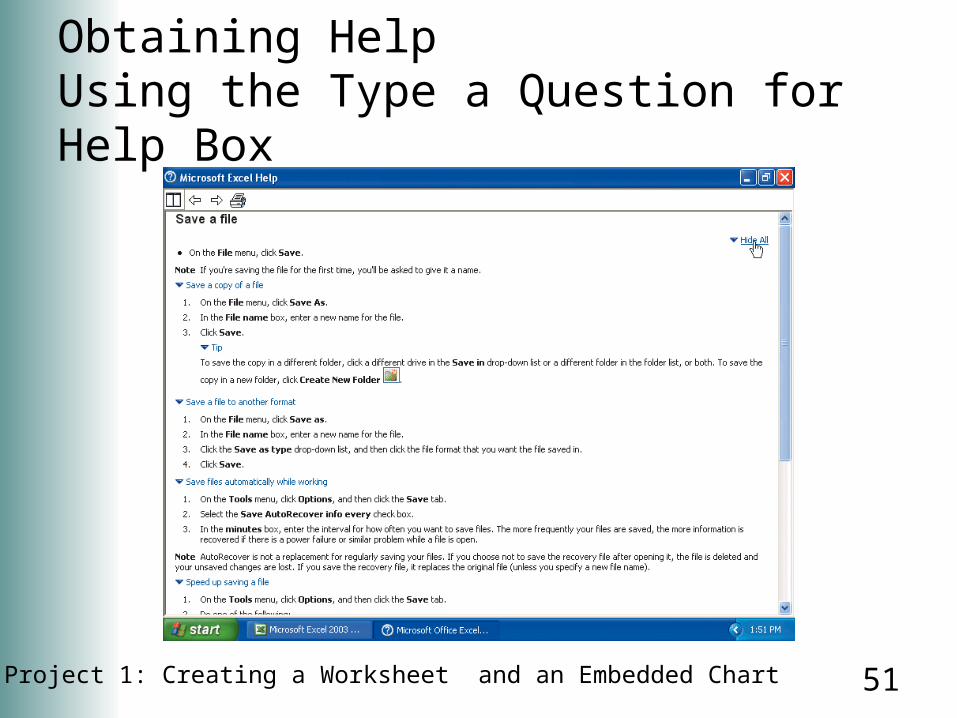
Obtaining Help Using the Type a Question for Help Box
• Type save a workbook in the Type a Question for help box on the right side of the menu bar
• Press the ENTER key• When Excel displays the Search Results task pane,
scroll down and then click the link Save a file• If necessary, click the AutoTile button to tile the windows• Click the Show All link on the right side of the Microsoft
Excel Help window to expand the links in the window
50Excel Project 1: Creating a Worksheet and an Embedded Chart
Obtaining Help Using the Type a Question for Help Box
• Double-click the Microsoft Excel Help title bar to maximize it
• Click the Close button on the Microsoft Excel Help window title bar
51Excel Project 1: Creating a Worksheet and an Embedded Chart
Obtaining Help Using the Type a Question for Help Box

52Excel Project 1: Creating a Worksheet and an Embedded Chart
Quitting Excel
• Click the Close button on the right side of the title bar, and if necessary, click the No button in the Microsoft Excel dialog box

53Excel Project 1: Creating a Worksheet and an Embedded Chart
Summary
• Start and Quit Excel
• Describe the Excel worksheet
• Enter text and numbers
• Use the AutoSum button to sum a range of cells
• Copy a cell to a range of cells using the fill handle

54Excel Project 1: Creating a Worksheet and an Embedded Chart
Summary
• Copy a cell to a range of cells using the fill handle
• Format a worksheet
• Create a 3-D Clustered column chart
• Save a workbook and print a worksheet

55Excel Project 1: Creating a Worksheet and an Embedded Chart
Summary
• Open a workbook
• Use the AutoCalculate area to determine statistics
• Correct errors on a worksheet
• Use the Excel Help system to answer questions

Office 2003Introductory Concepts
and Techniques
M i c r o s o f t
Excel Project 1 Complete