of vlf a@ c~l07b54 observed the ogo-4
TRANSCRIPT

Interpretation of VLF signal) A@ c ~ l 0 7 b 5 4 observed on the OGO-4 Satellite
by
Rege Romeu Scarabucci
October 1969
Technical Report NO. 3418-2
Prepared under National Aeronautics and Space Administration Contract NAS 5 -3093 and Grant NGR -020-008

INTERPRmAT I ON OF VLF S 1 CNA LS
OBSERVED ON THE OGO-4 SATELLITE
by
Rege Romeu Scarabucci
October 1969
Technica l Report No. 3418-2
Prepared under Nat iona l Aeronaut ics and Space Adminis t ra t ion
Cont rac t NAS 5-3093 and Grant NGR-020-008
Rad io sc i ence Laboratory
S tanford Univers i ty S tanford , C a l i f o r n i a

ABSTRACT - In t h i s r e p o r t we p re sen t and i n t e r p r e t very-low-frequency (Vm)
s i g n a l s observed wi th t h e po l a r o r b i t i n g 060-4 s a t e l l i t e . The V W
s i g n a l s of i n t e r e s t i n t h i s r e sea rch o r i g i n a t e i n t he a i r space below t h e
ionosphere and cover t h e frequency range -- 0.3 t o - 30 kHz. The sources
a r e l i g h t n i n g f l a s h e s and high-power VLF t r a n s m i t t e r s . The observa t ions
a r e compared wi th c a l c u l a t i o n s based on a full-wave t reatment of t r a n s -
mission through t h e lower ionosphere and a r ay theory t rea tment i n t h e
upper ionosphere and i n t h e magnetosphere.
In t h i s r e s e a r c h we cons ider s e v e r a l s i t u a t i o n s r e l a t e d t o t h e
propagat ion of VLF waves. Included a r e t h e amplitude of t h e wave f i e l d s
when OGO 4 is i n t h e v i c i n i t y of VLF s t a t i o n s , two e q u a t o r i a l phenomena
corresponding t o propagat ion a t low l a t i t u d e s , and s e v e r a l phenomena
observed a t mid-high l a t i t u d e s . The s tudy a l s o inc ludes t h e d i f f e r e n c e s
between daytime and n igh t t ime propagat ion.
The equa t ions determining t h e ionospher ic wave-field ampli tudes
of t h e s i g n a l s r a d i a t e d by a ground-based v e r t i c a l d i p o l e a r e de r ived .
The equa t ions a r e based on geomet r ica l f a c t o r s , on a t ransmiss ion co-
e f f i c i e n t through t h e lower ionosphere g iven by a full-wave technique ,
and on a focus ing f a c t o r which i s der ived from t h e a n a l y s i s of t h e ray
t r a j e c t o r i e s i n t h e ionosphere. Ca l cu l a t i ons based on t h e der ived
equa t ions a g r e e w e l l wi th t h e wave-fields generated by t h e Omega t r a n s -
m i t t e r ( f requency = 12.5 kHz) of Fo re s t P o r t , New York.
A s tudy of VLF propagat ion a t low l a t i t u d e s r e v e a l s two d i f f e r e n t
phenomena. One e f f e c t , c a l l e d " e q u a t o r i a l e ro s ion , " occurs on t h e day-
s i d e and involves frequency-dependent a t t e n u a t i o n , wi th a l l VLF s i g n a l s
from ground sources eventua l ly d i sappear ing below the l e v e l of d e t e c t a b i l i t y
-iii-

as t h e s a t e l l i t e approaches t h e equa tor . The above phenomenon is
explained p r imar i l y by abso rp t ion i n t h e D and E reg ions of t he iono-
sphere and t o a lesser e x t e n t by t he ray t r a j e c t o r i e s followed by t h e
waves above t h e F-region. The o t h e r phenomenon, i n t e r p r e t e d as " e q u a t o r i a l
defocusing" is observed i n t h e n igh t t ime ionosphere and involves abrupt
dec reases i n t h e i n t e n s i t y of manmade VLF s i g n a l s . This e f f e c t i s caused
by ionospher ic defocusing of VLJ? r ays near t h e magnetic equa to r . The
defocusing is r e l a t e d t o t h e change of t h e v e r t i c a l g r a d i e n t of i o n i z a t i o n
t h a t e x i s t s near t h e t r a n s i t i o n he igh t .
In a d d i t ion t o t h e e q u a t o r i a l phenomena j u s t de sc r ibed , world-wide
measurements of s i g n a l s from mid - l a t i t ude VLF s t a t i o n s show two remaykable
phenomena i n t h e conjuga te hemisphere. One i s an enhancement of t h e
s i g n a l s i n t h e conjuga te r eg ion of t h e t r a n s m i t t e r and t h e o t h e r i s a
h i g h - l a t i t u d e "eros ion t ' of t h e s i g n a l s i n t h e conjugate hemisphere. A
d e t a i l e d s tudy of t h e r ay t r a j e c t o r i e s i n r e a l i s t i c models of t h e magneto-
sphere shows t h a t t h e s i g n a l s r a d i a t e d from mid - l a t i t ude s t a t i o n s reach
t h e conjuga te hemisphere a f t e r fol lowing t r a j e c t o r i e s n o t a l igned w i t h
t h e geomagnetic f i e l d l i n e s . This s tudy l eads t o t h e theory of t h e pro-
l o n g i t u d i n a l (P-L) mode of w h i s t l e r propagat ion. The P-L mode is
cha rac t e r i zed by propaga t ion wi th t h e wave normal i n s i d e a c h a r a c t e r i s t i c
cone r e l a t i v e t o t h e geomagnetic f i e l d . The propagat ion p r o p e r t i e s of t h e
P-L mode account f o r t h e wave-field amplitudes observed i n t h e conjugate
r eg ion of t h e t r a n s m i t t e r s and f o r almost a l l w h i s t l e r s observed by
OGO 4 a t mid-high l a t i t u d e s . The h igh - l a t i t ude "erosion" of t h e down-
coming s i g n a l s i s explained by a l a t i t u d i n a l cu to f f t h a t occurs f o r t h e
P-L mode. This cu to f f i s caused by g r a d i e n t s of e l e c t r o n d e n s i t y i n s i d e
t h e plasmasphere and by s t e e p g r a d i e n t s a t t h e plasmapause.
- iv-

TABLE OF CONTISNTS
Page
I . INTRODUCTION ....................*..................*........ 1 . . A Objec t ives . . . . . . . . . . . . . . . . . . . . . . . . . ~ o . . . . . . . . . . . . . . . . . . 1
B . The Ear ly Work .......................................... 1
C . Brief Desc r ip t i on of Experiment 02 Aboard OGO 4 ......... 5
...................................... . D OGO-4 Observat ions 7
E . Cont r ibu t ions of t h e Presen t Work ....................... 19
I 1 . EXCITATION OF WHISTLER-MODE WAVES THROUGH THE LOWER .................................................. IONOSPHERE 22
A . Some P r o p e r t i e s of t h e Numerical Full-Wave Method ....... 24
B . Ionospheric Wave F i e l d s Generated By Ground ............................................ Transmi t t e r s 3 1
1 . Power Radiated by a Small V e r t i c a l Grounded Dipole .. 33
2 . Transmission i n t h e Lower Ionosphere ................ 34
....................................... . 3 Focusing Gain 35
4 . The Magnetic Wave F i e ld a t t h e S a t e l l i t e ............ 37
C . OGO-4 Amplitude Measurements of Wave F i e l d s i n t h e V i c i n i t y of Ground Transmi t te rs ......................... 40
111 . OGO-4 OBSERVATIONS OF EQUATORIAL ABSORPTION AND DEFOCUSING ................................ OF VLF ELECTROMAGNETIC WAVES 52
A . INTRODUCTION .......................................... 52
B . THE EQUATORIAL EROSION .................................. 56
1 . Q u a l i t a t i v e Explanat ion of t h e Observation .......... 56
2 . D.eta i l s of t h e Analysis ............................. 57
3 . Daytime Ray T r a j e c t o r i e s Around t h e Equator ......... 6 1
C . Equa to r i a l Defocusing ................................... 69
D . Fac to r s Af fec t ing t h e Equa to r i a l Defocusing ............. 77
E . Seasonal Va r i a t i on of t h e Equa to r i a l Defocusing ......... 83
............................................. F. Conclusions 85

TABLE OF CONTENTS (con t . )
Page - IV . 6330-4 AMPLITUDE MEASUREMENTS OF SIGNALS GENERATm BY GROm-D
V W TRANSMITTERS ................................ w e 87
A . Nighttime Measurements .................................. 87
1 . Enhancement of t h e S i g n a l s i n t h e Conjugate Region of t h e Transmi t te r .................................. 90
2 . High-Latitude " ~ r o s i o n " i n t h e Conjugate Hemisphere . 90
3 . Equa to r i a l Defocusing ............................... 9 1
4 . Enhancement of t h e S igna l s i n t h e Hemisphere of t h e Transmi t te r ......................................... 9 1
5 . Rings of Noise i n t h e Auroral Rggion ................ 93
B . Daytime Measurements .................................... 93
C . Signa l s i n t h e Conjugate Hemisphere ..................... 99
D . Propagat ion i n a Model Magnetosphere .................... 109
E . Conclusions ............................................ 124
V . THE PRO-LONGITUDINAL MODE OF WHISTLER PROPAGATION ........... 125
A . In t roduc t ion ............................................ 125
B . High-Latitude Cutoff i n t h e Occurrence of Whis t le rs ..... 125
C . Whis t l e r s wi th Latitude-Independent Time-Delay .......... 129
D . Whis t l e r s Received on t h e Ground ........................ 134
E . Conclusions ............................................. 140
V I . AMPLITUDE FADING ............................................ 143
A . In t roduc t ion ............................................ 143
B . Amplitude Fading Related t o Plasmapause Crossing ........ 143
1 . I n t e r f e r e n c e Caused by Mul t ip le Hops Below the Ionosphere .......................................... 149
2 . I n t e r f e r e n c e Caused by Longi tudinal Gradients of Ion i za t ion ....................s~.~~.........s........ 149
3 . I n t e r f e r e n c e Caused by L a t i t u d i n a l Gradients of Ion i za t ion .......................................... 149

TABLE OF CONTENTS (eont.1
Page - C. C o n c l u s i o n s ............................................. 151
REFERENCES ...................................................... 154
LIST OF TABLES
T a b l e
.......................... 1 T a b l e f o r computing wave f i e l d s 46

Figure
LIST OF ILLUSTRATIONS
Page - b Po r t i on of s t r i p - c h a r t d i sp l ay ing demodulated PCM d a t a
corresponding t o s i g n a l s rece ived by t h e s tepping r e c e i v e r s and by t h e phase t r ack ing r e c e i v e r . . . . . . . . . . . . . . 8
2a Segments of a cont inuous s t r i p - c h a r t recorded by OGO 4 on 19 February 1968. . . . . .................................. 11
2b A con t inua t ion of F igure 2a............................... 12
2c A con t inua t ion of Figure 2 b . . . . . . . . . . . . . . . . . . . . . . . . . . . . . . . 13
3 Ground p r o j e c t i o n of OGO-4 t r a j e c t o r y f o r t h e records of F igures 2 a , b , c .......................................... 14
...................................... 4 The assumed geometry 23
5 Three ionospher ic p r o f i l e s a , b , c f o r t h e n igh t t ime D-region and t h e e f f e c t i v e c o l l i s i o n frequency a r e shown on t h e r i g h t s i d e of t h e f i g u r e . .......................... 26
6 Transmission c o e f f i c i e n t s f o r t h e p e n e t r a t i n g mode, v e r t i c a l p o l a r i z a t i o n and h o r i z o n t a l p o l a r i z a t i o n a t 17.8 ~ H Z . . . . . . . . . . . . . . . . . . . . . . . . . . . . . . . . . . . . . . . . . . . . . . . . . 29
7 Var i a t i on of t h e p o l a r i z a t i o n of t h e p e n e t r a t i n g mode along t h e m e r i d i a n . . . . . . . ................................. 30
8 Ray- t ra jec tory between a ground VLF t r a n s m i t t e r and a s a t e l l i t e . . . . . . . . . . . . . . . . . . . . . . . . . . . . . . . . . . . . . . . . . . . . . . . . 32
9 Tube of r a y s and geomet r ica l parameters f o r determining t h e focus ing g a i n ......................................... 36
10 Var i a t i on of angles as func t ions of t h e d i s t a n c e f o r an ionosphere whose he igh t i s 90 k m . . . . . . . . . . . . . . . . . . . . . . . . . . . 39
11 Combination of PCM and analog d a t a from OGO 4 . . . . . . . . . . . . . 41
12 OGO-4 t r a j e c t o r y f o r t h e records of F igure l l . . . . . . . . . . . . . 43
13 Receiving l a t i t u d e s of r ays and t h e corresponding longi - t u d i n a l r e f r a c t i v e index f o r waves of 12.5 kHz a s a f u n c t i o n of t h e i npu t l a t i tude . . . . . . . . . . . . . . . . . . . . . . . . . . . . 45
14 Transmission c o e f f i c i e n t s a t 12.5 kHz along t h e meridian. . 48
15 Comparison between c a ~ c u ~ a t e d and OGO-4 observa t ions of magnetic f i e l d amplitude of 12.5 - 12.6 kHz s i g n a l s t r ansmi t t ed by Omega (New York) ........................... 49

Figure -- Page -- 16 Frequency-time s p e c t r a of broadband VEI" d a t a from OGO 4
showing a t y p i c a l example of daytime " e q u a t o r i a l e ros ion" , , 53
17 OGO-4 r eco rds showing t h e NAA magnetic f i e l d amplitude a s measured by t h e s a t e l l i t e phase- t racking r ece ive r i n two consecut ive e q u a t o r i a l c ro s s ings ....................... 54
18 Height d i s t r i b u t i o n s of e l e c t r o n d e n s i t y a t midday equinox and e l e c t r o n c o l l i s i o n frequency. .......................... 59
19 Daytime e q u a t o r i a l model of t h e ionosphere above 100 k m . . . . 60
20 T o t a l ionospher ic l o s s ( r e f l e c t i o n p l u s abso rp t ion ) as a f u n c t i o n of magnetic l a t i t u d e f o r s e v e r a l f r equenc i e s . . . . 62
21 Ray t r a j e c t o r i e s f o r 1 kHz waves i n t h e e q u a t o r i a l iono- sphere using t h e e l ec t ron -dens i ty model of Figure l o . . . . . . . 63
22 Input l a t i t u d e s a t 120 km and t h e r e l a t e d l a t i u u d e s where 1 kHz r a y s w i l l be de t ec t ed by a 600 km po la r - o r b i t i n g s a t e l l i t e . . . . . . . .................................. 65
23 Ionospheric l o s s observed by a 600 km po la r -o rb i t i ng s a t e l l i t e as a f u n c t i o n of l a t i t u d e . . . . . . . . . . . . . . . . . . . . . . . . 68
24 Typica l daytime and n ight t ime r ay t r a j e c t o r i e s followed ............. by waves of 17.8 kHz nea r t h e magnetic equa tor 70
25 Correspondence between t h e l a t i t u d e s where t h e r ays l eak from t h e e a r t h ' s waveguide and t h e l a t i t u d e where they ...... w i l l be de t ec t ed by a s a t e l l i t e whose he ight is hs.. 72
26 The cont inuous curves show t h e focus ing g a i n a s a func t ion of t h e s a t e l l i t e l a t i t u d e c a l c u l a t e d f o r two d i f f e r e n t s a t e l l i t e he igh t s ......................................... 74
27 Lower-ionosphere t ransmiss ion c o e f f i c i e n t f o r p e n e t r a t i n g mode waves t r a v e l i n g s o u t h w a r d . . . . . . . . . . . . . . . . . . . . . . . . . . . . . 77
28 Three ionospher ic models A , B, and C . . . . . . . . . . . . . . . . . . . . . . 79
29 Correspondence between t h e l a t i t u d e s where t h e r ays leak from t h e e a r t h ' s waveguide and t h e l a t i t u d e where they w i l l be de t ec t ed by a s a t e l l i t e a t 700 km f o r t h e two ionospher ic models B and C.................................. 8 1
30 The continuous curves show t h e focus ing g a i n a s a f u n c t i o n of t h e s a t e l l i t e l a t i t u d e f o r ionospheric model B . . . . . . . . . . 82

F i g u r e Page - 31 P o s ~ t x o n of t h e defoeuslng reg lon r e l a t x v e t o t h e magnetxc
equa tor ...,.......,.......~..~~~s~............... 84
32 OGO-4 amplitude measurements of NAA s i g n a l s a t 17.8 kHz.... . 88
33 OGO-4 t r a j e c t o r i e s f o r F igure 3 2 . . . . . . . . . . . . . . . . . . . . . . . . . . . . 89
34 OGO-4 record d i s p l a y i n g t h e h i g h - l a t i t u d e l t e ros ion" phenomenon. ................................................ 92
35a OGO-4 s t i p - c h a r t recorded on 19 November 1 9 6 7 . . . . . . . . . . . . . . . 95
35b Continuat ion of t h e s t r i p - c h a r t shown i n F igure 3 5 a . . . . . . . . . 96
35c Cont inua t ion of t h e s t r i p - c h a r t shown i n F igure 3 5 b . . . . . . . . . 97
36 Ground p r o j e c t i o n of s a t e l l i t e t r a j e c t o r y f o r Figures 35a, b , and c. . . . . . . . . . . . . . . . . . . . . . . . . . . . . . . . . . . . . . . . . . . . . . . . . . . . 98
37 Geometry assumed f o r t h e two-dimensional r a y equa t ion . ...... 103
38 Ray t r a j e c t o r i e s i n a l a t i t u d i n a l l y cons t an t magnetosphere and i n a magnetosphere p re sen t ing an i nc reas ing t rend of i o n i z a t i o n toward t h e equa tor . .............................. 108
39 Geometry f o r developing t h e equa t ions of i o n i z a t i o n o r i e n t e d a long t h e f i e l d l i n e s . . . . . . . . . . . . . . . . . . . . . . . . . . . . . . 112
40 E lec t ron d e n s i t y a t 1000 km a s a f u n c t i o n of l a t i t u d e f o r t h e model magnetosphere .................................... 114
41 The e q u a t o r i a l i o n i z a t i o n p r o f i l e of t h e assumed magneto- s p h e r i c m o d e l . . . . . . . . . . . . . . . . . . . . . . . . . . . . . . . . . . . . . . . . . . . . . . . 115
42a Ray- t ra jec tory f o r 17.8 kHz waves t h a t s t a r t w i t h v e r t i c a l wave-normal a t 120 km he ight and a t 58' l a t i t u d e . . . . . . . . . . . . 116
42b L a t i t u d i n a l behavior of t h e angle between t h e geomagnetic f i e l d and t h e wave-normal of t h e 17.8 kHz wave correspond- ing t o t h e r a y pa th of F igure 4 2 a . . . . . . . . . . . . . . . . . . . . . . . . . . . . 117
43 A r r i v a l l a t i t u d e and corresponding t r a v e l t imes f o r waves of 17.8 kHz a s a f u n c t i o n of t he input l a t i t u d e i n t h e no r the rn hemisphere. ....................................... 121
44 D e t a i l s of t h e l a s t descending p a r t of t h e ray t h a t produces t h e h i g h - l a t i t u d e cu to f f of NAA w a v e s . . . . . . . . . . . . . . . . . . . . . . . 123
45 A r r i v a l l a t i t u d e s as a func t ion of input l a t i t u d e s i n t he nor thern hemisphere f o r waves from P t o 20 k H z . . . . . . . . . . . . . . 126

L I S T OF ILLUSTRATIONS ( e o n t , )
F i g u r e Page
46 Trave l times a s a func t ion of t h e r e c e i v i n g l a t i t u d e s . . . . . . 130
47 P red i c t ed "hookt' w h i s t l e r t o be received a t 500 km he igh t and a t -52' l a t i t u d e . . . . . . . . . . . . . . . . . . .............. 131
48 P ieces of t h e OGO-4 record d i sp layed i n F igure 3 4 . . . . . . . . . . 133
49 Hor i zon ta l component of t h e r e f r a c t i v e index f o r down- going waves i n t h e sou the rn hemisphere a t 120 km he ight a s a f u n c t i o n of input l a t i t u d e . . . . . . . . . . . . . . . . . . . . . . . . . . . . 135
50 Range of l a t i t u d e s where w h i s t l e r f requenc ies of 1 .0 , 2.5, 5 .0 , 7 . 5 , 10.0, 12.5 and 15.0 kHz p re sen t I b I < 1. ........ 137
H - 51 Magnetic f i e l d amplitude of NAA s i g n a l and 0 t o 12.5 kHz
broadband spectrum a s func t ions of time UT and L va lue of OGO .................................................... 144
52 R e p e t i t i o n of t he f e a t u r e s d i sp layed i n F igure 51 f o r 21 September 1 9 6 8 . . . . . . . . . . . . . . . . . . . . . . . . . . . . . . . . . . . . . . . 145
53 Ground p r o j e c t i o n s of t h e two OGO-4 t r a j e c t o r i e s cor re - sponding t o t h e records of Figures 5 1 and 5 2 . . . . . . . . . . . . . . . 146
54 Receiving l a t i t u d e s a t 600 km f o r r a y s t h a t s t a r t between t h e i npu t l a t i t u d e s of 59.95O and 60.35O.. ................. 152

ACKNOWLEDGMENTS --
The a u t h o r i s g r e a t l y i n d e b t e d t o P r o f e s s o r R . A , B e l l i w e l l f o r h i s
g u i d a n c e and s t i m u l a t i n g d i s c u s s i o n s d u r i n g t h e c o u r s e of t h i s r e s e a r c h .
The a u t h o r a l s o wishes t o e x p r e s s h i s a p p r e c i a t i o n t o Dr . R . I,. Smith
and D r . J . J . Angerami f o r t h e i r i n t e r e s t and h e l p f u l c r i t i c i s m s . The
a s s i s t a n c e and encouragement of M r . John K a t s u f r a k i s i n s u p p l y i n g
e x p e r i m e n t a l d a t a f o r t h i s r e s e a r c h , and t h e a s s i s t a n c e of M r . Ken
Howell i n t h e i n t e r p r e t a t i o n of t h e d a t a a r e g r a t e f u l l y acknowledged.
T h i s r e s e a r c h was s u p p o r t e d by t h e N a t i o n a l A e r o n a u t i c s and Space
A d m i n i s t r a t i o n under c o n t r a c t NAS 5-3093 and g r a n t NGL-05-020-008.
Suppor t of t h e N a t i o n a l S c i e n c e Founda t ion th rough t h e O f f i c e o f Computer
S c i e n c e s under g r a n t NSF GP-948 is a l s o acknowledged.
The r e s e a r c h was c a r r i e d o u t under a g r a d u a t e s t u d e n t r e s e a r c h
a s s i s t a n t s h i p awarded by S t a n f o r d U n i v e r s i t y and a s c h o l a r s h i p awarded
by C.N.A.E. - B r a z i l .

A . OBJECTImS
The main purpose of t h i s r e sea rch is t o p re sen t and i n t e r p r e t
measurements of very-low-frequency s i g n a l s observed wi th t h e low-a l t i tude ,
p o l a r - o r b i t i n g , OGO-4 s a t e l l i t e . The i n t e r p r e t a t i o n s of t h e measurements
a r e based on ampli tude and spectrum a n a l y s i s of t h e rece ived s i g n a l s as
w e l l as on t h e r e l a t e d p o s i t i o n of t h e s a t e l l i t e . The phenomena t o be
d i scussed i n t h i s r e s e a r c h a r e observed on n e a r l y a l l r evo lu t ions of
OGO 4 . The p re sen t s tudy i s mainly concerned wi th s i g n a l s generated on
t h e ground by l i g h t n i n g s t r o k e s and by VLF t r a n s m i t t e r s .
This r e s e a r c h may a l s o be c l a s s i f i e d a s a g l o b a l s tudy of very-low-
frequency propagat ion i n t h e ionosphere and i n t h e magnetosphere of t h e
e a r t h . I t inc ludes t h e gene ra l problem of e x c i t a t i o n of waves through
t h e lower ionosphere under d i f f e r e n t cond i t i ons and t h e c h a r a c t e r i s t i c s
of propagat ion i n s i d e t h e a n i s o t r o p i c plasma above t h e e a r t h . The
s tudy covers a v a r i e t y of s i t u a t i o n s , inc lud ing s i g n a l s received when
OGO 4 i s r e l a t i v e l y c l o s e t o t h e ground sources and s i g n a l s received a t
low, middle, and high l a t i t u d e s . The d i f f e r e n c e s between daytime and
n ight t ime propagat ion a r e a l s o included i n t h i s s t udy .
B. THE EARLY WORK
The b u r s t of c u r r e n t produced during a l i g h t n i n g f l a s h involving a
cloud-to-cloud o r cloud-to-ground e l e c t r i c d i scharge r a d i a t e s e l e c t r o -
magnetic energy l i k e an e l e c t r i c d i p o l e . The surge of c u r r e n t whose
d u r a t i o n is of t h e o r d e r of 100 mi l l i seconds r a d i a t e s a l a r g e spectrum
of waves extending from a few Hertz up t o about 20 MHz. These waves a r e
heard as c l i c k s i n r a d i o r e c e i v e r s tuned t o any frequency i n s i d e t he
- 1 -

a b o v e band and corresponci t o the poiiier spectrlsmi r a d i a t e d in the p a s s -
band of t h e r e c e i v e r , The r ad i a t ed waves (whose spectrum usua l ly peaks
between 5 and 10 kHz) e n t e r t h e ionosphere and t r a v e l i n s i d e t h e magneto-
sphere fo l lowing curved t r a j e c t o r i e s . The wave components r ad i a t ed by
t h e l i g h t n i n g source t r a v e l w i th d i f f e r e n t v e l o c i t i e s because t h e mag-
ne tosphere is a d i s p e r s i v e medium, and f i n a l l y they may p e n e t r a t e t he
a i r space below t h e ionosphere i n t h e conjuga te hemisphere. When
reproduced i n aud ib l e form t h e s e wave components u sua l ly sound l i k e
w h i s t l i n g tones of s t e a d i l y f a l l i n g p i t c h , known simply a s "wh i s t l e r s . "
Whi s t l e r s r e p r e s e n t a va luab le t o o l f o r s tudying p r o p e r t i e s of t h e
magnetosphere because some of t h e w h i s t l e r c h a r a c t e r i s t i c s a r e d i r e c t l y
r e l a t e d t o i o n i z a t i o n and g r a d i e n t s of i o n i z a t i o n t h a t e x i s t i n t h e
magnetosphere.
The f i r s t s u c c e s s f u l s tudy of w h i s t l e r s based both on experimental
obse rva t ions and on t h e o r e t i c a l t rea tment was presented by Storey [19531.
S ince then t h e number of pub l i ca t i ons concerning t h e propagat ion of VLF
waves i n t h e magnetosphere has increased s t e a d i l y . S u b s t a n t i a l c o n t r i -
but ions t o t h e understanding of w h i s t l e r s and r e l a t e d phenomena have
been provided by t h e VLF Group of Stanford Univers i ty during t h e l a s t
15 yea r s [He l l iwe l l , 19651. '
Storey El9531 showed t h a t i f t h e f requenc ies of t h e w h i s t l e r com-
ponents were much smal le r than both t h e e l e c t r o n gyrofrequency and t h e
plasma frequency along t h e w h i s t l e r pa th , then t h e whis t le r -packe t
should t r a v e l approximately along t h e e a r t h ' s magnetic f i e l d . Under
t h e above circumstances t h e maximum d e p a r t u r e of t h e r ays r e l a t i v e t o
0 t h e f i e l d l i n e s would be 19 2 9 ' . S torey a l s o observed long t r a i n s of
echoing w h i s t l e r s t h a t presented very low amplitude decrement from each
- 2 -

k i i ~ i s d l e r tc? , t h e correspcrnd ing eciro He s u g g e q t e d t h a t ~onosrj-,herxc
i r r e g u l a r i t i e s l i k e columns of a u r o r a l ionization could have a gu id ing
e f f e c t on t h e waves and thus explain t he low amplitude decrement,
H e l l i w e l l e t a l . C19561 r epo r t ed w h i s t l e r s whose frequency-time
spectrum presented a r i s i n g and a f a l l i n g branch connected t oge the r a t
a f requency of minimum de l ay time r e l a t i v e t o t h e causa t ive l i g h t n i n g
d i scha rge . These w h i s t l e r s a r e known as "nosert w h i s t l e r s and t h e
frequency of minimum de l ay is c a l l e d t h e nose frequency. The au thors
showed t h a t t h e w h i s t l e r d i s p e r s i o n was explained by t h e magnetoionic
theory when t h e frequency components of t h e w h i s t l e r s were permit ted t o
be comparable t o t h e e l e c t r o n gyrofrequency along t h e w h i s t l e r pa th i n
t h e magnetosphere.
Smith e t a l . [1960] developed q u a n t i t a t i v e l y t h e e x i s t i n g i deas of
magnetospheric duc t ing , proposing a theory of t rapping of w h i s t l e r s i n
f i e l d - a l i g n e d duc t s of enhanced i o n i z a t i o n . Smith C1961al presented
some evidence of ducted propagat ion and showed t h a t t h e theory of
t r app ing a l s o p red i c t ed a c u t o f f frequency of approximately one-half t h e
minimum gyrofrequency along t h e w h i s t l e r pa th .
S ince then w h i s t l e r s have been used t o measure t h e p r o f i l e of
e l e c t r o n d e n s i t y a t t h e equa to r . The method is based on f i nd ing t h e
propaga t ion t r a j e c t o r i e s of t h e w h i s t l e r s from t h e i r nose f requenc ies
[Hel l iwel l , 1961; Smith, 1961b, Carpenter , 19621.
In a s tudy based on w h i s t l e r s Carpenter [I9631 showed t h a t t h e
e l e c t r o n d i s t r i b u t i o n i n t h e magnetosphere does n o t f a l l o f f smoothly.
He f r e q u e n t l y found an abrupt decrease of e l e c t r o n d e n s i t y u sua l ly a t
f i e l d l i n e s w i t h an e q u a t o r i a l r a d i u s of about 4 e a r t h r a d i i . This very
s t e e p dec rease of i o n i z a t i o n , known as t h e plasmapause, e x h i b i t s inward/
- 3 -

outwavd motions r e l a t e d to the geomagne t i c a c t i v i t y and is a permanent
f e a t u r e of t h e magnetosphere.
With t h e advent of t h e space age new too l s became a v a i l a b l e f o r t h e
s tudy of whistler-mode propaga t ion , I t was then p o s s i b l e t o observe
w h i s t l e r s i n s i d e t h e magnetosphere before they reached t h e low r eg ion of
t h e ionosphere where they can be r e f l e c t e d , t r ansmi t t ed o r absorbed by
t h e medium. S i m i l a r l y i t was p o s s i b l e t o observe w h i s t l e r s t h a t do n o t
r e t u r n t o t h e e a r t h . With s a t e l l i t e measurements new forms of w h i s t l e r s
were observed i n t h e magnetosphere, namely t h e t tsubprotonosphericl l
w h i s t l e r [Carpenter e t a l . , 19641, t h e " ion cyc lo t ron11 w h i s t l e r EGurnett
e t a l . , 19651, t h e ''helium11 w h i s t l e r [Barr ington e t a l . , 19661, t he
t f magnetospherical ly r e f l e c t e d 1 ' and the "NU" w h i s t l e r [Smith and Angerami,
1968 I , t h e " ion cu to f f I ' w h i s t l e r [Muzzio, 1968 1, and t h e t lwalking-trace"
w h i s t l e r [Walter and Angerami, 19691.
The s a t e l l i t e age a l s o brought t h e p o s s i b i l i t y of con t ro l l ed exper i -
ments i n VLF propagat ion by means of s a t e l l i t e observa t ions of s i g n a l s
t r ansmi t t ed by ground-based U . S . Navy s t a t i o n s . VLF waves were f i r s t
observed i n t h e magnetosphere i n 1961 by t h e L o f t i - I s a t e l l i t e CLeiphart
e t a l . , 19621. In t h i s experiment VLF s i g n a l s were received from t h e
U . S . Navy s t a t i o n s , NBA (24 kHz) i n t h e Canal Zone and NPG (18.6 k ~ z )
i n J i m Creek, Washington. A number of f e a t u r e s of t h e d a t a were i n t e r -
p re ted by Rorden e t a l . C19641.
Observat ions aboard OGO 1 and OGO 2 of whistler-mode waves generated
by U . S . Navy s t a t i o n s were repor ted by Heyborne C19661. He found
s e v e r a l i n t e r e s t i n g f e a t u r e s presented by t h e VLF s i g n a l s from NPG and
NAA, both loca ted i n t h e nor thern hemisphere, He observed a nor thern
hemisphere l a t i t u d i n a l cu tof f i n t h e amplitude of t h e s i g n a l s ; r ecep t ion

7 t of whistler-mode s i g n a l s i n t h e s o u t h e r n hemisphere a t latitudes f o r -
bidden1' by t h e theory of cu to f f a t one-half of t he gyrofrequency [Smith,
1961aI ; an ampli tude cu to f f a t h igh l a t i t u d e s i n the southern hemisphere;
and a d i p of f i e l d i n t e n s i t y over t h e geomagnetic equa tor .
S torey C19661 descr ibed t h e main f e a t u r e s of t h e French s a t e l l i t e
FR-1 and presen ted some pre l iminary r e s u l t s from wave-field measurements
of VLF s i g n a l s t r ansmi t t ed by NBA i n t h e Canal Zone and by FUB (16.8 kHz)
i n S a i n t e Assise, France. FR-1 was a b l e t o measure t h e wave-normal
d i r e c t i o n of t h e waves. For example, an important r e s u l t from FR-1
repor ted by Aubry E1967, 19681, i s t h a t t h e wave normals of t h e waves
genera ted by FUB and rece ived a t m i d l a t i t u d e s i n t h e nor thern hemisphere
a r e d i r e c t e d toward t h e equa to r . Sometimes t h e wave normal i s t i l t e d
0 toward t h e equa to r by more than 50 w i t h r e s p e c t t o t h e v e r t i c a l a t
750 km. He i n t e r p r e t e d t h e phenomenon i n terms of h o r i z o n t a l g r a d i e n t s
of e l e c t r o n d e n s i t y t h a t e f f e c t i v e l y bend t h e waves toward reg ions of
h igher i o n i z a t i on.
C . BRIEF DESCRIPTION OF EXPERIMENT 02 ABOARD OGO 4
The Orb i t i ng Geophysical Observatory OGO 4 , is a multi-experiment
s a t e l l i t e t h a t was launched i n t o a p o l a r o r b i t i n Ju ly 1967. The o r b i t
per iod is of t h e o rde r of 100 minutes , t h e he igh t v a r i e s from approximately
400 t o 900 km and t h e o r b i t i n c l i n a t i o n i s 86'. OGO 4 c a r r i e s more than
20 d i f f e r e n t experiments , one of which w i l l be descr ibed b r i e f l y below.
The S tanford ~ n i v e r s i t ~ / ~ t a n f ord Research I n s t i t u t e experiment
aboard OGO 4 c o n s i s t s of a loop antenna, a broadband p reampl i f i e r t h a t
d r i v e s t h r e e s t epp ing r e c e i v e r s , two broadband r e c e i v e r s , and one phase-
t r ack ing r e c e i v e r . The loop antenna may e f f e c t i v e l y work as an e l e c t r i c

or as a magnetlc i s e L d sensor depending on the p o s i t i o n o f sx,vitehes
s u i t a b l y placed a t t h e antenna and a t t h e input of t h e p reampl i f i e r .
A l l t h e measurements shown i n t h i s r e p o r t were taken when t h e loop
antenna was working a s a magnetic antenna. The VLF spectrum covered by
t h e broadband p reampl i f i e r ranges from 30 Hz t o 100 kHz. The s t epp ing
r e c e i v e r s (No. 1, No. 2, and No. 3 ) ope ra t e t oge the r , t h e tun ing f r e -
quency f o r Band 3 being 8 and 64 times t h e tun ing f r equenc i e s f o r Band 2
and Band 1, r e s p e c t i v e l y . The s tepping r e c e i v e r s provide t h e fol lowing
amplitude measurements of t h e e l e c t r i c o r magnetic wave f i e l d s .
Frequency range 3 db bandwidth
Band 1
Band 2
Band 3
1.05 - 12.5 kHz 2 75 Hz
8 .4 - 100 kHz 2 250 Hz
Each band may be tuned t o one of 256 d i f f e r e n t f r equenc i e s when ope ra t i ng
i n f ixed-frequency mode o r t h e s t epp ing r e c e i v e r s may sweep i n frequency
from t h e bottom t o t h e t o p of each band i n 256 success ive s t e p s when
ope ra t i ng i n t h e sweeping mode.
The broadband r e c e i v e r s provide s p e c t r a l information i n t h e range
30 t o 300 Hz (ELF channel) and 0 .3 t o 12.5 kHz (VLF channel ) .
The phase t r a c k i n g r e c e i v e r measures amplitude and phase of waves
i n t h e range 14 t o 27 kHz. The phase of t h e a r r i v i n g wave i s measured
by comparison wi th t h e phase of a s t a b l e s p a c e c r a f t o s c i l l a t o r and t h e
ampli tude is measured i n a sharp-edged passband of f 2 5 Hz t h a t f a l l s
approximately 30 db a t 550 Hz from the tuned frequency.
Amplitude measurements w i th t h e phase t r ack ing r e c e i v e r and the
s t epp ing r e c e i v e r s a r e te lemetered t o ground i n a form of pulse-code-
modulated (PCM) s i g n a l s . The s i g n a l may be sampled i n a Low b i t r a t e
- 6 -

( 4 k b i t / s e c ) which is suitable f o r t a p e s t o r a g e inside the s p a c e c r a f t
o r i t may be sampled in a high b i t r a t e (64 k b i t / s e c ) when te lemeter ing
i n " r e a l time" to ground,
The amplitude and t h e spectrum con ten t of t h e s i g n a l s rece ived by
t h e broadband r e c e i v e r s a r e te lemetered i n analog form and i n r e a l t ime
t o ground. The s i g n a l i s log-compressed i n ampli tude and then used t o
modulate a v o l t a g e - c o n t r o l l e d - o s c i l l a t o r (VCO) between 15 and 20 kHz.
The spectrum con ten t i s obtained a f t e r t h e s i g n a l i s fed i n t o a s a t u r a t i n g
c l i p p e r and i ts ou tpu t f i l t e r e d t o r e t a i n f r equenc i e s between 30 H z t o
12.5 kHz. The VCO has s e v e r a l u se s , namely i t can be modulated by t h e
ampli tude of t h e ELF and VLF channels and a l s o by t h e ou tput of t h e
s tepping r e c e i v e r No. 3 . ( I n t h i s c a s e , t h e r e f o r e t h e te lemet ry of t h e
s tepping r e c e i v e r No. 3 is obtained i n analog form.)
Experiment 02 onboard OGO 4 is n e a r l y s i m i l a r t o t h e corresponding
experiment c a r r i e d onboard OGO 2 . More d e t a i l s about t h e equipment can
be found i n a p u b l i c a t i o n prepared f o r OGO 2 by F i c k l i n e t a l . C19651.
D . 0 0 - 4 OBSERVATIONS
A sys t ema t i c coverage of VLF phenomena throughout t h e world is
obtained by r eco rd ing cont inuous ly t h e s i g n a l s from t h e s t epp ing r e c e i v e r s
and t h e phase t r a c k i n g r e c e i v e r onboard t h e s a t e l l i t e . In t he course of
t h e p re sen t r e s e a r c h t h e i n t e r p r e t a t i o n s of s e v e r a l phenomena have been
i n i t i a t e d by observ ing t h e d a t a from t h e s e f o u r r e c e i v e r s . We s t a r t
wi th a d i s cus s ion r e l a t e d t o t h e kind of measurements t h a t a r e bas i c i n
t h i s work and t h e g l o b a l f e a t u r e s presented by t h e OGO-4 r e c e i v e r s during
a complete r e v o l u t i o n of t h e s a t e l l i t e .
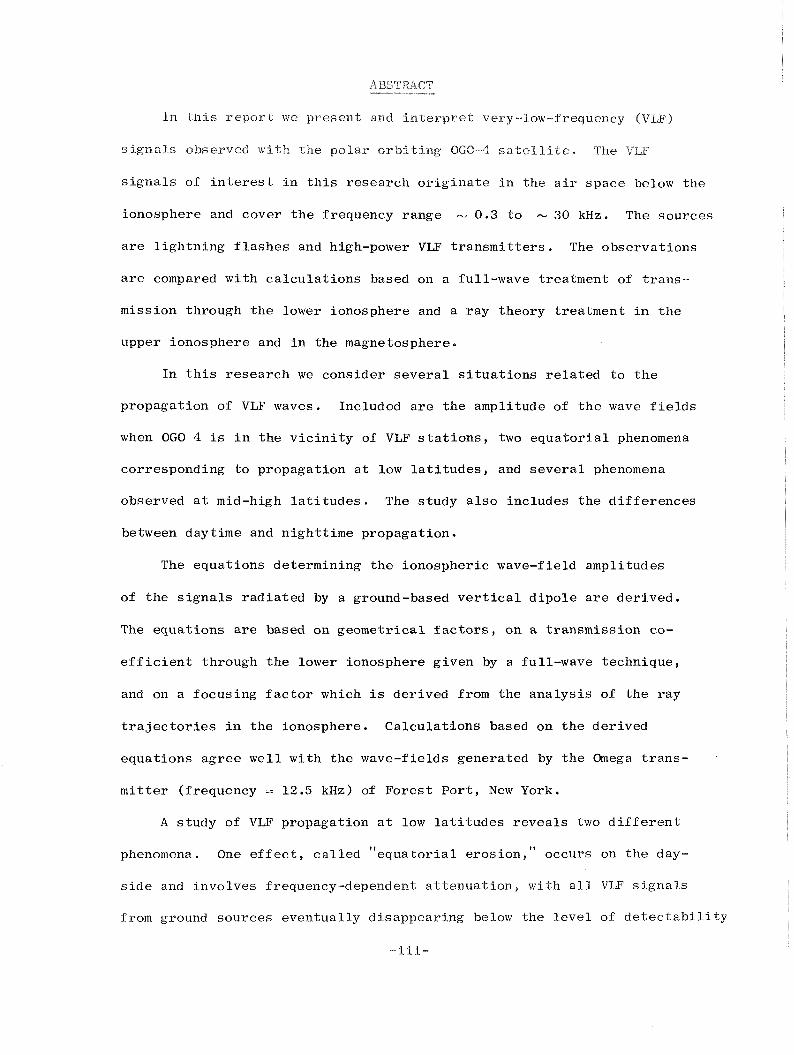
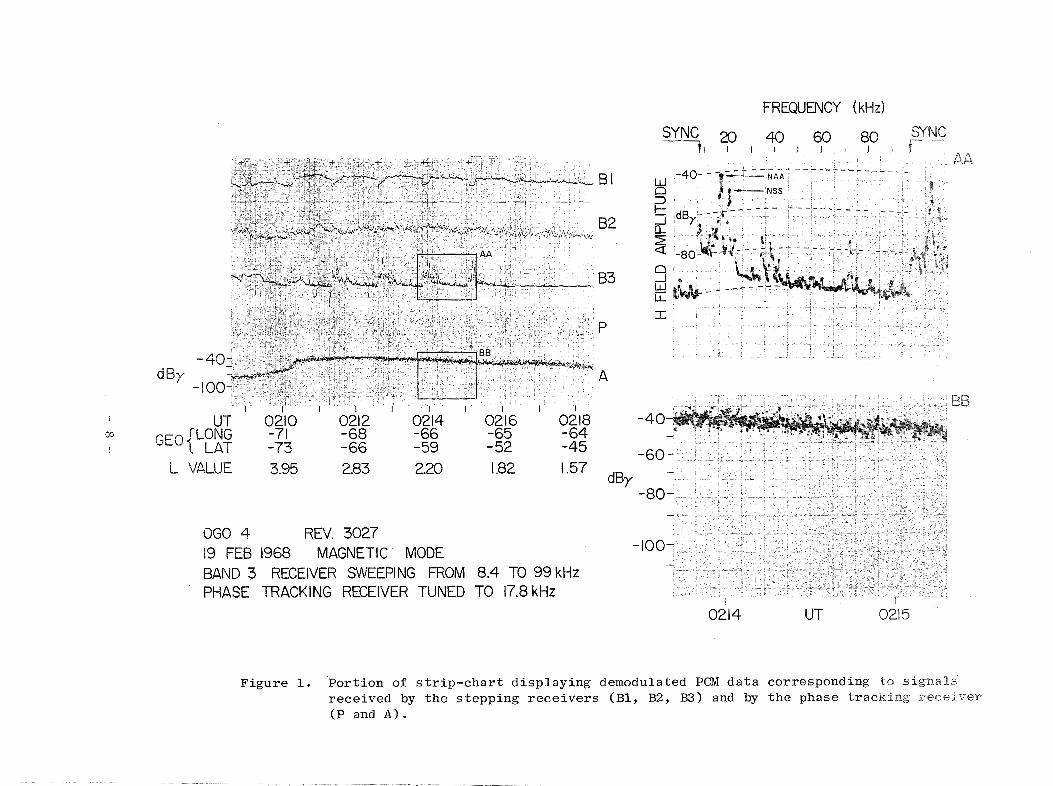
Figure 1 shows a p o r t i o n of a s t r i p - c h a r t d i sp l ay ing PCM da t a
BY
GEO UT ' 0210 ' 0212 ' 0214 ' 0216 ' 0218
LONG -7 1 -68 - 66 -65 -64 LAT -73 -66 -59 - 52 -45
FREQUENCY (kHz)
L VALUE 3.95 2.83 2.20 1.82 1.57
060 4 REV. 3027 19 FEB 1968 MAGNETIC MODE BAND 3 RECEIVER SWEEPING FROM 8.4 TO 99 kHz PHASE TRACKING RECEIVER TUNED TO 17.8 kHz
F i g u r e 1. P o r t i o n of s t r i p - c h a r t d i s p l a y i n g demodulated PCM d a t a cor responding t o s i g n a l s r e c e i v e d by t h e s t e p p i n g r e c e i v e r s ( B l , B2, B3) and by t h e phase t r a c k i n g receiver (P and A ) .

i t o r - e c l by OGO 4 ant1 x i l b s e r j u e n t l ~ r rece*\,ed by tape-d~lrnpxulg a t the telemetry
s t a t i o n i n Rosinan, North Caro l ina + Five records a r e i l l u s t r a t e d , read ing
f r o m top t o bottom: ou tpu t s of Band 1 (1311, Band 2 (B2f , and Band 3 (B)
of t h e s tepping r e c e i v e r s ope ra t i ng i n t he sweeping mode, phase ( P ) , and
amplitude (A) of t h e phase t r a c k i n g r e c e i v e r . Nearly 10 minutes of PCM
d a t a a r e shown as a func t ion of u n i v e r s a l time (UT), geographic p o s i t i o n ,
and t h e L va lue of t h e s a t e l l i t e . Small c ro s se s above t h e Band 1
record show the p o s i t i o n of synchronizing pulses where each frequency
sweep s t a r t s . The 256 s t e p s of each sweep occur dur ing an i n t e r v a l of
73.6 seconds. A t about 0216 UT t h e s t epp ing r e c e i v e r s were switched
t o a f i x e d mode of ope ra t i on commanded by t h e te lemet ry s t a t i o n a t
Sant iago , Ch i l e .
The phase t r ack ing r e c e i v e r i s tuned t o NAA a t 17.8 kHz. The phase
P is u s e l e s s when t h e t ransmiss ion mode of ope ra t i on i s CW o r FSK
( t h e p re sen t ca se ) because t h e phase i s random during t h e Morse code
i n t e r v a l s corresponding t o "no s igna l1 ' (CW) or "another frequency1' (FSK).
The phase may be u s e f u l during i n t e r v a l s of key-down mode t ransmiss ion .
The phase and t h e amplitude of t h e phase t r ack ing r e c e i v e r a r e each
sampled 512 t imes i n each 73.6 s e c i n t e r v a l . The magnetic f i e l d of t he
waves i s measured i n db r e l a t i v e t o 1 gamma, represen ted he re by t h e
symbol dby. Gamma is r e l a t e d t o amperelmeter by
The d a t a recorded by t h e s t epp ing r e c e i v e r s and by t h e phase
t r a c k i n g r e c e i v e r a r e independent ly processed. This f a c t i s very
important f o r i n t e r p r e t i n g t h e measurements c o r r e c t l y . For example, i f
a r e a s o n a b l e v a l u e of wave f i e l d is measured by xhe phase t r a c k i n g
r e c e i v e r then a s p i k e must appear a t t h e corresponding frequency dur ing
t h e sweep of Band 3 . This i s sho~vn on t h e r i g h t s i d e of F i g u r e b $\,here
two r ec t angu la r segments of B3 and A a r e d i sp layed on an expanded s c a l e .
Observe t h a t t h e NAA s i g n a l measured by t h e phase t r ack ing r e c e i v e r is
e a s i l y recognized by a sp ike of t h e same amplitude recorded by the
s t epp ing r e c e i v e r No. 3 a t 17.8 kHz. I t is a l s o p o s s i b l e t o observe
t h e s i g n a l t r ansmi t t ed by NSS a t 21.4 kHz.
The presence of no i se is e a s i l y de t ec t ed by t h e s tepping r e c e i v e r s
when, i n s t ead of s p i k e s , a continuous curve is d isp layed during t h e
sweep. For example, F igure 1 shows t h a t a t 0210:30 UT the NAA s i g n a l
i s de t ec t ed by t h e phase t r ack ing r e c e i v e r a s recognized by t h e cor re -
sponding s p i k e a t B3. However, t h e sweep s t a r t i n g a t about 0209 UT
e x h i b i t s a cont inuous amplitude behavior denot ing a band of no i se t h a t
goes from about 13 kHz t o 50 kHz. Therefore t h e amplitude measured a t
A i s no i se and n o t s i g n a l from NAA.
PCM d a t a of a complete r evo lu t ion of OGO 4 . F igures 2a t o 2c show
p o r t i o n s of a cont inuous s t r i p c h a r t corresponding t o 139 minutes of
PCM d a t a s t o r e d by OGO 4 on 19 February 1968 between 0017 and 0236 UT.
The onboard t ape r eco rde r began t o s t o r e d a t a j u s t a f t e r t ape dumping
a t t h e te lemet ry s t a t i o n a t Or ro ra l , A u s t r a l i a ; l a t e r a t 0236:30 UT
t h e s t o r e d d a t a were te lemetered t o Rosman, North Ca ro l ina . The ground
p r o j e c t i o n of t h e s a t e l l i t e t r a j e c t o r y i s superimposed on t h e mercator
p r o j e c t i o n of world shown i n F igure 3 . The numbers on t h e s a t e l l i t e
t r a j e c t o r y i n d i c a t e times (UT) of i n t e r e s t i n g events which w i l l be
d i scussed below.
F igures 2a t o 2c show t h e amplitudes of t h e t h r e e s tepping r e c e i v e r s ,
- 10 -

F i g u r e 2 a . Segments of a con t inuous s t r i p - c h a r t r ecorded by OGO 4 on 19 February 1968. B1, B2, B3 a r e t h e ampl i tudes o f t h e s t e p p i n g r e c e i v e r s o p e r a t i n g i n sweeping mode a s i n d i c a t e d i n F i g u r e 1. The phase t r a c k i n g r e c e i v e r (P and A) was tuned t o NAA a t 17 .8 kHz. C d e n o t e s a c a l i b r a t i o n sweep which o c c u r s a f t e r 1 6 c o n s e c u t i v e sweeps .


Figure 2 c . A con t inua t ion of F igure 2b.


RI, R2, and B3, operating I n the sv ,ccp~ng mode a n d the phase (P) and the
amplitude (A) of t h e phase t racking r ece ive r tuned t o NAA a t 17.8 kHz.
T h e synchronizing pulses f o r the band r ece ive r s a r e represented by
v e r t i c a l bars i n t he top record B l . The main f e a t u r e s presented by B l ,
B2, B3 and A a r e d iscussed below.
1 ) Low l a t i t u d e observa t ions .
The s i g n a l l e v e l s from mid- la t i tude VLF t r a n s m i t t e r s decrease
a t low l a t i t u d e s . There is an abrupt decrease of s i g n a l a t n ight t ime
e q u a t o r i a l c ros s ings a s shown i n F igure 2a between -- 0048 and - 0054 UT
and i n t h e subsequent pass between 0223 and -- 0230 UT (Figure 2c ) . The
geographic p o s i t i o n s of t h e s e reg ions where t h e NAA s i g n a l drops below
the threshold l e v e l of t he equipment i s shown i n Figure 3 . There i s an
absence of s i g n a l i n B2 and I33 while B1 measures some s i g n a l below
- 1 kHz. There a r e sp ikes i n t he s tepping r e c e i v e r s corresponding t o
i n t e r f e r e n c e l i n e s t h a t appear when t h e e x t e r n a l s i g n a l l e v e l is very
low. The common i n t e r f e r e n c e l i n e s f o r B1 a r e 400, 800, and 1200 Hz
corresponding t o harmonics of t h e power supply l i n e a t 400 Hz. For B2
t h e i n t e r f e r e n c e l i n e s a r e harmonics of t h e spacec ra f t dc conver te rs
a t 2461 kHz. The i n t e r f e r e n c e i n B3 a r e odd harmonics of 2461 kHz.
Measurements i n r e a l t ime wi th the broadband r e c e i v e r i n d i c a t e t he
presence of w h i s t l e r s a t t hese low l a t i t u d e s during the n i g h t . The
reason f o r the t o t a l absence of s i g n a l s i n B2 and I33 i s because these
w h i s t l e r s p re sen t smal l d i s p e r s i o n a t the higher f requencies and there-
f o r e they a r e ignored by t h e low sampling r a t e of t he equipment.
During daytime e q u a t o r i a l c ros s ings the s i g n a l from the t r ans -
m i t t e r s i t u a t e d i n t h e n i g h t s i d e decreases progress ive ly and goes below
t h e d e t e c t a b i l i t y l e v e l as the s a t e l l i t e approaches the equator ( s ee
- 15 -

F i g u r e 2b abou t 0139 UT and the satellite position In Figure 3). B I ,
B2, and B3 f ollow the same p a t t e r n of A , as shown xn E'xgure 2b . Observe
t h a t t h e decrease of the e x t e r n a l s i g n a l l e v e l i s q u i t e marked i n B l ,
When r e a l time da t a a r e analyzed t h e above e f f e c t i s manifested by a
progress ive disappearance of t h e high f requencies of w h i s t l e r s a s t h e
s a t e l l i t e approaches t h e equator . There is a complete absence of
s i g n a l s i n s a t e l l i t e records obtained near t h e magnetic equator dur ing
daytime.
2) Mid-lat i tude observa t ions .
There is an enhancement of s i g n a l s t ransmi t ted by mid- la t i tude
VLF s t a t i o n s and rece ived by t h e s a t e l l i t e a t mid- la t i tudes i n both
hemispheres. In t h e hemisphere of the VLF t r a n s m i t t e r a maximum s i g n a l
is received when the s a t e l l i t e i s nea r ly east-west from t h e t r a n s m i t t e r
( s ee F igure 2a about 0104 UT f o r n ight t ime and about 0127 UT when t h e
s a t e l l i t e is i n t h e dayside over Russ ia ) . These s i g n a l s reach t h e
s a t e l l i t e from below, a f t e r t r a v e l i n g i n s i d e t h e ground-ionosphere
space from t h e t r a n s m i t t e r t o t h e f o o t of t he r ay t r a j e c t o r y between
t h e low-ionosphere and t h e s a t e l l i t e . In t h e conjugate hemisphere of
t h e t r a n s m i t t e r t h e s i g n a l s t h a t reach t h e s a t e l l i t e coming from above
a r e much s t ronge r t han s i g n a l s exc i ted from below. (This was checked
by measuring t h e t r a v e l t imes of s i g n a l s . ) Therefore t h e s i g n a l l e v e l s
observed i n t h e conjugate hemisphere a r e r e l a t e d t o f i e l d s measured i n
t h e hemisphere of t h e t r a n s m i t t e r , Enhancements of NAA s i g n a l s i n t h e
southern hemisphere a r e observed a t -- 0038 UT and i n the succeeding
r evo lu t ion a t - 0214 UT (both i n t he n igh t s ide ) and -- 0150 UT (days ide)
when t h e s a t e l l i t e i s over A u s t r a l i a ,
The s i g n a l l e v e l i n Band l and Band 2 increases toward mid
- 16 -

l a t i t u d e s on both s ides of t h e e q u a i o r , and a l s o f o r both d a y s i d e and
n i g h t s i d e ( s e e B 1 a t l e f t and r i g h t of 0052 UT (n igh t s ide ) and 0139 UT
(days ide ) ) The signal behavior i n B l and B2 is charac te r ized by s c a t t e r e d
p o i n t s caused by the r ecep t ion of w h i s t l e r s . The wh i s t l e r energy t h a t l i e s
i n s i d e t h e bandwidth of the sweeping r e c e i v e r i s more e f f i c i e n t l y sampled
a t mid - l a t i t udes where downgoing w h i s t l e r s p re sen t g r e a t e r d i spe r s ion .
Some n o i s e probably i s a l s o p re sen t i n s i d e B1 and B2 a t mid- la t i tudes
but t h i s n o i s e i s masked by t h e r ecep t ion of w h i s t l e r s . Whist ler energy
i s a l s o observed i n fewer ca ses by B3 a t mid- la t i tudes . The sp ikes
r e l a t e d t o w h i s t l e r s a r e d i f f e r e n t from those r e l a t e d t o s i g n a l s t r a n s -
mit ted from VLF s t a t i o n s because i n t h i s l a s t ca se t h e sp ikes remain a t
t he same frequency f o r a l l sweeps.
3 ) High- la t i tude observa t ions .
There is a h igh - l a t i t ude cu tof f i n t h e i n t e n s i t y of t h e s i g n a l s
from mid - l a t i t ude t r a n s m i t t e r s observed i n t h e conjugate hemisphere
( s ee t h e c u t o f f i n amplitude A of t h e NAA s i g n a l a t 0032 UT and i n t h e
fo l lowing r e v o l u t i o n of OGO 4 a t 0210 U T ) . The phenomenon is we l l
documented by t h e disappearance a t h igher l a t i t u d e s of t h e NAA s p i k e
i n B3. The h igh - l a t i t ude cu tof f i n t h e conjugate hemisphere of t h e
t r a n s m i t t e r is a l s o de tec ted i n t h e dayside ( see Figure 2b a t 0154 UT)
al though i n t h i s case t h e cu to f f i s l e s s pronounced.
The h igh - l a t i t ude cu tof f i n t h e conjugate hemisphere of NAA
i s i n f a c t a p a r t i c u l a r case of a more gene ra l phenomenon de tec ted i n
every OGO-4 pass , namely a h igh - l a t i t ude l 'erosionl l of downgoing w h i s t l e r s .
The cu to f f i n t h e occurrence of w h i s t l e r s a t high l a t i t u d e s is more
e a s i l y observed wi th the broadband r e c e i v e r . However i t can be reason-
ably observed i n Figure 2c near 0210 UT: as t h e s i g n a l of NAA decreases

t h e s i g n a l i n R2 disappears and t h e s i g n a l i n BI progress ive ly deczqeases
toward h igher l a t i t u d e s ( t o t h e l e f t of 0210 U T ) , T h i s e f f e c t converted
t o w h i s t l e r observa t ion means t h a t t he downgoing w h i s t l e r s a r e "eroded"
a t high l a t i t u d e s wi th t h e h igher f requencies d isappear ing f i r s t as t he
observa t ion goes from mid l a t i t u d e t o t h e nea re s t po le . Disregarding
t h e occurrence of wel l - loca l ized a u r o r a l no ise AON (discussed below)
the s t epp ing r e c e i v e r s e x h i b i t t y p i c a l l y empty bands i n po la r regions
( see El , B2, and I33 about 0024, 0117, and 0202 UT) . I n every r evo lu t ion of OGO 4 i t is poss ib l e t o i d e n t i f y two
r i n g s of i n t e n s e no i se around each magnetic po le . The same r i n g i s
crossed twice dur ing each h igh - l a t i t ude pass . The reg ions labe led AON
i n F igures 2a9 b, and c s t and f o r a u r o r a l oval noise. Th i s no ise has a
t y p i c a l spectrum ranging from 2 - 5 kHz t o above 50 kHz, but t h e i n t e n s i t y
of t h e no i se seems t o depend upon t h e z e n i t h angle of t h e sun. A O N ' s
a r e observed i n t h e southern hemisphere near 0021 and 0027 UT and i n
t he succeeding r e v o l u t i o n of OGO 4 near 0158 and 0208 UT. In t he
nor thern hemisphere A o N ' s a r e observed near 0114 and 0121 UT. The
amplitude of t h i s a u r o r a l no i se i n t h e 50 Hz bandwidth of t h e phase
t r ack ing r e c e i v e r is very i n t e n s e a s shown i n the record of amplitude
A j u s t below t h e AON symbols i n F igures 2a9 b, and c .
In t h e hemisphere of t he mid- la t i tude t r a n s m i t t e r t h e r e is
a l s o a h igh - l a t i t ude decrease i n t h e i n t e n s i t y of t h e upgoing s i g n a l s
r e l a t e d t o t h e p o s i t i o n of t h e AON. I n t h i s case the s i g n a l from a
powerful VLF t r a n s m i t t e r competes w i th the AON l e v e l and t h e s i g n a l
r e t u r n s when the s a t e l l i t e c ros ses t h e po la r reg ion . Observe f o r
example t h e decrease of t h e NAA s i g n a l as t he s a t e l l i t e moves northward
a t 0112 UT. A c l o s e observa t ion of B3 i n d i c a t e s tha-t t h e NAA sp ike
- 18 -

co~rlpctes ~ ~ i t h t h e n o i s e l e v e l near 0113 t o 0116 UT and Lhe s i g n a l from
NAA remains (although i n a somewhat i r r e g u l a r fashion) when the s a t e l l i t e
c rosses the polar region near 0117/0119 UT,
E . CONTRIBUTIONS OF THE PRESENT WORK
In t h i s research the exc i t a t ion of VLF waves through the lower
ionosphere i s s tudied by means of a ttfull-wave't treatment of the wave
equations. The r e l a t e d computer program is f u l l y discussed i n a r epor t
by Scarabucci E19691.
The wave f i e l d s s e t up by VLF s t a t i o n s i n the nearby ionosphere of
the t r ansmi t t e r a r e ca lcula ted by means of the full-wave computer
program and a ray-tracing computer program developed by Walter C19691.
I t is shown t h a t very good agreement i s obtained between ca lcula ted and
measured s i g n a l l e v e l s (Chapter 2 ) .
A s tudy of VLF propagation a t low l a t i t u d e s reveals two d i f f e r e n t
phenomena. During daytime equa to r i a l propagation i s dominated by
c o l l i s i o n a l absorption i n t h e lower ionosphere which increases sharply
a t lower l a t i t u d e s . This e f f e c t i s manifested by a complete disappearance
from s a t e l l i t e records a t low l a t i t u d e s of a l l s i g n a l s o r ig ina t ing on
the ground. During nightt ime t h e c o l l i s i o n a l absorption i s l e s s
important and it w i l l be shown t h a t i n t h i s case the propagation is
highly dependent upon the change of v e r t i c a l gradient of e l ec t ron dens i ty
i- a t the CO' - H 1 t r a n s i t i o n height . These v e r t i c a l gradients of ioniza-
t i o n produce defocusing of VLF waves near the equator . The above
equa to r i a l phenomena a r e discussed i n Chapter 3 .
In Chapter 4 a simple i n t e r p r e t a t i o n of the amplitude measurements
i n the conjugate hemisphere of NAA a l s o j u s t i f i e s seve ra l p roper t i e s of

3u~~sa3Sns b~3uox~s auo pus y3xeasaJ sry~ $0 TTnsax ~usqxodmy uv
sp~a~3-ans~ $0 apn~r~dure ayq uy Suypej daap 30 ssex3 e b~-puy,$
jjo$n3 paTeInaIe3 ay& *asnedemstqd ayT ~e s~uarpex3 daa~s ayT pug axayds
uor~e?axdxa$uy a~qyssod e saprnoxd OSTE pus sapn3yTeI ysyy-pym qs p 090
bq paaya~ax sxaITsyyhi IT= TSO~IB XOJ squnoa3s apom q-d ay& .saurT
-pTayc ayq 3uoxe uor~eSedoxd ~euypn$-fSuo~ bxaxnd go ~ea~dbq axe 3eq~
ayq yTyM uor~eSedoxd bq pazrxaT3-exey3 sr apom q-d ay;L *uoy%eSedoxd
xaTqsryM 30 apom (y-6) ,,~eurpn~rSuo~-oxd,, ayq $0 bxoayq ayq 03 spsal:
axaydsoqauSvm aya ur sa~xo~3aCex~ b-ex 30 bpnqs paIyeTap *bTysuap
uox~aa~a $0 s?uaypex3 puypnT-f?eT sapnIauy Teya axaydso~au%e~u so Tapom
3yTsyIeax e Lq papxqsuomap s-f xoyaeyaq bvx syy& *axaydsjmay a~eSnCuo3
ay$ uy sapnxr$-eI y3yy pxe~o~ y~ed 3uypuaasap e SAIOTIOJ pue sqysyay
hi01 d~aarTe1a~ JZ xo~enba ay3 sassox3 'pxehiu-f sIaaex3 sapnTyTeT y3yy
TV sTxeTs 3-e~~ LEJ v osau-cTpTarj 3r~aa3emoa3 ayT yTrhi pau%yxe ~ou sr
TEY? Guro?~aC~~? E Srr~hio~~oj xa2j-e a~aydsruray a3-eSnCuoa ay? rr-5: sapnJ-g$-eT
STY-PTIU 2-e pa~raaax axe suor?-e$s apnTFT.ey--p-gw dq palmpiex s-~-eu.Srs
~TA arii, ?T-'r[l TXA~OIJS ST 21 "v ojljg j7t~t?oq~ s;raIas!y\i pani,aaa-r d~rrorm~~or,

result may be the starting point for future research relative to wave-
p a r t i c l e i n t e r a c t i o n s a t t h e s e eqrratori-a1 heights,

I I , EXCBTAT ION OF \VBISTL,ER-MODT b"VES ------ - - --"- T'KROUGK THE LOWER 1 ONOSPHERE
I n t h e lower r e g i o n of t h e i o n o s p h e r e t h e e l e c t r o n c o n c e n t r a t i o n
shows s u b s t a n t i a l v a r i a t i o n o v e r d i s t a n c e s comparable t o t h e l o c a l wave-
l e n g t h s o f very-low-frequency waves . The p r o p a g a t i o n of t h e s e VLF waves
i n s i d e t h e D-region of t h e i o n o s p h e r e is dominated by i n t e r n a l r e f l e c t i o n s ,
c o u p l i n g between d i f f e r e n t modes of p r o p a g a t i o n and by c o l l i s i o n a l absorp -
t i o n . The a m p l i t u d e of t h e p r o p a g a t i o n wave f i e l d s does n o t p r e s e n t a
s i n u s o i d a l v e r t i c a l v a r i a t i o n , t h u s r u l i n g o u t f i e l d s o l u t i o n s of t h e
form exp(- j f3z) . Under t h e above c i r c u m s t a n c e s a 'If ull-wave" method of
s o l u t i o n must be used i n which t h e wave- f i e ld s o l u t i o n i s c o n s t r u c t e d
p o i n t by p o i n t i n s i d e t h e i o n o s p h e r e by s o l v i n g n u m e r i c a l l y t h e r e l a t e d
wave e q u a t i o n s .
The set of d i f f e r e n t i a l e q u a t i o n s g o v e r n i n g t h e p r o p a g a t i o n of p l a n e
waves i n s i d e a h o r i z o n t a l l y s t r a t i f i e d a n i s o t r o p i c i o n o s p h e r e was
d e r i v e d by Clemmow and Heading L19541. These l i n e a r d i f f e r e n t i a l wave
e q u a t i o n s a r e n u m e r i c a l l y i n t e g r a t e d th roughou t t h e D and E i o n o s p h e r i c
r e g i o n s by s p e c i f y i n g t h e h e i g h t d i s t r i b u t i o n of t h e l o c a l i o n o s p h e r i c
p a r a m e t e r s and t h e d i r e c t i o n and p o l a r i z a t i o n of an i n c i d e n t wave. A
computer program f o r i n t e g r a t i n g t h e Clemmow-Heading e q u a t i o n s f o r waves
g e n e r a t e d below t h e i o n o s p h e r e h a s been developed by S c a r a b u c c i [I969 I .
The n u m e r i c a l t e c h n i q u e assumes t h a t t h e r e i s an e l e c t r o m a g n e t i c p l a n e
wave p r o p a g a t i n g i n f r e e s p a c e which is i n c i d e n t upon a p l a n a r l y s t r a t i -
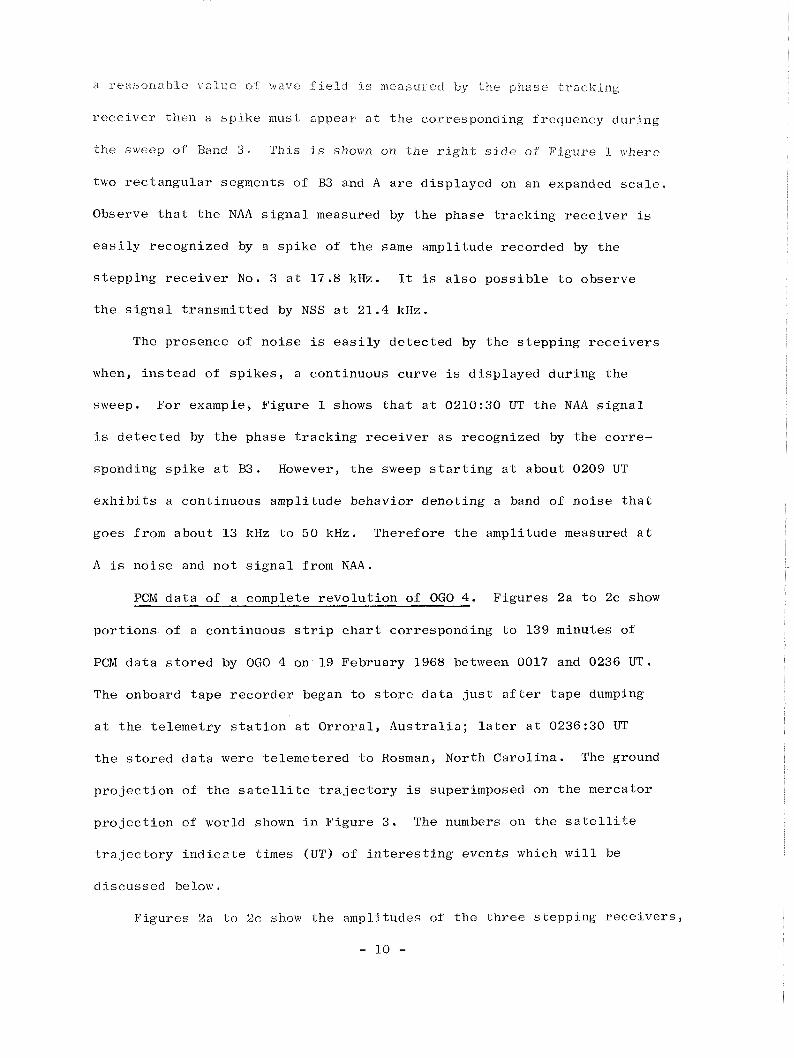
f i e d i o n o s p h e r e t h a t v a r i e s o n l y i n t h e z - d i r e c t i o n a s shown i n F i g u r e 4 .
The geometry i s s u c h t h a t t h e p l a n e s of s t r a t i f i c a t i o n a r e p a r a l l e l t o
t h e (x-y) p l a n e . The y a x i s i s p a l s a l l e l t o t h e ground and i n t h e
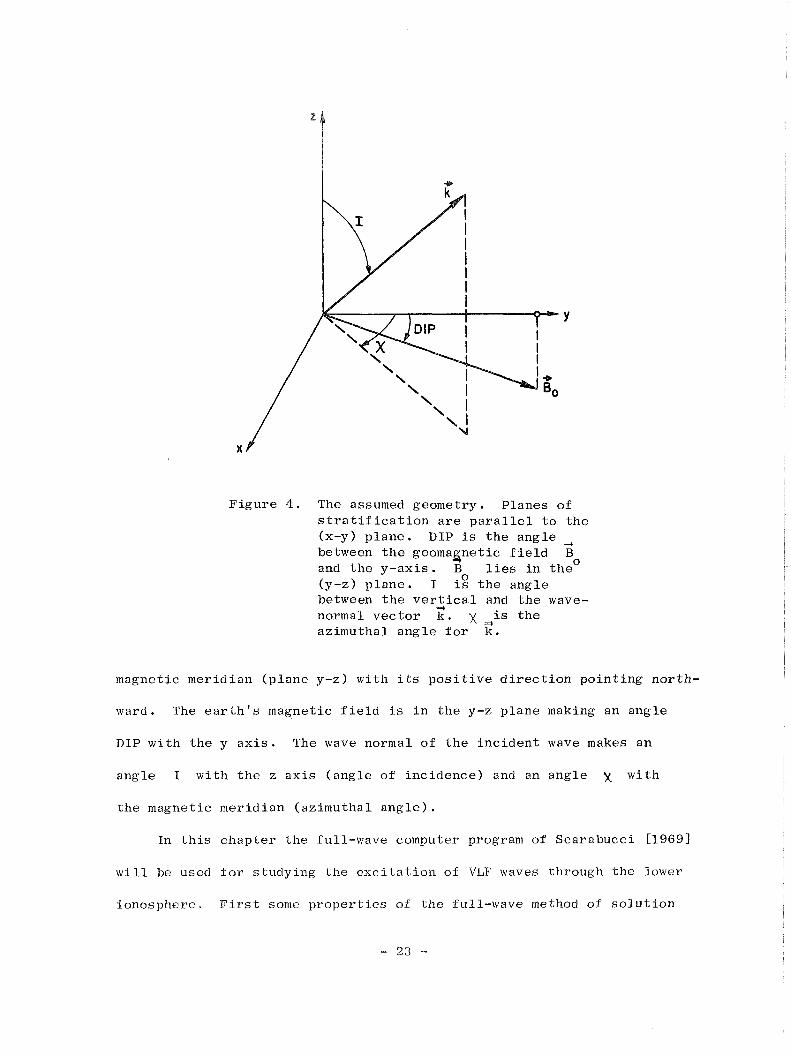
F i g u r e 4 . The assumed geomet ry . P l a n e s of s t r a t i f i c a t i o n a r e p a r a l l e l t o t h e (x-y) p l a n e . DIP is t h e a n g l e _, between t h e geomagnet ic f i e l d B and t h e y - a x i s .
Bo l ies i n t h e 0
(y-z) p l a n e . I i s t h e a n g l e between t h e v e r 2 i c a l and t h e wave- normal v e c t o r k . x +is t h e a z i m u t h a l a n g l e f o r k .
magne t i c m e r i d i a n ( p l a n e y-z) w i t h i ts p o s i t i v e d i r e c t i o n p o i n t i n g n o r t h -
ward. The e a r t h ' s magne t i c f i e l d is i n t h e y-z p l a n e making a n a n g l e
DIP w i t h t h e y a x i s . The wave normal of t h e i n c i d e n t wave makes an
a n g l e I w i t h t h e z a x i s ( a n g l e of i n c i d e n c e ) and an a n g l e X w i t h
t h e magne t i c m e r i d i a n ( a z i m u t h a l a n g l e ) .
In t h i s c h a p t e r t h e fu l l -wave computer program of S c a r a b u c c i C19691
w i l l be used f o r s t u d y i n g t h e e x c i t a t i o n of VLF waves th rough t h e lower
i o n o s p h e r e . F i r s t some p r o p e r t i e s of t h e fu l l -wave method o f s o l u t i o n

~$111 be d l s c u s s e c l . Thns ilrsciassion 15 fo l lov,eci hy .i r l e r ~ i i a t ~ o n of the
equations r e q u l r e d f o r c a l c u l a t l n g t i le ionospheric f l e l d s g e n e r a t e d by
ground t r a n s m i t t e r s by malting use o f t h e fu l l -wave method, The e q u a t i o n s
may be used f o r p r e d i c t i n g t h e i o n o s p h e r i c f i e l d s g e n e r a t e d by ground-
based VLF t r a n s m i t t e r s o r , s i m i l a r l y , t h e i o n o s p h e r i c f i e l d s o r i g i n a t e d
from n a t u r a l l y o c c u r r i n g l i g h t n i n g f l a s h e s . The b u r s t s of c u r r e n t pro-
duced by l i g h t n i n g f l a s h e s s i m u l a t e t h e r a d i a t i o n of a s m a l l v e r t i c a l
e l e c t r i c d i p o l e when t h e d i s c h a r g e o c c u r s between c loud and g round . The
p r o c e s s of c a l c u l a t i o n i s t h e n a p p l i e d f o r computing t h e wave f i e l d s
t h a t s h o u l d be measured by a p o l a r s a t e l l i t e d u r i n g i t s p a s s i n t h e
nea rby i o n o s p h e r i c r e g i o n o f a 12.5 kHz t r a n s m i t t e r . More s p e c i f i c a l l y
t h e purpose of t h e c a l c u l a t i o n is t o compare t h e computed f i e l d w i t h
measurements made aboard t h e OGO-4 s a t e l l i t e n e a r t h e Omega t r a n s m i t t e r
l o c a t e d i n N e w York. The r e s u l t s a r e d i s c u s s e d and i t is shown t h a t t h e
f u l l - w a v e method p roduces f i e l d v a l u e s t h a t match t h e measurements i n a
v e r y c o n s i s t e n t and s t a b l e manner.
A . SOME PROPERTIES OF THE NUMERICAL FULL-WAVE METHOD
Most of t h e p r o p e r t i e s p r e s e n t e d by t h e n u m e r i c a l fu l l -wave method
have been e x t e n s i v e l y s t u d i e d i n t h r e e b r i l l i a n t paper s by P i t t e w a y C19651,
P i g g o t e t a l . [1965], and P i t t e w a y and J e s p e r s e n [1966]. The purpose
h e r e w i l l be t o e s t a b l i s h some fundamenta l p r o p e r t i e s t h a t w i l l be c o n t i n u -
o u s l y used from now on and t o emphasize a s p e c t s of t h e method t h a t have
n o t been covered by t h e above r e f e r e n c e d p a p e r s .
The f u l l - w a v e s o l u t i o n f o r t h e problem of i n c i d e n c e of upgoing waves
i n t h e lower i o n o s p h e r e i s g i v e n i n t e rms of " p e n e t r a t i n g 1 1 and "non-
p e n e t r a t i n g f r nrode waves. Given t h e d i r e c t i o n of t h e i n c i d e n t wave, t h e

pcncl rat i~-tg mode is l ound by determining the po la r i z a t j on of t h e incident
i i a v e l.shich maximizes the power transmitted through the lower ionosphere.
I 'he non-penetrating mode has p o l a r l z a t l o n such that no poiver-flow 1s
produced a t t he t op of t h e ionosphere, Therefore t h e a b i l i t y of an
i n c i d e n t wave t o gene ra t e whistler-mode waves i n s i d e t h e ionosphere i s
d i r e c t l y r e l a t e d t o t h e degree of s i m i l a r i t y between t h e p o l a r i z a t i o n s
of t h e i nc iden t wave and t h a t of t h e pene t r a t i ng mode.
F igure 5 shows t h e envelope of t h e t o t a l ZoHx
f i e l d s e t up by a
p e n e t r a t i n g mode wave of 18.6 kHz t h a t encounters t h e D reg ion of t h e
0 ionosphere a t an angle of inc idence of 30 and t r a v e l s from e a s t t o
0 west (X = -90 ) . The f i e l d envelope i s shown t o g e t h e r wi th some n igh t -
time he igh t d i s t r i b u t i o n s of e l e c t r o n s and e l e c t r o n c o l l i s i o n frequency
( r i g h t s i d e of F igure 5 ) i n o rde r t o emphasize some r e l a t i o n s h i p s between
the wave f i e l d d i s t r i b u t i o n and t h e assumed models of e l e c t r o n d e n s i t y
and c o l l i s i o n frequency. The ionospher ic p r o f i l e s a , b , and c were
der ived by Deeks E1966a I based on measurements of r e f l e c t i o n c o e f f i c i e n t s
made i n England and us ing t h e full-wave computer program of Pi t teway.
The n ight t ime p r o f i l e b i s app rop r i a t e f o r w in t e r a t sunspot maximum
and a l s o f o r summer and equinox a t sunspot minimum. This p r o f i l e w i l l
be used ex t ens ive ly i n t h i s r e p o r t .
Laboratory experiments (Huxley C19591, Phelps and Pack C19601) have
shown t h a t t h e c o l l i s i o n frequency of e l e c t r o n s wi th a i r molecules
( n i t r o g e n , oxygen) i s d i r e c t l y p ropor t i ona l t o e l e c t r o n energy. Using
t h e above r e l a t i o n s h i p f o r t h e c o l l i s i o n frequency and t h e t h e o r e t i c a l
approach of Sen and Wyller C19601 f o r t h e s u s c e p t i b i l i t y of a medium
having a Maxwellian d i s t r i b u t i o n of e l e c t r o n s , Deeks [1966bl der ived
new wave equa t ions desc r ib ing propagat ion of waves through t h e ionosphere.

ENVELOPE OF Z,H, PENETRATING MODE
ELECTRON DENSITY, cm-"
.gure 5 . Three ionospher ic p r o f i l e s a , b , c f o r t h e n igh t t ime D-region and t h e e f f e c t i v e c o l l i s i o n frequency v a r e shown on t h e r i g h t s i d e of t h e f i g u r e [Deeks, 1966a,b
The r e s u l t i n g envelope of Z H f o r t h e p e n e t r a t i n g mode whose parameters a r e 0 . x
shown on t h e l e f t ( t op ) a r e g lven f o r ionospher ic model b. Z i s t h e impedance 0
of f r e e space .

i ic sl~osecl that no essential new features viere ji~trodrlced i l l to the r e s u l t s
of full-wave calculations by che use of t h e generalized theory and t h a t
a s u i t a b l e c h o i c e of e f f e c t i v e c l a s s i c a l c o l l i s i o n f requency g i v e s
numer ica l r e s u l t s i n good agreement w i t h t h e more complicated t h e o r y .
The e f f e c t i v e c l a s s i c a l c o l l i s i o n f requency v i n F i g u r e 5 was c a l c u l a t e d
by Deeks C1966bl based on e x p e r i m e n t a l r e s u l t s and i s v a l i d f o r VLF waves.
For dayt ime and m i d - l a t i t u d e s a p p r o p r i a t e e l e c t r o n d e n s i t y models of
t h e D r e g i o n were g i v e n by Mechtly and Smith C19681. However, no c a l -
c u l a t i o n s f o r dayt ime a t m i d - l a t i t u d e s w i l l be p resen ted i n t h i s r e p o r t .
The enve lope of t h e p e n e t r a t i n g Z H f i e l d shown a t t h e l e f t of 0 X
F i g u r e 5 p r e s e n t s a s t a n d i n g wave p a t t e r n below t h e p r i n c i p a l r e f l e c t i o n
l e v e l a t - 8 9 km. I t shows t h a t t h e s m a l l e l e c t r o n d e n s i t i e s provided
by model b below 89 km d o n o t s u b s t a n t i a l l y i n t e r f e r e w i t h t h e propa-
g a t i o n of t h e 18 .6 kHz waves because t h e d i s t a n c e s e p a r a t i n g peaks o r
v a l l e y s i n t h e s t a n d i n g wave is e s s e n t i a l l y t h a t r e s u l t i n g from propa-
g a t i o n i n f r e e s p a c e . Above 90 km t h e amount of energy r e f l e c t e d i s
very sma 11, t h e "wave length1 ' d e c r e a s e s and a l t h o u g h some a b s o r p t i o n i s
o c c u r r i n g a t t h e s e h e i g h t s t h e magnet ic wave f i e l d i n c r e a s e s because of
impedance t r a n s f o r m a t i o n . Some s m a l l r e f l e c t i o n s s t i l l occur above
104 km where t h e e l e c t r o n d e n s i t y e x h i b i t s a g a i n s u b s t a n t i a l v e r t i c a l
v a r i a t i o n . However t h e wave l e n g t h i n s i d e t h e medium becomes s m a l l e r
and soon t h e medium i s a s lowly v a r y i n g ionosphere f o r 1 8 . 6 kHz waves
a s denoted by t h e smooth v a r i a t i o n of t h e envelope of Z H above 115 km. 0 X
T h e r e f o r e a n i n c i d e n t p e n e t r a t i n g mode wave g i v e s r ise t o a r e f l e c t e d
downgoing wave and t o an upgoing whistler-mode wave h i g h i n t h e ionosphere .
Although t h e power c a r r i e d th rough by t h e whistler-mode wave i s maximized
by t h e c h o i c e of a s u i t a b l e p o l a r i z a t i o n ( p e n e t r a t i n g mode) f o r t h e
- 27 -

i n c i d e n t wave, i t does n o t n e c e s s a r i l y produce the s m a l l e s t amount of
r e f l e c t e d power.
F i g u r e 6 i l l u s t r a t e s t h e behavior of t h e t ransmiss ion c o e f f i c i e n t s
i n t h e lower ionosphere f o r 17.8 kHz waves a s a func t ion of t h e angle of
0 inc idence and f o r propagat ion along t h e north-south meridian (X = 0 ).
The ionospher ic model used is t h e one labe led b i n Figure 5 . The
e a r t h ' s magnetic f i e l d and t h e wave frequency a r e such t h a t Figure 6
s imu la t e s n igh t t ime cond i t i ons near t h e VLF Navy t r a n s m i t t e r NAA i n
C u t l e r , Maine (44 O ON, 67 OW). The square of t h e t ransmiss ion c o e f f i c i e n t
is def ined as t h e r a t i o between t h e z -d i rec ted power flow c a r r i e d by t h e
whis tler-mode wave high i n t he ionosphere and t h e z -d i rec ted power f low
of t h e i n c i d e n t wave ( s ee Scarabucci C19691). The t ransmiss ion c o e f f i c i e n t
c h a r a c t e r i z e s t h e t o t a l l o s s ( r e f l e c t i o n p lus abso rp t ion ) su f f e r ed by t he
input wave. F igure 6 shows t h e t ransmiss ion c o e f f i c i e n t T f o r t h e P
p e n e t r a t i n g mode and t h e c o e f f i c i e n t s Th and T corresponding t o v
h o r i z o n t a l and v e r t i c a l p o l a r i z a t i o n s . Th and T a r e r e l a t e d t o T v P
by
F igure 6 shows t h a t t h e t ransmiss ion c o e f f i c i e n t s decrease f o r I
0 approaching t h e l i m i t i n g angles of F90 and t h a t they p re sen t a broad
0 maximum around I r -15 when the i nc iden t wave normal i s d i r e c t e d
0 along t h e e a r t h ' s magnetic f i e l d ( D I P = 75 ) , Figure 6 a l s o shows t h a t
f o r t h e assumed ionospher ic cond i t i ons t he v e r t i c a l p o l a r i z a t i o n is
r e l a t e d t o more l o s s e s r e l a t i v e t o h o r i z o n t a l p o l a r i z a t i o n . However
0 observe t h a t f o r angles of incidence near -15 we have T~ T v and
T = dr2 T which means t h a t both v e r t i c a l l y and h o r i z o n t a l l y po la r ized P h '

Figure 6 . Transmission c o e f f i c i e n t s f o r t h e pene t r a t i ng mode T , v e r t i c a l p o l a r i z a t i o n Tv and h o r i z o n t a l
0 p81a r i za t i on T a t 17.8 kHz. DIP = 75 , f H = 1 .6 MHz an2 t h e propagat ion is along t h e
0 meridian x = 0 . Ionospheric p r o f i l e b from Figure 5 .
waves only l o s e 3 d b r e l a t i v e t o t h e whistler-mode wave s e t up by t h e
p e n e t r a t i n g mode.
F igure 7 shows t h e p o l a r i z a t i o n P
of t h e pene t r a t i ng mode f o r t h e
same cond i t i ons of F igure 6 . The p o l a r i z a t i o n is def ined he re by t h e
r a t i o between t h e e l e c t r i c f i e l d component i n t h e plane of inc idence
E ~ . ~ . ' and t h e h o r i z o n t a l component of t he e l e c t r i c f i e l d
E~~~ '
Figure 7 shows t h a t t h e p o l a r i z a t i o n of t h e pene t r a t i ng mode is n e a r l y
0 c i r c u l a r t o t h e l e f t near I = -15 where / p p l i s c l o s e t o 1 and
0 i s c l o s e t o -90 .
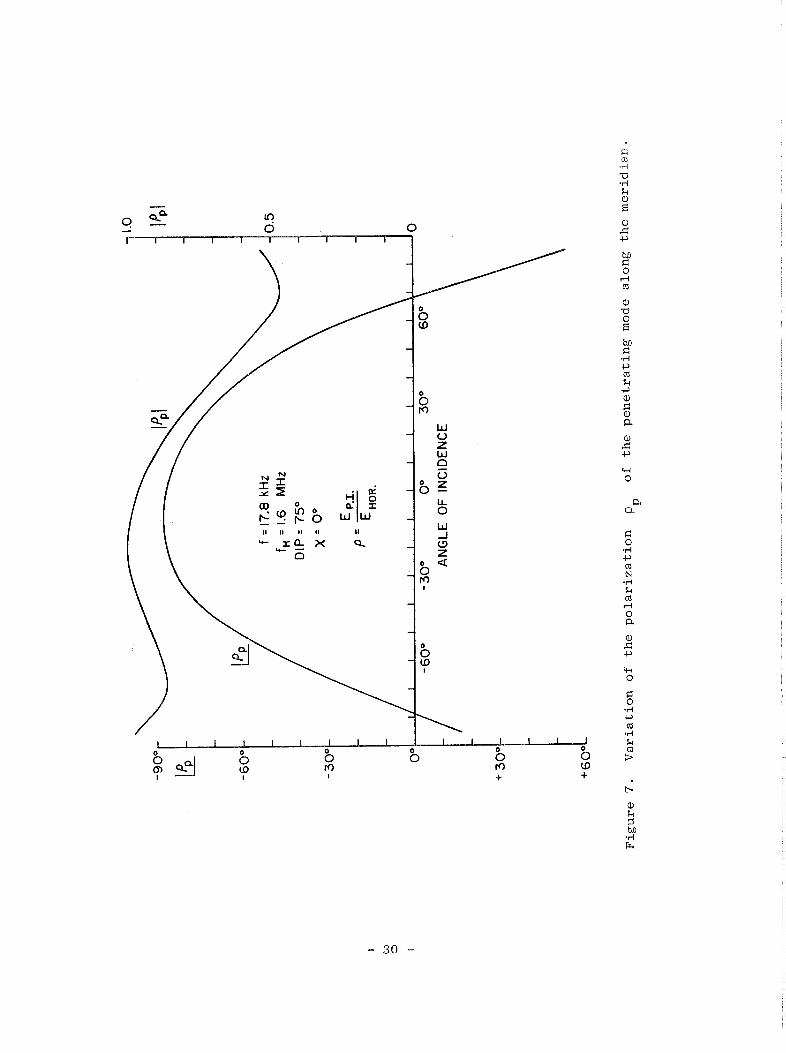

F a g u r r 7 ihows Lha i F o r m o i l ang les of incidence t h e pene t r a t i ng
mode i s e l l x p t i c a l l y po l a r i zed t o t h e l e f t , However when t h e a n g l e
between the i n c i d e n t wave normal and t h e magnet ic f i e l d i s very l a r g e
t he optimum p o l a r i z a t i o n changes t h e sense of r o t a t i o n from l e f t t o
0 0 r i g h t a f t e r ach iev ing l i n e a r p o l a r i z a t i o n s a t I " 68.5 and I -2 -79 . These l i n e a r p o l a r i z a t i o n s of t h e p e n e t r a t i n g mode a r e n e i t h e r h o r i z o n t a l
nor v e r t i c a l f o r t h e ionospher ic cond i t i ons of F igure 7 . For example,
0 a t I = 68.5 ,
P Z 0.47 which means t h a t t he p e n e t r a t i n g i nc iden t
0 e l e c t r i c wave f i e l d makes an angle of - 25 with t h e h o r i z o n t a l p lane .
Be IONOSPHERIC WAVE FIELDS GENERATED BY GROUND TRANSMITTERS
In t h i s s e c t i o n we d e r i v e t he equa t ions f o r c a l c u l a t i n g t he wave
f i e l d s high i n t h e ionosphere produced by a ground-based smal l v e r t i c a l
d i p o l e antenna. The adopted geometry i s g iven i n F igure 8 where a r a y
t r a j e c t o r y from t h e ground t r a n s m i t t e r T t o a s a t e l l i t e S i s shown.
The wave r a d i a t e d by T h i t s t h e lower boundary of t h e D reg ion of t h e
ionosphere whose he igh t is h a f t e r t r a v e l i n g a d i s t a n c e s . The
wave normal of t he i n c i d e n t wave bends toward t h e v e r t i c a l during t h e
D r eg ion c ros s ing and t h e r a y is f i n a l l y launched i n the w h i s t l e r medium
above the E r eg ion of t he ionosphere. The po in t of e n t r y i n t h e lower
ionosphere occurs a t a ground d i s t a n c e d from t h e t r a n s m i t t e r and t h e
angle of inc idence is I a s shown i n F igure 8 . Observe t h a t i n a d d i t i o n
t o t he r ay shown i n F igure 8 o t h e r r ays may a l s o reach t h e s a t e l l i t e by
bouncing one o r more times between t h e lower edge of t he ionosphere and
the ground, f i n a l l y fo l lowing a t r a j e c t o r y t h a t a l s o i n t e r c e p t s t h e
s a t e l l i t e S . This f a c t in t roduces the p o s s i b i l i t y of fad ing and w i l l
be d i scussed near t h e end of t h i s s e c t i o n . The equa t ions t o be der ived
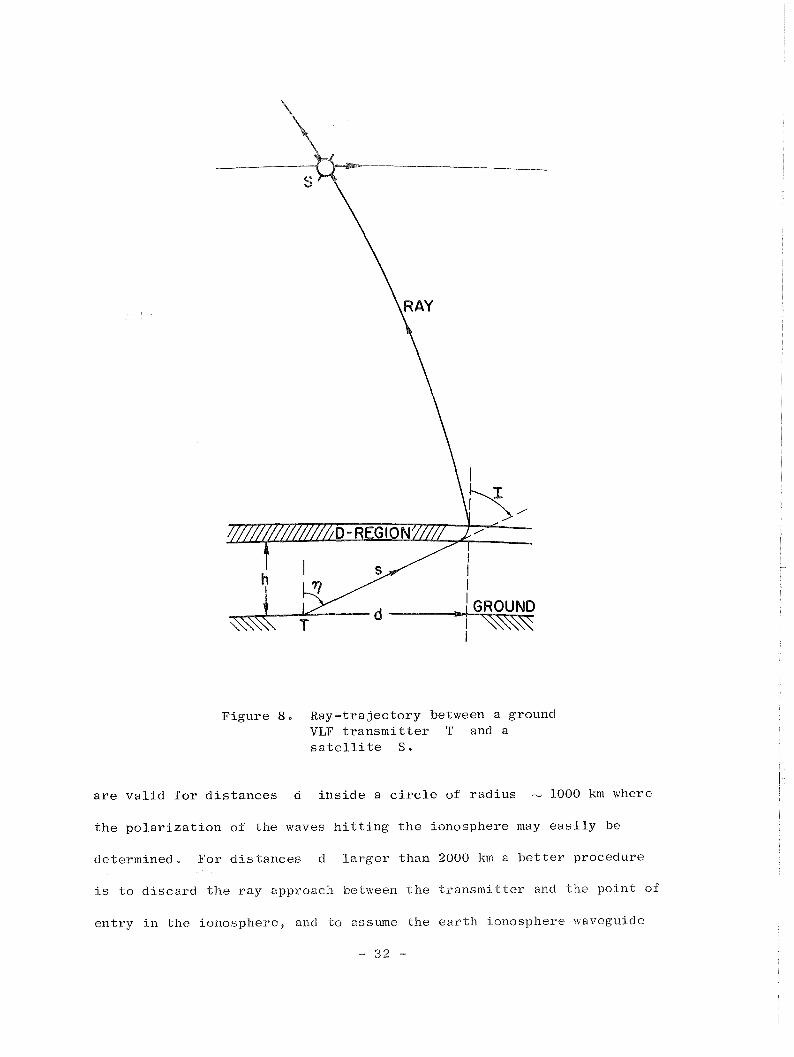
F i g u r e 8 - R a y - t r a j e c t o r y between a ground V L F t r a n s m i t t e r T and a s a t e l l i t e S .
a r e v a l i d f o r d i s t a n c e s d i n s i d e a c i r c l e of r a d i u s - 1000 km where
t h e p o l a r i z a t i o n o f t h e waves h i t t i n g t h e i o n o s p h e r e may e a s i l y be
d e t e r m i n e d . F o r d i s t a n c e s d l a r g e r t h a n 2000 km a b e t t e r p r o c e d u r e
i s t o d i s c a r d t h e r a y approach between t h e t r a n s m i t t e r and t h e p o i n t of
e n t r y i n t h e i o n o s p h e r e , and t o assume t h e e a r t h i o n o s p h e r e waveguide
- 3 2 -

approach, I n o r d e r lo determ~ne x h e Leakage of t n c waveguide, f u r t h e r
assumptions must be made by assuming only t he ex i s t ence of t h e w a v e g ~ i d e
mode n = 1 and a t ransmiss ion c o e f f i c i e n t i n t h e lower ionosphere
g iven by the p e n e t r a t i n g mode. Obviously t h e accuracy of t h e c a l c u l a t i o n
must be re laxed .
Heyborne C19661 c a l c u l a t e d ionospher ic wave f i e l d s us ing r e s u l t s
deduced by Crary C19611 i n which a sha rp ly bounded model of t h e lower
ionosphere was assumed. Among o t h e r assumptions, Crary assumed a v e r t i c a l
magnetic f i e l d and a homogeneous ionosphere. Heyborne assumed some
va lues f o r t h e r e f l e c t i o n c o e f f i c i e n t and t h a t ionospher ic l o s s was
represen ted only by abso rp t ion . The p o l a r i z a t i o n and t h e azimuthal
d i r e c t i o n of t h e i n c i d e n t wave were d i s regarded .
The process of c a l c u l a t i o n used he re d i f f e r s s i g n i f i c a n t l y from t h e
one presented by Heyborne [I9661 because of a d i f f e r e n t mathematical
approach followed h e r e which s i m p l i f i e s t h e a n a l y s i s . The behavior of
t h e waves i n t h e lower ionosphere i s s tud i ed by using t h e full-wave
computer program of Scarabucci [1969], whi le t h e r a y t r a j e c t o r i e s above
t h e E reg ion a r e analyzed by means of a r ay - t r ac ing computer program
developed by Walter C19691.
1. Power Radiated bv a Small V e r t i c a l Grounded D i ~ o l e
The power f l u x p r a d i a t e d by a v e r t i c a l grounded d i p o l e whose
l eng th is much smal le r than t h e wave l eng th a t t h e frequency of e x c i t a t i o n
i s pure ly r a d i a l r e l a t i v e t o t h e d i p o l e and i s g iven by
2 2 p = F s i n n / ~ watt/m
2 ( 2 . 2 )
where is t h e d e c l i n a t i o n angle shown i n Figure 8 and F i s a cons t an t
t h a t depends on the amount of r ad i a t ed power P , The r a d i a t i o n p a t t e r n
- 33 -

of the s m a l l grounded dipole at any vertical p l a n e that contains the
d i p o l e i s a h a l f " e i g h t " f i g u r e ( s ee f o r example Ternlan [I9551 Sec. 23-6)
0 which means t h a t q i s def ined between Q and 90°+ The radsa ted power
P is found from p by summing up a l l t h e f l u x e s emanating from a closed
s u r f a c e t h a t con ta in s t h e d i p o l e , f o r example
2 F s i n q ,
pdS = 4nF
(27rs a s inn) . sdq = - 2 3
S sphe re 0
Therefore , t h e power-flux, Eq . (2 .2) i s given by
2 . Transmission i n t h e Lower Ionosphere
The z -d i r ec t ed power f l u x P :, above t h e E r eg ion is r e l a t e d
t o p by t h e t r ansmis s ion c o e f f i c i e n t f o r v e r t i c a l p o l a r i z a t i o n , i . e . ,
Above t h e E r eg ion t h e W.K.B. method r e p l a c e s p r o f i t a b l y t h e
ful l -wave method. The assumption of p lanar s t r a t i f i c a t i o n f o r t h e medium
i s d iscarded and a r ay - t r ac ing technique is used i n o r d e r t o f i n d t h e
t r a j e c t o r i e s of t h e upgoing r a y s . The ray t r a j e c t o r i e s may involve
more a t t e n u a t i o n caused by f u r t h e r absorp t ion above t h e E r eg ion and
d ivergence of r a y s . On t h e o t h e r hand t h e r e may be some ga in caused
by focus ing of r a y s .
Absorption above the E r eg ion is caused mainly by Coulomb
c o l l i s i o n . Ca lcu l a t i ons of absorp t ion using a r e a l i s t i c c o l l i s i o n

i rer l r re t icy p r o f i l~ a n d f o r se-cieral e l e e d r o n - d e n s i t y p r o f i l e s provide I t o
3 d b e x t r a a t t e n u a t i o n , depending on t h e i o n i z a t i o n between 120 and
600 I t m , This e s t r a l o s s is s m a l l and w i l l no t be considered i n t h e
fo l lowing c a l c u l a t i o n s .
3 . Focusing Gain
Under t h e above circumstances t h e power f l u x t h a t a r r i v e s a t
t h e s a t e l l i t e i s r e l a t e d t o t h e i npu t power above the E region by the
ray behavior . The focusing g a i n is def ined by t h e r a t i o between t h e
i npu t and t h e ou tput c ros s - sec t ion a r ea s of a " tube of r ays . " The tube
of r ays may be determined by two ad j acen t r a y s separa ted i n l a t i t u d e by
A$, and by a l o n g i t u d i n a l increment AX. I f we suppose t h a t t h e r ays
remain i n t h e same magnetic mer id ian , which i s a good assumption f o r
t h e purpose of power c a l c u l a t i o n , t h e focus ing ga in is then independent
of AX and i s g iven by
where i r e f e r s t o t h e p o s i t i o n of i npu t above t h e E r eg ion and s t o
t h e p o s i t i o n of t h e s a t e l l i t e . F igure 9 shows t h e geometr ical parameters
involved i n Eq . (2 .6) :
r is t h e g e o c e n t r i c r a d i u s
@ i s t h e magnetic l a t i t u d e
and @ i s t he angle between t h e ray and t h e l o c a l v e r t i c a l .
A l l elements i n Eq . (2 .6) a r e determined by t h e r ay - t r ac ing computer
program. The focus ing ga in def ined by Eq . (2 .6) may assume values
above o r below t h e un i ty which means t h a t divergence of rays i s a l s o
considered i n E q . ( 2 . 6 ) .

Figure 9 . Tube of rays and geomet r ica l parameters f o r determining t h e focus ing g a i n .
The power f l u x a t t h e s a t e l l i t e i s r e l a t e d t o t h e power-flux
j u s t above t h e E reg ion by
Observe t h a t ' is the v e r t i c a l component of t h e t o t a l power f l u x pz
p ; / c ~ s @ ~ j u s t above t h e E r e g i o n .
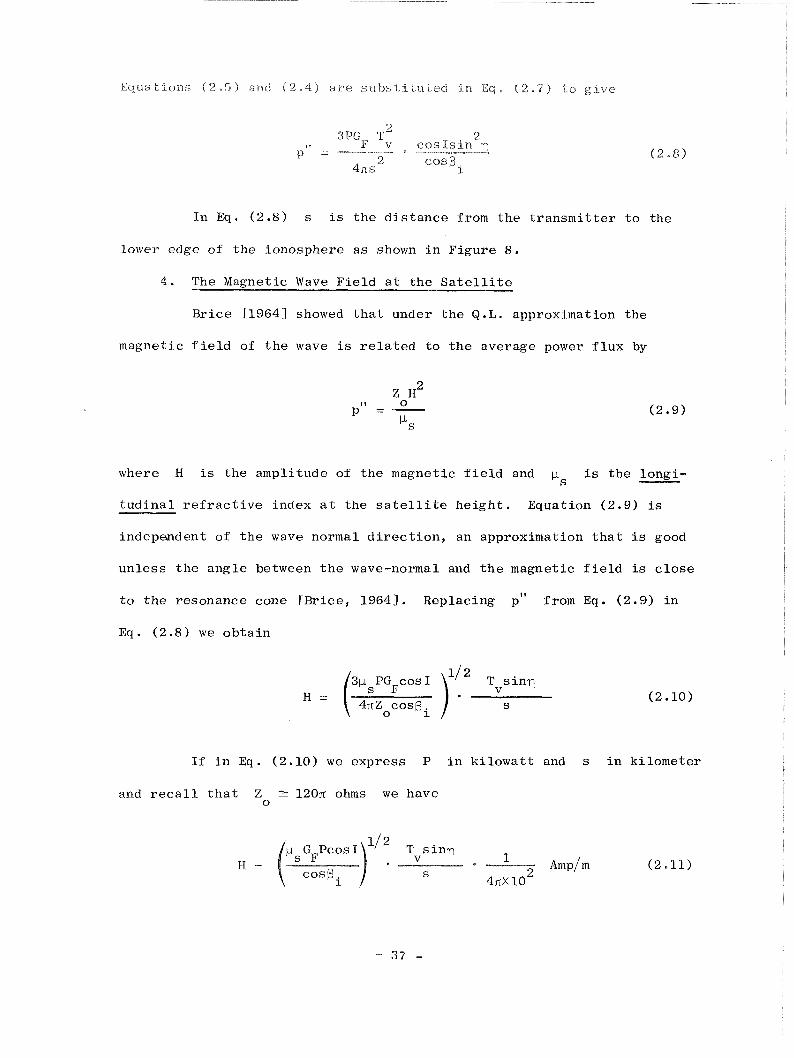
E q i i a t l o n i ( 2 - 5 ) a n d (2,4) are s u b s t i t u t e d in E q , (2.7) to g i v e
3PG T~ 2 I I E v c o s I s i n q
P =- 2 eosp 4ns i
In Eq, (2 .8) s i s t h e d i s t a n c e from t h e t r a n s m i t t e r t o t he
lower edge of t h e ionosphere a s shown i n F igure 8 .
4 . The Magnetic Wave F i e l d a t t h e S a t e l l i t e
Br ice 119641 showed t h a t under t h e Q.L. approximation the
magnetic f i e l d of t h e wave is r e l a t e d t o t h e average power f l u x by
where H is t h e ampli tude of t h e magnetic f i e l d and is the longi -
t u d i n a l r e f r a c t i v e index a t t he s a t e l l i t e h e i g h t . Equation (2.9) is
indepeadent of t h e wave normal d i r e c t i o n , an approximation t h a t is good
un le s s t h e ang le between t h e wave-normal and t h e magnetic f i e l d is c l o s e
t o t h e resonance cone CBrice, 19642. Replacing from Eq. (2 .9) i n
Eq. (2 .8) we ob ta in
I f i n Eq. (2.10) w e express P i n k i l o w a t t and s i n k i lometer
and r e c a l l t h a t Z 2 1207r ohms w e have 0

l+'ina l l y we express H i n gammas ( * Y ) :
Theref o r e , t h e f i e l d a t the s a t e l l i t e w i l l be given by
p G PCOSI 'I2 T s i n q
= ( scas,i vs
P i n k i l owa t t
s i n ki lometer
In o rde r t o u s e Eq. (2.13) t o c a l c u l a t e the magnetic wave f i e l d a t
t h e s a t e l l i t e t h e fo l lowing procedure is used.
1. Ray t r a j e c t o r i e s i n a model ionosphere determine the focus ing
g a i n GF and t h e l o n g i t u d i n a l r e f r a c t i v e index ps
a t t h e
s a t e l l i t e he igh t a s a func t ion of s a t e l l i t e p o s i t i o n . In
p a r t i c u l a r , g iven a po in t S h igh i n t h e ionosphere t h e ray-
t r a c i n g technique determines t h e l a t i t u d e and the longi tude
where t h e r ay begins j u s t above t h e E r eg ion .
2 . The d i s t a n c e d i s then ca l cu l a t ed ( s ee F igure 8 ) . Observe
t h a t i n g e n e r a l t h e ray t r a j e c t o r y above t h e E r eg ion i s no t
coplanar w i th t h e t r a j e c t o r y below t h e ionosphere.
3. The d i s t a n c e s , t h e ang le of inc idence I and t h e d e c l i n a t i o n
angle q a r e then determined by
s i n ( d / r o ) t a n I = (2.15)
and 7 = I + d / r (2.16) 0
r is t h e e a r t h r a d i u s . 0
I and a r e shown i n F igure 10 a s a func t ion of t h e d i s t a n c e
d from t r a n s m i t t e r and f o r h = 90 k m .

0 500 1000 DISTANCE FROM TRANSMITTER, km
Figure 10 . Va r i a t i on of angles I and a s func t ions of t h e d i s t a n c e d f o r an ionosphere whose he igh t is 90 km.
4. Given I and the azimuth x of t h e r a y d i r e c t i o n below t h e
ionosphere is then p o s s i b l e t o determine T . v
5 . Equation (2.13) determines t h e amplitude of t h e magnetic wave
f i e l d a t S .
F i n a l l y we d i s c u s s b r i e f l y t h e p o s s i b i l i t y of f ad ing caused by
i n t e r f e r e n c e between t h e d i r e c t r a y ( t h e one ca l cu l a t ed by E q . (2 .13) )
and o t h e r r a y s . These i n t e r f e r i n g r ays may bounce two o r more times
between the ground and t h e lower edge of t h e ionosphere before fo l lowing
a t r a j e c t o r y t h a t a l s o i n t e r c e p t s t he d i r e c t r ay a t S . The c a l c u l a t i o n
of t he ionospher ic f i e l d s under t he se circumstances is somewhat involved
because t h e phase of t h e wave must be computed i n a l l s t e p s of c a l c u l a t i o n .

Furthermore t h e t ransmiss ion coe f f i eken t c a n be g r e a t l y modifieci a f t e r
each ground-ionosphere hop because the p o l a r i z a t i o n of t h e r e f l e c t e d
waves is used a s ~ n p u t f o r t h e sueceedlng inc idence i n t h e ionosphere,
Extensive c a l c u l a t i o n s of f ad ing have been done f o r p r o f i l e b of
F igure 5 and f o r propagat ion of 12.5 kHz waves along the meridian a t
mid l a t i t u d e s . The r e s u l t s i n d i c a t e a s p a t i a l p a t t e r n of l ad ing ,
p r e sen t ing a maximum of -- 5 d b between t h e peaks and v a l l e y s of t h e
s i g n a l . However t h e fad ing usua l ly observed aboard t h e OGO-4 s a t e l l i t e
is much deeper than 5 d b which shows t h a t t h e above kind of f ad ing is
no t t h e dominant f a c t o r c o n t r o l l i n g t h e t o t a l f i e l d s t r e n g t h .
There a r e s e v e r a l o t h e r e f f e c t s t h a t can produce deep fad ing a t t h e
s a t e l l i t e . One of t h e s e e f f e c t s , l i k e l y t o occur i n t h e a c t u a l ionosphere,
i s i n t e r f e r e n c e between d i r e c t r a y s t h a t e n t e r t h e ionosphere a t d i f f e r e n t
p o i n t s and t h a t fo l l ow ray t r a j e c t o r i e s t h a t i n t e r s e c t a t t h e s a t e l l i t e
he igh t . Such i n t e r s e c t i o n s would be caused by h o r i z o n t a l g r a d i e n t s of
e l e c t r o n d e n s i t y . The a n a l y s i s of deep f ad ing i n t h e amplitudes of
ionospher ic wave f i e l d s w i l l be pursued f u r t h e r i n Chapter 6 .
C . OGO-4 AMPLITUDE MEASUREMEXTS OF WAVE FIELDS I N THE VICINITY OF GROUND TRANSMITTERS
In t h i s s e c t i o n we p re sen t t y p i c a l n igh t t ime amplitude measurements
of s i g n a l s recorded ahoard t h e OGO-4 s a t e l l i t e i n t h e v i c i n i t y of ground
VLF t r a n s m i t t e r s . The theory developed i n t h e prev ious s e c t i o n s i s now
appl ied i n o rde r t o p r e d i c t t h e s i g n a l l e v e l s t h a t should be measured i n
a s p e c i f i c ca se . Ca lcu la ted and measured wave f i e l d s a r e compared and
good agreement i s ob ta ined .
F igure 11 p r e s e n t s OGO-4 records showing amplitude measurements of
s i g n a l s t r ansmi t t ed by NAA a t 17.8 kHz and Olnega (New York) a t 12 .5 t o
- 40 -

cdN rn + x (d k ' O w ((J
bn 0 E
0'33 @ : z 5 d .rl +' ((J 'H
2 $2 g m ~ >
a, Z d Q ' z $5 +I
E 0 .- 3 n
d IX '5 O W e, ad PI k C , - 5 m rn G C 03 z 2 g 8 2 2

12.6 kHz as well as broadband spec t rum i n f o r ~ n a t i o i l f o r wave f r e q u e n c i e s
between 300 Hz t o 12-5 kHz, Each panel of Figure 11 i ~ i c l u d e s about
1.5 minutes of d a t a and t h e measurements a r e presented a s func t ions of
time (0131 UT t o 0134 U T ) , L va lue and height of t h e s a t e l l i t e . In each
panel t h e r e a r e 5 independent r eco rds , namely from top t o bottom:
1. magnetic f i e l d of 17.8 kHz waves measured by t h e phase-tracking r e c e i v e r (PTR);
2 . magnetic f i e l d of 12.5 t o 12.6 kHz waves measured by the s tepping r e c e i v e r No. 3 (B3);
3 . same a s i n B3 but te lemetered t o ground v i a VCO;
4 . t ime marks a t one second i n t e r v a l s ;
5 . broadband spectrum from 300 Hz t o 12.5 kHz (BB) . The magnetic f i e l d amplitudes a r e given i n db r e l a t i v e t o 1 gamma
(dby) . Severa l a spec t s of t h e d a t a displayed i n F igure 11 w i l l be
analyzed i n Chapter 6 . Here we concen t r a t e on t h e amplitude f e a t u r e s
presented by t h e s tepping r e c e i v e r No. 3 r e l a t i v e t o s i g n a l s t r ansmi t t ed
by t h e Omega s t a t i o n of Fo res t P o r t , New York. The schedule of Omega
(New York) was composed of t ransmiss ion segments a t 10.2, 11.33, 12.5,
12.6 and 13.6 kHz. With the except ion of t h e 13.6 kHz segment, l y i n g
o u t s i d e t h e pass band, t h e t ransmiss ion segments a r e observed by t h e
broadband spectrum r e c e i v e r (bottom record of each pane l ) . The t r a n s -
mission segments de t ec t ed by t h e s tepping r ece ive r No. 3 correspond t o
12.5 kHz r ad ia t ed i n t h e i n t e r v a l 10, 3.41 s e c and 12.6 kHz i n t he
i n t e r v a l C7.4, 9.81 s e c i n s i d e each 10 second i n t e r v a l ( see F igure 1 1 ) .
F igure 12 shows t h e s a t e l l i t e t r a j e c t o r y and t h e loca t ions of t h e
Omega (New York) and NAA t r a n s m i t t e r s i n r e spec t t o geographic coo rd ina t e s .
Also shown i s a magnetic meridian p lane t h a t c ros ses t h e s a t e l l i t e t r a -
j ec to ry near t h e Omega t r a n s m i t t e r i n order t o i l l u s t r a t e schemat ica l ly
how a s i g n a l r a d i a t e d from the t r a n s m i t t e r reaches t h e s a t e l l i t e a t S.

F i g u r e 1 2 . OGO-4 t r a j e c t o r y f o r t h e r e c o r d s of F i g u r e 11.

The v,ave t r a v e l s t e l c w the lonosphere to the e n t r y poznt Q i n the lovier
edge of t h e D r eg lon , i s launched i n t h e w h i s t l e r medium above t h e E
r eg ion and f i n a l l y fo l lows a r ay pa th nea r ly along the magnetic merxdian
t o t h e s a t e l l i t e .
In o r d e r t o c a l c u l a t e t h e f i e l d s a t t h e s a t e l l i t e by using E q . (2.13)
we s t a r t w i th t h e r ay t r a j e c t o r i e s of 12.5 kHz waves i n a model magneto-
sphere . The model used here inc ludes l a t i t u d i n a l v a r i a t i o n of e l e c t r o n
dens i ty and is t h e same model employed i n Chapter 5 where i t i s used
f o r t h e purpose of s tudying g e n e r a l c h a r a c t e r i s t i c s of t h e r a y t r a j e c t o r i e s
i n t h e magnetosphere. The d e t a i l s of t h e assumed model a r e g iven i n
Sec t ion D of Chapter 4 . F igure 13 shows t h e r e c e i v i n g l a t i t u d e s of r a y s
f o r a s a t e l l i t e a t 640 km a l t i t u d e a s a func t ion of t h e i npu t l a t i t u d e s ,
where t h e r a y s s t a r t a t 120 km. Also shown is t h e l o n g i t u d i n a l r e f r a c t i v e
index a t 640 km f o r t h e assumed magnetospheric model. Once F igure 13 i s
determined by t h e ray- t rac ing computer program, w e in t roduce t h e magnetic
l a t i t u d e s of t h e s a t e l l i t e f o r t h e pass of F igure 11 by means of t i m e
marks. Using F igure 13 and t h e angles Ps from t h e r ay - t r ac ing computer
program, we determine t h e r a t i o ~ ~ / c o s @ ~ which i s independent of i
a s shown i n Eq . ( 2 .6 ) . This r a t i o v a r i e s from 1.02 t o 0.92 when t h e
0 magnetic l a t i t u d e of t h e s a t e l l i t e changes from 60 t o 50' f o r t h e model
magnetosphere.
Another important use of F igure 13 is t o determine t h e e n t r y p o i n t
Q ( s ee F igure 1 2 ) a t 120 km f o r each s a t e l l i t e p o s i t i o n . This is shown
i n Table 1 where t he geographic l a t i t u d e s and longi tudes of t he e n t r y
p o i n t s a r e g iven i n t h e second and t h i r d columns as func t ions of t i m e .
With t h e l o c a t i o n s of t he e n t r y po in t s we determine t h e d i s t a n c e d by
using a s tandard equat ion of s p h e r i c a l t r i a n g l e s . Distances s a r e then
- 44 -

INPUT LATITUDE, h = 120 km
F i g u r e 1 3 . Rece iv ing l a t i t u d e s of r a y s and t h e c o r r e s p o n d i n g l o n g i t u d i n a l r e f r a c t i v e i n d e x ps f o r waves of 12.5 kHz a s a f u n c t i o n of t h e i n p u t l a t i t u d e . The i o n o s p h e r i c model is g i v e n i n Chap te r 4 , S e c t i o n D .

TABLE 1.

c.alck.ilnter3 by E q , (2 ,741 ancl a n g l e s J and r ai-e talcen f r o n Figure 10.
V a l u e s Cor d , s , I , and q aye shown i n Table 1. The knowledge of
a l l p e r t i n e n t geometrical f a c t o r s a f f e c t i n g t h e propagat ion is completed
by determining t h e azimuthal angles x a t t he po in t s of en t ry i n the
lower ionosphere. x is added t o Table 1.
The next s t e p is t o f i n d t h e n igh t t ime t ransmiss ion c o e f f i c i e n t s i n
t h e lower ionosphere s u i t a b l e f o r t h e reg ion of New York. The ionospher ic
p r o f i l e b from Figure 5 i s used t o g e t h e r w i th a gyrofrequency of 1.6 MHz
0 and magnetic f i e l d d i p of 75 a s i npu t t o t h e full-wave computer program.
The r e s u l t i n g t r ansmis s ion c o e f f i c i e n t s a r e shown i n F igure 14a f o r nor th-
0 sou th propaga t ion (X = 0 ) and F igure 14b f o r east-west propagat ion
0 (X = -90 ). Among o t h e r f e a t u r e s , F igures 14a and 14b show t h a t v e r t i c a l l y
po l a r i zed waves have g r e a t e r t ransmiss ion c o e f f i c i e n t s r e l a t i v e t o
h o r i z o n t a l l y po l a r i zed waves when propaga t ing westward and southward.
For t h e va lues of x shown i n Table 1, t h e t ransmiss ion c o e f f i c i e n t s
f o r v e r t i c a l p o l a r i z a t i o n a r e found by i n t e r p o l a t i n g Tv between
F igures 14a and 14b, shown i n Table 1.
The powers r a d i a t e d by t h e Omega t r a n s m i t t e r of Fo re s t P o r t , New
York dur ing t h e per iod 0129 t o 0135 UT on 5 J u l y 1968 were 278 wa t t s a t
12.5 kHz and 295 wa t t s a t 12.6 kHz ( informat ion provided by M . L. T i b b a l s ) .
In t h e fo l lowing c a l c u l a t i o n a r a d i a t e d power of 285 wa t t s has been assumed.
Now a l l t he f a c t o r s a f f e c t i n g Eq. (2.13) a r e known and t h e va lue of t h e
magnetic f i e l d a t t h e s a t e l l i t e can be es t imated . This is shown i n
Table 1 and p l o t t e d i n F igure 15. F igure 15 shows t h e pred ic ted t ' f u l l -
wavett magnetic f i e l d ampli tudes i n d b r e l a t i v e t o one gamma (cont inuous
curve) as a func t ion of t ime . In a d d i t i o n F igure 15 shows the amplitude
measurements of Ornega s i g n a l s d i sp layed i n F igure I I and a l s o t he magnetic
- 47 -

Figure 14. (a) Transmission coefficients at 12.5 kHz along the 0
meridian, y = 0 ( b ) Transmission coefficients o at 12.5 kHz in the east-west azimuth, x = -90 .

i I e i t l va lues tllai worrhd be ppl ~ c i l c t c c i u s l n g d ray- ; tb iorpdio t i rrac;.ti~ocl
(dashed c u r v e ) , ?'he measurements a r e represen ted i n Figure 15 by broken
l i n e s where t h e corresponding alnplltude va lues a t each integer second
a r e t h e average va lues of t h e f i e l d measured by OGO 4 durlng one second.
The f i e l d va lues p red i c t ed by t h e ray-absorpt ion method a r e a l s o
shown i n Table 1. They were c a l c u l a t e d by i n t e g r a t i n g t h e imaginary p a r t
of t h e r e f r a c t i v e index through the same ionospher ic p r o f i l e b of
F igure 5 and hence f i n d i n g t h e t o t a l abso rp t ion . The r e s u l t i n g t r a n s -
mission c o e f f i c i e n t has a cons t an t va lue of 0.937. The f i e l d s were then
c a l c u l a t e d wi th Eq. (2 .13) ) r e p l a c i n g T by a cons tan t va lue of 0.937. v
F igu re 15 shows t h a t t h e wave f i e l d s pred ic ted wi th t h e full-wave
method ag ree very w e l l wi th t h e average measurements made on OGO 4 . The
reason f o r t h e success of t h e full-wave method is t h a t t h i s p rocess
t akes i n t o account a l l t he important f a c t o r s t h a t c o n t r o l t he l o s s e s i n
t h e lower ionosphere, namely p o l a r i z a t i o n of t h e wave, r e f l e c t i o n and
abso rp t ion . On t h e con t r a ry t h e ray-absorp t ion method only t akes i n t o
account t h e abso rp t ion of t h e wave. Therefore the shape of t h e r e l a t e d
curve d i sp layed i n F igure 15 i s almost exc lus ive ly con t ro l l ed by t h e
v a r i a t i o n of t h e d i s t a n c e s ( s ee Eq. ( 2 .13 ) ) . A s a consequence t h e
p red i c t ed f i e l d ampli tude v a r i e s a s -- l /s a t g r e a t d i s t a n c e s from t h e
t r a n s m i t t e r which is inadequate a s shown i n F igure 15.
Observe f i n a l l y t h a t t h e va lues suppl ied by t h e ray-absorpt ion
method a r e i n b e t t e r agreement wi th t he measurements south of t h e t r a n s -
m i t t e r ( a f t e r - 0133 UT). This happens because t h e t ransmiss ion co-
e f f i c i e n t f o r v e r t i c a l l y po la r ized waves is only about 3 dh below t h e
c o e f f i c i e n t f o r t h e p e n e t r a t i n g mode wave when propagat ion i s southward
a s shown i n F igure 14a. However, t h e t ransmiss ion c o e f f i c i e n t f o r
- 50 -

vertically polarized waves traveling northward i s smaller (Figure 14a),
Therefore the values predicted by the ray-absorption method in this
case lie well above the field measurements recorded by OGO 4 north of
the transmitter as shown in Figure 15 between 0131 and 0132:30 UT.

I J I. 060-4 OBSERVATIONS OF EOU4TORIAL ABSORKI'ION
AND DRFOCUS TNG OF' VLF ELECTROiLlAGNETlC WAVES - . -
In t h i s chap te r two new ionospher ic phenomena involving the propa-
g a t i o n and abso rp t ion of VLF waves near t h e magnetic equator a r e presented
and d i scus sed . Both phenomena a r e r e l a t e d t o a t t e n u a t i o n of VLF s i g n a l s
rece ived aboard a p o l a r o r b i t i n g s a t e l l i t e when t h e s p a c e c r a f t t r a v e l s
a t low l a t i t u d e s . One e f f e c t , c a l l e d " e q u a t o r i a l e ro s ion , " occurs on
t h e days ide and involves frequency-dependent a t t e n u a t i o n , w i th a l l VLF
s i g n a l s from ground sou rces even tua l ly d i sappear ing below the l e v e l of
d e t e c t a b i l i t y a s t h e s a t e l l i t e approaches t h e equa tor . An example of
e q u a t o r i a l e ro s ion observed from OGO 4 is shown i n F igure 16, which
d i s p l a y s frequency from 0 t o 10 kHz versus magnetic l a t i t u d e and t i m e on
a northbound pas s . A s t h e s a t e l l i t e moves toward t h e equator between
2049 and 2050 UT, broadband VLF w h i s t l e r s i g n a l s a r e ' e roded , ' c u t t i n g
o f f a t succes s ive ly lower f requenc ies w i th decreas ing l a t i t u d e . The
a c t i v i t y r ecove r s n o r t h of t h e equa tor , but i n somewhat i r r e g u l a r f a s h i o n .
The o t h e r new phenomenon, i n t e r p r e t e d h e r e as " e q u a t o r i a l defocus ing ,"
i s observed i n t h e n igh t t ime ionosphere and involves abrupt decreases i n
t h e i n t e n s i t y of manmade VLF s i g n a l s , t y p i c a l l y more than 15 clb i n less
than 50 km. Two examples of e q u a t o r i a l defocusing a r e shown by the OGO-4
r eco rds of F igu re 17 . The two pane ls show f o r two consecut ive n igh t t ime
e q u a t o r i a l passes t h e amplitude of t h e magnetic f i e l d of s i g n a l s t r a n s -
mi t ted by NAA (17.8 kHz) and received aboard t h e s a t e l l i t e by t he phase
t r ack ing r e c e i v e r . The records show R'AA s i g n a l l e v e l s of about -80 t o
0 -90 dbhi when t h e s a t e l l i t e is a t geographic l a t i t u d e s of about -25 and
as t h e s a t e l l i t e moves northivard a pronotxnced d r o p i n s i g n a l i n t e n s i t y
- 52 -

EQUATOR I
HEIGHT 670 km GEOGRAPHIC LONGITUDE-68" SOLAR ZENITHAL ANGLE-69"
Figure 16. Frequency-time s p e c t r a of broadband VLF d a t a from OGO 4 showing a t y p i c a l example of daytime " e q u a t o r i a l e ros ion ." The bottom panel shows a p o r t i o n of t h e upper record i n expanded time s c a l e where downgoing w h i s t l e r s e n t e r i n g the ionosphere i n the conjuga te hemisphere e x h i b i t a la t i tude-dependent upper c u t o f f . The h o r i z o n t a l l i n e s a r e caused by i n t e r f e r e n c e from t h e odd harmonics of t he s p a c e c r a f t d c conve r t e r s a t 2461 kHz (heavy l i n e s ) and even harmonics from t h e 400 Hz power s u p p l y l i n e (weak l i n e s ) which show up when t h e e x t e r n a l s i g n a l l e v e l i s v9p.y low.

OG0 4 29 JAN 1968 MAGNETIC ANTENNA PHASE TRACKING RECEIVER TUNED TO NAA AT 17.8 kHz
!- - -J GEOGRAPHIC o
-25 5 '_/A"P-rijDE Q
Figure 17. 060-4 records showing the NAA magnetic f i e l d ampli tude a s measured by t h e s a t e l l i t e phase- t racking r e c e i v e r i n two consecut ive e q u a t o r i a l c ro s s ings . The records present t h e n igh t t ime " e q u a t o r i a ~ defocusing" wi th t h e amplitude of t h e s i g n a l dropping below equipment th reshold a t about -100 dby. The r e l a t i v e p o s i t i o n of t he magnetic equa tor is ind i ca t ed by M.E. A t about 0357 UT t h e p a t t e r n of NAA s i g n a l changes t o Key-down mode, preceding t h e major change from CW (0300-0400 UT) t o FSK (0400-0500 UT) i n t h e mode of t ransmiss ion .

0 occurs a t t h e v i c i n i t y of -20 wi th t h e f i e l d s t r e n g t h dropping be lo^^
t h e no i se l e v e l of about -100 d b v . The s i g n a l remains below the n o i s e
0 level i n t h e succeeding 15 of northward s a t e l l i t e f l i g h t and elnerges
0 from t h e no i se a t a geographic l a t i t u d e of about -5 .
Very-low-frequency waves were f i r s t observed i n t h e magnetosphere
i n 1961 by t h e L o f t i - I s a t e l l i t e CLeiphart e t a l . , 19621. In t h i s
experiment VLF s i g n a l s were rece ived from U . S . Navy s t a t i o n s NBA i n the
Canal Zone and NPG i n J i m Creek, Washington. I n t e r p r e t i n g these measure-
ments, Rorden e t a l . C19641 r epo r t ed a h igher a t t e n u a t i o n i n t h e s i g n a l s
from NBA, and suggested t h a t t he d i f f e r e n c e could be a t t r i b u t e d t o a
g r e a t e r abso rp t ion a t low l a t i t u d e s . A more sys t ema t i c observa t ion of
t h i s kind was repor ted by Heyborne C19661 who s t u d i e d t h e cont inuous
r ecep t ion aboard t h e OGO-2 s a t e l l i t e of VLF s i g n a l s from NPG and NAA.
The r eco rds showed a c o n s i s t e n t drop of t he VLF wave f i e l d s a t each
s a t e l l i t e pass over t h e equa to r . I t was shown t h a t t h i s e f f e c t could
be a t t r i b u t e d t o h igher ionospher ic absorp t ion around t h e equa tor .
Be t t e r obse rva t ions of e q u a t o r i a l phenomena have been obta ined
from t h e s t a b i l i z e d s a t e l l i t e OGO 4 which provides r e p e a t a b i l i t y of
measurements and more conf idence i n d a t a a n a l y s i s . Data i n t e r p r e t a t i o n
has been aided by a new approach involv ing a full-wave s tudy of t h e
t ransmiss ion c o e f f i c i e n t i n t h e lower ionosphere and a r ay - t r ac ing
technique t o determine e f f e c t s such a s defocusing of t he power f low.
This approach has l ed t o a s a t i s f a c t o r y i n t e r p r e t a t i o n of t h e d a t a , i n
which t h e r o l e s of abso rp t ion and defocusing i n t h e day and n igh t regimes
have been s e p a r a t e l y i d e n t i f i e d . The p re sen t work w i l l show t h a t t h e e q u a t o r i a l e ro s ion i s caused
by t h e combined e f f e c t of h igh absorp t ion i n t h e D reg ion a t low l a t i t u d e s

p l u s the ray t r a ~ e c l o r l e s k o i lowed hj the s i g r ~ a l s a b o r c t h c F reg ion ,
A t n i g h t t h e absorp t lon e f f e c t i s l e s s impor tan t , with Eow-alti tude
e q u a t o r i a l propagat ion being dominated by a pronounced ionospheric
defocusing caused by a r ap id i n c r e a s e of t h e e lec t ron-dens i ty s c a l e -
he igh t above about 500 km. I t w i l l be shown t h a t t h e defocusing phenom-
enon r e p r e s e n t s a method of d e t e c t i n g l a r g e v a r i a t i o n s i n t h e v e r t i c a l
g r a d i e n t of e l e c t r o n d e n s i t y . Therefore , thi .s e f f e c t may be used f o r
4- + measuring t h e n igh t t ime LO - H 1 t r a n s i t i o n he igh t a t t he equa tor .
B. THE EQUATORIAL EROSION
The e q u a t o r i a l e ro s ion e f f e c t i s manifested i n every one of about
200 OGO-4 r eco rds of e q u a t o r i a l c r o s s i n g s obtained i n daytime dur ing
1967 and 1968. Frequency-time r eco rds such as t hose of F igure 16
t y p i c a l l y show t h a t a s t h e s a t e l l i t e approaches t h e equator t h e h i g h e s t
f r equenc i e s d i sappear f i r s t . Although Figure 16 i s t y p i c a l w i t h r e s p e c t
t o t h e sharpness of t h e cu to f f sou th of t h e equa tor , i t shows an unusual ly
smooth v a r i a t i o n a s compared wi th most r eco rds . Sometimes t h e e ros ion
i s n o t complete, and t h e lowest w h i s t l e r f requenc ies a r e observed
throughout t h e e q u a t o r i a l c r o s s i n g . The e ros ion e f f e c t is a l s o cons is -
t e n t l y observed a t t he ou tput of t h e s t epp ing r e c e i v e r s when t h e s e
r e c e i v e r s a r e working i n t h e sweeping mode. I t i s then usua l ly observed
a s a d i sappearance of a l l ground-source VLF s i g n a l s from 0.13 t o 100 kHz,
a s shown i n F igure 2 near 0139 UT.
1. Q u a l i t a t i v e &plana t ion of t h e Observations
The e q u a t o r i a l e ro s ion may be understood i n terms of an increase
i n t h e t ransmiss ion l o s s through t h e ionosphere wi th decreas ing magnetic
L a t i t u d e . In daytime a l l . VIlF waves propagate upward with nea r ly v e r t i c a l

w a v e normals, a consequence of applying S n e l l ' s Law t o t h e lower s t r a t i -
f i e d l aye r s of t h e ionosphere. Hence, i n t h e reg ion of high V L F absorp-
t i o n (70 t o 80 krn), the angle between t h e wave rlormals and t h e e a r t h ' s
magnetic f i e l d i nc reases a s t he s a t e l l i t e approaches the equa to r , The
medium becomes o p t i c a l l y t h i c k e r which means t h a t t h e wave numbers
i n s i d e t h e medium i n c r e a s e s , and t h e r e f o r e t h e wave exper iences g r e a t e r
c o l l i s i o n a l absorp t ion . Thus f o r a co l l i s ion- f requency cons t an t i n
l a t i t u d e , t h e abso rp t ion should become g r e a t e r a t lower l a t i t u d e s .
Above 100 krn and except under cond i t i ons of s t r o n g sporadic-E
i o n i z a t i o n , t h e ionosphere is a slowly varying medium f o r a l l VLF waves,
and geome t r i ca l o p t i c s may be appl ied i n o rde r t o determine t h e p a t h
followed by a wave packe t . The r ay t r a j e c t o r i e s a r e n o t symmetrical
around t h e equa tor which, a s w i l l be seen , accounts p a r t i a l l y f o r t h e
non-symmetrical p r o p e r t i e s of t h e e ros ion e f f e c t s d i sp layed i n F igure 16.
In f a c t daytime propagat ion around t h e magnetic equator is inf luenced
p r i m a r i l y by t h e high v e r t i c a l g r a d i e n t of e l e c t r o n d e n s i t y above t h e
F-region, and t o a l e s s e r (bu t neve r the l e s s important) e x t e n t by t h e
n e a r l y f l a t p r o f i l e of i o n i z a t i o n around t h e bulge of t h e F r eg ion and
t h e cu rva tu re of t h e e a r t h ' s magnetic f i e l d . The h igh v e r t i c a l g r ad i en t
extends t o h e i g h t s above 1000 km f o r daytime cond i t i ons , and i s a conse-
quence of a s ca l e -he igh t dominated by oxygen and helium ions . For t h e
range of l a t i t u d e s where e ros ion is observed, i t has been found t h a t t h e
r ay t r a j e c t o r i e s a r e curves t h a t c r o s s t h e equator below 1000 km. Hence
t h e e f f e c t s of e q u a t o r i a l e ro s ion a r e observable only by s a t e l l i t e s
ope ra t i ng below N 1000 km a t low l a t i t u d e s .
2 . D e t a i l s of t h e Analysis
The e q u a t o r i a l e ro s ion phenomenon can be pred ic ted by a s tudy

of D--region absorption, followed by a study of r a y trajectories to
determine the reg ion of space where the e f f e c t should be observed a t
t h e s a t e l l i t e ,
The ionospher ic model used included t h e e l e c t r o n c o l l i s i o n
frequency and d e n s i t y p r o f i l e s f o r t h e daytime D reg ion of P iggot t e t a l .
L19651, shown i n F igu re 18 . For he igh t s above 100 km an a n a l y t i c a l
e l ec t ron -dens i ty p r o f i l e was developed s a t i s f y i n g measurements made by
Alouet te I1 i n August 1967 ( d a t a provided by L. Co l in ) . This p r o f i l e
of i o n i z a t i o n is shown i n Figure 19 toge the r wi th Alouet te measurements.
The wave equat ions governing r e f l e c t i o n and t ransmission i n t h e
lower ionosphere were numerical ly i n t e g r a t e d by means of a l lfull-wavell
computer program [Scarabucci, 19691. The main i n t e r e s t he re was t o
determine t h e t ransmiss ion c o e f f i c i e n t i n t h e lower ionosphere a s a
f u n c t i o n of t h e magnetic l a t i t u d e . A t each magnetic l a t i t u d e the d i r e c t i o n
of t h e inc iden t wave was chosen s o a s t o g ive maximum transmission. The
p o l a r i z a t i o n a t each l a t i t u d e was s e l e c t e d t o be the p o l a r i z a t i o n of t h e
lTpenet ra t ing mode." Under t h e above cond i t i on t h e t o t a l l o s s ( r e f l e c t i o n
p lus absorp t ion) i n t he lower ionosphere i s given by
L = 2 0 log T db 10 P
where T is t h e t ransmiss ion c o e f f i c i e n t f o r t h e pene t r a t ing mode P
defined i n Sec t ion A of Chapter 2. Equation (3.1) r ep re sen t s t he minimum
l o s s , s i n c e L is ca l cu la t ed f o r t h e angle of incidence t h a t g ives
maximum T . The computer c a l c u l a t i o n was programmed t o s t o p a t 120 km, P
where t h e c o l l i s i o n frequency i s small and where t h e W.K.B. method can
r ep lace the ' tfull-waverf method. The remaining E-F reg ion absorpt ion is
smal l compared wi th t h e D-region absorp t ion , and has been neglec ted .
- 58 -

COLLISION FREQUENCY v (s~c" ' )
ELECTRON DENSITY N ( ~ r n - ~ )
Figure 18. Height d i s t r i b u t i o n s of e l e c t r o n d e n s i t y a t midday equinox ( N ) and e l e c t r o n c o l l i s i o n frequency (v ) [P iggot t e t a l . , 19651.

DAYTIME MODEL
F i g u r e 1 9 . Daytime e q u a t o r i a l model of t h e i o n o s p h e r e above 100 km. E l e c t r o n - d e n s i t y measurements f rom A l o u e t t e 2 a r e a l s o shown ( d a t a s u p p l i e d by L . C o l i n ) .

Flgure 20 g i v e s t h e ionospher ic l o s s L a s a f u n c t i o n of i n o u t magnetic
l a t i t u d e fo r a range of f r equenc i e s . The h igher f requeac ics e x h i b i t
r e l a t i v e l y g r e a t e r l o s s e s , and both t he amount of l o s s and 1 - c ~ frequency
dependence i n c r e a s e r a p i d l y toward lower l a t i t u d e s .
F igure 20 shows t h a t i f t h e r e c e i v e r t h r e sho ld i s cons t an t w i th
frequency t h e h i g h e s t f requenc ies should d i sappear f i r s t and t h e lowest
f r equenc i e s l a t e r f o r a s a t e l l i t e approaching t h e equa tor . Thus t h e
abso rp t ion a n a l y s i s q u a l i t a t i v e l y expla ins t h e e q u a t o r i a l e ro s ion e f f e c t .
For daytime ionospher ic models t h e t ransmiss ion l o s s is caused
almost e x c l u s i v e l y by abso rp t ion , t h e amount of l o s s introduced by
r e f l e c t i o n being comparat ively smal l . Hence, t h e behavior shown i n
F igure 20 could be p red i c t ed w i t h a s impler t echnique . A s an example,
curves of abso rp t ion g iven by H e l l i w e l l 11965, Chapter 31, which a r e
based on t h e i n t e g r a l of t h e imaginary p a r t of t h e r e f r a c t i v e index,
ag ree reasonably w e l l w i th F igure 20.
3 . Daytime Ray T r a j e c t o r i e s Around t h e Equator
The n e x t necessary s t e p is t o fo l l ow t h e r ay t r a j e c t o r i e s i n
o rde r t o determine f u r t h e r e f f e c t s and t h e s a t e l l i t e p o s i t i o n s where
t h e abso rp t ion in t roduced by t h e lower ionosphere w i l l be d e t e c t e d .
F igure 21 shows some 1 kHz r ay pa ths produced by a ray- t rac ing computer
program [Walter, 19691 us ing t h e ionospher ic model shown i n F igure 19 .
The i l l u s t r a t e d r a y s s t a r t a t t h e he igh t of 120 km and a t 8 , 10, 12, and
14 degrees of l a t i t u d e wi th v e r t i c a l wave normals, a s ind ica ted by smal l
arrows. The r ay t h a t s t a r t s a t 8O fo l lows a t r a j e c t o r y wel l - inc l ined
toward t h e equa tor because of t h e guiding e f f e c t of t h e magnetic f i e l d
which has low d i p angles a t t h e s e l a t i t u d e s . The r e s u l t i s t h a t a sub-
s t a n t i a l . l e n g t h of t h e ray t r a j e c t o r y occurs a t t h e he ight of t h e bulge
- 61 -

F i g u r e 2 0 - T o t a l i o n o s p h e r i c l o s s ( r e f l e c t i o n p l u s a b s o r p t i o n ) a s a f u n e t i o ~ l 01 nlagrletie l a t i t u d e f o r s e v e r a l f r e a u e n c i e s .

HE1 GHT km C IOOO
Figure 21. Ray t r a j e c t o r i e s f o r 1 kHz waves i n t h e e q u a t o r i a l ionosphere us ing t h e e lec t ron-dens i ty model of F igure 10. The assumed d i p o l e geomagnetic f i e l d has an e q u a t o r i a l gyrofrequency of 870 kHz a t t h e ground.

reg-iorr of t h e F-regron where tile ~ ~ e c l l c a l g r a d i e r l t of e l e c t r o n d e t l s ~ t y
i s s m a l l , Therefore , t h e r a t e of change of t h e wave-normal d i r e c t i o n
which i s p r imar i l y dependent on t h e v e r t i c a l i o n i z a t i o n g rad i en t i s a l s o
sma l l . Hence t h e r ay proceeds upward u n t i l h igher g r a d i e n t s of e l e c t r o n
d e n s i t y a r e met above 500 km which then bend t h e wave normal downward
and t h e ray r e t u r n s t o t h e lower ionosphere.
Rays t h a t s t a r t above of l a t i t u d e a r e a f f e c t e d by magnetic f i e l d
l i n e s w i t h h igher d i p angles and t h e r e f o r e t h e r a y s c ros s t he F-region
l e s s ob l ique ly ( s ee F igure 21) . Such r a y s w i l l be a f f e c t e d by t h e h igh
e l ec t ron -dens i ty g r a d i e n t above t h e F-region c l o s e r t o t h e input l a t i t u d e
f o r succes s ive ly h ighe r i npu t l a t i t u d e s . A s a consequence t h e apogees
of t h e t r a j e c t o r i e s move from nega t ive t o p o s i t i v e l a t i t u d e s when t h e
i npu t l a t i t u d e v a r i e s from 8 t o 14 degrees a s shown i n Figure 21. The
r e s u l t i n g downgoing r a y s p re sen t t h e p o s s i b i l i t y of wave i n t e r f e r e n c e
because of r a y c r o s s i n g s and a l s o some focus ing caused by r ay bunching.
The ray t r a j e c t o r i e s f o r wave f requenc ies between 1 and 18 kHz a r e almost
equa l t o t h e curves shown i n Figure 21, t h e maximum d i f f e r e n c e being
approximately ha l f degree i n l a t i t u d e f o r some r ays a t 10 kHz. Therefore
i t is only necessary t o show the propagat ion p r o p e r t i e s d i sp layed by one
wave frequency . Figure 22 shows t h e r e l a t i o n s h i p between t h e i npu t l a t i t u d e a t
120 km where 1 kHz r ays s t a r t and the l a t i t u d e s where a 600 km polar -
o r b i t i n g s a t e l l i t e would r e c e i v e t h e r ays (cont inuous curve) t oge the r
w i th t h e r e l a t e d t r a v e l t imes (dashed c u r v e ) . Figure 22 i s t o be used
i n t h e fo l lowing way: Given an upgoing r ay a t a s p e c i f i e d l a t i t u d e
( l e f t s i d e of f i g u r e ) i t w i l l c ro s s t h e he igh t of GOO lun a t two l a t i t u d e s ,
namely a s an upgoing wave ( s e c t i o n CD) o r a s a downgoing wave ( s e c t i o n ABC).
- 64 -

- lo0 oO 1 o0 SATELLITE LATITUDE, Rs = 600 km
Figu re 22. Input l a t i t u d e s a t 120 km and t h e r e l a t e d l a t i t u d e s where 1 kHz r ays w i l l be de tec ted by a 600 km polar - o r b i t i n g s a t e l l i t e . For a given s a t e l l i t e l a t i t u d e (bottom) t h e r e l a t e d t r a v e l time can be read a t t h e r i g h t hand s i d e of t h e f i g u r e (dashed cu rve ) .
For a g iven s a t e l l i t e l a t i t u d e t h e t r a v e l times a r e read on t h e r i g h t
s i d e of t h e f i g u r e . For example, a 1 kHz r ay t h a t s t a r t s a t lo0 of
l a t i t u d e w i l l be rece ived by t h e s a t e l l i t e a t 2' a s an upgoing wave
0 wi th a de lay t ime of 0.76 s e c , and w i l l a l s o be de t ec t ed a t -3.6 a s a
downoing wave wi th 1.10 s e c t i m e de l ay .
F igu re 22 shows the f a c t a l r eady descr ibed by F igure 21 t h a t t he
t r a j e c t o r i e s a r e n o t symmetrical around t h e equa to r : t h e r e is bunching
of r a y s a t nega t ive l a t i t u d e s and some divergence of r ays a t p o s i t i v e
s a t e l l i t e l a t i t u d e s . Numerical c a l c u l a t i o n s i n d i c a t e t h a t t h e above
d ivergence l o s s and focus ing g a i n r e p r e s e n t l e s s than 2 3 db, a number
t h a t i s n e g l i g i b l e i n comparison wi th t h e low ionosphere absorp t ion
- 65 -

shoivn i n F i g u r e 20. A strong f o c u s i n g of r a y s may occur at point R
where t h e d e r i v a t i v e of t h e curve is i n f i n i t e ; t h i s po in t w i l l be d i s -
cussed l a t e r =
Figure 22 a l s o shows t h a t wave i n t e r f e r e n c e should occur i n a
c e r t a i n range of nega t ive l a t i t u d e s where r ays t h a t come from d i f f e r e n t
s t a r t i n g l a t i t u d e s a r e observed a t one p o i n t . Although t h i s s ta tement
is c e r t a i n l y t r u e f o r a s i n u s o i d a l wave of long d u r a t i o n i t r e q u i r e s a
f u r t h e r d i s cus s ion f o r t h e c a s e of w h i s t l e r r e c e p t i o n where each wave
frequency e x i s t s only dur ing a s h o r t du ra t i on . For example, i f t h e
0 s a t e l l i t e l o c a t i o n i s -5 i t would r ece ive 3 d i s t i n c t r ays ( s ee F igure 22)
whose de lay t i m e s a r e 1.090, 1.155 and 1.170 seconds but t he l a s t 2 r a y s
would appear a s 2 d i s t i n c t t r a c e s only i f t h e d u r a t i o n of t h e 1 kHz
packet i s sma l l e r than 15 mi l l i s econds a t t h e r e c e i v i n g po in t . Other-
wise and more g e n e r a l l y i f two i n t e r f e r i n g r ays a r e rece ived a t t h e same
l o c a t i o n they w i l l produce wave i n t e r f e r e n c e only dur ing t h e per iod when
both packe ts c o e x i s t . The amplitude of t h e i n t e r f e r i n g waves may be
very d i f f e r e n t because they were a f f e c t e d d i f f e r e n t l y by the lower iono-
sphere abso rp t ion ( a s g iven i n F igure 20) a l though t h e above e f f e c t may
be compensated by t h e p o s i t i o n of t he l i g h t n i n g sou rce r e l a t i v e t o t h e
e n t r y p o i n t s below t h e ionosphere, Therefore t h e complete p i c t u r e of
w h i s t l e r i n t e r f e r e n c e nea r t h e equator is somewhat involved. I t depends
on s e v e r a l f a c t o r s , namely ionospher ic p r o f i l e ( c o n t r o l l i n g t h e de lay
t imes and t r a j e c t o r i e s ) , f requency, and r e l a t i v e p o s i t i o n s of l i g h t n i n g
source and s a t e l l i t e . Typica l OGO-4 records of downgoing w h i s t l e r s a t
low l a t i t u d e s d i s p l a y f ad ing i n t h e w h i s t l e r t r a c e s as w e l l a s t h e
occurrence of almost co inc iden t t r a c e s which sometimes merge t oge the r .
The above f e a t u r e s togexher wi th t h e e ros ion e i f e c t a r e presen t i n t he
- 66 -

0 0 - 4 spectrogram of Figure 16 at negative l ~ t i t u d e s ibllerc c l ~ ~ : ~ n ~ o ~ n g
vhistlers are belng received (see bottom panel).
Uslng Figure 22 t h e ionospheric loss of Figure 20 is related to
t h e s a t e l l i t e l a t i t u d e by fo l lowing t h e ray t r a j e c t o r i e s up t o 600 km.
This is shown i n F igu re 23 f o r wave f r equenc i e s 1, 4 , and 7 kHz. Figure
23 shows t h a t t h e e ros ion e f f e c t should be unsymmetrical around t h e
equa tor i f t h e l i g h t n i n g sources a r e loca ted a t one s i d e of t h e magnetic
equa tor . For example, t he curve f o r 1 kHz shows t h a t f o r a northbound
e q u a t o r i a l pa s s of a 600 km s a t e l l i t e t h e s i g n a l decreases 10 d b between
0 0 -5.4 and -3 . However, t h i s l o s s is recovered n o r t h of t h e equa tor
0 between 5 and 1 1 . 6 ~ . F igure 23 a l s o shows t h a t t he r a t e of l o s s wi th
l a t i t u d e i s g r e a t e r a t h igher f r equenc i e s .
The p r e d i c t e d focus ing of t h e r ays a t t h e l a t i t u d e B of F igure 22
is probably e f f e c t i v e on ly a t the low f r equenc i e s where ionospher ic
l o s s e s have n o t been exces s ive ly h igh . The focus ing i s i n e f f e c t i v e a t
h igher f r equenc i e s because t he se waves a r e absorbed by the lower iono-
s p h e r i c medium . The asymmetry of t he e ros ion e f f e c t s around the equator i s caused
i n p a r t by t h e non-symmetrical ray t r a j e c t o r i e s around t h e equator and
p a r t i a l l y because of t h e response of t h e r e c e i v e r under d i f f e r e n t
regimes. This i s t h e d i f f e r e n c e i n t h e response of t h e s a t e l l i t e
r e c e i v e r t o "shor t" upgoing w h i s t l e r s and r rd i spersed" downgoing s i g n a l s
and t h e f a c t t h a t upgoing w h i s t l e r s were concentrated n o r t h of t he
magnetic equa tor and downgoing w h i s t l e r s on t h e southern s i d e . In t h e
case of s h o r t upgoing 'whis t le rs rece ived n o r t h of t h e equator t h e peak
s i g n a l is l a r g e ; t h e ins tan taneous AGC of t he log-compressor r e c e i v e r
a c t s t o lower t h e g a i n s o a s t o r e v e a l some amplitude d e t a i l s (hence t h e
- 67 -

SAELLITE LATITUDE, h, = 660 km
IONOSPHERIC LOSS, dB
Figure 2 3 . Ionospheric l o s s observed by a 600 km po la r -o rb i t i ng s a t e l l i t e a s a f u n c t i o n of l a t i t u d e . The curves a r e paramet r ic i n frequency .
i r r e g u l a r s t r u c t u r e of F igure l b ) that f a l l below a c e r t ~ l n c l i p l e v e l *
a
In t he case of d i spe r sed downga~ng w l l i s t J e r s observed s o u t l l of t h e
equa to r Lhe signal is on the average r e l a Lively weak arrd of Long. d u r a t r o n ,
t h e AGC a c t i o n main ta ins h igh g a i n l e v e l s w i t h much of t h e s i g n a l near
t h e c l i p l e v e l and t h e r e s u l t is an abrupt change i n darkaess of t h e
d i s p l a y a t t h e cu to f f o r beginning of high a t t e n u a t i o n .
C . EQUATORIAL DEFOCUS ING
A t n igh t t ime t h e t r a n s i t i o n he igh t a t which t h e e q u a t o r i a l ionosphere
changes from a sca le -he ight dominated by oxygen t o a sca le -he ight dominated
by hydrogen is usua l ly below 1000 km ( s ee f o r example, Prased C19681).
Theref o r e t h e v e r t i c a l g r a d i e n t of e l e c t r o n d e n s i t y may change r a p i d l y
between t h e peak of t h e F r eg ion and 1000 km. In what fo l lows we use
t h e r e s u l t s of a r ay - t r ac ing computer program [Walter, 19691 t o analyze
t h e e f f e c t s of t h i s change i n i o n i z a t i o n g r a d i e n t upon t h e propagat ion
c h a r a c t e r i s t i c s of VLF waves.
F igure 24 shows some r a y t r a c i n g s f o r t y p i c a l day and n ight t ime
e l ec t ron -dens i ty p r o f i l e s . Both daytime and n igh t t ime p r o f i l e s s imu la t e
A loue t t e 1 t o p s i d e measurements taken over t h e equa tor i n November 1962.
The r ay p a t h shown f o r t h e daytime p r o f i l e (dashed curve) i s more o r
0 0 less t y p i c a l f o r waves s t a r t i n g between 5 and 15 , i . e . , t h e ray
t r a j e c t o r i e s a r e approximately symmetric around t h e equa tor . In t h i s
c a s e t h e cu rva tu re of t h e e a r t h ' s magnetic f i e l d p lus t h e h igh v e r t i c a l
g r a d i e n t of e l e c t r o n d e n s i t y above t h e F r eg ion provide a s i g n i f i c a n t
r a t e of change of t h e wave normal d i r e c t i o n a l l t h e way along the p a t h .
A s a consequence t h e wave normals bend i n i t i a l l y toward t h e equa to r ,
c r o s s t h e equa tor o r i e n t e d almost h o r i z o n t a l l y and f i n a l l y bend r a p i d l y
inward from t h e f i e l d l i n e d i r e c t i o n . These waves a r r i v e i n t h e D reg ion
- 69 -

E X ..
I- x 2 CLd 1
MAGNETIC LATITUDE
Figure 24. Typica l daytime and n ight t ime r ay t r a j e c t o r i e s followed by waves of 17.8 kHz n e a r t h e magnetic equa to r . The d i r e c t i o n s of t h e wave normal a r e represen ted by sma l l arrows, showing t h a t t h e e q u a t o r i a l defocusing occurs when t h e medium l o s e s t h e a b i l i t y of e f f e c t i v e l y bending down t h e wave normal. This e f f e c t i s caused by a weak v e r t i c a l g r a d i e n t above t h e t r a n s i t i o n he igh t i n t h e n igh t t ime e lec t ron-dens i ty d i s t r i b u t i o n .

of the conjugate l z e m i s p h ~ r c w ~ l b ~lmosi eri s r l t w a v c r - t e : r m : ~ i c ,
I'lle t w o r a y pa th s shown for. the n ~ g h t i ~ r n e profile (solid cu rves )
p r e sen t two types of behavior , 'File ray pat11 that starts a t + g o 1s
t y p i c a l of waves whose i n c i d e n t l a t i t u d e is r e l a t i v e l y c l o s e t o the
equa to r . This pa th i s s i m i l a r t o t h e one presented by t h e daytime curve,
i n t h a t t h e wave normals bend r a p i d l y earthward i n t h e reg ion of high
v e r t i c a l g r a d i e n t of i o n i z a t i o n below 600 km, where t h e n igh t t ime
p r o f i l e i s dominated by t h e 0' sca l e -he igh t . The n ight t ime r ay whose
s t a r t i n g l a t i t u d e is +lo0 p r e s e n t s a behavior t h a t i s t y p i c a l f o r
r a y s s t a r t i n g above -- lo0 , i . e . , i t c ros se s t h e equator above t h e
t r a n s i t i o n h e i g h t . A s a consequence, t h e r a t e of change of t h e r ay
d i r e c t i o n , which is approximately p ropor t i ona l t o t h e v e r t i c a l g r a d i e n t
of i o n i z a t i o n , i s much sma l l e r f o r t h i s group of r a y s . F igure 24 shows
t h a t i n t h i s c a s e t h e wave-normal remains po in t ing upward over a wide
r ange of l a t i t u d e s , bends s lowly toward t h e h o r i z o n t a l , and f i n a l l y
bends r a p i d l y earthward when t h e r ay e n t e r s t h e r eg ion of low s c a l e -
h e i g h t below t h e t r a n s i t i o n he igh t . The d i f f e r e n c e s i n t h e behavior of
t h e r a y t r a j e c t o r i e s presented f o r t h e n igh t t ime p r o f i l e , depending on
whether t h e r a y c r o s s e s t h e equa tor above o r below t h e t r a n s i t i o n he igh t ,
produce t h e defocusing of t h e r a y s labe led a and b.
The defocus ing phenomenon can be q u a n t i t a t i v e l y analyzed i f a
r e l a t i o n s h i p i s found between t h e l a t i t u d e s where t h e r ays s t a r t and t h e
l a t i t u d e s where they should be i n t e r cep t ed by a s a t e l l i t e c ros s ing t h e
e q u a t o r i a l r eg ion a t cons t an t h e i g h t . The r e s u l t of such a c a l c u l a t i o n
i s shown i n F igu re 25 f o r t h e n igh t t ime ionospher ic model of F igure 24
and f o r two s a t e l l i t e he igh t s , h = 450 and 700 k m . F igure 25 shows S
t h a t rays s t a r t i n g a t a g iven inpu t l a t i t u d e ( t h e independent v a r i a b l e )
- 71 -

T" INPUT LATITUDE
SATELLITE LATITUDE
Figure 25. Correspondence between t h e l a t i t u d e s where t h e r ays l e a k from t h e e a r t h ' s waveguide and t h e l a t i t u d e where they w i l l be de t ec t ed by a s a t e l l i t e whose he igh t i s h .
S Arrows i n d i c a t e t h e reg ions where upgoing ( U P ) and downgoing (DOWN) r ays a r e r ece ived . The he igh t a t t h e i npu t l a t i t u d e i s 120 km where t h e wave normals a r e assumed v e r t i c a l , The ionospher ic model is t h e n igh t t ime p r o f i l e shown i n F igure 24. The assumed dipole geomagnetic f i e l d has an e q u a t o r i a l gyrofrequency of 870 kHz a t t h e ground.

may o b v i o u s l y be d e t e c t e d by a s a t e l l i t e i n tjlo t l l f i r r e n t v jnys: as
u p g o l n g o r as downcoming Naves. Arrows i n d x c a i e t h e s a t e l l l i e latitudes
f o r . rvh~eh t h e r a y s w l l l be d e t e c t e d a s upgolng (IJP) o r downcomlng (UO\VN)
h a v e s . F o r example , t h e c u r v e f o r h = 450 km shows t h a t rays whose S
0 i n p u t l a t i t u d e is 8 . 5 w i l l i n t e r c e p t t h e s a t e l l i t e a t 2' l a t i t u d e a s
0 upgo ing waves and a t -6.5 l a t i t u d e a s downgoing waves . L i t t l e d e f o c u s i n g
l o s s is p r e d i c t e d f o r t h e s e r a y s . Defocus ing l o s s is a p p a r e n t where t h e
c u r v e s a r e f l a t , meaning t h a t t h e r e i s a v e r y wide r a n g e of l a t i t u d e
where t h e s a t e l l i t e w i l l be r e c e i v i n g e n e r g y t h a t comes f rom a v e r y
na r row r a n g e o f i n p u t l a t i t u d e s . Obse rve , f o r example t h a t r a y s s t a r t i n g
0 0 be tween 9 and 9.6O a r e d e t e c t e d upwardly be tween 3 and 4O by a s a t e l l i t e
a t 450 km and t h a t t h e c o r r e s p o n d i n g power f l u x w i l l be weaker i n t h e
s o u t h e r n hemisphe re b e c a u s e t h e downcoming r a y s w i l l be d e t e c t e d f rom
0 0 -9 t o -22 l a t i t u d e .
The f o c u s i n g g a i n is d e f i n e d by Eq . ( 2 . 6 ) and F i g u r e 9 . The f a c t o r
( A @ ~ / A @ ~ ) is r e a d i l y d e t e r m i n e d f rom F i g u r e 2 5 , and f3 i s a s i d e
p r o d u c t of t h e r a y - t r a c i n g computer program. Hence, t h e f o c u s i n g g a i n
c a n be c a l c u l a t e d a s a f u n c t i o n o f t h e l a t i t u d e of t h e s a t e l l i t e . T h i s
is shown i n F i g u r e 26 f o r r a y i n p u t s i n t h e n o r t h e r n hemisphe re and f o r
two d i f f e r e n t s a t e l l i t e h e i g h t s , h = 450 and 700 km ( s o l i d c u r v e s ) . S
The c a l c u l a t i o n s p r e d i c t t h a t t h e d r o p i n t h e s i g n a l w i l l o c c u r when t h e
s a t e l l i t e i s i n t h e hemisphe re c o n j u g a t e t o t h a t o f t h e t r a n s m i t t e r , and
t h a t t h e s i g n a l w i l l d e c r e a s e a b r u p t l y i n s p a c e , i n good agreement w i t h
t h e measurements a s shown by t h e dashed c u r v e s . The c a l c u l a t i o n s a l s o
i n d i c a t e t h a t t h e s i g n a l s h o u l d r e c o v e r a t a s l o w e r r a t e wh ich , a g a i n ,
is u s u a l l y o b s e r v e d .
I n o r d e r t o compare t h e c a l c u l a t e d f o c u s i n g g a i n w i t h t h e o b s e r v a t i o n s
- 7 3 -

( d m T I 5 C, o 2% $4 0
a, " Y-l C,a ,oC, a, . r l s m m ~
rl a, m > S C, -"m.dC,
: z s : w G I 4 0
a , O G a , G o b a k e , 4 J b . d M
a, m o r % Nd' E .d hl
5 4 J a d l
g 2 m z d G 0 5 a cdo

it is necessary to l l o rma l i ze -the rirnplitucies of "Lie rikeasuremcrris iilade
j u s t b e f o r e t h e e q u a t o r l a 1 def o c u s i n g . Th is has been done i n F i g u r e 26,
by f i x i n g t h e i n i t i a l s i g n a l l e v e l a t +2 d b a n d p l a c i n g t h e l e a d i n g
edge of t h e measured defocus ing r e g i o n a t -24O. The two c o n s e c u t i v e
0 measurements, s e p a r a t e d by 25 i n l o n g i t u d e , p r e s e n t q u a l i t a t i v e s i m i l a r -
i t y but s u b s t a n t i a l d i f f e r e n c e s i n l e v e l . For example, F i g u r e 17 shows
t h a t t o t h e s o u t h of t h e de focus ing r e g i o n t h e upper record ( l o n g i t u d e
0 -54 ) p r e s e n t s s m a l l e r f i e l d l e v e l s compared w i t h t h e bottom r e c o r d
0 ( l o n g i t u d e -78 ) . Because of t h i s f a c t t h e n o i s e l e v e l d i sp layed by t h e
r e c o r d s of F i g u r e 1 7 i n s i d e t h e de focus ing r e g i o n s is r e p r e s e n t e d i n
F i g u r e 26 by f l a t l i n e s 9 d b a p a r t , t h e h i g h e r l i n e corresponding t o
t h e e q u a t o r i a l p a s s a t t h e l o n g i t u d e -54O. F i g u r e 26 shavs t h a t t h e
c u r v e p r e d i c t e d f o r a s a t e l l i t e h e i g h t of 450 km i s t h e one t h a t r e a s o n a b l y
0 matches t h e observed d e f o c u s i n g f o r t h e pass of LONG = -78 , a l t h o u g h
OGO-4 h e i g h t was 730 km. I t w i l l be shown t h a t t h i s f a c t s u g g e s t s a
0 h i g h e r t r a n s i t i o n h e i g h t f o r t h e ionosphere a t -78 l o n g i t u d e . T h i s
p o i n t w i l l be d i s c u s s e d i n t h e n e x t s e c t i o n .
Night t ime i o n o s p h e r i c l o s s . Next, i t is proposed t o de te rmine t h e
r o l e played by t h e lower ionosphere d u r i n g t h e n i g h t . In o r d e r t o
e s t i m a t e t h e l e a k a g e of t h e ea r th - ionosphere wave g u i d e a t d i f f e r e n t
magnet ic l a t i t u d e s t h e f o l l o w i n g procedure is t a k e n . The l eakage of t h e
dominant wave g u i d e mode n = 1 is produced by waves whose a n g l e of
0 i n c i d e n c e i n t h e lower ionosphere i s -- 80 [Wait, 19621. The f u l l
wave computer program is t h e n used i n o r d e r t o de te rmine t h e t r a n s m i s s i o n
0 l o s s a s a f u n c t i o n of t h e l a t i t u d e f o r a c o n s t a n t 80 a n g l e of i n c i d e n c e .
The n i g h t t i m e e l e c t r o n d e n s i t y (model b) and c o l l i s i o n - f r e q u e n c y p r o f i l e s
were taken from Deeks C1966al ( s e e F i g u r e 5 ) , The r e s u l t i s shown i n
- 7 5 -

E'ngurc 27 ithere tkrc t r a n s ~ n ~ s s r c r n lass is p l o t t e d tor d x f f f e r e f l t n p u t
l a t i t u d e s and f o r waves t rave lxng southward from NAA, I t shows t h a t
0 t h e tramlsrnission coef f i c i e n t is maximum a t -- 14 l a t i t ~ r d e , experiences
0 0 a t sha rp decay a t l a t i t u d e s below 10 and f a l l s t o zero a t -6 l a t i t u d e ,
In t h e southern hemisphere t h e t ransmiss ion c o e f f i c i e n t recovers s lowly ,
0 reachjng s i g n i f i c a n t va lues aga in only f o r l a t i t u d e s below -45 . These
abnormally low va lues f o r t h e t ransmiss ion c o e f f i c i e n t come from the
f a c t t h a t a t ionospher ic he igh t s where t h e wave normals a r e changing
0 d i r e c t i o n from -80 t o almost v e r t i c a l , t h e wave normal c ros se s a r eg ion
0 of h igh c o l l i s i o n frequency whi le making an angle of nea r ly 90 wi th
t h e e a r t h ' s magnetic f i e l d . F igure 27 is i n good q u a l i t a t i v e agreement
wi th a s i m i l a r s tudy made by Pi t teway and Jespersen 119661 f o r a d i f f e r e n t
low ionosphere. F igure 27 l eads t o t h r e e conc lus ions :
0 1. The sha rp decay of t h e t ransmiss ion c o e f f i c i e n t below 10 does
n o t i n t e r f e r e wi th t h e e q u a t o r i a l defocus ing , because t h e
s a t e l l i t e he igh t is such t h a t i t w i l l only r e c e i v e r a y s which 0
s t a r t above - 9 l a t i t u d e ( s e e F igure 25) .
0 2. Between o0 and -20 l a t i t u d e t he t ransmiss ion c o e f f i c i e n t is s o
sma l l t h a t s i g n a l s coming from below cannot be de t ec t ed i n t h e
defocus ing reg ion of F igure 26.
3 . The r eg ion of high t ransmiss ion c o e f f i c i e n t f o r w h i s t l e r s
exc i t ed from one s i d e of t h e equa tor co inc ides wi th t h e low
t r ansmis s ion c o e f f i c i e n t reg ion f o r w h i s t l e r s exc i t ed i n t h e
oppos i t e hemisphere and v ice-versa .
Conclusions (1 ) and (2) s u b s t a n t i a t e t h e r e s u l t s p rev ious ly provided
by t h e r ay - t r ac ing technique, i . e . , a r eg ion of defocusing f o r waves
s t a r t i n g below t h e ionosphere and coming from one s i d e of t h e equa to r
should be observed, Goncbusion (3) no t e s t h a t t h e e q u a t o r i a l e ro s ion
cannot be observed dur ing the n i g h t because t h e defocusing region f o r
- 76 -

f = 17.8 kHz
- 20° o0 20° LATITUDE
Figure 27. Lower-ionosphere t ransmiss ion c o e f f i c i e n t f o r p e n e t r a t i n g mode waves t r a v e l i n g southward. The propagat ion is assumed t o be i n t h e magnetic meridian and t h e angle of inc idence i s -80' a s i nd i ca t ed i n t h e ske t ch by t h e curve .
w h i s t l e r s genera ted i n one hemisphere is f i l l e d wi th upgoing w h i s t l e r s
from the o t h e r hemisphere and vice-versa . Only a s h o r t d i s p e r s i o n
c h a r a c t e r i s t i c f o r w h i s t l e r s i n s i d e t h e defocusing r eg ion corresponding
t o upgoing w h i s t l e r s should be observed; t h i s phenomenon has been
observed .
D . FACTORS AFFECTING THE EQUATORIAL DEFOCUS I N G
A s we pointed out p rev ious ly t he e q u a t o r i a l defocusing is d i r e c t l y
r e l a t e d t o t h e change of t h e e l ec t ron -dens i ty sca le -he ight a t t h e
t r n n c , x t l o n h c l g h t , B e t w e e n i h e peak of "clre I? r e g ~ o n anci the 10' - H']
t r a n s i t i o n he igh t t h e v e r t i c a l dens i ty g rad i en t i s u sua l ly high because
t h e e l e c t r o n sca l e -he igh t 1s allnost excliusiveiy given by t h e sca le -he ight
of 0'. A s a consequence t h e ray t r a j e c t o r i e s below the t r a n s i t i o n
he igh t remain reasonably unchanged f o r d i f f e r e n t i o n i z a t i o n s . For
example, t h e n igh t t ime qnd t h e daytime ray t r a j e c t o r i e s shown i n F igure
24 a r e e x a c t l y t h e same below t h e n igh t t ime t r a n s i t i o n he ight a l though
t h e two ionospher ic p r o f i l e s p r e sen t s u b s t a n t i a l l y d i f f e r e n t e l e c t r o n -
d e n s i t y l e v e l s .
Above t h e t r a n s i t i o n he ight t h e defocusing is c o n t r o l l e d by t h e H+
s ca l e -he igh t . A sma l l e r H+ s ca l e -he igh t produces a smal le r def ocus ing
l o s s . Another very important f a c t o r is the smoothness of t he t r a n s i t i o n
+ + from t h e 0 dominated reg ion t o t h e H dominated r eg ion . I f enough
+ helium i s p re sen t t h e t r a n s i t i o n r eg ion i s smoothed out because t h e He
+ sca l e -he igh t is only 4 t imes g r e a t e r t han t h e 0 sca l e -he igh t . A smooth
t r a n s i t i o n p r o f i l e around the t r a n s i t i o n he igh t produces a sma l l e r
defocusing l o s s . Hence, a s t r o n g e q u a t o r i a l defocusing is an i n d i c a t i o n
t h a t t h e ~ e + concen t r a t i on around t h e t r a n s i t i o n he igh t i s n e c e s s a r i l y
very smal l .
In order t o g i v e a numerical t reatment t o t h e above d i scus s ion we
s h a l l cons ider t h e t h r e e d i f f e r e n t ionospher ic models A , B, and C
shown i n F igure 28. The ionospheric models have been ca l cu l a t ed assuming
a d i f f u s i v e equ i l i b r ium d i s t r i b u t i o n [Angerami and Thomas, 19641. P r o f i l e
A i s t h e n igh t t ime model p rev ious ly shown i n F igure 24. This model has
an H' s ca l e -he igh t of 1600 krn ( i - e . , a n e u t r a l H sca le -he ight of
800 l a ) , P r o f i l e G has an B' sca le -he ight of El20 k m , namely 70% of
t h e H' sca l e -he igh t presented by p r o f i l e A . P r o f i l e B i s obtained
- 78 -

F i g u r e 28. Three i o n o s p h e r i c models A , B, and C . Model A i s t h e n i g h t t i m e model of F i g u r e 24. Model B is ob ta ined from A by i n c r e a s i n g t h e t r a n s i t i o n h e i g h t . Model C h a s a hydrogen s c a l e - h e i g h t 78% of t h e hydrogen s c a l e - h e i g h t of Model A .
from A , c ' ssentral iy mncreaslng the L r a n s r t l o n krelgirrt by ahor l t 350 Ltm,
F igure 29 i s the r e s u l t of s e v e r a l r ay - t r ac ing computations showing the
s a t e l l i t e l a t i t u d e where t h e r ays w i l l be de tec ted as a func t ion of t h e
l a t i t u d e s where they s t a r t . Curves f o r t h e ionospher ic models B and
C a r e shown where t h e s a t e l l i t e he igh t has been assumed equa l t o 700 km.
These r e s u l t s can be compared wi th t h e r e s u l t s f o r p r o f i l e A shown i n
F igure 25. F igure 29 i n d i c a t e s t h a t t h e ionospher ic model C g ives no
s u b s t a n t i a l def ocusing (observe t h e d e r i v a t i v e d S d i . Calcu la t i ons
show t h a t t h e maximum defocusing f o r t h i s model i s around 5 d b f o r a
s a t e l l i t e he igh t of 700 km. In c o n t r a s t , p r o f i l e B produces a s t r o n g
defocus ing a s w e should expec t because the corresponding e l e c t r o n dens i ty
d i s t r i b u t i o n i s e s s e n t i a l l y t h e same a s p r o f i l e A but v e r t i c a l l y
s h i f t e d . Observe t h a t t h e B curve i n Figure 29 resembles t h e curve
corresponding t o h = 450 km i n F igure 25. Figure 30 g ives t h e focusing S
g a i n f o r t h i s ionospher ic model B as a f u n c t i o n of t h e s a t e l l i t e l a t i -
tude f o r h = 700 krn. Not ice t h a t t h e ca l cu l a t ed defocusing r eg ion has S
a l eng th very s i m i l a r t o t h e one presented by the curve f o r h = 450 km S
i n F igure 26. This i n d i c a t e s t h a t we can e f f e c t i v e l y modify t h e iono-
s p h e r i c model i n o rde r t o o b t a i n a prescr ibed r e s u l t . Another f e a t u r e
introduced by p r o f i l e B r e l a t i v e t o p r o f i l e A is a northward s h i f t i n g
0 of - 5 i n t he p o s i t i o n of t h e defocusing r eg ion and a f r a c t i o n of db
i n l o s s (compare w i th F igure 26 ) . In Figure 30 we a l s o show t h e s a t e l l i t e
0 measurements f o r t h e e q u a t o r i a l pa s s corresponding t o LONG = -78 . A
very good agreement i s now obta ined .
The t r a n s i t i o n he igh t f o r model B i s 750 km, a va lue t h a t s u i t s
t h e e x t r a p o l a t i o n of the m i d n i g h t r a n s i t i o n he igh t curves given by
Prasad (19681 which were based oil t h e a n a l y s i s of Irequency spectrum of
- 80 -

DOWN-UP I
SATELLITE LATITUDE
Figure 29. Correspondence between t h e l a t i t u d e s where t h e r ays l eak from t h e e a r t h ' s waveguide and t h e l a t i t u d e where they w i l l be de t ec t ed by a s a t e l l i t e a t 700 km f o r t h e two ionospher ic models B and C. Compare wi th t h e curves der ived f o r Model A i n Figure 25.
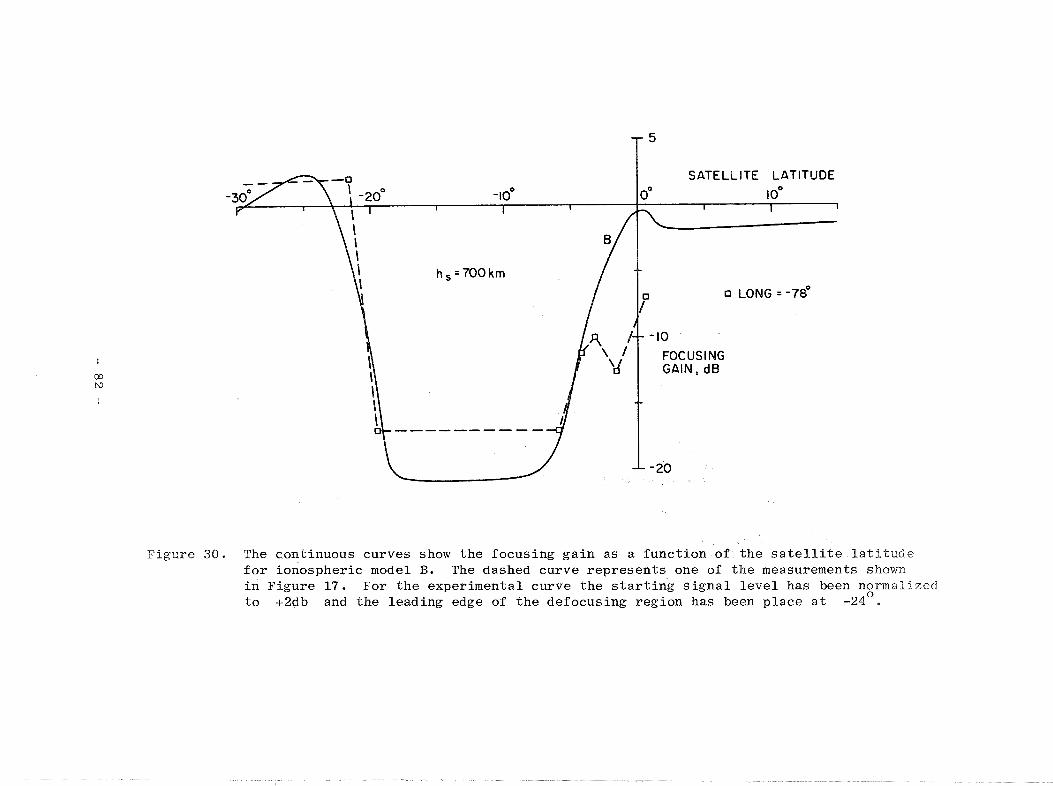
Figu re 30. The cont inuous curves show t h e focus ing g a i n a s a func t ion of t h e s a t e l l i t e l a t i t u d e f o r ionospher ic model B. The dashed curve r e p r e s e n t s one of t h e measurements shown i n F igure 17. For t h e experimental curve t h e s t a r t i n g s i g n a l l e v e l has been normalized
0 t o +2db and t h e lead ing edge of t h e defocusing reg ion has been p l ace a t -24 .

r a d a r backsca t t e r s i g n a l s from t h e ionosphere,
A discrepancy s t i l l remains, namely t h a t t h e p l ace of t h e ca l cu l a t ed
o defocusing r eg ion i s s h i f t e d about 10 southward r e l a t i v e t o the measured
defocus ing reg ion of F igure 17 . This p o i n t w i l l be d i scussed i n t h e
next s e c t i o n .
E. SEASONAL VARIATION OF THE EQUATORIAL DEFOCUSING
Measurements of t h e e q u a t o r i a l defocusing between November 1967 and
J u l y 1968 sugges t a s ea sona l v a r i a t i o n i n t h e magnetic l a t i t u d e s where
t h e e q u a t o r i a l defocusing t akes p l ace . This i s shown i n F igure 31 where
t h e defocusing r eg ion i s ind i ca t ed by t h e p o s i t i o n of v e r t i c a l bars along
some s a t e l l i t e pa s se s . They show t h a t t h e defocusing r eg ion f o r t r a n s -
m i t t e r s loca ted i n t h e no r the rn hemisphere occurs j u s t below t h e magnetic
equa tor (as p red i c t ed ) f o r months i n which t h e s u n ' s d e c l i n a t i o n i s
nega t ive . For months of p o s i t i v e d e c l i n a t i o n of t h e sun (no r the rn
hemisphere summer) t h e defocusing reg ion seems t o move northward. A
d e t a i l e d s tudy of t h i s northward s h i f t i s d i f f i c u l t because t h e passes
shown i n F igu re 3 1 have occurred a t d i f f e r e n t l o c a l t imes as i l l u s t r a t e d
i n t h e same f i g u r e by t h e numbers below each d a t e . Therefore i t i s
s p e c u l a t i v e whether t h e northward s h i f t presented i n Figure 31 is caused
only by a s ea sona l v a r i a t i o n i n t h e ionosphere o r whether t h e i n f luence
of l o c a l t ime may be a cause. Never the less , based only on t h e propagat ion
p r o p e r t i e s of t h e waves, i t i s suggested t h a t t h e northward s h i f t of t h e
defocus ing r eg ion du r ing t h e no r the rn hemisphere s o l s t i c e i s caused by
h o r i z o n t a l g r a d i e n t s of e l e c t r o n d e n s i t y near t h e magnetic equa to r . The
d i r e c t i o n of t h e l a t i t u d i n a l g r ad i en t f o r ob t a in ing t h i s e f f e c t should
be northward, i n accordance wi th e l e c t r o n dens i ty measurements made by
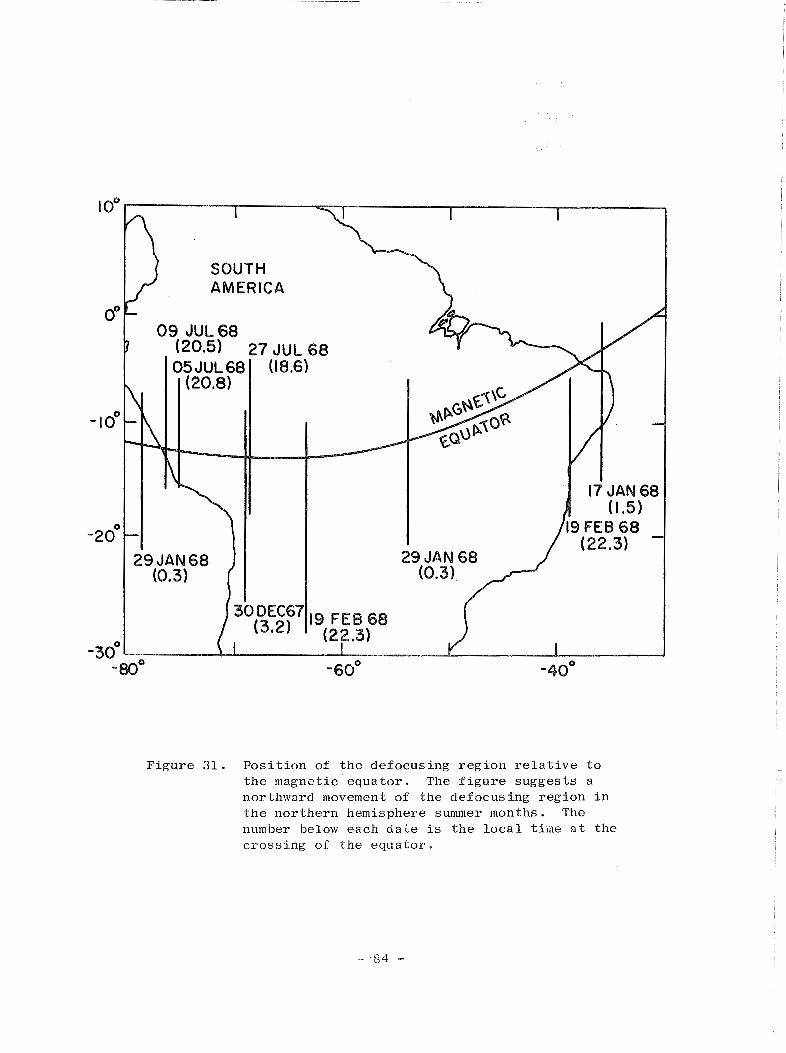
Figure 31. P o s i t i o n of t h e defocusing r eg ion r e l a t i v e t o t h e magnetic equa to r . The f i g u r e sugges ts a northward movement of t h e defocusing region i n t h e nor thern hemisphere summer months. The number below each d a t e is t h e l o c a l time a t t h e c ros s ing of t h e equa to r .

Reddy et a l . C19671, T h i s problem can be analyzed when a more complete
seasonal behavior of the equatorial defocusing is I~nown,
F , CONCLUS IONS
In t h i s chap te r we have presented t h e e q u a t o r i a l e ros ion and t h e
e q u a t o r i a l def ocusing of VLF waves propagat ing a t low magnetic l a t i t u d e s .
I t has been shown t h a t t h e e q u a t o r i a l e ros ion i s caused by ionospher ic
l o s s e s (absorp t ion p lus r e f l e c t i o n ) i n t h e D reg ion . These l o s s e s
i nc rease f o r lower l a t i t u d e s and may cause t h e complete disappearance of
a l l VLJ? waves from t h e r e c e i v e r of a low a l t i t u d e s a t e l l i t e . During the
n igh t absorp t ion i s l e s s important but neve the less a very pronounced
drop i n t h e s i g n a l s of VLF t r a n s m i t t e r s has been observed. We showed
t h a t t h i s new phenomenon is caused by ionospher ic defocusing of VLF r a y s
near t he magnetic equator . This defocusing i s r e l a t e d t o t h e change of
t he v e r t i c a l g r a d i e n t of t he e l ec t ron -dens i ty d i s t r i b u t i o n t h a t takes
p l ace around t h e t r a n s i t i o n h e i g h t . A full-wave t reatment has been
appl ied t o t h e propagat ion through t h e lower n ight t ime ionosphere. This
s tudy confirmed t h e defocusing i n t e r p r e t a t i o n by showing t h a t upgoing
r ays were prevented from reaching t h e defocusing reg ion by excess ive
ionospher ic l o s s i n t h e lower ionosphere. F i n a l l y we showed t h a t t h e
ionospher ic model can be modified i n o rde r t o o b t a i n a prescr ibed e q u a t o r i a l
defocusing p a t t e r n . Given t h e s a t e l l i t e he ight we can approximately s t a t e
t h a t :
1. t h e amount of t h e defocusing l o s s can only be achieved wi th a
hydrogen sca le -he ight g r e a t e r than a s p e c i f i e d va lue ;
2 . t he width of t he defocusing reg ion determines the minimum height
of t h e t r a n s i t i o n reg ion of t h e ionosphere;
3 . t h e p o s i t i o n of the defocusing reg ion r e l a t i v e t o t h e magnetic

e q u a t o r w i l l be a measure of the horrzontal gradient I n the
ionosphere.
Although t h e s e t h r e e s t e p s a r e no t completely ~ndependen t , they change
t h e e q u a t o r i a l defocusing i n t h e way i nd i ca t ed above.
The above process of matching a measured defocus ing l o s s by s u i t a b l e
changes i n a b a s i c ionospher ic d i s t r i b u t i o n r e p r e s e n t s a p o t e n t i a l
+ d i a g n o s t i c t o o l f o r o b t a i n i n g t h e CO+ - H 1 t r a n s i t i o n he ight and t h e
hydrogen temperature i n t h e e q u a t o r i a l ionosphere. A s pointed o u t pre-
v ious ly t h e defocusing phenomenon i s h ighly s e n s i t i v e t o t h e he igh t of
+ t h e LO+ - H 1 t r a n s i t i o n and hydrogen temperature j u s t above t h a t he igh t .
On t h e o t h e r hand t h e phenomenon i s r e l a t i v e l y unaf fec ted by d i f f e r e n t
e l e c t r o n d i s t r i b u t i o n s below t h e t r a n s i t i o n he igh t (compare f o r example
t h e upgoing s e c t i o n s of t h e r ay t r a j e c t o r i e s f o r n igh t t ime and daytime
p r o f i l e s of F igure 2 4 ) . Therefore , i n o r d e r t o f i t a s p e c i f i e d defocusing
measurement t h e most important parameters a r e t he t r a n s i t i o n he igh t and
hydrogen temperature , r e g a r d l e s s of p o s s i b l e d i s c r epanc i e s between t h e
assumed p r o f i l e and t h e a c t u a l ionospheric p r o f i l e . Fu r the r development
of t h i s propagat ion method could provide i n d i r e c t measurements whose
accu rac i e s might compete w i t h p r e s e n t l y a v a i l a b l e processes of measuring
t r a n s i t i o n he igh t and tempera ture . Obviously t h e suggested method can
only be appl ied a t t h e magnetic equator and during n ight t ime because
t h e r e i s no s i g n i f i c a n t defocus ing dur ing t h e day. However, t h e process
would provide measurements a t a l l longi tudes and t h e c o s t of analyzing
t h e d a t a is r e l a t i v e l y low.

I V . OGO-4 AMPLf TUDE MmSUREMENTS OF S I G K A L S ----- - ---- GENERATED BY GROIINE) VLF TRANSM ITTEiZS ------P-
I n t h i s chap te r w e d i s c u s s t h e general features presented by t h e
measurements of ampli tude of VLF s i g n a l s , generated by ground-based
t r a n s m i t t e r s , a s observed dur ing t h e po l a r r evo lu t ions of OGO 4 around
t h e e a r t h . Two a s p e c t s of t h e s e measurements have a l r eady been cons idered ,
corresponding t o r e c e p t i o n of waves i n t h e nearby ionosphere of t h e
t r a n s m i t t e r (Chapter 2 ) and e q u a t o r i a l phenomena (Chapter 3 ) . The
d i s c u s s i o n of t h e measurements g iven he re i s intended t o be more s p e c i f i c
than t h e i n t r o d u c t o r y cons ide ra t i ons of Chapter 1, Sec t ion D. I T w i l l
be followed by a d e t a i l e d s tudy of t h e c o n t r o l l i n g parameters a f f e c t i n g
t h e waves t h a t propagate from the hemisphere of o r i g i n t o t h e conjuga te
hemisphere. A s w i l l be shown, t h e theory of wave propagat ion der ived
from t h a t s t udy is one of t h e most important r e s u l t s of t h i s r e s e a r c h .
A . NIGHTTIME MEASUREMENTS
Figure 3 2 shows n igh t t ime measurements of t h e magnetic f i e l d of
waves t r ansmi t t ed by t h e VLF s t a t i o n NAA a t 17.8 kHz and recorded aboard
OGO 4 by t h e phase t r a c k i n g r e c e i v e r . The corresponding p o s i t i o n of t h e
s a t e l l i t e is shown i n F igure 3 3 . Panels A-B, B-C, C-D, and E-F of
Figure 3 2 correspond t o t h e o r b i t segments shown i n Figure 3 3 . The
pane ls of F igure 3 2 show t h e ampli tude of t h e magnetic f i e l d i n dby
as a f u n c t i o n of t ime and L va lue of t h e s a t e l l i t e . Between A and D
t h e s a t e l l i t e moves approximately from one magnetic pole t o t h e o t h e r
(from L = 33 a t 0330 UT t o L = 38 a t 0420 UT) i n a ha l f o r b i t pe r iod .
Panel E-F corresponds t o measurements taken 50 minutes l a t e r and is
displayed here i n o rde r t o show t h e r e p e a t a b i l i t y of t he main f e a t u r e s

0 6 0 4 17 JAN 1968 MAGNETIC ANTENNA PHASE TRACKING RECEiVER TUNED TO NAA AT 17.8 kHz
Figure 32. OGO-4 amplitude measurements of NAA s i g n a l s a t 17.8 kHz. Panels A-B, B-C, and C-D a r e s e q u e n t i a l p i eces of a cont inuous s t r i p - c h a r t , whi le E-F corresponds t o rneasure- ments taken 50 minutes l a t e r and recorded i n t h e same s t r i p - c h a r t . The corresponding s a t e l l i t e t r a j e c t o r i e s a r e shown i n F igure 3 3 .

F i g u r e 33 . OGO-4 t r a j e c t o r i e s f o r F i g u r e 3 2 . P o i n t C i n t h e s o u t h e r n hemisphere is t h e magnet ic c o n j u g a t e of NAA. The two c u r v e s su r rounding t h e t r a n s m i t t e r a r e l o0 , 20° wide i n l a t i t u d e and l o n g i t u d e , r e s p e c t i v e l y . The cor responding c o n j u g a t e r e g i o n s a r e a l s o drawn i n t h e s o u t h e r n hemisphere .

r e c o r d e d 111 A-R, Tlze r e c o r d s oi F~gixre 32 p r e s e n t properties t h a t are
t y p i c a l for alr ipl i tude measurernen ts taker1 when both trarrsmilter and
s a t e l l i t e a r e on t h e n i g h t s i d e of t h e e a r t h , The m a i n f e a t u r e s d i s p l a y e d
i n t h e r e c o r d s of F i g u r e 3 2 a r e d i s c u s s e d below.
1. Enhancement of t h e S i g n a l s i n t h e Con iuga te Region of t h e
T r a n s m i t t e r
P a n e l A-B shows t h a t t h e s i g n a l s from NAA a r e v e r y s t r o n g i n
t h e c o n j u g a t e r e g i o n of t h i s s t a t i o n . The c o n j u g a t e p o i n t f o r NAA and
t h e c o n j u g a t e l o c i i f o r two c u r v e s s u r r o u n d i n g t h e t r a n s m i t t e r a r e shown
i n F i g u r e 3 3 . The r e g i o n s where t h e s i g n a l s a r e s o s t r o n g t h a t they
s a t u r a t e t h e r e c e i v e r ( s e e A-B o r E-F) are shown i n F i g u r e 3 3 w i t h a
t h i c k e r l i n e a l o n g t h e o r b i t i n t h e c o n j u g a t e r e g i o n o f NAA. Such h i g h
s i g n a l l e v e l s (above -30 dby) a r e u s u a l l y measured when t h e s a t e l l i t e
is i n t h e neighborhood o f t h e NAA t r a n s m i t t e r . T h e r e f o r e t h e measure-
ments show t h a t t h e f i e l d s i n t h e F r e g i o n n e a r t h e t r a n s m i t t e r a r e
mapped i n t o t h e s o u t h e r n c o n j u g a t e i o n o s p h e r e w i t h n e g l i g i b l e l o s s . I n
f a c t on some o c c a s i o n s a n enhancement of a few d b h a s been measured i n
t h e con j u g a t e r e g i o n .
2 . H igh-La t i tude " ~ r o s i o n " i n t h e Con juga te Hemisphere
Arrows i n d i c a t e i n p a n e l s A-B and E-F t h a t n e a r L = 5 t h e r e
is a c u t o f f i n t h e i n t e n s i t y of t h e s i g n a l s from NAA. The c o r r e s p o n d i n g
s a t e l l i t e p o s i t i o n s a r e a l s o marked by ar rows i n F i g u r e 3 3 . Usua l ly t h e
0 magne t i c f i e l d d e c r e a s e s by - 7 0 d b i n a d i s t a n c e of 1 t o 4' and t h e
s i g n a l i s g e n e r a l l y n o t observed a g a i n above t h e c u t o f f magnet ic l a t i t u d e .
T h i s phenomenon h a s been obse rved p r e v i o u s l y aboard t h e OGO-2 s a t e l l i t e
[Heyborne, 19661 and must n o t be confused w i t h a h i g h - l a t i t u d e c u t o f f
obse rved i n t h e hemisphere of t h e t r a n s m i t t e r r e c e n t l y r e p o r t e d by

Heyborne e t a l . r19691 ( s e e p a r a r r a p h (5) below)
The h i g h - l a t i t u d e cu to f f i n t h e conjugate hemisphere of NAA is
i n f a c t a p a r t i c u l a r ca se of a more g e n e r a l phenomenon de t ec t ed i n e v e r y
OGO-4 pas s , namely a h i g h - l a t i t u d e e ros ion of downcoming w h i s t l e r s . The
h igh - l a t i t ude e ros ion of downcoming w h i s t l e r s and t h e cu to f f i n t h e
i n t e n s i t y of t h e NAA s i g n a l a r e shown simultaneously i n t h e OGO-4 spec t ro -
gram of F igure 34. Frequency ranging from 0 t o 12.5 kHz i s shown as a
f u n c t i o n of t i m e and L va lue t oge the r w i th t h e f requenc ies of t h e vol tage-
con t ro l l ed o s c i l l a t o r (VCO) modulated by t h e ou tput of t h e s t epp ing
r e c e i v e r No. 3 (upper t r a c e ) . Observe t h a t t h e r e i s a complete absence
of w h i s t l e r s c l o s e r t o t h e magnetic po le and t h a t as t h e s a t e l l i t e
t r a v e l s equatorward t h e lowest f r equenc i e s of t h e downcoming w h i s t l e r s
appear f i r s t and t h e h igher f r equenc i e s appear l a t e r . During t h i s t i m e
s i g n a l s a r e n o t rece ived i n Band 3 and only when t h e spectrum 0 - 12.5 kHz
i s completely f i l l e d w i th downcoming w h i s t l e r s does t h e NAA s i g n a l r ise
ou t of t h e n o i s e , a s seen by t h e VCO. The h i g h - l a t i t u d e cu to f f i n t h e
occur rence of w h i s t l e r s has been repor ted by Carpenter e t a l . El9681
from Alouet te 1 and 2 obse rva t ions . There a r e o the r f e a t u r e s i n F igu re
34 t h a t w i l l be d i scussed l a t e r .
3 . Equa to r i a l Defocusing
The s i g n a l l e v e l s from mid - l a t i t ude VLF t r a n s m i t t e r s decrease
ab rup t ly near t h e magnetic equa tor a s shown i n pane l B-C of F igure 32.
I t has been shown i n Chapter 3 t h a t t h i s phenomenon is caused by ionospher ic
defocusing r e l a t e d t o t h e change i n ionization g r a d i e n t t h a t occurs around
+ t h e CO+ - H 1 t r a n s i t i o n h e i g h t .
4. Enhancement of t h e S igna l s i n t h e Hemisphere of t h e Transmi t te r
Panel C-D of Figure 32 p re sen t s measurements made i n t h e nor thern
- 91 -

-u~oys axe (a~ex3 xaddn) 03~ ay? Lq uaas se z~y 8.~1
03 paunl I# 6aaraaa-x 3urdda3s ay7 $0 apn3r~dme aya pue z~y 9.~1 03 0 moxj urn.qDads aur~~-63uanba~~ uouaurouayd I,uorsoxaII apn~r-$eT-y8ry ay?. %u?Le~dsrp pxoDax P-030 PE axn%ra
1 1 I
099 - oL9- 089- 069- 6'2 O'E 2.S £'I.
,8JE1 LlEl,
069- E'E
OPL - E'P
hemisphere. These s i g n a l s reach t h e s a t e l l i t e from below, a f t e r t r a v e l i n g
i n t h e ground-ionosphere waveguide from the t r a n s m i t t e r t o t h e f o o t of
t he ray t r a j e c t o r y connect ing t h e l o w ionosphere t o t h e s a t e l l i t e . The
s i g n a l is maximum when t h e s a t e l l i t e i s nea r ly e a s t of t h e t r a n s m i t t e r .
5. Rings of Noise i n t h e Auroral Region
In every r e v o l u t i o n of OGO 4 t h e a u r o r a l ova l no i se (AON) is
de t ec t ed i n t h e 50 Hz bandwidth of t h e phase t r a c k i n g r e c e i v e r when t h e
s a t e l l i t e c r o s s e s t h e p o l a r r eg ions . The same r i n g of no i se i s c ros sed
twice a t each h i g h - l a t i t u d e pass . The AON measured i n t h e conjuga te
hemisphere of NAA (pane ls A-B o r E-F) does n o t i n t e r f e r e wi th t h e ampli-
tude measurement of NAA s i g n a l s . This is due t o t h e occurrence of AON
above t h e l a t i t u d e s where a complete e ros ion of t h e NAA s i g n a l has
a l ready taken p l ace i n t h e conjuga te hemisphere. On t h e con t r a ry , t h e
AON measured i n t h e t r a n s m i t t e r hemisphere (pane l C-D) seems t o be
r e l a t e d t o a h igh a t t e n u a t i o n i n t h e upgoing waves. I n t h i s ca se t h e
NAA s i g n a l may d i sappea r below t h e n o i s e l e v e l but i t r e t u r n s when t h e
s a t e l l i t e is over t h e po l a r r eg ion . This phenomenon has been r epo r t ed
by Heyborne e t a l . E19691.
B. DAYTIME MEASUREMENTS
The magnetic f i e l d of s i g n a l s t r ansmi t t ed by mid- la t i tude VLF s t a t ions
and rece ived aboard OGO 4 on t h e days ide p r e s e n t s t h e same n igh t t ime
f e a t u r e s d i scussed above wi th two main except ions : s i g n a l l e v e l and
e q u a t o r i a l behavior . F i r s t , t h e s i g n a l l e v e l s a r e of t h e o rde r of 30 db
weaker than t h e n igh t t ime l e v e l s ( s ee , f o r example, Figure 2 i n Chapter 1) .
Second, p ropaga t ion near t h e equa tor is no t dominated by defocusing as
on t h e n i g h t s i d e but r a t h e r by absorp t ion i n t h e lower ionosphere as

d i s c u s s e d rn C h a p t e r 3 . For a situation like the oxre exemplified i n
F igure 33 where both s a t e l l i t e and t r a n s m i t t e r a r e on the n i g h t s i d e of
t h e e a r t h t h e s i g n a l l e v e l s f o r the o t h e r half days ide o r b i t a r e very
sma l l . For example, t h e s i g n a l s from a powerful 1 Megawatt t r a n s m i t t e r
l i k e NAA a r e bare ly d e t e c t a b l e . A b e t t e r s i t u a t i o n occurs when s a t e l l i t e
and t r a n s m i t t e r a r e on t h e days ide of t h e e a r t h . In t h i s case i n t e r -
merd i a t e s i g n a l l e v e l s a r e measured on t h e days ide because of t r a n s -
m i t t e r proximity. In te rmedia te l e v e l s a r e a l s o found on t h e n i g h t s i d e
caused by a combination of increased e a r t h waveguide a t t e n u a t i o n followed
by h igh t r ansmis s ion c o e f f i c i e n t s i n t h e n i g h t s i d e ionosphere. With t h e
except ion of t h e conjuga te p o l a r r eg ion , it is then poss ib l e t o observe
complete world coverage of VLF r e c e p t i o n aboard OGO 4 f o r a s t a t i o n
such a s NAA. One example of world coverage wi th NAA is given i n F igures
35a, b, c . These f i g u r e s show about 175 minutes of s t o r ed d a t a co r r e -
sponding t o almost two OGO-4 r e v o l u t i o n s on 19 November 1967 as i nd i ca t ed
by t h e ground p r o j e c t i o n of t h e s a t e l l i t e t r a j e c t o r y i n F igure 36. The
s t epp ing r e c e i v e r s B1, B2, and B3 were ope ra t i ng i n t h e sweeping mode
and t h e phase t r ack ing r e c e i v e r ( P and A) was tuned t o 17.8 kHz. B1,
B2, and B3 p re sen t t h e c h a r a c t e r i s t i c s a l ready d iscussed i n Chapter 1,
S e c t i o n D, t h e r e f o r e we concen t r a t e he re on t h e f e a t u r e s d i sp layed by
ampli tude A of NAA. The s a t e l l i t e o r b i t was nea r ly i n t h e dawn-dusk
mer id ian : I t was e a r l y evening a t t h e e q u a t o r i a l c ro s s ings n e a r A u s t r a l i a
( l o c a l time -, 19.3) and e a r l y morning a t t h e e q u a t o r i a l c ro s s ings over
South America ( l o c a l t ime - 7 - 3 ) . This f a c t y i e l d s i n t e r e s t i n g p r o p e r t i e s
r e l a t e d t o t h e t r a j e c t o r y of t h e waves received by OGO 4 and t h e c o r r e -
sponding D r eg ion abso rp t ion tak ing p l ace j u s t a f t e r t he waves en te red
t h e ionosphere. Fox- example, Figures 35a and 35c show t h a t reasonable
- 94 -

L 21
F i g u r e 35a . OGO-4 s t r i p - c h a r t r e c o r d e d on 19 November 1 9 6 7 , B1, B2, 83, P and A a r e , r e s p e c t i v e l y , t h e a m p l i t u d e s of t h e s t e p p i n g r * e c e i v e r s o p e r a t i n g i n sweep mode and phase and ampl i tude of t h e phase t r a c k i n g r e c e i v e r , tuned t o NAA a t 1-7-8 k H z . There i s an i n t e r r u p t i o n i n t h e 43 .6 s e e sweep between 0916 and 0926 UT co~imanded by t h e t e l e m e t r y s t a t i o n a t O r r o r a l , A u s t r a l i a .
OK .

F i g u r e 35b. C o n t i n u a t i o n of t h e s t r i p - c h a r t shown i n F i g u r e 3 5 a .

Figure 35c. Continuation of the strip-chart shown in Figure 35b. There is an interruption in the 73.6 sec sweep after 1125 UT commanded by the telemetry station at Santiago, Chile.
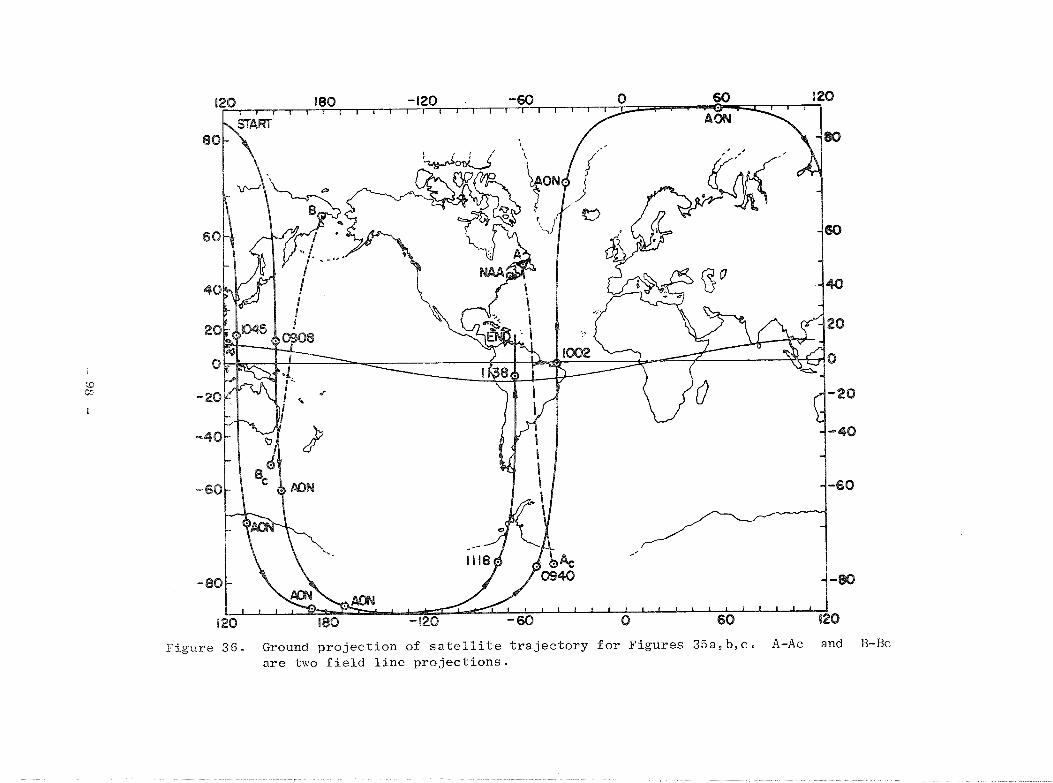

f leld levels are measured I n th? S(\:I ther13 j i e m l s p l r ~ r ~ s o t l t h O L i \ l i s t r a l l ? ,
111 t h e t w o consecutibe r e v o l u t ~ o l i s , betweeii CISL~ and 0924 UT ;rid beriveen
1052 and 1105 UT, The z e n ~ t h angle of tllr s u n a t 0925 IrI' nrld a c 1105 IJT
o was - 88 a t t h e s a t e l l i t e t i - a j ec to ry , i n d i c a t i n g d a y l i g h t . However
t h e s i g n a l was coming from above a f t e r t r a v e l i n g along a meridian whose
conjuga te r eg ion was i n t h e n i g h t s i d e a s shown by t h e f i e l d l i n e p r o j e c t i o n
B-Bc i n F igure 36. Therefore , t h e s i g n a l s rece ived i n t h e s e southern
reg ions (almost i n t h e an t ipoda l r eg ion of NAA) r each t h e s a t e l l i t e
a f t e r t r a v e l i n g i n t h e n i g h t s i d e ground-ionosphere wave guide from C u t l e r ,
Maine t o west of Alaska, before being launched i n t o t h e w h i s t l e r medium
around po in t B. This is m t t h e only p o s s i b l e t r a j e c t o r y but i t i s t h e
one t h a t g ives minimum t o t a l a t t e n u a t i o n .
F igures 35a and 35c show a l s o t h a t he s i g n a l from NAA s a t u r a t e s
t h e r e c e i v e r dur ing t h e two passes (between 0940 t o 0948 UT and 1118 t o
1124 UT) i n t h e southern hemisphere over South America. Here aga in i t
was s u n l i g h t i n t h e above southern reg ions but i n both ca se s t h e s a t e l l i t e
was r ece iv ing s i g n a l s from a r eg ion near NAA where i t was n ight t ime as
shown i n F igure 36 by t h e f i e l d l i n e p r o j e c t i o n A - . The z e n i t h C
0 0 angle of t h e sun was 111 a t p o i n t A a t 0945 UT and 101 a t t h e e n t r y
0 0 p o i n t (LAT = 50 , LONG = -70 ) from where t h e s a t e l l i t e was r ece iv ing
s i g n a l s a t 1120 UT.
The NAA s i g n a l is n o t received i n t he p o l a r reg ions of t h e southern
hemisphere a s shown i n F igure 35. We observe world coverage of NAA
s i g n a l s w i th t h i s one except ion .
C . SIGNALS IN THE CONJUGATE HEMISPHERE
From t h e p r o p e r t i e s d i scussed i n t he previous s e c t i o n s r e l a t i v e t o

magne t i c f ieZd meas~r re r i i en t s of IrTW t r a n s m i t ters , v ' e novr eoncel l t ra te on
t h e f e a t u r e s that occur i n t h e conjuga te he~rtisphere of t he t r a n s m i t t e r
(pane l A-B o r E-F of Fjgure 321, I t i s proposed t o i n t e r p r e t t he se
measurements and t o d i s c u s s t h e i r i m p l i c a t i o n s . To be more s p e c i f i c ,
t h e f i r s t s t e p w i l l be t o deduce t h e p r o p e r t i e s t h e medium must p r e sen t
f o r t h e purpose of matching t h e requirements imposed by the measurements.
Next, t h e deduced p r o p e r t i e s of t h e medium w i l l be appl ied t o t h e a n a l y s i s
of w h i s t l e r p ropaga t ion i n t h e magnetosphere. I t w i l l be shown t h a t a
s imple i n t e r p r e t a t i o n of t h e amplitude measurements i n t h e conjuga te
hemisphere of t h e t r a n s m i t t e r w i l l p r e d i c t concomitantly s e v e r a l f e a t u r e s
f o r t h e w h i s t l e r s commonly rece ived aboard t h e same s a t e l l i t e . This
provides proof of t h e new theory of VLF propaga t ion i n t h e magnetosphere.
T h e o r e t i c a l d i s c u s s i o n . The measurements of F igure 32 f o r t h e
conjuga te hemisphere of t h e t r a n s m i t t e r pu t t h e fo l lowing c o n s t r a i n t s on
t h e ray-wave p r o p e r t i e s received aboard t h e s a t e l l i t e :
1. P o s s i b l e Doppler s h i f t must be confined t o f 25 Hz because
d i f f e r e n c e s i n amplitude have n o t been observed when the same
VLF t r a n s m i t t e r i s tuned s imultaneously by t h e s t epp ing r e c e i v e r
No. 3 and t h e phase t r ack ing r e c e i v e r , whose bandwidths a r e
5250 and 225 Hz r e s p e c t i v e l y . For t h e o r b i t a l v e l o c i t y of
OGO 4 t h e above cond i t i on impl ies t h a t t h e h o r i z o n t a l component
of t h e r e f r a c t i v e index a t t h e s a t e l l i t e must be below 57.
2 . The propaga t ion cannot be along duc t s of enhanced i o n i z a t i o n
because a cu to f f should t hen occur f o r t h e duc t whose minimum
gyrofrequency is 2 x 17.8 kHz [Smith, 1961al. Hence, t h e
maximum l a t i t u d e where t h e domcoming s i g n a l could be observed 0
is - 54 (L 3 2 + 9 ) - The measurements i n d i c a t e t h a t t h e VLF
s i g n a l s a r e received aboard t h e s a t e l l i t e a t much h igher l a t i t u d e s
i n t h e conjuga te hemisphere,
3 . Rag t r a c j e c t o r i e s i n a l a t i t u d i n a l l y smooth ionosphere produce

ciomazcornfng :tTa\es i n the c o n ~ u g ; ~ t e hernispllere whose m a t n c h a r a c t e r -
i s t i c s a r e : very l a r g e angle between the wave normal and t h e
e a r t h ' s magnetic f ieLd ( l a r g e r e f r a c t i v e index) p l u s a maximum 0 1
La t i t ude range of about 48 . This corresponds t o t h e wa lk ing -
t r a c e ' ' mode of propagat ion d iscussed by \Yalteia and Angerami
C19691. The measurements d i sp layed i n F igure 32 r u l e ou t t h e
walking-trace mode, because of a l a t i t u d e range of obse rva t ions
and a r e f r a c t i v e index a t t h e s a t e l l i t e n e c e s s a r i l y sma l l e r than
about 57.
From t h e above d i s c u s s i o n i s is concluded t h a t t h e waves probably
c r o s s t h e equa to r a t a r a d i u s l e s s than 2.9 e a r t h r a d i i . Hence, t h e
upgoing r ays s t a r t i n g from below t h e ionosphere a t high l a t i t u d e s m u s t
m ig ra t e t o lower L-she l l s , c r o s s t h e equa tor below 2.9 e a r t h r a d i i , and
fo l l ow a descending pa th toward h igher L va lues i n t h e conjuga te hemi-
sphe re . In o rde r t o achieve t h e above r ay behavior it i s necessary t o
d e f l e c t t h e upgoing wave normal toward t h e equa tor . This equatorward
o r i e n t a t i o n of t h e wave normal is accomplished by in t roduc ing a nega t ive
l a t i t u d i n a l g r a d i e n t of e l e c t r o n d e n s i t y i n t h e ionosphere a t mid-high
l a t i t u d e s . In f a c t , t h i s kind of i o n i z a t i o n g r a d i e n t e x i s t s and has
been de t ec t ed s y s t e m a t i c a l l y a t t h e o r b i t i n g a l t i t u d e s of s a t e l l i t e s
T i r o s 7 , Explorer 22,and Aloue t t e I, and Aloue t te 2 ( see f o r example,
Brace e t a l . C19671; Reddy e t a l . C19671). The e f f e c t of t h e s e ho r i zon ta l
g r a d i e n t s of i o n i z a t i o n on t h e behavior of t h e wave normal has been
d i scus sed by Aubry C19671 f o r upgoing r ays j u s t a f t e r t h e waves en te red
t h e ionosphere.
In o r d e r t o i n t roduce t h e need f o r a l a t i t u d i n a l g r a d i e n t of e l e c t r o n
d e n s i t y t h e fo l lowing s tudy of wave-normal behavior is made. The
d i f f e r e n t i a l equa t ions governing t h e propagat ion of waves i n a slowly
vary ing two-dimensional ionosphere may be expressed by a c losed s e t

d r - - 9 and d t
d t ' d t
where r and 8 a r e r e s p e c t i v e l y t h e r a d i u s and t h e c o l a t i t u d e of t h e
r ay t r a j e c t o r y , and i s t h e angle between t h e wave normal and t h e
e a r t h ' s magnetic f i e l d . These equa t ions d e s c r i b e t h e ray pa th of a
wave packet i n t h e magnetosphere a s a f u n c t i o n of t ime t , and can be
numerical ly i n t e g r a t e d by means of s tandard computer procedures . These
equa t ions have been w r i t t e n i n t h i s form by Walter L19691 who showed
t h a t when e l e c t r o n s only a r e considered t h e equa t ion f o r $ is
where is t h e r e f r a c t i v e index
2 X = ( f N / f ) and f N i s t h e l o c a l plasma frequency
Y = f / f where H
f H is t h e l o c a l gyrofrequency
f i s t h e wave frequency
c is t h e v e l o c i t y of l i g h t
and 6 is t h e ang le between t h e l o c a l v e r t i c a l and t h e wave normal.
The geometry is shown i n F igure 37. For very-low-frequencies and when
only t h e motion of e l e c t r o n s i s taken i n t o account t h e r e f r a c t i v e index
i s approximately g iven by
where C = cos$ ( s e e , f o r example, H e l l i w e l l Cl965 3 ) .

NORTH WhE
Figure 37. Geometry assumed f o r t h e two-dimensional r ay equa t ion , Eq. (4 .1 ) .
There a r e s e v e r a l approximations i n Eq. (4 .2) , namely X >> 1,
2 Q.L. approximation ERatc l i f fe , 19591, p >> 1, and f i n a l l y
Of a l l t h e approximations t h e l a s t one f a i l s when $ is near t h e
resonance cone f o r a w i d e range of h e i g h t s i n t h e magnetosphere. The
2 resonance cone is def ined by t h e angle f o r which p = , In
gene ra l t h e Q.L. approximation is good f o r a l l magnetospheric cond i t i ons ,

i n c l u d i n g at the resonance cone. On the other hand we assume that
the earth's magnetic iield comes from a centered dipole, i,e.,
where r is t h e e a r t h ' s r a d i u s and Y corresponds t o t h e e q u a t o r i a l 0 0
gyrofrequency on t h e ground. Using Eq. (4.2) and Eq. (4.3) and no t ing
t h a t f2 i s p r o p o r t i o n a l t o t h e e l e c t r o n dens i ty N , Eq. (4.1) may N
be w r i t t e n a s
where t h e i n f l u e n c e of t h e cu rva tu re of t h e e a r t h ' s magnetic f i e l d i s
given by
and t h e i n f l u e n c e of t h e magnetic f i e l d over t he wave normal i s dependent
upon t h e ang le $ between t h e wave normal and t h e magnetic f i e l d ,
namely
In Eq. (4 .4) logN s t a n d s f o r t h e n a t u r a l logari thm of N .
Assume f o r t h e moment t h a t N does no t vary i n l a t i t u d e and t h a t
N dec reases w i th he igh t as it does above t h e peak of t h e F region.

T h e r e f o r e , E q , ( 4 , 4 ) g i v e s
d a ZOS 6 21' ----- - 3s in6 - s i n 6 1 log?: 1 i ---- * me - -- (m +-m I
c d t r r Y
The f i r s t two terms i n E q . (4 .8) provide p o s i t i v e va lues f o r t h e d e r i v a t i v e
of (bending toward t h e equa to r ) whi le t h e l a s t term in t roduces
nega t ive va lues f o r d$ /d t . The waves t h a t emerge from the E r eg ion of
t h e ionosphere have an almost v e r t i c a l wave normal (6 = 01, a r e s u l t
provided by t h e a p p l i c a t i o n of S n e l l ' s law t o t h e lower ionosphere.
Therefore , t h e only term t h a t w i l l produce some equatorward d e f l e c t i o n
a t t h e s t a r t i n g h e i g h t s w i l l be In@ '
This e f f e c t w i l l i n t u r n cause 6
t o be d i f f e r e n t from z e r o and then t h e o t h e r terms i n E q . (4 .8) become
e f f e c t i v e as t h e r ay proceeds upward.
Observe t h a t m dec reases a s t h e ray approaches t h e equator and 8
0 is much sma l l e r than t h e o t h e r magnetic terms f o r ( say) + l o near t h e
equa to r . A t t h e s e l a t i t u d e s c r i t i c a l cond i t i ons occur :
1. I f i n E q . (4 .8) t h e term involving t h e r a d i a l d e r i v a t i v e of N
i s of t h e o r d e r of t h e term involving (m +m ) then t h e r a y c Y
may c r o s s t h e equa tor w i th no t very l a r g e $ and may cont inue
t r a v e l i n g downward w i t h reasonable angles $ between t h e wave
normal and t h e magnetic f i e l d . 2 . If t h e t e r m involv ing t h e r a d i a l d e r i v a t i v e of N i s sma l l e r
than t h e one involv ing (m +m ) a degenera t ion may happen c Y
namely t h a t $ i nc reases nega t ive ly and t h e product YC may
approach u n i t y . This i n t u r n i n c r e a s e s t h e d i f f e r e n c e f u r t h e r
between t h e terms i n Eq. (4 .8) u n t i l t h e wave normal i s a t tached
t o t h e resonance cone wi th a very l a r g e r e f r a c t i v e index. I t
can be shown t h a t from t h i s po in t on t h e r a y w i l l fo l low c l o s e l y
a l i n e of f o r c e and w i l l a r r i v e a t t h e conjuga te hemisphere
with very l a r g e r e f r a c t i v e i ndes [Walter and ~ n g e r a m i , 19691.

Now we ask what would be t h e s c a l e he igh t of t he e l e c t r o n d e n s i t y
t h a t would overcome t h e above degenera t ing e f f e c t , Suppose t h e e l e c t r o n
d e n s i t y is g iven by a hyd ros t a t i c - equ i l i b r ium d i s t r i b u t i o n [Angerami
and Thomas, 19641 and t h a t - a t h igh a l t i t u d e s on ly hydrogen ions and r
e l e c t r o n s e x i s t . Then, t h e e l e c t r o n d e n s i t y i s given by
r r N = N r exp -
(1 - $11 where Nr i s t h e e l e c t r o n d e n s i t y taken a t a r e f e r ence r ad ius r and
r
H is t h e n e u t r a l s c a l e he igh t of hydrogen. I f Eq. (4.9) i s now sub-
s t i t u t e d i n t o Eq. (4 .8) and t h e cond i t i on imposed t h a t 9 is n e a r l y d t
ze ro around e q u a t o r i a l l a t i t u d e s , w e g e t
H e 200 km a t r = 2 e a r t h r a d i i
H = 160 km a t r = 2.5 e a r t h r a d i i
The r e f e r e n c e l e v e l has been assumed t o correspond t o a he igh t of
400 km. The n e u t r a l s ca l e -he igh t va lues f o r hydrogen gene ra l l y measured
above 1000 km a r e of t h e o rde r of o r g r e a t e r than 1000 k m and t h e r e f o r e
t h e va lues g iven by Eq. (4.10) a r e u n r e a l i s t i c . Therefore , c e r t a i n l y
t h e term involv ing N i n Eq. (4 .8) w i l l l o s e c o n t r o l of t o t h e
magnetic t e r m s around t h e equa tor because t h e r e a l s c a l e he igh t i s
c e r t a i n l y much g r e a t e r than t h e va lues d i sp layed i n Eq. (4 .10) . Hence,
i t is conc lus ive t h a t 9 w i l l be nega t ive i n a r eg ion around t h e d t
equa tor and t h i s s i t u a t i o n cannot be changed. Nevertheless can be
convenien t ly shaped o u t s i d e t h e e q u a t o r i a l r eg ion i n such a way t h a t t h e
r ay e n t e r i n g t h e e q u a t o r i a l r eg ion may c ros s i t and emerge from t h e o ther

s l t l c ? . before the d e g e n e r a l i o n taliec p l a c e , 1 ,e ,, before t h e 17ave normal
g e t s a t tached t o t h e resonance cone. The idea is then t o in t roduce
convenient g r a d i e n t s of i on i za t i o i l i n o rde r t o g e l 9 > 0 a t the L d l
s h e l l s where presumably t h e r a y t r a j e c t o r y w i l l t ake p l a c e and o u t s i d e
t h e e q u a t o r i a l r eg ion . Equation (4.4) shows t h a t a nega t ive l a t i t u d i n a l
g r a d i e n t of e l e c t r o n d e n s i t y would work i n t h e des i red d i r e c t i o n s t a r t i n g
from t h e beginning of t h e r ay pa th . Therefore , t h i s g r a d i e n t of e l e c t r o n
d e n s i t y would bend t h e wave normal t o p o s i t i v e va lues of , t he r ay
would mig ra t e t o lower L s h e l l s , and p e n e t r a t e t h e degenera t ing r eg ion
wi th p o s i t i v e va lues . The r ay may come from t h e degenera t ing r eg ion
wi th nega t ive $ values ( a s i t usua l ly does) but f o r a symmetric mag-
ne tosphere - dd' w i l l aga in be p o s i t i v e i n t h e conjuga te hemisphere and d t
then reasonable va lues of $ may be achieved i n t h e downward ray flow.
These i d e a s a r e expressed by t h e r a y t r a j e c t o r i e s of F igure 38. I n
F igure 38 a r ay - t r ac ing computer program [Walter, 19691 has been used
i n o r d e r t o o b t a i n t h e behavior of 17.8 kHz r ays t h a t s t a r t a t t h e same
l a t i t u d e f o r two d i f f e r e n t magnetospheres: one wi th no l a t i t u d i n a l
v a r i a t i o n of e l e c t r o n d e n s i t y (N - 0 ) and one p re sen t ing a l a t i t u d i n a l 8 -
g r a d i e n t of e l e c t r o n s toward t h e equator (N f 0). Both models of 8
e l e c t r o n d e n s i t y a r e of t h e hyd ros t a t i c - equ i l i b r ium type and t h e d e t a i l s
f o r t h e model having N f 0 w i l l be given i n Sec t ion D of t h i s chap te r . 8
The wave normal t o magnetic f i e l d angle J i s nega t ive f o r t h e N = 0 8
model, and t h e r ay degenera tes i n t h e walking-trace mode of propagat ion
p re sen t ing a r e f r a c t i v e index of 1200 and a de lay of 3 .6 seconds a t t h e
a r r i v a l h e i g h t of 500 km i n t h e conjuga te hemisphere. To t h e c o n t r a r y ,
t h e r ay t h a t t r a v e l s i n s i d e t h e medium p re sen t ing Ne =& 0 has t h e wave
normal r a p i d l y bent toward the equa tor a t low he ights . The r ay migra tes
- 107 -

f = 17.8 kHz
Figure 38. Ray trajectories in a latitudinally constant magneto- sphere (N = 0) and in a magnetosphere presenting e an increasing trend of ionization toward the equator (Ng # 0 ) .

t o lower L shells and i s l a u n c h e d i n s i d e t h e de rene ra t i on regiqn i iv i th
p o s i t i v e 1 v a l u e . I n s ide t h e degenerat ion r eg ion d $ / d t becomes
nega t ive d r i v i n g 111 t o nega t ive v a l u e s . However, t h e g rad i en t of
e l e c t r o n d e n s i t y ac ros s t h e f i e l d Lines r e s t r a i n s t h e nega t ive v a r i a t i o n
of and t h e ray a r r i v e s approximately a t t h e conjuga te po in t from
where i t s t a r t e d . The important f a c t i s t h a t a l though t h i s r ay a r r i v e s
a t 500 km w i t h of t h e o r d e r of €40' t h e r e f r a c t i v e index is r e l a t i v e l y
sma l l (p = 34) and t h e de l ay i s 0.47 second ( a t y p i c a l t r a v e l t ime
f o r l o n g i t u d i n a l p ropaga t ion) .
The s a t e l l i t e VLF r ecep t ion a t h igh l a t i t u d e s i n t h e conjuga te
hemisphere of t h e t r a n s m i t t e r is i n t e r p r e t e d as t h e r e s u l t of e f f e c t s
upon t h e r a y t r a j e c t o r i e s caused by e l e c t r o n d e n s i t y g r a d i e n t s ac ros s
magnetic f i e l d l i n e s i n t h e ionosphere. A numerical s tudy fo l lows i n
o r d e r t o ana lyze t h e p r e d i c t i o n s by a computer r ay - t r ac ing program when
r a y s a r e allowed t o t r a v e l i n a r e a l i s t i c l a t i t u d i n a l l y v a r i a b l e magneto-
s p h e r i c model.
D . PROPAGATION I N A MODEL MAGNETOSPHERE
E lec t ron d e n s i t y measurements i n t h e upper ionosphere have shown
t h a t t h e i o n i z a t i o n a t a cons t an t he igh t is h ighly v a r i a b l e i n l a t i t u d e .
More than t h a t , t ops ide sounders Aloue t te 1 and 2 have shown t h a t t h e
g e n e r a l l a t i t u d i n a l t rend of i o n i z a t i o n observed a t a s p e c i f i c he igh t
i s a l s o observed a t a l l he igh t s above t h e F r eg ion and below t h e
s a t e l l i t e s . Nighttime f e a t u r e s of t h e ionosphere i nc lude a f l a t p r o f i l e
of i o n i z a t i o n around t h e equa to r , a peak a t mid l a t i t u d e s , a decrease
toward high l a t i t u d e s , a h i g h - l a t i t u d e t rough and an i r r e g u l a r behavior
a t po l a r l a t i t u d e s [Reddy e t a l , 19671, A model magnetosphere w i l l be

d e r i v e d having t h e above f e a t u r e s and satisfying t h e equations of
d i f f u s i v e equi l ib r ium along t h e magnetic f i e l d l i n e s . No claim w i l l be
made t h a t t h e der ived model has t h e a c t u a l p r o p e r t i e s of a g l o b a l mag-
ne tosphere , but t h e model w i l l c a r r y t h e f e a t u r e s g e n e r a l l y found a t
n igh t t ime below 2500 km.
F i r s t w e s t a r t w i th a d i f f u s i v e equi l ib r ium model whose composition
i nc ludes hydrogen and oxygen i o n s . For a cons t an t temperature a long t h e
f i e l d l i n e t h e e l e c t r o n d e n s i t y is ( s e e Angerami and Thomas C19641)
where
and
Nr i s t h e e l e c t r o n d e n s i t y a t a r e f e r ence l e v e l r a d i u s r . 5 r ) o+
and tH+ a r e r e s p e c t i v e l y t h e oxygen and t h e hydrogen i o n percentages
a t r ' r is t h e g e o c e n t r i c r a d i u s , and Ho and HH a r e r e s p e c t i v e l y r '
t h e n e u t r a l s c a l e h e i g h t s of oxygen and hydrogen. The r e f e r e n c e l e v e l is
taken a s 400 km, i . e . ,
The E , F reg ions of t h e ionosphere a r e s imulated by a gauss ian
d i s t r i b u t i o n t h a t matches t h e i o n i z a t i o n and t h e v e r t i c a l g r a d i e n t s of

i o n i z a t i o n of t h e above d i f fu s ive -equ i l i b r ium model a t a he ight below
400 kln and has a g iven va lue of e l e c t r o n d e n s i t y a t 100 km, Therefore ,
a complete d e s c r i p t i o n of e l e c t r o n d i s t r i b u t i o n above 100 km i s de r ived .
Very good agreement between ca l cu l a t ed models and Aloue t te p r o f i l e
measurements is e a s i l y ob ta ined by using t h e p re sen t technique.
Next, t h e der ived model is modulated as a f u n c t i o n of l a t i t u d e ,
where Q0 is t h e c o l a t i t u d e a t ground l e v e l . The f a c t t h a t t h e hydrogen
s c a l e he igh t is 16 times g r e a t e r than the oxygen s c a l e he igh t has been
used. Observe t h a t Nr and H depend on r and 8 because t h e
d i s t r i b u t i o n is a long t h e f i e l d l i n e s :
1 r 1 = L = - . - 2 0 r 2
(4.18) s i n 0
0 0 s i n 8
This means g iven a p o i n t ( r , 0 ) i n t h e magnetosphere it i s necessary
t o u se t h e r e l a t i o n , E q . (4 .18) , t o o b t a i n t h e c o l a t i t u d e e0 of t h e
f o o t of t h e f i e l d l i n e pass ing through 0 Now N and H can be r
c a l c u l a t e d . The geometry i s shown i n F igure 3 9 . I t i s e a s i l y seen t h a t

s o t h a t a v a r i a b l e d e n s i t y a c r o s s Pines of f o r c e produces both r a d i a l
and l a t i t u d i n a l d e r i v a t i v e s i n t h e d i f f u s i v e e q u i l i b r i u m model.
F i g u r e 39. Geometry f o r deve lop ing t h e e q u a t i o n s of i o n i z a t i o n o r i e n t e d along t h e f i e l d l i n e s .
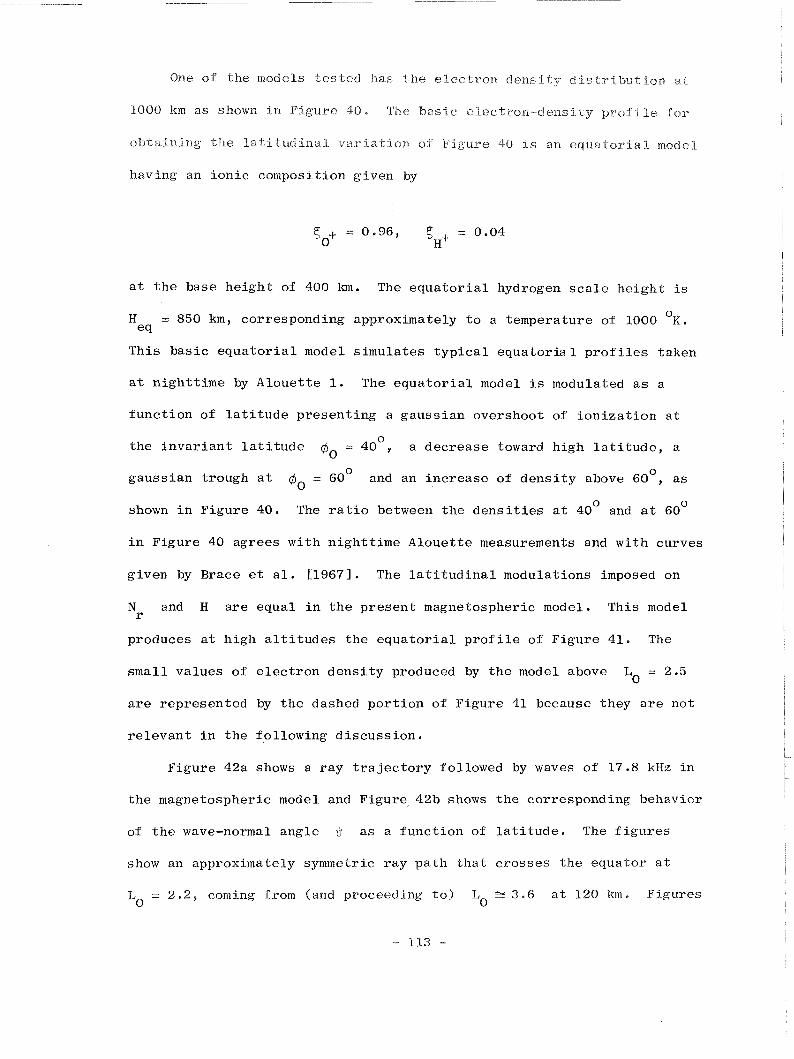
One o f the models t e s t ed has t h e e l ec t ron density distribution at
1000 km as shown in Figure 4 0 . The basic electron-density profile for
obtaining the latitudinal variation of Figure 40 i s an equatorial model
having an i o n i c composition g iven by
a t t h e base h e i g h t of 400 km. The e q u a t o r i a l hydrogen s c a l e he igh t is
0 H = 850 km, corresponding approximately t o a temperature of 1000 K . eq
This bas i c e q u a t o r i a l model s imu la t e s t y p i c a l e q u a t o r i a l p r o f i l e s taken
a t n igh t t ime by Aloue t t e 1. The e q u a t o r i a l model is modulated a s a
f u n c t i o n of l a t i t u d e p re sen t ing a gauss ian overshoot of i o n i z a t i o n a t
Go = 40 0
the i n v a r i a n t l a t i t u d e a decrease toward high l a t i t u d e , a
0 gauss ian t rough a t @ = 60' and an i nc rease of d e n s i t y above 60 , a s
0 0
shown i n F igure 40. The r a t i o between t h e d e n s i t i e s a t 40 and a t 60°
i n F igure 40 agrees w i th n igh t t ime Aloue t t e measurements and w i t h curves
g iven by Brace e t a l . C19671. The l a t i t u d i n a l modulations imposed on
Nr and H a r e equa l i n t h e p re sen t magnetospheric model. This model
produces a t h igh a l t i t u d e s t h e e q u a t o r i a l p r o f i l e of F igure 41. The
sma l l va lues of e l e c t r o n d e n s i t y produced by t h e model above L = 2.5 0
a r e represen ted by t h e dashed p o r t i o n of F igure 41 because they a r e not
r e l e v a n t i n t h e fo l lowing d i s c u s s i o n .
F igure 42a shows a r a y t r a j e c t o r y followed by waves of 17.8 kHz i n
t h e magnetospheric model and F igure 42b shows t h e corresponding behavior
of t h e wave-normal ang le a s a func t ion of l a t i t u d e . The f i g u r e s
show an approximately symmetric r ay p a t h t h a t c ros se s t h e equa tor a t
L = 2 . 2 , coming from (and proceeding t o ) L z 3 .6 a t 120 k m . Figures 0 0


P I-'
3 iJ. 0 0 a 3 (D p. I-' N . II,
t-t P. 0 s +a Y 0 t-h c". b' (D
t-t P (D

F i g u r e 42a. R a y - t r a j e c t o r y f o r 17.8 kHz waves t h a t s t a r t w i t h v e r t i c a l wave-normal a t 120 km h e i g h t and a t 58O l a t i t u d e . The magnetospher ic model i n c l u d e s t h e e l e c t r o n d i s t r i b u t i o n of F i g u r e s 40 and 4 1 and a c e n t e r e d d i p o l e f o r t h e geomagnetic f i e l d whose gyrofrequency a t t h e e q u a t o r is 870 kHz on t h e ground l e v e l .


4 2 a , h reproduce all t h e requirernexats ~ n ~ p o s e d by the rneasurenzerrts whose
p r o p e r t i e s have been deduced i n t h e l a s t s e c t i o n . Observe, f o r example
d$ /d t i n F igure 42b and t h e wave normal progress ion in Figure 42a
r ep re sen t ed by t h e d i r e c t i o n of arrows placed a t some po in t s of t h e r a y
t r a j e c t o r y ( t hey fo l low t h e p a t t e r n p red i c t ed p rev ious ly ) . Figure 42a
a l s o shows t h e r e f r a c t i v e index s u r f a c e and t h e geomet r ica l r e l a t i o n s h i p
between t h e r e f r a c t i v e index and t h e d i r e c t i o n of t h e r ay a t an
a r b i t r a r y p o i n t of t h e r a y pa th i n t h e conjuga te hemisphere. This
geomet r ica l r e l a t i o n s h i p emphasizes t h e mechanism by which t h e r ay
r e t u r n s t o h igher L s h e l l s . The r e f r a c t i v e index s u r f a c e of Figure 42a
i l l u s t r a t e s another very important p o i n t , namely t h a t t h e d i f f e r e n c e
between t h e walking-trace behavior and "small-dispers ionn behavior i s
c h a r a c t e r i z e d by g r a d i e n t s t h a t permit o r do not permit t h e angle 1 ~ 1 t o become g r e a t e r t han The angle q m
i s determined by t h e ang le
$ f o r which t h e component of t h e r e f r a c t i v e index vec to r a long t h e
magnetic f i e l d i s minimum, i . e . ,
For t h e d e n s i t y g r a d i e n t s gene ra l l y found (N decreases w i th h e i g h t )
t h e angles +$m s e p a r a t e t h r e e d i s t i n c t reg ions of ray behavior:
1. I f $ becomes g r e a t e r than a t any po in t of t h e ray pa th
t hen w i l l con t inue t o i n c r e a s e toward t h e resonance cone
from t h i s po in t on. The r a y may o r may not r e t u r n t o ground.
This s i t u a t i o n would occur f o r extremely l a r g e l a t i t u d i n a l
g r a d i e n t s : t h e upgoing wave normal would bend r a p i d l y toward t h e
equa to r , would become g r e a t e r than 1 , and from t h i s In
p o i n t on t h e r a y would t r a v e l t o high L va lues wi th t he wave
normal a t tached t o t h e resonance cone. I t can be shown t h a t
t h e wave w i l l t hen s u f f e r a defocusing e f f e c t above t h e he igh t

where t h e frequency of t he wave i s g r e a t e r than ha l f t h e gyro-
f r e q u e n c y . The r a y may r e t u r n t o ground i f $ > $ occurs i n
t h e downcoming s e c t i o n of t h e r a y pa th ,
2 . For / $ I < du r ing t h e whole ray path t h e doivncorning r a y
may r each t h e o r e t i c a l l y any l a t i t u d e i n t h e conjuga te r eg ion .
The de l ay t i m e f o r t h e e n t i r e pa th is comparable t o c a l c u l a t e d
de l ays supposing l o n g i t u d i n a l propagat ion. We d e f i n e t h i s a s
t h e pro- longi tud ina l mode of propagat ion (PL-mode) because
wave normals i n s i d e t h e cone def ined by 14 1 = 1 lm 1 produce
r a y t r a j e c t o r i e s and/or t r a v e l t imes t h a t a r e s i m i l a r t o
c h a r a c t e r i s t i c s g iven by pure ly l ong i tud ina l propagat ion.
3 . I f -$ becomes g r e a t e r than -qm a t any p o i n t of t h e r ay
p a t h then , aga in , - w i l l r a p i d l y i nc rease toward t h e
resonance cone and t h e r a y w i l l p r e sen t t h e p r o p e r t i e s of t h e
walking-trace mode of propaga t ion : very l a r g e de l ay t i m e and
very l a r g e r e f r a c t i v e index i n a r e s t r i c t e d r eg ion of observa-
t i o n a t mid l a t i t u d e s ( s e e Walter and Angerami C19691).
I f s t a r t e d w i t h a smooth magnetosphere where g r a d i e n t s of e l e c t r o n
d e n s i t y a r e p rog re s s ive ly introduced i n t h e u sua l ly observed d i r e c t i o n s ,
t h e walking-trace mode of propagat ion w i l l be exc i t ed f i r s t . Above a
c e r t a i n l e v e l of g r a d i e n t s , t h e PL-mode is introduced and it may be
observed f o r a wide range of cond i t i ons . F i n a l l y f o r extremely l a r g e
g r a d i e n t s , which a r e probably u n r e a l i s t i c f o r t h e r e a l magnetosphere,
t h e mode d iscussed i n 1 ($ > am) w i l l then be e x c i t e d . The term
"grad ien t" is used he re i n a broad sense because t h e g r a d i e n t s of e l e c t r o n
d e n s i t y may be completely d i f f e r e n t a t d i f f e r e n t po in t s of t h e magneto-
sphe re r e s u l t i n g i n complex cond i t i ons f o r e x c i t i n g t h e above modes of
p ropaga t ion . I n f a c t some modes of propagat ion may c o e x i s t i n a model
magnetosphere, depending on t h e p l a c e and t h e i n t e n s i t y of t h e e l e c t r o n -
d e n s i t y g r a d i e n t s , as we l l as on t h e frequency, i n i t i a l angle between
t h e wave normal and t h e v e r t i c a l , and the l a t i t u d e where t h e waves s t a r t .
- 119 -

\Ye r e t u r n now to Lhe rlrrrnerji c a l s t u d y of Lhe rnadel magnetosphere
which produced t h e r a y behavior of Figures 42a, b. For waves of 17,8 kHz
s t a r t i n g a t any no r the rn La t i t ude , F igure 43 g ives t h e corresponding
a r r i v a l l a t i t u d e a t 500 km i n t h e southern hemisphere ( l e f t s i d e of
F igure 43) as w e l l a s t h e r e l a t e d t r a v e l time f o r t he se rays ( r i g h t s i d e
of F igure 43) . The maximum input l a t i t u d e of F igure 43 is s l i g h t l y
sma l l e r than 60° which corresponds t o t h e p o s i t i o n of t h e h igh - l a t i t ude
0 t rough of F igure 40. Waves s t a r t i n g above 60 a r e d i s regarded because
t hey w i l l encounter e l ec t ron -dens i ty g r a d i e n t s which suppor t t h e walking-
t r a c e mode of propaga t ion beginning a t low a l t i t u d e s . Consequently t h e s e
r a y s t r a v e l t o very h igh a l t i t u d e s w i th t h e wave normal a t t h e resonance
cone and t h e r e f o r e w i t h very l a r g e r e f r a c t i v e index. This impl ies an
enhancement of c o l l i s i o n a l absorp t ion . The r e s u l t i s t h a t t h e i n t e g r a t e d
abso rp t ion over a long pa th i s extremely h igh and t h e s e r ays a r e i n f a c t
absorbed by the medium.
0 For i npu t l a t i t u d e s between 0 and 35O Figure 43 shows t h a t t h e
t r a v e l t i m e and t h e a r r i v a l l a t i t u d e a t t h e conjuga te hemisphere a r e
both monotonically i nc reas ing f u n c t i o n s . The f l a t r e g i o n f o r t h e a r r i v a l
0 l a t i t u d e t h a t occurs around 10 of input l a t i t u d e denotes a defocusing
r eg ion and has been f u l l y d i scussed i n Chapter 4 .
0 0 For i npu t l a t i t u d e s between - 35 and - 45 , t h e peak of i o n i z a t i o n
t h a t occurs a long t h e mid - l a t i t ude f i e l d l i n e s performs l i k e a very wide
d u c t . Depending on t h e l a t i t u d e of e x c i t a t i o n t h e upgoing r ays w i l l
m e e t g r a d i e n t s a t t h e t op of t h e pa th which correspond t o t h e c e n t e r o r
t o t h e s i d e s of t h e d u c t . The r e s u l t is t h e wiggly behavior of the
l a t i t u d e where t h e r ays w i l l be observed f o r i npu t l a t i t u d e s varying
0 from 35O t o - 45 .

l NPUT
f = 17.8 kHz LATITUDE, h= 120 km
ARRIVAL LATITUDE, h=500 km TRAVEL TIME, ms
Figure 43. A r r i v a l l a t i t u d e and corresponding t r a v e l t imes f o r waves of 17.8 kHz a s a f u n c t i o n of t h e input l a t i t u d e i n t h e nor thern hemisphere.

0 0 For i n p u t ' l a t i t r i d e s hetiveers - 45 a r ~ d 60 t h o n e g a t i v e Z a t a t u d i n a l
g r a d i e n t of e l e c t r o n d e n s i t y d i sp layed i n F igure 40 performs i n t he way
prev ious ly deduced and provides r a y s t h a t reach h igher L va lues f o r
i nc reas ing va lues of input l a t i t u d e u n t i l a cu to f f occurs a t E = 4.0
a f t e r which t h e a r r i v a l l a t i t u d e decreases aga in . That c u t o f f , i n t h i s
p a r t i c u l a r ca se , i s caused by t h e s t e e p g r a d i e n t of e l e c t r o n dens i ty a t
t h e plasmapause. F igure 44 shows t h e d e t a i l s of t h e l a s t p o r t i o n of t h e
r a y t r a j e c t o r y which produces t h e above cu to f f f o r t he downcoming waves
of NAA i n t h e sou the rn hemisphere. Arrows i n d i c a t e t h e d i r e c t i o n s of
t h e wave normal pushing t h e r ay toward t h e plasmapause s h e l l a t L = 4. 0
Af te r reaching t h e plasmapause t h e r ay d e v i a t e s inward t o lower L va lues
because of t h e e l eva t ed l o c a l g r a d i e n t s of e l e c t r o n d e n s i t y ($ becomes
p o s i t i v e ) . Rays s t a r t i n g i n t h e no r the rn hemisphere a t l a t i t u d e s h ighe r
than t h e i npu t l a t i t u d e of t h e above cu to f f ray change t h e s i g n of $
from nega t ive t o p o s i t i v e a t h ighe r a l t i t u d e s a t L < 4 and a r r i v e a t 0 -
t h e r e c e i v i n g he igh t of 500 km a t lower l a t i t u d e s a s d i sp layed i n F igure
43. C lea r ly t h e mechanism of cu to f f is r e l a t e d t o t h e p o s i t i o n where
passes through ze ro which i n t u r n is r e l a t e d t o t h e g r a d i e n t s of
i o n i z a t i o n met by t h e ray du r ing i ts progress ion . Therefore t h e h igh
l a t i t u d e cu to f f i n t h e hemisphere conjuga te t o t h e t r a n s m i t t e r may occur
a t t h e plasmapause, a s i n t h e p re sen t magnetospheric model, but i t may
a l s o be caused by t h e e x i s t i n g g r a d i e n t s i n s i d e t h e plasmasphere i n
which c a s e no connect ion would e x i s t between t h e cu to f f l a t i t u d e and
t h e plasmapause p o s i t i o n , This po in t w i l l be pursued f u r t h e r i n t h e
a n a l y s i s of w h i s t l e r s rece ived a t t h e downcoming end of t h e t r a j e c t o r y
(Chapter 5 ) . F igure 43 d i s p l a y s a l l t h e f e a t u r e s of n igh t t ime s a t e l l i t e
measurements we were looking f o r , namely:
- 122 -

F i g u r e 44. D e t a i l s of t h e l a s t descend ing p a r t of t h e r a y t h a t p roduces t h e h i g h - l a t i t u d e c u t o f f o f NAB waves. A t L = 4 t h e r e i s a s t e e p g r a d i e n t
0 of i o n i z a t i o n c o r r e s p o n d i n g t o t h e plasmapause boundary.

1 * e q u a t o r i a l def ocusing.
2 , enhancement of t h e s i g n a l i n t h e conjuga te reg ion: F igure 43
shows the southern ionosphere corresponding t o t h e conjuga te
r eg ion of NAA, mapped by rays coming from t h e neighborhood of
t h e t r a n s m i t t e r i n t h e no r the rn ionosphere. Therefore , a s
s a t u r a t i o n normally occurs i n a r eg ion surrounding NAA w e should
a l s o observe s a t u r a t i o n i n t h e conjuga te r eg ion .
3 . h igh l a t i t u d e cu to f f i n t h e conjuga te reg ion .
E . CONCLUSIONS
I n t h e p r e s e n t work emphasis has been placed upon t h e importance
of t h e l a t i t u d i n a l g r a d i e n t s of e l e c t r o n d e n s i t y f o r t h e propagat ion of
VLF waves i n t h e magnetosphere. In f a c t a new theory of VLF propaga t ion
( t h e PL-mode) has been der ived from t h e d i s cus s ion . Propagat ion i n a
model magnetosphere inc luding l a t i t u d i n a l g r a d i e n t s of i o n i z a t i o n
j u s t i f i e s a l l t h e f e a t u r e s presented by t y p i c a l OGO-4 records of magnetic
f i e l d ampli tude from s i g n a l s generated on t h e ground by VLF t r a n s m i t t e r s
du r ing n ight t ime. For daytime t h e t rend of i nc reas ing i o n i z a t i o n toward
low l a t i t u d e s i s maintained ( s ee Brace e t a l . , C19671; Reddy e t a l . ,
C19671) and t h e r e f o r e t h e same kind of propagat ion is expected t o
dominate i n t h e magnetosphere.
Seve ra l new phenomena r e l a t e d t o t h e PL-mode of propagat ion w i l l
be d i scussed i n Chapter 5.

V. THE PRO-1,ONGITllaINAL MODE OF WHISTLER PROPi?f;ATION ---- -------------
A. INTRODUCTION
Having examined t h e p r i n c i p a l propagat ion e f f e c t s of cross-f i e l d
g r a d i e n t s of e l e c t r o n d e n s i t y , on w h i s t l e r mode waves of 17.8 kHz, i t
is proposed t o examine t h e e f f e c t s t he se g r a d i e n t s may have i n o t h e r
p a r t s of t h e w h i s t l e r spectrum. I t w i l l be seen t h a t t h e PL-mode,
cha rac t e r i zed by propagat ion wi th t h e wave normal i n s i d e t h e cone -{-
- J i , around t h e geomagnetic f i e l d , i s a s t a b l e mode of propagat ion i n t h e
s ense t h a t it can be exc i t ed f o r a broad v a r i e t y of magnetospheric
models and wave f r equenc i e s . I t i s bel ieved t h a t t h e fol lowing d i s c u s s i o n ,
n e c e s s a r i l y s h o r t , i s t h e beginning of much f u t u r e work i n w h i s t l e r
r e s e a r c h because t h e PL-mode seems t o be t h e most n a t u r a l l y occu r r ing
mode of propagat ion i n t h e magnetosphere. For example, t h e PL-mode
w i l l supply t h e d i s p e r s i o n i n t e r p r e t a t i o n of w h i s t l e r s t h a t a r e rece ived
almost cont inuous ly by low-a l t i tude po l a r o r b i t i n g s a t e l l i t e s . The PL-
mode a l s o provides a p o s s i b l e i n t e r p r e t a t i o n f o r c e r t a i n w h i s t l e r s
rece ived on t h e ground.
I n t h e fo l lowing d i scus s ion we w i l l p r e sen t some p r o p e r t i e s of t h e
PL-mode of w h i s t l e r propgat ion based on t h e model magnetosphere t h a t
has been employed i n t h e prev ious s e c t i o n . I t i s understood t h a t some
of t h e propagat ion f e a t u r e s provided by t h a t model a r e n o t n e c e s s a r i l y
of c h a r a c t e r , but may be a f e a t u r e suppl ied by t h e p a r t i c u l a r
model magnetosphere. Again, only t h e e f f e c t s of e l e c t r o n s is cons idered .
B. HIGH-LATITUDE CUTOFF I N THE OCCURRENCE OF WHISTLERS
Figure 45 shows t h e mapping of t h e southern hemisphere ionosphere
by w h i s t l e r f r equenc i e s whose l i g h t n i n g sources o r ig ina t ed i n t h e no r the rn
- 125 -


hemisphere. A r r i v a l IS t i t u d e of u r h i q t l e r -waves a? a receivi i ~ g h e i g i i t
of 120 krn is p l o t t e d as a f unc t ion of t h e i npu t l a t i t u d e f o r t h e range
45' t o 60' i n t h e nor thern hemisphere. The curves of Figure 45 a r e
paramet r ic i n f requency and i l l u s t r a t e s e v e r a l f e a t u r e s . A gene ra l
f e a t u r e of F igu re 45 is t h a t a t a f i xed frequency each s i n g l e downcoming
w h i s t l e r r ece ived a t a s p e c i f i e d l a t i t u d e u sua l ly comes from more t han
one p o i n t i n t h e conjuga te hemisphere. For example, a 500 km o r b i t i n g
0 s a t e l l i t e a t -50 l a t i t u d e would r e c e i v e a 1 kHz downcoming wave t h a t
0 s t a r t e d i n t h e n o r t h e r n hemisphere a t 46.2 and 5 1 . 8 ~ l a t i t u d e ( s l i g h t l y
d i f f e r e n t va lues a r e shown i n F igure 45 where t h e r ece iv ing he igh t is
120 km). Observe next how t h e curves change when t h e frequency inc reases
consecut ive ly from 1 t o 20 k H z : t h e a r r i v a l l a t i t u d e decreases when t h e
0 0 inpu t l a t i t u d e v a r i e s from 50 t o 60 a t low f r equenc i e s and has a
reversed behavior a t h igher f r equenc i e s . The d i s s i m i l a r i t i e s i n t h e
r a y pa ths presen ted a t d i f f e r e n t f r equenc i e s a r e r e l a t e d t o t h e frequency
dependent i n t e g r a t e d e f f e c t of magnetospheric g r a d i e n t s upon t h e wave
normal dur ing t h e r ay progress ion . A mathematical t rea tment of ray
behavior as a f u n c t i o n of frequency and e l ec t ron -dens i ty g r a d i e n t s i s
d i f f i c u l t and beyond t h e scope of t h e p re sen t work.
F igu re 45 a l s o d i s p l a y s a maximum l a t i t u d e of observa t ion f o r each
frequency and t h e r e f o r e p r e d i c t s a h i g h - l a t i t u d e cu to f f i n t he occurrence
of downcoming w h i s t l e r s . For example, t h e h i g h e s t l a t i t u d e s where
w h i s t l e r waves of 1, 5 , and 10 k H z could be observed would be r e s p e c t i v e l y
0 0 0 -53.6 , -58.2 , and -59.0 f o r t h e p a r t i c u l a r model magnetosphere used.
An important f a c t about t h e h igh - l a t i t ude cu to f f i s t h a t t h e cu tof f may
be " n a t u r a l , " i . e . , caused by t h e e x i s t i n g g r a d i e n t s i n s i d e t h e plasma-
sphere , o r i t may be caused by t h e high g r a d i e n t s a t t h e plasmapause
- 127 -
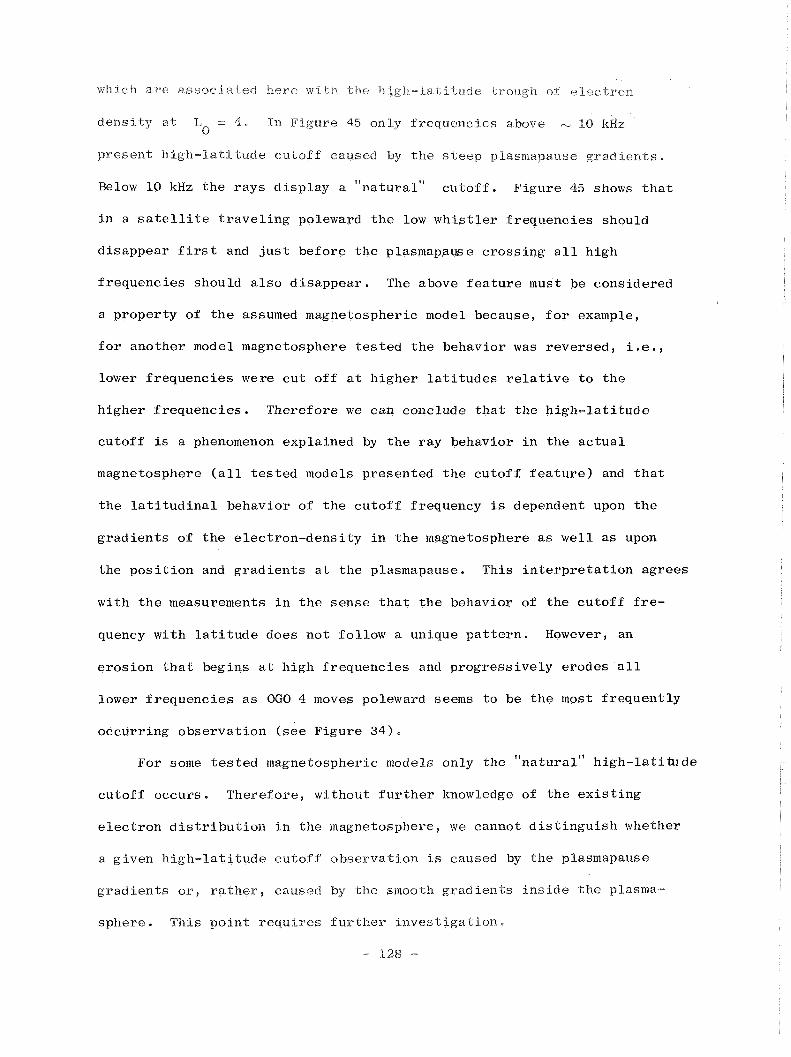
which a r e associated Iaese w i b h t h e h i g h - l a t i t r r d e t rough of e l e c t r o n
der ls i ty a t L = 4 , In Figure 45 on ly f requenc ies above - 10 kHz 0
presen t h i g h - l a t i t u d e cu tof f caused by t h e s t e e p plasmapause g r a d i e n t s .
Below 10 kHz t h e r a y s d i s p l a y a "na tu ra l " c u t o f f . F igure 45 shows t h a t
i n a s a t e l l i t e t r a v e l i n g poleward t h e low w h i s t l e r f r equenc i e s should
d i sappear f i r s t and j u s t before t h e plasmapause c ros s ing a l l h igh
f r equenc i e s should a l s o d i s appea r . The above f e a t u r e must be considered
a p rope r ty of t h e assumed magnetospheric model because, f o r example,
f o r another model magnetosphere t e s t e d t h e behavior was r eve r sed , i . e . ,
lower f r equenc i e s were c u t o f f a t h igher l a t i t u d e s r e l a t i v e t o t h e
h igher f r equenc i e s . Therefore w e can conclude t h a t t h e h i g h - l a t i t u d e
cu tof f i s a phenomenon explained by t h e r ay behavior i n t h e a c t u a l
magnetosphere ( a l l t e s t e d models presented t h e cu to f f f e a t u r e ) and t h a t
t h e l a t i t u d i n a l behavior of t h e cu to f f frequency is dependent upon t h e
g r a d i e n t s of t h e e l ec t ron -dens i ty i n t h e magnetosphere a s w e l l a s upon
t h e p o s i t i o n and g r a d i e n t s a t t h e plasmapause. This i n t e r p r e t a t i o n agrees
wi th t h e measurements i n t h e sense t h a t t h e behavior of t h e cu to f f f r e -
quency wi th l a t i t u d e does n o t fo l low a unique p a t t e r n . However, an
e ros ion t h a t begins a t h igh f r equenc i e s and p rog re s s ive ly erodes a l l
lower f r equenc i e s a s OGO 4 moves poleward seems t o be t h e most f r equen t ly
occur r ing obse rva t ion ( s ee F igure 34 ) .
For some t e s t e d magnetospheric models only t h e "na tu ra l r ' h i g h - l a t i t u d e
cu to f f occurs . Therefore , without f u r t h e r knowledge of t h e e x i s t i n g
e l e c t r o n d i s t r i b u t i o n i n t h e magnetosphere, we cannot d i s t i n g u i s h whether
a g iven h i g h - l a t i t u d e cu to f f observa t ion is caused by t h e plasmapause
g r a d i e n t s o r , r a t h e r , caused by the smooth g r a d i e n t s i n s i d e t h e plasma-
sphere . This p o i n t r e q u i r e s f u r t h e r i n v e s t i g a t i o n ,
- 128 -

C . WHISTLERS WITH UTITUZ)E-IMDFPmDENT TTME-DEUU
F i g u r e 46 shows the t i m e s p e n t by e a c h w h i s t l e r f r equency ene rgy
t o t r a v e l from t h e n o r t h e r n l iemisphere t o a r e c e i v i n g he igh t o f 500 km
i n t h e southern hemisphere a s a func t ion of t h e a r r i v a l l a t i t u d e . Arrows
i n each curve show how t h e i npu t l a t i t u d e progresses between 45' and 60°
i n t h e no r the rn hemisphere f o r each frequency. For example, t he curve
0 f o r 2.5 kHz shows an almost cons t an t de lay t ime between -45 and t h e
0 0 cu to f f l a t i t u d e -54.5 when t h e i npu t l a t i t u d e v a r i e s from 45 t o 4g0
( a s s een i n F igure 45) and shows s l i g h t l y sma l l e r de l ay t imes f o r input
l a t i t u d e s between 4g0 and 60°.
F igure 46 d i s p l a y s t h e ou ts tanding phenomenon of an almost cons t an t
t i m e de l ay f o r w h i s t l e r s a s a f u n c t i o n of l a t i t u d e as denoted by n e a r l y
h o r i z o n t a l curves . I t shows a l s o t h a t f o r a c e r t a i n range of l a t i t u d e s
it should be p o s s i b l e t o observe two d i s t i n c t w h i s t l e r t r a c e s a t h igh
f r equenc i e s and t h a t t h e t r a c e s should converge a t low f r equenc i e s .
F igure 47 shows t h e frequency-time spectrogram of t h i s "gemini" (or
"hook") w h i s t l e r t h a t should be received by a 500 km s a t e l l i t e a t -52O
l a t i t u d e .
The above double- t race "hook" w h i s t l e r , whose d i s t i n c t t r a c e s
converge a t low f r equenc i e s , was f i r s t r epo r t ed by Gurnet t e t a l . ,
[1966]. The exp lana t ion of t h e "hook" w h i s t l e r given by Shawhan [19661
assumes t h a t f o r a g iven inpu t l a t i t u d e two d i f f e r e n t wave-normal d i r e c t i o n s
may produce two d i s t i n c t r a y s t h a t would p re sen t a c ros s ing p o i n t i n t h e
oppos i t e hemisphere a t t h e s a t e l l i t e . There a r e t h r e e s t r o n g ob jec t ions
t o t h e above i n t e r p r e t a t i o n :
1. The exp lana t ion is based on the p o s s i b i l i t y of wave s c a t t e r i n g
i n t h e E r eg ion of t h e ionosphere which i s u n l i k e l y t o occur

0 Q) V )
ti- z - I- > Q 4 W 0
-45" -50' - 55" -60° ARRIVAL LATITUDE, h = 5 O O krn
F i g u r e 46. T r a v e l t i m e s a s a f u n c t i o n o f t h e r e c e i v i n g l a t i t u d e s . Arrows i n e a c h c u r v e show how t h e i n p u t l a t i t u d e p r o - g r e s s e s between 45O and 60' i n t h e n o r t h e r n hemisphe re f o r e a c h f r e q u e n c y .

WHISTLER RECEIVED AT 52'
2 2c
C
> 0 z W
i? k!5 LL
0 0.5 1 .O 1.5
DELAY TIME, sec
F i g u r e 47. P r e d i c t e d "hookt' w h i s t l e r t o be r e c e i v e d 0
a t 500 k m h e i g h t and a t -52 l a t i t u d e .

for. VI .3 w a v e s . Fur thernaorc?, this interpretation rvou l d require
E reg ion s c a t t e r i n g cont inuously f o r some thousand k i lometers
because hook w h i s t l e r s a r e e a s i l y observed dur ing 18 - 15 degrees of N O - 4 passes a t mid l a t i t u d e s ,
2. The ray pa ths produced by t h e r ay - t r ac ing technique of t h e above
r e p o r t [Shawhan, 1966 1 pred ic t ed he igh t s and l a t i t u d e s of
observa t ions completely d i f f e r e n t from t h e measurements.
3 . The PL-mode of propagat ion, based simply on r e a l i s t i c p r o f i l e s
of i o n i z a t i o n , shows t h a t t h e hook w h i s t l e r is caused by
r e c e p t i o n a t a s i n g l e l a t i t u d e of two wave packets coming from
d i s t i n c t e n t r y p o i n t s i n t h e hemisphere of t h e source .
The h i g h - l a t i t u d e cu to f f i n t h e occurrence of w h i s t l e r s , t h e l a t i -
t u d i n a l l y cons t an t de l ay t i m e f o r w h i s t l e r s and t h e hook w h i s t l e r a r e t h e
most impressive r e s u l t s explained by t h e p re sen t s imple theory of w h i s t l e r
p ropaga t ion . A l l t h e s e f e a t u r e s a r e exh ib i t ed i n t h e frequency-time
spectrograms of F igu re 34 where cons t an t de l ay time w h i s t l e r s a r e seen
fol lowed by twin convergent t r a c e s , between L =r 2.4 and L 1 3.9.
F igure 48 shows expanded p i eces of t h e record d i sp layed i n F igure 34
around p o i n t s 1, 2 , and 3 i n o rde r t o show t h e d e t a i l s of some hook
w h i s t l e r s of F igure 34.
The spectrograms of F igure 34 show a high l a t i t u d e cu to f f e f f e c t
i n a form of e r o s i o n w i t h t h e d i sappearance of t h e h igh f requenc ies
of w h i s t l e r s s t a r t i n g a t L =r 3 .9 . This is followed by t h e g radua l
vanishing of lower w h i s t l e r f r equenc i e s u n t i l L Y 4.8 where no more
downcoming w h i s t l e r f r equenc i e s a r e r ece ived .
The p red i c t ed constant-delay t ime w h i s t l e r seems t o be a g e n e r a l
f e a t u r e of t h e a c t u a l magnetosphere because t h a t p roper ty has been
genera ted by s e v e r a l d i f f e r e n t magnetospheric models. On t h e o t h e r
hand t h e two d i f f e r e n t de l ay t i m e s p red ic ted f o r t h e h igh f r equenc i e s
- 132 -

.. Pieces of the OGO-4 record displayed in Figure 34. The frequency-time spectrum from 0 to 12.5 kHz shows several hook whistlers.

of the "hookff whistler of F l g u r e 47 may o r may n o t be o b s e r v e d * F o r
some magnetospheric models t h e d i f f e r e n c e s i n de l ay t imes a r e g r e a t e r
than t h e d i f f e r e n c e s d i sp layed i n Figure 46, f o r o t h e r models t h e d i f f e r -
ences a r e n e g l i g i b l e and the re f o r e on ly one whis t ler t r a c e should be
observed. Never the less , t h e important p roper ty t h a t has been generated
by a l l magnetospheric models is t h a t t h e s i g n a l s rece ived a t a given
l a t i t u d e come, i n g e n e r a l , from more than one l a t i t u d e i n t h e conjuga te
hemisphere, and t h a t t h e de l ay times f o r t h e d i f f e r e n t t r a j e c t o r i e s a r e
i n g e n e r a l d i f f e r e n t . The f e a t u r e of a cons t an t de l ay t ime a s a func t ion of t h e r ece iv ing
l a t i t u d e must be considered a r e s u l t of t h e i n t e r r e l a t e d behavior between
t h e r ay group v e l o c i t y and t h e l eng th of t h e pa th a t d i f f e r e n t a r r i v a l
l a t i t u d e s provided by e l ec t ron -dens i ty g r a d i e n t s . Here aga in , t h e
mathematical i n t e r p r e t a t i o n of t h e g l o b a l p r o p e r t i e s of t h e rays is
very d i f f i c u l t and i s post-poned.
D . WHISTLERS RECEIVED ON THE GROUND
The PL-mode of w h i s t l e r propagat ion a l s o provides a p o s s i b l e i n t e r -
p r e t a t i o n of some w h i s t l e r s rece ived on t h e ground. The i n t e r p r e t a t i o n
is based on t h e fo l lowing s tudy of wave-normal d i r e c t i o n f o r t h e down-
coming waves j u s t above t h e E r eg ion of t h e ionosphere. Wave t ransmiss ion
through t h e lower ionosphere and e x c i t a t i o n of propagat ing waves i n s i d e
t h e ground-ionosphere space r e q u i r e s t h a t t h e wave-normal d i r e c t i o n of
t h e downcoming r a y lies w i th in a " t ransmiss ion cone." The t ransmiss ion
cone is t h e geomet r ica l locus of t h e wave-normal d i r e c t i o n having un i ty
h o r i z o n t a l p r o j e c t i o n of t h e r e f r a c t i v e index. F igure 49 shows t h e
h o r i z o n t a l component pH of t h e r e f r a c t i v e index a t 120 krn i n t he

F i g u r e 49. H o r i z o n t a l component p of t h e r e f r a c t i v e index f o r downgoing waves i n !he s o u t h e r n hemisphere a t 120 km h e i g h t a s a f u n c t i o n of i n p u t l a t i t u d e ,

s o u t h e r n hemisphere a s a function o f thc rnput l a t a t u d c In the nor thern
hemisphere, The curves a r e paramet r ic i n f requency, The ske t ch a t t h e
bottom of F igure 49 shows t h e adopted s i g n convect ion f o r pH:
p o s i t i v e
wave-normal angles may only produce waves t r a v e l i n g southward i n t h e
a i r below, whi le nega t ive angles may only launch waves propagat ing
toward t h e equa to r . F igure 49 shows t h a t t h e PL-mode waves generated
by t h e model magnetosphere a r r i v e i n t h e conjuga te hemisphere wi th a
wide range of wave-normal d i r e c t i o n s , depending on t h e input l a t i t u d e .
Also displayed is t h e important f a c t t h a t p, c ros se s t h e l i n e H pH = 0
one of more t i m e s f o r each frequency. Thus f o r a given w h i s t l e r f r e -
quency, it is always p o s s i b l e t o f i n d a l a t i t u d e f o r which an upgoing
wave of t h a t f requency w i l l produce, i n t h e conjugate hemisphere, a
downcoming r ay whose wave normal i s v e r t i c a l a t 120 km. F igure 49 shows
t h a t t h e e x c i t a t i o n of propagat ing waves below t h e ionosphere by w h i s t l e r
mode waves should be e a s i e r below 7.5 kHz because f o r t h e s e lower f r e -
quenc ies t h e r e i s a wide range of i npu t l a t i t u d e which produces down-
coming r ays whose wave normals a r e i n s i d e t h e t ransmiss ion cone pH = -+1
a t t h e r ece iv ing end of t h e t r a j e c t o r y i n t h e conjuga te hemisphere. A t
h igher f r equenc i e s t h e range of input l a t i t u d e s i s smal le r producing
pH <-- 111 i n t h e conjuga te hemisphere (observe t h e curves f o r 10, 12.5,
and 15 kHz) . Using t h e r e s u l t s of Figure 45 and F igure 49 i t i s poss ib l e t o
d e r i v e t h e range of a r r i v a l l a t i t u d e s f o r which t h e downcoming w h i s t l e r
waves w i l i p r e sen t wave-normal d i r e c t i o n s w i th in t h e t ransmiss ion cone
= +1 a t 120 km. This is shown i n F igure 50 by h o r i z o n t a l bars which
i n d i c a t e t h e range of l a t i t u d e s where w h i s t l e r f requenc ies of 1, 2.5 , 5 ,
7.5, 10 , 12.5, and 15 kHz would p re sen t cLH < - I 11 i n t h e con juga te
- 136 -

* d a u rn 0 .A .d Vlm r G k 3-a, a, x&l + a, % a , k-G a, a, a k G r n m 3 * ad
c E rn rn a , a , r i a, r n ~ m aa, E 3 k e k * a k o .A a, c 9 N G I m X r a, r i x k >

hemisphere, The arrows in each curve of Figure 50 indicate how the
i npu t l a t i t u d e progresses i n t h e hemisphere of o r i g i n and smal l c i r c l e s
marl< t h e l a t i t u d e s where the downcoming wave normals a r e ver-cical at
120 km.
F igures 49 and 50 g i v e t h e fo l lowing new i n t e r p r e t a t i o n of w h i s t l e r s
rece ived on t h e ground: t h e g r a d i e n t s of e l e c t r o n dens i ty and magnetic
f i e l d i n t h e a c t u a l magnetosphere bend t h e wave normal of t h e upgoing
w h i s t l e r waves toward t h e equa tor producing r ays t h a t c ros s t h e equa tor
between - 2. t o 2 . 6 e a r t h r a d i i and a r r i v e i n t h e conjugate hemisphere
w i th wave normals t h a t a r e i n s i d e t h e t ransmiss ion cone f o r a wide range
of cond i t i ons . These f i g u r e s a l s o sugges t t h a t a high-frequency cu to f f
f o r t h e w h i s t l e r rece ived on t h e ground is caused by c o n t r a c t i o n of t h e
range of i npu t and ou tpu t l a t i t u d e s which provide pH <- ! 11 i n t h e
E r eg ion a t t h e r e c e i v i n g end of t h e t r a j e c t o r y . For example, i f a
0 l i g h t n i n g f l a s h occurs a t 50 N , F igure 49 shows t h a t t h e 12.5 kHz wave
component should t r a v e l approximately 800 km northward before being
launched i n t h e w h i s t l e r medium a t t h e convenient l a t i t u d e of - 5 8 O ~
which would provide = 0 i n t h e conjuga te hemisphere. Therefore VH -
t h i s 12.5 kHz w h i s t l e r component would be much weaker than t h e ground
rece ived lower f r equenc i e s because of t h e fo l lowing f a c t o r s :
1. Great d i s t a n c e t r a v e l e d w i th l/r v a r i a t i o n . For example a
wave t h a t t r a v e l s 800 km before reaching t h e ionosphere is
a t t enua t ed 20 d b more than another wave t h a t only t r a v e l s
80 km u n t i l s t r i k i n g t h e bottom of t h e ionosphere.
2. Smaller t ransmiss ion c o e f f i c i e n t i n t h e lower ionosphere caused
by l a r g e ang le between t h e v e r t i c a l and t h e i nc iden t wave 0
normal (about 82 ), ( s ee , f o r example, Chapter 2 ) .
3 . Fur the r defocusing of t h e r ays a t t h e r ece iv ing end of t h e

0 trajectory where the downcorning power flux c o n t a i ~ ~ e d in 1,s of
latitude (see Figure 5 0 ) is dispersed i n a 1 1 d i r e c t i o n s i n s i d e
the ear th- ionosphere space .
Hence, a ground r e c e i v e r should d e t e c t w h i s t l e r s whose cu to f f f r e -
quencies a r e r e l a t e d t o t h e l o c a t i o n s of t h e two ends of t he r ay t r a j e c t o r y
i n t h e magnetosphere i n a d d i t i o n t o t h e l o c a t i o n where t h e corresponding
l i g h t n i n g f l a s h occurs .
A s der ived i n Sec t ion C of t h i s chap te r , t h e PL-mode w h i s t l e r
resembles w h i s t l e r s t h a t fo l l ow t h e Eckersley dispers ion-law ( see
H e l l i w e l l 119651, Chapter 3 ) . For a l l magnetospheric models t e s t e d , no
nose frequency has been genera ted by t h e PL-mode f o r w h i s t l e r f r equenc i e s
below 20 kHz. The absence of nose frequency comes from t h e f a c t t h a t t h e
PL-mode waves c r o s s t h e equa tor a t r e l a t i v e l y low h e i g h t s . This means
t h e wave f r equenc i e s below 20 kHz a r e always much sma l l e r than t h e mini-
mum gyrofrequency along t h e r ay t r a j e c t o r y . However, f o r t h e e x c i t a t i o n
of nose w h i s t l e r s under cond i t i ons of PL propagat ion i t is necessary
t h a t f be compariable t o f H a t some r eg ion along t h e ray . Therefore ,
t h e PL-mode does n o t gene ra t e nose w h i s t l e r s .
When d e t e c t i n g Eckersley-type w h i s t l e r s on t h e ground ( s i n g l e
w h i s t l e r , long echo t r a i n of w h i s t l e r s , o r w h i s t l e r followed by t r a i n
of nose w h i s t l e r s ) t h e ques t i on w i l l a r i s e whether t h e w h i s t l e r i s
ducted or i s a PL w h i s t l e r . No d e f i n i t e answer can be g iven a t t h i s
t ime because no measurements have been planned f o r t h i s purpose. One
method of recogniz ing t h e PL-mode w h i s t l e r would be by t h e use of a
d i r e c t i o n f i n d e r f o r w h i s t l e r f r equenc i e s . I f i t is a PL-mode w h i s t l e r ,
t h e d i r e c t i o n of a r r i v a l f o r d i f f e r e n t f requenc ies w i l l be d i f f e r e n t ,
a s i n f e r r e d from Figure 50.

E , CONGLUS SONS
Ray t r a j ec t o r i e s i n s i d e a ''real.'' tnagnetosphere i ne Puding a plasma-
pause b u n d a r y and e l e c t r o n d e n s i t y g r a d i e n t s , such a s those measured
by Brace e t a l . [I9671 lead t o t h e PL-mode of VLF p ropaga t ion . The PL-
mode is cha rac t e r i zed by propagat ion wi th t h e wave normal i n s i d e a cone
f $ m r e l a t i v e t o t h e e a r t h ' s magnetic f i e l d . I t has been shown t h a t
t h e PL-mode j u s t i f i e s a t once s e v e r a l f e a t u r e s r e g u l a r l y observed wi th
t h e OGO-4 s a t e l l i t e . Because s o many e f f e c t s a r e connected by a common
cause, namely t h e PL-mode of propagat ion, we conclude t h a t t h e r e a l
magnetosphere cannot be very d i f f e r e n t i n shape from the model magneto-
sphere used i n t h e p re sen t s tudy . These phenomena r e p r e s e n t a p o t e n t i a l
t o o l f o r measuring e l e c t r o n d e n s i t y d i s t r i b u t i o n s i n t h e magnetosphere
based on w h i s t l e r s observed w i t h p o l a r s a t e l l i t e s . For example, f o r
matching d e l a y t imes , l a t i t u d e of obse rva t ions , and m u l t i p l e t r a c e s of
w h i s t l e r s from low t o h igh l a t i t u d e measurements i t would be necessary
t o use a r ay - t r ac ing computer program wi th a s tandard magnetosphere
model which should be s u i t a b l y changed a t c e r t a i n p o i n t s i n o rde r t o
match a l l of t h e d a t a . Although t h e technique of r ep l ac ing e x i s t i n g
magnetospheric models by more s u i t a b l e models would be r e l a t i v e l y complex
t h e r e s u l t s should be q u i t e worthwhile. The development of t h i s technique
of magnetospheric shaping based on w h i s t l e r c h a r a c t e r i s t i c s would mean
t h a t t h e thousands of w h i s t l e r s t h a t a r e observed a t each s a t e l l i t e
r e v o l u t i o n could have important aeronomic a p p l i c a t i o n s .
Another important f e a t u r e introduced by t h e PL-mode i s a concen-
t r a t i o n of VLLF energy between - 2.0 and 2.5 e a r t h r a d i i over t h e
e q u a t o r , This phenomenon i s caused by t h e equatorward bending of t h e
wave normals produced by t h e g r a d i e n t s of i o n i z a t i o n . A s a r e s u l t a l l

t h e VLF waves lauxlched i n t h e magi~etosphere f roil? mid t o high l a t i t u d e s
i n s i d e t he plasmasphere c r o s s the equator wi th very low divergence of
power f l o w , T h i s r e s u l t may be e ~ t ~ e m e l y important i n the study of
wave-par t ic le r n t e r a c t i o n s i n t he magnetosphere,
A p roper ty a l s o important f o r t h e s tudy of wave-part ic le i n t e r a c t i o n s
is t h e r e l a t i o n s h i p between t h e de lay time and t h e wave-normal ang le $
presented by t h e PL-mode of propagat ion. Typica l ly t h e PL-mode may
p r e s e n t l a r g e angles between t h e wave normal of t h e waves and t h e geo-
magnetic f i e l d l i n e s i n t h e downcoming s e c t i o n of t h e r a y - t r a j e c t o r y
and may show a t t h e same t i m e a de lay t ime t y p i c a l of pure ly l o n g i t u d i n a l
p ropaga t ion . Therefore t h e r e s u l t i n g low va lues of phase v e l o c i t y
p ro j ec t ed along t h e f i e l d l i n e s may be t h e cause of i n t e r a c t i o n between
t h e waves and a s t ream of charged p a r t i c l e s guided by t h e geomagnetic
f i e l d . For example, emissions t r i gge red by s i g n a l s from t h e low-power
t r a n s m i t t e r of Omega (New York) have been observed by OGO 4 a t L r 4
n e a r Byrd S t a t i o n . This r e s u l t f i t s t h e p re sen t theory i n t h e sense t h a
t h e PL-mode n o t only j u s t i f i e s t h e presence of Omega f requenc ies a t high
l a t i t u d e s i n t h e conjuga te hemisphere but i t a l s o provides l a r g e wave-
normal angles $ a t t h e s e l a t i t u d e s . Furthermore, under c e r t a i n circum-
s t a n c e s t h e i n t e r a c t i n g waves could be observed on t h e ground i f t h e
g r a d i e n t s of i o n i z a t i o n were such as t o bend t h e wave normal toward t h e
v e r t i c a l i n t h e l a s t p a r t of t h e downcoming t r a j e c t o r y . Clear ly no
specu la t i on i s involved he re ; t he se a r e r e s u l t s obtained by merely
analyzing t h e r ay behavior i n t h e model magnetosphere assumed i n t h i s
work.
F i n a l l y t h e PL-mode of propagat ion can exp la in t h e f a c t t h a t w h i s t l e r
a c t i v i t y is low above L 3 a s observed by t h e OGO-3 s a t e l l i t e

( B r u c e E d g a r , p r i v a t e communication) w h i l e t h e w h i s t l e r a c t i v i t y d e t e c t e d
a t h i g h L s h e l l s (above L = 3 ) b u t aboard low a l t i t u d e s a t e l l i t e s
(060 2 , OGO 4 ) is v e r y i n t e n s e . T h i s i s e x a c t l y t h e main c h w a c t e r i s t i c
of t h e PL-mode, namely r a y t r a j e c t o r i e s t h a t c r o s s t h e equa tor a t low
a l t i t u d e s upcoming from h igh l a t i t u d e s and downgoing t o high l a t i t u d e s
i n t h e conjugate hemisphere.

A . I NTROUUCT I ON
In t h i s concluding chap te r w e d i s c u s s a c l a s s of amplitude f ad ing
t h a t has been observed on OGO 1, OGO 2 and ?low on t h e OGO-4 s a t e l l i t e .
The f ad ing occurs f o ~ upgoing waves and is g e n e r a l l y de t ec t ed c l o s e t o
VLF t r a n s m i t t e r s l oca t ed a t mid l a t i t u d e s . Heyborne C19661 repor ted
t h i s type of f ad ing from obse rva t ions w i th OGO 1 and OGO 2. He suggested
s e v e r a l f ad ing mechanisms but d e f i n i t i v e i n t e r p r e t a t i o n has n o t been
ob ta ined . Here aga in t h e above f ad ing phenomenon w i l l be t e n t a t i v e l y
i n t e r p r e t e d . These t e n t a t i v e i n t e r p r e t a t i o n s of fad ing a r e n o t completely
c o n s i s t e n t but they may s e r v e a s a gu ide f o r f u r t h e r work. For example,
we w i l l prove t h a t c e r t a i n f ad ing mechanisms a r e n o t adequate t o e x p l a i n
s p e c i f i c f e a t u r e s of fad ing observed on OGO 4 . Although t h e s e proofs
r e p r e s e n t nega t ive r e s u l t s they w i l l be va luab le when a b e t t e r i n t e r -
p r e t a t i o n of t h e phenomenon i s at tempted.
B . AMPLITUDE FADING RELATED TO PLASMAPAUSE CROSSING
Figure 51 and F igure 52 show two OGO-4 spectrograms recorded approxi-
mately under t h e same cond i t i ons on two consecut ive days, 20 and 21
September 1968. Each f i g u r e shows 4 minutes of a cont inuous record
d i sp l ayed he re i n 4 segments (one pane l f o r each minute) . The magnetic
f i e l d amplitude i n dby of NAA s i g n a l s a t 17.8 kHz a s measured by t h e
s t epp ing r e c e i v e r No. 3 and te lemetered t o ground v i a VCO is shown by
t h e upper t r a c e i n each pane l . Also shown i s t h e broadband spectrum
from 300 H z t o 12.5 kHz measured a s a f u n c t i o n of time (UT) and L value
of t h e s a t e l l i t e , The corresponding ground p r o j e c t i o n s of t h e two
OGO-4 t r a j e c t o r i e s a r e shown i n F igure 53. NAA was ope ra t i ng i n t h e FSK
- 143 -

0 (I, (I, I1
02 (I,
!2


mode of transmission, s h i f t i n g the frequency beev~een 17.80 and 79,Siii keiz,
These f r equenc i e s a r e de t ec t ed equa l ly i n s i d e t h e 500 Hz bandwidth of
t h e band 3 s t epp ing r e c e i v e r whose ou tput then d i s p l a y s a continuous
t r a c e a s shown i n F igures 51 and 52. Morse-code t ransmiss ions i n t h e
FSK mode can only be de t ec t ed by t h e phase t r a c k i n g r e c e i v e r of OGO 4
which provides about 30 d b s e p a r a t i o n between 17.80 and 17.85 kHz.
F igures 5 1 and 52 show t h a t a t low L va lues t h e r e is a s t eady NAA
s i g n a l which is rece ived toge the r w i th a broadband spectrum of upgoing
and downcoming w h i s t l e r waves. The broadband spectrogram shows s h o r t
w h i s t l e r s and s e v e r a l t ransmiss ion segments of Omega (New York) t h a t
a r e upgoing waves. Also d i sp layed a r e long w h i s t l e r s exc i t ed i n t h e
conjuga te hemisphere t h a t a r e downcoming waves a t t h e s a t e l l i t e p o s i t i o n .
Next w e observe t h a t a s t h e s a t e l l i t e moves northward t h e r e is a p o i n t
where t h e NAA s i g n a l f a l l s ab rup t ly and then s t a r t s fad ing i n a pseudo-
p e r i o d i c f a s h i o n . The p o s i t i o n where t h e f ad ing s t a r t s i s ind i ca t ed by
an arrow F i n F igure 53. A t t h e same t i m e t h e h i g h - l a t i t u d e e ros ion
begins i n t h e occurrence of downcoming w h i s t l e r s ; observe f o r example
t h a t t h e l a s t pane ls of F igure 5 1 and 52 show only upgoing s h o r t w h i s t l e r s
and some t r a c e s of upgoing m e g a waves. A c l o s e obse rva t ion r e v e a l s t h a t
t h e s e upgoing w h i s t l e r s p r e sen t "choppy'' t r a c e s i n d i c a t i n g t h a t f ad ing
is i n f a c t occur r ing a t a l l f r equenc i e s f o r upgoing waves. Another
i n t e r e s t i n g f e a t u r e presen ted by t h e records of F igures 5 1 and 52 is
a band of n o i s e between 6 and 10 kHz which is l i m i t e d i n space and begins
about 1 .5 degrees above t h e l a t i t u d e of t h e NAA f ad ing . The c e n t e r
frequency of t h e no i se band dec reases northward and d isappears ab rup t ly
about 4.3 degrees l a t e r . Observe f o r example t h a t t h e abrupt disappearance
of no i se i n F igure 52 a t 0634:05 UT is a s soc i a t ed wi th a l a r g e r educ t ion
-14'7 -

of NAA s i g n a l ~ v h ~ e b then irrcreases a g a i n nor thward. T l r i s f a c t may he
s i g n i f i c a n t f o r t h e s tudy of t h i s isplasmapause no i se f ' i n conjunc t ion
wi th t h e r e l a t e d i n c r e a s e of a t t e n u a t i o n observed a t t he boundaries of
t h e n o i s e r eg ion .
Figures 51 and 52 show t h a t t h e s i g n a l from a mid l a t i t u d e VLF
t r a n s m i t t e r i s s t eady i n s i d e t h e plasmasphere and t h a t t h e plasmapause
c ros s ing is a s soc i a t ed w i t h 1 ) h igh - l a t i t ude e ros ion i n t h e occurrence
of downcoming waves; 2 ) deep amplitude f ad ing f o r upgoing waves; 3 )
a dec rease of ampli tude f o r upgoing s i g n a l s a s t h e f ad ing begins; and
4) a band of plasmapause no i se . F igure 11 i n Chapter 2 shows f o r example
t h e a s s o c i a t i o n between t h e abrupt decrease of NAA and Omega s i g n a l s t o
t h e l e f t of 0131:lO UT and t h e corresponding e ros ion f o r t h e downcoming
w h i s t l e r s ( record BB of F igure 1 1 ) . F igure 11 shows aga in t h a t t h e
rap id decrease of s i g n a l s from NAA and Chnega (New York) occurs a t t h e
no r the rn boundary of t h e plasmapause no ise (observe t h e n o i s e band
between -- 0131:07 UT and - 0131:40 UT) . In F igure 11 t h e NAA s i g n a l
i s measured i n t h e 50 Hz passband of t h e phase t r ack ing r e c e i v e r and
t h e r e f o r e t h e 17.80 t o 17.85 kHz frequency s h i f t i n g is de t ec t ed . I n
t h i s c a s e t h e obse rva t ion of amplitude fad ing i s contaminated by t h e
presence of Morse code and is d iscarded i n t h e cont inu ing d i scus s ion .
The ampli tude f ad ing of Figures 5 1 and 52 shows t h a t t h e po in t s of
minimum ampli tude a r e 20 t o 40 db below t h e average l e v e l of t h e s i g n a l
which, combined wi th t h e pseudo-periodic behavior of t he f ad ing , s t r o n g l y
sugges t s i n t e r f e r e n c e between two and only two waves of nea r ly equa l
amplitudes a t t h e s a t e l l i t e h e i g h t , This idea of i n t e r f e r e n c e between
two waves of t h e same amplitude is pursued i n t he fol lowing d i scus s ion
where t h r e e i n t e r f e r e n c e mechanisms a r e cons idered .
- 148 -

I . InLerI erence Caused by Mul t ip le Hops B e l o w tbc Ionosphere -pa-
A s i nd i ca t ed i n Sec t ion B of Chapter 2 i t i s poss ib l e t o observe
i n t e r f e r e n c e between a ray t h a t fol lows a d i r e c t t r a j e c t o r y t r a n s m i t t e r -
i o n o s p h e r e - s a t e l l i t e and r ays t h a t bounce two o r more times between the
ground and t h e lower edge of t h e ionosphere before fol lowing a t r a j e c t o r y
t h a t a l so i n t e r c e p t s t he s a t e l l i t e a t t h e same p o i n t . However ex t ens ive
full-wave c a l c u l a t i o n s have shown t h a t amplitude fad ing of t h e o rde r of
5 db is p red ic t ed i n t h i s ca se . Therefore t h e fad ing c h a r a c t e r i s t i c s
displayed i n F igures 51 and 52 r u l e o u t t h i s m u l t i p l e hop mechanism.
2 . I n t e r f e r e n c e Caused by Longitudinal Gradients of Ion iza t ion
Longitudinal g r a d i e n t s of i o n i z a t i o n permit two waves launched
i n t h e w h i s t l e r medium a t d i f f e r e n t longi tudes t o i n t e r f e r e a t t h e
s a t e l l i t e he igh t i n t h e ionosphere. Therefore d ivergent r ays o r ig ina t ed
from NAA and t r a v e l i n g northward may p e n e t r a t e t h e ionosphere and i n t e r -
f e r e cont inuously a t t he he ight of a s a t e l l i t e t h a t f l i e s approximately
i n t h e north-south meridian. This mechanism r e q u i r e s l ong i tud ina l grad-
i e n t s of i o n i z a t i o n o u t s i d e t h e plasmasphere and no e f f e c t i v e g r a d i e n t s
i n s id e t h e plasmasphere.
3 . I n t e r f e r e n c e Caused by Lat i tudknal Gradients of I o n i z a t i o n
Records of OGO-4 c ros s ings of t h e plasmapause a r e cha rac t e r i zed
by an i n i t i a l abrupt decrease of f i e l d i n t e n s i t y when the records a r e
examined from mid t o h igh l a t i t u d e s . Observe f o r example t h e s i g n a l s
from NAA and Cknega a t 0131:lO UT i n F igure 11 and t h e NAA s i g n a l s i n
F igures 51 and 52 a t t h e beginning of t h e fad ing regime. This r ap id
decrease of f i e l d i n t e n s i t y i s probably caused by a defocusing of t h e
upgoing waves a t t h e h igh - l a t i t ude t rough of e l e c t r o n dens i ty which i s
assoc ia ted wi th t h e plasmapause, A s i nd i ca t ed i n Figure 40 t h e r e i s a
- 149 -

r a p i d change i n the s i g n of t h e P a t i t r l d i n a l gradier~i , of ionization a t
t h e t r o u g h which means t h a t w h i l e t h e waves launched i n t h e i o n o s p h e r e
i n s i d e t h e p l a s m a s p h e r e are p u l l e d toward t h e e q u a t o r t h e waves t h a t
propagate j u s t ou t s ide the plasmasphere a r e pulled toward the pole.
Therefore a defocusing of the electromagnetic f i e l d w i l l c e r t a i n l y occur
f o r waves excited from below.
On t h e o ther hand the F region of the ionosphere is highly va r i ab le
a t t h e po la r s i d e of the trough (see , f o r example, Calvert E19661).
Therefore t h e quest ion a r i s e s whether o r not i r r e g u l a r i t i e s of ion iza t ion
may provide an amplitude fading p a t t e r n l i k e those shown i n Figures 51
and 52. The e f f e c t of small-size i r r e g u l a r i t i e s of e l ec t ron dens i ty on
t h e ray t r a j e c t o r i e s of waves excited from below is studied below.
The unmodulated ionospheric model N(r) of Section D , Chapter 4
is used again wi th a modulating f a c t o r Fn
such t h a t the new p r o f i l e
of e l e c t r o n dens i ty i s given by
and we have used
Go-*1 = 1 + s i n (,) exp 1 - (r-6490)
Fn H
t h a t i s , the bas ic model N(r) i s modulated by a s inusoidal i r r e g u l a r i t y
which is f i e l d or iented and t h a t decreases with height . The nota t ion
is t h e same Tor Chapter 4 and here we have chosen
0 = 0.2 , @ , = 6 0 O , A @ = O . z , H = 500 1r;m
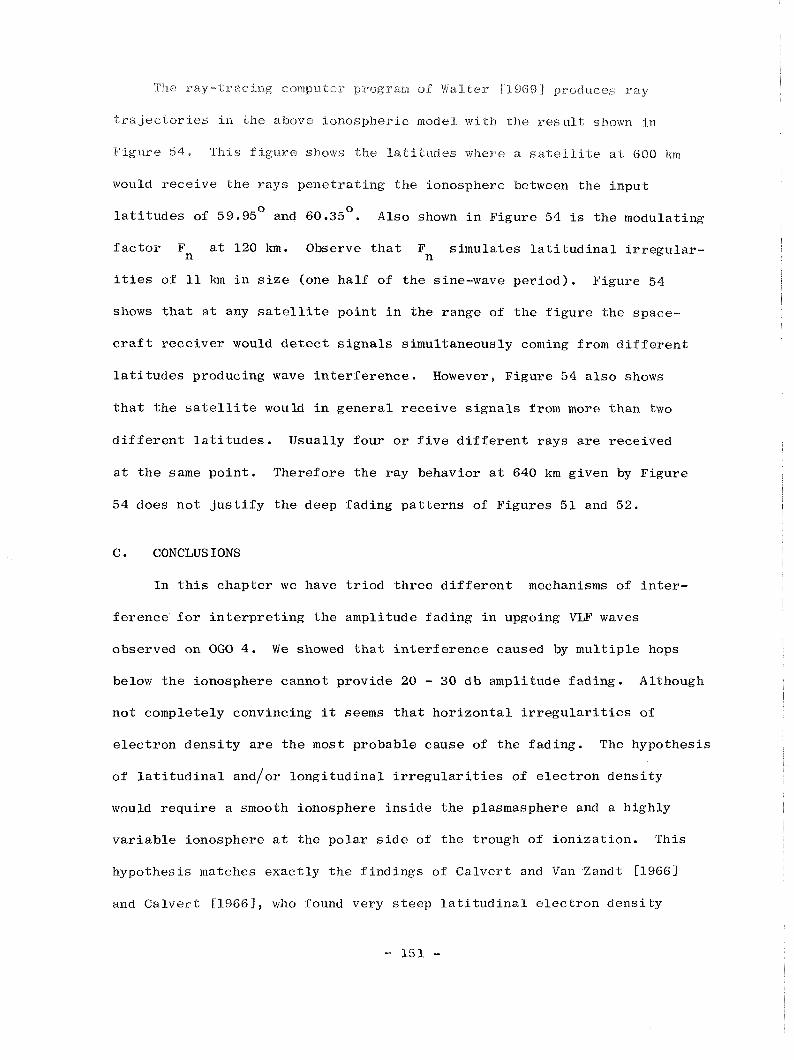
The r ay - t r ac ing cornpalter program of Walter 119693 produces ray
t r a j e c t o r i e s i n t h e above ionospher ic model wi th t h e r e s u l t shown i n
F igure 54, This f i g u r e shows t h e l a t i t u d e s where a s a t e l l i t e a t 600 k m
would r ece ive t h e r ays p e n e t r a t i n g t h e ionosphere between t h e i npu t
l a t i t u d e s of 59.95O and 6 0 . 3 5 ~ . Also shown i n F igure 54 is t h e modulating
f a c t o r Fn
a t 120 km. Observe t h a t F s imu la t e s l a t i t u d i n a l i r r e g u l a r - n
i t i es of 11 Inn i n s i z e (one ha l f of t h e sine-wave pe r iod ) . Figure 54
shows t h a t a t any s a t e l l i t e p o i n t i n t h e range of t h e f i g u r e t h e space-
c r a f t r e c e i v e r would d e t e c t s i g n a l s s imultaneously coming from d i f f e r e n t
l a t i t u d e s producing wave i n t e r f e r e n c e . However, F igure 54 a l s o shows
t h a t t h e s a t e l l i t e would i n g e n e r a l r e c e i v e s i g n a l s from more than two
d i f f e r e n t l a t i t u d e s . Usual ly f o u r o r f i v e d i f f e r e n t r ays a r e rece ived
a t t h e same p o i n t . Therefore t h e ray behavior a t 640 km given by F igure
54 does n o t j u s t i f y t h e deep f ad ing p a t t e r n s of F igures 5 1 and 52.
C . CONCLUS IONS
I n t h i s chap te r w e have t r i e d t h r e e d i f f e r e n t mechanisms of i n t e r -
f e r e n c e f o r i n t e r p r e t i n g t h e ampli tude f ad ing i n upgoing VLF waves
observed on OGO 4. W e showed t h a t i n t e r f e r e n c e caused by mu l t i p l e hops
below t h e ionosphere cannot provide 20 - 30 d b amplitude fad ing . Although
n o t completely convincing it seems t h a t h o r i z o n t a l i r r e g u l a r i t i e s of
e l e c t r o n d e n s i t y a r e t h e most probable cause of t h e f ad ing . The hypothes i s
of l a t i t u d i n a l and/or l o n g i t u d i n a l i r r e g u l a r i t i e s of e l e c t r o n d e n s i t y
would r e q u i r e a smooth ionosphere i n s i d e t h e plasmasphere and a h igh ly
v a r i a b l e ionosphere a t t h e po l a r s i d e of t h e t rough of i o n i z a t i o n . This
hypothes i s matches e x a c t l y t h e f i n d i n g s of Ca lve r t and Van Zandt [1966]
and Ca lve r t C19661, who found very s t e e p l a t i t u d i n a l e l e c t r o n dens i ty


gradients in the t o p s i d e F Layer a t high latitudes, They showed that
t h e e l e c t r o n d e n s i t y g r a d i e n t s caused by i r r e g u l a r i t i e s a t t h e e q u a t o r
s i d e of t h e t r o u g h a r e r e l a t i v e l y small and t h a t t h e i r r e g u l a r i t y p a t t e r n
changes s u b s t a n t i a l l y a t high l a t i t u d e s . They reported low s i z e s t r u c t u r e s
of e l e c t r o n dens i ty and very s t e e p gradients a t the polar s i d e of the
trough. For example, changes of 50% i n a d i s t ance of 8 km have been
observed a t l a t i t u d e s above t h e trough of ion iza t ion . Therefore t h e
requirement of a va r i ab le ionosphere ou t s ide the plasmasphere t h a t would
be associa ted with amplitude fading f o r upgoing waves is confirmed
experimental ly. However, the d e t a i l s of the fading mechanism a r e not
c l e a r a t t h i s time.

REFERENCES
Angerami, J . J . and J * 0 , Thomas, S tudies of p l ane t a ry atmospheres, 1, t h e d i s t r i b u t i o n of e l e c t r o n s and ions i n t h e e a r t h ' s exosphere, J. Geophys. Res. , 69, 4537, 1964, -
Aubry, M . P. , In f luence des g r a d i e n t s horizontaux de d e n s i t d Llec t ron ique s u r l a d i r e c t i o n des normales d 'ondes TBF dans l ' i onosphkre , Ann. Geophys . , 23, 467, 1967. -
Aubry, M . P . , Some r e s u l t s of t h e FR-1 s a t e l l i t e experiment on t h e VLF wave f i e l d i n t h e zone c l o s e t o t h e t r a n s m i t t e r , J. Atmos. Te r r . Phys. , 30, 1161, 1968. - -
Barr ington, R. E . , J . S . Belrose and W. E. Mather, A helium w h i s t l e r observed i n t h e Canadian s a t e l l i t e Aloue t te 2 , Nature , 210, 80,
Brace, L. H . , B. M . Reddy and H. G. Mayr, Global behavior of t h e iono- sphere a t 1000 k i lome te r s a l t i t u d e , J . Geophys. Res. , - 72, 265, 1967.
Br ice , N . M . , Discrete very low frequency emissions from t h e upper atmosphere, SEL-64-088, Radioscience Lab., Stanford E lec t ron i c s Labs. , Stanford Un ive r s i t y , S t an fo rd , C a l i f o r n i a , 1964.
Ca lve r t , W . , S t eep h o r i z o n t a l e l ec t ron -dens i ty g r a d i e n t s i n t h e t ops ide F l a y e r , J . Geophys. R e s . , 71, - 3665, 1966.
C a l v e r t , W . and T. E. Van Zandt, Fixed-frequency observa t ions of plasma resonances i n t h e t ops ide ionosphere, J . Geophys. Res., - 71, 1799, 1966.
Carpenter , D . L., E lec t ron-dens i ty v a r i a t i o n s i n t h e magnetosphere deduced from w h i s t l e r d a t a , J . Geophys. R e s . , - 67, 3345, 1962.
Carpenter , D . L . , Whis t le r evidence of a "knee" i n t h e magnetospheric i o n i z a t i o n d e n s i t y p r o f i l e , J . Geophys. Res. , - 68, 1675, 1963.
Carpenter , D . L., N . Dunckel and J . F. Walkup, A new very low frequency phenomenon: w h i s t l e r s trapped below t h e protonosphere, J . Geophys. Res., 69, 5009, 1964. - -
Carpenter , D . L., F. Wal te r , R. E. Barr ington and D . J . McEwen, Aloue t te 1 and 2 obse rva t ions of abrupt changes i n w h i s t l e r r a t e and of VLF n o i s e v a r i a t i o n s i n t h e plasmapause - a s a t e l l i t e -g round s tudy , J . Geophys. Res. , - 73, 2929, 1968,
Clemmow, P. C . and J . Beading, Coupled forms of t h e d i f f e r e n t i a l equa- t i o n s governing r a d i o propagat ion i n t h e ionosphere, Proc. Camb. P h i l . Soc., - 50, 319, 1954.
Crary, J . B . , The e f f e c t of t h e ear th- ionosphere waveguide on w h i s t l e r s , Rept. No. 9, Radioscience Laboratory, S tanford E lec t ron i c s Labs. , Stanford Univers i ty , S tanford , C a l i f o r n i a , J u l y 1961.

D c e l r s , 19, G., 13-region e l e c t r o n d i s t r i b ~ ~ t i o n s i n m i d d l e latitudes deduced from the r e f l e x i o n of long r a d i o waves, Proc. Roy. Soc. A , 291, - - ,- 413, 1966a.
Deeks , D, G . , Generalized f u l l wave theory f o r energy-dependent c o l l i s i o n f r equenc i e s , J . Atrnos. T e r r , Phys. , 28, 839, 1966b. -
F i c k l i n , B. P . , M . E. M i l l s , L. E. Orsak, L. H . Rorden and R. H. S t e h l e , Desc r ip t i on and ope ra t i on of t h e ins t ruments f o r t h e S tanford u n i v e r s i t Y / s t a n f o r d Research I n s t i t u t e Experiment (5002) t o be flown on t h e POGO s a t e l l i t e , Tech. Memo No. 2 , S tanford Research I n s t i t u t e , Menlo Park, C a l i f o r n i a , March 1965.
Gurne t t , D . A . , S. D . Shawhan, N . M. Brice and R. L. Smith, Ion cyc lo t ron w h i s t l e r s , J . Geophys. Res. , 70, 1665, 1965. -
Gurnet t , D . A . , S. D . Shawhan and G. W . P f e i f f e r , The hook w h i s t l e r - a new e q u a t o r i a l w h i s t l e r observed by Injun 3 , UI 66-50, Dept. of Physics & Astronomy, Univers i ty of Iowa, Iowa C i t y , Iowa, 1966.
H e l l i w e l l , R . A . , Exospheric e l e c t r o n d e n s i t y v a r i a t i o n s deduced from w h i s t l e r s , Ann. Geophys., 17, 76, 1961.
P - H e l l i w e l l , R . A . , Whi s t l e r s and Related Ionospheric Phenomena, S tanford
Un ive r s i t y P r e s s , S tanford , C a l i f o r n i a , 1965.
H e l l i w e l l , R . A . , J . H. Crary, J . H. Pope and R . L. Smith, The t tnoset l w h i s t l e r - a new high l a t i t u d e phenomenon, J . Geophys. Res . , 61, - 139, 1956.
Heyborne, R. L., Observat ions of whistler-mode s i g n a l s i n t h e OGO s a t e l l i t e s from VLF ground s t a t i o n t r a n s m i t t e r s , SEL-66-094, Radio- s c i ence Lab., Stanford E lec t ron i c s Labs., S tanford Univers i ty , S tanford , C a l i f o r n i a , November 1966.
Heyborne, R. L. , R . L. Smith and R . A . H e l l i w e l l , L a t i t u d i n a l cu to f f of VLF s i g n a l s i n t h e ionosphere, J . Geophys. Res., - 74, 2393, 1969.
Huxley, L. G. H . , A d i s cus s ion of t h e motion i n n i t rogen of f r e e e l e c t r o n s wi th sma l l ene rg i e s w i th r e f e r ence t o t h e ionosphere, J . Atmos. Te r r . Phys., 16, 46, 1959. -
Le ipha r t , J . P . , R. W . Zeek, L. S. Bearce and E . Toth, Pene t r a t i on of t h e ionosphere by very-low-frequency r a d i o s igna l s - in t e r im results of t h e L o f t i experiment, Proc. IRE, 50, 6 , 1962. -
Mechtly, E. A . and L. G . Smith, Seasonal v a r i a t i o n of t h e lower iono- sphere a t Wallops I s land during t h e IQSY, J . Atmos. Ter r . Phys., 30, 1555, 1968.
Muzzio, J . L. R . , Ion cu tof f w h i s t l e r s , J . Geophys. Res. , - 7 3 , 7526, 1968.

Phelps , A , V. and J. L * Pack, Elec t ron collision f requenc ies i n n i t rogen and i n Lhe louder iorrosphere, Phys . R e v , L e C d e r s , 3 , 340, 1959, -
P i g g o t t , W , R,, M. L , V. Pitteway and E , V, Thrane, The numerical c a l - c u l a t i o n of wave f i e l d s , r e f l e x i o n eoei-i icren'cs and p o l a r i z a t i o n s f o r long r a d i o waves i n t h e lower ionosphere, 11, P h i l . Trans. Roy. S o c , , London, A , 257, 243, 1965. -
Pi t teway, M. L. V . , The numerical c a l c u l a t i o n of wave f i e l d s , r e f l e x i o n c o e f f i c i e n t s and p o l a r i z a t i o n s f o r long r a d i o waves i n t h e lower ionosphere, I , P h i l . Trans. Roy. Soc., London, A , 257, 219, 1965.
P i t teway, M. L. V. and J . L. J e spe r sen , A numerical s tudy of t h e e x c i t a - t i o n , i n t e r n a l r e f l e c t i o n and l i m i t i n g p o l a r i z a t i o n of w h i s t l e r waves i n t h e lower ionosphere, J . Atmos. T e r r . Phys. , 28, 17, 1966. -
Prasad , S. S . , Nighttime i o n i c composition and temperature over Arecibo, J. Geophys. Res. , 73, 6795, 1968. -
R a t c l i f f e , J . A . , The hlagneto-Ionic Theory and I t s Appl ica t ions t o t h e Ionosphere, Cambridge Univers i ty P r e s s , Cambridge, England ( F i r s t E d i t i o n ) , 1959.
Reddy, B. M . , L. H. Brace and J . A . F ind lay , The ionosphere a t 640 k i l - ometers on q u i e t and d i s t u r b e d days, J . Geophys. Res. , - 72, 2709, 1967.
Rorden, L . H . , R . A . He l l iwe l l and R . L . Smith, An i n t e r p r e t a t i o n of LOFTI-I VLF obse rva t ions , AGARDOGRAPH 74, Pergamon P re s s , New York, 1964.
Scarabucc i , R. R . , Ana ly t i ca l and numerical t rea tment of wave propagat ion i n t h e Power ionosphere, SEL-69-046, Radioscience Lab., S tanford E l e c t r o n i c s Labs. , S tanford Un ive r s i t y , S tanford , C a l i f o r n i a , August 1669.
Sen, H . K . and A . A . Wyller , On t h e g e n e r a l i z a t i o n of t h e Appleton-Hartree magnetoionic formulas , J . Geophys . Res . , - 65, 3931, 1960.
Shawhan, S . D . , VLF ray t r a c i n g i n a model ionosphere, UI-66-33, Dept. of Physics & Astronomy, Univers i ty of Iowa, Iowa C i t y , Iowa, August 1966.
Smith, R . L., Propagat ion c h a r a c t e r i s t i c s of w h i s t l e r s trapped i n f i e l d - a l igned columns of enhanced i o n i z a t i o n , J . Geophys . R e s . , - 66, 3699, 1961a.
Smith, R . L . , P r o p e r t i e s of t h e o u t e r ionosphere deduced from nose w h i s t l e r s , - J . Geophys. Res., - 66, 3709, 1961b.
Smith, R e L. and J . J . Angerami, Magnetospheric p r o p e r t i e s deduced from 060-1 obse rva t ions of d u c t e d snd aoadueted w h i s t l e r s , J . Geophys. Res., 73, 1, 1968. - -

S m i t h , R , L . , R e A , H e l L i w e P f and 4 , Y a b r o f f , A theory of trapping of wbis t lers in field -aligned columns of enhanced ionization, J . Geophys, Res., 65, 815, 1960. -
Storey, L. R . O., An investigation of whistling atmospherics, Phil. Trans. Roy. Soc., -London, A , 246, 113, 1953. -- -
Sto rey , L. R. O . , R e s u l t a t s p r e l i m i n a i r e s s u r l a p ropaga t ion TBF dans l a basse magnetosphere obtenus p a r l a s a t e l l i t e FR-1, Space R e s . V I I , North-Holland Publ . , Co., Amsterdam, p . 588, 1966.
Terman, F. E. , E l ec t ron i c and Radio Engineer ing, McGraw H i l l Book Co., Inc . , New York, ( 4 t h E d i t i o n ) , 1955.
Wait , J . R . , Electromagnet ic Waves i n S t r a t i f i e d Media, Pergamon P re s s , New York, 1962.
Wal te r , F . , Nonducted VLF propaga t ion i n t h e magnetosphere, SEL-69-061, Radioscience Lab., S tanford E l e c t r o n i c s Labs., Stanford Un ive r s i t y , S tanford , C a l i f o r n i a , October 1969.
Wal te r , F. and J . J . Angerami, The nonducted mode of VW propagat ion between conjuga te hemispheres; observa t ions on O G O ' s 2 and 4 of t h e 'walking-trace ' w h i s t l e r and of Doppler s h i f t s i n f i x e d frequency t r ansmis s ions , J . Geophys. R e s . , 74, - December 1, 1969.