of the requirements for the degree of - unb scholar
TRANSCRIPT

Petrological and Metallogenic studies of the Nashwaak Granite and felsic dykes
associated with the Sisson Book W-Mo-(Cu) deposit, west-central New Brunswick,
Canada
by
Wei Zhang
M.Sc., China University of Geosciences (Beijing), 2009 B.Sc, China University of Geosciences (Beijing), 2006
A Dissertation Submitted in Partial Fulfillment of the Requirements for the Degree of
Doctor of Philosophy
in the Graduate Academic Unit of Earth Sciences
Supervisor: David R. Lentz, Ph.D, Department of Earth Sciences
Co-supervisor: Christopher R.M. McFarlane, Ph.D, Department of Earth Sciences
Examining Board: David Keighley, Ph.D, Department of Earth Sciences Stephan J. Peake. Ph.D, Department of Biology
Nicholas J. Susak, Ph.D, Department of Earth Sciences
External Examiner: Ian Coulson, Ph.D, Department of Geology, University of Regina
This dissertation is accepted by the Dean of Graduate Studies
THE UNIVERSITY OF NEW BRUNSWICK
June, 2015
©Wei Zhang, 2015

ii
ABSTRACT
The Sisson Brook W-Mo-Cu deposit was formed by hydrothermal fluids likely
related to the Nashwaak Granites and related felsic dykes. These granites consist of two
pluton subfacies: muscovite-biotite granite (Group I) and biotite granite (Group II), and
dykes with various textures (aplitic to pegmatoidal dykes, Group III; and a porphyry
dyke, Group IV).
This deposit formed at 376.45 ± 1.64 Ma to 378.54 ± 1.71 Ma (Re-Os molybdenite)
that is older than the porphyry dyke (364.5 ± 1.3 Ma, earlier U-Pb zircon age), but
younger than the volumetrically dominant medium- to coarse-grained biotite granitic
dykes (405.6 ± 2.5 Ma, U-Pb zircon age), as well as the Nashwaak granitic plutons. The
syn-hydrothermal dykes could be the other dykes with different textures in Group III, if
they are not contemporary, or possibly related to a deeply buried large granitic pluton has
not been intersected by drilling thus far.
The Nashwaak Granite and related dykes are highly siliceous (SiO2 > 69 wt. %),
peraluminous, calc-alkaline, and magnesian I-type granites. They formed in a volcanic
arc type setting and are characterized by depletion of HFSE and enrichment of LILE.
Oxygen isotope data (9.3 - 12.3 ‰), (87Sr/86Sr)i (0.702 - 0.710), and ɛNd(t) (-4.51 to -1.42)
of the whole rock, and in situ δ18O analyses of magmatic zircons (4.9 - 9.9 ‰) and quartz
show the granitic magmas are probably derived from bulk assimilation of Meso-
proterozoic Gondwanan basement ± the overlying Gander Zone sedimentary prism, by
mantle-derived melts.
The magmas of the Nashwaak Granite and related dykes formed at temperatures
below 800°C (TZr) with the aid of water-rich fluid infiltration. These magmas with a

iii
initial water content of 5-6 wt.% increased upwards until they intersect the water-
saturated granite solidus at pressures lower than 2.5 to 3.0 kbar. Assimilation and
fractional crystallization is the mechanism that controlled magma evolution. Trace
element contents in quartz and biotite are not correlated with that of the whole rock, but
the K/Rb of biotite decrease, and Al/Ti and Ge/Ti of quartz increase with differentiation
of the magmas and show that the Group III is the most evolved. Oxygen fugacity of these
magmas is close to the nickel-nickel oxide buffers, thus they are oxidized I-type magmas,
and only the two-mica granite is reduced due to later, strongly supracrustal,
contamination (ASI > 1.1, δ18OZr > 8‰). Halogen fugacity study shows that the Group I
suite have higher F relative to Cl, with other groups having higher H2O and Cl activity
than F, indicative of build-up of chlorine and water in the evolving magma. These high
HCl/HF and H2O/HF ratios are suggested as tungsten mineralization vectors and only the
dyke phases have similar HCl/HF ratios to that of granites typically associated with Sn-
Wo-Bi deposits.
Comparing the geochemical characteristics of all the Nashwaak Granites and
associated dykes with the granites related to the W-Mo deposits, the biotite granitic dykes
are the “best” candidates for the W-Mo deposit mineralization, since they are the most
differentiated, oxidized, and relatively ‘wet’ type of magma (compared to magmas of
porphyry Cu, < 4 H2O wt.%), and with a similar halogen fugacity. Further geochronology
studies are needed in order to better identify the syn-mineralization intrusions.

iv
ACKNOWLEDGEMENTS
I would like to thank my supervisor Prof. David R. Lentz for giving me the chance to
work on this project and for his continuous support and guidance at each stage of my
Ph.D study and research. Dr. Lentz always provided me opportunities to present my
research results at various conferences in different countries. These experiences made it
possible for me to exchange my ideas with other academic people and got many
constructive suggestions. I am grateful to my co-supervisor Dr. Christopher R.M.
McFarlane for his editing and help on the lab research. I also have to appreciate my other
advisor Dr. Kathleen G. Thorne for her several rounds editing on each chapters of this
thesis and every conference abstracts, and her guidance in the field during the sampling
and mapping stage of this project.
Department of Energy and Mines (New Brunswick), Geodex Minerals, HDI
Northcliff, NSERC Grant, Society of Economic Geologists Canada Foundation, New
Brunswick Museum, and China Scholarship Council are thanked for their interest and
support funding this project.
I am grateful to HDI Northcliff who gave me access to its property. Support by
Charlie Morrissy and Justin Bernard during field work, and Douglas Hall (University of
New Brunswick), Yan Luo (University of Alberta), and Richard Stern (University of
New Brunswick) during lab work, was greatly appreciated.
I am thankful to Prof. Jingwen Mao, Prof. Maohong Chen, and Prof. Huishou Ye
from Chinese Academy of Geological Sciences (CAGS) who supported me to study in
Canada. Valuable suggestions and critical comments given by Junfeng Xiang, Yanbo

v
Chen, Dongyang Zhang from CAGS, and Bo Xiao from Institute of Geology and
Geophysics, Chinese Academy of Sciences, were appreciated.
I thank all the graduate students in Department of Earth Sciences (UNB), in
particularly, Ayelu Gebru, Joseph Zulu, Melissa Anderson, Bryan Way, Kristy Beal,
Michelle Mckeough, Sarinya Paisarnsombat, Kim Klausen, Hao Hu, Denis Sanchez-
Mora, Zeinab Azadbakht, Azam Dehnavi-Soltani, and Nadia Mohammadi for their
support and help during daily life in the past several years.
Finally, I thank my parents Changhong Zhang and Aihua Du for their understanding
and encouragement during my long collegiate career. I also thank Jingqiu Du for bringing
me so much happiness everyday.

vi
Table of Contents
ABSTRACT........................................................................................................................ ii
ACKNOWLEDGEMENTS............................................................................................... iv
Table of Contents............................................................................................................... vi
List of Tables ..................................................................................................................... xi
List of Figures ................................................................................................................... xii
List of Symbols and Abbreviations................................................................................. xvii
Chapter 1 Introduction ........................................................................................................ 1 1.1 Previous research on the tectonic evolution history, magmatism, and tungsten
deposits in the Gander Zone of New Brunswick ............................................................ 1
1.1.1 Tectonic Evolution of the Gander Zone............................................................. 2
1.1.2 Magmatism in the Gander Zone ........................................................................ 8
1.1.3 Tungsten deposits in the Gander Zone............................................................. 12
1.2 Goals of this thesis .................................................................................................. 24
References..................................................................................................................... 26
Chapter 2 Genesis of W-Mo specialized granitoid magmas: a review of their petrology, geochemistry, and isotopic attributes................................................................................ 44
Abstract ......................................................................................................................... 44
2.1 Introduction............................................................................................................. 45
2.2 The Granitoids related to the porphyry-type W-Mo deposit .................................. 46
2.3 The granitoids related to the skarn-type W-Mo deposits........................................ 50
2.4 The granitoids related to the vein-type W-Mo deposits.......................................... 52
2.5 Discussion ............................................................................................................... 54
2.5.1 Tectonic environments..................................................................................... 54
2.5.2 Granite types and degree of compositional evolution...................................... 55
2.5.3 Metal sources ................................................................................................... 56

vii
2.5.4 Initial water content and depth of emplacement of magma............................. 57
2.5.5 Oxidation state of magmas............................................................................... 58
2.5.6 Partitioning of metals....................................................................................... 59
2.6 Conclusions............................................................................................................. 59
References..................................................................................................................... 60
Chapter 3 The petrological and mineralogical characteristics of felsic intrusive units at the Sisson Brook W-Mo-Cu deposit, west-central New Brunswick................................. 73
Abstract ......................................................................................................................... 73
3.1 Introduction............................................................................................................. 74
3.2 Geological setting ................................................................................................... 75
3.3 Sample Groups........................................................................................................ 77
3.4 Analytical Methods................................................................................................. 78
3.4.1 Major- and trace-elements analysis ................................................................. 78
3.4.2 Hydrogen, O, and S isotope analysis of the whole rocks................................. 79
3.4.3 Sr and Nd isotope............................................................................................. 80
3.4.4 Geochronology of zircon ................................................................................. 81
3.4.5 Re-Os geochronology ...................................................................................... 81
3.5 Geochemical characteristics.................................................................................... 82
3.5.1 Major element characteristics .......................................................................... 82
3.5.2 Trace element characteristics ........................................................................... 83
3.6 Isotopic compositions ............................................................................................. 85
3.6.1 Oxygen, H, and S stable isotopes..................................................................... 85
3.6.2 Strontium and Nd isotopes............................................................................... 86
3.6.3 Uranium-Pb zircon age .................................................................................... 86

viii
3.6.4 Rhenium-Os molybdenite age.......................................................................... 88
3.7 Magma temperatures............................................................................................... 89
3.8 Evaluation of geochemistry as indicators of tectonic setting.................................. 90
3.9 Discussion ............................................................................................................... 91
3.9.1 Magma source and granite type ....................................................................... 91
3.9.2 Magma evolution process ................................................................................ 93
3.9.3 Metallogenic implications................................................................................ 94
3.10 Conclusions........................................................................................................... 97
References..................................................................................................................... 98
Chapter 4 Magmatic sources and evolution process of the Nashwaak Granite and associated dykes related to the Sisson Brook W-Mo-Cu deposit, west-central New Brunswick, Canada: evidence from SEM-CL, LA-ICPMS, and SIMS studies on quartz and zircon........................................................................................................................ 128
Abstract ....................................................................................................................... 128
4.1 Introduction........................................................................................................... 130
4.2 Geological background and sample details........................................................... 132
4.3 Analytical methodologies ..................................................................................... 133
4.3.1 Textures and compositional analysis of quartz.............................................. 133
4.3.2 Oxygen isotope analysis of quartz and zircon ............................................... 134
4.4 Quartz textures distinguished by SEM-CL imaging............................................. 136
4.4.1 Quartz textures in the Nashwaak plutonic phases.......................................... 136
4.4.2 Quartz texture in the Nashwaak dykes........................................................... 137
4.5 Trace elements distribution in quartz.................................................................... 138
4.6 Oxygen isotope results.......................................................................................... 140
4.6.1 Oxygen isotope data of whole rock ............................................................... 140

ix
4.6.2 Oxygen isotopes of quartz ............................................................................. 141
4.6.3 Oxygen isotope of zircon............................................................................... 142
4.7 Discussion ............................................................................................................. 143
4.7.1 Factors affecting the incorporation of trace elements into quartz.................. 143
4.7.2 Titanium-in-quartz geothermometer.............................................................. 146
4.7.3 Oxygen isotope equilibrium fractionation between zircon, quartz, and whole
rock ......................................................................................................................... 147
4.7.4 Source of magma ........................................................................................... 151
4.8 Conclusions........................................................................................................... 154
References................................................................................................................... 156
Chapter 5 Geochemical characteristics of biotite from felsic intrusive rocks around the Sisson Brook W-Mo-Cu deposit, west-central New Brunswick: an indicator of halogen and oxygen fugacity of magmatic systems ..................................................................... 180
Abstract ....................................................................................................................... 180
5.1 Introduction........................................................................................................... 182
5.2 Geological setting ................................................................................................. 183
5.3 Source of data, specimens and analytical methods............................................... 186
5.4 Petrography........................................................................................................... 187
5.5 Biotite mineral chemistry...................................................................................... 189
5.5.1 Biotite classification....................................................................................... 189
5.5.2 Trace-element characteristics......................................................................... 190
5.6 Biotite halogen chemistry ..................................................................................... 191
5.7 Halogen fugacity of associated fluids ................................................................... 193
5.8 Oxygen fugacity.................................................................................................... 194
5.9 Discussion ............................................................................................................. 196

x
5.9.1 Petrogenetic implications............................................................................... 196
5.9.2 Metallogenic implication of volatiles ............................................................ 198
5.10 Conclusions......................................................................................................... 202
References................................................................................................................... 204
Chapter 6 Conclusions and recommendations for future work ...................................... 230 References................................................................................................................... 239
Appendix Table 1 XRF data of the standard samples (SY-4, NIM-G, and 94-GS) and retalive difference between them and reference values .................................................. 245
Appendix Table 2 INAA data of the standard samples (SY-4, NIM-G, and 94-GS) and retalive difference between them and reference values .................................................. 246
Appendix Table 3 Results of repeated analyses of the NIST 610 standard by laser ablation-ICPMS and comparison with reference values................................................. 247
Appendix Table 4 Limits of detections for the trace element concentrations in the quartz from the Nashwaak Granites and related dykes by laser ablation-ICPMS..................... 249
Appendix Table 5 Trace element compositions of quartz from the Nashwaak Granites and related dykes analyzed by laser ablation-ICPMS ........................................................... 251
Appendix Table 6 Oxygen isotope compositions of quartz from the Nashwaak granites, dykes, and the quartz veins in dykes, measured by in situ Secondary Ion Mass Spectrometer (SIMS) ...................................................................................................... 255
Appendix Table 7 Chemical composition of bioitite from Nashwaak granites and dykes analyzed by electron probe microanalysis (EMPA) ....................................................... 258
Appendix Table 8 Results of repeated analyses of the GOR 128-G standard by laser ablation-ICPMS and comparison with reference values................................................. 263
Appendix Table 9 Limits of detections for the trace element concentrations in the quartz from the Nashwaak Granites and related dykes by laser ablation-ICPMS..................... 265
Appendix Table 10 Trace element compositions of biotite from the Nashwaak Granites and related dykes analyzed by laser ablation-ICPMS..................................................... 267
Curriculum Vitae

xi
List of Tables
Table 3.1 Major- and trace-element data of Nashwaak Granitoids and related dykes ... 122
Table 3.2 The whole rock hydrogen and oxygen isotope data of the Nashwaak Granitoids and related dykes..................................................................................................... 126
Table 3.3 The whole rock sulfur isotope compositions of the Nashwaak Granitoids and related dykes. .......................................................................................................... 126
Table 3.4 The whole rock Sr-Nd isotope data of the Nashwaak Granitoids and related dykes. ...................................................................................................................... 126
Table 3.5 Zircon U-Pb isotopic data obtained by LA-ICPMS for a biotite dyke sample BGD-13 (Group III) from the drill core of the Sisson Brook deposit, west-central New Brusnwick....................................................................................................... 124
Table 3.6 Results of Re-Os analyses of molybdenite in the quartz veins from the Sisson Brook deposit. ......................................................................................................... 124
Table 4.1 Trace element concentration ranges (ppm) of quartz from the Nashwaak two-mica granite (MBG), biotite granite (BG), biotite granitic dykes (BGD), and a porphyry dyke (PD), measured by laser ablation-inductively coupled plasma mass spectrometry (LA-ICPMS). .................................................................................... 175
Table 4.2 Average oxygen isotope compositions of quartz from the Nashwaak granites, dykes, and the quartz veins in dykes, measured by in situ Secondary Ion Mass Spectrometer (SIMS) .............................................................................................. 176
Table 4.3 Oxygen isotope compositions of zircon from the Nashwaak two-mica granite (MBG), biotite granite (BG), and biotite granitic dyke (BGD), detected by in situ Secondary Ion Mass Spectrometer (SIMS)............................................................. 177
Table 5.1 Average chemical compositions of bioitite from Nashwaak granites and dykes analyzed by electron probe microanalysis (EPMA) ............................................... 228
Table 5.2 Average content of trace elements in biotite from Nashwaak granite and related dykes analyzed by the laser ablation-inductively coupled plasma mass spectrometry (LA-ICPMS). .......................................................................................................... 229

xii
List of Figures
Fig. 1.1 Lithotectonic divisions of the northeastern Appalachian orogen (modified after Hibbard et al., 2006). .................................................................................................. 6
Fig. 1.2 Lithotectonic terranes and cover sequences of New Brunswick. Faults: 1) Jacquet River; 2) Rocky - Brook Millstream; 3) Catamaran-Woodstock; 4) Bamford Brook-Hainesville; 5) Fredericton; 6) Sawyer Brook; 7) Turtle Head-Pendar Brook; 8) Falls Brook-Taylor Brook; 9) Wheaton Brook–Back Bay; 10) Belleisle-Beaver Harbour; 11) Kennebecasis-Pocologan; and 12) Caledonia-Clover Hill. Abbreviations: MK = Markey Brook inlier; NR = New River terrane; BV = Brookville terrane; CD = Caledonia terrane. Modified after Fyffe et al. (2011). ................................................ 7
Fig. 1.3 Paleotectonic setting for Early Paleozoic arc-backarc systems in New Brunswick. a) Late Cambrian tectonic setting. The Brookville terrane is assumed to be offsection at this time and that the passive margin sedimentary rocks of the St. Croix terrane are included as part of the New River terrane; b) Middle Ordovician accretion of the New River terrane to the Miramichi terrane following closure of the Penobscot backarc basin. The Miramichi and Annidale terranes are assumed to have occupied a similar paleogeographic position and were part of a single arc-backarc system. Modified after Fyffe et al. (2011). ................................................................. 8
Fig. 3.1 Regional geological map of showing the distribution of the Nashwaak Granites (1:50 000) (modified after Smith and Fyffe, 2006a, b). Cambrian to Early Ordovician: ЄOTLgn - Trousers Lake Metamorphic Suite, ЄOKBmc, - Miramichi Group; Ordovician: OLCfi - Little Clearwater Brook Granite, OMKfi - McKiel Lake Granite, OPBD,OHLfc,OHLmv,OTUls,OTM,OHL - Tetagouche Group; Silurian: SCRfc, SBUmc, STRmc, SSMfc, SBOGii; Devonian: DHfia - Hawkshaw Granite, DBLmi - Becaguimec Lake Gabbro, DHPii - Howard Peak Granodiorite, DNWfia - Nashwaak biotite Granite, DNWfib - Nashwaak two-mica Granite, Carboniferous: CCLcc, CHRmv, CSNcc - Mabou Group, CMOmc - Pictou Group; ------- Fault. .... 113
Fig. 3.2 Geological map of Sisson Brook W-Mo-Cu deposit (modified after Fyffe et al., 2008). DNW Devonian Nashwaak Granite, DHP Devonian Howard Peak Diorite, DG Devonian gabbro, OPB Ordovician Push and Be Damned Formation, OHL Ordovician Hayden Lake Formation, OTM Ordovician Turnbull Mountain Formation, ЄM Cambro-Ordovician Miramichi Group, Dash line fault, F - City of Fredericton. .. 114
Fig. 3.3 Hand samples and photomicrographs (taken under crossed polarized light) of the Nashwaak Granitoids and related dykes. a, b medium-grained two-mica granite (Group I), showing that muscovite coexists with biotite and earlier formed feldspar has reaction rims; c, d seriate biotite granite (Group II), reddish brown colour of the biotite may reflect that they formed in a reduced setting (cf. Ishihara, 1998); e, f medium-grained biotite granitic dykes (Group III), biotite cluster stay with quartz and K-feldspar; g, h the porphyry dyke (Group IV), rounded quartz, biotite, and

xiii
feldspar phenocrysts in fine-grained groundmass; rim of biotite altered to chlorite.................................................................................................................................. 115
Fig. 3.4 Quartz-alkaline feldspar-plagioclase ternary diagram (a, Streckeisen, 1976), and Shand index plot (b) for the Nashwaak Granites and related dykes (the fields from Streckeisen, 1976; Maniar and Piccoli, 1989). 1-alkali-feldspar syenite; 2-syenite; 3-monzonite; 4-monzodiorite; 5-diorite; 6-alkali-feldspar quartz; 7-quartz syenite; 8-quartz monzonite; 9-quartz monzodiorite; 10-quartz diorite; 11-alkali-feldspar granite; 12-syenoganite; 13-monzogranite; 14-granodiorite; 15-tonalite; 16-quartz-rich granite; 17-quartzite......................................................................................... 116
Fig. 3.5 Harker diagrams (oxides in wt.%) for the Nashwaak Granites and related dykes. See Fig. 3.4 for symbols ......................................................................................... 117
Fig. 3.6 Chondrite-normalized REE patterns and primitive primitive mantle-normalized spider diagrams for the Nashwaak Granites and related dykes. Normalized values from Sun and McDonough (1989). Symbols as Fig. 3.4. ....................................... 118
Fig. 3.7 Plots of Rb (ppm) vs. Sr (ppm) (a), Ba (ppm) vs. Sr (ppm) (b), Rb/Sr vs. Sr (ppm) (c), and La (ppm) vs. La/Yb (d) illustrating selected trace-element geochemical characteristics of the Nashwaak granites and related dykes resulting from crystallization (arrows indicate inferred fractionation vector). Mon-monzonite, Ap-apatite, Zr-zircon, Kfs-K-feldspar, Pl-plagioclase, Bi-biotite, Cpx-clinopyroxene, Opx-orthopyroxene. ....................................................................... 119
Fig. 3.8 Cathodoluminescence images of the zircon grains from sample BGD-13, displaying igneous growth zones and some older cores. ........................................ 120
Fig. 3.9 U-Pb Concordia diagram for zircon from a biotite dyke sample BGD-13 collected from drill core of the Sisson Brook deposit, west-central New Brunswick, Canada (see Table 3.5 for data). ............................................................................. 120
Fig. 3.10 Tectonomagmatic discrimination diagrams for granitoid samples from the Nashwaak granites and related dykes. Plots of Y vs. Nb (a) and (Y + Nb) vs. Rb (b). Field boundaries from Pearce et al. (1984) and modified by Christiansen and Keith (1996). (c) Triangle plot of Y–Nb–Ce (A1 Group granites are characterized by element ratios similar to the mantle, whereas A2 Group granites originated from continental crust or arcs); boundary line between groups from Eby (1992). (d) (La/Yb)N versus YbN discriminate the typical arc magma from adakite (Drummond and Defant, 1990).................................................................................................... 121
Fig. 4.1 Regional geological map (1:50 000) showing the distribution of the Nashwaak granites and location of the Sisson Brook W-Mo-Cu deposit (modified after Smith and Fyffe, 2006a, b). Cambrian to Early Ordovician: ЄOTLgn - Trousers Lake Metamorphic Suite, ЄOKBmc, - Miramichi Group; Ordovician: OLCfi - Little Clearwater Brook Granite, OMKfi - McKiel Lake Granite, OPBD, OHLfc, OHLmv, OTUls, OTM, OHL - Tetagouche Group; Silurian: SCRfc, SBUmc, STRmc, SSMfc, SBOGii; Devonian: DHfia - Hawkshaw Granite, DBLmi - Becaguimec Lake

xiv
Gabbro, DHPii - Howard Peak Granodiorite, DNWfia - Nashwaak biotite Granite, DNWfib - Nashwaak two-mica Granite, Carboniferous: CCLcc, CHRmv, CSNcc - Mabou Group, CMOmc - Pictou Group; ------- Fault........................................... 169
Fig. 4.2 Scanning electron microscope-cathodoluminescence (SEM-CL) images of quartz from the Nashwaak granite and dykes. In the two-mica granite: a) visible oscillatory zoning parallel to grain boundary (MBG5); b) homogeneous quartz with fractures (MBG5). In the biotite granite: c) homogenous quartz with fluids infiltration along fractures (BG3), d) oscillatory zoning (BG3). In dykes: e) cobweb and splatter texture is caused by corrosion of quartz focused along microfractures in biotite granitic dykes (BGD2); f) step zoning with resorption texture in the porphyry dyke (PD1)....................................................................................................................... 170
Fig. 4.3 Trace element concentration of magmatic quartz analyzed by laser ablation inductively coupled plasma mass spectrometry (LA-ICPMS) (see Table 4.1). ..... 171
Fig. 4.4 Cathodoluminescence (CL) images of representative zircons from a) Nashwaak two-mica granite, b) Nashwaak biotite granite, c) Biotite granitic dykes. Circles indicate the location of ion microprobe analysis spots, δ18O values are beside each circle (‰, VSMOW)............................................................................................... 172
Fig. 4.5 Grain-scale variation plot of zircons from the Nashwaak granite and related dykes. The δ18O values of zircons from different oxygen isotope reservoirs are from Valley et al. (1998, 2005), Bindeman and Valley (2001); Valley (2003); Kind et al. (2008); Bindeman (2008) and the references therein. ............................................ 173
Fig. 4.6 Plot of Al/Ti and Ge/Ti in quartz versus Zr*106/TiO2 in whole rock geochemical analyses (see Chapter 3). See Fig. 4.3 for symbols. ............................................... 173
Fig. 4.7 Crystallization temperature of magmatic quartz from Nashwaak granite and dykes calculated by the Ti-in-quartz geothermometer according to the Ti concentration in quartz (see Wark and Watson, 2006). Three sets of calculations based on assumed activity of Ti in melts are shown, i.e. aTi = 0.5, 0.6 and 1; at the same of Ti content in quartz, calculated temperatures increase with decreasing aTi. See Table 4.1 for data and Fig. 4.3 for symbols. .................................................... 174
Fig. 5.1 Regional geological map showing the distribution of the Nashwaak Granites (1:50 000) and location of the Sisson Brook W-Mo-Cu deposit (modified after Smith and Fyffe, 2006a, b). Cambrian to Early Ordovician: ЄOTLgn - Trousers Lake Metamorphic Suite, ЄOKBmc, - Miramichi Group; Ordovician: OLCfi - Little Clearwater Brook Granite, OMKfi - McKiel Lake Granite, OPBD, OHLfc, OHLmv, OTUls, OTM, OHL - Tetagouche Group; Silurian: SCRfc, SBUmc, STRmc, SSMfc, SBOGii; Devonian: DHfia - Hawkshaw Granite, DBLmi - Becaguimec Lake Gabbro, DHPii - Howard Peak Granodiorite, DNWfia - Nashwaak biotite Granite, DNWfib - Nashwaak two-mica Granite, Carboniferous: CCLcc, CHRmv, CSNcc - Mabou Group, CMOmc - Pictou Group; ------- Fault, ● location of pluton samples, dyke

xv
samples are from star area around the Sisson Brook W-Mo-Cu deposit (see Fig. 5.2).................................................................................................................................. 219
Fig. 5.2 Geological map of the local area around the Sisson Brook W-Mo-Cu deposit (modified after Fyffe et al., 2008). DNW Devonian Nashwaak Granite, DHP Devonian Howard Peak Diorite, DG Devonian gabbro, OPB Ordovician Push and Be Damned Formation, OHL Ordovician Hayden Lake Formation, OTM Ordovician Turnbull Mountain Formation, ЄM Cambro-Ordovician Miramichi Group, Dash line - fault, F - City of Fredericton. Zone I, II, and II of the deposit are noted. ........................... 220
Fig. 5.3 Representative photomicrographs of texture and mineralogy of the Nashwaak granite and related dykes. a) muscovite and biotite cluster with a nearby apatite, plagioclase with altered core and magmatic rim, sample MBG5, cross polarized light (XPL); b) plagioclase inclusion in perthite, sample MBG5, XPL; c) plagioclase with zoning, sample MBG5, XPL; d) biotite inclusion in quartz grain, sample BG1, XPL; e) granophyre texture, sample BG1, XPL; f) relative fresh anhydral biotite occur with plagioclase, sample BGD11, XPL; g) skeletal or resorbed quartz phenocryst, sample PD, XPL; h) zoned plagioclase and biotite phenocryst, sample PD, XPL. 221
Fig. 5.4 Chemical compositional diagram of biotite from the Nashwaak granite and related dykes. a) Ternary TiO2-FeO+MnO-MgO diagram (modified after Nachit et al., 2005), b) Ternary MgO-FeO-Al2O3 diagram (modified after Abdel-Rahman, 1994), c) Fe/(Fe+Mg)-Al diagram (modified after Rieder et al., 1998), d) Al-Mg diagram (modified after Stussi and Cuney, 1996) of biotite from Nashwaak granite and related dykes. ■ two mica granite (Group I), ◆ biotite granite (Group II), ▲ biotite granite dykes (Group III), ● porphyry dyke (Group IV). ............................ 222
Fig. 5.5 Trace-element composition (in ppm) of biotite from the Nashwaak granite and related dykes analyzed by LA-ICPMS. See Fig. 5.4 for symbols. ......................... 224
Fig. 5.6 Intercept value IV(F/Cl) plots against IV(F) for biotite from the Nashwaak granite and related dykes (modified after Munoz, 1984). See Fig. 5.4 for symbols.................................................................................................................................. 225
Fig. 5.7 a) log (Cl/OH), log(F/OH), and log(Cl/F) vs. XMg for the biotite from the Nashwaak granite and related dykes. in each diagram, the relative log(fH2O/fHCl), log(fH2O/fHF), and log(fHF/fHCl) reference lines are calculated at 750 °C. b) detailed log(fH2O/fHCl), log(fH2O/fHF), and log(fHF/fHCl) value of biotite from the Nashwaak granite and relate dykes, these values were calculated based on their relative zircon saturation temperature (TZr) (Watson and Harrison, 1983). All the calculated formulas are from Munoz (1984, 1992). See Fig. 5.4 for symbols. ...... 226
Fig. 5.8 Temperature vs. oxygen fugacity diagram for biotite from the Nashwaak granite and related dykes (see Candela 1989). See Fig. 5.4 for symbols. Grey pattern denotes contaminated I-type granite. Blue pattern represents strongly contaminated reduced I-type granitoids (modified after Ague and Brimhall, 1988). ................... 227

xvi
Fig. 5.9 Classification of the Nashwaak granite and related dykes according to the composition of their magmatic biotite composition (after Ague and Brimhall, 1988a). For comparison purposes, the biotites related to the Mo- and W-porphyry deposits are also shown (modified after Brimhall and Crerar, 1987). I-SC, strongly contaminated I-type; I-MC, moderately contaminated I-type, I-WC, weakly contaminated I-type, I-SCR, strongly contaminated and reduced I-type. See Fig. 5.4 for symbols.............................................................................................................. 227

xvii
List of Symbols and Abbreviations
% - percent
(87Sr/86Sr)i – initial strontium composition
° - Degree
°C – Degree Celsius
µm - Micrometer
‰ – permil or perthousand
2σ SD – Two standard deviations
A/CNK – Molar Al2O3/(CaO+Na2O+K2O)
AFC – Assimilation and fractional crystallization
Ap – Apatite
apfu - Atoms per formula unit
aTiO2 - Activity of Titanium
Bi – Biotite
BSE - Back-scattered Electron
Cpx - Clinopyroxene
DI - Differentiation index
EPMA - Electron probe microanalysis
ɛNd(t) - Initial epsilon neodymium
Eu/Eu* - Eu anomaly
f(HCl) – HCl fugacity
f(HF) – HF fugacity
fCl – Cl fugacity

xviii
fHF – HF fugacity
fO2 – Oxygen fugacity
fS2 – Sulfur fugacity
Ga – 109 years
HFSE - High field strength element
HREE – Heavy rare earth element
Hz - Hertz
INAA - Instrumental neutron activation analysis
J/cm2 – Joule per square centimeter
K-Ar age – Potassium-Argon age
Kb - Kilobar
Kfs - K-feldspar
km - Kilometer
kV - Kilovolts
L.O.D – Limits of detection
LA-ICPMS – Laser ablation-inductively coupled plasma mass spectrometry
LREE – Light rare earth element
m - Meter
Ma – Million years
MASH – Melting, assimilation, storage, and homogenization
mgli - Octahedral Mg minus Li
Mon – Monzonite
MPa - Megapascal

xix
MSWD - Mean square of weighted deviation
Mt - Megatonne
nA – nano Ampere
NNO – Nickel-Nickel oxide buffers
Opx – Orthopyroxene
oz/t – ounce per ton
P - Pressure
PASP - Phlogopite-Annite-Siderophyllite-Polylithionite
Pl – Plagioclase
ppm – Part per million
QFM buffer – Quartz-fayalite-magnetite buffers
Rb-Sr age – Rubidium-Strontium age
REE – Rare earth element
Re-Os age – Rhenium – Osmium age
SEM-CL - Scanning Electron Microscopy – Cathodoluminescence
SIMS - Secondary Ion Mass Spectrometer
T - Temperature
Tap – Apatite saturation temperature
TZr – Zircon saturation temperature
U-Pb age – Uranium – lead age
V-SMOW - Vienna-Standard Mean Ocean Water
Wt.% - Weight percent
XCl - Mole fractions of Cl in the hydroxyl site

xx
XF - Mole fractions of F in the hydroxyl site
XOH - Mole fractions of OH in the hydroxyl site
XPDoxy - Fe3+/sum of octahedral ions
Xphl=Mg/sum of octahedral cations
XPL – Cross-polarized light
XRF - X-ray fluorescence
δ18O – Oxygen isotope composition of a substance relative to a reference material
δ18OQz – Oxygen isotope of quartz
δ18OWR – Oxygen isotope of whole rock
δ18OZrc – Oxygen isotope of zircon
δ34S – Sulfur isotope composition of a substance relative to a reference material
δD – Hydrogen isotope composition of a substance relative to a reference material

1
Chapter 1 Introduction
1.1 Previous research on the tectonic evolution history, magmatism, and tungsten
deposits in the Gander Zone of New Brunswick
The Nashwaak Granite and related dykes are situated along the eastern margin of an
extensive belt of Late Silurian-Early Devonian plutonic rocks that underlie the Miramichi
Highlands of New Brunswick. The Siluro-Devonian magmatism in the Gander Zone is
attributed to collision and lithospheric delamination, which accompanied and followed
accretion of Avalonian belts to Ganderia during the Acadian Orogeny. The Gander Zone
is bordered to the west by the Dunnage Zone (oceanic and arc-type remnants of Iapetus)
and to the east by the Avalon Zone (a distinctive late Precambrian terrane) (Williams,
1979). Several lines of evidence suggest that the suture between Avalonia and Ganderia
lies along the Caledonia-Clover Hill Fault in New Brunswick and Hermitage Bay-Dover
Fault in Newfoundland (Samson et al., 2000; Barr et al., 1998, 2003; van Staal et al.,
2004; van Staal, 2005; Lin et al., 2007, Fig. 1.1). The terrane boundary between the
Dunnage Zone and Gander Zone was considered to be the Rocky Brook – Millstream
Fault (RBMF) by Williams (1979), however, more work has revealed that there is no
simple surface trace of the Gander – Dunnage contact (van Staal and Fyffe, 1991).
Furthermore, the distinctiveness of the Dunnage Zone from the Gander Zone is unclear,
since Ganderia was also shown to include volcanic arc and back-arc elements of the
Exploits Subzone of the Dunnage Zone in Newfoundland (Williams et al., 1988).
Elements of the Notre Dame Subzone of the Dunnage Zone, formed along the Laurentian
continental margin, are not exposed in New Brunswick, but occur in the subsurface

2
beneath covering rocks of the Matapédia Basin in the northwestern part of the Province
(van Staal et al., 1998; Moench and Aleinikoff, 2003; Dupuis et al., 2009).
The closure of Iapetus Ocean was responsible for the formation of the Canadian
Appalachians and terminated with the docking of the Avalonian microcontinent. The
subsequent closure of the Rheic Ocean caused accretion of Meguma and terminated with
assembly of Gondwana and Laurentia into the Pangea supercontinent (van Staal, 2005,
2007). The accretionary orogenies include the Penobscot Orogeny, Taconic Orogeny,
Salinic Orogeny, Acadian Orogeny, and Neo-Acadian Orogeny (Fyffe et al., 2011). In
this geodynamic framework, since the Nashwaak Granite intruded in the Gander Zone
during the Late Silurian to Early Devonian, this chapter will focus on the tectonic
evolution history of the Gander Zone and related magmatism.
1.1.1 Tectonic Evolution of the Gander Zone
Based on the oldest contained rocks in various terranes in the Gander Zone, Fyffe et
al. (2011) classified these terranes into two principal groups: (a) Proterozoic terranes
which include; (1) the Brookville terrane– composing Mesoproterozoic to
Neoproterozoic platformal carbonates and Neoproterozoic to Early Cambrian plutonic
rocks, and (2) the New River terrane– made of Neoproterozoic volcanic arc sequences
and co-magmatic plutons overlain by a Cambrian Penobscot volcanic arc sequence; and
(b) early Paleozoic terranes which include: (1) the St. Croix terrane– A Cambrian to
Upper Ordovician sedimentary sequence deposited on the passive margin of the New
River terrane, (2) the Annidale terrane– A Upper Cambrian to lower Lower Ordovician
Penobscot volcanic arc-back-arc sequence, unconformably overlying a upper Lower
Ordovician volcanic sequence, (3) Miramichi terrane– A Cambrian to Lower Ordovician

3
sedimentary sequence, unconformably overlying the Middle to Upper Ordovician
Tetagouche volcanic back-arc sequence; and a Lower to Middle Ordovician Meductic
volcanic arc sequence, (4) Elmtree terrane–Middle to Upper Ordovician backarc
ophiolitic sequence, and (5) Popelogan terrane–Middle to Upper Ordovician volcanic arc
sequence. Another terrane termed Caledonia in coastal New Brunswick comprises
Neoproterozoic volcanic arc sequences and comagmatic plutons is considered to form
part of the microcontinent of Avalonia, and therefore will not be discussed here (Fig.
1.2).
1.1.1.1 Penobscot Orogeny (514-482 Ma)
The Penobscot arc underwent rifting at 500-495 Ma, and then closed between 485
and 479 Ma, producing the short-lived Penobscot Orogeny (Zagorevski et al., 2007).
Remnants of this Penobscot arc/back-arc system can be traced in the Belleisle Bay area in
New Brunswick. In the Annidale terrane, deformed plutons related to subduction zone
magmatism of 481 ± 2 Ma (U-Pb zircon, Johnson et al., 2012) and a conglomerate
between an early arc-backarc volcanosedimentary sequence and late rhyolite of 478 ± 2
Ma (U-Pb zircon, Johnson et al., 2012) were interpreted to record uplift related to
Penobscot orogenesis. The post-tectonic Stewarton Gabbro that truncated the deformation
textures related to the Penobscot orogenesis, yielded a U-Pb zircon age of 479 ± 2 Ma
(U-Pb zircon, Johnson et al., 2012). Thus the Penobscot tectonic event in southern New
Brunswick terminated in the Early Ordovician (Johnson et al., 2009). During the Early
Ordovician, the Miramichi terrane was likely situated in the forearc area of the Penobscot
arc and thus it would have contained few magmatic rocks and its back-arc area may have
experienced more or less continuous sedimentation during Penobscot orogenesis. The

4
Miramichi terrane also shares a similar history with the Annidale terrane during the
Penobscot uplift and evidence shows they are part of a single arc-backarc system (Fig.
1.3, Fyffe et al., 2011).
1.1.1.2 Taconic Orogeny (460-450 Ma)
The Taconic Orogeny, as re-defined by van Staal et al. (2007), encompasses all the
orogenic events that took place in the peri-Laurentian realm between the Late Cambrian
and Late Ordovician (495-450 Ma). This orogeny comprises three orogenic events,
referred to as Taconic 1, 2, and 3. Taconic 1 represents west-directed obduction of the
Lushs Bight oceanic tract onto the peri-Laurentian Dashwoods micro-continent in
Newfoundland. Taconic 2 was a result of dextral oblique collision of an Early Ordovician
west-facing Notre Dame arc in Newfoundland with the Humber margin and obduction of
suprasubduction zone oceanic lithosphere of the intervening Humber seaway. It ended by
the collision of the peri-Laurentian Red Indian Lake arc with the west-facing peri-
Gondwanan Popelogan-Victoria arc along the Red Indian Line (RIL) (Taconic 3) that is
the principal Iapetan suture in the northern Appalachians and is largely covered in New
Brunswick. The uplift of the Popelogan arc was recorded as a late Ordovician calcareous
grit that disconformably overlies late Ordovician volcanic rocks and black shales in the
Popelogan terrane (Wilson et al., 2000). The Tetagouche back arc basin was opened
during the rifting of Popelogan-Victoria arc (ca. 470 Ma) (van Staal and Fyffe, 1991,
1995; van Staal et al., 1991, Fig. 1.1).

5
1.1.1.3 Salinic Orogeny (450-423 Ma)
Salinic orogenesis was due to a mid-Silurian (430-422 Ma) collision between the
Gander margin and composite Laurentia following terminal closure of the Tetagouche-
Exploits backarc basin between the Popelogan-Victoria arc and passive Gander margin
(van Staal, 1994, 2007). The closure of the Tetagouche backarc basin is recorded by the
unconformities within the Silurian Chaleurs Group along the southeastern margin of the
Matapédia Basin. One of these unconformities is the Lower Silurian conglomerate of the
Weir Formation of the Chaleurs Group that overlies Middle Ordovician gabbroic rocks of
the Elmtree terrane. The other one is the Simpsons Field conglomerate, which is
conformably overlain by Upper Silurian reefal limestone of the LaPlante Formation. This
reefal unit is referred to as the West Point Formation in the Campbellton area, where it
disconformably overlies the lower part of the Chaleurs Group (Noble, 1985; Wilson,
2002; Wilson et al., 2004; Dimitrove et al., 2004; Wilson and Kamo, 2008, Fig. 1.1).
1.1.1.4 Acadian Orogeny (421-400 Ma)
Early orogenesis including the Penobscot, Taconic, and Salinic orogenies are caused
by the volcanic arc accretion and are relatively local in nature, whereas the Acadian
Orogeny is related to the collision between the Avalon Zone and the Laurentian margin,
and the Acadian deformation is widespread in the northeastern Appalachian orogen (Bird
and Dewey, 1970; Bradley, 1983; Malo, 2001; Tucker et al., 2001). The suture between
Avalonia and Laurentia lies along the Caledonian-Clover Hill Fault in New Brunswick
(Samson et al., 2000; Barr et al., 1998, 2003; van Staal et al., 2004; van Staal, 2005; Lin
et al., 2007). The closure of the Acadian Seaway, which began during the Late Silurian at
around 421 Ma in Maritime Canada, induced the inversion of the Mascarene back-arc

6
basin (Fyffe et al., 1999), which contained a bimodal volcanic assemblage that represents
within-plate, subalkalic geochemical signatures (van Wagoner et al., 2001, 2002). The
progressive hinterland migration of the Acadian deformation front was explained by
Murphy et al. (1999) as being attributed to a west-dipping ‘flat-slab’ subduction of
Avalonia beneath the Laurentian margin (Fig. 1.1).
Fig. 1.1 Lithotectonic divisions of the northeastern Appalachian orogen (modified after Hibbard et al., 2006).

7
Fig. 1.2 Lithotectonic terranes and cover sequences of New Brunswick. Faults: 1) Jacquet River; 2) Rocky - Brook Millstream; 3) Catamaran-Woodstock; 4) Bamford Brook-Hainesville; 5) Fredericton; 6) Sawyer Brook; 7) Turtle Head-Pendar Brook; 8) Falls Brook-Taylor Brook; 9) Wheaton Brook–Back Bay; 10) Belleisle-Beaver Harbour; 11) Kennebecasis-Pocologan; and 12) Caledonia-Clover Hill. Abbreviations: MK = Markey Brook inlier; NR = New River terrane; BV = Brookville terrane; CD = Caledonia terrane. Modified after Fyffe et al. (2011).

8
Fig. 1.3 Paleotectonic setting for Early Paleozoic arc-backarc systems in New Brunswick. a) Late Cambrian tectonic setting. The Brookville terrane is assumed to be offsection at this time and that the passive margin sedimentary rocks of the St. Croix terrane are included as part of the New River terrane; b) Middle Ordovician accretion of the New River terrane to the Miramichi terrane following closure of the Penobscot backarc basin. The Miramichi and Annidale terranes are assumed to have occupied a similar paleogeographic position and were part of a single arc-backarc system. Modified after Fyffe et al. (2011).
1.1.2 Magmatism in the Gander Zone
Two major magmatic belts occur in New Brunswick: one is along the Miramichi
Highlands and the other is around the Saint George Batholith in southern New Brunswick
close to the suture between the Gander Zone and Avalon Zone. The volcano-sedimentary
rocks of the Miramichi Highlands in the Bathurst area consist of a Cambrian to Lower
Ordovician quartzose sedimentary sequence of the Miramichi Group overlain by Middle
to Upper Ordovician bimodal volcanic rocks of the Bathurst Supergroup (the Tetagouche,
California Lake, Sheephouse Brook, and Fournier groups) (Helmstaedt, 1971; Fyffe,
1976, 1982; Whitehead and Goodfellow, 1978; Neuman, 1984; van Staal, 1987; van Staal

9
and Fyffe, 1991, 1995; van Staal et al., 1991, 2003; Fyffe et al., 1997). The Miramichi
Highlands near Woodstock in west-central New Brunswick are characterized by a
quartzose sedimentary sequence of the Woodstock Group and an overlying volcanic
sequence of the Meductic Group (Fyffe, 2001).
The Ordovician felsic plutonic rocks of the Miramichi Highlands were investigated
by Whalen et al. (1998), and in order to facilitate discussion, the plutons were subdivided
into the northern (South Little River Lake, Popple Depot, Meridian Brook, Sweat Hill,
and Mullin Stream Lake), central (Serpentine River, Fox Ridge, and South Renous), and
southern (Gibson) groups. Major- and trace-element compositions of the most northern
and central plutons are felsic (SiO2 > 70 wt.%) with high K and Na contents, whereas the
southern plutons are of intermediate composition and metaluminous to weakly
peraluminous. Although most Ordovician Gander Zone granites are I-type granites, their
HFSE contents are transitional between typical I-type and A-type granites (Whalen,
1993, Whalen et al., 1987). Geotectonic geochemical discrimination diagrams by Pearce
et al. (1984) shows the southern plutons are volcanic arc granites, whereas the northern
and central plutons plot in the within-plate granite fields, but are close to and straddle the
volcanic arc and within-plate boundary. Primitive mantle-normalized spider diagrams
show these granites have negative Ba, Sr, Eu, and Ti anomalies that may be the result of
fractional crystallization. However, the negative Nb anomalies are a common feature for
the igneous rocks formed in a destructive plate margin setting and of melts derived from
or contaminated by arc-like crust. The granites have ɛNd(t) between -4.0 to +0.3 and
oxygen isotopes (δ18O) of +8.0 to +10.1‰ (Whalen et al., 1998). Field, geochemical, and
isotopic evidence indicate that they are mainly derived from Proterozoic or older

10
infracrustal sources. The southern plutons show continental arc-type features (Whalen et
al., 1998).
The Siluro-Devonian granitoids in the Gander Zone are also felsic (SiO2 > 67 wt.%)
and metaluminous to weakly peraluminous, and are typically I-type granites. Presence of
contemporaneous gabbroic to dioritic and granitic units in some Silurian plutons, plus
field and geochemical evidence of high-level comingling of these magmas, indicate
magma mixing played a vital role in producing these granitoids (Whalen et al., 1996a,
Yang et al., 2008). In the geochemical discrimination diagrams illustrating inferred
tectonic setting, these granitoids plot along and straddle the boundary between volcanic-
arc and within-plate granites. Lead isotopic compositions of these granites plot along or
near the upper crust reference curve and on or near the orogene reference curve (Zartman
and Doe, 1981), consistent with input from old crustal material. The generally negative
ɛNd(t) indicate that the Gander Zone plutons were derived from a reservoir with a long-
term history of LREE enrichment. The oxygen isotopic values of these granites range
from +7.4 to +10.4‰ indicating these granites are ‘normal granite’ (Taylor, 1968, 1978;
Taylor and Sheppard, 1986). Slightly positive ɛNd(t) and lack of a Nb anomaly shows the
Silurian gabbros are derived from an enriched mantle source. However, the nature of the
lower crust for the Gander Zone is poorly known. A general model for the Silurian to
Devonian granitoids is that they were derived by bulk assimilation of Meso-Proterozoic
Gondwanan basement ± the overlying Gander Zone sedimentary prism, by enriched
asthenospheric mantle-derived melts (Whalen et al., 1996a). Post-orogenic Devonian
granitoid petrogenesis likely involved re-melting of hybridized lower crust generated
during earlier orogenic plutonic episodes (Whalen et al., 1996a).

11
In southern New Brunswick, the Gander – Avalon boundary is obscured by
boundary-parallel faults and various cover sequences (Fig. 1.2). Whalen et al. (1996b)
investigated the geochemical features of the Siluro-Devonian granites, which include the
Pleasant Ridge, Beech Hill, Kedron, Sorrel Ridge, Mount Pleasant, McDougall Brook,
Tower Hill, John Lee Brook, and Canaan River granites in southern New Brunswick
along the Avalon-Gander boundary region. They are alkali-rich with the SiO2 greater
than 73 wt.%. On the basis of their chondrite-normalized rare earth element (REE)
patters, these plutons can be subdivided into (La/Lu)N < 4 and (La/Lu)N > 4 groups, with
Eu/Eu* < 0.2 and Eu/Eu* > 0.2, respectively. The (La/Lu)N < 4 group is more enriched in
F, Cs, Rb, Li, Nb, Ta, Y, Th, and U relative to the (La/Lu)N > 4 group. The primitive
mantle-normalized diagram shows these granites have pronounced negative Ba, Sr, Eu,
and Ti anomalies without Nb anomalies. Using geotectonic geochemical discrimination
diagrams by Pearce et al. (1984) shows that the (La/Lu)N < 4 group plots within the syn-
collisional granite (S-type) field or straddles its boundary with the within-plate granite
field, whereas the (La/Lu)N > 4 group plots within the volcanic-arc (I-type) or syn-
collisional field. The whole-rock oxygen isotope compositions of these granites are from
7.1 to 10.3‰, which is consistent with normal granites and might be derived from mixed
juvenile (mantle – lower crustal) and supracrustal sources (Taylor, 1978, 1988; Taylor
and Sheppard, 1986). In general, the sources of Precambrian and Paleozoic Avalon
plutons were isotopically distinct. Mainly juvenile granitoid melts were repeatedly
generated within the Avalon Zone with positive ɛNd(t), whereas the significant older crust
was repeatedly recycled in the Gander plutons with negative ɛNd(t) values (Whalen et al.,
1996b). The ɛNd(t) values of these Siluro-Devonian granites calculated at 0.4 Ga are from

12
-1.7 to +0.9 spanning the gap between typical Avalon and typical Gander Zone granites
(Whalen et al., 1996b). Thus they could be derived from either stratigraphically
overlapping or tectonically interleaved Gander and Avalon basement rocks or a distinct
basement source beneath the boundary zone. It is most likely that the boundary zone
between the Gander and Avalon zones is not a simple crustal fault and basements below
the Gander and Avalon zones are different (Whalen et al., 1996b).
Shabani et al. (2003) analyzed the geochemical composition of biotite from
Paleozoic granitic rocks of the Canadian Appalachians. The results show that biotite from
granites of the Gander Zone of New Brunswick and Newfoundland have mean
Fe/(Fe+Mg) of 0.6 and total Al ranging from 1.05 to 1.75 atoms per formula unit (apfu),
confirming significant contributions of aluminous supracrustal material to the magmas,
either by assimilation or anatexis. The biotite from the Gander Zone formed under
oxygen fugacities on or above the NNO buffer, indicating moderately oxidizing
conditions.
1.1.3 Tungsten deposits in the Gander Zone
The distribution of tungsten deposits and occurrences in New Brunswick reveals a
close spatial relationship to granitic plutons of Devonian age. Currently, those at Sisson
Brook and Mount Pleasant are considered to have economically viable reserves of
tungsten and associated metals. The Burnthill deposit contains tungsten mineralization at
relatively high grades, but only a limited tonnage has been delineated to date. The Lake
George deposit, North American’s largest producer of antimony (Morrissy and
Ruitenberg, 1980; Scratch et al., 1984), also contains a potentially important source of
scheelite and molybdenite (Seal et al., 1987). Several other prospects, including those at

13
True Hill (Lentz and McAllister, 1990), Wildcat Brook, Flume Ridge, and Foster Lake,
show potential for significant tungsten concentrations (Stewart et al., 2011).
1.1.3.1 Lake George Sb-Au-W-Mo deposit
The Lake George Sb-Au-W-Mo polymetallic mineral deposit lies approximately 40
km southwest of the city of Fredericton. In 1970, Durham Resources Inc. had produced
approximately one million tonnes of 3.0 to 3.5 percent Sb from orebody 1 and 800,000
tonnes of 4.15% Sb from orebody 2 on the east-west-striking Hibbard vein. A later
drilling program found an extensive zone of scheelite and molybdenite mineralization in
both the hanging wall and footwall of the Hibbard vein. More recently, it has been noted
that gold anomalies are widespread in drill cores (Morrissy, 1991a; Lentz et al., 2002a),
and ore grade (up to 0.416 oz/t Au, 13.0 g/t) bodies are locally developed (Morrissy,
1991b).
The country rocks to the Lake George Sb-Au-W-Mo polymetallic mineral deposit
are deformed Silurian turbiditic metasediments of the Fredericton cover sequence
consisting of greywacke-sandstone, siltstone, and black nongraphitic slate (Fyffe and
Fricker, 1987). All of these metasedimentary rocks contain various amounts of carbonate
(Procyshyn and Morrissy, 1990). They are tightly folded and metamorphosed to lower
greenschist facies and cut by a northeast-trending axial-planar spaced cleavage that is
thought to be related to the Acadian Orogeny (Ruitenberg and McCutcheon, 1982). The
Pokiok Batholith lies 3 km northwest of the deposit and has been subdivided into five
units (Ruitenberg and Fyffe, 1982; Lutes, 1987; Whalen, 1993; Whalen et al., 1996a).
The Hartfield Tonalite is the oldest unit (U-Pb titanite, 415 ± 1 Ma), followed by the
Skiff Lake Granite (U-Pb zircon, 409 ± 2 Ma), and the Hawkshaw Granite (U-Pb titanite,

14
411 ± 1 Ma) (Bevier and Whalen, 1990a, b; Whalen, 1993). The Lake George
granodiorite stock was dated at 414 +4/-5 Ma (U–Pb zircon), the Allandale Granite dated
at 402 ± 1 Ma (U-Pb monazite) (Whalen, 1993; see McLeod et al., 2004), and a
pegmatite-aplite dyke along the northeastern cusp of the Hawkshaw Granite yield ages
ranging from 400.5 ± 1.2 Ma to 404 ± 8 Ma (U-Pb zircon) (Beal et al., 2010). In the
deposit area, the intrusive rocks include a narrow east-west lamprophyre dyke, which is
cut by a quartz-feldspar porphyry dyke (420.8 +5.9/-4.0 Ma, U-Pb zircon, Lentz et al.,
2002b; Leonard et al., 2006). The Lake George granodiorite is suggested to be linked to
the exocontact W-Mo-Au mineralization (Lentz et al., 2002a). The intrusion of the
granodiorite into metasedimentary rocks causes contact metamorphism around the stock,
as indicated by the formation of biotite and cordierite in the pelitic rocks (Caron, 1996).
The granodiorite is metaluminous to weakly peraluminous (A/CNK = 0.99-1.13), calc-
alkaline, Na2O > K2O, and has (La/Yb)N from 7.34 to 11.14 with a small negative Eu
anomaly, as well as obvious negative Nb, Ti, Sr, and Ba anomalies. It is a typical I-type
granite, derived from partial melting of arc-like lower continental crust in a volcanic arc
to late orogenic environment and most closely resembles the Hawkshaw phase of the
Pokiok Batholith (Yang et al., 2002).
Three stages of tungsten-molybdenum mineralization have been identified by Seal et
al. (1987, 1988). The first stage is characterized by calc-silicate (granditic garnet,
wollastonite, clinopyroxene, and calcic amphibole) -bearing quartz veinlets, with Ca
metasomatic alteration envelopes. The temperature of the hydrothermal fluids ranges
from 550° to 228 °C. The succeeding stage is quartz veinlets with lesser amounts of
perthitic alkali feldspar, muscovite, calcite, scheelite, molybdenite, and pyrite. This stage

15
of mineralization occurred at the temperature range from 400° to 175 °C under a pressure
of ~1.3 kb (130 MPa). High grade mineralization is typically located within the lower
temperature zone where CO2 effervescence is evident. Based on combined mineralogical
and fluid inclusion studies, this two stage scheelite and molybdenite deposition is related
to decreasing temperature and increasing pH. The last stage of mineralization is
represented by veinlets of prehnite, molybdenite, and quartz. They are volumetrically
minor in this deposit.
The economic stibnite-quartz veins occupy fractures that transect all the stages of W-
Mo mineralization. There are three types of alteration zones related to the Sb
mineralization (Scratch et al., 1984). The first is fracture-controlled argillic alteration
containing arsenopyrite, pyrite, and pyrrhotite. The second is a thin siliceous rind that
transects the argillic zone and is related to Sb-bearing quartz vein emplacement along the
fractures. The third is an extensive oxidized zone of hematite - magnetite - quartz
alteration, which is coeval with the second stage siliceous alteration. The ore-bearing
fluid with δ18O of 11 to 12 ‰ and δD value of -20 to -30 ‰, underwent transient boiling
at pressures of 600 to 900 bar, when the temperature fell to the 340 to 350°C range, and
precipitated ore minerals along fractures (Scratch et al., 1984). The high δ18O of fluids
suggest they might be derived from the granitic melts, which partially assimilated the Sb-
bearing metasediments or came from meteoric water, which underwent large positive
shifts in δ18O and salinity during convection through the Sb-bearing metasediments. The
latest hematite alteration is interpreted to be unrelated to the mineralization process
(Scratch et al., 1984). The results of the studies on fluid inclusions from W-Mo-Sb
mineralization show similarities in phase relations, final homogenization, and salinities

16
with the fluids in quartz phenocrysts from the Lake George granodiorite (Yang et al.,
2004), thus they are genetically linked.
1.1.3.2 Burnthill W-Mo-Sn deposit
The Burnthill deposit is situated within the Miramichi Highlands of central New
Brunswick and is suggested to be related to the Burnthill Granite, which is a polyphase
intrusion of biotite granite with a surface area of approximately 180 km2. This pluton
intrudes the Cambrian to Middle Ordovician Tetagouche Group, which comprises a thick
quartzose wacke-slate sequence overlain by pillow basalt, minor felsic volcanic rocks,
and lithic wacke interbedded with slate that have undergone greenschist facies
metamorphism. The Tetagouche Group is in faulted contact with lithic wacke and slate of
the Silurian Kingsclear Group in the southeast. To the northwest there is an adjacent
amphibolite-facies complex of paragneiss, biotite schist, and amphibolite cut by
concordant plutons of Ordovician metamorphosed granites. The metamorphic complex is
in faulted contact with interbedded volcanic and shallow marine sedimentary rocks of the
Lower Devonian Tobique Group in the northwest (Fyffe, 1982a). All of these rocks were
affected by the Acadian Orogeny during which time (Late Silurian to Early Devonian)
syntectonic intrusions of gabbro and granite were emplaced, mostly along the margins of
the Miramichi Terrane (Crouse, 1981; Irrinki, 1981; MacLellan et al., 1990).
The multi-phase Burnthill intrusion is texturally heterogeneous, consisting primarily
of coarse-grained seriate to equigranular biotite granite with alkali feldspar phenocrysts
(MacLellan et al., 1990). Near the southern end of the intrusion are zones of equigranular
biotite granite and equigranular biotite microgranite. The rock closest to the veins is the
microgranite and it is the equigranular granites that in general are most spatially

17
associated with tungsten mineralization (MacLellan et al., 1990). The entire pluton is
crosscut by numerous aplitic dykes and granophyric phases. Homogeneous, fine-grained,
equigranular biotite granite has only been encountered in diamond drill holes beneath the
deposit and is a possible source for the mineralization. Geochronological dating gives an
age of 381 Ma (40Ar/39Ar muscovite and biotite; Taylor et al., 1987) for the Burnt Hill
granite and 380 Ma for the proceeding mineralization (40Ar/39Ar muscovite; Taylor et al.,
1987).
Mineralization at the Burnthill deposit consists of both endogranitic and exogranitic
polymetallic mineralization deposit. The exogranitic mineralization is characterized by
eight W-Mo-bearing quartz vein zones in a plan area approximately 500 m long by 300 m
wide to a down-dip depth of 275 m. The veins have been emplaced in 303°-trending
fault(s), fractures, and joint sets. Veins occur as en-echelon swarms or as sheeted veins
up to 1.5 m wide with an average of 0.3 m wide. Narrower veins tend to contain higher
grade tungsten, and the larger veins show evidence of multi-stage deposition. These
quartz veins contain wolframite with minor scheelite, molybdenite, cassiterite, beryl,
topaz, fluorite, bismuthinite, muscovite, and other minor sulphides. Endogranitic
mineralization was intersected in the Burnthill Granite in several drill holes that contain
molybdenite and cassiterite disseminated within quartz-greisen and in greisen veins.
Open pit resources at Burnthill are estimated as indicated resources of 527 000 tonnes
grading 0.303% WO3, 0.005% MoS2, and 0.005% SnO2 and inferred resources of 82 000
tonnes grading 0.147% WO3, 0.003% MoS2, and 0.003% SnO2 at a cut-off grade of
0.07% WO3 (Wahl and Burt, 2013). Underground resources are estimated as indicated
resources of 1,234,000 tonnes grading 0.287% WO3, 0.008% MoS2, and 0.009% SnO2

18
and inferred resources of 1,438,000 tonnes grading 0.27% WO3, 0.008% MoS2, and
0.005% SnO2 at a cut-off grade of 0.16% WO3 (Wahl and Burt, 2013).
Although the Burnthill Granite is texturally heterogeneous, it is compositionally
quite uniform, being dominated by biotite monzogranites and alkali feldspar granites,
with minor muscovite- and garnet-bearing phases. It also has high silica (SiO2 > 74%)
and is mildly peraluminous. The compatible elements that are concentrated in feldspars
(Sr, Ba, Eu) and in mafic silicates (e.g., biotite (Cr, Co)) are strongly depleted. Normative
compositions indicate the Burnthill granite crystallized at low pressure (ca. 1 kbar, 100
MPa) under vapour-saturated conditions with temperatures ranging from 730-800°C
(MacLellan and Taylor, 1989).
1.1.3.3 Mount Pleasant (W-Mo-Bi and Sn-Zn-In) deposit
The Mount Pleasant Caldera is bounded to the east and west by polydeformed
Ordovician to Silurian turbiditic metasedimentary rocks and to the south by Late Silurian
to Devonian granitic rocks of the Saint George Batholith (McLeod et al., 1988; McLeod,
1990). To the north, the caldera is disconformably overlain and concealed by
Carboniferous sedimentary rocks. Mount Pleasant is located near the southwest margin of
the caldera complex (Sinclair et al., 2006). Rocks within the caldera constitute the Upper
Devonian Piskahegan Group, which largely consists of bimodal volcanic rocks and is
divided into exocaldera, intracaldera, and late caldera-fill sequences (McCutcheon,
1990a, 1990b; McCutcheon et al., 1997, 2001). The Mount Pleasant Caldera formed
during the transition from a compressional to a transtensional tectonic setting, i.e., during
initial development of the Maritimes Basin (McCutcheon et al., 1997).

19
Granitic intrusions within the Late Devonian Mount Pleasant Caldera include the
McDougall Brook (MBG) and the slightly younger Mount Pleasant (MPG) granitic
suites. The MBG is a polyphase suite mainly consisting of marginal feldspar porphyry,
fine-grained porphyritic monzogranite, and minor fine-grained equigranular to
subporphyritic quartz monzonite (McCutcheon, 1990a; McCutcheon et al., 1997, 2001).
The northern half of the MBG intrudes intracaldera rocks, including Seelys Formation
(rhyolite and ash flow tuffs) to the south, Scoullar Mountain Formation (sedimentary
breccia, andesitic and rhyolitic ash flow tuffs) to the west, and exocaldera Bailey Rock
Rhyolite to the north and east. The southern half of the MBG mostly intrudes the Little
Mount Pleasant Formation (rhyolitic ash flow tuffs) (McCutcheon, 1990a). The
polyphase MPG is composed of fine-grained equigranular granite (GRI), aplitic to
porphyritic granite (GRII), and fine- to medium-grained equigranular granite (GRIII)
(Kooiman et al., 1986; Sinclair et al., 1988; McCutcheon et al., 2001) and intrude in the
sequence from GRI to GRIII. The GRI unit is heavily brecciated and altered, and is
genetically related to early W-Mo-Bi mineralization (Kooiman et al., 1986; Sinclair et al.,
1988; McCutcheon et al., 2001; Yang et al., 2003; Inverno and Huchinson, 2004). The
MPG intrudes intracaldera rocks (Scoullar Mountain and Little Mount Pleasant
formations) and cuts the MBG along the southwestern margin of the caldera (Sinclair et
al., 1988; McCutcheon et al., 1997, 2001).
A U-Pb zircon age of 363.4 ± 1.8 Ma (Tucker et al., 1998) was obtained for the
Bailey Rock rhyolite that is considered to be the extrusive equivalent of the McDougall
Brook feldspar porphyry (McCutcheon et al. 1997), which was thought to be earlier than
the mineralizing events. However, new Re-Os ages of 369.7 ± 1.6 Ma and 370.1 ± 1.7

20
Ma obtained from molybdenite samples associated with tungsten-molybdenum
mineralization at the Fire Tower Zone constrain the age of intrusion of Granite I and the
initial onset of mineralization to ca. 370 ± 2 Ma (Thorne et al., 2013).
The mineralization occurs in two main zones (North and Fire Tower zones) that are
located approximately 1 km apart with a smaller third zone (Saddle Zone) located
halfway in between. The Fire Tower Zone consists predominantly of tungsten-
molybdenum mineralization, which is cross-cut by minor tin and zinc lodes. The North
Zone consists predominantly of indium-bearing tin-zinc mineralization with lesser earlier
tungsten-molybdenum mineralization. The Saddle Zone consists of tin mineralization
underlying a topographically depressed area between the North and Fire Tower zones.
The total NI 43-101 resource estimate for the Fire Tower Zone presently includes an
indicated resource of 13,489,000 tonnes at 0.33% WO3 and 0.21% MoS2 and an inferred
resource of 841,700 tonnes at 0.26% WO3 and 0.20% MoS2 (Dunbar et al., 2008). At the
North Zone, the NI 43-101 resource estimate consists of 12,400,000 indicated tonnes
averaging 0.38% Sn, 0.86% Zn, and 64 ppm In, as well as an inferred resource of
2,800,000 tonnes averaging 0.30% Sn, 1.13% Zn, and 70 ppm In (McCutcheon et
al., 2012).
Petrochemical studies of the McDougall Brook Granitic Suite (MBG) and the Mount
Pleasant Granitic Suite (MPG) shows that the low-silica (< 70 wt.%) MBG and the high-
silica (> 74 wt.%) MPG are calc-alkaline and metaluminous to weakly peraluminous
(A/CNK = 0.91 – 1.28), and exhibit some crustal A-type granite affinities (Yang et al.,
2003). However, compared to the MPG, the MBG has lower amounts of incompatible
trace elements, a more pronounced negative Nb anomaly, enriched REE patterns with

21
smaller negative Eu anomalies, and lower negative Ti, Sr, and Ba anomalies. Trace-
element modelling, major-element composition, and petrological evidence indicate that
the MBG and MPG may have formed through pulse injection of magmas produced by
fractional crystallization from felsic magma chambers at depth. Given low Sr and high
initial 87Sr/86Sr ratio (0.7126) together with εNd(t) (-0.2) and δ18O values (8.2-8.6‰) of
the MPG rocks, the most likely scenario is that the magma originated from partial
melting of juvenile materials and was subsequently contaminated by supracrustal rocks
(Kooiman et al., 1986; Taylor, 1992; Whalen et al., 1996b; Yang et al., 2003).
In the Fire Tower Zone, Samson (1990) identified two mineralization stages of
which stage I is related to the W-Mo mineralization with quartz±topaz and/or fluorite,
and lesser green biotite, chlorite, K feldspar, and sericite. Stage II consists of Sn–bearing
minerals, sulphides, fluorite, and chlorite. Three fluid inclusion types were sampled from
the quartz, fluorite, and topaz in these two mineralization stage zones (Samson, 1990).
Type 1 are low-salinity (mostly < 10 equiv. wt.% NaCl+CaCl2) liquid-vapour inclusions,
which homogenized to liquid; type 2 are vapour-rich inclusions that homogenize to
vapour, and type 3 are high-salinity (30-60 equiv. wt.% NaCl) liquid-vapour-solid
inclusions, most of which homogenize to the liquid phase. All three inclusion types are
found in minerals from stage I and only type 1 is found from stage II. Orthomagmatic
low-salinity vapour and high-salinity liquids exsolved from the crystallizing fine-grained
granite mixing with ground water are responsible for the W-Mo mineralization, whereas
the later orthomagmatic fluids from the later intrusion of the granite porphyry and/or
porphyritic granite formed the Sn-bearing, polymetallic zone.

22
1.1.3.4 Sisson Brook (W-Mo-Cu) deposit
The Sisson Brook deposit is situated along the eastern margin of an extensive belt of
Late Silurian–Early Devonian plutonic rocks that underlie the Miramichi Highlands of
New Brunswick. The plutonic rocks were emplaced into a variety of country rocks,
including sedimentary rocks of the Cambrian–Early Ordovician Miramichi Group,
volcanic and sedimentary rocks of the Ordovician Tetagouche Group, and deformed
Ordovician plutonic rocks (Fyffe, 1982a, 1982b; van Staal and Fyffe, 1991). The two
Late Silurian–Early Devonian plutons in the immediate vicinity of the Sisson Brook
deposit are referred to as the Howard Peak Granodiorite (432.1 ± 1.9 Ma, U-Pb titanite,
Bustard, 2013) and Nashwaak Granite (Fyffe et al., 1981).
The oldest rocks are quartzose wackes interbedded with siltstones and shales of the
Cambrian-Early Ordovician Miramichi Group, which are thought to occupy the core of a
north-northeast-trending, southerly plunging anticline in the area (Lutes, 1981). These
rocks are bounded to the east and west by younger volcanic and sedimentary rocks of the
Ordovician Tetagouche Group. To the west, the rocks of the Miramichi Group are in
faulted contact with felsic crystal tuffs, mafic tuffs, and clastic sedimentary rocks of the
Ordovician Turnbull Mountain Formation, and to the east, they are overlain
unconformably by black shales, flow-banded felsic volcanic rocks and fragmental mafic
volcanic rocks of the Ordovician Hayden Lake Formation.
The Howard Peak Granodiorite is a medium-grained, foliated, hornblende–biotite
granodiorite that grades eastward into, and becomes intermixed with, dark grey, medium-
grained ophitic gabbro. Both the granodiorite and gabbro are transected by veins and
stringers of foliated, light greyish pink, equigranular to porphyritic granite. The eastern

23
margin of the pluton is intensely sheared and cataclasitized, and it contains an abundance
of elongated, schistose xenoliths derived from the adjacent folded country rocks (Lutes,
1981; Venugopal, 1982).
The Nashwaak Granite is a massive, light greyish pink, medium-grained,
equigranular to subporphyritic biotite granite that grades into a muscovite–biotite granite
in the north (Fyffe et al., 2008).
Mineral composition and fluid inclusion research show that there are four
mineralization stages for the Sisson Brook deposit (Nast, 1985; Nast and Williams-Jones,
1991): 1) Disseminated and vein-bearing molybdo-scheelite with amphibole alteration.
This stage was controlled by the supplement of Ca that is derived from host rocks in a
low fluid-rock setting; 2) Molybdenite in quartz veins with biotite alteration. This stage is
marked by increasing fS2 and temperature; 3) scheelite in quartz veins with biotite
alteration. This is the result of high Ca contents of the host rocks and/or biotitization; 4)
wolframite and chalcopyrite in quartz vein stockworks with phyllic alteration. This
process is probably related to temperature decreasing, and/or decreasing pH, and/or
increasing fS2.
Previous geochronological studies on the Nashwaak Granite yielded a Rb-Sr
muscovite age of 422 ± 4 Ma and a K-Ar muscovite age of 386 ± 5 Ma (Whalen and
Theriault, 1990). Based on this K-Ar age, Taylor et al. (1987) considered the Sisson
Brook deposit to be contemporaneous with the nearby Burnthill deposit, which also
occurs in the Miramichi lithotectonic zone. However, if the Sisson Brook deposit is
related to the later feldspar - quartz - biotite (FQB) porphyry dyke (364.5 ± 1.3 Ma, U-Pb
zircon age; Fyffe et al., 2008) as several geologists have suggested (Mann, 1981; Nast,

24
1985; Nast and Williams-Jones, 1991), it would therefore be contemporaneous with the
late Devonian Mount Pleasant volcanic complex (363.4 ± 1.8 Ma, U-Pb zircon age;
Tucker et al., 1998) in southwestern New Brunswick instead.
1.2 Goals of this thesis
In the Sisson Brook area, previous studies include the fluid inclusion studies by Nast
(1985) and Nast and Williams-Jones (1991), and geochronology by Whalen and Theriault
(1990) and Fyffe et al. (2008). However, ages of other subfacies are still unknown.
Considering the K-Ar contents in granite could be modified by later magma activities or
hydrothermal alteration, U-Pb zircon dating could offer a more robust method to
constrain the age of emplacement of the Nashwaak two-mica granite. Further detailed
dating on other different felsic units, and molybdenite, which is a common ore-forming
mineral in quartz veins, would help to identify which rock unit is attributed to the
mineralization of the Sisson Brook deposit. This research also aims to gain a better
understanding of the magma system related to the Sisson Brook deposit, by deducing the
various magma sources, tectonic setting, assimilation and fractional crystallization
conditions (P-T-XH2O-fO2), as well as the composition of hydrothermal fluids exsolved
from the magma system during the late stage crystallization of magma. Such a task
necessitates a detailed description of the rock units in the field and to ascertain their
interrelationships (i.e., cross cutting, cooling margin, and foliations and metamorphism
caused later magma intrusion), optical microscopy studies on the polished thin sections,
whole-rock geochemistry (major- and trace-element compositions analyzed by X-ray
Fluorescence and Instrumental Neutron Activation Analysis, stable isotope O, H, and S,
and radiogenic isotope Sr-Nd composition), geochronology (U-Pb zircon, Re-Os

25
molybdenite), mineralogical studies (optical microscopy, Scanning Electron Microscopy,
electron microprobe, back scattered electron detector, Scanning Electron Microscopy
cathodoluminescence (SEM-CL), Laser Ablation-Inductively Couples Plasma Mass
Spectrometry (LA-ICPMS), and Secondary Ion Mass Spectrometry (SIMS). The
analytical results from these methods will be discussed as follows:
Chapter 2 reviews the different types of W-Mo deposits, and the petrology,
geochemistry, and isotopic attributes of the granites related to them. Overall similarities
between these different granites and W and Mo behaviour during magma fractional
crystallization processes are also summarized.
Chapter 3 identifies different felsic rock units in the Sisson Brook deposit area, and
discusses the major- and trace-element, H, O, and S stable isotopic, and Sr-Nd radiogenic
isotopic composition of these granite groups, and further deduces the magma source,
crystallization processes, and tectonic setting. Geochronological studies show the biotite
granitic dykes intersected in drill core in the deposit (U-Pb zircon) are older than the
mineralization (Re-Os molybdenite).
Chapter 4 presents in situ (ion microprobe) oxygen isotope compositions of quartz
and zircon as a function of internal zoning and textural setting. The trace-element
compositions of quartz are also analyzed by LA-ICPMS. Results show that the Nashwaak
Granites and dykes are formed from different sources: the biotite granitic pluton is
derived from partial melting of lower crustal metaigneous rocks, whereas the two-mica
granite pluton and the biotite granitic dykes formed through mixing of mantle derived
melts with lower crust metaigneous melts. Supracrustal materials were added into the
magmas in the source region or by assimilation during ascent and emplacement.

26
Chapter 5 analyzes the trace-element compositions of magmatic biotite and explains
the different oxidation states between different rock units and also calculates the halogen
fugacity of hydrothermal fluids that equilibrated with the biotite.
Chapter 6 presents the key conclusions of this research and recommendations for
future work.
References
Barr, S.M., Raeside, R.P., White, C.E., 1998. Geological correlations between Cape
Breton Island and Newfoundland, northern Appalachian orogen. Canadian Journal
of Earth Sciences 35, 1252-1270.
Barr, S.M., White, C.E., Miller, B.V., 2003. Age and geochemistry of Late
Neoproterozoic and Early Cambrian igneous rocks in southern New Brunswick:
similarities and contrasts. Atlantic Geology 39, 55-73.
Beal, K.L., Lentz, D.R., Hall, D.C., Dunning, G., 2010. Mineralogical, geochronological,
and geochemical characterization of Early Devonian aquamarine-bearing dykes of
the Zealand Station beryl and molybdenite deposit, west central New Brunswick.
Canadian Journal of Earth Sciences 47, 859-874.
Bevier, M.L., Whalen, J.B., 1990a. U-Pb geochronology of Silurian granites, Miramichi
terrane, New Brunswick. In Radiogenic Age and Isotopic Studies: Report 3,
Geological Survey of Canada, Paper 89-2, 93–100.
Bevier, M.L., Whalen, J.B., 1990b. Tectonic significance of Silurian magmatism in the
Canadian Appalachians. Geology 18, 411–414.
Bird, J.M., Dewey, J.K., 1970. Lithosphere plate-continental margin tectonics and the

27
evolution of the Appalachian Orogen. Geological Society of America Bulletin 81,
1031–1060.
Bradley, D.C., 1983. Tectonics of the Acadian Orogeny in New England and adjacent
Canada. Journal of Geology 91, 381–400.
Bustard, A., 2013. Tungsten mineralization processes at the Sisson Brook W-Mo-Cu
deposit, Central New Brunswick: the role of formation of titaniferous phases at
reaction fronts. Unpublished BSc thesis, University of New Brunswick, 55p.
Caron, A., 1996. Geology of the Pokiok Batholith aureole, with emphasis on the Lake
George Mine, York County, New Brunswick. New Brunswick Department of
Natural Resources and Energy, Minerals and Energy, Geoscience Report 94-2, 91p.
Crouse, G.W., 1981. Geology of parts of Burnthill, Clearwater and McKiel Brooks map-
areas K-14, K-15, and K-16 (parts of 21 J/15 and 21 J/10): New Brunswick
Department of Natural Resources, Map Report 81-5, 46 p.
Dimitrove, I., McCutcheon, S.R., Williams, P.F., 2004. Stratigraphic and structural
observations in Silurian rocks between Pointe Rochette and the Southeast
Upsalquitch River, northern New Brunswick. A progress report. In Geological
Investigations in New Brunswick for 2003. Edited by Martin, G.L., New Brunswick
Department of Natural Resources; Minerals, Policy and Planning Division, Mineral
Resource Report 2004-4, 41–74.
Dunbar, P., El-Rassi, D., Rogers, J.S., 2008. A technical review of the Mount Pleasant
property, including an updated mineral resource estimate on the Fire Tower Zone,
southwestern New Brunswick for Adex Mining Inc.. Watts, Griff and McOuat, 130
p.

28
Dupuis, C., Malo, M., Bedard, J., Davis, B., Villeneuve, M., 2009. A lost arc-back-arc
terrane of the Dunnage oceanic tract recorded in clasts from the Garin Formation
and McCrea mélange in the Gaspé Appalachians of Québec. Geological Society of
America Bulletin 121, 17–38.
Fyffe, L.R., 1976. Correlation of geology in the southwestern and northern parts of the
Miramichi Zone. In 139th Annual Report of the Department of Natural Resources of
the Province of New Brunswick for the year ended 31st March 1976. The
Government of the Province of New Brunswick, Fredericton, 137 – 141.
Fyffe, L.R., 1982a. Taconian and Acadian structural trends in central and northern New
Brunswick. In Major Structural Zones and Faults of the Northern Appalachians.
Edited by St-Julien, P., Bèland, J., Geological Association of Canada, Special Paper
24, 117–130.
Fyffe, L.R., 1982b. Geology of Woodstock (sheet 21J). New Brunswick Department of
Natural Resources, Map NR-4 (with marginal notes).
Fyffe, L.R., 2001. Stratigraphy and geochemistry of Ordovician volcanic rocks of the Eel
River area, west-central New Brunswick. Atlantic Geology 37, 81–101.
Fyffe, L.R., Fricker, A., 1987. Tectonostratigraphic terrane analysis of New Brunswick.
Maritime Sediments and Atlantic Geology 23, 113-122.
Fyffe, L.R., Johnson, S.C., van Staal, C.R., 2011. A review of Proterozoic to Early
Paleozoic lithotectonic terranes in the northeastern Appalachian orogen of New
Brunswick, Canada, and their tectonic evolution during Penobscot, Taconic, Salinic,
and Acadian orogenesis. Atlantic Geology 47, 211-248.
Fyffe, L.R., McCutcheon, S.R., Wilson, R.A., 1997. Miramichi-Tetagouche stratigraphic

29
relationships, Bathurst Mining Camp, northern New Brunswick. In Current Research
1996. Edited by Carroll, B.M.W., New Brunswick Department of Natural Resources
and Energy, Minerals and Energy Division, Mineral Resource Report 97-4, 37–51.
Fyffe, L.R., Pajari, G.E., Cherry, M.E., 1981. The Acadian plutonic rocks of New
Brunswick. Maritime Sediments and Atlantic Geology 17, 23–36.
Fyffe, L.R., Pickrill, R.K., Stringer, P., 1999. Stratigraphy, sedimentology and structure
of the Oak Bay and Waweig formations, Mascarene basins: implications for the
Paleotectonic evolution of southwestern New Brunswick. Atlantic Geology 35, 59–
84.
Fyffe, L.R., Thorne, K.G., Dunning, G.R., Martin, D.A., 2008. U-Pb geochronology of
the Sisson Brook granite porphyry, York County, west-central New Brunswick. In:
Martin, G.L. (Eds), Geological Investigations in New Brunswick for 2007. New
Brunswick Department of Natural Resources. Minerals, Policy and Planning
Division, Mineral Resource Report 2008-1, 35-54.
Helmstaedt, H., 1971. Structural geology of Portage Lakes area, Bathurst-Newcastle
District, New Brunswick. Geological Survey of Canada, Paper 70-28, 52p.
Hibbard, J.P., van Staal, C.R., and Rankin, D.W., and Williams, H. 2006. Lithotectonic
map of the Appalachian Orogen (North), Canada-United States of America;
Geological Survey of Canada, Map 02042A, scale 1:1,500,000.
Inverno, C.M., Hutchinson, R.W., 2006. Petrochemical discrimination of evolved granitic
intrusions associated with Mount Pleasant deposits, New Brunswick, Canada.
Applied Earth Science 115, 23-39.
Irrinki, R.R., 1981. Geology of the Rocky, Sisters and Clearwater Brooks – Todd

30
Mountain Region, map areas L-14, L-15 and L-16 (parts of 21J/10 and 21J/15).
Mineral Resources, New Brunswick Department of Natural Resources, Map Report
81-7 (1:25,000 maps), 1-30.
Johnson, S.C., McLeod, M.J., Fyffe, L.R., Dunning, G.R., 2009. Stratigraphy,
geochemistry, and geochronology of the Annidale and New River belts, and the
development of the Penobscot arc in southern New Brunswick. In Geological
Investigations in New Brunswick for 2008. Edited by Martin, G.L., New Brunswick
Department of Natural Resources; Minerals, Policy, and Planning Division, Mineral
Resource Report 2009-2, 141–218.
Johnson, S.C., Fyffe, L.R., McLeod, M.J., Dunning, G.R., 2012. U-Pb ages,
geochemistry, and tectonomagmatic history of the Cambro-Ordovician Annidale
Group: a remnant of the Penobscot arc system in southern New Brunswick.
Canadian Journal of Earth Sciences 49, 166-188.
Kooiman, G.J.A., McLeod, M.J., Sinclair, W.D., 1986. Porphyry tungsten-molybdenum
ore bodies, polymetallic veins and replacement bodies, and tin-bearing greisen zones
in the Fire Tower Zone, Mount Pleasant, New Brunswick. Economic Geology 81,
1356–1373.
Lentz, D.R., McAllister, A.L., 1990. The petrogenesis of tin- and sulfide-lode
mineralization at True Hill, southwestern New Brunswick. Atlantic Geology 26,
139-155.
Lentz, D.R., Thorne, K.G. Yang, X.M., 2002a. Preliminary analysis of the controls on the
various episodes of gold mineralization at the Lake George antimony deposit, New
Brunswick. In Current Research 2001. Edited by Carroll, B.M.W., Department of

31
Natural Resources and Energy Division, New Brunswick. Mineral Resource Report
02-4, 55-79.
Lentz, D.R., Thorne, K.G. Yang, X.M., Adams, M., 2002b. Shoshonitic lamprophyre
dykes at the Lake George antimony deposit, New Brunswick: petrochemical
characteristics and implications for gold mineralization. In Current Research 2001.
Edited by Carroll, B.M.W., New Brunswick Department of Natural Resources and
Energy Division, Mineral Resource Report 02-4, 41-54.
Leonard, P.R.R., Lentz, D.R., Poujol, M., 2006. Petrology, geochemistry, and U-Pb
(zircon) age of the quartz-feldspar porphyry dyke at the Lake George antimony
mine, New Brunswick: implications for origin, emplacement process, and
mineralization. Atlantic Geology 42, 13-29.
Lin, S., Davis, D.D., Barr, S.M., Chen, Y., van Staal, C.R. Constantin, M., 2007. U–Pb
geochronological constraints on the geological evolution and regional correlation of
the Aspy terrane, Cape Breton Island, Canadian Appalachians. American Journal of
Science 307, 371–398.
Lutes, G., 1981. Geology of Deersdale-Head of Nashwaak River map area J-17 and upper
parts of Nashwaak River–McBean and Sisters brooks, map area J-18. New
Brunswick Department of Natural Resources; Mineral Resources, Map Report 81-4,
1-26.
Lutes, G.G., 1987. Geology and geochemistry of the Pokiok batholith, New Brunswick.
New Brunswick Department of Natural Resources and Energy, Minerals and Energy
Division, Report of Investigation 22, 1-55.
MacLellan, H.E., Taylor, R.P. Gardiner, W.W., 1990. Geology and geochemistry of the

32
Burnt Hill Brook granites and related tin-tungsten deposits, York and
Northumberland Counties, New Brunswick (1:40,000 scale map of Burnt Hill
granite, Plate 86-241(R)).
MacLellan, H.E., Taylor, R.P., 1989. Geology and geochemistry of the Burnthill Granite
and related W-Sn-Mo-F mineral deposits, central New Brunswick. Canadian Journal
of Earth Sciences 26, 499-514.
Malo, M., 2001. Late Silurian-Early Devonian tectono-sedimentary history of the Gaspé‚
Belt in the Gaspé Peninsula: from a transtensional Salinic basin to an Acadian
foreland basin. Bulletin of Canadian Petroleum Geology 49, 202–216.
Mann, R., 1980. Report on diamond drilling at Sisson Brook. Unpublished company
report, Kidd Creek Mines Ltd., Fredericton, New Brunswick, 36 p.
McCutcheon, S.R. 1990a. The Late Devonian Mount Pleasant caldera complex:
stratigraphy, mineralogy, geochemistry and geologic setting of a Sn-W deposit in
southwestern New Brunswick. Unpublished Ph.D. thesis, Dalhousie University,
Halifax, NS, 609 p.
McCutcheon, S.R. 1990b. The Mount Pleasant Caldera: geological setting of associated
tungsten-molybdenum and tin deposits. In Mineral deposits of New Brunswick and
Nova Scotia [field trip 2], 8th IAGOD Symposium field trip guidebook. Edited by
Boyle, D.R., Geological Survey of Canada, Open File 2157, 73–77.
McCutcheon, S.R., Anderson, H.E., Robinson, P.T., 1997. Stratigraphy and eruptive
history of the Late Devonian Mount Pleasant Caldera Complex. Canadian
Appalachians. Geological Magazine 134, 17–36.
McCutcheon, S.R., Reddick, J., McKeen, T., Scott, S., Kociumbas, M., 2012. Technical

33
report Mount Pleasant property including an updated mineral resource estimate on
the North Zone, southwestern New Brunswick for Adex Mining Inc.. Watts, Griff
and McOuat, 170 p.
McCutcheon, S.R., Sinclair, W.D., Kooiman, G.J.A., 2001. The Late Devonian Mount
Pleasant Caldera: geological setting of a W-Mo-Sn-In deposit in southwestern New
Brunswick. In Guidebook to field trips in New Brunswick and western Maine.
Edited by Pickerill, R.K., Lentz., D.R., 93rd Annual Meeting New England
Intercollegiate Geological Conference, B5-B14.
McLeod, M.J., 1990. Geology, geochemistry, and related mineral deposits of the Saint
George Batholith; Charlotte, Queens, and Kings Counties, New Brunswick. New
Brunswick Department of Natural Resources and Energy, Mineral Resources,
Mineral Resource Report 5, 1-169.
McLeod, M.J., Johnson, S.C., Krogh, T.E., 2004. Archived U–Pb (zircon) dates from
southern New Brunswick. Atlantic Geology 39, 209–223.
McLeod, M.J., Taylor, R.P., Lux, D.R., 1988. Geology, Ar/Ar geochronology and Sn-W-
Mo-bearing sheeted veins of the Mount Douglas Granite, southwestern New
Brunswick. Canadian Institute of Mining and Metallurgical Bulletin 81, 70–77.
Moench, R.H., Aleinikoff, J.N., 2003. Stratigraphy, geochronology and accretionary
terrane setting of two Bronson Hill arc sequences, northern New England. Physics
and Chemistry of the Earth 28, 113–160.
Morrissy, C.J., 1991a. Further characterization of drill core from the Lake George mine,
York County, New Brunswick; New Brunswick Department of Natural Resources
and Energy, Mineral Resources, Open File Report 91-8, 1-74.

34
Morrissy, C.J., 1991b. Gold assessment at the Lake George mine, York County, New
Brunswick; New Brunswick Department of Natural Resources and Energy, Mineral
Resources, Open File Report 91-1, 1-22.
Morrissy, C.J., Ruitenberg, A.A., 1980. Geology of the Lake George antimony deposit
southern New Brunswick. Canadian Institute of Mining and Metallurgy Bulletin 73,
79–84.
Murphy, J.B., van Staal, C.R., Keppie, J.D., 1999. Middle to Late Paleozoic Acadian
Orogeny in the northern Appalachians: A Laramide-style plume modified orogeny.
Geology 27, 653–656.
Nast, H.J., 1985. The geology and petrochemistry of the Sisson Brook W-Cu–Mo
deposit, New Brunswick. unpublished M. Sc. thesis, McGill University, Montreal,
Quebec, 192 p.
Nast, H.J., Williams-Jones, A.E., 1991. The role of water–rock interaction and fluid
evolution in forming the porphyry–related Sisson Brook W–Cu–Mo deposit, New
Brunswick. Economic Geology 86, 302-317.
Neuman, R.B., 1984. Geology and paleobiology of islands in the Iapetus Ocean: Review
and implications. Geological Society of America Bulletin 95, 1188–1201.
Noble, J.P.A., 1985. Occurrence and signifiance of Late Silurian reefs in New
Brunswick, Canada. Canadian Journal of Earth Sciences 22, 1518–1529.
Pearce, J.A., Harris, N.B.W., Tindle, A.G., 1984. Trace element discrimination diagrams
for the tectonic interpretation of granitic rocks. Journal of Petrology 25, 956-983.
Potter, R.R., 1969. The geology of the Burnt Hill area and ore controls of the Burnt Hill
Tungsten Deposit. Unpublished Ph.D. thesis, Carleton University, Ottawa, 136 p.

35
Procyshyn, E.L., Morrissy, C.J., 1990. Geology of the Lake George mine, southern New
Brunswick. In 8th IAGOD Symposium, Field Trip Guidebook, Mineral Deposits of
New Brunswick and Nova Scotia (Field trip 2). Edited by Boyle, D.R., Geological
Survey of Canada, Open File 2157, 58-72.
Ruitenberg, A.A., Fyffe, L.R., 1982. Mineral deposits associated with granitoid intrusions
and related subvolcanic stocks in New Brunswick and their relationship to
Appalachian tectonic evolution. Canadian Institute of Mining and Metallurgy,
Buttetin 75, 83-97.
Ruitenberg, A.A., McCutcheon, S.R., 1982. Acadian and Hercynian structural evolution
of southern New Brunswick. Geological Association of Canada, Special Paper 24,
131-148.
Samson, I.M., 1990. Fluid evolution and mineralization in a subvolcanic Granite Stock:
the Mount Pleasant W-Mo-Sn Deposits, New Brunswick, Canada. Economic
Geology 85, 145-163.
Samson, S.D., Barr, S.M., White, C.E., 2000. Nd isotopic characteristics of terranes
within the Avalon Zone, southern New Brunswick. Canadian Journal of Earth
Sciences 37, 1039-1052.
Scratch, R.B., Watson, G.P., Hutchinson, R.W., 1984a. Fracture-controlled antimony-
quartz mineralization, Lake George deposit, New Brunswick: mineralogy,
geochemistry, alteration, and hydrothermal regimes. Economic Geology 79, 1159-
1186.
Scratch, R.B., Watson, G.P., Kerrich, R., Hutchinson, R.W., 1984b. Fracture-controlled
antimony-quartz mineralization, Lake George deposit, New Brunswick: mineralogy,

36
geochemistry, alteration, and hydrothermal regimes. Economic Geology 79, 1159–
1186.
Seal, R.R., Clark, A.H., Morrissy, C.J., 1987. Stockwork tungsten (Scheelite)-
molybdenum mineralization, Lake George, southwestern New Brunswick.
Economic Geology 82, 1259-1282.
Seal. R.R., II, Clark, A.H., Morrissy, C.J., 1988. Lake George, southwestern New
Brunswick: a Silurian multi-stage, polymetallic (Sb-W-Mo-Au-base metal)
hydrothermal centre. In Recent advances in the geology of granite-related mineral
deposits. Edited by Taylor, R.P., Strong, D.F., Canadian Institute of Mining and
Metallurgy S39, 252-264.
Shabani, A.A.T., Lalonde, A.E., Whalen, J.B., 2003. Composition of biotite from granitic
rocks of the Canadian Appalachian Orogen: a potential tectonomagmatic indicator?
The Canadian Mineralogist 41, 1381-1396.
Sinclair, W.D., Kooiman, G.J.A., Martin, D.A., 1988. Geological setting of granites and
related tin deposits in the North Zone, Mount Pleasant, New Brunswick. Geological
Survey of Canada, Current Research, Paper 88-1B, 201–208.
Sinclair, W.D., Kooiman, G.J.A., Martin, D.A., Kjarsgaard, I.M., 2006. Geology,
geochemistry and mineralogy of indium resources at Mount Pleasant, New
Brunswick, Canada. Ore Geology Reviews 28, 123-145.
Stevenson, D.B., 1981. The Burnthill pluton and some related mineral occurrences.
Unpublished B.Sc. thesis, University of New Brunswick, Fredericton, 120 p.
Stewart, H.J., McLeod, M.J., Thorne, K.G., 2011. Tungsten. New Brunswick Department
of Natural Resources; Lands, Minerals and Petroleum Division, Mineral Commodity

37
Profile No.7, 1-7.
Taylor, H.P.Jr., 1968. The oxygen isotope geochemistry of igneous rocks. Contributions
to Mineralogy and Petrology 19, 1-71.
Taylor, H.P.Jr., 1978. Oxygen- and hydrogen-isotope studies of plutonic rocks. Earth and
Planetary Science Letters 38, 177-210.
Taylor, H.P., Sheppard, S.M.F., 1986. Igneous rocks; I, Processes of isotopic
fractionation and isotope systematics. Reviews in Mineralogy and Geochemistry 16,
227-271.
Taylor, H.P.Jr., 1988. Oxygen, hydrogen, and strontium isotope constraints on the origin
of granites. Transactions of the Royal Society of Edinburgh: Earth Sciences 79, 317-
338.
Taylor, R.P., 1992. Petrological and geochemical characteristics of the Pleasant Ridge
zinnwaldite topaz granite, southern New Brunswick, and comparisons with other
topaz-bearing felsic rocks. Canadian Mineralogist 30, 895–921.
Taylor, R.P., Lux, D.R., MacLellan, H.E. and Hubacher, F., 1987. Age and genesis of
granite related W-Sn-Mo mineral deposits, Burnthill, New Brunswick. Economic
Geology 82, 2187-2198.
Thorne, K.G., Fyffe, L.R., Creaser, R.A., 2013. Re-Os geochronological constraints on
the W-Mo mineralizing event in the Mount Pleasant Caldera Complex: implications
for the timing of subvolcanic magmatism and caldera development. Atlantic
Geology 49, 131-150.
Tucker, R.D., Bradley, D.C., ver Straeten, C.A., Harris, A.C., Ebert, J.R., McCutcheon,
S.R., 1998. New U-Pb zircon ages and the duration and division of Devonian time.

38
Earth and Planetary Science Letters 158, 175–186.
Tucker, R.D., Osberg, P.H., Berry, H.N. IV., 2001. The geology of part of Acadia and the
nature of the Acadian orogeny across central and eastern Maine. American Journal
of Science 301, 205–260.
van Staal, C.R., 1987. Tectonic setting of the Tetagouche Group in northern New
Brunswick: implications for plate tectonic models of the northern Appalachians.
Canadian Journal of Earth Sciences 24, 1329–1351.
van Staal, C.R., 1994. The Brunswick subduction complex in the Canadian Appalachians:
Record of the Late Ordovician to Late Silurian collision between Laurentia and the
Gander margin of Avalon. Tectonics 13, 946–962.
van Staal, C.R., 2005. The Northern Appalachians. In Encyclopedia of Geology. Edited
by Selley, R.C., Cocks, L.R., Plimer, I.R., Elsevier, Oxford 4, 81–91.
van Staal, C.R., 2007. Pre-Carboniferous tectonic evolution and metallogeny of the
Canadian Appalachians. In Mineral Deposits of Canada: A Synthesis of Major
Deposit-types, District Metallogeny, the Evolution of Geological Provinces, and
Exploration Methods. Edited by Goodfellow, W.D., Geological Association of
Canada, Mineral Deposit Division, Special Publication 5, 793–818.
van Staal, C.R., Dewey, J.F., Mac Niocaill, C., McKerrow, S., 1998. The Cambrian-
Silurian tectonic evolution of the northern Appalachians: History of a complex,
southwest Pacific-type segment of Iapetus. In Lyell: the Past is the Key to the
Present. Edited by Blundell, D.J. Scott, A.C., Geological Society, London, Special
Publications, 143, 199–242.
van Staal, C.R., Fyff, L.R., 1995. Gander Zone-New Brunswick. In Chapter 3 of Geology

39
of the Appalachian-Caledonian Orogen in Canada and Greenland. Edited by
Williams, H., Geology Survey of Canada, Geology of Canada No. 6, 216–223.
van Staal, C.R., Fyffe, L.R., 1991. Dunnage and Gander Zones, New Brunswick:
Canadian Appalachian Region. New Bunswick Department of Natural Resources
and Energy, Geoscience Report 91-2, 39 p.
van Staal, C.R., McNicoll, V., Valverde-Vaquero, P., Barr, S., Fyffe, L.R., Reusch, D.N.,
2004. Ganderia, Avalonia, and the Salinic and Acadian orogenies. Abstracts with
Programs, Geological Society of America, 39th Annual Meeting, NE-section, 128–
129.
van Staal, C.R., Wilson, R.A., Rogers, N., Fyff, L.R., Langton, J.P., McCutcheon, S.R.,
McNicoll, V., Ravenhurst, C.E., 2003. Geology and tectonic history of the Bathurst
Supergroup, Bathurst Mining Camp and its relationships to coeval rocks in
southwestern New Brunswick and adjacent Maine–a synthesis. In Massive Sulphide
Deposits of the Bathurst Mining Camp, New Brunswick and Northern Maine. Edited
by Goodfellow, W.D., McCutcheon, S.R., Peter, J.M., Economic Geology
Monograph 11, 37–60.
van Staal, C.R., Winchester, J.A., Bedard, J.H., 1991. Geochemical variations in
Ordovician volcanic rocks of the northern Miramichi Highlands and their tectonic
significance. Canadian Journal of Earth Sciences 28, 1031–1049.
van Staal, C.R., Whalen, J.B., McNicoll, V.J., Pehrsson, S., Lissenberg, C.J., Zagorevski,
A., van Breemen, O., Jenner, G.A., 2007. The Notre Dame arc and the Taconic
orogeny in Newfoundland. In: 4-D Framework of Continental Crust, GSA Memoirs
200. Edited by Hatcher, R.D., Carlson, M.P., McBride, J.H., Martínez Catalán, J.R.,

40
Geological Society of America, 511-552.
van Wagoner, N.A., Leybourne, M.I., Dadd, K.A., Baldwin, D.K., McNeil, W., 2002.
Late Silurian bimodal volcanism of southwestern New Brunswick, Canada: Products
of continental extension. Geological Society of America Bulletin 114, 400–418.
van Wagoner, N.A., Leybourne, M.I., Dadd, K.A., Huskins, M.L.A., 2001. The
Silurian(?) Passamaquoddy Bay mafic dyke swarm, New Brunswick: petrogenesis
and tectonic implications. Canadian Journal of Earth Sciences 38, 1565–1578.
Venugopal, D.V., 1982. Geology of upper parts Becaguimec, Keswick and Nashwaak
rivers, Cloverdale–Millville map-areas I-19, J-19, J-20 (Parts of 21 J/3, 21 J/6). New
Brunswick Department of Natural Resources; Mineral Resources, Map Report 82-2,
1-35.
Wahl, D.G., Burt, P., 2013. Deposit Modeling & NI 43-101 resource estimate. Burnt Hill
tungsten-molybdenum-tin property, Stanley Parish, York County, New Brunswick.
Prepared for Cadillac Ventures Inc. by Southampton Associates Inc.
Whalen, J.B., 1993. Geology, petrology, and geochemistry of Appalachian granites in
New Brunswick and Gaspésie, Quebec. Geological Survey of Canada, Bulletin 463,
124 p.
Whalen, J.B., Currie, K.L., Chappell, B.W., 1987. A-type granites: geochemical
characteristics and discrimination. Contributions to Mineralogy and Petrology 95,
420-436.
Whalen, J.B., Fyffe, L.R., Longstaffe, F.J., Jenner, G.A., 1996b. The position and nature
of the Gander-Avalon boundary, southern New Brunswick, based on geochemical
and isotopic data from granitoid rocks. Canadian Journal of Earth Sciences 33, 129-

41
139.
Whalen, J.B., Jenner, G.A., Longstaffe, F.J., Hegner, E., 1996a. Nature and evolution of
the eastern margin of Iapetus: geochemical and isotopic constraints from Siluro-
Devonian granitoid plutons in the New Brunswick Appalachians. Canadian Journal
of Earth Sciences 33, 140-155.
Whalen, J.B., Rogers, N., van Staal, C.R., Longstaffe, F.J., Jenner, G.A., Winchester,
J.A., 1998. Geochemical and isotopic (Nd, O) data from Ordovician felsic plutonic
and volcanic rocks of the Miramichi Highlands: petrogenetic and metallogenic
implication for the Bathurst Mining Camp. Canadian Journal of Earth Sciences 35,
237-252.
Whalen, J.B., Theriault, R., 1990. K-Ar and Rb–Sr geochronology of granites, Miramichi
terrane, New Brunswick. In: Radiogenic Age and Isotopic Studies: Report 3.
Geological Survey of Canada, Paper 89-2, 101-107.
Whitehead, R.E.S., Goodfellow, W.D., 1978. Geochemistry of volcanic rocks from the
Tetagouche Group, Bathurst, New Brunswick, Canada. Canadian Journal of Earth
Sciences 15, 207–219.
Williams, H., 1979. Appalachian Orogen in Canada. Canadian Journal of Earth Sciences
16, 792-807.
Williams, H., Colman-Sadd, S.P., Swinden, H.S., 1988. Tectonic-Stratigraphic
subdivisions of central Newfoundland. Current Research. Geological Survey of
Canada 88-1B, 91–98.
Wilson, R.A., 2000. Geology of the Popelogan Lake-Lost PineLake area, Restigouche
County, New Brunswick. In Current Research 1999. Edited by Carroll, B.M.W.,

42
New Brunswick Department of Natural Resources and Energy, Minerals and Energy
Division, Mineral Resource Report 2000-4, 91–136.
Wilson, R.A., 2002. Geology of the Squaw Cap area (NTS21 O/15d, e, f), Restigouche
County, New Brunswick. In Current Research 2001. Edited by Carroll, B.M.W.,
New Brunswick Department of Natural Resources and Energy; Minerals, Policy and
Planning Division, Mineral Resource Report 2002-4, 155–196.
Wilson, R.A., Burden, E.T., Bertrand, R., Asselin, E., McCracken, A.D., 2004.
Stratigraphy and tectono-sedimentary evolution of the late Ordovician to Middle
Devonian Gaspé Belt in northern New Brunswick: evidence from the Restigouche
area. Canadian Journal of Earth Sciences 41, 527–551.
Wilson, R.A., Kamo, S.L., 2008. New U-Pb ages from the Chaleurs and Dalhousie
groups: implications for regional correlations and tectonic evolution of northern
New Brunswick. In Geological Investigations in New Brunswick for 2007. Edited
by Martin, G.L., New Brunswick Department of Natural Resources; Minerals,
Policy and Planning Division, Mineral Resource Report 2008-1, 78–109.
Yang, X.M., Lentz, D.R., Chi, G.X., 2002. Petrochemistry of Lake George granodiorite
stock and related gold mineralization, York County, New Brunswick. Geological
Survey of Canada, Current Research, 2002-D7, 10 p.
Yang, X.M., Lentz, D.R., Chi, G.X., Kyser, T.K., 2004. Fluid-mineral reaction in the
Lake George granodiorite, New Brunswick, Canada: implications for Au-W-Mo-Sb
mineralization. The Canadian Mineralogist 42, 1443-1464.
Yang, X.M., Lentz, D.R., McCutcheon, S.R., 2003. Petrochemical evolution of
subvolcanic granitoid intrusions within the Late Devonian Mount Pleasant Caldera,

43
southwestern New Brunswick, Canada: comparison of Au versus Sn-W-Mo
polymetallic mineralization systems. Atlantic Geology 39, 97-121.
Yang, X.M., Lentz, D.R., Chi, G.X., Thorne, K.G., 2008. Geochemical characteristics of
gold-related granitoids in southwestern New Brunswick, Canada. Lithos 104, 355-
377.
Zagorevski, A., van Staal, C.R., McNicoll, V., Rogers, N., 2007. Upper Cambrian to
Upper Ordovician peri-Gondwanan island arc activity in the Victoria Lake
Supergroup, Central Newfoundland: Tectonic development of the northern
Ganderian margin. American Journal of Science 307, 339–370.
Zartman, R.E., Doe, B.R., 1981. Plumbotectonics – the model. Tectonophysics 75, 135-
162.

44
Chapter 2 Genesis of W-Mo specialized granitoid magmas: a review of
their petrology, geochemistry, and isotopic attributes
Abstract
According to the S-I-A-M classification scheme, granitoids related to the W-Mo
deposits are S-, I-, and A-type granites. These granites are intermediate to felsic rocks
and metaluminous to peraluminous. Most of the granitoids related to large W-Mo
deposits typically contain high silica contents. However, the trace element contents,
K2O/Na2O, and LREE/HREE of these granites vary significantly between the granitoids
associated with different deposits, but normally show LREE enrichment and highly
evolved characteristics (large negative Eu anomalies). The magma compositions consist
of mantle material contaminated by the crust and reflect the fact that W-Mo related
plutons do not belong to any particular suite of rocks. Extensive fractional crystallization,
rather than magma sources, plays a vital role in formation of these deposits. The partition
coefficient studies of Mo and W between crystallization minerals and melts show that the
Mo is concentrated in residual melts under very high fO2, whereas the W is less
dependent on oxidation state. Fluorine has no recognized effect on W and Mo partition
coefficients between melts and exsolved fluids. Molybdenum extraction behaviour is not
controlled by Cl, whereas W is dominantly controlled by the chlorinity, pH, and oxygen
fugacity of fluids.
Key words: Tungsten-molybdenite deposit, granite classification, partition coefficient

45
2.1 Introduction
The elements tungsten and molybdenum are positioned vertically adjacent to each
other in group 6 of the periodic table and share very similar chemical properties (O’Neill
et al., 2008). They also typically occur in association with Sn in the same pluton or
granitic suite, e.g., the Pine Creek, California (Newberry, 1982); the King Island,
Tasmania (Wesolowski, 1985); and the Shizhuyuan, China (Lu et al., 2003). These W-
Mo-Sn-bearing granites were classified by different criteria in order to probe the
relationship between these plutons and the deposits they produced.
Blevin and Chappell (1995) discussed the metallogeny of different granites in the
Lachlan Fold Belt, NSW Australia, and found that extremely fractionated I-type granites
are associated with Sn ± W, Mo ± W, and W-Mo-Bi deposits, and that S-type granites
can form W and Sn deposits only after extended fractional crystallization. These two
types of granite, as well as M-type (White, 1979) granite, are used to reflect the granite
sources. A-type granites identified by Loiselle and Wones (1979) represent these granites
formed in the anorogenic settings.
Unlike the S-I-A-M classification system, Ishihara (1977, 1981) proposed the
magnetite series and ilmenite series granites reflecting their redox characteristics. The
magnetite series represent oxidized granitoids with the higher magnetic susceptibilities
(>1×10⁻⁴ emu/g) and the ilmenite series represent reduced granitoids with lower magnetic
susceptibilities (<1×10⁻⁴ emu/g). Comparing the relationship between granites and
mineralization in Japan, South Korea, and southeastern China, Ishihara (1981) illustrated
that the magnetite series granitoids are associated with sulfide mineralization, whereas
the ilmenite series granitoids are related to wolframite mineralization.

46
The relationship between the S-I-A-M and the magnetite-ilmenite series
classification system (Ishihara, 1981) for metaliferous granitoid suite is that the I-type
granitoids include the magnetite and the ilmenite series granites and the S-type granitoids
only include the ilmenite series granites in Australia. Moreover, in Japan, the magnetite
series consist of the I-type granitoids and the ilmenite series granitoids include the I-type
and the S-type granitoids. These relationships are quite consistent worldwide.
Although there are other granite classification criteria, including classifications based
on petrography (Yang, 1982) and mineralogy (Lameyre and Bowden, 1982), the most
popular are the I-S-A-M (Chappell and White, 1974, 1982; Collins et al., 1982; Whalen
et al., 1987) and the ilmenite-magnetite series classification scheme (Ishihara, 1977,
1981). This chapter adopts the I-S-A-M scheme to discuss the granites related to the W-
Mo deposits.
Tungsten and Mo are often formed in association in the same pluton as discussed
above (Strong, 1988), but are generally related to 3 types of ore deposits: skarn- (Meinert
et al., 2005), porphyry- (Seedorff et al., 2005), and vein-types of deposits (Liu and Ma,
1993; Černý et al., 2005). The goal of this chapter is to discuss the characteristics of the
various granitoids associated with W-Mo deposits to establish common features between
them, and to use this to help explain the genesis of these economically important
granitoids.
2.2 Granitoids related to porphyry-type W-Mo deposits
Porphyry-type deposits can be divided into five classes based upon the principal
contained metals: porphyry Au, porphyry Cu, porphyry Mo, porphyry W, and porphyry
Sn (Seedorff et al., 2005). In Seedorff et al. (2005) classification scheme, a continium

47
may exist between porphyry Mo, porphyry W-Mo, and porphyry W deposits (Sinclair,
2007), thus it is hard to make sharp distictions between them. The pricipal ore and
associated minerals in porphyry W-Mo deposts include scheelite, wolframite,
molybdenite, cassiterite, stannite, bismuthinite, and native bismuth; other minerals
include pyrite, arsenopyrite, loellingite, quartz, K-feldspar, biotite, muscovite, clay
minerals, fluorite, and topaz (Sinclair, 2007). Typical alteration types in porphyry
deposits, summarized by Sillitoe (1993), consist of an inner potassic zone and outer zone
of propylitic alteration. Zones of phyllic alteration and argillic alteration may be part of
the zonal pattern between the potassic and propylitic zones. The detailed characteristics
of the granites related to porphyry W-Mo deposits are discussed as follow.
The Mount Pleasant Granite suites are the parental rock of the Mount Pleasant W-
Mo-Bi and Sn-Cu-Zn-Pb-In deposits in the southwestern New Brunswick (Kooiman et
al., 1986; Lentz et al., 1988; Sinclair et al., 1988; McCutcheon, 1990; McCutcheon et al.,
2001; Yang et al., 2003; Inverno and Hutchinson, 2006). The main rock forming minerals
consist of quartz, K-feldspar, plagioclase, and biotite. Accessory minerals include apatite,
monazite, zircon, ilmenite, columbite, and Li mica (Yang et al., 2003). Alteration types of
this deposit include sericitic (phyllic), chloritic, quartz-topaz (advanced argillic), chlorite-
biotite, and clay alteration (argillic) (Inverno, 1991; Sinclair et al., 2006). As the other
part of the Beech Hill series, the True Hill intrusion is genetically related to the Mount
Pleasant Granites (Lentz et al., 1988; Lentz and McAllister, 1990; Lentz and Gregoire,
1995), based on similar ages and chemical compositions (Dagger, 1972; Butt, 1976). The
Lake George Monzogranite related to the Lake George polymetallic (Sb-W-Mo-Au-base
metal) deposit contains quartz, plagioclase, biotite, and feldspar. Hornblende, apatite, and

48
titanite occur as accessory minerals. Hydrothermal alteration minerals in this area include
sericite and chlorite (Seal et al., 1987).
The Logtung porphyry deposit, in the Yukon Territory, western Canada, has two
stages of intrusion. The intrusion associated with the W-Mo mineralization is biotite
monzogranite with fluorite, scheelite, ilmenite, magnetite, pyrite, zircon, allanite, and
apatite as accessory minerals. Alteration minerals are dominated by sericite, calcite,
fluorite, epidote, and chlorite (Noble et al., 1984).
In general, the common mineral assemblage of intrusions (usually granites or
granodiorites) associated with porphyry W-Mo deposits is generally quartz, K-feldspar,
plagioclase, and biotite. Accessory minerals typically comprise monazite, zircon,
ilmenite, magnetite, apatite, titanite, hornblende, and allanite with rare fluorite and
calcite. Hydrothermal alteration minerals typically include sericite, chlorite, and biotite.
These mineralogical characteristics are also present in the Nannihu (Bao et al., 2009) and
Yangchuling (Liu and Shen, 1982; Zhang, 1983; Li et al., 1985) porphyry W-Mo deposits
in China.
The granitoids associated with the porphyry W-Mo deposits consist of intermediate
to felsic rocks with low TiO2, P2O5, CaO, MgO, and MnO, and relatively high SiO2
contents (>70%) (e.g., the Yangchuling Intrusive Complex; Zhang, 1983). The Fe/Mg
ratios and K2O/Na2O are commonly larger than 1. The Aluminum Saturation Index
(A/CNK) indicates that these granitoids are metaluminous to weakly peraluminous.
Granite from the Mount Pleasant deposit displays medium K and calcic-alkalic
characteristics (Yang et al., 2003). The Nannihu granitic porphyries have alkalic to
alkalic-calcic attributes and a high differentiation index (DI) (Bao et al., 2009). Although

49
the granitoids related to porphyry-type W-Mo deposits span a wide range of magmatic
composition, most of these granites are highly silicious.
The highly differentiated nature of the Mount Pleasant Granites is demonstrated by
low chondrite-normalized ratio of (La/Yb)N with large negative Eu anomalies (Eu*)
(Yang et al., 2003). Similar to the Mount Pleasant granites, the True Hill Granite also has
high total REE, low LREE/HREE ratios, and pronounced negative Eu anomalies (Lentz
and Gregoire, 1995). In China, the La/Yb ratios of the Yangchuling Complex range from
14.3 to 38.5 and increase with magma differentiation (Li et al., 1985); the plutons related
to the Nannihu deposit have (La/Yb)N values between 8.9 and 38, Eu* between 0.48 and
0.74, high Ga and Rb, and low Sr and low Rb/Sr, indicating they formed by extreme
fractionation. This result is also supported by pronounced Sr, Ba, and Ti depletion, which
was probably caused by plagioclase and Fe-Ti oxide fractional crystallization (Bao et al.,
2009). All the characteristics of the granitoids related to the porphyry W-Mo deposits
discussed here show that these granites formed by extreme fractional crystallization.
A εNd(t) and a δ18O value for the Mount Pleasant Granite suites reported by Whalen
et al. (1996) is -0.2 and 8.6 ‰, respectively. In addition to the low Sr and high initial
87Sr/86Sr ratios (0.7126; Kooiman et al., 1986), Yang et al. (2003) deduced that the
parental magma of the Mount Pleasant Granites formed by partial melting of juvenile
materials followed by contamination from supracrustal rocks. The Nannihu Granitoids,
which have low εNd(t) values (-12.7 to -15.5) and young Nd model ages, are likely
derived from partial melting of young crustal material with minor mixing with mantle
materials (Bao et al., 2009). The δ18O values of the Yangchuling Complex increase from
9.8‰ for the quartz diorite to 11‰ for the monzogranite porphyry and the average initial

50
87Sr/86Sr ratio is 0.70862; this may demonstrate that the parental magma of the
Yangchuling Granite Complex is from a mixed mantle source with crustal contamination
(Liu and Shen, 1982).
2.3 Granitoids related to the skarn-type W-Mo deposits
Newberry and Swanson (1986) noted that granitoids associated with the W skarn
deposits range from granodiorite to granite; however, aplite and pegmatite phase may
also be present. Titanite and magnetite are common in these deposits with variable
amount of hornblende, garnet, and magmatic muscovite. The Pine Creek deposit
(California), as one of the largest W-Mo skarn deposits, has the typical petrology features
of skarn W deposits (Newberry, 1998) and was well documented by Bateman (1965) and
Newberry (1982). The main intrusion in the Pine Creek mine area is granodiorite; locally
quartz diorite and alaskite (leucogranite) are present (Krauskopf, 1953). The average
modal mineralogy of the quartz diorite is 40-65 % plagioclase, 1-15 % quartz, 10-30 %
biotite, and 5-10 % hornblende (Newberry, 1980). A secondary intrusion of the Pine
Creek mine, the Morgan Creek quartz monzonite consists of 20-30 % K-feldspar, 30-40
% plagioclase, 25-35 % quartz, 2-7 % biotite, and 0-2% hornblende (Newberry, 1980).
Massive quartz with trace of garnet and alkali feldspar occur on the skarn side and
hedenbergitic pyroxene and plagioclase with minor epidote are on the intrusive side
(Newberry, 1982).
The granitoids related to oxidized skarn-type deposits, in particular, have lower
average SiO2 values (general range from 60 to 75 %) and higher Al2O3, P2O5, CaO, MgO,
Na2O, and Fe2O3 contents than reduced skarns (Kwak, 1987). Most unaltered granitoids
are metaluminous to weakly peraluminous (A/CNK < 1.1) and contain molar K2O/Na2O

51
< 1 and an average normative corundum of less than 1 (Newberry and Swanson, 1986).
The increasing nature of Al saturation with increasing SiO2 of these granitoids does not
indicate sedimentary rock contamination or a sedimentary source (Newberry, 1998). This
characteristic may be caused by hornblende fractionation (ASI of hornblende < 0.5),
including in plutons that lack of hornblende (Evernden and Kistler, 1970; Frey et al.,
1978; Abbot, 1981; Blum, 1983; Gray, 1984).
Kwak (1987) using the Rb/Sr ratio as a fractionation index, observed that even
though extreme fractional crystallization is not a prerequisite to the formation of the
economic W-skarns deposits, most large deposits are related to highly evolved, I-type
granitoids. However, granite type seems to not be a vital factor in the formation of large
W deposits, for example the Shizhuyuan deposit (China), a world-class W-Mo-Sn
polymetallic deposit. The granite associated with the Shizhuyuan exhibits similar
petrology to the Qianlishan Granitoids (Liu et al., 1998). They have relatively high Rb/Sr
ratios and are highly fractionated (Mao et al., 1995), and belong to S-type granitoids.
Compared with granitoid related to other skarn deposits (Cu, Fe, Au, Zn), those with W-
Mo-Sn deposits generally have lower Sc, V, and Zr, and higher Rb and Rb/Sr ratios
(Meinert, 1995).
The Sr isotopic features of the granitoids associated with W skarn deposits are
described by Newberry and Swanson (1986) and indicate that there is no identified
correlation between initial 87Sr/86Sr values and scheelite skarn deposit size and grade, but
these granitoids generally show some crust contamination attributes.

52
2.4 Granitoids related to vein-type W-Mo deposits
Liu and Ma (1993) noted common petrological characteristics of vein-type W
deposits of south China and adjacent areas. The related igneous rocks are granites and the
host rocks consist of volcanic rocks, unmetamorphosed to metamorphosed sandstone,
slate, sandy slate, and shale. Pervasive silicification, sericitization, pyritization,
chloritization, and greisenization are common alteration types to these deposits, while
albitization, tourmalinization, and argillic alteration are also locally present. Major
economic minerals include wolframite, molybdenite, bismuthinite, beryl, base-metal
sulfides, cassiterite, scheelite, stibnite, and ferberite.
Greisens and mineralized veins occur within felsic, highly fractionated,
metaluminous to peraluminous (less commonly alkaline) granites (Černý et al., 2005).
Liu and Ma (1993) observed that the plutons associated with the vein-type tungsten
deposits have higher K, Na, and Si (SiO2 > 73%, K2O + Na2O > 7.5% and commonly
K2O > Na2O) and lower Ca, Mg, and Fe compared to barren granites. Sodium contents in
these granites increase, while K, Ca, Mg, and Fe contents decrease with the magma
fractionation.
The REE distribution patterns of granites related to the vein-type W-Mo deposits
also indicate their high fractionation characteristics. For example, the Baid al Jimalah
tungsten deposit is in Kingdom of Saudi Arabia and is associated with the Baid al
Jimalah Granite (Kamilli et al., 1993). The REE pattern of this granite is relatively flat
with pronounced negative Eu anomalies (Kamilli et al., 1993). The other example is the
Concordia Granite is related to several W-Mo deposits in South Africa (Raith and
Prochaska, 1995). This granite has high LREE and negative Eu anomalies and evolved to

53
be depleted in LREE, enriched in HREE, and to have more pronounced negative Eu
anomalies. Although these granites associated with vein-type W-Mo deposits have
various LREE/HREE ratios, their pronounced netagive Eu anamolies indicate fractional
crystallization of plagioclase, during which W and Mo are enriched in the late stage
magma and exsolved fluids.
South China is celebrated for its wolframite-quartz vein systems related to granitic
intrusions (Liu and Ma, 1993). Hong et al. (1998) concluded that the Hunan-Jiangxi-
Guangdong transitional belt, which hosts many W deposits in South China, consists of S-
type monzogranites, syenogranites, and alkali feldspar granites. Their initial 87Sr/86Sr
values range between 0.708 and 0.720, which when combined with Nd depleted mantle
model ages, indicate that the granite phases formed by partial melting of rocks similar to
the basement in that area.
Hua et al. (2003) compared the petrological characteristics of the two largest vein-
type W (Mo, Sn) deposits in South China, the Dajishan deposit and the Piaotang deposit.
The Dajishan Granite has high SiO2 contents (73.37 wt.%), A/CNK > 1.1, and K2O/Na2O
< 1, whereas the Piaotang Granite has high SiO2 (76.43 wt.%) with A/CNK < 1.1 and
K2O/Na2O > 1. Both are enriched in incompatible elements, contain similar K, Sr, and Ba
values and are highly fractionated. Hua et al. (2003) considered both the Dajishan Granite
and Piaotang Granite to be S-type granites formed by melted supracrustal rocks.
However, earlier research by Wang and Zhou (1999) suggested that the Piaotang Granite
is more similar to an A-type granite (crustal?). Trace-element geochemical discrimination
diagrams (Pearce et al., 1984) indicated that the Dajishan Granite formed in a syn-

54
collisional setting, whereas the Piaotang Granite formed in a within-plate setting (crustal
A-type, Eby, 1990, 1992; cf. Christiansen and Keith, 1996).
2.5 Discussion
2.5.1 Tectonic environments
The tectonic setting of granitoids can be discriminated by trace elements (Pearce et
al., 1984; Christiansen and Keith, 1996; Fӧrster et al., 1997), with two popular schemes
including the plots of the whole rock Nb vs.Y and Rb vs. Y+Nb. The Nb vs. Y diagram is
important when study altered granitoids, because of the generally immobile character of
Nb and Y. Meinert (1995) illustrated that W skarn and most Mo skarn plutons plot in the
within-plate field, whereas Newberry (1998) illustrated that a large number of W-Mo-Sn
skarn plutons plot in the volcanic arc field on the Rb versus Y+Nb diagram. In France
and Tasmania, the plutons associated with W skarns occur with granitoid rocks of mixed
I- and S-type characteristics related to a collisional association (White et al., 1977).
Seedorff et al. (2005) concluded that porphyry deposits are related to subduction
processes. Subduction-derived fluids aid in the generation of mantle-sourced mafic
magma that is ultimately related to a porphyry system. Newberry (1998) also noted that
the W skarns seem to be associated with granitoids, which formed by subduction.
Extensive fractionation affects the Rb and Nb+Y contents and caused these granites to
display “syn-collisional” or “within-plate” characteristics. The vein-type W-Mo deposits
in South China dominantly formed in the Yanshanian period (133.9-199.6 Ma, Hua et al.
2005), which represents the tectonic environment transforming from the post-orogenic
setting of the Indo-sinian movement to the subduction of the Pacific Plate (Wang and
Shen, 2003). Christiansen and Keith (1996) suggested that trace-element concentrations

55
in magmas are more of reflections of their melting and crystallization histories rather than
simply of the dominant tectonic regimes. Sawka et al. (1990) also noted that highly
fractionated I-type fields in the tectonic discrimination diagrams of Pearce et al. (1984)
overlap the A-type fields, and less-fractionated S-type fields overlap fractionated I-type
fields; so caution is necessary before connecting each type of granites to a particular
tectonic setting. Blevin and Chappell (1992) and Christiansen and Keith (1996)
concluded that Mo deposits are related to oxided granites, whereas Sn deposis are related
to the reduced granites, thus the W-Mo deposits could be hosted by both I-type granites
and A-type granites (Whalen et al., 1987; Eby, 1990, 1992), and corresponding to the
volcanic arc and within-plate environments. By contrast, syn-collision environments
typically form the reduced S-type granites and thus could host Sn and/or W deposts
(Christiansen and Keith, 1996).
2.5.2 Granite types and degree of compositional evolution
W-Mo-related granitoids have intermediate to evolved felsic compositions with a
large range SiO2. Most A/CNK values are less than 1.1 denoting metaluminous to weakly
peraluminous signatures (some are alkaline) and K2O/Na2O < 1; these characteristics are
identical to I-type granites. However, some W-Mo-related granitoids have typical S-type
characteristics (White et al., 1977; Takahashi et al., 1980), including K2O/Na2O > 1 and
A/CNK > 1.1. A-type granitoids contain lower Al2O3, CaO, and MgO and higher FeO
and K2O+Na2O than I-type granites, but also produce W-Mo deposits. Newberry and
Swanson (1986) suggested that a lack of clear correlation between scheelite skarn plutons
and granite types (based on the I-S-A-M classification) may indicate that other factors,

56
rather than magma source, control the W-Mo deposit formation, such as the initial water
content (Candela, 1989) and oxygen fugacity (Blevin and Chappell, 1992).
The (La/Yb)N values of the granites related to W-Mo deposits show that the REE
distribution patterns vary from a flat “bird-wing shape” to LREE enrichment. In these
granitoids, the S-type granites (e.g., the Shizhuyuan deposit) have higher Pb, Cr, and Ni,
and lower Na, Ca, and Sr than I-type granites (e.g., the King Island deposit ) (Chappell
and White, 1982). The A-type granite features (e.g., the Mount Pleasant deposit) are
higher in Ga, Nb, Ta, Zr, REE, Sn, and W than I-type granites (White et al., 1982). Some
granitoids related to the small deposits may show intermediate fractional crystallization
degree, e.g., the Jiangjunzhai deposit with a (La/Yb)N between 3.94 and 5.35 (Wang et
al., 2009). However, the largest numbers of plutons related to large W-Mo deposit have a
high degree of differentiation, which is thought to be a vital process causing enrichment
of W and Mo in exsolved magmatic fluids (Newberry and Swanson, 1986).
2.5.3 Metal sources
Granitoids related to W-Mo deposits have various sources ranging from mantle
source contaminated by minor crustal material to partial melting of crustal rocks. The
tungsten content of continental crust (ca. 1 ppm; Rudnick and Gao, 2003) is higher than
the primitive mantle abundance (ca. 16 ppb, Palme and O’Neill, 2003). This may be a
possible reason some workers (e.g., Ta’ergou deposit, Zhang et al., 2003) consider that
W was leached out from the strata by hydrothermal fluids. Although crustal source is not
a prerequisite to W deposit formation, Newberry and Swanson (1986) demonstrated the
critical contribution of crustal source to form high-grade W deposits. For example,
continued recycling of continental material into subduction zone-related magmas may

57
have amplified W enrichment (Kӧnig et al., 2008). The extraction of W and Mo from
magmas takes place by exsolution of an aqueous fluid phase; this partitioning process is
controlled by the oxidation state, melt and aqueous fluid composition, temperature, and
pressure (Blevin and Chappell, 1992; Sillitoe, 1996). This is followed by metal-bearing
fluids ascending through the magma column, and depositing in the shallow crust with the
input of meteoric and/or metamorphic water (Shelton et al., 1986; Shelton et al., 1987; So
et al., 1991; Kamilli et al., 1993).
2.5.4 Initial water content and depth of emplacement of magma
Granitic magmas derived from the melting of different source materials contain a
variable amount of initial water. A melt derived by melting of source rocks comprised of
mainly muscovite (i.e., S-type granite) would contain about 7-8 wt.% H2O, whereas a
melt derived by dehydration melting of an amphibolitic source (i.e., I-type granite) at
higher pressure and temperature could contain only 2-3 wt.% H2O (Strong, 1988).
According to the P-T diagram of Strong (1988), if these two types of magmas rise to the
shallow crust along an adiabatic cooling path until they intersect the water-saturated
granite solidus, the wetter magmas would be emplaced at mid-crustal depths (4-5 kbar) as
dictated by intersection of the muscovite breakdown curve with the water-saturated
granite solidus. Unlike porphyry-Cu deposits, for which their magmas have low initial
water content (< 3 – 4 wt.%) and could rise into shallow crust, the W-Mo deposit have
higher initial water content (i.e., dehydration of biotite rather than amphibolite) and rise
into deeper crust and permits a greater degree of crystallization before water-saturation is
achieved. The extensive fractionation of the magma causes the enrichment of W and Mo
in the residual melts and coexisting exsolving fluids (Candela, 1989).

58
2.5.5 Oxidation state of magmas
Metallic elements need to be extracted efficiently from magma to the site of ore
deposition. This process requires metallic elements to partition into the residual silica-
rich melt as a result of a relatively low partition coefficient between fractional
crystallizing minerals and melts. Then these elements concentrate into the aqueous fluid
that is exsolved from the melts and at last precipitate as a result of changing
physiochemical conditions at the site of deposition (Newberry and Swanson, 1986;
Blevin and Chappell, 1992).
The partition coefficient between crystalized minerals and residual melts depends on
temperature, pressure, magma composition, and oxygen fugacity. Newberry and Swanson
(1986) demonstrated that it is not necessary for the parental magma of W skarn deposits
to have high initial W concentration, since this element could be elevated by later
fractional crystallization. During the fractionation, W is slightly enriched in magnetite
and titanite under relatively high fO2 conditions (Mahood and Hildreth, 1983) and the
compatibility of it with respect to ilmenite weakly decreases with increasing fO2 (Candela
and Bouton, 1990). Therefore, the W deposits can occur in oxidized and reduced granites
(Blevin and Chappell, 1992), but are generally more enriched in reduced granites. On the
other hand, according to Tacker and Candela (1987) and Candela and Bouton (1990), the
Mo partition coefficient drops in half when the fO2 changes from the graphite-methane to
NNO buffer conditions, and similar ionic radii of Mo4+ and Ti4+ cause the Mo loss with
Ti minerals (e.g., biotite, ilmenite, and titanite) crystallization, so increasing the Mo
cations valency higher than 4+ makes it more incompatible. As Mo enrichment only
forms in high fO2 conditions, and the W partition coefficient between crystallization

59
minerals and melts is less dependent on the oxidizing state, the W-Mo deposits are
generally present in oxidized granites. This conclusion is also supported by Blevin and
Chappell (1992).
2.5.6 Partitioning of metals
Experiments of partitioning behaviour of W and Mo between silicate melts and
fluids indicated that transport of W and Mo by Cl and F is relatively unimportant
(Candela and Holland, 1984; Keppler and Wyllie, 1991; Wood and Samson, 2000).
Tungsten can be transported as H2WO4, HWO- 4, and WO-2
4, and tungsten-chloride, -
fluoride, or –carbonate complexes are not required (Wood and Vlassopoulos, 1989;
Wood, 1992; Wood and Samson, 2000). Molybdenum may have the same partitioning
behaviour as that of W (Bernard et al., 1990). However, Candela and Holland (1984)
found partitioning of Mo into H2O-fluids is independent of the Cl concentration in fluids.
According to Zajacz et al. (2008), the fluid/melt partition coefficient for Mo is
maximized (20) in a fluid with only 1-2 mol/kg Cl, implying that Mo is independent of Cl
contents and dissolves in fluids as non-chloride species (e.g., hydroxyl). The partition
coefficient of W is complex and is controlled by the combination of fluid chlorinity, pH,
and oxygen fugacity; F has no significant effect for any element studied (Candela and
Piccoli, 1995)
2.6 Conclusions
The W-Mo deposits commonly occur as porphyry-type, skarn-type, and vein-type
deposits and are typically related to the highly silicious granitoids. These granitoids can
be classified as A-type, I-type, and S-type granites and thus formed in within-plate,

60
volcanic arc, and syn-collision environments, respectively. The magma compositions
consist of mantle material contaminated by the crust and reflect the fact that W-Mo
related plutons do not belong to any particular suite of rocks. The initial water content in
these magmas is relatively higher (i.e., >4%) than that of the granitoids associated with
porphyry Cu deposits, thus the magmas intrude to deeper level in the crust. Large degree
of crystallization need to be take place before water-saturation is achieved. The extensive
fractionation indicated by high silica with large Eu depletion causes the enrichment of the
W and Mo in the melts and coexisting exsolving fluids. Molybdenum is concentrated in
residual melts under very high fO2, whereas the W is less dependent on oxidation state.
Fluorine has no effect on W and Mo partition coefficients between melts and exsolved
fluids. Molybdenum extraction behaviour is not controlled by Cl, whereas W is
dominantly controlled by the chlorinity, pH, and oxygen fugacity of fluids.
References
Abbott, R.N., 1981. AFM liquidus projections for granitic magmas, with special
reference to hornblende, biotite, and garnet. The Canadian Mineralogist 19, 103-
110.
Bao, Z.W., Zeng, Q.S., Zhao, T.P., Yuan, Z.L., 2009. Geochemistry and petrogenesis of
the ore-related Nannihu and Shangfanggou granite porphyries from east Qinling belt
and their constraints on the molybdenum mineralization. Acta Petrologica Sinica 25,
2523-2536.
Bateman, P.C., 1965. Geology and tungsten mineralization of Bishop district, California,
U. S. Geological Survey Professional Paper 470, 208p.

61
Bernard, A., Symonds, R.B., Rose, W.I.Jr., 1990. Volatile transport and deposition of
Mo, W and Re in high temperature magmatic fluids. Applied Geochemistry 5, 317-
326.
Blevin, P.L., Chappell, B.W., 1992. The role of magma sources, oxidation states and
fractionation in determining the granite metallogeny of eastern Australia. Royal
Society of Edinburgh Transactions, Earth Sciences 83, 305-316.
Blevin, P.L., Chappell, B.W., 1995. Chemistry, origin, and evolution of mineralized
granites in the Lachlan Fold Belt, Australia: the metallogeny of I- and S-type
granites. Economic Geology 90, 1604-1619.
Blum, J.D., 1983. Petrology, geochemistry, and isotope geochronology of the Gilmore
Dome and Pedro Dome plutons, Fairbanks Mining District, Alaska. Report of
Investigations-Alaska. Division of Geological and Geophysical Surveys 83, 59 p.
Butt, K.A., 1976. Genesis of granitic stocks in southwestern New Brunswick.
Unpublished Ph.D. thesis. University of New Brunswick, Fredericton, N.B., 235 p.
Candela, P.A., Holland, H.R., 1984. The partitioning of copper and molybdenum between
silicate melts and aqueous fluids. Geochimica et Cosmochimica Acta 48, 373-380.
Candela, P.A., 1989. Felsic magmas, volatiles, and metallogenesis. In Ore Deposition
Associated with Magmas. Edited by Whitney, J.A. and Naldrett, A.J., Reviews in
Economic Geology 4, 223-233.
Candela, P.A., Bouton, S.L., 1990. The influence of oxygen fugacity on tungsten and
molybdenum partitioning between silicate melts and ilmenite. Economic Geology
85, 633-640.

62
Candela, P.A., Piccoli, P.M., 1995. Model ore-metal partitioning from melts into vapour
and vapour-brine mixtures. In Magmas, Fluids, and Ore Deposits. Edited by
Thompson, J.F.H. Mineralogical Association of Canada, Short Course 23, 101-127.
Černý, P., Blevin, P. L., Cuney, M., London, D., 2005. Granite-related ore deposits. In
One Hundredth Anniversary Volume 1905-2005. Edited by Hedenquist, J.W.,
Thompson, J.F.H., Goldfarb, R.J. and Richards, J.P. Economic Geology, 337-370.
Chappell, B.W., White, A.J.R., 1974. Two contrasting granite types. Pacific Geology 8,
173-173.
Chappell, B.W., White, A.J.R., 1982. I- and S-type granites in the Lachlan fold belt,
southeastern Australia. In Geology of Granites and Their Metallogenetic Relations.
Edited by Xu, K.Q. and Tu, G.C. Proceedings of the International Symposium, 87-
101.
Christiansen, E.H., Keith, J.D., 1996. Trace-element systematics in silicic magmas: a
metallogenic perspective. In Trace Element Geochemistry of Volcanic Rocks:
Applications for Massive Sulphide Exploration. Edited by Wyman, D.A. Geological
Association of Canada, Short Course Notes 12, 115-151
Collins, W.J., Beams, S.D., White, A.J.R., Chappell, B.W., 1982. Nature and origin of A-
type granites with particular reference to south-eastern Australia. Contributions to
Mineralogy and Petrology 80, 189-200.
Dagger, G.W., 1972. Genesis of the Mount Pleasant tungsten-molybdenum deposit, New
Brunswick. Transactions of the Institution of Mining and Metallurgy. Section B:
Applied Earth Science 81, B73-B102.

63
Eby, G.N., 1990. The A-type graniotids: a review of their occurrence and chemical
characteristics and speculations on their petrogenesis. Lithos 26, 115-134.
Eby, G.N., 1992. Chemical subdivision of the A-type granitoids: petrogenetic and
tectonic implications. Geology 20, 641-644.
Evernden, J.F., Kistler, R.W., 1970. Chronology and emplacement of Mesozoic batholitic
complexes in California and Western Nevada. U. S. Geological Survey Professional
Paper 623, 1-42.
Fӧrster, H.J., Tischendorf, G., Trumbull, R.B., 1997. An evaluation of the Rb vs. (Y+Nb)
discrimination diagram to infer tectonic setting of silicic igneous rocks. Lithos 40,
261-293.
Frey, F.A., Chappell, B.W., Roy, S.D., 1978. Fractionation of rare-elements in the
Tuolumne intrusive series, Sierra Nevada batholiths, California. Geology 6, 239-
242.
Gray, C.M., 1984. An isotopic mixing model for the origin of granitic rocks in
southeastern Australia. Earth and Planetary Science Letters 70, 47-60.
Hong, D.W., Xie, X.L., Zhang, J.S., 1998. Isotope geochemistry of granitoids in South
China and their metallogeny. Resource Geology 48, 251-263.
Hua, R.M., Chen, P.R., Zhang, W.J., Lu, J.J., 2005. Three major metallogenic events in
Mesozoic in South China. Mineral Deposits 24, 99-107 (in Chinese).
Hua, R.M., Zhang, W.L., Chen, P.R., Wang, R.C., 2003. Comparison in the
characteristics, origin, and related metallogeny between granites in Dajishan and
Piaotang, South Jiangxi, China. Geological Journal of China Universities 9, 609-619
(in Chinese).

64
Inverno, C.M.C., 1991. Endogranitic tin mineralization in Mount Pleasant intrusive
complex, New Brunswick, Canada. Unpublished Ph.D thesis, Colorado School of
Mines, Golden, Colorado, USA, 302 p.
Inverno, C.M.C., Hutchinson, R.W., 2006. Petrochemical discrimination of evolved
granitic intrusions associated with Mount Pleasant deposits, New Brunswick,
Canada. Transactions of the Institution of Mining and Metallurgy, Section B 115,
23-39.
Ishihara, S., 1977. The magnetite-series and ilmenite-series granitic rocks. Mining
Geology 27, 293-305.
Ishihara, S., 1981. The granitoid series and mineralization. In 75th Anniversary Volume.
Edited by Skinner, B.J. Economic Geology, 458-484.
Kamilli, R.J., Cole, J.G., Elliott, J.E., Criss, R.E., 1993. Geology and genesis of the Baid
al Jimalah tungsten deposit, Kingdon of Saudi Arabia. Economic Geology 88, 1743-
1767.
Keppler, H., Wyllie, P.J., 1991. Partitioning of Cu, Sn, Mo, W, U, and Th between melt
and aqueous fluid in the systems haplogranite-H2O-HCl and Haplogranite-H2O-HF.
Contributions to Mineralogy and Petrology 109, 139-150.
Kooiman, G.J.A., Mcleod, M.J., Sinclair, W.D., 1986. Porphyry tungsten- molybdenum
ore bodies, polymetallic veins and replacement bodies, and tin-bearing greisen zones
in the Fire Tower Zone, Mount Pleasant, New Brunswick. Economic Geology 81,
1356-1373.
Krauskopf, K.B., 1953. Tungsten deposits of Madera, Fresno, and Tulare counties,
California. California Division of Mines and Geology, special report 35, 1-83.

65
Kwak, T.A.P., 1987. W-Sn skarn deposits and related metamorphic skarns and granitoids.
Developments in Economic Geology 24, 201-205.
Lameyre, J., Bowden, P., 1982. Plutonic rocks type series: discrimination of various
granitoid series and related rocks. Journal of Volcanology and Geothermal Research
14, 169-186.
Lentz, D.R., Gregoire, C., 1995. Petrology and mass-balance constraints on major-, trace,
and rare-earth-element mobility in porphyry-greisen alteration associated with the
epizonal True Hill granite, southwestern New Brunswick, Canada. Journal of
Geochemical Exploration 52, 303-331.
Lentz, D.R., Lutes, G., Hartree, R., 1988. Bi-Sn-Mo-W greisen mineralization associated
with the True Hill granite, southwestern New Brunswick. Maritime Sediments and
Atlantic Geology 24, 321-338.
Lentz, D.R., McAllister, A.L., 1990. The petrogenesis of tin- and sulfide-lode
mineralization at True Hill, southwestern New Brunswick. Atlantic Geology 26,
139-155.
Li, B.L., Xie, Y.H., Zhao, R., Li, R.M., 1985. Magmatic process and geochemistry of
calc-alkaline complex from Yangchuling, Jiangxi Province. Acta Petrologica Sinica
1, 1-16.
Liu, J.Y., Shen, J.L., 1982. The metallogenetic complex of Yangchuling porphyry
tungsten (molybdenum) deposit- Agenetic and evolutionary model of transitional
type granitoids. In Geology of Granites and Their Metallogenetic Relations. Edited
by Xu, K.Q. and Tu, G.C. Proceedings of the international symposium held at
Nanjing University, Nanjing, China, 329-346.

66
Liu, Y.J., Ma, D.S., 1993. Vein-type tungsten deposits of China and adjoining regions.
Ore geology Reviews 8, 233-246.
Liu, Y.M., Lu, H.Z., Wang, C.L., Xu, Y.Z., Kang, W.Q, Zeng, T., 1998. On the ore-
forming conditions and ore-forming model of the superlarge multimetal deposit in
Shizhuyuan. Science in China, series D 41, 502-512.
Loiselle, M.C., Wones, D.R., 1979. Characteristics and origin of anorogenic granites.
Geological Society of America Abstracts with Programs 11, 468.
Lu, H.Z., Liu, Y.M., Wang, C.L., Xu, Y.Z., Li, H.Q., 2003. Mineralization and fluid
inclusion study of the Shizhuyuan W-Sn-Bi-Mo-F skarn deposit, Hunan Province,
China. Economic Geology 98, 955-974.
Mahood, G.A., Hildreth, W., 1983. Large partition coefficient for trace elements in high
silica rhyolites. Geochimica et Cosmochimica Acta 47, 11-30.
Mao, J.W., Li, H.Y., Pei, R.F., Raimbault, L, Guy, B., 1995. Geology and geochemistry
of the Qianlishan granite stock and its relationship to polymetallic tungsten
mineralization. Mineral Deposits 14, 12-23 (in Chinese).
McCutcheon, S.R., 1990. The Mount Pleasant Caldera: geological setting of associated
tungsten-molybdenum and tin deposits. In 8th IAGOD Symposium Field Trip
Guidebook. Edited by Boyle, D.R. Geological Survey of Canada, Open File 2157,
73-77.
McCutcheon, S.R., Sinclair, W.D., Kooiman, G.J.A., 2001. The Late Devonian Mount
Pleasant Caldera: geological setting of a W-Mo-Sn-In deposit in southwestern New
Brunswick. In Guidebook to Field Trip in New Brunswick and Western Maine.

67
Edited by Pickerill, P.K. and Lentz, D.R., 93rd Annual Meeting New England
Intercollegiate Geological Conference, B5-B14.
Meinert, L.D., 1995. Compositional variation of igneous rocks associated with skarn
deposits-chemical evidence for a genetic connection between petrogenesis and
mineralization. Mineralogical Association of Canada Short Course Handbook 23,
401-418.
Meinert, L.D., Dipple, G.M., Nicolescu, S., 2005. World skarn deposits. In One
Hundredth Anniversary Volume 1905-2005. Edited by Hedenquist, J.W.,
Thompson, J.F.H., Goldfarb, R.J., and Richards, J.P., Economic Geology, 299-336.
Newberry, R.J., 1980. The geology and chemistry of skarn formation and tungsten
deposition in the central Sierra Nevada, California. Unpublished Ph.D. thesis,
Stanford University, Stanford, California, 325 p.
Newberry, R.J., 1982. Tungsten-bearing skarns of the Sierra Nevada. I. The Pine Creek
Mine, California. Economic Geology 77, 823-844.
Newberry, R.J., 1998. W- and Sn- skarn deposits: a 1998 status report. In Mineralogical
Association of Canada Short Course Handbook 26 Edited by Lentz, D.R., 289-335.
Newberry, R.J., Swanson, S.E., 1986. Scheelite skarn granitoids: an evalution of the roles
of magmatic source and process. Ore Geology Reviews 1, 57-81.
Noble, S.R., Spooner, E.T.C., Harris, F.R., 1984. The Logtung large tonnage, low-grade
W (scheelite)-Mo porphyry deposit, south-central Yukon Territory. Economic
Geology 79, 848-868.

68
O’Neill, H.S.C., Berry, A.J., Eggins, S.M., 2008. The solubility and oxidation state of
tungsten in silicate melts: Implications for the comparative chemistry of W and Mo
in planetary differentiation processes. Chemical Geology 255, 346-359.
Palme, H., O’Neill, H.S.C., 2003. Cosmochemical estimates of mantle composition. In
Treatise on Geochemistry. Edited by Holland, H.D. and Turekian, K.K., 1-38.
Pearce, J.A., Harris, N.B.W., Tindle, A.G., 1984. Trace element discrimination diagrams
for the tectonic interpretation fo granitic rocks. Journal of Petrology 25, 956-983.
Raith, J.G., Prochaska, W., 1995. Tungsten deposits in the wolfram schist, Namaqualand,
South Africa: strata-bound versus granite-related genetic concepts. Economic
Geology 90, 1934-1954.
Rudnick, R.L., Gao, S., 2003. Composition of the continental crust. In Treatise on
Geochemistry. Edited by Holland, H.D. and Turekian, K.K., 1-64.
Sawka, W.N., Heizler, M.T., Kistler, R.W., Chappell, B.W., 1990. Geochemistry of
highly-fractionated I- and S-type granites from the tin-tungsten province of western
Tasmania. In Ore Bearing Granite Systems: Petrogenesis and Mineralizing
Processes. Edited by Stein, H.J., and Hannah, J.L., Geology Society of America,
Special Paper 246, 161-179.
Seal, R.R., Clark, A.H., Morrissy, C.J., 1987. Stockwork tungsten (dcheelite) -
molybdenum mineralization, Lake George, Southwestern New Brunswick.
Economic Geology 82, 1259-1282.
Seedorff, E., Dilles, J.H., Proffett, Jr.J.M., Einaudi, M.T., Zurcher, L., Stawast, W.J.A.,
Johnson, D.A., Barton, M.D., 2005. Porphyry deposits: characteristics and origin of
hypogene features. In: One Hundredth Anniversary Volume 1905-2005. Edited by

69
Hedenquist, J.W., Thompson, J.F.H., Goldfarb, R.J., and Richards. J.P., Economic
Geology, 251-298.
Shelton, K.L., So, C.S., Rye, D.M., Park, M.E., 1986. Geologic, sulfur isotope, and fluid
inclusion studies of the Sannae W-Mo mine, Republic of Korea: comparison of
sulfur isotope systematic in Korean W deposits. Economic Geology 81, 430-446.
Shelton, K.L., Taylor, R.P., So, C.S., 1987. Stable isotope studies of the Dae Hwa
tungsten-molybdenum mine, Republic of Korea: evidence of pregressive meteoric
water interaction in a tungsten-bearing hydrothermal system. Economic Geology 82,
471-481.
Sillitoe, R.H., 1993. Gold-rich porphyry copper deposits: geological model and
exploration implications. In: Mineral Deposit Modeling: Geological Association of
Canada. Edited by Kirkham, R.V., Sinclair, W.D., Thorpe, R.I., and Duke, J.M.,
Special Paper 40, 465-478.
Sillitoe, R.H., 1996. Granites and metal deposits. Episodes 19, 126-133.
Sinclair, W.D., Kooiman, G.J.A., Martin, D.A., 1988. Geological setting of granites and
related tin deposits in the North Zone, Mount Pleasant, New Brunswick. Geological
Survey of Canada, Current Research, Part B, 201-208.
Sinclair, W.D., Kooiman, G.J.A., Martin, D.A., Kjarsgaard, I.M., 2006. Geology,
geochemistry and mineralogy of indium resources at Mount Pleasant, New
Brunswick, Canada. Ore Geology Reviews 28, 123-145.
Sinclair, W.D., 2007. Porphyry deposits. In: Mineral Deposits of Canada: A Synthesis of
Major Deposit-Types, District Metallogeny,the Evolution of Geological Provinces,

70
and Exploration Methods. Edited by Goodfellow, W.D., Geological Association of
Canada, Mineral Deposits Division, Special Publication No. 5, 223-243.
So, C.S., Schelton, K.L., Chi, S.J., Yun, S.T., 1991. Geochemical studies of the
Gyeongchang W-Mo mine, Republic of Korea: progressive meteoric water
inundation of a magmatic hydrothermal system. Economic Geology 86, 750-767.
Kӧnig, S., Münker, C., Schuth, S., Garbe-Schӧnberg, D., 2008. Mobility of tungsten in
subduction zones. Earth and Planetary Science Letters 274, 82-92.
Strong, D.F., 1988. A review and model for granite-related mineral deposits.In: Recent
Adances in the Geology of Granite-Related Mineral Deposits. Edited by Toylor,
R.P. and Strong, D.F., The Canadian Institute of Mining and Metallurgy, 424-444.
Takahashi, M., Aramake, S., Ishihara, S., 1980. Magnetite-series/ ilmenite-series vs. I-
type/S-type granitoids. Mining Geology 8, 13-28.
Taker, R.C., Candela, P.A., 1987. Partitioning of molybdenum between magnetite and
melt: A preliminary experimental study of the partitioning of ore metals between
silicic magmas and crystalline phases. Economic Geology 82, 1827-1838.
Wang, D.Z., Shen, W.Z., 2003. Genesis of granitoids and crustal evolution in southeast
China. Earth Science Frontiers 10, 209-220 (in Chinese).
Wang, D.Z., Zhou, J.C., 1999. Look back and look forward on granite research. Acta
Petrologica Sinica 15, 161-169 (in Chinese).
Wang, Y.L., Pei, R.F., Li, J.W., Wang, H.L., Liu, X.F., 2009. Geochemical
characteristics of granites from the Jiangjunzhai tungsten deposit of Southeast
Hunan province and its Re-Os isotopic dating. Rock and Mineral Analysis 28, 274-
278 (in Chinese).

71
Wesolowski, D., Cramer, J.J., Ohmoto, H., 1985. Scheelite mineralization in skarns
adjacent to Daconian granitoids at King Island, Tasmania. In: Recent Advances in
the Geology of Granite-related Mineral Deposits. Edited by Tailor, R.P. and Strong,
D.F., The Canadian Institute of Mining and Metallurgy 39, 234-251.
Whalen, J.B., Currie, K.L., Chappell, B.W., 1987. A-type granites: geochemical
characteristics, discrimination and petrogenesis. Contributions to Mineralogy and
Petrology 95, 407-419.
Whelen, J.B., Fyffe, L.R., Longstaffe, F.J., Jenner, G.A., 1996. The position and nature of
the Gander-Avalon boundary, southern New Brunswick, based on geochemical and
isotopic data from granitoid rocks. Canadian Journal of Earth Sciences 33, 129-139.
White, A.J.R., 1979. Sources of granite magmas. Geological Society of America
Abstracts with programs 11, No.7, 539 p.
White, A.J.R., Beams, S.D., Cramer, J.J., 1977. Granitoid types and mineralization with
special reference to Tin. In Plutonism in Relation to Volcanism and Metamorphism,
7th CPPP Meeting, Toyama. Edited by Yamada, N., 89-100.
White, A.J.R., Collins, W.J., Chappell, B.W., 1982. Influence of melt structure on the
trace element composition of granites. In: Geology of Granites and Their
Metallogenetic Relations. Edited by Xu, K.Q. and Tu, G.C., Proceedings of the
International Symposium, 737-751.
Wood, S.A., Vlassopoulos, D., 1989. Experimental determination of the hydrothermal
solubility and speciation of tungsten at 500 °C and 1 Kbar. Geochimica et
Cosmochimica Acta 53, 303-312.

72
Wood, S.A., 1992. Experimental determination of the solubility of WO3 (s) and the
thermodynamic properties of H2WO4 (aq) in the range 300-600 °C at 1 Kbar:
Calculation of scheelite solubility. Geochimica et Comochimica Acta 56, 1827-
1836.
Wood, S.A., Samson, I.M., 2000. The hydrothermal geochemistry of tungsten in
granitoid environments: I. relative solubilities of ferberite and scheelite as a function
of T, P, pH, and mNaCl. Economic Geology 95, 143-182.
Yang, C.Q., 1982. The genetic types of the granitoids in South China. In: Geology of
Granites and Their Metallogenetic Relations. Edited by Xu, K.Q. and Tu, G.C.,
Proceedings of the International Symposium, 253-276.
Yang, X.M., Lentz, D.R., McCutcheon, S.R., 2003. Petrochemical evolution of
subvolcanic granitoid intrusions within the Late Devonian Mount Pleasant Caldera,
southwestern New Brunswick, Canada: comparison of Au versus Sn-W-Mo-
polymetallic mineralization systems. Atlantic Geology 39, 97-121.
Zajacz, Z., Halter, W.E., Pettke, T., Guillong, M., 2008. Determination of fluid/melt
partition coefficients by LA-ICPMS analysis of co-existing fluid and silicate melt
inclusions: Controls on element partitioning. Geochemica et Cosmochimica Acta 72,
2169-2197.
Zhang, Y.X., 1983. Geochemical characteristics and origin of Yangchuling porphyry W-
Mo deposit. Geochemistry 2, 99-112.
Zhang, Z.H., Mao, J.W., Yang, J.M., Wang, Z.L., Zhang, Z.C., 2003. Geology and
genesis of the Ta’ergou skarn-quartz vein tungsten deposit in the north Qilian
Caledonian Orogenic Belt, Northwest China. Resource Geology 53, 101-114.

73
Chapter 3 The petrological and mineralogical characteristics of felsic
intrusive units at the Sisson Brook W-Mo-Cu deposit, west-central New
Brunswick
Abstract
Four groups of granitoids in the vicinity of the Sisson Brook W-Mo-Cu deposit are
recognized: the Nashwaak Granite plutonic phases (muscovite-biotite granite, Group I;
and biotite granite, Group II), and related dyke phases (biotite granitic dykes, Group III,
and porphyry dyke, Group IV). These granites are relatively high in silica (> 69 wt.%),
calc-alkaline, and peraluminous (ASI < 1.61), and show similar variation trends in the
chondrite-normalized rare earth elements (REE) diagram (low (La/Yb)N with noticeable
Eu negative anomalies) and primitive mantle-normalized spider diagram (rich in LILE
with Ba, Sr, Nb, P, and Ti depletion). The bulk rock δ18O ranging from 9.7 to 10.9 ‰,
(87Sr/86Sr)i lie between 0.702 and 0.710, as well as the ɛNd(t) varying from -4.51 to -1.42,
indicate that the Nashwaak Granites and related dykes were derived from partial melting
of lower crust, which could be the seismically defined Central Crustal Block that
underlies the area. These low-temperature I-type granites crystallized at 700-800 °C at a
depth of 7-8 km (~250 MPa). Assimilation of crustal rocks and fractional crystallization
(AFC) is the dominant mechanism controlling magma evolution. For the granites related
to the large W-Mo deposits, the extensive fractional crystallization causes the enrichment
of W and Mo, whereas the assimilation of crustal rocks reduces the oxygen fugacity of
the magma, but could elevate the W and Mo contents in magma. The biotite granitic

74
dykes (Group III) dated by LA-ICPMS and yielded a concordant age of 405.6 ± 2.5 Ma
with a mean square of weighted deviation (MSWD) of 0.0098 and a probability of 0.92.
Three Re-Os model ages for the molybdenites are ranging from 376.45 ± 1.64 Ma to
378.54 ± 1.71 Ma. Thus the syn-hydrothermal dykes could not be the medium to coarse
grained biotite granitic dykes, because of the age gap between them unless these medium-
to coarse-grained biotite granitic dykes formed at different times besides the age of 405.6
± 2.5 Ma. Alternatively, the syn-hydrothermal dykes could be the dykes with different
textures, i.e., the aplitic and pegmatoidal dykes in this area. Geochemical features show
the dykes have a long fractional crystallization history (highest silica and most
pronounced Ba, Sr, P, and Ti depletion) could be the candidate magma from which the
metallic elements were derived.
Key words: Sisson Brook; LA-ICPMS; whole-rock oxygen isotope; Sr and Nd
isotopes; W-Mo deposit; Petrogenesis
3.1 Introduction
The Sisson Brook W-Mo-Cu deposit is situated in west-central New Brunswick,
along the eastern margin of an extensive belt of “Acadian” plutonic rocks that underlie
the Miramichi Highlands (Fyffe et al., 1981; 2008). The deposit is spatially associated
with the Nashwaak Granite (Fig. 3.1), one of the major plutons in this belt. Chronological
studies on this granite intrusion, including a Rb-Sr muscovite age of 422 ± 4 Ma and a K-
Ar muscovite age of 386 ± 5 Ma (Whalen and Theriault, 1990), as well as an 40Ar/39Ar
biotite age of 379 Ma (Taylor et al., 1987), suggest a Middle Devonian emplacement age.

75
A much younger feldspar-quartz-biotite (FQB) porphyry dyke intersected in drilling at
the Sisson Brook deposit yields an age of 364.5 ± 1.3 Ma (U-Pb zircon age; Fyffe et al.,
2008), which belongs to the Late Devonian as defined by Tucker et al. (1998) (363.4 ±
1.8 Ma).
The deposit consists of three mineralized zones (Fig. 3.2), in which Zone I and Zone
II are structurally controlled and over tens of meters in width and a hundred meters along
strike. They contain W and Cu, with no significant Mo. Zone III contains the main W and
Mo resources of the Sisson Brook deposit. The newest mineral resource estimate shows
that this deposit has 387 Mt of ore grading 0.067% WO3 and 0.021% Mo in the measured
plus indicated category, and 187 Mt of ore grading 0.05% WO3 and 0.02% Mo in the
inferred category (Rennie, 2012).
Previous studies of the Sisson Brook W-Mo-Cu deposit dealt with the mineralogy,
fluid inclusions, and alteration of the host rocks and mineralization (Nast, 1985; Nast and
Williams-Jones, 1991). This chapter focuses on classifying various felsic units in the
vicinity of the deposit according to their petrology, major- and trace-element
characteristics, and deducing their petrogenesis, and the formation environment of the
Sisson Brook W-Mo-Cu deposit.
3.2 Geological setting
The rocks in the vicinity of the Sisson Brook deposit consist of a thick sequence of
Cambro-Ordovician continental and marine volcanic and sedimentary rocks, and younger
mafic and felsic intrusive rocks (Nashwaak Granite, Howard Peak granodiorite and
gabbro) (Fig. 3.2). Late felsic dykes with different textures crosscut the Nashwaak
Granite and Howard Peak metagranodiorite and metagabbro.

76
The oldest rocks are quartzose wackes interbedded with siltstones and shales of the
Cambrian-Early Ordovician Miramichi Group and occupy the core of a north-northeast-
trending, southerly plunging anticline in the area (Lutes, 1981). These rocks are bounded
to the east and west by younger volcanic and sedimentary rocks of the Ordovician
Tetagouche Group (Fig. 3.1). To the west, the Miramichi Group rocks are in fault contact
with felsic crystal tuffs, mafic tuffs, and clastic sedimentary rocks of the Ordovician
Turnbull Mountain Formation, and to the east, they are overlain unconformably by black
shales, flow-banded felsic volcanic rocks and fragmental mafic volcanic rocks of the
Ordovician Hayden Lake Formation.
The oldest intrusive pluton in the Sisson Brook area is the Howard Peak Granodiorite
which is dark grey, medium- to coarse-grained, moderately to highly foliated, and
consists mainly of plagioclase and amphibole; minor calcite and sericite are associated
with biotitization and chloritization, due to intrusion of the young Nashwaak Granite. The
Howard Peak Granodiorite grades eastward into dark grey, medium-grained ophitic
gabbro (Fyffe et al., 2008). A drill hole near the boundary between the Nashwaak Granite
and Howard Peak Granodiorite, intersects 71 m of light grey to green diorite that is cut by
chalcopyrite-bearing calcite veins, and 129 m of dark grey to green, fine- to coarse-
grained granodiorite overlying the diorite. Locally, the Howard Peak Granodiorite
contains notable molybdenite, scheelite, pyrite, chalcopyrite, and magnetite.
The Nashwaak Granite has two subfacies. (1) pink, coarse- to medium-grained,
equigranular to subporphyritic biotite granite with a mineral assemblage of plagioclase,
orthoclase, quartz, and minor biotite, grades northward into (2) muscovite-biotite granite.

77
In drill core, foliated, silicified and greisenized granite dykes containing xenoliths of
gabbro crosscut the Howard Peak Granodiorite (Fyffe et al., 2008; Rennie, 2012).
A grey, massive, unfoliated granite porphyry dyke was intersected in drill hole
SSN26. The granite porphyry contains about 50% phenocrysts set in a fine-grained
groundmass of alkali feldspar and quartz. The phenocryst population includes about 25%
zoned plagioclase laths (An34-An15) up to 1 cm in length; 10% euhedral quartz crystals
from 1 mm to 7 mm in width; 8% biotite laths from 0.05 cm to 1 cm in length; and 7%
alkali feldspar crystals from 0.2 cm to 1 cm in width (Nast, 1985).
3.3 Sample Groups
Four groups of samples have been distinguished, based on their mineral assemblages
and textures. Group I samples (two-mica granite, n=13) are from the outcrops of
muscovite-biotite granite at the north end of Nashwaak pluton. This two-mica granite
intrudes the Cambro-Ordovician Trousers Lake Metamorphic Suite, which contains
robust crystals of sillimanite within 1 km of the contact. The two mica granite is
characterized by the presence of biotite with variable muscovite contents (Fig. 3.3a, b).
Alkali feldspar has typical tartan twins formed during the change from monoclinic high
temperature orthoclase to triclinic low temperature microcline, and perthitic texture
formed by the microcline and albite both exsolved (unmixed) from an originally
homogeneous composition (hypersolvus) at high temperature. Some earlier feldspar
crystals show reaction rims (see Parsons, 1977).
Group II samples (biotite granite, n=9) were collected from outcrops along the south
side of the Nashwaak biotite granite close to the Howard Peak Granodiorite contact with
the exception of one sample that was taken from drillhole SB-08-22. These samples are

78
biotite granite (facies) that are light pinkish grey, medium- to coarse-grained, and locally
slightly foliated. Biotite is abundant (approximately 20%) in these samples with
accessory zircon, apatite, monazite, magnetite, and ilmenite (Fig. 3.3c, d). The drill core
sample is from a biotite granitic dyke (144.34 m to 155.06 m in drill hole SB-08-22) that
cuts diorite at 60-65° to the core axis.
Group III samples (biotite granitic dykes, n=17) were collected from dykes that
crosscut the Howard Peak Granodiorite-gabbro in drill cores. Dyke contacts are generally
sharp and locally irregular with angles from 20° to 80° to the core axis (holes drilled at a
dip angle of 45° with few at 55°). Dyke widths range from several cm up to 12.2 m. The
dyke samples are generally light greenish grey (due to sericitization), medium to coarse
grained, anhedral inequigranular and unfoliated. Volumetrically minor aplitic to
pegmatoidal dykes were also evident. In this group, biotite (ca. 5%) is the dominant
ferromagnesian mineral coexisting with apatite and titanite (Fig. 3.3e, f).
Group IV (a porphyry dyke) comprises a single sample of a porphyry dyke that was
intersected from 13.6 m to 54.6 m in drillhole SSN-26. Phenocrysts consist of
approximately 23% plagioclase up to 1 cm across, 10% quartz up to 7 mm across, 8%
biotite up to 0.3 mm in length, and 7% K-feldspar (0.2 to 1.0 cm in width) (Fig. 3.3g, h)
(Nast, 1985). This dyke is also intersected in drillhole SB-05-03, located about 700 m to
the southwest of drill hole SSN-26 (Martin, 2006).
3.4 Analytical Methods
3.4.1 Major- and trace-elements analysis
All samples were crushed and pulverized at the University of New Brunswick. For
each sample, approximately 10 g pulp was analyzed at Memorial University of

79
Newfoundland by using pressed pellet X-ray fluorescence (XRF) technique for contents
of Na2O, Al2O3, CaO, Fe2O3(T), K2O, MgO, MnO, P2O5, SiO2, TiO2, As, Ba, Ce, Cl, Cr,
Cu, Ga, Nb, Ni, Pb, Rb, S, Sc, Sr, Th, U, V, Y, Zn, and Zr (see Longerich 1995); and 50
g was analyzed at Actlabs by instrumental neutron activation analysis (INAA) for
composition of Au, Ag, As, Ba, Br, Ca, Ce, Co, Cr, Cs, Eu, Fe, Hf, Hg, Ir, La, Lu, Mo,
Na, Nd, Ni, Rb, Sb, Sc, Se, Sm, Sn, Sr, Ta, Tb, Th, U, W, Yb, and Zn. Three standard
samples (i.e., SY-4 from Canada Centre for Energy and Mineral Technology
(CANMET), NIM-G (Steele et al., 1978), and 94-GS (Lentz, 1995)) were included in
each batch of samples to monitor analytical quality. Comparison between the data and
accepted values of the standards indicates that accuracy increases with element
concentration. The relative error is always less than 10% if the major-element
concentration is above 5%, or if the trace-element concentration is above 10 ppm. Where
the same element was detected by both methods (XRF, INAA), the data closest to the
accepted value of standards (Appendix Tables 1 and 2) was used (see Table 3.1).
3.4.2 Hydrogen, O, and S isotope analysis of the whole rocks
Twelve granite samples from different rock units were prepared for hydrogen and
oxygen isotope analysis at the Queen’s University. Oxygen was extracted from separated
quartz and whole rocks using the BrF5 method of Clayton and Mayeda (1963) and δ18O
values were measured using a dual inlet Finnigan MAT 252 Isotopic Ratio Mass
Spectrometer (IRMS). Hydrogen isotope compositions were determined from whole rock
samples using a Thermo Chemical Elemental Analyzer coupled to a XP Thermo Finnigan
and Delta Plus IRMS. Some whole-rock samples were treated with 20 percent HCl in a
sonic bath and centrifuged in order to remove impurities, such as carbonates. Oxygen and

80
H isotope compositions are reported in the δ notation in units of per mil relative to the
standard V-SMOW (Vienna-Standard Mean Ocean Water, δ18O and δD). The δ18O and
δD values were reproducible to ± 0.2 and ± 3‰, respectively (see Table 3.2).
Sulfur isotope analysis was carried out at the University of Ottawa. Samples are
weighed into tin capsules with equal or greater amounts of tungstic oxide by the lab.
Samples are loaded into a Vario el (Elementar, Germany) elemental analyser (EA) to be
flash combusted at 1800 °C. Released gases are carried by helium through the EA to be
cleaned, and then separated by "trap & purge". SO2 gas is carried into the XP isotope
ratio mass spectrometer (ThermoFinnigan, Germany) for analysis. Analytical precision is
+/- 0.2 per mil (see Table 3.3).
3.4.3 Sr and Nd isotope
For Rb/Sr isotopic analyses, whole-rock powders are dissolved in 2.5N HCl and then
pipetted into a 14-ml Bio-Rad borosilicate glass chromatography column containing 3.0
ml of Dowex AG50-X8 cation resin. Rubidium and Sr are eluted in succession using 2.5
N HCl. REE fractions are dissolved in 0.26N HCl and loaded onto Eichrom Ln Resin
chromatographic columns containing Teflon powder coated with HDEHP (di(2-
ethylhexyl) orthophosphoric acid, Richard et al., 1976). Neodymium is eluted using
0.26N HCl, followed by Sm in 0.5N HCl. The average values of total procedural blanks
obtained during the study period are as follows: Sr 250 picograms, Nd 50 picograms, and
Sm 6 picograms.
Strontium and Nd isotopic ratios were determined using a Finnigan-MAT 261 multi-
collector mass spectrometer at the Carleton University operated in the static mode.
Samples were loaded on either Ta or Re filaments. Isotope ratios are normalized to

81
86Sr/88Sr = 0.11940 and 146Nd/144Nd = 0.72190 to correct for fractionation (Richard et al.,
1976) (see Table 3.4).
3.4.4 Geochronology of zircon
A biotite granitic dyke sample from drill core was selected for U-Pb zircon dating.
The zircon was separated by heavy liquid at the Overburden Drilling Management
Limited (ODM). The largest and best quality zircon grains were selected and fixed to an
epoxy mount. Prior to analysis, inherited core and magmatic rims of zircons were imaged
by the Scanning Electron Microscopy - Cathodoluminescence (SEM-CL) (see Fig. 3.8).
The laser ablation-inductively coupled plasma mass spectrometry (LA-ICPMS) U-Pb
dating of zircon was conducted using a Resonetics M-50-LR 193nm Excimer laser
ablation system coupled to an Agilent 7700x quadrupole ICP-MS at the University of
New Brunswick, Canada. This analysis uses a 26 µm beam size, 4 Hz pulse rate, 5 J/cm2
fluence, and zircon 91500 as the standard sample. Results are presented in Table 3.5.
3.4.5 Re-Os geochronology
Three molybdenite samples were collected from drillholes SB-08-26 at 244.5 m, SB-
08-32 at 203.2 m, and SB-09-15 at 169.5 m, respectively. These molybdenite crystals
occur along margins of 3-5 cm wide quartz veins from different host rocks, including
gabbro, quartz diorite, and felsic volcanic tuff. These wide, commonly planar Mo-bearing
quartz veins represent the main Mo mineralization stage. Other minerals in the quartz
veins include scheelite, minor wolframite, and minor sulphide. The analysis of Re and Os
composition of molybdenite was conducted at the University of Alberta Radiogenic
Isotope Facility by isotope dilution mass spectrometry using Carius-tube digestion,

82
solvent extraction, anion exchange chromatography, and negative thermal ionization
mass spectrometry techniques.
Isotopic analysis used a Thermo Scientific Triton mass spectrometer with a Faraday
collector. Total procedural blanks for Re and Os are less than 5 picograms and 4
picograms, respectively, which are insignificant for the Re and Os concentrations in
molybdenite. The molybdenite from the Henderson mine and mill in Colorado (Markey
et al. 2007), is routinely analyzed as a Re-Os age standard. The age of this reference
material was defined as 27.656 ± 0.022 Ma (95% conf.). Detailed analytical methods
were described by Selby and Creaser (2004). Results are presented in Table 3.6.
3.5 Geochemical characteristics
3.5.1 Major element characteristics
The silica contents of all analyzed samples range from 69.29 to 81.46 oxide wt.%
(Table 3.1). These samples plot within the field of subalkaline granite on the TAS (Total
Alkalis-Silica) diagram of Cox et al. (1979), and are located in the fields of alkali-
feldspar granite and syenogranite in the QAP diagram of Streckeisen (1976). They are
generally moderately to strongly peraluminous (molar A/CNK: Al2O3/(CaO+Na2O+K2O)
> 1, Maniar and Piccoli, 1989; Fig. 3.4). These granites are calc-alkaline on the basis of
the AFM (Na2O+K2O - FeOt - MgO) diagram (Irvine and Baragar, 1971; not shown)
with the total Na2O+K2O varying from 4.34 to 8.3 wt.%. The iron number
[FeOT/(FeOT+MgO)] ranges between 0.56 and 0.91, indicating that most of the granites
are magnesian (FeOT/[FeOT+MgO] < 0.8 at SiO2 of 70 wt.%; Frost et al., 2001; Frost and
Frost, 2008). The data for all granites show TiO2, P2O5, Al2O3, and Fe2O3T have well-

83
defined, nearly negative trends with increasing SiO2. The remaining elements, including
MnO, MgO, CaO, Na2O, and K2O have no apparent systematic variation with silica.
The Nashwaak plutonic phases, consisting of muscovite-biotite granite (Group I) and
biotite granite (Group II), have similar major element contents, with SiO2 = 66.4 - 75.7
wt.%, Al2O3 = 13.4 - 18.5 wt.%, TiO2 = 0.13 – 0.36 wt.%, and P2O3 = 0.05 - 0.25 wt.%.
They also have a high aluminum saturation index (ASI) (>1.1) and K2O and thus fall into
the field of high-K granite (Peccerillo and Taylor, 1976).
In the dyke groups, all data from the porphyry dyke plot in the same range of
plutonic phase, except that their ASI is lower (<1.1). The biotite granitic dyke group
(Group III) is distinct from other groups because of its high silica (69.3 -81.5 wt.%) and
Na2O (1.25 - 4.74 wt.%), but low TiO2 (0.04 - 0.18 wt.%), Al2O3 (10.7 - 16.7 wt.%),
P2O5 (0.01 - 0.1 wt.%), and K2O (0.67 - 5.29 wt.%) (Fig. 3.5).
3.5.2 Trace element characteristics
3.5.2.1 Rare Earth Elements (REE)
All of the granite samples show similar chondrite-normalized rare earth element
(REE) (Sun and McDonough, 1989) patterns to that of the average crustal compositions
(Wedepohl, 1995) (Fig. 3.6, Table 3.1). They have a gently to moderately sloping profile
with noticeable negative Eu anomalies due to fractionation of feldspar, and slight
depletion with respect to heavy REEs. The Group I and Group II have generally parallel
overall trends, although they have slightly different (La/Yb)N ratio (Group I = 4.28-11.5,
Group II = 5.98-31.9), and the Group III has a flatter pattern with the (La/Yb)N ranging
from 1.27 to 7.98. Moreover, the total REE abundances do not show systematic
variations with silica, and they are higher in Group II (~16-226 ppm) than in other groups

84
(Group I: ~46-126 ppm; Group III: ~32-168 ppm; Group IV: 128 ppm). It is notable that
the REE patterns of these granites cross over to some extent, combined with no linear
variations in the (La/Yb)N - YbN diagram (Fig. 3.7), suggesting involvement of other
magmatic processes (i.e., assimilation) besides simple fractional crystallization (i.e.,
AFC; see Lentz, 1996, 1998).
3.5.2.2 Primitive mantle-normalized spider diagrams
Primitive mantle-normalized (Sun and McDonough, 1989) extended trace-element
plots for the granites show enrichment in large ion lithophile elements (LILE, e.g., Rb,
Ba, Th, U, and K), with pronounced negative Ba, Nb, Sr, P, and Ti anomalies (Fig. 3.6;
Table 3.1). The enrichment of LILEs can be attributed to their incompatible habit during
AFC process. It is noted that the trace element patterns as reflected by these granites and
may have been derived from volcanic arcs, and the enrichment of Rb, Ba, Th, U, K in the
melts is caused by a slab contribution, in which these elements always behave as highly
‘nonconservative’ during the subduction process (e.g., Ryerson and Watson, 1987; Green
and Pearson, 1987; Pearce and Peate, 1995). Barium, Nb, Sr, P, and Ti depletion may be
the result of late fractional crystallization (Guilbeau and Kudo, 1985; Sivell and
Waterhouse, 1988). For example, apatite removal is reflected by P depletion, and
formation of a restite Ti phase is likely to be responsible for the Nb and Ti depletion
(Briqueu et al., 1984; Stimac and Hickmott, 1994). In the Nashwaak plutonic phases, the
K-feldspar fractionation is supported by the LILE linear variations. In Group I and Group
II, Sr (13-252 ppm) contents decrease with decreasing Ba (210-764 ppm) and with
increasing Rb (97-399 ppm); and Rb/Sr (0.38-30.7) increase with decreasing Sr contents
(Fig. 3.7). These variation trends may be caused by fractional crystallization of feldspar.

85
The Group III shows different trends, and may be affected by additional geological
process, e.g., interaction with wall rocks. A negative Nb anomaly is commonly
considered as indicative of subduction-related magmatism (Thompson et al., 1984, Yang
et al., 2002; Baier et al., 2008). The high field strength element abundances (HFSE)
between different groups are indistinguishable with Zr < 228 ppm, Hf < 6 ppm, U < 14.6
ppm, Th < 31.8 ppm, Nb < 23.1 ppm, and Ta < 3.5 ppm, but the lowest Zr/Hf ratio was
evident in Group III reflecting it is the highest evolved characteristic.
3.6 Isotopic compositions
3.6.1 Oxygen, H, and S stable isotopes
Whalen et al. (1996) analyzed the whole-rock δ18O composition of the Nashwaak
Two-mica Granite (Group I) with a range from 9.3 to 10.0‰, which is close to that of
Group III (9.7 to 10.9 ‰, one sample is 12.3‰) and Group IV (10.1‰). Group II has
lower δ18O value (7.9-9.5‰), but is still consistent with the δ18O values of other Siluro-
Devonian plutons in the Gander Zone (Mostly 7.4-10.4‰) (Whalen et al., 1996). Thus,
these granites are ‘normal granites’ (Taylor, 1968, 1978) and are derived from igneous
protoliths, although supracrustal contamination may have been involved in magma
evolution process. The whole-rock δD values of all the groups of samples are in a small
range from -79 to -62 ‰ (Table 3.2).
The whole-rock δ34S values of the Nashwaak pluton (Group I and II) were below
detection limits due to their low S content (Group I= avg. 250 ppm, and Group II= avg.
159 ppm). The whole-rock δ34S values of dykes range from +3.6 to 4.7 ‰ for Group III
(S = 230 - 4233 ppm) and +5.2‰ for Group IV (S = 468 ppm) (Table 3.3). The small
δ34S variation range in the biotite granitic dykes (Group III) can be explained by
86
reflection of fractional crystallization which can cause δ34S values to change by ±1.5‰
(Yang and Lentz, 2010). However, the sample BGD-11 has 4233 ppm S that is too high
for the sulfur solubility in granitic melts (maximum 1400 ppm at 1025 °C, calculated by
Yang and Lentz, 2010), and also has the lowest δ34S value of 3.6‰. It likely was
contaminated by supracrustal rocks. The overall δ34S values of Group III and Group IV
are in the δ34S range of I-type granites (-3.6 to +5.0‰, Coleman, 1977).
3.6.2 Strontium and Nd isotopes
The measured 87Rb/86Sr, 87Sr/86Sr, and calculated initial (87Sr/86Sr)i of the Nashwaak
Granite samples and related dykes are from 0.641 to 10.986, from 0.7098 to 0.7731, and
from 0.702 to 0.710, respectively (Table 3.4). The calculations of the initial (87Sr/86Sr)i
and ɛNd(t) are based on the zircon U-Pb age of 405 Ma (this chapter) for Group I, II, and
III, and 364 Ma for Group IV (Fyffe et al., 2008). All the granites have consistent ɛNd(t)
values ranging from -4.51 to -1.42, with the 147Sm/144Nd of 0.1230 to 0.1597, and
143Nd/144Nd of 0.511885 to 0.512345. The (87Sr/86Sr)i and ɛNd(t) values indicate that these
granitic magmas are formed by partial melting of old crustal materials (cf. Murphy,
2007).
3.6.3 Uranium-Pb zircon age
The first attempt to date the Nashwaak Granite and related dykes used the method of
U-Pb in situ zircon dating by LA-ICPMS at the University of New Brunswick. Five thin
sections were cut for each sample and the analysis result could not yield a reliable age
because of the limited numbers of zircon grains. In order to obtain enough zircon grains,
the bulk rock samples were pulverized and zircon grains were separated. Twenty to fifty

87
zircon grains for each sample from different groups were fixed into an epoxy mount and
analyzed by LA-ICPMS. Because of the narrow overgrowth rim of zircon and fractures in
the zircon crystals, a 17 µm beam size was used and the analysis results could not yield
reliable ages. The sample epoxy mount were then polished in order to eliminate ablation
craters in the zircon grains. Further analysis used a 26 µm beam size and still could not
obtain reliable ages for these samples. One exception is the sample (sample BGD-13)
taken from a medium- to coarse-grained biotite granitic dyke. Zircon grains (50 to 100
μm in size) selected from this sample are colourless, transparent, and subhedral to short
prismatic (Fig. 3.8). Twenty-seven zircon grains were analyzed and the ablation spots
were located on the magmatic zoning of the grains, avoiding any fractures and inclusions.
All the data were then processed by IOLITE and Isoplot. Seven of the points yielded a
concordant age of 405.6 ± 2.5 Ma with a mean square of weighted deviation (MSWD) of
0.0098 and a probability of 0.92 (Fig. 3.9; Table 3.5). The age of the biotite granitic dyke
is close to the age range of Pokiok Batholith (409 ± 2 Ma of Skiff Lake granite, 402 ± 1
Ma of Allandale Granite, and 400.5 ± 1.2 Ma of dykes in them; Bevier and Whalen,
1990a, b; Whalen, 1993; Beal et al., 2010; McLeod et al., 2004), which is located about
50 km south of the Sisson Brook deposit. Although current available ages for the
Nashwaak Granite plutons are 422 ± 4 Ma (Rb-Sr muscovite age) and 386 ± 5 Ma (K-Ar
muscovite; Whalen and Theriault, 1990), it is possibly that neither of these ages represent
the crystallization ages of these plutons, since these isotope concentrations in rocks are
susceptible to isotopic resetting and disturbance caused by metamorphism and fluid-rock
interaction. Considering the Nashwaak pluton phases are cut by the dykes as exposed by
trenching, thus these pluton phases must be older than 405 Ma.

88
3.6.4 Rhenium-Os molybdenite age
Results of the Re-Os analysis of three samples are given in Table 3.6. The age
uncertainties are reported at 2σ level. The 187Re and 187Os concentration of sample
SB0826, SB0832, and SB0915 are from 2410.5 to 5482.3 ppb, and from 15.3 to 34.5 ppb,
respectively. The Re-Os molybdenite model ages for these samples are identical showing
as 376.45 ± 1.64 Ma for SB0826, 378.54 ± 1.71 Ma for SB0832, and 377.57 ± 1.71 Ma
for SB0915 (Table 3.6). However, these ages representing the main stage of Mo
mineralization that is much younger than the medium- to coarse-grained biotite granitic
dyke of 405.6 ± 2.5 Ma obtained by this study using U-Pb zircon geochronology, and
older than the porphyry dyke dated at 364.5 ± 1.3 Ma (U-Pb zircon age; Fyffe et al.,
2008). The Re-Os molybdenite model age of ca. 377 Ma suggests that another generation
of granitic pluton responsible for ore fluids at the Sisson Brook deposit area has not been
intersected by drilling. If some of the dykes in the dyke swarm could represent the
offshoots of a deeply buried pluton, which is attributed to mineralization as previously
thought, then these syn-hydrothermal dykes could not be the medium- to coarse-grained
biotite granitic dykes because of the huge age gap between them unless these medium- to
coarse-grained biotite granitic dykes formed at different times besides the age of 405.6 ±
2.5 Ma. However, similarity of mineral assemblage and absence of cutting relationship
between them in drillholes make it hard to judge their geochronological sequence.
Alternatively, the syn-hydrothermal dykes could be the dykes with different textures,
such as an aplitic dyke in drill hole SB0830 or a pegmatoidal dyke in drill hole SB1121,
although they are volumetrically minor in this area.

89
The Re-Os age of ca. 377 Ma for the molybdenite at Sisson Brook deposit is
contemporaneous with the age of Burnthill Granite (ca. 380 Ma40Ar/39Ar age) and might
also the formation age of Peaked Mountain W-Mo deposit (Taylor et a., 1987). This
regional metallogenic epoch took place slightly earlier than the Mount Pleasant deposit,
which has molybdenite yielding ages of 369-370 Ma (Re-Os molybdenite) as reported by
Thorne et al. (2013). Fyffe et al. (2008) suggested that long-lived magmatic–
hydrothermal systems evolve from Late Silurian to Late Devonian in the central
Miramichi Highland. This total time span of plutonism is similar to that found for the
episodic emplacement of the composite Saint George Batholith in southern New
Brunswick. The metallogenic trends in these two areas are also similar as showed by the
Late Silurian to Early Devonian less-differentiated granite and granodioritic intrusive
suites that are responsible for the Au-Sb mineralization, and Middle to Late Devonian
highly evolved, and in some cases, high-silica and/or topaz granites are responsible for
the Sn-W-Mo mineralization (McLeod et al., 2008).
3.7 Magma temperatures
Zircon saturation temperatures (TZr) can be calculated by using melt Zr concentration
represented by bulk rock Zr content of granites (Table 3.1) on the basis of experiment
work of Watson and Harrison (1983). This temperature may represent a maximum
temperature for low temperature granites, and a minimum temperature for high
temperature granites (Chappell et al., 1998). The calculated TZr for the Group I ranges
from 772 °C to 810 °C, 730 to 814 °C for Group II, 677 to 782 °C for Group III, and 770
°C for Group IV (Table 3.1).

90
Apatite solubility in the melt is a function of absolute temperature (T) and the melt
composition (basically P2O5 and SiO2) (Harrison and Watson, 1984). Using the bulk rock
contents of P2O5 and SiO2 to deduce the apatite saturation temperature, Group I yielded
temperatures of between 877 and 969°C, whereas Group II yielded temperature of 925 to
995°C. Group III has lower Tap ranging from 753 to 917°C and Group IV is 948°C (Table
3.1). Obviously, Tap is higher than TZr in each group, and this difference may be caused
by the presence of other P-bearing phases, i.e., monazite which occurs in Nashwaak
Granite and related dykes.
Miller et al. (2003) interpreted granites with the TZr lower than 800°C as “cold
granites” and such granites form from inheritance-rich magmas requiring fluid influx,
either by dehydration of underthrust sedimentary rocks (Murphy, 2006) or from hydrous
mafic silicates in ultramafic-mafic rocks. These magmas are rich in crystals and reflect a
crustal thickening environment (Miller et al., 2003). This is not exactly the same
subdivision as high- and low-temperature granites proposed by Chappell et al. (1998),
which is based on the absence or presence of inherited zircon, respectively. In the
Nashwaak Granite and related dykes, the zircons have inherited cores with old ages
determined by laser ablation inductively coupled plasma-mass-spectrometry (LA-
ICPMS); these low-temperature granites may be formed by partial melting of quartzo-
feldspathic rocks (Chappell et al., 1998, 2004a).
3.8 Evaluation of geochemistry as indicators of tectonic setting
The Nashwaak Granite and related dykes have low Rb (< 399 ppm), Nb (< 23.1
ppm), and Y (< 53.5 ppm). On the Nb vs. Y diagram and Rb vs. Nb+Y diagram (Fig.
3.10a, b; Pearce et al., 1984; Christiansen and Keith, 1996; Förster et al., 1997), most

91
samples plot in the I-type volcanic arc environment. This is further supported by the Nb-
Y-Ce diagram (see Eby, 1992; see Christiansen and Keith, 1996), where the lower Nb
contents relative to Y + Ce place the samples to the A2 area, which suggests that these
granites originated from continental crust or arcs (Fig. 3.10c).
Drummond and Defant (1990) employed La/Yb and Sr/Y ratio to discriminate
adakite from typical arc rocks. In those diagrams, the Nashwaak Granite and related
dykes with low (La/Yb)N (< 32) and Sr/Y (< 28) ratios are consistent with typical arc
rocks (Fig. 3.10d). This tectonic setting has been inferred for the nearby Lake George
Granite (Yang et al., 2002) and the associated quartz-feldspar porphyry dyke (Leonard et
al., 2006). However, a different tectonic setting (crustal within-plate and syn-collision
setting) has been interpreted for the granitoids of southern New Brunswick (Kooiman et
al., 1986; McLeod, 1990; Lentz, 1992; Lentz and Gregoire, 1995; Yang et al., 2008).
3.9 Discussion
3.9.1 Magma source and granite type
The biotite granite dykes formed at 405.6 Ma and other subfacies of Nashwaak
Granite probably have the similar ages. The W and Mo deposits associated with the Late
Silurian to Late Devonian granitoids in the New Brunswick are the products of the
Acadian and Neoacadian orogenic magmatism (Taylor et al., 1987; MacLellan and
Taylor, 1989; Yang et al., 2002; Yang et al., 2003; 2009; Beal et al., 2010). In these
granitoids, the Lake George Granodiorite is a typical I-type granite (cf. Chappell, 1974;
Chappell and White, 1982), whereas the Mount Pleasant Granite shows A-type granite
characteristics and the Burnthill Granite and Zealand Granite dykes exhibit a transitional
A-type to S-type signature (Taylor et al., 1987; Yang et al., 2003; Beal et al., 2010). For

92
the Nashwaak Granite and related dykes, Group I has S-type granite characteristics
shown by presence of muscovite and high ASI (> 1.1), P2O5 (> 0.1 wt.%), and low CaO
(mostly < 1.37 wt.%) and Sr (13-108 ppm) (Chappell and White, 1974, 1992, 2001). But
its low Rb (mostly < 291 ppm), Ta (< 3.5 ppm), and oxygen isotope of whole rock (9.3 -
10‰) indicate it is I-type granite (Taylor, 1978; Chappell and White, 1992; Christiansen
and Keith, 1996). For the other three groups, their P2O5 decrease with silica increasing,
combined with the mineral assemblage in these samples (i.e., the presence of titanite and
magnetite without cordierite and garnet) shows that they are I-type granitoids instead of
S-type granitoids (cf. Blevin and Chappell, 1995; Barbarin, 1999). They are also different
from A-type granite due to their low FeOT/MgO (< 9.5), (K2O+Na2O)/CaO (< 23.4), and
low Zr+Nb+Ce+Y (322 ppm) (see Whalen et al., 1987).
The whole-rock δ18O (9.3-10.9 ‰) indicates that the Nashwaak Granite and related
dykes are ‘normal granites’ with various degrees of contamination (Taylor, 1968, 1978).
The ɛNd(t) (-4.51 to -1.42), and the 206Pb/204Pb, 207Pb/204Pb, 208Pb/204Pb values of 18.3,
15.6, and 38.3, respectively from Ayuso and Bevier (1991), imply that the Nashwaak
Granite and related dykes are mainly originated from meta-igneous old crustal rocks
(Bevier and Whalen,1990; Whalen, 1993). Since the nature of the lower crust of the
Gander Zone is poorly known, it is hard to deduce the possible sources of the Nashwaak
Granite and related dykes. Possible basement fragments of the Gander Zone occur in the
Tetagouche Group shown as granodiorite cobbles which yield late Mesoproterozoic (ca.
1.09 Ga) U-Pb zircon crystallization ages and gave an ɛNd(t) of -3.47. Xenocrystic zircon
grains in the cobbles range in age between ca. 1.16 and 1.55 Ga (van Staal et al., 1996).
van Staal et al. (1996) argued that overlap of the Nd crust formation ages of Palaeozoic

93
granitoid plutons (1.3 - 1.7 Ga; Whalen, 1993) of the Gander Zone with the
crystallization and xenocrystic zircon of these cobbles indicates that the Paleozoic
granites probably image or map an old continental crustal basement. However, the
ɛNd(0.4 Ga) of the granodiorite cobble representing the old crustal basement is -8.8, and
to form the Nashwaak Granite and related dykes (ɛNd(t) = -4.51 to -1.42), mantle melts or
mafic lower crustal rocks are needed. Whalen et al. (1996) interpreted those granitic
magmas to being derived from bulk assimilation of Meso-proterozoic Gondwanan
basement ± the overlying Gander Zone sedimentary prism, by enriched asthenospheric
mantle-derived melts. The Meso-proterozoic basement could be the seismically imaged
Central Crustal Block beneath the Gander and Avalon zones (Keen et al., 1986; Marillier
et al., 1989; Quinlan et al., 1992). Unless more information of the end-member sources is
available, any attempt to quantify the relative amount of end-members by simple mixing
calculations would be meaningless.
3.9.2 Magma evolution process
Nast (1985) deduced an upper pressure limit of 3.5 kb (350 MPa), based on the
appearance of andalusite porphyroblasts in the sedimentary country rocks and a lower
pressure limit of 1 kb (100 MPa) based upon the fracture intensity. Thus these granites
formed at shallow levels. Tuttle and Bowen (1958) presented phase relationships in the
system quartz-albite-orthoclase (Qz+Ab+Or) under water-saturated conditions, which
started modern granite studies (Chappell, 2004b) and has been used ever since for
exploring the water pressure and evolution trends of magmas (Cashman and Blundy,
2000; Yang and Lentz, 2005). In this diagram, the Nashwaak granitoids started to

94
crystallize at 250 MPa (equal to 7-8 km in depth) with more than 80% normative quartz +
albite + orthoclase at the temperature around 750 °C (TZr).
The magma evolution process is controlled by fractional crystallization reflected by
their trace element compositions, e.g., feldspar crystallization indicated by Sr decreases
with Ba decreasing and with Rb increasing, as well as the Rb/Sr increases with
decreasing Sr contents; monazite crystallization exhibited by La/Yb decreases with La
decreasing (Fig. 3.10). Furthermore, the Ba, Sr, P, and Ti depletion may also be caused
by feldspar, apatite, and Ti-phase crystallization. However, supracrustal contamination
may also have happened as is evident by the scatter of certain elements on the Harker
diagram, the REE pattern cross over to some degree, and lack of connection between
isotope values with silica. Moreover, the magma of the Nashwaak granitoids formed by
subduction should be oxidized, since in this setting, oxygen fugacity of the magma is
linearly correlated with their water content that is usually high (Kelley and Cottrell,
2009). However, assimilation of the supracrustal rocks is a possible mechanism to
explain why the Nashwaak granitoids have lower oxygen fugacity than expected.
3.9.3 Metallogenic implications
Tungsten-molybdenum deposits are generally related to I-type granites and A-type
granites (see chapter 2). Crustal source is not a prerequisite to W deposit formation, but
crustal contamination could amplify W enrichment (cf. König et al., 2008). Since W and
Mo behave as incompatible elements in oxidized magmas, the W-Mo deposits are
typically related to the highly fractionated granites (cf. Chowdhury and Lentz, 2011).
Although the biotite granitic dyke with the age of 405.6 ± 2.5 Ma and the porphyry dyke
with the age of 364.5 ± 1.3 Ma are not the probable granite responsible for the

95
mineralization, other biotite granitic dykes, especially those with different textures (i.e.
aplitic dykes and pegmatoidal dykes) could not be ruled out. Geochemical characteristics
of the Nashwaak Granite and related dykes show that they have very high silica (mostly >
70 wt. %), and the biotite granitic dykes (Group III) have the highest silica and the most
pronounced Ba, Sr, P, and Ti depletion. Furthermore, the granophile and other elements
(i.e., Sn, W, and Mo) enriched ‘specialized’ granitoids usually have low ratios of K/Rb,
Mg/Li, and Ba/Rb, but high ratios of Rb/Sr, and thus the multiplicative ratios of
(Rb3×Li)/(Mg×Ba×Sr×K) was used to discriminate the specialized granitoids from barren
granitoids (Govett and Atherden, 1988; Srivastava and Sinha, 1997). Since the Nashwaak
Granite and related dykes lack of Li data, the multiplicative ratios of
(Rb3×10000)/(Ba×Sr×K) were calculated for them. In those granitoids, the muscovite-
biotite granite (Group I) and biotite dykes (Group III) have higher
(Rb3×10000)/(Ba×Sr×K) value ranging from 23.8 to 5387, and from 11.2 to 150,
respectively. Compared with the muscovite-biotite granites (Group I) which are neither
close to the Sisson Brook deposit nor enriched in W and Mo elements, the biotite dykes
(Group III) could be the ‘specialized’ granites and contribute to the formation of Sisson
Brook deposit.
The extraction of W and Mo from crystallizing magmas during exsolution of an
aqueous fluid phase; this process is controlled by oxidation state, melt and aqueous fluid
composition, temperature, and pressure (Blevin and Chappell, 1992; Sillitoe, 1996).
Mahood and Hildreth (1983) demonstrated that W is slightly enriched in magnetite and
titanite under relatively high fO2 conditions, but its compatibility in ilmenite decreases
with increasing oxygen fugacity (fO2) (Candela and Bouton, 1990). Therefore, W

96
deposits can occur in oxidized and reduced granites (Blevin and Chappell, 1992), but are
higher grade when associated with reduced granites. On the other hand, according to
Tacker and Candela (1987) and Candela and Bouton (1990), Mo partition coefficients
drop in half when the fO2 changes from the graphite-methane to nickel-nickel oxide
(NNO) buffer conditions. The similar ionic radius of Mo4+ and Ti4+ cause Mo to be lost
from the melt with the crystallization of Ti-bearing minerals (e.g., biotite, ilmenite, and
titanite). Therefore, increasing the valence of Mo to higher than 4+ makes it more
incompatible. Because Mo enrichment only forms in high fO2 conditions, and the W
partition coefficient between crystallizing minerals and melts is less dependent on the
oxidizing state, the W-Mo deposits are generally associated with oxidized granites
(Blevin and Chappell, 1992). However, the magnetic susceptibility meter (KT-10)
measurements (measured 3 times for each sample) yielded average values that lie along
the boundary of the magnetite series and ilmenite series granites (1×10⁻⁴ emu/g; Ishihara,
1981, 1998). This result is in accordance with the findings of Shabani et al. (2003), who
demonstrated that the magnetite/ilmenite ratio in granites varies considerably in the
Gander Zone of New Brunswick. These reduced ilmenite series granites may form by the
input of a supracrustal component. The carbon from assimilated country rocks partially
reduced the oxygen fugacity of the magma and probably elevated the W content in the
magma (see also Newberry and Swanson, 1986). Copper is compatible during magma
fractional crystallization and increasing continental crustal contamination dilutes the Cu
concentration in magmas (Christiansen and Keith, 1996), thus the Sisson Brook deposit
only has minor Cu mineralization in Zone I and II.

97
3.10 Conclusions
With the aid of major and trace elements, stable isotopes (H, O, and S), and
radiogenic isotopes (Sr-Nd) studies on the Nashwaak Granite and related dykes, which
are spatially related to the Sisson Brook W-Mo-(Cu) deposits, the petrogenesis of these
granites can be summarized as follows.
(1) The Nashwaak Granite (Group I and II) and related dykes (Group III, and IV) are
highly siliceous (SiO2 > 69 wt. %), peraluminous (ASI >1), and are typical I-type granites
with low Rb (< 399 ppm), Nb (< 23 ppm), Y (< 54 ppm) contents and low (La/Yb)N (<
32) and Sr/Y (< 28) ratios. The similar chondrite-normalized REE patterns and primitive
mantle-normalized diagrams indicate they originated from the same source although
affected by varied AFC processes. Of these granites, the biotite granitic dykes are highly
evolved, which is indicated by the highest silica content and largest compatible elements
(Ba, Sr, P, and Ti) negative anomaly amongst the four groups. They formed in a volcanic
arc setting in response to subduction-related geodynamic environment in the region.
(2) The Nashwaak granitoids are ‘cold’ (TZr < 800 °C), low-temperature granites
(inherited zircon presence). The magma crystallized at 250 MPa (7-8 km) (Group I and
II), and the late dykes (Group III and IV) ascended to a much shallower depth. The δ18O
and ɛNd(T) of the Nashwaak granitoids indicate that they are normal granites and are
derived from bulk assimilation of Meso-proterozoic Gondwanan basement ± the
overlying Gander Zone sedimentary prism, by enriched asthenospheric mantle-derived
melts. Assimilation and fractional crystallization may have played a key role in magmatic
evolution.

98
(4) One of the biotite granitic dykes (Group III) formed at 405.6 ± 2.5 Ma
(MSWD=0.0098, probability=0.92) and the three Re-Os model ages for the molybdenites
are 376.45 ± 1.64 Ma to 378.54 ± 1.71 Ma. Thus, syn-hydrothermal dykes could not be
the medium to coarse grained biotite granitic dykes because of their age gap, but could be
the dykes with different textures, i.e., the aplitic and pegmatoidal dykes in this area.
Further detailed dating work is needed to differentiate the ages of these dykes.
Geochemical features show the dykes could be the ‘specialized’ granite and contribute to
the formation of Sisson Brook deposit. They have been highly fractional crystallized,
leading to enrichment of incompatible metallic elements (W and Mo). Crustal
contamination reduced the oxygen fugacity, but probably elevated the W content in the
magma. Copper is compatible and would be depleted in highly differentiated magmas
due to fractional crystallization, thus only minor Cu mineralization occurs in Zone I and
II.
References
Ayuso, R.A., Bevier, M.L., 1991. Regional differences in lead isotopic compositions of
feldspars from plutonic rocks of the northern Appalachian mountains, U.S.A. and
Canada: a geochemical method of terrane correlation. Tectonophysics 10, 191-212.
Baier, J., Audétat, A., Keppler, H., 2008. The origin of the negative niobium tantalum
anomaly in subduction zone magmas. Earth and Planetary Science Letters 267, 290-
300.
Barbarin, B., 1999. A review of the relationships between granitoid types, their origins
and their geodynamic environments. Lithos 46, 605-626.

99
Beal K., Lentz, D.R., Hall, D.C., Dunning, G. 2010. Mineralogical, geochronological,
and geochemical characterization of Eartly Davonian aquamarine-bearing dykes of
the Zealand Station beryl and molybdenite deposit, west central New Brunswick.
Canadian Journal of Earth Sciences 47, 859-874.
Bevier, M.L., Whalen, J.B., 1990a. U-Pb geochronology of Silurian granites, Miramichi
terrane, New Brunswick. In Radiogenic Age of Isotopic Studies: Report 3,
Geological Survey of Canada, Paper 89-2, 93-100.
Bevier, M.L., Whalen, J.B., 1990b. Tectonic significance of Silurian magmatism in the
Canadian Appalachians. Geology 18, 411-414.
Blevin, P.L., Chappell, B.W., 1992. The role of magma sources, oxidation states and
fractionation in determining the granite metallogeny of eastern Australia. Royal
Society of Edinburgh Transactions, Earth Sciences 83, 305-316.
Blevin, P.L., Chappell, B.W., 1995. Chemistry, origin, and evolution of mineralized
granites in the Lachlan Fold Belt, Australia: the metallogeny of I- and S-type
granites. Economic Geology 90, 1604-1619.
Briqueu, L., Bougault, H., Joron, J.L., 1984. Quantification of Nb, Ta, Ti, and V
anomalies in magmas associated with subduction zones: petrogenetic implications.
Earth and Planetary Science Letters 68, 297-308.
Candela, P.A., Bouton, S.L., 1990. The influence of oxygen fugacity on tungsten and
molybdenum partitioning between silicate melts and ilmenite. Economic Geology
85, 633-640.

100
Cashman, K., Blundy, J., 2000. Degassing and crystallization of ascending andesite and
dacite. Philosophical Transactions: Mathematical, Physical and Engineering
Sciences 358, 1487-1513.
Chappell, B.W., 2004a. High- and low-temperature granites. In: Blevin, P., Champion, D.
(Eds), The Ishihara Symposium: Granites and Associated Metallogenesis.
Commonwealth of Australia, 35-36.
Chappell, B.W., 2004b. Towards a unified model of granite petrogenesis. In: Blevin,
P.L., Jones, M., Chappell, B.W. (Eds.), Magmas to Mineralisation: the Ishihara
Symposium on granites and related metallogenesis, 37.
Chappell, B.W., Bryant, C.J., Wyborn, D., White, A.J.R., Williams, I.S., 1998. High- and
low-temperature I-type granites. Resource Geology 48, 225-235.
Chappell, B.W., White, A.J.R., 1974. Two contrasting granite types. Pacific Geology 8,
173-174.
Chappell, B.W., White, A.J.R., 1974. Two contrasting granite types. Pacific Geology 8,
173-174.
Chappell, B.W., White, A.J.R., 1982. I- and S- type granites in the Lachlan fold belt,
southeastern Australia. In: Xu, K.Q., Tu, G.C. (Eds.), Geology of Granites and Their
Metallogenetic Relations. Proceeding of the International Symposium, 87-101.
Chappell, B.W., White, A.J.R., 1992. I- and S-type granites in the Lachlan Fold Belt.
Transactions of the Royal Society of Edinburgh: Earth Sciences 83, 1-26.
Chappell, B.W., White, A.J.R., 200. Two contrasting granite types: 25 years latter.
Australian Journal of Earth Sciences 48, 489-499.

101
Chowdhury, S., Lentz, D.R., 2011. Mineralogical and geochemical characteristics of
sheelite-bearing skarns, and genetic relations between skarn mineralization and
petrogenesis of the associated granitoid pluton at Sargipali, Sundergarh District,
Eastern India. Journal of Geochemical Exploration 108, 39-61.
Christiansen, E.H., Keith, J.D., 1996. Trace-element systematics in silicic magmas: a
metallogenic perspective. In: Wyman, D. A. (Eds.), Trace Element Geochemistry of
Volcanic Rocks: Applications for Massive Sulphide Exploration. Geological
Association of Canada, Short Course Notes 12, 115-151.
Clayton, R.N., Mayeda, T.K., 1963. The use of bromine pentafluoride in the extraction of
oxygen from oxides and silicates for isotopic analysis. Geochimica et
Cosmochimica Acta 27, 43-52.
Coleman, M.L., 1977. Sulphur isotopes in petrology. Journal of the Geological Society,
London 133, 593-608.
Cox, K.G., Bell, J.D., Pankhurst, R.J., 1979. The interpretation of igneous rocks: London,
UK, George Allen and Unwin, 450 p.
Drummond, M.S., Defant, M.J., 1990. A model for trondhjemite – tonalite – dacite
genesis and crustal growth via slab melting: Archean to modern comparisons.
Journal of Geophysical Research 95, 21502 – 21521.
Eby, G.N., 1992. Chemical subdivision of the A-type granitoids: petrogenetic and
tectonic implications. Geology 20, 640-644.
Förster, H.J., Tischendorf, G., Trumbull, R.B., 1997. An evaluation of the Rb vs. (Y+Nb)
discrimination diagram to infer tectonic setting of silicic igneous rocks. Lithos 40,
261-293.

102
Frost, B.R., Barnes, C.G., Collins, W.J., Arculus, R.J., Ellis, D.J., Frost, C.D., 2001. A
geochemical classification for granitic rocks. Journal of Petrology 42, 2033-2048.
Frost, B.R., Frost, C.D., 2008. A geochemical classification for feldspathic igneous rocks.
Journal of Petrology 49, 1955-1969.
Fyffe, L.R., Pajari, G.E., Cherry, M.E., 1981. The Acadian plutonic rocks of New
Brunswick. Maritime Sediments and Atlantic Geology 17, 23-26.
Fyffe, L.R., Thorne, K.G., Dunning, G.R., Martin, D.A., 2008. U-Pb geochronology of
the Sisson Brook granite porphyry, York County, West-central New Brunswick. In:
Martin, G.L. (Eds), Geological Investigations in New Brunswick for 2007. New
Brunswick Department of Natural Resources. Minerals, Policy and Planning
Division, Mineral Resource Report 2008-1, 35-54.
Govett, G.J.S., Atherden, P.R., 1988. Applications of rock geochemistry to productive
plutons and volcanic sequences. Journal of Geochemical Exploration 30, 223-242.
Green, T.H., Pearson, N.J., 1987. An experimental study of Nb and Ta partitioning
between Ti-rich minerals and silicate liquids at high pressure and temperature.
Geochimica et Cosmochimica Acta 51, 55-62.
Guilbeau, K.P., Kudo, A.M., 1985. Petrology and geochemistry of the Paliza Canyon
formation and the Bearhead rhyolite, Keres group, Jemez mountains, New Mexico.
Geological Society of America Bulletin 96, 108-113.
Harrison, T.M., Watson, E.B., 1984. The behaviour of apatite during crustal anatexis:
equilibrium and kinetic considerations. Geochimica et Cosmochimica Acta 48,
1467-1477.

103
Irvine, T.N., Baragar, W.R.A., 1971. A guide to the chemical classification of the
common volcanic rocks. Canadian Journal of Earth Sciences 8, 523-548.
Ishihara, S., 1981. The granitoid series and mineralization. In: Skinner, B.J. (Eds),
Economic Geology, Seventy-fifth anniversary volume, 458-484.
Ishihara, S., 1998. Granitoid series and mineralization in the Circum-Pacific Phanerozoic
granitic belts. Resource Geology 48, 219-224.
Keen, C.E., Keen, M.J., Nichols, B., Reid, I., Stockmal, G.S., Colman-Sadd, S.P.,
O’Brien, S.J., Miller, H., Quinlan, G., Williams, H., Wright, J., 1986. A deep
seismic refection profile across the northern Appalachians. Geology 14, 141-145.
Kelly, K.A., Cottrell, E., 2009. Water and the oxidation state of subduction zone magmas.
Science 325, 605-607.
Kooiman, G.J.A., McLeod, M.J., Sinclair, W.D., 1986. Porphyry tungsten – molybdenum
orebodies, polymetallic veins and replacement bodies and tin – bearing greisens
zones in the Fire Tower Zone, Mount Pleasant, New Brunswick. Economic Geology
82, 1356-1373.
Lentz, D.R., 1992. Petrogenesis and geochemical composition of biotites in rare-element
granitic pegmatites in the southwestern Grenville Province, Canada. Mineralogy and
Petrology 46, 239-256.
Lentz, D.R., 1994. Exchange reactions in hydrothermally altered rocks: examples from
biotite-bearing assemblages. In: Lentz, D.R. (Eds.), Alteration and alteration
processes associated with ore-forming systems. Geological Association of Canada
Short Course Notes 11, 69-99.

104
Lentz, D.R., 1995. Preliminary evaluation of six in-house rock geochemical standards
from the Bathurst Camp, New Brunswick. In: Merlini, S.A.A. (Eds.), Current
Research 1994, Minerals and Energy Division, Miscellaneous Report 18, New
Brunswick Department of Natural Resources and Energy, 81-89.
Lentz, D.R., 1996. Trace-element systematics of felsic volcanic rocks associated with
massive-sulphide deposits in the Bathurst mining camp: Petrogenetic, tectonic and
chemostratigraphic implication for VMS exploration. In: Wyman, D.A. (Eds.),
Trace Element Geochemistry of Volcanic Rocks: Applications for Massive Sulphide
Exploration. Geological Association of Canada, Short Course Notes 12, 359-402.
Lentz, D.R., 1998. Petrogenetic evolution of felsic volcanic sequences associated with
Phanerozoic volcanic - hosted massive sulphide systems: the role of extensional
geodynamics. Ore Geology Reviews 12, 289-327.
Lentz, D.R., Fowler, A.D., 1992. A dynamic model for graphic quartz-feldspar
intergrowths in granitic pegmatites in the southwestern Grenville province.
Canadian Mineralogist 30, 571-585.
Lentz, D.R., Gregoire, C., 1995. Petrology and mass – balance constraints on major-,
trace-, and rare – earth – element mobility in porphyry – greisens alteration
associated with the epizonal True Hill granite, southwestern New Brunswick,
Canada. Journal of Geochemical Exploration 52, 303-331.
Leonard, P.R.R., Lentz, D.R., Poujol, M., 2006. Petrology, geochemistry, and U-Pb
(Zircon) age of the quartz-feldspar porphyry dyke at the Lake George antimony
mine, New Brunswick: implications for origin emplacement process, and
mineralization. Atlantic Geology 42, 13-29.

105
Longerich H.P., 1995. Analysis of Pressed Pellets of Geological Samples Using
Wavelength-Dispersive X-Ray Fluorescence Spectrometry. X-Ray Spectrometry 24,
123-136.
Lutes, G., 1981. Geology of Deersdale–Head of Nashwaak River map area J-17 and
Upper parts of Nashwaak River–McBean and Sister Brooks, map area J-18. New
Brunswick Department of Natural Resources; Mineral Resources, Map Report 81- 4,
26.
MacLellan, H.E., Taylor, R.P., 1989. Geology and geochemistry of the Burnthill Granite
and related W-Sn-Mo-F mineral deposits, central New Brusnwick. Canadian Journal
of Earth Sciences 26, 499-514.
Mahood, G.A., Hildreth, W., 1983. Large partition coefficient for trace elements in high
silica rhyolites. Geochimica et Cosmochimica Acta 47, 11-30.
Maniar, P.D., Piccoli, P.M., 1989. Tectonic discrimination of granitoids. Geological
Society of America Bulletin 101, 635-643.
Mann, R., 1980. Report on diamond drilling at Sisson Brook. Unpublished company
report, Kidd Creek Mines Ltd., Fredericton, New Brunswick, 36 p.
Marillier, F., Keen, C.E., Stockmal, G.S., Quinlan, G., Williams, H., Colman-Sadd, S.P.,
O’Brien, S.J., 1989. Crustal structure and surface zonation of the Canadian
Appalachians: implications of deep seismic reflection data. Canadian Journal of
Earth Sciences 26, 305-321.
Markey, R., Stein, H.J., Hannah, J.L., Selby, D., Creaser, R.A., 2007. Standardizing Re-
Os geochronology: A new molybdenite Reference Material (Henderson, USA) and
the stoichiometry of Os salts. Chemical Geology 244, 74-87.

106
Martin, D.A., 2006. Report of geological compilation, line cutting, soil sampling,
geological mapping and prospecting, magnetic and induced polarization surveys,
and drilling, 2005, Sisson Brook Claim Group, York County, New Brunswick.
Geodex Minerals for Champlain Resources Inc. License No. 15088. New Brunswick
Department of Natural Resources; Minerals, Policy and Planning Division,
Assessment Report 476311, 7.
McLeod, M.J., 1990. Geology, geochemistry and related mineral deposits of the Saint
George Batholith; Queens and Kings counties, New Brunswick. New Brunswick
Department of Natural Resources and Energy; Mineral Resources, Mineral Resource
Report 5, 169 p.
McLeod, M.J., Hoy, D., Thorne, K.G., 2008. History, tectonic setting, and models for
intrusion-related gold deposits in Southwestern New Brunswick, Canada: Examples
from the Clarence Stream Area. Exploration and Mining Geology 17, 1-12.
McLeod, M.S., Johnson, S.C., Krough, T.E., 2004. Archived U-Pb (zircon) dates from
south New Brunswick. Atlantic Geology 39, 209-225.
Miller, C.F., McDowell, S.M., Mapes, R.W., 2003. Hot and cold granites? Implications
of zircon saturation temperatures and preservation of inheritance. Geology 31, 529-
532.
Murphy, J.B., 2006. Igneous Rock Associations 7. Arc magmatism I: Relationship
between subduction and magma genesis. Geoscience Canada 33, 145-167.
Murphy, J.B., 2007. Igneous Rock Associations 8. Arc Magmatism II: geochemical and
isotopic characteristics. Geoscience Canada 34, 7-35.

107
Nast, H.J., 1985. The geology and petrochemistry of the Sisson Brook W-Cu–Mo
deposit, New Brunswick. Unpublished M. Sc. thesis, McGill University, Montreal,
Quebec, 192 p.
Nast, H.J., Williams-Jones, A.E., 1991. The role of water–rock interaction and fluid
evolution in forming the porphyry–related Sisson Brook W–Cu–Mo deposit, New
Brunswick. Economic Geology 86, 302-317.
Newberry, R.J., Swanson, S.E., 1986. Scheelite skarn granitoids and evaluation of the
roles of magmatic source and process. Ore Geology Reviews 1, 57-81.
Parsons, I., 1977. Feldspars and fluids in cooling plutons. Mineralogical Magazine 42, 1-
17.
Pearce, J.A., Harris, N.B.W., Tindle, A.G., 1984. Trace element discrimination diagrams
for the tectonic interpretation of granitic rocks. Journal of Petrology 25, 956-983.
Pearce, J.A., Peate D.W., 1995. Tectonic implications of the composition of volcanic arc
magmas. Earth and Planetary Science Letters 23, 251-285.
Peccerillo, A., Taylor, S.R., 1976. Geochemistry of Eoscene calcakaline volcanic rocks
from the Kastamanu Area, Northern Turkey. Contributions to Mineralogy and
Petrology 58, 63-81.
Quinlan, G.M., Hall, J., Williams, H., Wright, J.A., Colman-Sadd, S.P., O’Brien, S.J.,
Stockmal, G.S., Marillier, F., 1992. Lithoprobe onshore seismic reflection transects
across the Newfoundland Appalachians. Canadian Journal of Earth Sciences 29,
1865-1877.
Rennie, D.W., 2012. Technical report on the Sisson project, New Brunswick, Canada. NI
43-101 report, Prepared for Northcliff Resources Ltd. 161 p.

108
Richard, P., Shimizu, N., Allègre, C.J., 1976. 143Nd/146Nd, a natural tracer: an application
to oceanic basalts. Earth Planet and Science Letters 31, 269-278.
Ryerson, F.J., Watson, E.B., 1987. Rutile saturation in magmas: implications for Ti-Nb-
Ta depletion in island arc basalts. Earth and Planetary Science Letters 86, 225-239.
Selby, D., Creaser, R.A., 2004. Macroscale NTIMS and microscale LA-MC-ICP-MS Re-
Os isotopic analysis of molybdenite: Testing spatial restrictions for reliable Re-Os
age determinations, and implications for the decoupling of Re and Os within
molybdenite. Geochimica et Cosmochimica Acta 68, 3897-3908.
Shabani, A.A.T., Lalonde, A.E., 2003. Composition of biotite from granitic rocks of the
Canadian Appalachian orogen: a potential tectonomagmatic indicator? The
Canadian Mineralogist 41, 1381-1396.
Sillitoe, R.H., 1996. Granites and metal deposits. Episodes, 19, 126-133.
Sivell, W.J., Waterhouse J.B., 1988. Petrogenesis of Gympie Group volcanics: evidence
for remnants of an early Permian volcanic arc in eastern Australia. Lithos 21, 81-95.
Smith, E.A., Fyffe, L.R., 2006a. Bedrock geology of the Coldstream area (NTS 21 J/06).
York and Carleton counties. New Brunswick. New Brunswick Department of
Natural Resources. Minerals, Policy and Planning Division. Plate 2006-7.
Smith, E.A., Fyffe, L.R., 2006b. Bedrock geology of the Napadogan area (NTS 21 J/07).
York and Carleton counties. New Brunswick. New Brunswick Department of
Natural Resources. Minerals, Policy and Planning Division. Plate 2006-8.
Srivastawa, P.K., Sinha, A.K., 1997. Geochemical characterization of tungsten-bearing
granites from Rajasthan, India. Journal of Geochemical Exploration 60, 173-184.

109
Steele, T.W., Wilson, A., Goudvis, R., Ellis, P.J., Radford, A.J., 1978. Trace element data
(1966-1977) for six “NIMROC” reference samples. Geostandards Newsletter 2, 71-
106.
Kӧnig, S., Münker, C., Schuth, S., Garbe-Schӧnberg, D., 2008. Mobility of tungsten in
subduction zones. Earth and Planetary Science Letters 274, 82-92.
Stimac, J., Hickmott, D., 1994. Trace-element partition coefficients for ilmenite,
orthopyroxene and pyrrhotite in rhyolite determined by micro-PIXE analysis.
Chemical Geology 117, 313-330.
Streckeisen, A.L., 1976. Classification of the common igneous rocks by means of their
chemical composition: a provisional attempt. Neues Jahrbuch für Mineralogie,
Monatshefte, H.1, 1-15.
Sun, S.S., McDonough, W.F., 1989. Chemical and isotopic systematics of oceanic
basalts: implications for mantle compositions and processes. In: Saunders, A.D.,
Norry, M.J. (Eds.), Magmatism in the Ocean Basins. Geological Society of London,
Special Publication 42, 313-345.
Tacker, R.C., Candela, P.A., 1987. Partitioning of molybdenum between magnetite and
melt: A preliminary experimental study of the partitioning of ore metals between
silicic magmas and crystalline phases. Economic Geology 82, 1827-1838.
Taylor, H.P.Jr., 1968. The oxygen isotope geochemistry of igneous rocks. Contributions
to Mineralogy and Petrology 19, 1-71.
Taylor, H.P.Jr., 1978. Oxygen- and hydrogen- isotope studies of plutonic rocks. Earth
and Planetary Science Letters 38, 177-210.

110
Taylor, R.P., Lux, D.R., MacLellan, H.E., Hubacher, F., 1987. Age and genesis of
granite–related W–Sn–Mo mineral deposits, Burnthill, New Brunswick, Canada.
Economic Geology 82, 2187-2198.
Thompson, R.N., Morrison, M.A., Hendry, G.L., Parry, S.J., 1984. An assessment of the
relative roles of crustal and mantle in magma genesis, an elemental approach. The
Royal Society of London Philosophical Transactions, Series A 310, 549-590.
Thorne, K.G., Fyffe, L.R., Creaser, R.A., 2013. Re-Os geochronological constraints on
the W-Mo mineralizing event in the Mount Pleasant Caldera Complex: implications
for the timing of subvolcanic magmatism and caldera development. Atlantic
Geology 49, 131-150.
Tucker, R.D., Bradley, D.C., Ver Straeten C.A., Harris A.G., Ebert, J.R., McCutcheon,
S.R., 1998. New U-Pb zircon ages and the duration and division of Devonian time.
Earth and Planetary Science Letters 158, 175-186.
Tuttle, O.F., Bowen, N.L., 1958. Origin of granite in the light of experimental studies in
the system NaAlSi3O8-KAlSi3O8-SiO2-H2O. The Geological Society of America
Memoir 74, 153
van Staal, C.R., Sullivan, R.W., Whalen, J.B., 1996. Provenance and tectonic history of
the Gander margin in the Caledonian/Appalachian orogen: implications for the
origin and assembly of Avalonia. In Avalonian and related peri-Gondwanan terranes
of the Circum-North Atlantic. Edited by Nance, R.D. and Thompson, M.D.,
Geological Society of America, Special paper 304, 347-367.

111
Watson, E.B., Harrison, T.M., 1983. Zircon saturation revisited: temperature and
composition effects in a variety of crustal magma types. Earth and Planetary Science
Letters 64, 295-304.
Wedepohl, K.H., 1995. The composition of the continental crust. Geochimica et
Cosmochimica Acta 59, 1217-1232.
Whalen, J.B., 1993. Geology, petrography and geochemistry of Appalachian granites in
New Brunswick and Gaspésie, Quebec. Geological Survey of Canada, Bulletin 436,
130 p.
Whalen, J.B., Currie, K.L., Chappell, B.W., 1987. A-type granites: geochemical
characteristics, discrimination and petrogenesis. Contributions to Mineralogy and
Petrology 95, 407-419.
Whalen, J.B., Jenner, G.A., Longstaffe, F.J., Hegner, E., 1996. Nature and evolution of
the eastern margin of Iapetus: geochemical and isotopic constraints from Siluro-
Devonian granitoid plutons in the New Brunswick Appalachians. Canadian Journal
of Earth Sciences 33, 140-155.
Whalen, J.B., Theriault, R., 1990. K-Ar and Rb–Sr geochronology of granites, Miramichi
terrane, New Brunswick. In: Radiogenic Age and Isotopic Studies: Report 3.
Geological Survey of Canada, Paper 89-2, 101-107.
Yang, X.M, Lentz, D.R., Chi, G.X., 2002. Petrochemistry of Lake George granodiorite
stock and related gold mineralization, York County, New Brunswick. Geological
Survey of Canada, Current Research report 2002-D7, 10 p.
Yang, X.M., Lentz, D.R., 2005. Chemical composition of rock–forming minerals in
gold–related granitoid intrusions, southwestern New Brunswick, Canada:

112
implications for crystallization conditions, volatile exsolution, and fluorine–chlorine
activity. Contributions to Mineralogy and Petrology 150, 287-305.
Yang, X.M., Lentz, D.R., 2010. Sulfur isotopic systematics of granitoids from
southwestern New Brunswick, Canada: implications for magmatic-hydrothermal
processes, redox conditions and gold mineralization. Mineralium Deposita 45, 795-
816.
Yang, X.M., Lentz, D.R., Chi, G.X., Thorne, K.G., 2008. Geochemical characteristics of
gold-related granitoids in southwestern New Brunswick, Canada. Lithos 104, 355-
377.
Yang, X.M., Lentz, D.R., McCutcheon, S.R., 2003. Petrochemical evolution of
subvolcanic granitoid intrusions within the Late Devonian Mount Pleasant Caldera,
southwestern New Brunswick, Canada: comparison of Au versus Sn-W-Mo-
polymetallic mineralization system. Atlantic Geology 39, 97-121.

113
Fig. 3.1 Regional geological map of showing the distribution of the Nashwaak Granites (1:50 000) (modified after Smith and Fyffe, 2006a, b). Cambrian to Early Ordovician: ЄOTLgn - Trousers Lake Metamorphic Suite, ЄOKBmc, - Miramichi Group; Ordovician: OLCfi - Little Clearwater Brook Granite, OMKfi - McKiel Lake Granite, OPBD,OHLfc,OHLmv,OTUls,OTM,OHL - Tetagouche Group; Silurian: SCRfc, SBUmc, STRmc, SSMfc, SBOGii; Devonian: DCGfv – Costigan Mountain Formation, DHfia - Hawkshaw Granite, DAfi – Allandale Granite, DBLmi - Becaguimec Lake Gabbro, DHPii - Howard Peak Granodiorite, DNWfia - Nashwaak biotite Granite, DNWfib - Nashwaak two-mica Granite, Carboniferous: CCLcc, CHRmv, CSNcc - Mabou Group, CMOmc - Pictou Group; ------- Fault. Star is the Sisson Brook deposit position.

114
Fig. 3.2 Geological map of Sisson Brook W-Mo-Cu deposit (modified after Fyffe et al., 2008). DNW Devonian Nashwaak Granite, DHP Devonian Howard Peak Diorite, DG Devonian gabbro, OPB Ordovician Push and Be Damned Formation, OHL Ordovician Hayden Lake Formation, OTM Ordovician Turnbull Mountain Formation, ЄM Cambro-Ordovician Miramichi Group, Dash line fault, F - City of Fredericton.
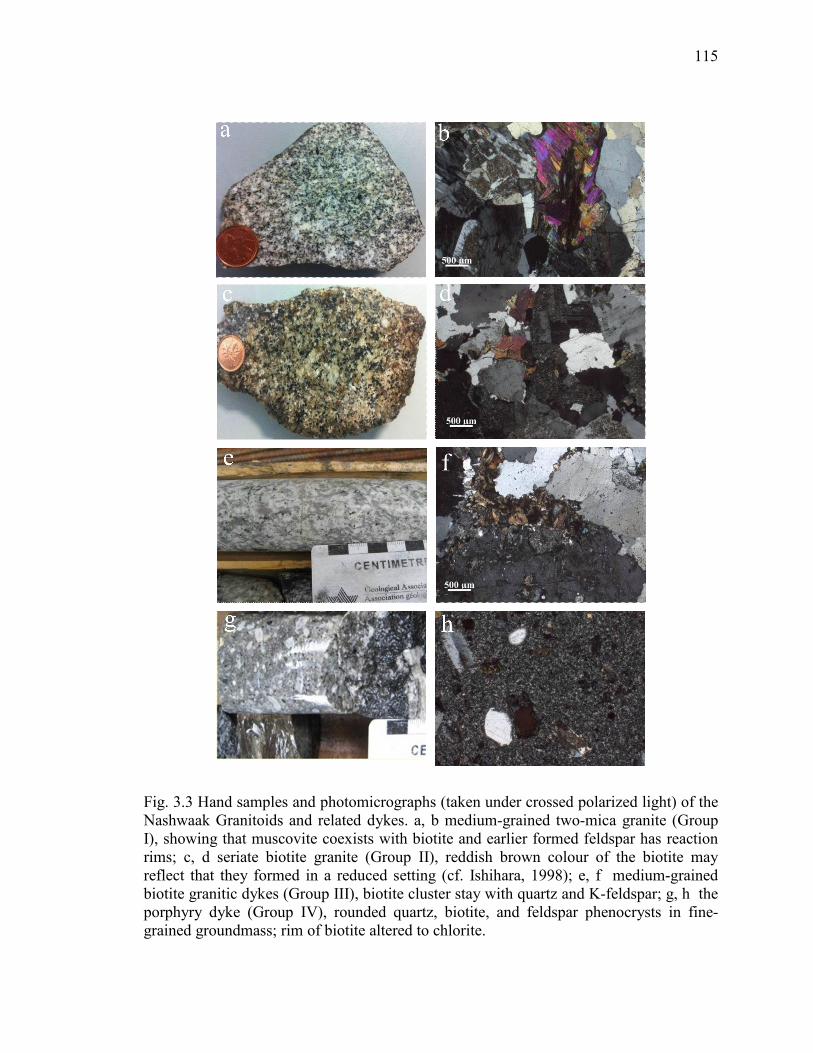
115
Fig. 3.3 Hand samples and photomicrographs (taken under crossed polarized light) of the Nashwaak Granitoids and related dykes. a, b medium-grained two-mica granite (Group I), showing that muscovite coexists with biotite and earlier formed feldspar has reaction rims; c, d seriate biotite granite (Group II), reddish brown colour of the biotite may reflect that they formed in a reduced setting (cf. Ishihara, 1998); e, f medium-grained biotite granitic dykes (Group III), biotite cluster stay with quartz and K-feldspar; g, h the porphyry dyke (Group IV), rounded quartz, biotite, and feldspar phenocrysts in fine-grained groundmass; rim of biotite altered to chlorite.

116
Fig. 3.4 Quartz (Q)-alkaline feldspar (A)-plagioclase (P) ternary diagram (a, Streckeisen, 1976), and Shand index plot (b) for the Nashwaak Granites and related dykes (the fields from Streckeisen, 1976; Maniar and Piccoli, 1989). 1-alkali-feldspar syenite; 2-syenite; 3-monzonite; 4-monzodiorite; 5-diorite; 6-quartz alkali feldspar syenite; 7-quartz syenite; 8-quartz monzonite; 9-quartz monzodiorite; 10-quartz diorite; 11-alkali-feldspar granite; 12-syenogranite; 13-monzogranite; 14-granodiorite; 15-tonalite; 16-quartz-rich granite; 17-quartzite.
■ Group I, ♦ Group II, ▲ Group III, ● Group IV.

117
Fig. 3.5 Harker diagrams (oxides in wt.%) for the Nashwaak Granites and related dykes. See Fig. 3.4 for symbols

118
Fig. 3.6 Chondrite-normalized REE patterns and primitive primitive mantle-normalized spider diagrams for the Nashwaak Granites and related dykes. Normalized values from Sun and McDonough (1989). Symbols as Fig. 3.4.

119
Fig. 3.7 Plots of Rb (ppm) vs. Sr (ppm) (a), Ba (ppm) vs. Sr (ppm) (b), Rb/Sr vs. Sr (ppm) (c), and La (ppm) vs. La/Yb (d) illustrating selected trace-element geochemical characteristics of the Nashwaak Granites and related dykes resulting from crystallization (arrows indicate inferred fractionation vector). Mon-monzonite, Ap-apatite, Zr-zircon, Kfs-K-feldspar, Pl-plagioclase, Bi-biotite, Cpx-clinopyroxene, Opx-orthopyroxene.

120
Fig. 3.8 Cathodoluminescence images of the zircon grains from sample BGD-13, displaying igneous growth zones and some older cores.
0.062
0.063
0.064
0.065
0.066
0.067
0.068
0.46 0.48 0.50 0.52 0.54
207Pb/
235U
206P
b/2
38U
390
400
410
420
Concordia Age = 405.6 ± 2.5 Ma
(2, decay-const. errs included)MSWD (of concordance) = 0.0098,Probability (of concordance) = 0.92
data-point error ellipses are 2
Fig. 3.9 U-Pb Concordia diagram for zircon from a biotite dyke sample BGD-13 collected from drill core of the Sisson Brook deposit, west-central New Brunswick, Canada (see Table 3.5 for data).

121
Fig. 3.10 Tectonomagmatic discrimination diagrams for granitoid samples from the Nashwaak Granites and related dykes. Plots of Y vs. Nb (a) and (Y + Nb) vs. Rb (b). Field boundaries from Pearce et al. (1984) and modified by Christiansen and Keith (1996). (c) Triangle plot of Y–Nb–Ce (A1 Group granites are characterized by element ratios similar to the mantle, whereas A2 Group granites originated from continental crust or arcs); boundary line between groups from Eby (1992). (d) (La/Yb)N versus YbN
discriminate the typical arc magma from adakite (Drummond and Defant, 1990).

122
Table 3.1 Major- and trace-element data of Nashwaak Granitoids and related dykes
Group I
Sample MBG-1 MBG-2 MBG-3 MBG-4 MBG-5 MBG-6 MBG-7 MBG-8 MBG-9 MBG-10 MBG-11 MBG-12
wt.%
SiO2 72.2 75.7 72.3 73.3 74.2 73.9 73.4 72.6 71.3 74.2 71.7 71.9
TiO2 0.25 0.12 0.29 0.22 0.24 0.16 0.20 0.20 0.21 0.13 0.13 0.31
Al2O3 15.1 15.3 15.6 16.0 14.9 15.5 16.4 16.5 16.1 18.5 17.2 15.7
FeOt 2.36 1.26 2.59 1.98 2.01 1.59 1.87 1.73 1.91 1.02 1.45 2.51
MnO 0.07 0.04 0.06 0.04 0.04 0.04 0.04 0.04 0.08 0.04 0.04 0.06
MgO 0.73 0.26 0.79 0.48 0.49 0.35 0.30 0.42 0.80 0.81 0.57 0.84
CaO 2.54 0.30 1.40 0.64 0.85 0.56 0.41 0.58 2.92 0.16 0.66 1.37
Na2O 2.89 2.76 3.41 3.12 3.34 3.43 3.21 3.05 2.13 <0.01 3.29 3.41
K2O 3.81 4.14 3.53 4.11 3.79 4.37 4.11 4.80 4.39 4.97 4.81 3.81
P2O5 0.10 0.11 0.10 0.14 0.13 0.15 0.11 0.17 0.11 0.12 0.20 0.11
ppm
S 391 147 143 143 130 137 131 140 121 114 136 142
Cl 82.0 63.0 70.0 <20.0 45.0 36.0 <20.0 25.0 83.0 50.0 46.0 69.0
Rb 230 224 173 222 249 291 257 260 243 399 250 177
Sr 90.0 36.0 122 57.0 66.0 35.0 74.0 63.0 99.0 13.0 49.0 108
Ba 320 210 540 360 410 350 290 230 300 220 250 470
Cs 7.00 11.0 7.00 5.00 11.0 12.0 8.00 7.00 9.00 14.0 10.0 6.00
Ga 15.0 16.0 21.0 19.0 17.0 22.0 19.0 18.0 13.0 20.0 17.0 21.0
Ta 3.50 2.10 1.50 1.50 3.20 < 0.50 2.00 < 0.50 1.90 1.70 2.50 2.70
Nb 16.5 13.5 16.5 19.1 22.2 18.2 21.7 18 14.4 13.8 15.1 15.4
Hf 4.00 2.00 4.00 3.00 3.00 2.00 3.00 2.00 3.00 2.00 2.00 4.00
Zr 129 54.0 175 107 106 90.0 109 92.0 108 75.0 59.0 170
Y 22.0 19.0 19.0 15.0 17.0 6 20.0 14.0 15.0 17.0 14.0 14.0
Th 16.9 6.5 17.2 13.2 14.7 9.9 17.7 10.9 12.6 12.0 4.80 15.4
U 3.70 3.70 < 0.50 6.10 5.90 4.80 5.50 6.00 3.00 4.10 3.90 4.10
La 33.5 13.4 37.0 26.7 27.7 19.6 29.4 22.6 24.4 21.6 12.1 36.5
Ce 54.0 16.0 57.0 41.0 45.0 34.0 46.0 37.0 42.0 30.0 20.0 51.0
Nd 15.0 15.0 22.0 13.0 18.0 14.0 20.0 15.0 17.0 14.0 10.0 27.0
Sm 6.00 2.90 6.30 5.30 5.70 3.90 4.90 4.20 4.30 3.10 2.60 5.70
Eu 0.70 0.30 0.80 0.60 0.50 0.40 0.40 0.50 0.50 0.30 0.40 0.90
Tb < 0.50 0.90 < 0.50 < 0.50 < 0.50 1.00 < 0.50 < 0.50 < 0.50 < 0.50 0.60 < 0.50
Yb 2.40 1.70 2.30 1.70 1.90 1.30 2.30 1.60 1.80 1.70 0.90 2.30
Lu 0.46 0.26 0.44 0.30 0.27 0.25 0.36 0.27 0.33 0.29 0.17 0.37
Cr 15.0 9.00 20.0 20.0 13.0 8.00 11.0 15.0 14.0 8.00 13.0 15.0
Ni 7.00 5.00 7.00 7.00 6.00 3.00 7.00 6.00 6.00 3.00 6.00 6.00
Co 4.00 <1.00 5.00 4.00 4.00 3.00 3.00 3.00 2.00 3.00 2.00 4.00
Sc 5.60 3.50 6.10 5.40 6.10 4.30 5.60 4.90 4.30 3.80 3.80 5.80
V 20.0 6.00 28.0 18.0 20.0 13.0 16.0 16.0 16.0 10.0 9.00 27.0
Cu 6.00 2.00 6.00 5.00 9.00 4.00 4.00 4.00 3.00 5.00 2.00 6.00
Pb 23.0 35.0 24.0 29.0 22.0 21.0 28.0 29.0 21.0 29.0 36.0 23.0
Zn 39.0 29.0 52.0 53.0 61.0 40.0 44.0 44.0 35.0 29.0 43.0 51.0
Sn < 0.01 <0.01 < 0.01 < 0.01 < 0.01 < 0.01 < 0.01 < 0.01 < 0.01 < 0.01 < 0.01 < 0.01
W <1.00 5.00 <1.00 <1.00 <1.00 <1.00 <1.00 4.00 <1.00 <1.00 <1.00 <1.00
Mo 5.00 <1.00 <1.00 <1.00 <1.00 <1.00 <1.00 1.00 <1.00 <1.00 <1.00 3.00
Ag <3.00 <3.01 <3.02 <3.03 <3.04 <3.05 <3.06 <3.07 <3.08 <3.09 <3.10 <3.11
As 8.20 8.20 7.10 5.00 5.50 4.90 6.10 4.30 2.80 7.60 6.20 7.10
Se <3.00 <3.00 <3.00 <3.00 <3.00 <3.00 <3.00 <3.00 <3.00 <3.00 <3.00 <3.00
Sb 0.20 0.30 0.60 0.40 <1.00 0.40 <1.00 <1.00 0.70 1.50 0.40 0.40
Au (ppb) <2.00 <2.00 <2.00 <2.00 <2.00 <2.00 <2.00 <2.00 <2.00 4.00 <2.00 4.00
TZr1 773 773 814 782 775 761 787 767 763 791 730 809
Tap1 930 968 926 969 968 982 946 985 925 964 995 930

123
Group I Group II Group III
Sample MBG-13 BG-1 BG-2 BG-3 BG-4 BG-5 BG-6 BG-7 BG-8 BG-9 BGD-1 BGD-2
wt.%
SiO2 72.9 72.8 73.6 72.0 73.2 74.0 73.0 72.1 71.9 66.4 78.6 80.1
TiO2 0.19 0.31 0.36 0.26 0.3 0.21 0.27 0.33 0.36 0.66 0.06 0.06
Al2O3 15.6 14.5 13.4 15.1 14.2 13.7 15.1 14.9 15.6 16.6 11.8 11.7
FeOt 1.76 2.20 2.70 2.04 2.27 2.06 2.35 2.74 2.66 4.46 1.16 1.07
MnO 0.05 0.02 0.09 0.02 0.03 0.02 0.04 0.04 0.05 0.08 0.03 0.02
MgO 0.54 0.55 0.9 0.88 0.91 0.71 0.50 0.70 0.82 1.68 0.60 0.26
CaO 0.92 1.18 1.40 1.89 1.59 1.02 0.85 1.45 1.04 2.65 1.22 1.82
Na2O 3.03 2.30 3.28 2.83 2.57 2.53 3.16 3.11 3.38 3.09 3.19 4.19
K2O 4.84 6.00 4.24 4.94 4.91 5.71 4.66 4.59 4.16 4.08 3.31 0.80
P2O5 0.13 0.10 0.07 0.11 0.10 0.05 0.06 0.08 0.10 0.25 0.02 0.02
ppm
S 186 195 726 184 187 249 226 205 126 148 785 1161
Cl 64.0 79.0 110 83.0 92.0 122 62.0 62.0 73.0 55.0 120 131
Rb 181 132 142 101 102 106 192 203 204 159 160 51.1
Sr 76.0 109 123 252 155 128 80.0 87.0 202 141 375 243
Ba 327 730 303 764 407 521 370 550 650 530 154 50.0
Cs 5.00 3.00 3.00 2.00 2.00 <1.00 5.00 6.00 6.00 7.00 8.00 4.00
Ga 15.0 15.0 14.0 15.0 15.0 13.0 16.0 18.0 17.0 19.0 12.0 11.0
Ta 1.50 <0.50 1.5 <0.50 <0.50 <0.50 2.50 <0.50 <0.50 2.70 <0.50 1.60
Nb 14.3 10.2 15.6 3.80 6.40 4.30 16.4 16.7 14.7 22.3 1.00 2.60
Hf 2.00 5.00 6.00 4.00 5.00 4.00 4.00 5.00 4.00 5.00 <1.00 3.00
Zr 83.0 143 166 128 142 151 157 171 168 228 103 88.4
Y 22.1 14.9 35.6 8.90 12.6 13.0 32.0 26.0 20.0 29.0 51.6 48.2
Th 8.00 20.2 20.7 8.90 15.9 31.8 20.8 16.7 17.1 15 15.7 14.1
U 2.10 3.70 3.10 2.70 3.50 2.80 5.60 4.90 5.50 5.00 4.80 4.00
La 17.3 50.6 39.2 17.8 36.8 53.4 39.1 32.1 36.4 27.8 24.2 27.6
Ce 33.0 106 82.0 58.0 82.0 116 68.0 56.0 51.0 43.0 56.0 64.0
Nd 14.0 45.0 24.0 15.0 38.0 47.0 30.0 22.0 21.0 15.0 22.0 22.0
Sm 2.60 7.00 4.80 2.60 5.00 7.30 8.40 6.90 6.40 6.70 5.00 4.90
Eu 0.70 1.50 0.70 1.00 0.80 1.00 0.60 0.80 0.90 1.10 0.60 1.00
Tb <0.50 <0.50 1.20 <0.50 <0.50 <0.50 1.40 1.90 <0.50 1.20 1.60 1.40
Yb 2.90 1.30 4.70 1.20 1.40 1.20 4.10 2.70 2.50 3.00 6.00 6.70
Lu 0.42 0.28 0.71 0.26 0.19 0.21 0.62 0.46 0.41 0.47 0.77 0.92
Cr <5.00 22.0 10.0 9.00 13.0 <5.00 9.00 16.0 21.0 21.0 <5.00 6.00
Ni 12.0 13.0 9.00 7.00 4.00 4.00 6.00 7.00 11.00 10.00 6.00 6.00
Co 3.00 2.00 3.00 5.00 4.00 3.00 4.00 5.00 6.00 8.00 3.00 2.00
Sc 4.50 5.00 5.90 3.60 4.20 2.90 7.20 8.40 7.80 14.3 1.60 1.80
V 9.00 15.0 26.0 21.0 21.0 11.0 28.0 34.0 35.0 50.0 11.0 <LD
Cu <LD <LD 8.00 5.00 6.00 <LD 4.00 4.00 4.00 16.0 61.0 58.0
Pb 37.0 34.0 14.0 23.0 27.0 31.0 34.0 27.0 23.0 27.0 16.0 11.0
Zn 60.0 < 50 110 < 50 < 50 < 50 45.0 46.0 46.0 81.0 < 50 < 50
Sn <0.02 <0.02 <0.02 <0.02 <0.02 <0.02 <0.01 <0.01 <0.01 <0.01 < 0.02 < 0.02
W 4.00 <1.00 4.00 <1.00 <1.00 <1.00 <1.00 <1.00 <1.00 <1.00 248 <1.00
Mo <1.00 <1.00 11 <1.00 <1.00 <1.00 2.00 3.00 3.00 <1.00 <1.00 <1.00
Ag <5.00 <5.00 <5.00 <5.00 <5.00 <5.00 <0.30 <0.30 <0.30 <0.30 <5.00 <5.00
As 1.90 1.20 < 0.5 2.20 < 0.5 2.70 6.00 13.3 5.40 4.20 2.30 2.20
Se <3.00 <3.01 <3.02 <3.03 <3.04 <3.05 <3.06 <3.07 <3.08 <3.09 <3.10 <3.11
Sb <0.10 <0.10 0.30 0.20 <0.10 0.30 <0.10 <0.10 0.2 <0.10 <0.10 <0.10
Au (ppb) <2.00 <2.00 <2.00 5.00 <2.00 <2.00 <2.00 <2.00 <2.00 <2.00 <2.00 <2.00
TZr 751 787 792 772 785 790 804 802 810 819 758 746
Tap 960 932 904 933 935 877 887 909 926 969 843 855

124
Group III
Sample BGD-3 BGD-4 BGD-5 BGD-6 BGD-7 BGD-8 BGD-9 BGD-10 BGD-11 BGD-12
wt.%
SiO2 77.9 78.2 79.0 78.2 79.8 81.5 76.2 77.0 69.3 78.7
TiO2 0.05 0.06 0.09 0.12 0.08 0.08 0.04 0.04 0.1 0.06
Al2O3 12.5 12.5 11.5 12.3 11.5 10.7 13.2 12.7 15.4 12.4
FeOt 1.18 1.54 1.07 1.27 1.10 1.40 1.23 1.83 2.32 1.07
MnO 0.02 0.02 0.02 0.03 0.02 0.02 0.04 0.05 0.04 0.03
MgO 0.33 0.53 0.23 0.30 0.21 0.35 0.19 0.18 0.42 0.40
CaO 1.51 2.71 0.94 0.84 1.58 1.66 1.11 1.15 5.82 1.59
Na2O 4.74 3.74 1.97 3.57 3.28 3.67 4.02 3.77 1.25 4.16
K2O 1.72 0.68 5.19 3.43 2.41 0.67 3.93 3.27 5.29 1.62
P2O5 0.02 0.02 0.02 0.01 0.02 0.02 0.06 0.05 0.02 0.02
ppm
S 285 298 516 944 560 861 1728 2271 4233 348
Cl 121 141 98.0 72.0 181 159 99.0 149 99.0 123
Rb 97.0 92.5 130.5 156.9 105.9 72.2 175 204.1 231.8 95.6
Sr 251 418 87.2 111.5 193.5 200.9 68.6 169.9 92.4 508.9
Ba 124 39.0 159 311 104 <20 160 234 445 114
Cs 3.00 5.00 3.00 3.00 4.00 5.00 2.00 4.00 7.00 3.00
Ga 12.0 18.0 12.0 18.0 14.0 18.0 18.0 14.0 14.0 15.0
Ta <0.50 0.90 <0.50 2.5 <0.50 <0.50 <0.50 <0.50 <0.50 <0.50
Nb 1.80 1.70 3.60 23.1 3.10 4.30 10.3 4.30 2.90 2.10
Hf 2.00 < 1.00 3.00 4.00 3.00 4.00 3.00 < 1.00 4.00 3.00
Zr 62.0 92.6 87.5 119.6 77.2 89.5 38.7 43.7 97.7 65.8
Y 37.0 38.8 53.5 37.3 44.7 37.9 19.1 30.8 37.8 36.0
Th 9.40 13.8 16.8 17.9 13.9 16.2 10.2 11.9 16.9 9.50
U 3.60 6.20 2.60 6.60 3.20 14.6 13.3 13.7 5.90 4.80
La 13.5 22.3 25.0 41.0 20.5 29.8 6.30 8.30 30.9 11.6
Ce 31.0 55.0 65.0 83.0 48.0 70.0 15.0 22.0 69.0 32.0
Nd 8.00 20.0 20.0 30.0 16.0 28.0 11.0 < 5.00 26.0 5.00
Sm 3.00 4.30 5.30 5.30 4.00 4.80 1.80 2.00 4.50 2.50
Eu <0.20 0.90 0.30 0.80 0.70 0.90 < 0.20 0.40 0.80 0.40
Tb < 0.50 1.40 1.40 1.80 1.30 < 0.50 < 0.50 < 0.50 1.20 1.00
Yb 4.40 4.40 6.20 5.40 5.60 4.80 3.60 4.70 4.00 5.10
Lu 0.64 0.65 0.93 0.78 0.72 0.68 0.61 0.64 0.65 0.75
Cr < 5.00 13.0 < 5.00 < 5.00 < 5.00 < 5.00 13.0 < 5.00 < 5.00 < 5.00
Ni 3.00 7.00 <LD 6.00 8.00 <LD <LD 7.00 5.00 7.00
Co 2.00 3.00 2.00 2.00 3.00 4.00 3.00 7.00 9.00 2.00
Sc 2.20 1.80 2.00 5.40 2.00 2.60 3.20 2.50 2.40 1.90
V 7.00 18.0 <LD 7.00 8.00 15.0 <LD 14.0 <LD 8.00
Cu 12.0 12.0 4.00 20.0 45.0 8.00 25.0 217 823 <LD
Pb 7.00 6.00 31.0 15.0 15.0 7.00 17.0 14.0 21.0 13.0
Zn 70.0 < 50 < 50 < 50 < 50 < 50 < 50 < 50 80 < 50
Sn < 0.02 < 0.02 < 0.02 < 0.02 < 0.02 < 0.02 < 0.02 < 0.02 < 0.02 < 0.02
W < 1.00 179 < 1.00 < 1.00 < 1.00 < 1.00 < 1.00 211 11.0 < 1.00
Mo 5.00 7.00 8.00 23.0 62.0 444 10.0 22.0 11.0 < 1.00
Ag < 5.00 < 5.00 < 5.00 < 5.00 < 5.00 < 5.00 < 5.00 < 5.00 < 5.00 < 5.00
As < 0.50 1.40 < 0.50 2.10 3.00 < 0.50 < 0.50 < 0.50 4.80 2.50
Se < 3.00 < 3.00 < 3.00 < 3.00 < 3.00 < 3.00 < 3.00 < 3.00 < 3.00 < 3.00
Sb < 0.10 0.20 < 0.10 < 0.10 < 0.10 0.40 0.40 0.40 0.30 < 0.1 Au (ppb)
< 2.00 < 2.00 < 2.00 < 2.00 < 2.00 < 2.00 < 2.00 < 2.00 < 2.00 < 2.00
TZr 711 748 748 773 736 752 677 691 717 723
Tap 837 839 846 787 853 867 914 904 754 844

125
Group III Group IV Average crust Sample BGD-13 BGD-14 BGD-15 BGD-16 BGD-17 PD-1 PD-22 PD-32 PD-42 UC3 LC3
wt.%
SiO2 78.5 79.0 71.3 74.7 76.3 71.7 69.2 70.7 70.3 64.9 58.1 TiO2 0.12 0.08 0.08 0.18 0.17 0.43 0.41 0.39 0.39 0.53 0.84 Al2O3 11.9 12.2 16.7 14.3 13.4 14.6 14.5 14.6 14.6 14.6 15.5 FeOt 1.48 1.16 1.37 2.17 1.63 2.82 2.66 2.45 2.52 4.37 8.07 MnO 0.03 0.02 0.04 0.03 0.08 0.04 0.07 0.12 MgO 0.80 0.46 0.54 0.81 0.72 0.89 0.92 0.78 0.81 2.24 4.07 CaO 2.55 2.16 2.17 3.19 1.75 2.55 2.50 2.34 2.17 4.12 6.8 Na2O 3.46 4.26 2.94 3.56 4.23 3.42 3.65 3.88 3.81 3.46 2.86 K2O 1.17 0.63 4.75 1.00 1.73 3.42 3.64 3.86 3.95 3.45 1.58 P2O5 0.02 0.02 0.10 0.04 0.05 0.13 0.15 0.20 ppm
S 736 230 1709 3419 1447 468 953 408 Cl 177 102 92.0 129 193 170 640 278 Rb 88.4 55.1 271 89 124 149 110 41.0 Sr 420.8 526.9 157 373 354 258 316 352 Ba 128 28.0 392 185 201 451 668 568 Cs 3.00 4.00 7.00 4.00 4.00 4.00 5.80 0.80 Ga 10.0 14.0 18.0 15.0 14.0 19.0 14.0 17.0 Ta 1.70 <0.50 < 0.50 < 0.50 < 0.50 2.40 1.50 0.84 Nb 3.60 2.10 7.60 7.20 13.0 15.4 26.0 11.3 Hf 5.00 3.00 3.00 3.00 4.00 4.00 5.80 4.00 Zr 128.7 51.0 67.0 137 111 136 237 165 Y 19.6 30.5 18.6 37.4 36.5 20.5 21.0 27.0 Th 11.2 10.8 5.70 20.9 18.6 12.3 10.3 6.60 U 3.60 6.30 8.20 8.50 10.7 10.7 2.50 0.93 La 26.7 12.5 8.80 32.0 25.5 32.3 32.3 26.8 Ce 61.0 27.0 19.0 65.0 52.0 62.0 65.7 53.1 Nd 22.0 7.00 < 50 20.0 14.0 26.0 25.9 28.1 Sm 3.80 2.90 1.50 3.50 3.40 4.00 4.70 6.00 Eu 1.00 0.50 0.60 1.00 0.80 1.00 0.95 1.60 Tb < 0.50 < 0.50 < 0.50 < 0.50 < 0.50 < 0.50 0.50 0.81 Yb 2.40 4.50 2.50 5.40 5.00 2.60 1.50 2.50 Lu 0.40 0.61 0.36 0.82 0.72 0.39 0.27 0.43 Cr < 5.00 18.0 < 5.00 12.0 < 5.00 < 5.00 35.0 228 Ni <LD <LD 8.00 6.00 9.00 <LD 19.0 99.0 Co 2.00 < 1 3.00 5.00 3.00 6.00 12.0 38.0 Sc 2.60 2.10 2.20 3.80 4.10 5.90 7.00 25.0 V 16.0 15.0 8.00 23.0 17.0 32.0 53.0 147 Cu 44.0 8.00 26.0 110 25.0 8.00 14.0 37.0 Pb 12.0 11.0 24.0 11.0 43.0 18.0 17.0 13.0 Zn < 50 < 50 < 50.0 60.0 < 50.0 < 50.0 52.0 79.0 Sn < 0.02 < 0.02 < 0.02 < 0.02 < 0.02 < 0.02 2.50 2.10 W < 1.00 < 1.00 < 1.00 < 1.00 < 1.00 < 1.00 1.40 0.60 Mo 6.00 8.00 14.0 16.0 15.0 8.00 1.40 0.60 Ag < 5.00 < 5.00 < 5.00 < 5.00 < 5.00 < 5.00 55.0 80.0 As 3.40 1.90 1.40 1.80 < 0.50 1.90 2.00 1.30 Se < 3.00 < 3.00 < 3.00 < 3.00 < 3.00 < 3.00 0.08 0.17 Sb 0.30 < 0.1 0.30 < 0.10 < 0.10 0.30 0.31 0.30 Au (ppb) < 2.00 8.00 < 2.00 < 2.00. < 2.00 < 2.00 TZr 773 702 725 782 765 770 Tap 841 846 917 865 898 948
1. TZr and Tap are the zircon and apatite saturation temperature, respectively (see Watson and Harrison,1983; Harrison and Watson, 1984); 2. Porphyry dyke data from Nast (1985); 3. Upper and lower crust average composition data from Wedepohl (1995); <LD means below detection limit;

126
Table 3.2 The whole rock hydrogen and oxygen isotope data of the Nashwaak Granitoids and related dykes.
Sample Approx %H2O δD(VSMOW) Yield δ18O (VSMOW)
MBG1* 9.3 MBG2* 10 BG-1 0.6 -79 15.2 9.5 BG-3 0.4 -79 15.8 7.9 BG-4 0.8 -76 15.3 8.8 BGD-2 1.0 -66 15.4 10.7 BGD-3 0.6 -72 15.7 10.4 BGD-5 0.4 -66 16.1 10.6 BGD-6 0.4 -77 14.1 10.7 BGD-7 0.8 -68 17.1 9.7 BGD-8 0.8 -68 15.8 10.9 BGD-11 1.0 -73 15.3 9.8 BGD-14 0.8 -62 15.6 12.3 PD-1 0.9 -67 15.1 10.1
* data from Whalen et al. (1996)
Table 3.3 The whole rock sulfur isotope compositions of the Nashwaak Granitoids and related dykes.
Sample BGD-2 BGD-5 BGD-6 BGD-7 BGD-8 BGD-11 PD-1
S (ppm) 1161 516 944 560 861 4233 468
δ34S (CDT)* 4.3 4.7 4.5 4.4 4.4 3.6 5.2
*CDT is Cañon Diablo Troilite
Table 3.4 The whole rock Sr-Nd isotope data of the Nashwaak Granitoids and related dykes.
Sample Age (Ma)* 87Sr/86Sr 87Rb/86Sr 87Sr/86Sr init 143Nd/144Nd 147Sm/144Nd ƐNd (t)
MBG-5 405 0.773086 10.99 0.709724 0.512257 0.140145 -4.51
BG-7 405 0.741092 6.77 0.702026 0.512352 0.140249 -2.65
BGD-17 405 0.711992 0.64 0.708298 0.512360 0.141881 -2.60
BGD-4 405 0.709820 1.01 0.703971 0.512432 0.159678 -2.11
PD-1 364 0.714101 1.67 0.705423 0.512390 0.122964 -1.42
* The age of the biotite granitic dykes (BGD-4, and BGD-17, Group III) is 405 Ma dated by U-Pb zircon in this study. Ages of the Nashwaak plutonic phases (MBG-5 and BG-7) might be close to 405 Ma; Whalen et al. (1996) used 400 Ma for his Sr-Nd isotope calculation. The age of the porphyry dyke is 364 Ma as reported by Fyffe et al. (2008)

124
Table 3.5 Zircon U-Pb isotopic data obtained by LA-ICPMS for a biotite granitic dyke sample BGD-13 (Group III) from the drill core of the Sisson Brook deposit, west-central New Brusnwick.
Spot Concentration (ppm) Corrected Atomic Ratios Error
Correlation Age (Ma)
BGD-13
U Th Pb U/Th 207Pb/235Pb 2σ 206Pb/238Pb 2σ 207Pb/206Pb 2σ 206Pb/238Pb vs
207Pb/235Pb 206Pb/238Pb 207Pb/235Pb 207Pb/206Pb
1 1855 234 46 7.9 0.4855 0.0094 0.0642 0.0013 0.0547 0.0013 0.3250 400.9 401.7 402.0
2 599 118 20 5.1 0.4870 0.0110 0.0644 0.0013 0.0548 0.0016 0.0898 402.3 403.5 407.0
3 571 735 109 0.8 0.4900 0.0160 0.0654 0.0017 0.0541 0.0018 0.1778 408.0 404.0 386.0
4 359 135 34 2.7 0.4940 0.0130 0.0655 0.0014 0.0551 0.0016 0.0700 409.0 406.7 491.0
5 285 404 76 0.7 0.4950 0.0170 0.0651 0.0015 0.0564 0.0022 0.2660 406.5 410.0 526.0
6 821 1006 147 0.8 0.4960 0.0110 0.0651 0.0013 0.0554 0.0015 0.1414 406.8 409.1 425.0
7 263 262 52 1.0 0.4970 0.0260 0.0653 0.0014 0.0557 0.0033 0.0052 407.6 408.0 506.0
Table 3.6 Results of Re-Os analyses of molybdenite in the quartz veins from the Sisson Brook deposit.
Sample Re
( ppm) ± 2s
187Re (ppb)
± 2s 187Os (ppb)
± 2s Total common Os
(pg) Model Age
(Ma) ± 2σ (Ma)
SB0826 8.722 0.025 5482.29 15.44 34.49 0.04 2.813 376.5 1.6
SB0832 3.835 0.012 2410.55 7.43 15.25 0.02 3.572 378.5 1.7
SB0915 6.874 0.018 4320.81 11.60 27.27 0.05 3.211 377.6 1.7
127

128
128
Chapter 4 Magmatic sources and evolution process of the Nashwaak
Granite and associated dykes related to the Sisson Brook W-Mo-Cu
deposit, west-central New Brunswick, Canada: evidence from SEM-CL,
LA-ICPMS, and SIMS studies on quartz and zircon
Abstract
The Sisson Brook W-Mo-Cu deposit is spatially related to the Nashwaak Granite and
related dykes consisting of two plutonic phases (two-mica granite and biotite granite) and
dykes with various textures (biotite granitic dykes, aplitic dykes, and porphyry dykes).
The textures and trace element concentrations of quartz from these granites reveal
complicated magmatic- hydrothermal processes. The quartz with oscillatory zoning in the
Nashwaak plutonic phases crystallized in a stable environment of gradual cooling in the
temperature range of 628 to 683 °C. In the dykes, quartz crystallized at similar or lower
temperatures (down to 602 °C), and show evidence for quartz dissolution and
precipitation along open fractures related to continued cooling. Quartz phenocrysts in the
porphyry dyke crystallized at temperatures of 706 to 741 °C and commonly exhibit
resorbed crystal boundaries, which suggest rapid ascent of the magma to the shallow
crust. Only small differences in the trace-element contents of quartz were observed across
the rock types: Al (30-198 ppm), Ti (15-58 ppm), B (5-15 ppm), Ge (0.43-1.96 ppm), Li
(<16.1 ppm), Fe (broadly lower than 38 ppm), and Mg (mostly lower than 2 ppm).
However, differences in the Ge/Ti and Al/Ti ratios of quartz likely reflect varying
degrees of magma differentiation; such that the porphyry dykes are the most primitive

129
129
and the aplitic dykes are the most differentiated. No systematic correlations were
observed between the trace element concentrations of quartz and their host rocks,
indicating that incorporation of trace elements into quartz is not only simply controlled
by the composition of the magmas, but also controlled by other physiochemical
conditions; including temperature, pressure, H2O, and F activities.
Two-mica granite, biotite granite plutonic phases, and biotite granitic dykes are
widely distributed in the Sisson Brook deposit area. Zircons from these three types of
granites typically have bright-CL cores and low-response CL rims as revealed by the
SEM-CL imaging. In situ Secondary Ion Mass Spectrometry (SIMS) oxygen isotope
analysis of zircon revealed differences in the isotopic composition of the core and rim
domains for both the two-mica granite (δ18O = +5.3 to 9.9‰ for the cores and +4.9 to
7.4‰ for the rims) and biotite granitic dykes (δ18O = 4.9 to 9.7‰ for the cores and +5.3
to 7.1‰ for the rims). Furthermore, the zircon cores with δ18O values higher than +6‰
decreased to the rim and an opposite trend was found for one core with a δ18OZrc of
+5.2‰. Disequilibrium oxygen isotope fractionation between zircon and quartz, and
zircon and whole rocks suggests an open system in these magmas. Combining previous
tracer O, Pb, Sr, and Nd isotope studies with these in situ oxygen isotope results suggests
that the two-mica granite and biotite granitic dykes are thought to be formed by mixing of
mantle-like melts with partial melted lower meta-igneous crust. Supracrustal rocks were
assimilated during the magma evolution processes, and are interpreted as a source for the
inherited zircon cores. However, the biotite granite pluton has relatively homogeneous
δ18OZrc composition within and between zircon grains with an average value of 6.8‰ and

130
130
homogenization between zircons with quartz and whole rock, indicate this biotite granite
pluton was mainly formed by partial melting of meta-igneous rocks in the lower crust.
Key words: LA-ICPMS; SIMS; SEM-CL; oxygen isotope; Nashwaak Granite;
Petrogenesis
4.1 Introduction
Zircon and quartz are common minerals in intermediate and silicic rocks, and are
widely used to investigate the magmatic-hydrothermal processes by analyzing their
textures and trace element concentrations. Compared to other rock-forming minerals,
such as feldspar and mica, they can be more resistant to later hydrothermal alteration and
thus may be capable of preserving primary textures and geochemical information about
the magmas in which they crystallized. Scanning electron microscope-
cathodoluminesence (SEM-CL) has the ability of revealing otherwise unobservable
textures in quartz and has been used to investigate growth history of hydrothermal quartz
at different stages of mineralization resulted in various deposits (Penniston-Dorland,
2001; Rusk and Reed, 2002; Rusk et al., 2006; Rusk et al., 2008; Müller et al., 2010).
Intragranular growth structures of quartz grains (phenocrysts) in volcanic and granitic
rocks have also been studied by Müller et al. (2000, and 2009), Wark et al. (2007), Wiebe
et al. (2007), Bineli-Betsi and Lentz (2010), Agangi et al. (2011), Breiter et al. (2012),
and Wilcock et al. (2013) as related to the primary granitic textures. With the aid of
SEM-CL imaging, laser ablation-inductively coupled plasma mass spectrometry (LA-
ICPMS) has been used as an in situ method to analyze the trace-element concentrations

131
131
of different domains observed by CL in quartz (Müller et al., 2003; Götze et al., 2004;
Larsen et al., 2004; Jacamon and Larsen, 2009; Betsi and Lentz, 2010; Breiter et al.,
2012, 2013) to discern between multiple pulses of magma and understand fractional
crystallization processes and late subsolidus process.
Zircon, as a refractory mineral in magma, has a high closure temperature and slow
rates of oxygen diffusion even during granulite-facies metamorphism and anatexis, thus
is a potential tool in preserving oxygen isotope composition of its hosting magma
(Valley, 2003a; Page et al., 2007; Bowman et al., 2011). As a reference, typical δ18O
values of different oxygen isotope reservoirs were summarized by Valley et al. (2005)
and Eiler (2001). Quartz also has been widely regarded as preserving reliable oxygen
isotope ratios representing magmatic compositions, but due to its less refractory nature
relative to zircon, is susceptible to isotopic re-equilibration during fluid-related alteration
processes (Valley and Graham, 1996; Gilliam and Valley, 1997; King et al., 1997; King
et al., 2008). Other open-system processes, such as assimilation of supracrustal rocks,
may also modify the isotopic composition of the magma and any host crystals (Bindeman
and Valley, 2001; Monani and Valley, 2001; King et al., 2004).
This paper uses in situ Secondary Ion Mass Spectrometry (SIMS) to analyze the
oxygen isotope compositions of zircon and quartz, in order to differentiate between
varying magmatic and/or crustal sources of the Nashwaak pluton and related dykes, and
sources of hydrothermal fluids associated with the Sisson Brook W-Mo-Cu deposit, New
Brunswick. Quartz crystallization textures and trace element compositions were
investigated by SEM-CL and LA-ICPMS methods, respectively, in order to further
constrain the magmatic-hydrothermal processes during the late stages of magma

132
132
evolution and establish possible connections between the composition of magmatic
quartz and the host granite.
4.2 Geological background and sample details
The rocks in the vicinity of the Sisson Brook W-Mo-Cu deposit consist of a thick
sequence of Cambro-Ordovician continental and marine volcanic and sedimentary rocks
intruded by younger mafic and felsic intrusive rocks (i.e., the Nashwaak Granite, Howard
Peak Granodiorite and Gabbro). The oldest rocks are quartzose wackes interbedded with
siltstones and shales of the Cambrian-Early Ordovician Miramichi Group, which form the
core of a north-northeast-trending, southerly plunging anticline in the area (Lutes, 1981).
These rocks are bounded to the east and west by younger volcanic and sedimentary rocks
of the Ordovician Tetagouche Group (Fig. 4.1).
The oldest intrusive phase in the Sisson Brook area is the Howard Peak Granodiorite
which is dark grey, medium- to coarse-grained, moderately to highly foliated and consists
mostly of plagioclase and amphibole. Partial biotitization and chloritization are common,
and likely reflect localized contact metamorphism by intrusion of the Nashwaak Granite
along its western margin. The Howard Peak Granodiorite grades eastward into the dark
grey, medium-grained ophitic gabbro. Its eastern contact with the Turnbull Mountain
Formation is a vertical fault (Fyffe et al., 2008).
The Nashwaak Granite has two subfacies: (1) pink, coarse- to medium-grained,
equigranular to subporphyritic biotite granite (Group II) with a mineral assemblage of
plagioclase, orthoclase, quartz, and minor biotite, that grades northward into (2)
muscovite-biotite granite (Group I). In drill core, foliated, silicified, and greisenized

133
133
granite dykes (Group III) containing xenoliths of gabbro crosscut the Howard Peak
Granodiorite; these dykes are considered to be offshoots of the Nashwaak Granite.
A grey, massive, unfoliated granite porphyry dyke (Group IV) was intersected in
drill hole SSN26. The granite porphyry contains about 50% phenocrysts set in a fine-
grained groundmass of alkali feldspar and quartz. The phenocryst population includes
about 25% zoned plagioclase laths (An34-An15) up to 1 cm in length; 10% euhedral quartz
crystals from 0.1 to 0.7 cm in width; 8% biotite laths from 0.05 to 1 cm in length; and 7%
alkali feldspar crystals from 0.2 to 1 cm in width (Mann, 1980; Nast, 1985; Nast and
Williams-Jones, 1991). This dyke was dated at 364.5 ± 1.8 Ma using zircon U-Pb (Fyffe
et al., 2008).
All of these granites are typical of those formed in a volcanic arc environment (i.e.,
low Nb, Ta, Y, Yb, and Rb) (see Chapter 3). These magmas were emplaced at low
pressures (< 3 kbar, 300 MPa) and low temperatures (< 800ºC), with slightly oxidized
characteristics (oxygen fugacity between 10-13 and 10-16) (see Chapter 5). They are
attributed to subduction of the Avalon Zone crust beneath the Gander Zone during the
Acadian Orogen (cf. Whalen et al., 1996).
4.3 Analytical methodologies
4.3.1 Textures and compositional analysis of quartz
Three samples were selected from each of the Nashwaak two-mica granite rocks,
biotite granite rocks, and biotite granitic dykes, and one sample was selected from each of
the porphyry and aplitic dykes. Polished thin sections of these samples were prepared at
the University of New Brunswick for SEM-CL imaging. The SEM-CL imaging was
carried out on carbon-coated polished thin sections with a JEOL 6400 SEM at the

134
134
University of New Brunswick. Back-scattered electron (BSE) and CL images were
successively taken under the same analytical conditions (acceleration voltage of 15 kV
and beam current of 10 nA) using a Gatan Chroma CL digital image acquisition system
(Fig. 4.2). The system used cannot quantify the CL intensity; only luminescence colours
exhibited by quartz crystals were recorded. With the guidance of CL textures in quartz,
further in situ trace element analysis was conducted using a Resonetics M-50-LR 193nm
Excimer laser ablation system coupled to an Agilent 7700x quadrupole ICP-MS also at
the University of New Brunswick. The 193 nm laser has a repetition rate of 10 Hz, a spot
size of 47 μm, and produces an energy fluency of 120 mj/cm2 on the sample surface. To
assess the accuracy and precision of the method used, 42 replicate analyses of the NIST
610 (Jochum et al., 2011) were conducted using the same laser settings as for the
unknowns. The results yielded relative standard deviations of lower than 1% and relative
deviations (100 × (ppmmeans-ppmref)/ppmref) of lower than 5% for the most of the elements
(see Appendix Table 3). Limits of detection (LOD) are given in the Appendix Table 4,
trace element concentrations lower than LOD or with negative value are listed as 0 (Fig.
4.3, Table 4.1, and Appendix Table 5).
4.3.2 Oxygen isotope analysis of quartz and zircon
SIMS oxygen isotope analysis of quartz and zircon was carried out using a Cameca
IMS 1280 ion microprobe, at the Canadian Centre for Isotopic Microanalysis (CCIM),
University of Alberta. Quartz grain and vein samples were fixed into an epoxy mount
with a reference material S0033 glass (GeeWiz glass; Larsen and Sharp, 2005). After
polishing and cleaning, 5 nm of Au was evapouratively coated onto the mount surface for
SEM imaging using a Zeiss EVO MA15 SEM, and equipped with Robinson CL and

135
135
Zeiss backscattered electron detectors. A further 25 nm Au was coated onto the mount
surface for the SIMS analysis. An attempt was made to analyze the oxygen isotopic
composition across two quartz veins (BGD2, BGD17) and multiple magmatic
crystals (MBG5, BG3, BGD2, BGD17, PD1). Oxygen isotope measurements include
transects that consist of 8 to 12 analyses, a spacing of ~ 100 to 300 µm, and generally
trend from rim to core for most magmatic crystals, or across the entire section of the two
quartz veins (Table 4.2, and Appendix Table 6).
Zircon from three felsic phases (the Nashwaak two-mica granite MBG5, biotite
granite BG3, and biotite granitic dykes BGD2) was separated at Overburden Drilling
Management Limited (ODM). An epoxy mount of zircon samples with reference
materials (UAMT1) was also prepared for SEM-CL and SIMS analysis. For the zircon
oxygen isotope session, multiple zircon crystals were analyzed for each sample, for a
combined total of 11 to 30 analyses per sample. Two zircon populations were identified
using SEM-CL, (1) prevalent high-CL response (bright) zircon domains (cores or whole-
crystals) and (2) thin, low-CL response rims (Fig. 4.4). An attempt was made to analyze
both of these domains; however due to the small size of the zircon crystals and the
internal fracturing observed in many of these, it was not always possible to fit multiple
analyses on a single crystal.
For the quartz and zircon SIMS sessions, a 133Cs+ primary beam was operated with
impact energy of 20 keV and 2 – 4 nA beam current. The ~ 12 µm diameter probe was
rastered slightly during acquisition to form rectangular sputtered areas of ~15x18 µm
across. Negative secondary ions were extracted into the secondary (transfer) column
through 10 kV. Transfer conditions included 122 µm entrance slit, 400 µm contrast

136
136
aperture, 5 mm field aperture, and 100x image magnification at the field aperture,
transmitting all regions of the sputtered area. The energy window utilized was 150 eV.
The mass-separated oxygen isotopes were detected simultaneously in Faraday cups L’2
(16O-) and H’2 (18O-) in the multi-detector array. Mass resolution (∆m/M at 10%) was
typically 1950 and 2275, respectively (see Zeh et al., 2014). For quartz reference
material S0033 (GeeWiz glass) (Larson and Sharp, 2005), the measured δ18O value of
+12.34 ± 0.05‰ (n = 12) agrees well with the reported value of +12.5‰. Median
uncertainties for the quartz reference materials and samples at 95% confidence (2) are ±
0.17‰ (Appendix Table 6).
For the zircon reference material S0081 (UAMT1), the measured δ18OVSMOW value
of +4.81 ± 0.04 ‰ agrees well with the accepted value of +4.87 ‰ (Stern R.,
unpublished data). At 95% confidence the median uncertainty for the zircon reference
materials and samples is ± 0.19 and ± 0.18‰, respectively. During the analytical session,
a small number of analyses may have been acquired from metamict portions of core and
rim zircon domains. These were recognized (and removed from the dataset) during post-
analysis data reduction (Table 4.3).
4.4 Quartz textures distinguished by SEM-CL imaging
4.4.1 Quartz textures in the Nashwaak plutonic phases
The compositional zoning of quartz in magmatic systems is controlled by the
disturbances of growth and diffusion rates during crystallization (Müller, 2000). The
quartz grains in the Nashwaak biotite granite and two-mica granite are green and bluish
red in SEM-CL (colour). They are homogeneous and composed of only one generation of

137
137
primary igneous quartz. In some quartz grains, oscillatory zoning occurs as periodic, μm
scale zones, and small amplitude variations in CL (Fig. 4.2). This oscillatory zoned
texture is interpreted as forming very slowly by a self-organized, diffusion controlled
mechanism on the crystal-melt boundary layer, at low degrees of undercooling and
oversaturation (Shore and Fowler, 1996).
Secondary textures of the magmatic quartz in the Nashwaak Granites include: (1)
dark CL-streaks and patches associated with fractures, (2) healed fractures, which do not
show up in BSE images, and are likely filled by nonluminescent SiO2 (cf. Seyedolali et
al., 1997), (3) opened fractures. The occurrence of secondary red quartz along fractures
and the grain margins likely reflects replacement by silica-rich aqueous fluids. These
fracture textures are attributed to the later tectonic activity, such as uplift after intrusion
(see Seyedolali et al., 1997).
4.4.2 Quartz texture in the Nashwaak dykes
The primary magmatic quartz grains in the biotite granitic dykes (in colour SEM-
CL) are also green and homogeneous with only one generation of quartz. The secondary
texture called cobweb and splatter texture similar to those described in Rusk and Reed
(2002) is found in both vein quartz in the dykes and the hydrothermally altered magmatic
quartz nearby a quartz vein (Fig. 4.2). This texture is characterized by variably oriented
and anastomosing fluid migration trails in which dissolution and corrosion processes alter
the quartz to a dark green in colour. Quartz dissolution in the dyke system might be
caused by pH fluctuation of fluids, magmatic fluids mixing with meteoric water, and
cooling of fluids through the zone of retrograde solubility of quartz (see Fournier, 1985;
Rusk and Reed, 2002; Betsi and Lentz, 2010).

138
138
In the porphyry dykes, quartz phenocrysts are up to 7 mm in diameter, and vary in
CL colour from light green to dark green, in particular, between the layers of stepped
zoning; which is defined as wide, non-periodic and large-scale (> tens of μm) variations
in CL intensity (Allègre, 1981; Shore and Fowler, 1996). The later growth zones partially
truncate early formed core zones, revealing resorption textures, which could be the result
of temperature increases, depressurization, or magma mixing (Fig. 4.2, Müller et al.,
2009). However, considering the quartz phenocrysts are hosted in a porphyry dyke, rapid
ascent of magma is the most reasonable explanation for forming the resorption texture
according to the model of Holtz and Johannes (1994) and Johannes and Holtz (1996).
The later tectonic activity caused fracturing and fluid reaction that might result in CL
variations along fractures in quartz phenocrysts, similar to that of quartz in the Nashwaak
Granite pluton.
4.5 Trace elements distribution in quartz
The trace element concentrations in magmatic quartz from the Nashwaak Granites
and related dykes are listed in Table 4.1 and shown in Fig. 4.3. Concentrations of Be, Rb,
Sr, Sn, and Ba are generally lower than the limits of detection. Elements like Ti4+, Ge4+,
and Al3+ have an ionic potential comparable to Si4+, and form strong ionic-covalent bonds
with the oxygen atoms when substituting for Si4+ in the (SiO4)- tetrahedron (Jacamon and
Larsen, 2009); these elements are relatively immobile and may record the original
magmatic signature of magmatic quartz. Aluminum concentrations of <189 ppm in
Nashwaak Granite and dykes, are lower than the typically Al concentrations of up to 400
ppm in magmatic quartz (Müller et al., 2000; 2002). The Al content of quartz from the
Nashwaak Granites and dykes show no obvious variation between the two rock types,

139
139
with each ranging from 42 to 190 ppm. The highest Ti values of quartz were found in the
porphyry dykes, varying from 42 to 57 ppm, while Ti concentrations from other groups
are lower than 34 ppm (Table 4.1; Fig. 4.3)
Interstitial elements, such as Li, Na, K, and H, behave as charge compensators and
are accommodated in vacancies produced by lattice defects in quartz (Gӧtze et al., 2001,
2004). The substitution mechanism may be formulated as Al3+ (Fe3+, B3+) + Li+ (Na+, K+,
H+) ↔ Si4+ (Gӧtze et al., 2001, 2004). Lithium in all the samples has a linear variation
with Al with different Li/Al ratios between dykes and plutonic granite. Lithium
concentrations of quartz from the dykes (aplitic dykes and porphyry dykes) are higher
than 4.7 ppm, with Li/Al molar ratios larger than 0.3, while Li in plutonic quartz is lower
than 4.7 ppm, and Li/Al molar ratios less than 0.3 (Fig. 4.3). Quartz from the biotite
granite dyke yields similar Li contents of less than 1.55 ppm as the plutonic phases, with
associated Li/Al molar ratios of less than 0.2. Hurst and Storch (1981) found that the
Li/Al of quartz is inversely proportional to quartz precipitation temperature. However,
this is not the case for the Nashwaak Granite and dykes, since the Li/Al molar ratios of
quartz are not consistent with the zircon saturation temperatures (Watson and Harrison,
1983) or the calculated Ti-in-quartz temperatures (Wart and Watson, 2006) (see below).
Allan and Yardley (2007) suggested that the Li/Al of quartz may relate to the availability
of Li relative to other charge-balancing compensators, such as H+, Na+, and K+. Most of
the quartz grains have Na and K below 36 ppm and 10 ppm, respectively (Fig. 4.3).
However, the reported structurally incorporated Na in magmatic quartz typically reaches
up to 48 ppm (Larsen et al., 2004) and K up to 100 ppm (Larsen et al., 2009). The weaker
correlation between Al and Na or K may be partially due to the occurrence of fluid

140
140
inclusions in the analysis spot in the quartz grain (Allan and Yardley, 2007). Gӧtze et al.
(2004) investigated pegmatite quartz from different occurrences in Norway and Namibia
and found that fluid inclusions in quartz may host several ppms of Na + K, but very low
Li even in the quartz from Li pegmatites. Although P is able to be incorporated into
quartz by coupled substitution (Al3+ + P5+ ↔ 2Si4+; Jacamon and Larsen, 2009), the P
substitution extent is typically limited (Müller et al., 2012). The P contents of most
samples are above the limits of detection (6 ppm) and the highest P value of 18 ppm is
found in quartz from the two-mica granite. The molar ratio of ∑(Li+Na+K+P)/Al is
lower than 1, and the remaining univalent ions required for change balance might be
provided by H+, which is enriched at late stage of magma evolution.
The Fe content in quartz from all samples is generally lower than 38 ppm, and Mg is
lower than 2 ppm. The highest concentrations of Fe (290 ppm) and Mg (4 ppm) are found
in two-mica granite. Manganese is generally lower than 3 ppm in all the groups, with
only a few analyzed spots up to 20 ppm in the two-mica granite. Boron in quartz is
typically in the range of 5 to 15 ppm in all samples and a few quartz grains from the two-
mica granite have up to 26 ppm. Strontium, Rb, Sn, and Ba are below the limits of
detection (Fig. 4.3; Table 4.1).
4.6 Oxygen isotope results
4.6.1 Oxygen isotope data of whole rock
For two samples of the Nashwaak two-mica granite, the whole-rock oxygen isotope
values are +9.3 and +10.0‰ as reported by Whalen et al. (1996). These values are close
to the biotite dykes, which have a δ18OWR value ranging from +9.7 to 10.9 ‰ with a mean
of +10.4 ± 0.9‰ (2σ SD, n=7; see chapter 3); an exception is one sample with a δ18OWR

141
141
value of +12.3 ‰. Comparatively, the biotite granite pluton phase is more heterogeneous
and has lower δ18OWR values of +7.9 to 9.5 ‰ with a mean of +8.7 ± 1.6‰ (2σ SD, n=3).
One sample taken from the porphyry dyke has δ18OWR value of +10.1‰. Thus, all the
whole rock oxygen isotope values of the Nashwaak Granites and associated dykes are
similar to other Siluro-Devonian plutons in the Gander Zone (mostly +7.4 to 10.4‰)
(Whalen et al., 1996), suggesting that they are ‘normal granites’ (Taylor, 1968, 1978;
Taylor and Sheppard, 1986) likely derived from igneous protoliths, although supracrustal
contamination may have been involved in magma evolution.
4.6.2 Oxygen isotopes of quartz
Overall, the oxygen isotope compositions of quartz from the Nashwaak Granite and
related dykes have limited or no intragranular variations. The δ18OQz values of quartz
from the two-mica granite produce a mean of +10.3 ± 0.2‰ (2σ SD, n=11), which is
higher than that of the biotite granite with a mean of +8.3 ± 0.3 ‰ (2σ SD, n=12).
Detailed examination of magmatic quartz in proximity to a quartz vein yielded consistent
δ18OQz values, regardless of the distance from the vein. Oxygen isotope compositions of
the quartz veins show limited or no variability, but have slightly higher δ18OQz values
than those of magmatic quartz. For example, in the biotite granitic dyke samples (sample
BGD2), three analyses were acquired from a magmatic quartz crystal along the margin of
the vein and have a mean δ18OQz of +9.9 ± 0.1‰ (2σ SD, n=3). Other analyses for a
quartz grain, several centimetres from the quartz vein, show similar δ18OQz values of +9.7
± 0.3‰ (2σ SD, n=8). The quartz vein itself has a slightly higher δ18OQz value of +10.7 ±
0.7‰ (2σ SD, n=7). In the aplitic dyke (BGD17), magmatic quartz at various distances
from the vein has similar δ18OQz values to that of the quartz vein, which include +9.7 ±
142
142
0.2‰ (2σ SD, n=9) and +9.6 ± 0.1‰ (2σ SD, n=10), respectively. Although quartz
phenocrysts in the porphyry dyke display obvious stepped zoning and compositional
differences in trace elements, δ18OQz values of two quartz phenocrysts are identical, with
a mean of +9.1 ± 0.2‰ (2σ SD, n=22) (Table 4.2, Appendix Table 6).
4.6.3 Oxygen isotope of zircon
Inter-grain and intra-grain δ18OZrc values of zircon from the two-mica granite are
highly variable; from +5.2 to 9.9‰ (mean of +7.2‰) for the bright cores (Fig. 4.4), and
+3.0 to 7.4‰ (mean of +6.2‰) for the overgrowth oscillatory rims. The δ18OZrc values of
zircon generally decrease from core to rim, in the variation range of 0.6 to 3.1‰ (Table
4.3). However, the opposite trend was found in one sample (MBG5_2), with δ18OZrc
values of ~ +5.2 ‰ in the core and ~ +6.2‰ in the rim. Considering the analytical
uncertainties are generally < ± 0.2‰ (2σ), these inter-grain and intra-grain variations
likely represent the real oxygen isotopic heterogeneity. Zircon from the biotite granite
shows limited variation between cores and rims, with δ18OZrc values of the cores from
+6.7 to 7.4‰ (mean= +6.8‰, n=15) and the rims between +6.3 and 7.1‰ (mean=
+6.8‰, n=5). Inter-grain variation is smaller than 0.4‰ without a consistent distribution
trend from core to rim.
For the biotite granitic dyke, δ18OZrc values of the zircon cores mainly vary from
+6.9 to 7.8‰; however, outliers include one high δ18OZrc value of +9.7‰ and three low
δ18OZrc values of +4.9 to 5.4‰. For the rim domain, δ18OZrc values range from +5.3 to
7.1‰. In general, δ18OZrc values decrease from 0.3 to 1.4‰ between cores and rims
(Table 4.3; Fig. 4.5).

143
143
4.7 Discussion
4.7.1 Factors affecting the incorporation of trace elements into quartz
Quartz in granitic rocks typically contain 10-90 ppm Ti, 40-500 ppm Al, 5-25 ppm
Li, and 0.5-2.5 ppm Ge (Breiter and Müller, 2009; Jacamon and Larsen, 2009; Müller
and Koch- Müller, 2009; Deans, 2010; Breiter et al., 2012). Compared to granites, quartz
from rhyolite and pegmatite has higher Ti and Ge, but lower Al (Schrön et al., 1988).
Although this may not always be the case, some granitic quartz may also be enriched in
Ti and Ge (Breiter et al., 2012). The factors controlling partitioning of trace elements into
quartz are complex and the geochemical relationship between quartz and whole rocks is
still controversial. The Al content in quartz from the Nashwaak Granite and dykes is
lowest in the biotite dyke, which also has the lowest aluminum saturation index (ASI =
1.03). The Al content of quartz in other samples is similar ranging from 42 to 190 ppm,
regardless of the ASI of their host rock (1.05 < ASI < 1.36). Breiter et al. (2013)
investigated the trace element content of quartz from different types of granites from the
Bohemian Massif, Czech Republic, and suggested that Al distribution in quartz has no
direct relationship with the peraluminosity of their host rock. Although Jacamon and
Larsen (2009) have shown the Al content of quartz increases with increasing ASI of the
melt, several studies indicate the partitioning of Al into quartz is more complex. Dennen
et al. (1970) argued that the Al content of quartz is controlled by temperature, and
developed the Al-in-quartz geothermometer. Nonetheless, this geothermometer might not
be reliable, since Larsen et al. (2000, 2004) showed some quartz formed at low
temperatures also could have hundreds of ppm of Al. Jacamon and Larsen (2009) found
the Al in quartz coincides with H2O-CO2 saturation of the melt and suggested that the
144
144
high H2O activity should be associated with higher activity of hydroxyl groups, which
help Al incorporation into quartz though a supplementary substitution mechanism. Müller
et al. (2000) and Breiter et al. (2013) explained that in the de-polymerization of magma
as the effect of enrichment of H2O and F at the late stage of magma fractionation, the
depolymerized alumina-silica complexes can attach to the reactive crystal surface more
easily than those that are polymerized. In hydrothermal quartz veins, Al in quartz is
related to Al solubility in the fluids, which is in part controlled by pH value of fluids.
Based on an experiment of titrating granite into an acidic magmatic fluid, the equilibrium
dependence of aqueous Al concentration on pH and assemblages of Al minerals were
modeled by Rusk et al. (2008). The experiment results show pH and mineral assemblages
are a function of water/rock (w/r) ratio. At low temperature (200 °C), Al solubility is six
orders of magnitude higher at a pH of 1.5 (w/r = 10 and kaolinite is the only Al-bearing
mineral) than at a pH of 3.5 in the presence of muscovite (w/r = 1). At higher
temperatures (500 °C), the pH value fluctuates between 4 and 6 and Al solubility varies
slightly regardless of water/rock ratio and mineral assemblages (Rusk et al., 2008).
The magma composition and partition coefficient of elements between quartz and
magma are the main factors controlling the elemental content in igneous quartz. Jacamon
and Larsen (2009) noted that Ti is compatible in early formed mafic minerals, thus Ti in
quartz decreases with higher degrees of magma differentiation. In contrast, Ge is
commonly more compatible in the residual melt than the crystalizing phases (Beurlen et
al., 2011), thus Ge/Ti ratios in quartz can be a useful index of magma differentiation
(Larsen et al., 2004; Jacamon and Larsen, 2009). It has also been suggested that Al/Ti
ratios show similar magma differentiation trends (Breiter and Müller, 2009; Müller et al.,

145
145
2010; Breiter et al., 2012; Breiter, 2013). A plot of Ge/Ti versus Al/Ti shows the
porphyry dyke represents the most primary magma phase (with lowest Ge/Ti and Al/Ti),
whereas the aplitic dykes are the most differentiated (Fig. 4.6). However, the highest Ti
(> 42 ppm) concentrations were found in a quartz phenocryst of the primitive porphyry
dyke (whole rock TiO2 = 0.43 wt.%), and the Ti content of quartz in other groups has no
obvious difference. No correlation of Ti concentrations between quartz and whole rock
indicates that the Ti partition coefficient between quartz and magmas is likely a function
of equilibrium temperature (Wark and Watson, 2006), and possibly also pressure (Huang
and Audétat, 2011).
The lithium content of quartz is highest in the most primary porphyry dykes and
lowest in the strongly fractionated granitic dykes. This observation is contrary to the
conclusion of Larsen et al. (2004), who suggested that Li is more compatible in the melt
phase, and is only enriched in quartz at lower temperatures during the late crystallization
of granitic systems. However, our results indicate Li behaviour during magma evolution
might be more complex. Lithium is compatible during hornblende and biotite
crystallization (Jacamon and Larsen, 2009). Only after these minerals have fractionated
from the system, would Li become enriched in quartz. An alternative explanation is that
more Al is available in the late stages of fractionation (increased ASI values), which
helps Li incorporation into quartz (Jacamon and Larsen, 2009). The apparent depletion of
Li in a small number of quartz grains (e.g., BGD2) might reflect the infiltration of
aqueous fluids and resorption/dissolution of Li into the fluids, such that late quartz has
apparent enrichment in Li (Jacamon and Larsen, 2009).

146
146
The phosphorous in quartz is generally higher than 6 ppm in most of the samples.
The detectable P value of quartz from each group is positively related to their whole rock
P content. The highest P value of 18 ppm was found in the quartz from two-mica granite
with 0.15 wt.% P2O5, whereas the quartz with 6.5 ppm P was from the biotite granitic
dyke with 0.02 wt.% P2O5. This trend is different from the results of Breiter et al. (2012),
who found that neither the P content in melts, nor the peraluminosity of the melt, are the
primary factors in controlling the incorporation of P into quartz.
4.7.2 Titanium-in-quartz geothermometer
The experimental work of Wark and Watson (2006) shows that in Ti-saturated melts
(aTiO2 = 1), the Ti concentration in quartz is a function of the temperature from which
quartz crystallized. Furthermore, the diffusion of Ti in quartz is very slow (i.e., ~ 100 μm
for 100, 000 years at 750 °C), such that Ti in quartz is not easily removed or zoning
eliminated by later magmatic activity. Thus, the TitaniQ thermometer is a useful tool to
investigate the thermal evolution of magma (Wark et al., 2007; Wiebe et al., 2007;
Agangi et al., 2011; Wilcock et al., 2013). In rutile absent rocks (aTiO2 < 1), the equation
for calculating temperatures is:
T (°C) = –3765 / [log (XTi/aTi) – 5.69] – 273
Where XTi is the content of Ti in quartz (ppm), and aTi is the activity of Ti in the
coexisting melt. For most igneous and metamorphic rocks, the aTi is larger than 0.5
according to the rutile saturation model of Hayden and Watson (2007). Calculations by
Wilcock et al. (2013) indicate that a TiO2 activity of 0.5 is reflective of a high-silica
rhyolite system. According to the TiO2 saturation model for rhyolite (Hayden et al., 2005)
and equilibria among coexisting Fe-Ti oxides, a Ti activity value of 0.6 was suggested by

147
147
Wark et al. (2007) for the rhyolitic Bishop Tuff at eastern California, USA. Wiebe et al.
(2007) used the same Ti activity value of 0.6 to calculate the temperature for the
Vinalhaven granite, of coastal Maine. Since the Nashwaak Granites and related dykes
have nearly identical mineral assemblage (quartz, feldspar, zircon, biotite, magnetite, and
ilmenite) and similar bulk rock geochemical compositions to that of Bishop Tuff and
Vinalhaven Granite, a Ti activity of 0.6 is assigned for the Nashwaak Granite (Wiebe et
al., 2007). Although the two-mica granite has muscovite in it, the same aTi was also used
for temperature calculation. Variations of +/- 0.1 in the true aTi value would cause the
calculated temperature to be low or high, respectively, by about 20 °C (Wark and
Watson, 2006). The calculated Ti-in-quartz results include temperatures of 706 to 741 °C
for the porphyry dykes, 628 to 683 °C for the two-mica granite, 632 to 643 °C for the
biotite granite, and 602 to 683°C for the biotite granitic dykes (Fig. 4.7). For the quartz
from the Nashwaak Granites and dykes, the Ti is either constant or decreases from core to
rim, corresponding to decreasing temperature. This variation trend indicates that there
were no injections of hotter magmas into the magma chamber during crystallization.
Otherwise, the quartz would have increasing Ti content towards the rim as shown by
Wiebe et al. (2007), Agangi et al. (2011), and Breiter et al. (2012).
4.7.3 Oxygen isotope equilibrium fractionation between zircon, quartz, and whole
rock
4.7.3.1 Zircon-whole rock equilibrium fractionation
The oxygen isotope composition of zircon remains generally constant, although the
value of δ18OWR will increase with increasing the abundance of higher δ18O minerals (i.e.,
quartz and feldspar) during the fractional crystallization process. At magmatic

148
148
temperatures, the value of Δ18OZrc-WR is approximated as a linear fraction of wt.% SiO2
for igneous rocks and varies from ~ -0.5‰ for mafic rocks to ~-2‰ for granites
calculated from the following equation (Valley et al., 1994; Lackey, 2005).
Δ18OZrc-WR = δ18OZrc - δ18OWR ≈ -0.0612 (wt. % SiO2) + 2.5
The Δ18OZrc-WR is ca. -2‰ for the two-mica granite with the SiO2 content of 73 wt.%
and corresponding mean calculated δ18OWR values +8.2‰ for the zircon rim. This value is
lower than the measured δ18OWR value of +9.3 to 10.0‰, suggesting that oxygen isotopes
are not in equilibrium between zircon and whole-rock (melt). Such isotopic
disequilibrium is also evident in biotite granitic dykes, as the calculated δ18OWR values of
+7.3 to 9.1‰ are lower than the measured bulk rock oxygen isotope of +9.8 to 12.3‰,
which suggest the magmatic systems are either open or affected by late stage
hydrothermal fluids. Interestingly, the biotite granite has a mean value of +8.7 ± 1.6‰ for
the measured δ18OWR, which is the same as the calculated δ18OWR value according to the
mean δ18OZrc of +6.8 ‰ and SiO2 of 72 wt.%. Thus, only the biotite granitic pluton
formed in a closed system without being affected by late hydrothermal alteration and/or
assimilation of country rocks.
4.7.3.2 Zircon-quartz equilibrium fractionation
Oxygen isotope fractionation between zircon and quartz is a function of temperature
and is independent of oxygen fugacity or pressure (Trail et al., 2009). An empirical
equation given by Valley et al. (2003b) is as follow.
δ18OQtz - δ18OZrc = ΔQtz-Zrc ≈ 1000 ln(αQtz-Zrc) = AQtz-Zrc 106/T2
where AQtz-Zrc = 2.64 (‰), T = temperature in Kelvin.

149
149
If quartz and zircon are in isotopic equilibrium at a temperature, then the measured
δ18O of them should lie along a line in δ18OZrc vs. δ18OQtz (see Fig. 5b in Valley, 2003a).
For the two-mica granites, our calculated zircon saturation temperature (TZr) of ~ 800 °C
and yields a calculated Δ18OQtz-Zrc value of 2.3‰. The zircon of the two-mica granite has
heterogeneous cores with the δ18OZrc ranging from +5.2 to 9.9‰ and therefore not all of
them equilibrated with quartz. However, the difference of oxygen isotope between quartz
and zircon rim is from 2.9 to 5.4‰ that is larger than 2.3‰. Thus, neither the core, nor
the rim of zircon from the two-mica granite equilibrated with the coexisting quartz.
In the biotite granite, the oxygen isotope values of zircon and quartz are +6.8 and
+8.3‰, respectively. The ΔQtz-Zrc is 1.17-1.97 ‰ and the calculated temperature is 884°C
to 972 °C, which are a reasonable magma temperatures. Consequently, the zircon and
quartz in the biotite granite might have formed in a closed system and equilibrated with
their hosting magma during crystallization. In the biotite granitic dyke, the calculated
δ18OQtz is from +7.8 to 9.6‰ for the zircon overgrowth rim, based on the TZr at 765 °C.
The measured δ18OQtz of +9.9 ± 0.1‰ is higher than the calculated δ18OQtz and only high
δ18O zircons could equilibrate with quartz.
Disequilibrium of oxygen isotope composition between zircon and quartz, and
zircon-whole rock could be caused by several processes as suggested by King et al.
(2004) for granitoids elsewhere. Feldspar and quartz are less refractory minerals in
granites compared with zircon, therefore their oxygen isotope compositions could be
readily reset by hydrothermal alteration and recrystallization (King et al., 1997, 2000;
Monani and Valley, 2001). However, large-scale intense hydrothermal alteration was not
found in the Nashwaak plutonic phases as indicated by the quartz texture in the CL

150
150
images. Although quartz grains in biotite granite rarely have dilatent fractures through
which hydrothermal fluids with different δ18O values would modify the oxygen isotope
composition along the fracture rim (Fig. 4.2c), oxygen isotope equilibrium between
zircon and quartz, as well as zircon and whole rock, indicate that the effect of secondary
alteration processes is limited in the Nashwaak biotite granite. The dyke phases are
commonly altered, with biotite altered to chlorite. Cobweb and splatter textures in them
reflect the dissolution and precipitation processes may have occurred. The quartz veins in
the dykes have a mean δ18O value of +10.7 ± 0.7‰ that is higher than the magmatic
quartz value of +9.7‰ along the vein margin and calculated δ18OQtz of +7.8 to 9.6‰.
Thus, late hydrothermal fluids could increase the δ18O value of magmatic quartz and
whole rock. Interestingly, the oxygen isotope of quartz measured along transects across
the whole magmatic quartz grain does not show any expected variation, suggesting that
hydrothermal alteration is not a main process causing oxygen isotope disequilibrium
between quartz and zircon in the dykes.
Assimilation of country rock during crystallization is another process that can change
the δ18O composition of melts. King and Valley (2001) show that early-crystallizing
zircon has lower δ18O than late-crystallized garnet, which formed after contamination of
the granitic magma by assimilation of sedimentary rocks. Supracrustal contamination in
the two-mica Nashwaak Granite is indicated by the presence of high δ18O (> +8‰) cores
of zircon. Such a contamination process could affect the composition and temperature of
melts. Detailed investigation of quartz textures in the two-mica granite shows that quartz
did not record this process. The oscillatory zoning evident in the quartz from two-mica
granite was interpreted as forming very slowly by self-organised diffusion-controlled

151
151
mechanism on the crystal-melt boundary layer at low degrees of undercooling (cf. Shore
and Fowler, 1996). This stable cooling process is also supported by their slight decrease
of Ti concentration from the core to the rim of the quartz. The most likely explanation is
that the quartz crystallized after contamination. This contamination process can also be
idetified by the disequilibrium of oxygen isotope between other rock-forming minerals,
such as the garnet and zircon pair in the Idaho Batholith (King and Valley, 2001).
4.7.4 Source of magma
The Nashwaak Granites and related dykes are I-type granites. Compared to the
models for the origin of I-type granites in a subduction-related tectonic environment, the
model of the existence of a ‘deep crustal hot zone’ (Annen and Sparks, 2002) or a MASH
(melting, assimilation, storage and homogenization) zone in the deep lithosphere
(Hildreth and Moorbath, 1988) has been widely accepted (cf. Wang et al., 2003; Applely
et al., 2008; Lackey et al., 2008; Muñoz et al., 2012). In these models, the ‘hot zone’ or
the MASH zone is generated by successive emplacement of mantle-derived hydrous
basalts into the lower crust. Heat and water transfer from partial crystallization of basalt
sills trigger the partial melting of pre-existing crustal rocks (i.e., meta-sedimentary and
meta-igneous basement rocks). Once these mixed magmas fractionally crystallized into
basaltic andesite to andesitic compositions, their densities are low enough to have them
ascend to shallow crustal levels (Herzberg et al., 1983; Richards, 2011).
In these models, various magma sources can be identified by the oxygen isotope
composition of zircon. Magmatic zircons equilibrated with mantle-derived magmas have
average δ18OZrc value of +5.3 ± 0.6‰ (2σ SD, Valley et al., 1998; Eiler, 2001) and
fractional crystallization could have a ~0.5 to 1‰ effect on late crystallizing zircon.

152
152
Notable deviations of δ18OZrc from the mantle value are the result of intra-crustal
recycling. High-δ18O magmas (+8 to above 10‰) reflect assimilation of supracrustal
rocks that previously interacted with low temperature fluids (Valley et al., 2005; King et
al., 2008), while low δ18O magmas (lower than ca. +4‰) reflect assimilation of
supracrustal rocks that previously interacted with meteoric water or seawater at high
temperatures (Bindeman, 2008).
In the Nashwaak biotite granitic pluton, zircon is in high temperature equilibrium
with the coexisting quartz and bulk rock, thus hydrothermal alteration or assimilation of
crustal rock could be ruled out during magma evolution. The biotite granitic pluton with
homogeneous δ18OZrc around 6.8 ‰ within and between zircon grains might be derived
by partially melted meta-igneous rocks in the lower crust with only minor mantle melts.
For the two-mica granite and biotite granitic dykes, given the large variability
observed in the δ18OZrc values of the zircon cores (e.g., +4.9 to 9.9‰), it is unlikely that
they precipitated from a single pulse of magma with a uniform isotopic composition. It is
more likely that they formed from a magma that mixed with host rock materials (e.g.,
Applely et al., 2008, 2010; Ickert et al., 2008; Gagnevin et al., 2011), or crustal
assimilation (e.g. Valley et al., 1994; Bindeman and Valley, 2001; Monani and Valley,
2001; King et al., 2004; Valley et al, 2005; Bindeman, 2008; Fu et al., 2014; Miles et al.,
2014). Thus, the cores likely reflect inherited zircons that retained their primary and/or
source rock oxygen isotope compositions (cf. van Dongen et al., 2010). Thus, the two-
mica granite and biotite granitic dykes are interpreted to be formed by mixing of minor
mantle-derived melts with dominant crust-derived magma formed by partial melting of
meta-igneous rocks. Supracrustal materials were added into the system as source

153
153
materials or by assimilation during the magma evolution processes. Later
homogenization of the primary magma with the assimilated supracrustal rocks, may be
reflected in growth of the zircon rims; including their limited range of δ18OZrc values
(+4.9 to 7.4‰), in comparison to the cores +4.9 to 9.9‰ (Table 4.3; Fig. 4.5). This is
further demonstrated in the whole rock radiogenic isotopic compositions of the two mica
granite (see Chapter 3), which shows that Pb isotopes plot along or near the upper crust
reference curve (206Pb/204Pb vs. 207Pb/204Pb) and on or near the orogene reference curve
(206Pb/204Pb vs. 208Pb/204Pb) (see Ayuso and Bevier, 1991), as well as a ɛNd(t) value of -
4.51 and an initial (87Sr/86Sr)i ratio of 0.710, reflecting the involvement of reworked
crustal materials in origin of the magmas. The initial (87Sr/86Sr)i and ɛNd(t) values of
biotite granitic dykes show similar results.
Interestingly, one overgrowth rim of zircon has an extremely low value of +3.0‰ in
the two-mica granites. The δ18OZrc value in this range typically represents assimilation of
supracrustal rocks previously interacted with meteoric water or seawater at high
temperatures (Monani and Valley, 2001; Bindeman and Valley, 2001, 2002; Bindeman,
2008) or low δ18O fluid infiltration during or after magma crystallization. However, in the
Gander Zone, reported δ18O values for metasedimentary rocks are from +10 to 14‰
(Fryer et al., 1992), and for the Siluro-Devonian granitoids are from +6.6 to 10.4‰
(Whalen et al., 1996). Thus, there is no evidence showing that large-scale oxygen isotope
depletion signatures present in the Gander Zone. Infiltration of low δ18O fluid was not
detected in quartz and whole rock samples of these igneous rocks. One possible
explanation is that the zircon with a low δ18O value might be caused by radiation damage
due to local enrichment of U in the rim (e.g., Peck et al., 2001; Gao et al., 2014).

154
154
4.8 Conclusions
(1) Detailed investigation of trace element concentration in quartz shows that they
have no consistent relationship with the whole rock trace element composition.
The Al and Ge concentration generally increase during magma fractional
crystallization, whereas the Ti decreases, thus Al/Ti and Ge/Ti ratio is a reliable
index for studying the degree of magma evolution, although the Ge/Ti ratio seems
more robust. Aluminum incorporation into quartz might not only be controlled by
the aluminum saturation index (ASI) of magma, but also by water and F
activities, and pH, which is controlled by water/rock ratio and temperature.
Lithium is more enriched in the Nashwaak dyke phases than the plutonic phases.
It substitutes into quartz with the combination of Al and behaves as an
incompatible element, thus enriched in highly differentiated magmas and
associated fluids.
(2) The Ti concentration of quartz from different groups of the Nashwaak Granite
shows a constant to slightly decreasing trend from core to rim, indicating a slow
cooling process. Varieties of quartz textures revealed by SEM-CL analysis
suggest that these quartz crystals are the products of late crystallization that
formed under different conditions. The quartz from the Nashwaak plutonic phases
with the oscillatory zoning grew in a stable environment of gradual cooling (683
to 628 °C) from a stagnant magma chamber undisturbed by replenishments.
Supracrustal materials added into the magma system may have elevated the δ18O
values of quartz and thus caused isotopic disequilibrium between zircon and
quartz, and zircon and whole rock. Continuous cooling of quartz in the biotite

155
155
granitic dyke caused the fluctuation of the solubility of SiO2 and quartz dissolved
and precipitated along the fractures in the temperature range of 400 to 600 °C at
pressures below 1 kbar (100 MPa). Quartz phenocrysts in a porphyry dyke record
the highest crystallization temperature of 706 to 741 °C; these quartz crystals
formed in the deep level of crust and late rapid ascent of magma to the shallow
crust was recorded by the resorption texture in them.
(3) Scanning Electron Microscopy-Cathodoluminescense (SEM-CL) images of
zircons from the Nashwaak Granite and dykes show that they typically have a
bright core and low-CL response thin rims. In the two-mica granite and biotite
granitic dykes, δ18OZrc values of the core domains of zircon have a broad range
from +4.9 to 9.9‰ for both groups, and in the rim domain ranges from +4.9 to
7.4‰ for the two-mica granite and +5.3 to 7.1‰ for the biotite granitic dykes.
Intragrain variation of δ18OZrc from zircon core to rim decrease when the core has
the δ18OZrc larger than +6‰, and increase when the core has the δ18OZrc of +5.2‰.
The biotite granite pluton has relatively homogeneous δ18OZrc within and between
zircon grains with an average value of +6.8‰.
(4) Oxygen isotope fractionation between zircon and quartz and zircon and whole
rock indicate that the overgrowth rims of zircon are not isotopically equilibrated
with the coexisting quartz and host melt in the two-mica granite and biotite
granitic dykes. The two-mica granite and biotite granitic dykes are thought to be
formed by mixing of mantle-like melts with partially melted lower meta-igneous
crust. Supracrustal materials were added into the system as source materials or by
assimilation during the magma evolution processes. On the other hand, the biotite

156
156
granite records high temperature equilibrium between zircon and quartz, and
zircon and whole rock. It is simply derived by partially melted lower crust rocks
with minor mantle melts.
References
Agangi, A., McPhie, J., Kamenetsky, V.S., 2011. Magma chamber dynamics in a silicic
LIP revealed by quartz: The Mesoproterozoic Gawler Range Volcanics. Lithos 126,
68-83.
Allan, M.M., Yardley, B.W.D., 2007. Tracking meteoric infiltration into a magmatic-
hydrothermal system: a cathodoluminescence, oxygen isotope and trace element
study of quartz from Mt. Leyshon, Australia. Chemical Geology 240, 343-360.
Allègre, C.J., Provost, A., Jaupart, C., 1981. Oscillatory zoning: A pathological case of
crystal growth. Nature 294, 223-228.
Annen, C., Sparks, R.S.J., 2002. Effects of repetitive emplacement of basaltic intrusions
on thermal evolution and melt generation in the crust. Earth and Planetary Science
Letters 203, 937-955.
Appleby, S.K., Gillespie, M.R., Graham, C.M., Hinton, R.W., Oliver, G.J.H., Kelly,
N.M., EIMF., 2010. Do S-type granites commonly sample infracrustal sources? New
results from an integrated O, U-Pb and Hf isotope study of zircon. Contributions to
Mineralogy and Petrology 160, 115-132.
Appleby, S.K., Graham, C.M., Gillespie, M.R., Hinton, R.W., Oliver, G.J.H., EIMF,
2008. A cryptic record of magma mixing in diorites revealed by high-precision
SIMS oxygen isotope analysis of zircons. Earth and Planetary Science Letters 269,
105-117.

157
157
Ayuso, R.A., Bevier, M.L., 1991. Regional differences in lead isotopic compositions of
feldspars from plutonic rocks of the northern Appalachian mountains, U.S.A. and
Canada: a geochemical method of terrane correlation. Tectonophysics 10, 191-212.
Betsi, T.B., Lentz, D.R., 2010. The nature of “quartz’’ hosted by dykes associated with
Au-Bi-As-Cu, Mo-Cu, and base-metal-Au-Ag mineral occurrences in the Mountain
Freegold region (Dawson Range), Yukon, Canada. Journal of Geosciences 55, 347-
368.
Beurlen, H., Müller, A., Silva, D., D.A, Silva, M.R.R., 2011. Petrogenetic significance of
LA-ICP-MS trace-element data on quartz from the Borborema Pegmatite Province,
northeast Brazil. Mineralogical Magazine 75, 2703-2719.
Bindeman, I.N., 2008. Oxygen isotopes in mantles and crustal magmas as revealed by
single crystal analysis. Reviews in Mineralogy and Geochemistry 69, 445-478.
Bindeman, I.N., Valley, A.J., 2001. Low- δ18O rhyolites from Yellowstone: magmatic
evolution based on analyses of zircons and individual phenocrysts. Journal of
Petrology 42, 1491-1517.
Bindeman, I.N., Valley, J.W., 2002. Oxygen isotope study of Long-Valley magma system:
Isotope thermometry and role of convection. Contributions to Mineralogy and
Petrology 144:185-205.
Bowman, J.R., Moser, D.E., Valley, J.W., Wooden, J.L., Kita, N.T., Mazdab, F.K., 2011,
Zircon U-Pb isotope, δ18O and trace element response to 80 m.y. of high-
temperature metamorphism in the lower crust: Sluggish diffusion and new records
of Archean craton formation. American Journal of Science 311, 719-772.
Breiter, K., Ackerman, L., Svojtka, M., Müller, A., 2013. Behaviour of trace elements in

158
158
quartz from plutons of different geochemical signature: A case study from the
Bohemian Massif, Czech Republic. Lithos 175-176, 54-67.
Breiter, K., Müller, A., 2009. Evolution of rare-metal granitic magmas documented by
quartz chemistry. European Journal of Mineralogy 21, 335-346.
Breiter, K., Svojtka, M., Ackerman, L., Švecová, K., 2012. Trace element composition of
quartz from the Variscan Altenberg-Teplice caldera (Krušné hory/Erzgebirge Mts,
Czech Republic/Germany): Insights into the volcano-plutonic complex evolution.
Chemical Geology 326-327, 36-50.
Deans, J.R.L., 2010. Trace element and calculated temperature variation in quartz and
titanite in the 36 Ma Harrison Pass pluton, Ruby Mountains NE Nevada.
Unpublished MSc Thesis, Texas Tech. University, Texas, USA.
Dennen, W.H., Blackburn, W.H., Quesada, A., 1970. Aluminium in quartz as a
geothermometer. Contributions to Mineralogy and Petrology 27, 332-342.
Eiler, J.M., 2001. Oxygen isotope variations of basaltic lavas and upper mantle rocks.
Reviews in Mineralogy and Geochemistry 43, 319-364.
Fournier, R.O., 1985. The behaviour of silica in hydrothermal solutions. In Geology and
Geochemistry of Epithermal Systems. Edited by Berger, B.R., Bethke, P.M.,
Reviews in Economic Geology 2, 45-61.
Fryer, B.J., Kerr, A., Jenner, G.A., Longstaffe, F.J., 1992. Probing the crust with plutons:
regional isotopic geochemisry of granitoid intrusions across insular Newfoundland.
Newfoundland Department of Mines and Energy, Geological Surveys Branch,
Report 92-1, 119- 140.

159
159
Fu, B., Cliff, J., Zartman, R.E., 2014. Zircon oxygen isotopic constraints from plutonic
rocks on the magmatic and crustal evolution of the northern Appalachians in
southern New England, USA. Canadian Journal of Earth Sciences 51, 360-374.
Fyffe, L.R., Thorne, K.G., Dunning, G.R., Martin, D.A., 2008. U-Pb geochronology of
the Sisson Brook granite porphyry, York County, west-central New Brunswick. In:
Martin, G.L. (Eds), Geological Investigations in New Brunswick for 2007. New
Brunswick Department of Natural Resources. Minerals, Policy and Planning
Division, Mineral Resource Report 2008-1, 35-54.
Gagnevin, D., Daly, J.S., Horstwood, M.S.A., Whitehouse, M.J., 2011. In-situ zircon U–
Pb, oxygen and hafnium isotopic evidence for magma mixing and mantle
metasomatism in the Tuscan Magmatic Province, Italy. Earth and Planetary Science
Letters 305, 45–56.
Gao, Y.Y., Li, X.H., Griffin, W.L., O’Reilly, S.Y., Wang, Y.F., 2014. Screening criteria
for reliable U–Pb geochronology and oxygen isotope analysis in uranium-rich
zircons: A case study from the Suzhou A-type granites, SE China. Lithos 192-195,
180-191.
Gilliam, C.E., Valley, J.W., 1997. Low δ18O magma, Isle of Skye, Scotland: evidence
from zircons. Geochimica et Cosmochimica Acta 61, 4975-4981.
Götze, J., Plötze, M., Habermann, D., 2001. Origin, spectral characteristics and practical
applications of the cathodoluminescence (CL) of quartz—a review. Mineralogy and
Petrology 71, 225-250.
Gӧtze, J., Plӧtze, M., Graupner, T., Hallbauer, D.K., Bray, C.J., 2004. Trace element
incorporation into quartz: A combined study by ICP-MS, electron spin resonance,

160
160
cathodoluminescence, capillary ion analysis, and gas chromatography. Geochimica
et Cosmochimica Acta 68, 3741–3759.
Hayden, L.A., Watson, E.B., 2007. Rutile saturation in hydrous siliceous melts and its
bearing on Ti-thermometry of quartz and zircon. Earth and Planetary Science Letters
258, 561-568.
Herzberg, C.T., Fyfe, W.S., Carr, M.J., 1983. Density constraints on the formation of the
continental Moho and crust. Contributions to Mineralogy and Petrology 84, 1-5.
Hildreth,W., Moorbath, S., 1988. Crustal contributions to arc magmatism in the Andes of
central Chile. Contributions to Mineralogy and Petrology 98, 455-489.
Holtz, F., Johannes, W., 1994. Maximum and minimum water contents of granitic melts:
implications for chemical and physical properties of ascending magmas. Lithos 32,
149-159.
Huang R.F., Audétat, A., 2012. The titanium-in-quartz (TitaniQ) thermobarometer: a
critical examination and re-calibration. Geochimica et Cosmochimica Acta 84, 75-
89.
Hurst, V.J., Storch, S.P., 1981. Regional variation in the cell dimensions of metamorphic
quartz. American Mineralogist 66, 204-212.
Ickert, R.B., Hiess, J., Williams, I.S., Holden, P., Ireland, T.R., Lanc, P., Schram, N.,
Foster, J.J., Clement, S.W., 2008. Determining high precision, in situ, oxygen
isotope ratios with a SHRIMP II: analysis of MPI-DING silicate-glass reference
materials and zircon from contrasting granites. Chemical Geology 257, 114-128.
Jacamon, F., Larsen, R.B., 2009. Trace element evolution of quartz in the charnockitic
Kleivan granite, SW-Norway: The Ge/Ti ratio of quartz as an index of igneous

161
161
differentiation. Lithos 107, 281-291.
Jochum, K.P., Weis, U., Stoll, B., Kuzmin, D., Yang, Q., Raczek, I., Jacob, D.E., Stracke,
A., Birbaum, K., Frick, D.A., Günther, D., Enzweiler, J., 2011. Determination of
reference values for NIST SRM 610-617 glasses following ISO guidelines.
Geostandards and Geoanalytical Research 35, 397-429.
Johannes, W., Holtz, F., 1996. Petrogenesis and experimental petrology of granitic rocks.
Springer, Berlin, Heidelberg, New York, 335 p.
King, E.M., Barrie, C.T., Valley, J.W., 1997. Hydrothermal alteration of oxygen isotope
ratios in quartz phenocrysts, Kidd Creek mine, Ontario: Magmatic values are
preserved in zircon. Geology 25, 1079-1082.
King, E.M., Trzaskus, A.P., Valley, J.W., 2008. Oxygen isotope evidence for magmatic
variability and multiple alteration events in the Proterozoic St. Francois Mountains,
Missouri. Precambrian Research 165, 49-60.
King, E.M., Valley, J.W., 2001. The source, magmatic contamination, and alteration of
the Idaho batholith. Contributions to Mineralogy and Petrology 142, 72-88.
King, E.M., Valley, J.W., Davis, D.W., 2000. Oxygen isotope evolution of volcanic rocks
at the Sturgeon Lake volcanic complex, Ontario. Canadian Journal of Earth Sciences
37, 39-50.
King, E.M., Valley, J.W., Stockli, D.F., Wright, J.E., 2004. Oxygen isotope trends of
granitic magmatism in the Great Basin: location of the Precambrian craton boundary
as reflected in zircons. Geological Society of America Bulletin 116, 451-462.

162
162
Lackey, J.S., 2005. The magmatic and alteration history of the Sierra Nevada batholith as
recorded by oxygen isotope ratios in zircon, titanite, garnet, and quartz. Unpublished
PhD Thesis, University of Wisconsin, Madison, WI, 344 p.
Lackey, J.S., Valley, J.W., Chen J.H., Stockli, D.F., 2008. Dynamic magma systems,
crustal recycling, and alteration in the central Sierra Nevada Batholith: the oxygen
isotope record. Journal of Petrology 49, 1397-1426.
Larsen, R.B., Henderson, I., Ihlen, P.M., Jacamon, F., 2004. Distribution and petrogenetic
behaviour of trace elements in granitic pegmatite quartz from South Norway.
Contributions to Mineralogy and Petrology 147, 615-628.
Larsen, R.B., Jacamon, F., Kronz, A., 2009. Trace element chemistry and textures of
quartz during the magmatic hydrothermal transition of Oslo Rift granites.
Mineralogical Magazine 73, 691-707.
Larsen, R.B., Polvé, M., Juve, G., 2000. Granitic pegmatite quartz from Evje-Iveland:
trace element chemistry and implications for high purity quartz formation. Bulletin
Geological Survey Norway 436, 57-65.
Larson, T.E., Sharp, Z.D., 2005. Interpreting prograde-growth histories of Al2SiO5 triple-
point rocks using oxygen isotope thermometry: an example from the Truchas
Mountains, USA. Journal of Metamorphic Geology 23, 847-863.
Lutes, G., 1981. Geology of Deersdale–Head of Nashwaak River map area J-17 and
Upper parts of Nashwaak River–McBean and Sister Brooks, map area J-18. New
Brunswick Department of Natural Resources; Mineral Resources, Map Report 81- 4,
26.

163
163
Mann, R., 1980. Report on diamond drilling at Sisson Brook. Unpublished company
report, Kidd Creek Mines Ltd., Fredericton, New Brunswick, 36 p.
Miles, A., Graham, C., Hawkesworth, C., Gillespie, M., Dhuime, B., Hinton, A.R., 2014.
Using Zircon Isotope Compositions to Constrain Crustal Structure and Pluton
Evolution: the Iapetus Suture Zone Granites in Northern Britain. Journal of
Petrology 55, 181-207.
Monani, S., Valley, J.W., 2001. Oxygen isotope ratios of zircons: magma genesis of low
δ18O granites from the British Tertiary Igneous Province, western Scotland. Earth
and Planetary Science Letters 184, 377-392.
Müller, A., Herrington, R., Armstrong, R., Seltmann, R., Kirwin, D.J., Stenina, N.G.,
Kronz, A., 2010. Trace elements and cathodoluminescence of quartz in stockwork
veins of Mongolian porphyry-style deposits. Mineralium Deposita 45, 707-727.
Müller, A., Koch-Müller, M., 2009. Hydrogen speciation and trace element contents of
igneous, hydrothermal and metamorphic quartz from Norway. Mineralogical
Magazine 73, 569–583.
Müller, A., Lennox, P., Trzebski, R., 2002. Cathodoluminescence and micro-structural
evidence for crystallisation and deformation processes of granites in the Eastern
Lachlan Fold Belt (SE Australia). Contributions to Mineralogy and Petrology 143,
510-524.
Müller, A., Seltmann, R., Behr, H.-J., 2000. Application of cathodoluminescence to
magmatic quartz in a tin granite – case study from the Schellerhau Granite Complex,
Eastern Erzgebirge, Germany. Mineralium Deposita 35, 169-189.
Müller, A., van den Kerkhof, A.M., Behr, H.-J., Kronz, A., Kock-Müller, M., 2009. The

164
164
evolution of late-hercynian granites and rhyolites documented by quartz – a review.
Earth and Environmental Science Transactions of the Rocal Society of Edinburgh
100, Special issue 1-2, 185-204.
Müller, A., Wanvik, J.E., Ihlen, P.M., 2012. Petrological and chemical characterisation of
high-purity quartz deposits with examples from Norway. In Quartz: Deposits,
Mineralogy and Analytics. Edited by Götze, J., Möckel, R., Springer Geology,
Berlin, Heidelberg, pp. 71–118.
Müller, A., Wiedenbeck, M., van den Kerkhof, A.M., Kronz, A., Simon, K., 2003. Trace
elements in quartz – a combined electron microprobe, secondary ion mass
spectrometry, laser-ablation ICP-MS, and cathodoluminescence study. European
Journal of Mineralogy 15, 747-763.
Muñoz, M., Charrier, R., Fanning, C.M., Maksaev, V., Deckart, K., 2012. Zircon trace
element and O-Hf isotope analyses of mineralized intrusions from El Teniente Ore
Deposit, Chilean Andes: constraints on the source and magmatic evolution of
porphyry Cu-Mo related magmas. Journal of Petrology 53, 1091-1122.
Nast, H.J., 1985. The geology and petrochemistry of the Sisson Brook W-Cu–Mo
deposit, New Brunswick. Unpublished M. Sc. thesis, McGill University, Montreal,
Quebec, 192 p.
Nast, H.J., Williams-Jones, A.E., 1991. The role of water–rock interaction and fluid
evolution in forming the porphyry–related Sisson Brook W–Cu–Mo deposit, New
Brunswick. Economic Geology 86, 302-317.
Page, F.Z., Fu, B., Kita, N.T., Fournelle, J., Spicuzza, M.J., Schulze, D.J., Viljoen, F.,
Basei, M.S., Valley, J.W., 2007. Zircons from kimberlite: New insights from oxygen

165
165
isotopes, trace elements, and Ti in zircon thermometry: Geochimica et
Cosmochimica Acta 71, 3887-3903.
Peck, W.H., Valley, J.W., Wilde, S.A., Graham, C.M., 2001. Oxygen isotope ratios and
rare earth elements in 3.3 to 4.4 Ga zircons: Ion microprobe evidence for high 18O
continental crust and oceans in the Early Archean. Geochimica et Cosmochimica
Acta 65, 4215– 4229.
Penniston-Dorland, S.C., 2001. Illumination of vein quartz textures in a porphyry copper
ore deposit using scanned cathodoluminescence: Grasberg Igneous Complex, Irian
Jaya, Indonesia. American Mineralogist 86, 652-666.
Richards, J.P., 2011. Magmatic to hydrothermal metal fluxes in convergent and collided
margins. Ore Geology Reviews 40, 1-26.
Rusk, B., Reed, M., 2002. Scanning electron microscope-cathodoluminescence analysis
of quartz reveals complex growth histories in veins from the Butte porphyry copper
deposit, Montana. Geology 30, 727-730.
Rusk, B.G., Lowers, H.A., Reed, M.H., 2008. Trace elements in hydrothermal quartz:
Relationships to cathodoluminescent textures and insights into vein formation.
Geology 36, 547-550.
Rusk, B.G., Reed, M.H., Dilles, J.H., Kent, A.J.R., 2006. Intensity of quartz
cathodoluminescence and trace-element content in quartz from the porphyry copper
deposit at Butte, Montana. American Mineralogist 91, 1300-1312.
Schrön, W., Schmädicke, E., Thomas, R., Schmidt, W., 1988. Geochemische
Untersuchungen an Pegmatitquarzen. Zeitschrift für Geologische Wissenschaften
16, 229–244.

166
166
Seyedolali, A., Krinsley, D.H., Boggs, S., O’Hara, P.F., Dypvik, H., Goles, G.G., 1997.
Provenance interpretation of quartz by scanning electron microscope-
cathodoluminescence fabric analysis. Geology 25, 787-790.
Shore, M., Fowler, A.D., 1996. Oscillatory zoning in minerals: a common phenomenon.
The Canadian Mineralogist 34, 1111-1126.
Smith, E.A., Fyffe, L.R., 2006a. Bedrock geology of the Coldstream area (NTS 21 J/06).
York and Carleton counties. New Brunswick. New Brunswick Department of
Natural Resources. Minerals, Policy and Planning Division. Plate 2006-7.
Smith, E.A., Fyffe, L.R., 2006b. Bedrock geology of the Napadogan area (NTS 21 J/07).
York and Carleton counties. New Brunswick. New Brunswick Department of
Natural Resources. Minerals, Policy and Planning Division. Plate 2006-8.
Taylor, H.P.Jr., 1968. The oxygen isotope geochemistry of igneous rocks. Contributions
to Mineralogy and Petrology 19, 1-71.
Taylor, H.P.Jr., 1978. Oxygen- and hydrogen-isotope studies of plutonic rocks. Earth and
Planetary Science Letters 38, 177-210.
Taylor, H.P., Sheppard, S.M.F., 1986. Igneous rocks; I, Processes of isotopic
fractionation and isotope systematics. Reviews in Mineralogy and Geochemistry 16,
227-271.
Valley, J.W., 2003a. Oxygen isotopes in zircon. In Zircon. Edited by Hanchar, J.M.,
Hoskin, P.W.O., Reviews in Mineralogy and Geochemistry 53, 343-385.
Valley, J.W., Bindeman, I.N., Peck, W.H., 2003b. Empirical calibration of oxygen isotope
fractionation in zircon. Geochimica et Cosmochimica Acta 67, 3257-3266.
Valley, J.W., Bindeman, I.N., Peck, W.H., 2003. Empirical calibration of oxygen isotope

167
167
fractionation in zircon. Geochimica et Gosmochimica Acta 67, 3257-3266.
Valley, J.W., Chiarenzelli, J.R., McLelland, J.M., 1994. Oxygen isotope geochemistry of
zircon. Earth and Planetary Science Letters 126, 187–206.
Valley, J.W., Graham, C.M., 1996. Ion microprobe analysis of oxygen isotope ratios in
quartz from Skye granite: Healed micro-cracks, fluid flow, and hydrothermal
exchange. Contributions to Mineralogy and Petrology 124, 225-234.
Valley, J.W., Kinny, P.D., Schulze, D.J., Spicuzza, M.J., 1998. Zircon megacrysts from
kimberlite: oxygen isotope variability among mantle melts. Contributions to
Mineralogy and Petrology 133, 1-11.
Valley, J.W., Lackey, J.S., Cavosie, A.J., Clechenko, C.C., Spicuzza, M.J., Basei, M.A.,
Bindeman, I.N., Ferreira, V.P., Sial, A.N., King, E.M., Peck, W.H., Sinha, A.K., Wei,
C.S., 2005. 4.4 billion years of crustal maturation: oxygen isotope ratios of
magmatic zircon. Contributions to Mineralogy and Petrology 150, 561-580.
Van Dongen, M., Weinberg, R.F., Tomkins, A.G., Armstrong, R.A., Woodhead, J.D.,
2010. Recycling of Peoterozoic crust in Pleistocene juvenile magma and rapid
formation of the Ok Tedi Porphyry Cu-Au deposit, Papua New Guinea. Lithos 114,
282-292.
Wang, Z.R., Kitchen, N.E., Eiler, J.M., 2003. Oxygen isotope geochemistry of the second
HSDP core. Geochemistry, Geophysics, Geosystems 4, 8712.
Wark, D.A., Hildreth, W., Spear, F.S., Cherniak, D.J., Watson, E.B., 2007. Pre-eruption
recharge of the Bishop magma system. Geology 2007, 235-238.
Wark, D.A., Watson, E.B., 2006. TitaniQ: a titanium-in-quartz geothermometer.
Contributions to Mineralogy and Petrology 152, 743-754.

168
168
Watson, E.B., Harrison, T.M., 1983. Zircon saturation revisited: temperature and
composition effects in a variety of crustal magma types. Earth and Planetary Science
Letters 64, 295-304.
Whalen, J.B., Jenner, G.A., Longstaffe, F.J., Hegner, E., 1996. Nature and evolution of
the eastern margin of Iapetus: geochemical and isotopic constraints from Siluro-
Devonian granitoid plutons in the New Brunswick Appalachians. Canadian Journal
of Earth Sciences 33, 140-155.
Wiebe, R.A., Wark, D.A., Hawkins, D.P., 2007. Insights from quartz
cathodoluminescence zoning into crystallization of the Vinalhaven granite, coastal
Maine. Contributions to Mineralogy and Petrology 154, 439-453.
Wilcock, J., Goff, F., Minarik, W.G., Stix, J., 2013. Magmatic recharge during the
formation and resurgence of the Valles caldera, New Mexico, USA: Evidence from
quartz compositional zoning and geothermometry. Journal of Petrology 54, 635-664.
Zeh, A., Stern, R.A., Gerdes, A., 2014. The oldest zircons of Africa-their U-Pb-Hf-O
isotope and trace element systematics and implications for Hadean to Archean crust-
mantle evolution. Precambrian Research 241, 203-230.

169
169
Fig. 4.1 Regional geological map (1:50 000) showing the distribution of the Nashwaak Granites and location of the Sisson Brook W-Mo-Cu deposit (modified after Smith and Fyffe, 2006a, b). Cambrian to Early Ordovician: ЄOTLgn - Trousers Lake Metamorphic Suite, ЄOKBmc, - Miramichi Group; Ordovician: OLCfi - Little Clearwater Brook Granite, OMKfi - McKiel Lake Granite, OPBD, OHLfc, OHLmv, OTUls, OTM, OHL - Tetagouche Group; Silurian: SCRfc, SBUmc, STRmc, SSMfc, SBOGii; Devonian: DHfia - Hawkshaw Granite, DBLmi - Becaguimec Lake Gabbro, DHPii - Howard Peak Granodiorite, DNWfia - Nashwaak biotite Granite, DNWfib - Nashwaak two-mica Granite, Carboniferous: CCLcc, CHRmv, CSNcc - Mabou Group, CMOmc - Pictou Group; ------- Fault.

170
170
Fig. 4.2 Scanning electron microscope-cathodoluminescence (SEM-CL) images of quartz from the Nashwaak Granite and dykes. In the two-mica granite: a) visible oscillatory zoning parallel to grain boundary (MBG5); b) homogeneous quartz with fractures (MBG5). In the biotite granite: c) homogenous quartz with fluids infiltration along fractures (BG3), d) oscillatory zoning (BG3). In dykes: e) cobweb and splatter texture defined as corrosion of quartz by magmatic-hydrothermal fluids along microfractures in biotite granitic dykes (BGD2); f) step zoning with resorption texture in the porphyry dyke (PD1).

171
171
Fig. 4.3 Trace element concentration of magmatic quartz analyzed by laser ablation inductively coupled plasma mass spectrometry (LA-ICPMS) (see Table 4.1).
Symbols: ◆ The Nashwaak two-mica granite, ■ The Nashwaak biotite Granite, ▲
Biotite granitic dyke, ▲ Aplitic dyke, ● Porphyry dyke.

172
172
Fig. 4.4 Cathodoluminescence (CL) images of representative zircons from a) Nashwaak two-mica granite, b) Nashwaak biotite granite, c) Biotite granitic dykes. Circles indicate the location of ion microprobe analysis spots, δ18O values are beside each circle (‰, VSMOW).

173
173
Fig. 4.5 Grain-scale variation plot of zircons from the Nashwaak Granite and related dykes. The δ18O values of zircons from different oxygen isotope reservoirs are from Valley et al. (1998, 2005), Bindeman and Valley (2001); Valley (2003); Kind et al. (2008); Bindeman (2008) and the references therein.
Fig. 4.6 Plot of Al/Ti and Ge/Ti in quartz versus Zr*106/TiO2 in whole rock geochemical analyses (see Chapter 3). See Fig. 4.3 for symbols.

174
174
Fig. 4.7 Crystallization temperature of magmatic quartz from Nashwaak Granite and dykes calculated by the Ti-in-quartz geothermometer according to the Ti concentration in quartz (see Wark and Watson, 2006). Three sets of calculations based on assumed activity of Ti in melts are shown, i.e. aTi = 0.5, 0.6 and 1; at the same of Ti content in quartz, calculated temperatures increase with decreasing aTi. See Table 4.1 for data and Fig. 4.3 for symbols.

175
175
Table 4.1 Trace element concentration ranges (ppm) of quartz from the Nashwaak two-mica granite (MBG), biotite granite (BG), biotite granitic dykes (BGD), and a porphyry dyke (PD), measured by laser ablation-inductively coupled plasma mass spectrometry (LA-ICPMS).
MBG6 BG6 BGD2 BGD17 PD1
Min. Max. Min. Max. Min. Max. Min. Max. Min. Max.
Li <1.05 4.76 <0.48 3.55 <0.67 2.45 <1.37 13.5 6.50 16.1
Be <0.21 0.04 <0.08 0.14 <0.24 3.63 <0.27 1.66 <0.36 0.72
B <12.9 27.0 7.30 14.7 6.90 18.4 <14.26 25.8 <10.6 14.6
Na <3.70 824 4.16 142 5.30 6700 2.80 23300 <3.65 7600
Mg 0.08 75.6 0.18 27.1 0.09 7.50 0.14 69.0 0.42 197
Al 50.7 1290 42.3 454 29.5 11100 42.3 30000 84.7 26800
P <10.0 36.5 <5.31 10.9 <6.36 11.2 <13.1 8.00 <10.3 18.9
Cl 67 595 77.0 257 84.0 345 84.0 1220 44.0 350
K <1.45 761 2.25 230 <0.79 289 <2.23 174 <1.78 23400
Ca <608 0.00 <342 420 <430 7300 <844 0.00 <682 680
Ti 19.3 63.7 14.7 51.0 6.91 21.8 8.91 34.0 42.1 106
Cr 5.49 8.50 4.60 6.14 5.10 5.63 5.50 8.20 5.42 6.54
Mn <2.89 79.9 <0.95 64.0 <1.16 7.90 <4.18 4.00 <2.69 15.4
Fe <8.50 9290 5.00 459 <5.75 90.0 <10.8 310 <9.52 720
Ge 0.82 1.19 0.27 1.25 0.51 2.97 <0.54 1.96 <0.56 1.01
Rb <0.25 5.45 <0.16 1.60 <0.15 2.44 <0.28 1.14 <0.30 98.0
Sr <0.03 1.76 0.03 0.57 0.01 60.0 <0.05 28.1 <0.04 40.4
Sn <0.10 0.88 <0.05 0.44 <0.07 0.25 <0.10 4.00 <0.11 0.42
Ba <0.27 3.83 <0.22 1.49 <0.15 3.40 <0.47 1.31 <0.34 415
n 12 11 9 11 13
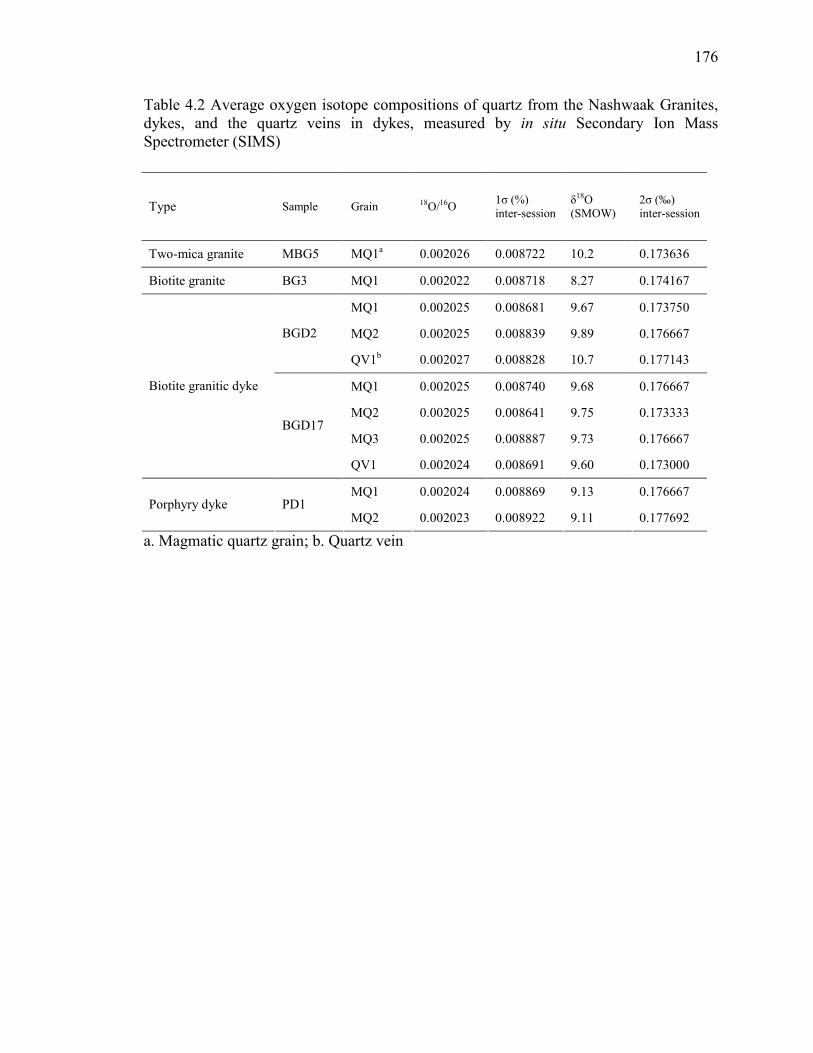
176
176
Table 4.2 Average oxygen isotope compositions of quartz from the Nashwaak Granites, dykes, and the quartz veins in dykes, measured by in situ Secondary Ion Mass Spectrometer (SIMS)
Type Sample Grain 18O/16O 1σ (%) inter-session
δ18O (SMOW)
2σ (‰) inter-session
Two-mica granite MBG5 MQ1a 0.002026 0.008722 10.2 0.173636
Biotite granite BG3 MQ1 0.002022 0.008718 8.27 0.174167
MQ1 0.002025 0.008681 9.67 0.173750
MQ2 0.002025 0.008839 9.89 0.176667 BGD2
QV1b 0.002027 0.008828 10.7 0.177143
MQ1 0.002025 0.008740 9.68 0.176667
MQ2 0.002025 0.008641 9.75 0.173333
MQ3 0.002025 0.008887 9.73 0.176667
Biotite granitic dyke
BGD17
QV1 0.002024 0.008691 9.60 0.173000
MQ1 0.002024 0.008869 9.13 0.176667 Porphyry dyke PD1
MQ2 0.002023 0.008922 9.11 0.177692
a. Magmatic quartz grain; b. Quartz vein

177
177
Table 4.3 Oxygen isotope compositions of zircon from the Nashwaak two-mica granite (MBG), biotite granite (BG), and biotite granitic dyke (BGD), detected by in situ Secondary Ion Mass Spectrometer (SIMS)
Sample 18
O/16
O 1σ (%) inter-session δ18
O (SMOW) 2σ (‰) inter-session
Two-mica granite
MBG5_33c 0.00201997 0.0095 7.4 0.19
MBG5_33r 0.00201889 0.0095 6.8 0.19
MBG5_30c 0.00201993 0.0092 7.3 0.18
MBG5_30r 0.00201503 0.0097 4.9 0.19
MBG5_31c 0.00202261 0.0095 8.7 0.19
MBG5_31r 0.00201114 0.0109 3.0 0.22
MBG5_35c 0.00201885 0.0087 6.8 0.17
MBG5_37c 0.00201777 0.0082 6.3 0.16
MBG5_41c 0.00201826 0.0098 6.5 0.20
MBG5_41r 0.00201637 0.0089 5.6 0.18
MBG5_42r 0.00202012 0.0112 7.4 0.22
MBG5_50c 0.00201965 0.0088 7.2 0.18
MBG5_51c 0.00201840 0.0093 6.6 0.19
MBG5_56r 0.00201697 0.0091 5.9 0.18
MBG5_58c 0.00202233 0.0089 8.5 0.18
MBG5_58r 0.00201598 0.0098 5.4 0.20
MBG5_57c 0.00202513 0.0112 9.9 0.22
MBG5_7c 0.00201748 0.0083 6.1 0.17
MBG5_2c 0.00201568 0.0095 5.2 0.19
MBG5_2r 0.00201758 0.0105 6.2 0.21
MBG5_12c 0.00201249 0.0085 3.6 0.17
MBG5_12r 0.00201432 0.0096 4.6 0.19
Biotite granite
BG3_1c 0.00202011 0.0093 7.4 0.19
BG3_2c 0.00201905 0.0087 6.9 0.17
BG3_2r 0.00201954 0.0092 7.1 0.18
BG3_3c 0.00201920 0.0102 7.0 0.20
BG3_4c 0.00201979 0.0095 7.3 0.19
BG3_5c 0.00201876 0.0104 6.8 0.21
BG3_5r 0.00201936 0.0104 7.1 0.21
BG3_6c 0.00201968 0.0097 7.2 0.19
BG3_7c 0.00201874 0.0096 6.8 0.19
BG3_7r 0.00201821 0.0085 6.5 0.17

178
178
Sample 18
O/16
O 1σ (%) inter-session δ
18O (SMOW)
2σ (‰) inter-session
biotite granite
BG3_8c 0.00201945 0.0101 7.1 0.20
BG3_9c 0.00201944 0.0091 7.1 0.18
BG3_10c 0.00201916 0.0094 7.0 0.19
BG3_11c 0.00201369 0.0093 4.2 0.19
BG3_12c 0.00201928 0.0096 7.0 0.19
BG3_13c 0.00201956 0.0122 7.2 0.24
BG3_14c 0.00201920 0.0093 7.0 0.19
BG3_14r 0.00201950 0.0112 7.1 0.22
BG3_15c 0.00201870 0.0093 6.7 0.19
BG3_15r 0.00201792 0.0096 6.3 0.19
biotite granitic dykes
BGD2_1c 0.00201963 0.0087 7.2 0.17
BGD2_3c 0.00202464 0.0097 9.7 0.19
BGD2_4c 0.00201902 0.0080 6.9 0.16
BGD2_5c 0.00201504 0.0080 4.9 0.16
BGD2_6c 0.00202074 0.0086 7.8 0.17
BGD2_7c 0.00202066 0.0095 7.7 0.19
BGD2_7r 0.00201823 0.0093 6.5 0.19
BGD2_8c 0.00202017 0.0096 7.5 0.19
BGD2_9c 0.00202022 0.0106 7.5 0.21
BGD2_10c 0.00201936 0.0094 7.1 0.19
BGD2_10r 0.00201881 0.0086 6.8 0.17
BGD2_11c 0.00201962 0.0092 7.2 0.18
BGD2_12c 0.00201898 0.0087 6.9 0.17
BGD2_12r 0.00201622 0.0086 5.5 0.17
BGD2_13c 0.00202427 0.0082 9.5 0.16
BGD2_15c 0.00201919 0.0094 7.0 0.19
BGD2_15r 0.00201886 0.0090 6.8 0.18
BGD2_16c 0.00201914 0.0090 7.0 0.18
BGD2_17c 0.00201896 0.0084 6.9 0.17
BGD2_17r 0.00201716 0.0080 6.0 0.16
BGD2_18c 0.00201759 0.0085 6.2 0.17
BGD2_18r 0.00201577 0.0090 5.3 0.18
BGD2_19c 0.00201998 0.0098 7.4 0.20
BGD2_19r 0.00201947 0.0092 7.1 0.18
BGD2_20c 0.00201976 0.0084 7.3 0.17
BGD2_21c 0.00201896 0.0094 6.9 0.19

179
179
Sample 18
O/16
O 1σ (%) inter-session δ
18O (SMOW)
2σ (‰) inter-session
biotite granitic dykes
BGD2_22c 0.00201964 0.0096 7.2 0.19
BGD2_23c 0.00201607 0.0087 5.4 0.17
BGD2_24c 0.00201908 0.0086 6.9 0.17
BGD2_25c 0.00201612 0.0098 5.4 0.20
S0081
S0081_1 0.00201496 0.0097 4.87 0.19
S0081_2 0.00201489 0.0100 4.83 0.20
S0081_3 0.00201488 0.0098 4.83 0.20
S0081_4 0.00201449 0.0097 4.63 0.19
S0081_5 0.00201455 0.0085 4.66 0.17
S0081_6 0.00201481 0.0096 4.79 0.19
S0081_7 0.00201471 0.0093 4.74 0.19
S0081_8 0.00201505 0.0092 4.91 0.18
S0081_9 0.00201498 0.0085 4.87 0.17
S0081_10 0.00201480 0.0096 4.79 0.19
S0081_11 0.00201503 0.0088 4.90 0.18
S0081_12 0.00201481 0.0093 4.79 0.19
S0081_13 0.00201480 0.0084 4.79 0.17
S0081_14 0.00201481 0.0082 4.79 0.16
S0081_15 0.00201467 0.0098 4.72 0.20
S0081_16 0.00201478 0.0099 4.78 0.20
S0081_17 0.00201463 0.0095 4.70 0.19
S0081_18 0.00201496 0.0083 4.86 0.17
S0081_19 0.00201483 0.0088 4.80 0.18
S0081_20 0.00201462 0.0096 4.70 0.19
S0081_21 0.00201494 0.0090 4.86 0.18
S0081_22 0.00201501 0.0081 4.89 0.16
S0081_23 0.00201493 0.0116 4.85 0.23

180
180
Chapter 5 Geochemical characteristics of biotite from felsic intrusive
rocks around the Sisson Brook W-Mo-Cu deposit, west-central New
Brunswick: an indicator of halogen and oxygen fugacity of magmatic
systems
Abstract
The Sisson Brook W-Mo-Cu deposit was formed by hydrothermal fluids likely
related to the Nashwaak Granite that consists of two pluton subfacies (muscovite-biotite
granite (Group I) and biotite granite (Group II)) and two dyke phases (Group III biotite
granitic dykes) and a feldspar-biotite-quartz porphyry dyke (Group IV). Primary
magmatic biotites in these granites were selected for major and trace element analysis
respectively by electron microprobe analysis (EMPA) and laser ablation-inductively
coupled plasma mass spectrometry (LA-ICPMS) in order to investigate magmatic
processes and associated hydrothermal fluids.
The composition of these biotites indicates that the Nashwaak Granite and dykes
were formed in a subduction and/or collisional setting with ~6% initial water content in
magmas assuming that melting takes place at moderate crustal depth (4 – 8 kb, 400 – 800
MPa). Compared with I-type granitoids of the Sierra Nevada and Peninsular Range
Batholiths, the biotite granite pluton (Group II) and dykes (Group III and IV) are similar
in origin indicated by that they are weakly to moderately contaminated I-type granites
with oxygen fugacity above the QFM buffer, although the muscovite-biotite granite
(Group I) is strongly contaminated I-type granite with reduced signature.

181
181
Trace element features of biotite in Group I two-mica granite suggest more
magmatic processes than a simple fractional crystallization. K/Rb ratios and compatible
elements (Cr, Ti, Co, V, and Ba) in biotite from other groups decreases, whereas
incompatible elements including Ta, Tl, Ga, Cs, and Li increase with magma
fractionation. No correlation of W and Sn with K/Rb ratios is evident, suggesting that
partitioning of W and Sn into biotite may have not been mainly controlled by
fractionation.
Halogen fugacity of the parental magma of the Nashwaak Granite and dykes,
calculated from zircon saturation temperature, shows that Group I has high fHF/fCl ratio
(between 0 and 1), similar to the plutons at the Henderson porphyry Mo deposit. The
fHF/fCl ratios of the other groups range from -1 to 0, comparable to the Santa Rita
porphyry Cu deposit. The fH2O/fHCl and fH2O/fHF ratios inferred from biotite in the
Nashwaak Granite and dykes are from 3 to 5 and from 4 to 5, respectively. In the
Nashwaak Granites, the dykes have an oxygen fugacity around the nickel-nickel oxide
buffer. The plutonic phases crystallized from a reduced to an oxidized condition, which
could be caused by H2 release at or near H2O vapour saturation at high H2O/Fe2+.
According to the halogen and oxygen fugacity of the related fluids, the magma associated
with the biotite dykes (Group III) is the plausible source of the hydrothermal fluids at the
Sisson Brook deposit since it has the similar F/Cl as that of W-Sn-Be systems (i.e.,
CanTung tungsten deposit) and was formed in an oxidized setting, which is necessary for
Mo to concentrate in the late stage fluids.

182
182
Key words: biotite mineral chemistry; LA-ICPMS, Sisson Brook W-Mo deposit,
halogen fugacity; oxygen fugacity
5.1 Introduction
The Sisson Brook W-Mo-Cu deposit, situated in west-central New Brunswick, is
hosted by the Cambro-Ordovician volcanic and sedimentary rocks of the Miramichi and
Tetagouche groups (Fig. 5.1). Rennie (2012) defined this deposit as an intrusion-related,
structurally controlled, bulk tonnage tungsten-molybdenum deposit whose hydrothermal
features are generally similar to porphyry copper deposits. The Sisson Brook deposit is
similar to other W-Mo deposits in New Brunswick, such as the Mount Pleasant (W-Mo-
Bi and Sn-Zn-In, ca. 370 Ma, Re-Os molybdenite; Thorne et al., 2013), Burnthill (W-Mo-
Sn), and Lake George (Sb-Au and W-Mo, ca. 412 Ma, U-Pb zircon) deposits, as they are
genetically linked to magmatic hydrothermal fluids exsolved from felsic batholiths and
intrusions formed during the Acadian Orogeny. These granitoids are metaluminous to
peraluminous and have transitional I-type to A-type granite signatures, which are
enriched in incompatible elements and are generally evolved (> 65% SiO2). Enrichment
of these metallic elements may have resulted from a combination of crystal fractionation
followed by aqueous phase saturation and separation, suggested by field and petrographic
evidence (e.g., miarolitic cavities, myrmekite) (Tucker et al., 1998; McLeod et al., 2003;
Yang et al., 2008).
Chemical composition of magmatic biotite is sensitive to chemical and physical
factors associated with crystallization of the magma and also to exsolved hydrothermal
fluids (Siahcheshm et al., 2012). The interlayer cations (K+, Na+, Ca2+, Ba+, and Cs+) in
biotite crystals could be leached out by later hydrothermal fluids and alteration processes

183
183
(e.g., chloritization); the octahedral layer (Al6+, Mg2+, Fe2+, Fe3+, Li+, Ti4+, Mn2+, Zn2+,
Cr3+, and V3+) and tetrahedral layer cations (Si4+ and Al4+) are controlled by complex
substitution mechanisms at different P-T-X conditions of a melt (magma) (Fleet, 2003).
Abdel-Rahman (1994, 1996) suggested that the MgO, FeO, and Al2O3 contents of biotite
are related to bulk composition of their host rocks. Munoz (1984, 1992) showed the
FeO/(FeO+MgO) ratio of biotite is affected by oxygen fugacity (fO2) of the system,
which is a critical factor controlling partition behaviour of W and Mo. In muscovite- and
fluorite-free granitoid rocks, biotite contains between 70 and 90% of the F and Cl in the
hydroxyl site with the remainder in apatite, amphibole and titanite (Speer, 1984).
Chemical equilibrium between biotite and hydrothermal fluids percolating through the
rock in the late stages of crystallization makes it possible to calculate the halogen
composition of the fluids using composition of biotite (Zhu and Sverjensky, 1991, 1992).
This method has been used to study the fluid composition of porphyry Cu (Mo, Au)
deposits (Loferski and Ayuso, 1995; Selby and Nesbitt, 1997, 2000; Idrus et al., 2007;
Ayati et al., 2008), intrusion-related Au deposits (Coulson et al., 2001; Yang and Lentz,
2005; Saravanan et al., 2009), and tungsten deposits (van Middelaar and Keith, 1990;
Rasmussen and Mortensen, 2013). In this chapter, petrogenesis of various granitic units
in the Sisson Brook area and related hydrothermal fluid characteristics (i.e., halogen ratio,
oxygen fugacity) will be investigated by comparing the determing compositions of biotite
in each of the rock units.
5.2 Geological setting
The rocks in the vicinity of the Sisson Brook deposit consist of a thick sequence of
Cambro-Ordovician continental and marine volcanic and sedimentary rocks and younger

184
184
mafic and felsic intrusive rocks (Nashwaak Granite, Howard Peak granodiorite and
gabbro) (Fig. 1).
The oldest rocks are quartzose wackes interbedded with siltstones and shales of the
Cambrian-Early Ordovician Miramichi Group, which occur in the core of a north-
northeast-trending, southerly plunging anticline in the area (Lutes, 1981). These rocks are
bound to the east and west by younger volcanic and sedimentary rocks of the Ordovician
Tetagouche Group (Fig. 5.1). To the west, the Miramichi Group rocks are in fault contact
with felsic crystal tuffs, mafic tuffs, and clastic sedimentary rocks of the Ordovician
Turnbull Mountain Formation, and to the east, they are overlain unconformably by black
shales, flow-banded felsic volcanic rocks and fragmental mafic volcanic rocks of the
Ordovician Hayden Lake Formation.
The oldest intrusive pluton in the Sisson Brook area is the Howard Peak Granodiorite
dated at 432.1±1.9 Ma using U-Pb titanite geochronology (Bustard, 2013). This
granodiorite is dark grey, medium- to coarse-grained, moderately to highly foliated, and
consists of plagioclase and amphibole. Partial biotitization and chloritization are
common, which reflect intrusion of the Nashwaak Granite on its west margin. The
Howard Peak Granodiorite grades eastward into, and becomes intermixed with dark grey,
medium-grained ophitic gabbro. Its eastern contact with the Turnbull Mountain
Formation is a vertical fault (Fyffe et al., 2008).
The Nashwaak Granite is one of many unfoliated Acadian granites in the Central
Plutonic Belt of New Brunswick. The granite forms an oblong pluton with an area of 250
km2, extending from Spruce Peak northwards to McKiel Brook. On its east side, the
Nashwaak Granite intrudes the Miramichi Group, Tetagouche Group, and the Howard

185
185
Peak Granodiorite. Andalusite and cordierite are present in sedimentary rocks up to 2 km
from the contact. This constrains the level of exposure to approximately 10 km. To the
north, it intrudes the Cambro-Ordovician Trousers Lake Metamorphic Suite, which
contains sillimanite within 1 km of the contact with the Ordovician McKiel Lake Granite.
To the west, the intrusive contact with the Becaguimec Lake Gabbro can be seen at the
type locality. The contact between the granite and Early Devonian volcanic rocks to the
south is not exposed, but is likely intrusive. The Nashwaak Granite has two subfacies: (1)
pink, coarse- to medium-grained, equigranular to subporphyritic biotite granite with a
mineral assemblage of plagioclase, orthoclase, quartz, and minor biotite, that grades
northward into (2) muscovite-biotite granite. In drill core, foliated, silicified and
greisenized granite dykes containing xenoliths of gabbro crosscut the Howard Peak
Granodiorite.
A grey, massive, unfoliated granite porphyry dyke was intersected in drill hole
SSN26. The granite porphyry contains about 50% phenocrysts set in a fine-grained
groundmass of alkali feldspar and quartz. The phenocryst population includes about 25%
zoned plagioclase laths (An34-An15) up to 1 cm in length; 10% euhedral quartz crystals
from 1 to 7 mm in width; 8% biotite laths from 0.05 to 1 cm in length; and 7% alkali
feldspar crystals from 0.2 to 1 cm in width (Mann, 1980; Nast, 1985; Nast and Williams-
Jones, 1991). A U-Pb age of 364.5±1.8 Ma from zircon was obtained from this dyke
(Fyffe et al., 2008).
The Sisson Brook deposit has three mineralized zones (Fig. 5.2), in which Zone I and
Zone II are structurally controlled and over tens of metres in width and a hundred metres
along strike. They contain W and Cu, but no significant Mo. Zone III contains the main

186
186
W and Mo resource for the Sisson Brook deposit. The newest mineral resource estimate
shows this deposit has 387 Mt of ore grading 0.067% WO3 and 0.021% Mo in the
measured plus indicated category, and 187 Mt of ore grading 0.05% WO3 and 0.02% Mo
in inferred category (Rennie, 2012).
5.3 Source of data, specimens and analytical methods
In fresh or least-altered Nashwaak Granites and related dykes, three samples of two-
mica granite, four samples of biotite granite, five samples of biotite granitic dykes, and
one sample of porphyry dyke, were selected for the biotite analysis by electron
microprobe at the University of New Brunswick. The samples were analyzed using a 15
kV accelerating voltage, 10 nA beam current, and a maximum 40s counting interval. The
analysis was conducted in wavelength-dispersion mode on a JXA JEOL-733 probe,
equipped with dQant32 and dSpec automation from Geller Microanalytical Laboratories.
Halogen elements F, and Cl of biotite from different groups were determined by EPMA.
These samples were then analyzed at the same spots in each grain by laser ablation-
inductively coupled plasma mass spectrometry (LA-ICPMS) which was conducted using
a Resonetics M-50-LR 193nm Excimer laser ablation system coupled to an Agilent
7700x quadrupole ICP-MS also at the University of New Brunswick. The analysis used
64 µm beam size, 4.5 Hz pulse rate, 4 J/cm2 energy. The SiO2 content of each spot
measured by electron probe microanalyser (EPMA) was used with an internally-
standardized data reduction scheme in order to obtain the most accurate trace element
data (Appendix Table 7). The GOR128-G glass was used as the reference material in
order to confirm the precision and accuracy of the results of the LA-ICPMS analysis. The
relative standard deviations (%RSD) for the most of trace elements in GOR128-G are

187
187
lower than 4%. Some low content elements ( generally <1 ppm) have larger RSD
showing as 6.52% for Rb, 7.17% for Ba, 13.9% for Cs, 18.6% for Ta, 12.7% for Mo,
24.2% for Sn (See Appendix Table 8). The relative deviations for trace elements of
unknows are generally within 10% (see Appendix Table 8). Detailed analysis results and
limits of detection are in Appendix Table 9 and 10. Formula calculation of biotite is
based on 22 atoms of oxygen by the EPMA data. Water contents were calculated by
stoichiometry (cf. Yang and Lentz, 2005).
5.4 Petrography
The studied samples can be grouped based upon their geological occurrences and
mineral assemblages. Group I is muscovite-biotite phase of the Nashwaak Granite that is
fine- to coarse-grained, seriate textured, and is characterized by the presence of biotite
with variable muscovite contents. Biotite is euhedral to anhedral, containing mineral
inclusions of zircon and apatite. Apatite also occurs in feldspar with moderate to high
relief and low birefringence (Fig. 5.3a). Microcline with predominantly patchy tartan
twins is present. Plagioclase displays typical polysynthetic twinning and/or Carlsbad
twins. Some small earlier formed plagioclase with altered cores (not resorbed) and K-
feldspar rims are contained in large perthite (Fig. 5.3b). Large euhedral crystals of
plagioclase are zoned and are altered along the boundary of each growth zone (Fig. 5.3c).
Group II is biotite phase of the Nashwaak Granite, which is medium- to coarse-
grained. Biotite is abundant (approximately 20%) in the samples of Group II, associated
with accessory minerals consisting of zircon, apatite, monazite, magnetite, and ilmenite.
Zircon and apatite commonly occur in biotite clusters. Biotite inclusions are also found in
large quartz grains (Fig. 5.3d). Anhedral quartz and alkali feldspar intergrowth formed

188
188
granophyre texture suggests water saturation during crystallization (Fig. 5.3e; Yang and
Lentz, 2005). Microcline with tartan twins is common. Plagioclase with altered cores and
magmatic rims are present inside microcline or between quartz and feldspar grains,
similar to that observed in the muscovite-biotite Nashwaak Granite (Group I).
Group III includes biotite granitic dykes crosscuts the Howard Peak diorite-gabbro
observed in drill core. These dykes range from several cm up to 12.2 m in width,
generally exhibiting sharp contacts with the host although locally, irregular with angles
from 20° to 80° to the core axis (holes drilled at a dip angle of 45° with few at 55°). The
dyke samples are generally light greenish grey, medium- to coarse-grained, anhedral
inequigranular and unfoliated. This group generally has the same mineral composition as
the biotite granite with the exception of some secondary minerals (i.e., pyrite and
chalcopyrite). Biotite is altered to chlorite (± titanite) along their rims and cleavages.
Unaltered or relatively fresh biotite is anhedral and is in contact with plagioclase that
shows albite twins and Carlsbad twins (Fig. 5.3f). Magmatic, anhedral quartz is more
abundant than in the Group II samples, and exhibits evidence of dynamic
recrystallization.
Group IV is a quartz-biotite-feldspar porphyry dyke that was intersected from 13.6 to
54.6 m in drillhole SSN-26. In this dyke sample, phenocrysts consist of approximately
23% plagioclase up to 1 cm across, 10% quartz up to 7 mm across, 8% biotite up to 0.3
mm in length, and 7% K-feldspar (0.2 to 1.0 cm in width). Quartz phenocrysts are
skeletal and exhibit a resorbed texture (Fig. 5.3g). Plagioclase crystals are zoned and
some have albite twins. The biotite is euhedral and some have slight alteration along their
rims (Fig. 5.3h).

189
189
5.5 Biotite mineral chemistry
5.5.1 Biotite classification
It is critical to be sure that biotite grains analyzed are of primary magmatic origin, so
that their chemical composition may reflect magmatic conditions of crystallization. The
Ti content of biotite is thermally controlled (Patino Douce, 1993; Stussi and Guney,
1996). Re-equilibrated and neoformed biotite grains, resulting from low temperature
hydrothermal alteration, have less Ti than that of primary magmatic biotite. Most of the
biotite from the Nashwaak Granites and related dykes plot in the primary biotite domain
defined by Nachit et al. (2005) with the TiO2 ranging from 1.76 to 4.55 wt%. The Ti
(apfu, atoms per formula unit) of the biotite from Group II (mean Ti = 0.41) and Group
IV (mean Ti = 0.46) are generally higher than that of the biotite from Group I (mean Ti =
0.31) and Group III (mean Ti = 0.29) (Fig. 5.4a, Table 5.1). Aluminum content of biotite
crystallized in equilibrium with a silicate melt reflects the peraluminosity of the melt
(Stussi and Cuney, 1996) and it is commonly the host for the excess Al in peraluminous
granitoids (Fleet, 2003). Therefore, biotite from the two-mica Nashwaak Granite (Group
I, whole rock aluminum saturation index >1.1) has higher Al (apfu>3.3) than that of
biotite from other groups (whole rock ASI<1.1) (Fig. 5.4d). In the International
Mineralogical Association (IMA) classification diagram, the most of the biotites plot
close to the siderophyllite-eastonite boundary (Rieder et al., 1998) with the Fe/(Fe+Mg)
ratio between 0.49 and 0.74 (Fig. 5.4c). Abdel-Rahman (1994) calculated the statistics on
the composition of biotite from various igneous rock types and found that biotites in
alkaline anorogenic suites are mostly iron-rich, biotites in peraluminous (including S-
type) suites are siderophyllitic in composition, and those in calc-alkaline, mostly

190
190
subduction-related orogenic suites are enriched in Mg. In the MgO-FeO+MnO-Al2O3
diagram (Fig. 5.4b), most of the biotites of Nashwaak Granites and related dykes plot on
the border between calc-alkaline and peraluminous suites. This conclusion is supported
by using plots of the inverse correlation between the Al and Mg a.p.f.u. contents of these
biotites (Nachit et al., 1985). Stussi and Cuney (1996) explained that the most
fractionated members of calc-alkaline magmas may become slightly to moderately
peraluminous although the origin of most peraluminous granites is known to be different.
5.5.2 Trace-element characteristics
Tischendorf et al. (1997, 2001) investigated the trace elements (Ti, Sn, Sc, V, Cr, Ga,
Mn, Co, Ni, Zn, Sr, Ba, Rb, Cs) in micas of the system phlogopite-annite-siderophyllite-
polylithionite (PASP) and divided the micas into seven varieties by the parameter mgli
(=octahedral Mg minus Li). However, if the Ba, Mg, Fe, Ni, Co, Sc, V, Cr, Ti, Be/Rb and
K/Rb all decrease in biotite, whereas Li, Rb, Cs, Tl, Be, Sn and Fe/Mg increase in biotite
with magmatic fractionation as suggested by Gordiyenko (1975) and Gordiyenko and
Leonova (1976), then the parameter mgli may be substituted by K/Rb indicating the
magma evolution as it decreases with fractionation.
The K/Rb ratios of biotite from the Nashwaak Granites and related dykes have a
good linear relationship with their Mg-Li (moles) and decrease gradually from porphyry
dykes (Group IV, 176 to 219), to the biotite granite (Group II, 85 to 142), the biotite
granitic dykes (Group III, 94 to 105), and two-mica granite (Group I, 41 to 105) (Table
5.2, Appendix Table 10, Fig. 5.5). The same trend is observed for the compatible
elements (in felsic rocks) Cr (17 to 93 ppm), Ti (1.22 to 2.83 wt.%), Co (20 to 53 ppm),
V (57 to 416 ppm), and Ba (30 to 2366 ppm) in Group II, III, and IV. Group I deviates

191
191
slightly from this trend with Cr contents values between 75 to 137 ppm, Ti from 1.06 to
1.43 wt.%, Co from 27 to 38 ppm, V between 147 and 245 ppm, and Ba of 189 to 783
ppm. Nickel in those biotites is scattered and ranges from 6 ppm to 47 ppm. The
incompatible elements, Ta (2-61 ppm), Tl (2-11 ppm), Ga (42-152 ppm), Cs (7-557
ppm), and Li (94-771 ppm), show a reverse distribution pattern and increase continuously
from the porphyry dykes, to biotite granite, biotite granitic dykes, and two-mica granite.
Scandium is enriched in Group III (51-116 ppm) relative to the other groups (26-58
ppm). Tin concentrates in highly evolved groups and is up to 150 ppm in Group III. The
concentration of other metallic elements, such as Zn (238-1380 ppm) and Cu (1-17 ppm),
are independent of K/Rb. Tungsten in all groups is lower than 6 ppm, and Mo is lower
than 2 ppm (Fig. 5.5, Table 5.2).
5.6 Biotite halogen chemistry
Most (70 to 90%) of the F content of muscovite- and fluorite-free granitoid rocks is
contained in biotite (Grabezkev et al., 1979), with the remainder being in apatite and
titanite. The F contents of biotites from the Nashwaak Granites and related dyke samples
are similar, and range from 0.11 to 0.83 wt.%. In contrast, because ionic radius of Cl- is
larger (1.81 Å) than that of F- (1.31 Å) or OH- (1.38 Å) (Munoz, 1984), the amount of Cl
substitution in the OH site is less, and vary between 0.01 and 0.28 wt.% in these biotites.
The extent of halogen replacement of hydroxyl in biotite is governed by its Mg/Fe ratio.
Biotites with high Mg/Fe ratios tend to incorporate more F, and low Mg/Fe biotites
contain more Cl, as noted by Munoz (1984). This correlation is caused by the crystal-
chemical effect known as ‘F-Fe avoidance” and “Mg-Cl avoidance” (Munoz, 1984). In
order to calculate relative degree of halogen enrichment in biotite, intercept values,

192
192
IV(F), IV(Cl), and IV(F/Cl), were developed by Munoz (1984) that have been corrected
by the effect of Mg/Fe ratios, and are given by the following equations
IV(F) = 1.52Xphl + 0.42Xann + 0.20Xsid - log(XF/XOH)
IV(Cl) = -5.01 - 1.93Xphl - log(XCl/XOH)
IV(F/Cl) = IV(F) - IV(Cl)
Where Xphl=Mg/sum of octahedral cations; Xsid=[(3 - Si/Al)/1.75](1-Xphl); Xann = 1 -
(Xphl + Xsid). The smaller intercept value representing higher enrichment degree of
halogen in biotites.
The biotite from the two-mica granite is distinct from the other groups by its low
IV(F) (1.51 to 2.16, mean = 1.7) and high IV(Cl) (-3.59 to -2.13, mean = -2.8). The
IV(F), IV(Cl), and IV(F/Cl) of biotite from other groups of samples are between 1.76 and
2.64, -4.11 and -2.71, and 3.93 and 6.51, respectively. The diagram of IV(F/Cl) and IV(F)
shows that they have a positive correlation (i.e., IV(F/Cl) decreases with decreasing
IV(F) (Fig. 5.6). Loferski and Ayuso (1995) explained that this trend was caused by
crystal fractionation processes during which F concentrates in the late stage magma
resulting in smaller IV(F). The F/Cl intercept values for biotites from porphyry copper
deposits, Mo-W-Sn-Be deposits (excluding Henderson) and the Henderson porphyry
molybdenum deposit were plotted against IV(F) by Munoz (1984). In this diagram,
biotite from Group I and Group II have less F enrichment (high IV(F)). The overlap of
the IV(F/Cl) of biotite between Group III and IV and that of Sn-W-Be deposit indicates
that the magma or fluids that were in equilibrium with those biotites had similar
f(HCl)/f(HF) fugacity ratio (Table 5.1, Appendix Table 7).

193
193
5.7 Halogen fugacity of associated fluids
Fluorine and chlorine contents in biotite may used to calculate the halogen fugacity
in associated magma or fluids (Munoz, 1984, 1992; van Middelaar and Keith, 1990;
Loferski and Ayuso, 1995; Selby and Nesbitt, 1998, 2000; Yang and Lentz, 2005; Ayati
et al, 2008; Boomeri et al., 2009, 2010). Calculations can be made in terms of the
following equations proposed by Munoz (1992) based on the revised coefficients for F-
Cl-OH partitioning between biotite and the hydrothermal fluid (Zhu and Sverjensky,
1991, 1992).
Log (fH2O/fHF)fluid = 1000/T (2.37+1.1Xphl) + 0.43 - log(XF/XOH)biotite
Log (fH2O/fHCl)fluid = 1000/T (1.15-0.55 Xphl) + 0.68 - log(XCl/XOH)biotite
Log (fHF/fHCl)fluid = -1000/T (1.22+1.65 Xphl)+ 0.25 + log(XF/XCl)biotite
where XF, XCl, and XOH are mole fractions of F, Cl, and OH in the hydroxyl site of
biotite. T is equilibrium temperature (in Kelvin) which could be estimated by the Xphl and
XPDoxy (Fe3+/sum of octahedral ions) of the hydrothermal biotites (Beane, 1974) or by the
Ti content of biotite from graphitic, peraluminous metapelites, which contain ilmenite or
rutile (Henry et al., 2005). However, for biotite from igneous rocks, Yang and Lentz
(2005) calculated oxygen fugacity of the associated magmas by using zircon-, apatite-,
and (or) monazite-saturation temperatures (Watson and Harrison, 1983; Harrison and
Watson, 1984; Montel, 1993). The zircon saturation temperatures of the Nashwaak
Granite and related dykes are from 677 to 814 °C, and thus calculated log(fH2O/fHF),
log(fH2O/fHCl), and log(fHF/fHCl) ratios of magmatic fluids in equilibrium with magma
based on the equations mentioned above are shown in Fig. 5.7. The fluids of Group I
have higher F as indicated by its higher log(fHF/fHCl) ratio (mean = 0.21), lower

194
194
log(fH2O/fHCl) (mean = 4.32), and lower log(fH2O/fHF) (mean = 4.12) than that of the
other groups. The fluids associated with Group II have similar or slightly higher
log(fH2O/fHF) (mean= 4.39), log(fH2O/fHCl) (mean = 4.04), and log(fHF/fHCl) (mean =
-0.35) than those fluids associated with Group III. The fluids associated with Group IV
have the log(fH2O/fHF) ratios of 4.14 to 4.36, log(fH2O/fHCl) of 3.44 to 3.9, and
log(fHF/fHCl) of -0.7 to -0.37. These fluids are relatively water-rich (more than 3 orders
of magnitude relative to halogen fugacity) and Cl-rich (log(fHF/fHCl) broadly between -1
and 0), and are similar to the fluid composition associated with biotites from the
porphyry-Cu deposits at Santa Rita, New Mexico, U.S.A (Munoz and Swenson, 1981).
One exception is the fluids of Group I, which have a log(fHF/fHCl) ratios higher than 0.
Furthermore, the log (XF/XOH) vs. XFe and log (XCl/XOH) vs. XMg plots of the biotites
formed under the same T, P, and fluid composition would form linear trends (Zhu and
Sverjensky, 1992). These linear trends are not observed for the biotite related to the
Nashwaak Granites and dykes. The variation of halogen fugacity calculated by their
zircon saturation temperature, and the scatter of the log (XF/XOH) vs. XFe and log
(XCl/XOH) vs. XMg plots, could be explained by that these biotites have been continually
equilibrated with fluids over a range of temperatures and of fluid composition. This is
typical for magmatic fluids during cooling of granite intrusions (i.e temperature
dropping) and solidification, manifested by that fHF/fHCl ratios of magmatic fluids may
progressively increase (Yang and Lentz, 2005).
5.8 Oxygen fugacity
Oxygen fugacity (fO2) exerts a control on the partitioning behaviour of Mo and W
between ferromagnesian phases and melts, and on relative efficiencies of removal of

195
195
these metals from the magmas into associated ore-forming fluids. Ore systems with high
W/Mo ratios are relatively reduced, whereas systems with low W/Mo are oxidized
(Candela and Bouton, 1990). Blevin and Chappell (1992) explained that during
fractionation of magma, W and Mo are sequestered by Fe-Ti phases whose stability is
normally fO2-dependent. Molybdenum is associated with oxidized felsic granites
(Mengason et al., 2011), but W shows little dependence on magma redox conditions.
However, besides the Fe3+/Fe2+ ratio of whole rocks, the Fe3+/Fe2+ ratio of biotite is also
used to constrain oxygen fugacity of the associated magma system. Shabani et al. (2003)
investigated the composition of biotites from the Gander zone of New Brunswick, which
falls on or above nickel-nickel oxide (NNO) buffer in the Fe3+-Fe2+-Mg diagram of
Wones and Eugster (1965). Wones and Eugster (1965) found biotite crystallizing from a
magma that contains sanidine and magnetite may follow either an iron-rich trend or a
magnesium-rich trend depending upon the fO2 conditions during crystallization over
cooling. Thus, the total Fe and Mg ratio of biotite is another useful tool as a quantitative
estimate of fO2 instead of Fe3+ and Fe2+, which cannot be measured directly by EMPA. In
the fO2 vs. T diagram (Fig. 5.8), biotites in Group I and II samples are plotted below the
quartz-fayalite-magnetite (QFM) buffer at high temperature, and increase above the
nickel-nickel oxide buffer with cooling of magmas. The increase of fO2 during magma
evolution may attributed to H2 release at or near H2O vapour saturation at high H2O/Fe2+
(cf. Candela, 1986a; Lentz, 1992). The biotite from the dykes (Group III and IV) plot
around the nickel-nickel oxide buffer, indicating that these dykes formed at relatively
higher oxygen fugacity than that of plutonic phases (Groups I and II). The oxygen
fugacity of all the samples is generally between 10-13 and 10-16 bars at between 700 and

196
196
800 °C estimated from zircon saturation geothermometer (Watson and Harrison, 1983).
In these samples, the fO2 values of Group I is comparable with that of strongly
contaminated reduced I-type granites of Ague and Brimhall (1988a, b), whereas the fO2
of the other Groups are close to oxidized I-type granites (Ague and Brimhall, 1988a, b;
Candela, 1989b).
On the other hand, magnetic susceptibility meter (KT-10) measurements (n=3 for
each sample) yielded average values that lie along the boundary of the magnetite series
and ilmenite series granites (1×10⁻⁴ emu/g; Ishihara, 1981). This result is in accordance
with the findings of Shabani et al. (2003), who demonstrated that the magnetite/ilmenite
ratio in granites varies considerably in the Gander Zone of New Brunswick.
5.9 Discussion
5.9.1 Petrogenetic implications
On the ∑Al-Mg diagram of Nachit et al. (1985) and MgO-∑FeO-Al2O3 diagram of
Abdel-Rahman (1994), biotites from the Nashwaak Granite and related dykes are located
in the peraluminous and calc-alkaline fields, likely formed in a subduction and/or
collisional setting. This conclusion is supported by their whole rock geochemistry with
low Nb, Rb, and Y contents indicating an arc setting (Pearce, 1984). Also, this is
consistent with the viewpoint of Whalen (1993) who suggested that the Siluro-Devonian
granitic rocks have mixed volcanic-arc to within-plate signatures. In these granites,
negative correlation between Al and Mg of biotite are controlled by different substitution
mechanisms as shown by Abdel-Rahman (1994), Stussi and Cuney (1996) and Fleet
(2003). Average Al content is lower in biotite in calc-alkaline granites than that in
peraluminous granites because of lower activity of Al2O3 in calc-alkaline magmas.

197
197
Almost all the F present in the continental crust resides in granitoids and felsic to
intermediate metamorphic rocks. Thus, F contents in granitoids may be related to the
nature of magma sources and the nature of the melting process. Whether F behaves as an
incompatible or compatible element in magmas depends on whether the resultant
magmatic rocks contain anhydrous or hydrous mineral assemblages (Sallet, 2000). Ague
and Brimhall (1988a, b) studied regional variations in bulk chemistry and mineralogy in
the batholiths of California. In those I-type granitoids, the F/OH value of biotite increases
with degree of crustal contamination and the biotites in strongly reduced I-type granitoids
are enriched in iron. However, Loferski and Ayuso (1995) investigated the biotite
composition from the Maine plutons that does not display a systematic regional variation.
Compared to the biotite composition of I-type granitoid rocks in the Sierra Nevada
batholith (California) (Ague and Brimhall, 1988a, b), the Nashwaak Ganites and related
dykes plot along the border between oxidized and reduced I-type granites with weak to
medium crustal contamination. The crustal contribution to the Nashwaak granitoids and
related dykes as shown by the whole-rock δ18O (9.3-10.9‰), εNd(T) (-4.51 to -1.42), and
the 206Pb/204Pb, 207Pb/204Pb, 208Pb/204Pb values of 18.3, 15.6, and 38.3, respectively
(Ayuso and Bevier, 1991), implys that the Nashwaak granitoids originated from
infracrustal sources (Bevier and Whalen, 1990; Whalen, 1993). Whalen et al. (1996)
interpreted those granitic magmas to be derived from bulk assimilation of
Mesoproterozoic Gondwanan basement ± the overlying Gander Zone sedimentary prism,
by enriched asthenospheric mantle-derived melts. In Fig. 5.9, the value of log (XMg/XFe)
= -0.21 was chosen as the dividing line between the reduced and oxidized rocks because
of absence of muscovite, garnet, and tourmaline and the presence of titanite at higher

198
198
values of log (XMg/XFe) in these granites. Ague and Brimhall (1988b) calculated oxygen
fugacity based on the representative conditions of 800 °C and 3 kb for the batholiths of
California and this border is between the CO2-CH4 and QFM buffers. The Nashwaak
granitoids and related dykes crystallized at temperatures lower than 800 °C and the line
of log (XMg/XFe) = -0.21 moves closer to or above the QFM buffer according to this
diagram (Fig. 5.8). Thus, some of the points in the I-SCR area might represent the
oxidized I-type granites.
5.9.2 Metallogenic implication of volatiles
5.9.2.1 Water content in melts
Water is a major volatile in natural aluminosilicate melts, and controls the chemical
and physical properties of magmas, such as phase relationships, viscosity, density and
diffusivity (Holtz et al., 2001). In ore deposit related melts, water content influences
hydrothermal evolution behaviour as shown by the model of Burnham (1979) and
William-Jones and Heinrich (2005), because water promotes the segregation of metal
elements from the melt to ore fluids (Candela, 1989a). Water content in granitic melts
could be estimated using the method developed by Holtz et al. (2001) if the initial
temperature and pressure are known. However, temperature estimation by using zircon
saturation thermometer (Watson and Harrison, 1983) indicates that the Nashwaak
Granites and related dykes are ‘cold’ granites (TZr<800 °C) as defined by Miller et al.
(2003). The presence of inherited zircons in these magmas shows that zircon is saturated
and thus TZr could represent the initial magma temperature at the source (Miller et al.,
2003). At moderate crustal depths (equivalent to lithostatic pressures of 4 – 8 kb), the
melts forming the Nashwaak Granites and dykes contain ~6% water in the P-T-H2O

199
199
diagram of Holtz et al. (2001). This estimated water content is slightly higher than that of
magmas resulted in scheelite skarn granitoids ranging from 2% to 4% as suggested by
Newberry and Swanson (1986). Candela (1989a, b) suggested that the ratio of the initial
water concentration to the saturation water concentration in the melt is the important
parameter when calculating the proportion of any given ore metal removed from the
magma into an ore fluid. W (Mo) deposits usually have lower ratios than that of porphyry
Cu deposits, since W (Mo) behaves as incompatible elements and enrichment of these
elements needs a significant amount of crystallization before water content is increased to
the saturation level. This could explain why large W skarn deposits are related to deep
emplacement of H2O-poor magmas (Newberry and Swanson, 1986; Keith et al., 1989;
van Middelaar and Keith, 1990; Newberry, 1998; Rasmussen et al., 2011). In the H2O-
poor system, HF has essentially the same effect per unit mass as H2O on melting relations
according to the model of Burnham (1979), this suggests that magmas produced by
partial melting of a source region with a high F/H2O ratio will be impoverished in water,
and will therefore experience a protracted crystallization history before vapour evolution,
allowing W, Mo, and other incompatible elements to concentrate in the melt (e.g.,
Climax-type Mo deposits) relative to compatible elements such as copper (Candela
1989b). For the Nashwaak Granites and related dykes, the water cannot be derived from
dehydration melting of biotite and/or hornblende since the temperature is too low
(TZr<800 °C) (Patino Douce and Harris, 1998) and therefore, fluid influx would be
required.

200
200
5.9.2.2 Implication of halogen elements
Experiments of W and Mo partitioning behaviour between melt and fluid show that
the majority of dissolved tungsten species in hydrothermal solutions occur as tungstates
and have the forms H2WO4, HWO- 4, and WO-2
4 (Candela and Holland, 1984; Keppler
and Wyllie, 1991; Wood and Samson, 1998, 2000;). Molybdenum tends to be more easily
reduced in nature than tungsten. Besides the similar species of H2MoO4, HMoO- 4, and
MoO-2 4 as tungsten in the fluids, the MoO2+ and Mo(OH)3+ also possibly formed under
reducing conditions (Wood and Samson, 1998; Rempel et al., 2009). Molybdenum oxy-
chloride complexes (i.e., MoO2Cl+) might only be present at very acid conditions
(Bernard et al., 1990; Yokoi et al., 1993). These experiments suggest that tungsten or
molybdenum -chloride or –fluoride is not required to transport significant W and Mo to
form an ore deposit (Candela and Holland, 1984; Eugster, 1985; Wood and Vlassopoulos,
1989; Keppler and Wyllie, 1991; Gilbert et al., 1992; Wood, 1992; Wood and Samson,
1998, 2000).
Although partition behaviour of W and Mo is not affected by halogen elements, the
ratio of F, Cl, and H2O in the magma system are still worthwhile to be discussed since
they could be the W (Mo) mineralization vectors (Candela, 1989b; Rasmussen and
Mortensen, 2013). The I-type magmas of the Nashwaak Granite and dykes were derived
from partial melting of lower crust, which could be the seismically defined Central
Crustal Block that underlies the area. Partial melting of dehydrated protolith (i.e.,
granulite-grade metamorphic rocks) would be rather rich in F in the remaining hydrous
minerals (Holloway, 1977; Burt, 1981; Ague and Brimhall, 1988a, b; Loferski and
Ayuso, 1995). During the early stage of magma differentiation, chlorine is strongly
201
201
partitioned into fluid over melt when the volatile phase exsolves, whereas the fluorine
displays the opposite behaviour partitioning into minerals in the melt (Rasmussen and
Mortensen, 2013). Thus, the Cl/F and H2O/F decrease with magma differentiation
accompanied by volatile release from the magma system (Candela, 1986b; Christiansen
and Keith, 1996; Lang, 1998; Piccoli et al., 1999; Piccoli and Candela, 2002; Webster,
1997a, b). This is typical for porphyry Cu systems where early vapour saturation with
low degree of crystallization allows compatible element Cu to gain access to the
magmatic aqueous phase. Late stage vapour evolution and accompanying crystallization
favors the portioning of melt-compatible elements, such as W and Mo into the buoyant
and low viscosity ore forming aqueous fluids (Candela, 1989b). Chlorine and water
continue to accumulate in the fluids at early stages of magma evolution. Meanwhile, the
crystallization and removal of hydrous minerals will decrease the F in the melt since F is
compatible to these minerals. Thus, the Cl/F and H2O/F ratios of magma will increase at
the later stages of magma evolution (Rasmussen and Mortensen, 2013), and the high
HCl/HF, and H2O/HF ratios, therefore, could be tungsten mineralization vectors.
The Nashwaak Granite and dykes are all highly evolved granites that contain
hydrous minerals (biotite and apatite). The ratios of Cl/F and H2O/F do not have obvious
correlation with magma differentiation. Except for the two-mica granite (Group I), the
other groups of rocks have the log(fHCl/HF) larger than 0.0, and the log(fH2O/HF) larger
than 4.0 (Fig. 5.7). If these ratios are indicative of build-up of chlorine and water, and
might also W and Mo in the magma as Rasmussen and Mortensen (2013) suggested, the
biotite granite pluton and dykes are likely to relate to the mineralization of the Sisson
Brook deposit. Like other Mo-W-Sn-Be deposits elsewhere (Munoz, 1984), the F/Cl

202
202
ratios of biotites in the Nashwaak Granites and dykes are intermediate between the F-rich
biotites associated with the Henderson Mo deposit and the more Cl-rich biotites
associated with porphyry Cu deposits. This correlation might indicate that differentiation
degree of those magmas (Keith et al., 1989). Besides the halogen volatile composition,
the amount of water in the magma, the depth of emplacement, oxygen fugacity, and
timing of vapour exsolution are also important factors that influence W and Mo
mineralization processes. The halogen ratio of the magma alone might not provide
enough evidence to differentiate the fertile (productive) from barren granitoids (Zaw and
Clark, 1978; van Middelaar and Keith, 1990).
5.10 Conclusions
The Sisson Brook W-Mo-Cu deposit was formed by magmatic hydrothermal fluids
inferred to be related to one of the four phases of the Nashwaak Granite. These four
phases consist of two plutonic sub-facies (muscovite-biotite granite (Group I) and biotite
granite (Group II)), and two dyke phases (the biotite granitic dykes (Group III) and a
feldspar-biotite-quartz porphyry dyke (Group IV)). Primary magmatic biotites in these
granites were selected for major- and trace-element analysis respectively by EPMA and
laser ablation-inductively coupled plasma mass spectrometry (LA-ICPMS) in order to
investigate their magmatic evolution processes and composition of related fluids. The
whole rock geochemistry and composition of biotites within the Nashwaak Granite and
associated dykes indicate that they were formed in a subduction and/or collisional setting.
According to the classification of I-type granitoids of the Sierra Nevada and Peninsular
Range Batholiths (Ague and Brimhall, 1988a, b), the biotite granite pluton (Group II) and
dykes (Group III and IV) are similar to the weakly to moderately contaminated I-type

203
203
granite with the oxygen fugacity above the QFM buffer, whereas the muscovite-biotite
granite (Group I) is similar to strongly contaminated and reduced I-type granites.
The K/Rb ratio of biotite has similar behaviour as the parameter mgli (=octahedral
Mg minus Li) developed by Tischendorf et al. (1997, 2001) and decreases with magma
fractionation. The same trend is observed for compatible elements (in felsic rocks) Cr, Ti,
Co, V, and Ba in Group II, III, and IV, but Group I is slightly different from this trend.
Incompatible elements Ta, Tl, Ga, Cs, and Li show a reverse distribution pattern.
Interestingly, Ni is scattered in those groups. Partitioning of W and Sn into biotite is not
(or not entirely) controlled by magma fractionation as shown in the plot of K/Rb vs. W or
Sn, in no obvious correlation is evident. Molybdenum in these magmas is lower than 2
ppm.
Compared to Cl-rich magma systems related to porphyry Cu deposits, porphyry Mo
deposits are more enriched in F. The high F/Cl ratio of magma in porphyry Mo systems
could be inherited from their metamorphic source rocks or due to vapour exsolution
during magma evolution leaching the Cl out of the system. The calculated halogen
fugacity of magmas associated with the Nashwaak Granite and related dykes shows that
Group I has higher fHF/fCl than the other groups (between 0.0 and 1.0), similar to those
magmas associated with the Henderson porphyry Mo deposit. The other groups have the
log(fHCl/HF) larger than 0.0, and the log(fH2O/HF) larger than 4.0. These ratios are
indicative of build-up of chlorine and water as well as W and Mo in the magma
(Rasmussen and Mortensen, 2013), thus the biotite granite pluton and dykes are likely
responsible for mineralization of the Sisson Brook deposit. In these granites, Group III
has similar IV(F/Cl) to those granites typically associated with W-Sn-Be deposits as

204
204
investigated by Munoz (1984). This could be explained as they have similar fHF/fHCl
and/or they have similar degrees of magmatic differentiation. The Mo-W enrichment and
mineralization are likely to form from slightly oxidized magmas (Blevin and Champell,
1992), since Mo is more easily sequestered from the magma system in reduced settings
and W is less affected. In the Nashwaak Granite, the dykes have the oxygen fugacity
around the nickel-nickel oxide buffers. The pluton phases crystallized from a reduced to
oxidized setting, which could be caused by H2 release at or near H2O vapour saturation at
high H2O/Fe2+ (cf. Candela, 1986a; Lentz, 1992). Although several other vital factors
could control W and Mo mineralization, such as the ratio of initial water content to
saturation water content in the magma, emplacement depth, assimilation and fractional
crystallization process, the difference of those factors between each group is difficult to
determine. If only considering the halogen and oxygen fugacity interpreted from the
composition of biotite, the magmatic source of the biotite dykes (Group III) is the
plausible source of the hydrothermal fluids responsible for the Sisson Brook deposit
mineralization since it has the similar F/Cl to that of W-Sn-Be systems (Munoz, 1984)
(i.e., CanTung tungsten deposit; see van Middelaar and Keith, 1990), and formed in an
oxidized setting, which is critical to concentrate Mo in the late stage fluids.
References
Abdel-Rahman, A.F.M., 1994. Nature of biotites from alkaline, calc-alkaline, and
peraluminous magmas. Journal of Petrology 35, 525-541.
Abdel-Rahman, A.F.M., 1996. Discussion on the comment on nature of biotites in
alkaline, calc-alkaline and peraluminous magmas. Journal of Petrology 37, 1031-

205
205
1035.
Ague, J.J., Brimhall, G.H., 1988a. Regional variations in bulk chemistry, mineralogy, and
the compositions of mafic and accessory minerals in the batholiths of California.
Geological Society of America Bulletin 100, 891-911.
Ague, J.J., Brimhall, G.H., 1988b. Magmatic arc asymmetry and distribution of
anomalous plutonic belts in the batholiths of California: Effects of assimilation,
crustal thickness, and depth of crystallization. Geological Society of America
Bulletin 100, 912-927.
Ayati, F., Yavus, F., Noghreyan, M., Haroni, H.A., Yavuz, R. 2008. Chemical
characteristics and composition of hydrothermal biotite from the Dalli porphyry
copper prospect, Arak, central province of Iran. Mineralogy and Petrology 94, 107-
122.
Ayuso, R.A., Bevier, M.L., 1991. Regional differences in lead isotopic compositions of
feldspars from plutonic rocks of the northern Appalachian mountains, U.S.A. and
Canada: a geochemical method of terrane correlation. Tectonophysics 10, 191-212.
Beane, R.E., 1974. Biotite stability in the porphyry copper environment. Economic
Geology 69, 241-256.
Bernard, A., Symonds, R.B., JR Rose, W.I., 1990. Volatile transport and deposition of
Mo, W and Re in high temperature magmatic fluids. Applied Geochemistry 5, 317-
326.
Bevier, M.L., Whalen, J.B., 1990. Tectonic significance of Silurian magmatism in the
Canadian Appalachians. Geology 18, 411-414.

206
206
Blevin, P.L., Chappell, B.W., 1992. The role of magma sources, oxidation states and
fractionation in determining the granite metallogeny of eastern Australia. Royal
Society of Edinburgh Transactions, Earth Sciences 83, 305-316.
Boomeri, M., Nakashima, K., Lentz, D.R., 2009. The Miduk porphyry Cu deposit,
Kerman, Iran: A geochemical analysis of the potassic zone including halogen
element systematics related to Cu mineralization processes. Journal of Geochemical
Exploration 103, 17-29.
Boomeri, M., Nakashima, K., Lentz, D.R., 2010. The Sarcheshmeh porphyry copper
deposit, Kerman, Iran: A mineralogical analysis of the igneous rocks and alteration
zones including halogen element systematics related to Cu mineralization processes.
Ore Geology Reviews 38, 367-381.
Brimhall, G.H., Crerar, D.A., 1987. Ore fluids: Magmatic to supergene. In
Thermodynamic Modeling of Geological Materials: Minerals, Fluids and Melts.
Edited by Carmichael, I.S.E. and Eugster, H.P., Reviews in Mineralogy 17, 235-322.
Burnham, C.W., 1979. Magmas and hydrothermal fluids. In Geochemistry of
Hydrothermal Ore Deposits, 2nd edition. Edited by Barnes, L.H., John Wiley &
Sons, New York, 71-136.
Burt, D.M., Bikun, J.V., Christiansen, E.H., 1982. Topaz rhyolites- distribution, origin,
and significance for exploration. Economic Geology 77, 1818-1836.
Candela, P.A., 1986a. The evolution of aqueous vapour from silicate melts: effect of
oxygen fugacity. Geochimica et Cosmochimica Acta 50, 1205-1211.
Candela, P.A., 1986b. Toward a thermodynamic model for the halogens in magmatic
systems: an application to melt-vapour - apatite equilibria. Chemical Geology 57,

207
207
289-301.
Candela, P.A., 1989a. Magmatic ore-forming fluids: Thermodynamic and mass transfer
calculations of metal concentrations. In Ore Deposition Associated with Magmas.
Edited by Whitney, J.A. and Naldrett, A.J., Reviews in Economic Geology 4, 203-
220.
Candela, P.A., 1989b. Felsic magmas, volatiles, and metallogenesis. In Ore Deposition
Associated with Magmas. Edited by Whitney, J.A. and Naldrett, A.J., Reviews in
Economic Geology 4, 223-233.
Candela, P.A., Bouton, S.L., 1990. The influence of oxygen fugacity on tungsten and
molybdenum partitioning between silicate melts and ilmenite. Economic Geology
85, 633-640.
Candela, P.A., Holland, H.D., 1984. The partitioning of copper and molybdenum between
silicate melts and aqueous fluids. Geochimica et Cosmochimica Acta 48, 373-380.
Christiansen, E.H., Keith, J.D., 1996. Trace element systematics in silicic magmas: A
metallogenic perspective. In Trace Element Geochemistry of Volcanic Rocks:
Applications for Massive Sulphide Exploration. Edited by Wyman, D.A., Geological
Association of Canada, Short Course Notes 12, 115-151.
Coulson I.M., Dipple, G.M., Raudsepp, M., 2001. Evolution of HF and HCl activity in
magmatic volatiles of the gold-mineralized Emerald Lake pluton, Yukon Territory,
Canada. Mineralium Deposita 36, 594-606.
Eugster, H.P., 1985. Granites and hydrothermal ore deposits: A geochemical framework.
Mineralogical Magazine 49, 7-23.
Fleet, M.E., 2003. Rock-Forming minerals, 2nd edition. Volume 3A: Micas. The

208
208
Geological Society of London, 325-585.
Fyffe, L.R., Thorne, K.G., Dunning, G.R., Martin, D.A., 2008. U-Pb geochronology of
the Sisson Brook granite porphyry, York County, West-central New Brunswick. In
Geological Investigations in New Brunswick for 2007. Edited by Martin, G.L., New
Brunswick Department of Natural Resources. Minerals, Policy and Planning
Division, Mineral Resource Report 2008-1, 35-54.
Gilbert, F., Moine, B., Schott, J., Dandurand, J,L., 1992. Modeling of the transport and
deposition of tungsten in the scheelite-bearing calc-silicate gneisses of the Montagne
Noire, France. Contributions to Mineralogy and Petrology 112, 371-384.
Gordiyenko, V.V., 1975. Geochemistry of the processes of pegmatite formation and
muscovite generation. In Muscovite Pegmatites of the U.S.S.R., Nauka, Leningrad,
107-117 (In Russian).
Gordiyenko, V.V., Leonova, V.A., 1976. Mica-bearing Pegmatites of Northern Karelia.
Leningrad (Nedra) (In Russian).
Grabezkev, A.I., Vigorova, V.G., Chashukhina, V.A., 1979. Behaviour of fluorine during
crystallization of granites (in connection with validation of the criteria of granite
specialization). Geochemistry International, 1979, 23-33.
Harrison, T.M., Watson, E.B., 1984. The behaviour of apatite during crustal anatexis:
equilibrium and kinetic considerations. Geochimica et Cosmochimica Acta 48,
1467-1477.
Henry, D.J., Guidotti, C.V., Thomson, J.A., 2005. The Ti-saturation surface for low-to-
medium pressure metapelitic biotites: Implications for geothermometry and Ti-
substitution mechanisms. American Mineralogist 90, 316-328.

209
209
Holloway, J.R., 1977. The effect of fluorine on dehydration equilibria. Geological
Society of America, Abstracts with Programs 9, 1021.
Holtz, F., Johannes, W., Tamic, N., Behrens, H., 2001. Maximum and minimum water
contents of granitic melts generated in the crust: A reevaluation and implications.
Lithos 56, 1-14.
Idrus, A., Kolb, J., Meyer, F.M., 2007. Chemical composition of rock-forming minerals in
copper-gold-bearing tonalite porphyries at the Batu Hijau deposit, Sumbawa Island,
Indonesia: Implications for crystallization conditions and fluorine-chlorine fugacity.
Resource Geology 57, 102-113.
Ishihara, S., 1981. The granitoid series and mineralization. In: Skinner, B.J. (Eds),
Economic Geology, Seventy-fifth anniversary volume, 458-484.
Jochum, K.P., Stoll, B., Herwig, K., Willbold, M., Hofmann, A.W., Amini, M., Aarburg,
S., Abouchami, W., Hellebrand, E., Mocek, B., Raczek, I., Stracke, A., Alard, O.,
Bouman, C., Becker, S., Dücking, M., Brätz, H., Klemd, R., de Bruin, D., Canil, D.,
Cornell, D., de Hoog, C.J., Dalpé, C., Danyushevsky, L., ´ Eisenhauer, A., Gao, Y.,
Snow, J.E., Groschopf, N., Gunther, D., Latkoczy, C., Guillong, M., Hauri, E.H.,
Hӧfer, H.E., Lahaye, Y., Horz, K., Jacob, D.E., Kasemann, S.A., Kent, A.J.R.,
Ludwig, T., Zack, T., Mason, P.R.D., Meixner, A., Rosner, M., Misawa, K., Nash,
B.P., Pfänder, J., Premo, W.R., Sun, W.D., Tiepolo, M., Vannucci, R., Vennemann,
T., Wayne, D., Woodhead, J.D., 2006. MPI-DING reference glasses for in situ
microanalysis: New reference values for element concentrations and isotope ratios.
Geochemistry Geophysics Geosystems 7, 1-44.

210
210
Keith, J.D., van Middelaar, W., Clark, A.H., Hodgson, C.J., 1989. Granitoid textures,
compositions, and volatile fugacities associated with the formation of tungsten-
dominated skarn deposits. In Ore deposition associated with magmas. Edited by
Whitney, J.A., Naldrett, A.J., Reviews in Economic Geology 4, 235-250.
Keppler, H., Wyllie, P.J., 1991. Partitioning of Cu, Sn, Mo, W, U, and Th between melt
and aqueous fluid in the systems haplogranite-H2O-HCl and haplogranite-H2O-HF.
Contributions to Mineralogy and Petrology 109, 139-150.
Lang, J.R., 1998. Halogen composition of biotite and apatite in Jurassic and Laramide
intrusions, southern Arizona: implications for discriminating between barren and
productive intrusions. Mineral Deposit Research Unit Magmatic-hydrothermal
Project, Second Annual Technical Report, 10.2-10.29.
Lentz, D.R., 1992. Petrogenesis and geochemical composition of biotites in rare-element
granitic pegmatites in the Southwestern Grenville Province, Canada. Mineralogy
and Petrology 46, 239-256.
Loferski, P.J., Ayuso, R.A., 1995. Petrography and mineral chemistry of the composite
Deboullie pluton, northern Maine, U.S.A.: Implications for the genesis of Cu-Mo
mineralization. Chemical Geology 123, 89-105.
Lutes, G., 1981. Geology of Deersdale–Head of Nashwaak River map area J-17 and
Upper parts of Nashwaak River–McBean and Sister Brooks, map area J-18. New
Brunswick Department of Natural Resources; Mineral Resources, Map Report 81- 4,
26.
Mann, R., 1980. Report on diamond drilling at Sisson Brook. Unpublished company
report, Kidd Creek Mines Ltd., Fredericton, New Brunswick, 36.

211
211
McLeod, M.J., Johnson, S.C., Krogh, T.E., 2003. Archived U-Pb (zircon) dates from
southern New Brunswick. Atlantic Geology 39, 209-225.
Mengason, M.J., Candela, P.A., Piccoli, P.M., 2011. Molybdenum, tungsten and
manganese partitioning in the system pyrrhotite-Fe-S-O melt-rhyolite melt: Impact
of sulfide segregation on arc magma evolution. Geochimica et Cosmochimica Acta
75, 7018-7030.
Miller, C.F., McDowell, S.M., Mapes, R.W., 2003. Hot and cold granites? Implications
of zircon saturation temperatures and preservation of inheritance. Geology 31, 529-
532.
Montel, J.M, 1993. A model for monazite/melt equilibrium and application to the
generation of granitic magmas. Chemical Geology 110, 127-146.
Munoz, J.L., 1984. F-OH and Cl-OH exchange in micas with applications to
hydrothermal ore deposits. Reviews in Mineralogy and Geochemistry 13, 469-493.
Munoz, J.L., 1992. Calculation of HF and HCl fugacities from biotite compositions:
revised equations. Geological Society of American, Abstracts with Programs 24,
221.
Munoz, J.L., Swenson, A., 1981. Chloride-hydroxyl exchange in biotite and estimation of
relative HCl/HF activities in hydrothermal fluids. Economic Geology 76, 2212-
2221.
Nachit, H., Ibhi, A., Abia, E.H., Ohoud, M.B., 2005. Discrimination between primary
magmatic biotites, reequilibrated biotites and neoformed biotites. Comptes Rendus
Geoscience 337, 1415-1420.
Nachit, H., Razafimahefa, N., Stussi, J.-M., Caron, J.-P., 1985. Composition chimique des

212
212
biotites et typologie magmatique des granitoïdes. Comptes Rendus Hebdomadaires
de l’Academic des Sciences 301, 813–818.
Nast, H.J., 1985. The geology and petrochemistry of the Sisson Brook W-Cu–Mo
deposit, New Brunswick. Unpublished M.Sc. thesis, McGill University, Montreal,
Quebec, 192 P.
Nast, H.J., Williams-Jones, A.E., 1991. The role of water–rock interaction and fluid
evolution in forming the porphyry–related Sisson Brook W–Cu–Mo deposit, New
Brunswick. Economic Geology 86, 302-317.
Newberry, R.J., 1998. W- and Sn-skarn deposits: A 1998 status report. In Mineralized
Intrusion-related Skarn systems. Edited by Lentz, D.R., Mineralogical Association
of Canada Short Course Series 26, 289-336.
Newberry, R.J., Swanson, S.E., 1986. Scheelite skarn granitoids: An evalution of the
roles of magmatic source and process. Ore Geology Reviews 1, 57-81.
Patiño Douce, A.E., 1993. Titanium substitution in biotite: an empirical model with
applications to thermometry, O2 and H2O barometries, and consequences for biotite
stability. Chemical Geology 108, 133-162.
Patiño Douce, A.E., Harris, N., 1998. Experimental constraints on Himalayan anatexis.
Journal of Petrology 39, 689-710.
Pearce, J.A., Harris, N.B.W., Tindle, A.G., 1984. Trace element discrimination diagrams
for the tectonic interpretation of granitic rocks. Journal of Petrology 25, 956-983.
Piccoli, P.M., Candela, P.A., 2002. Apatite in igneous systems. Reviews in Mineralogy
and Geochemistry 48, 255-292.
Piccoli, P.M., Candela, P.A., Williams, T.J., 1999. Estimation of aqueous HCl and Cl

213
213
concentrations in felsic systems. Lithos 46, 591- 604.
Rasmussen, K.L., Lentz, D.R., Falck, H., 2011. Felsic magmatic phases and the role of
late-stage aplitic dykes in the formation of the world-class Cantung Tungsten skarn
deposit, Northwest Territories, Canada. Ore Geology Reviews 41, 75-111.
Rasmussen, K.L., Mortensen, J.K., 2013. Magmatic petrogenesis and the evolution of
(F:Cl:OH) fluid composition in barren and tungsten skarn-associated plutons using
apatite and biotite compositions: Case studies from the northern Canadian
Cordillera. Ore Geology Reviews 50, 118-142.
Rempel, K.U., Williams-Jones, A.E., Migdisov, A.A., 2009. The partitioning of
molybdenum (VI) between aqueous liquid and vapour at temperatures up to 370 °C.
Geochimica et Cosmochimica Acta 73, 3381-3392.
Rennie, D.W., 2012. Technical report on the Sisson Project, New Brunswick, Canada.
Roscoe Postle Associates INC, 7-1.
Rennie, D.W., Friedman, D., Gray, J., Bolu, M., Pozder, S., Greskovich, G., 2013.
Canadian National Instrument 43-101 technical report on the Sisson Project, New
Brunswick, Canada. Samuel Engineering INC. 1-278.
Rieder, M., Cavazzini, G., D’Yakonov, Y.S., Frank-Kamenetskii, V.A., Gottardi, G.,
Guoggenheim, S., Koval, P.V., Muller, G., Neiva, A.M.R., Radoslovich, E.W.,
Robert, J,L., Sssi, F.P., Takeda, H., Weiss, Z., Wones, D.R., 1998. Nomenclature of
the micas. The Canadian Mineralogist 36, 41–48.
Sallet, R., 2000. Fluorine as a tool in the petrogenesis of quartz-bearing magmatic
associations: applications of an improved F-OH biotite-apatite thermometer grid.
Lithos 50, 241-253.

214
214
Saravanan, C.S., Mishra, B., Jairam, M.S., 2009. P-T conditions of mineralization in the
Jonnagiri granitoid-hosted gold deposit eastern Dharwar Craton, south India:
Constraints from fluid inclusions and chlorite thermometry. Ore Geology Reviews
36, 333-349.
Selby, D., Nesbitt, B.E., 1998. Biotite Chemistry of the Casino Porphyry Cu-Mo-Au
Occurrence, Dawson Range, Yukon. In Yukon Exploration and Geology 1997;
Exploration and Geological Services Division, Yukon, Indian and Northern Affairs
Canada, 83-88.
Selby, D., Nesbitt, B.E., 2000. Chemical composition of biotite from the Casino porphyry
Cu-Au-Mo mineralization, Yukon, Canada: evaluation of magmatic and
hydrothermal fluid chemistry. Chemical Geology 171, 77-93.
Shabani, A.A.T., Lalonde, A.E., Whalen, J.B., 2003. Composition of biotite from granitic
rocks of the Canadian Appalachian Orogen: A potential tectonomagmatic indicator?
The Canadian Mineralogist 41, 1381-1396.
Siahcheshm, K., Calagari, A.A., Abedini, A., Lentz, D.R., 2012. Halogen signatures of
biotites from the Maher-Abad porphyry copper deposit, Iran: characterization of
volatiles in syn- to post-magmatic hydrothermal fluids. International Geology
Review 54, 1353-1368.
Smith, E.A., Fyffe, L.R., 2006a. Bedrock geology of the Coldstream area (NTS 21 J/06).
York and Carleton counties. New Brunswick. New Brunswick Department of
Natural Resources. Minerals, Policy and Planning Division. Plate 2006-7.

215
215
Smith, E.A., Fyffe, L.R., 2006b. Bedrock geology of the Napadogan area (NTS 21 J/07).
York and Carleton counties. New Brunswick. New Brunswick Department of
Natural Resources. Minerals, Policy and Planning Division. Plate 2006-8.
Spear, J.A., 1984. Micas in igneous rocks. Reviews in Mineralogy 13, 299-356.
Stussi, J.M., Cuney, M., 1996. Nature of biotites from alkaline, calc-alkaline and
peraluminous magmas by Abdel-Fattah M. Abdel-Rahman: A comment. Journal of
Petrology 37, 1025-1029.
Thorne, K.G., Fyffe, L.R., Creaser, R.A. 2013. Re-Os geochronological constraints on
the W-Mo mineralizing event in the Mount Pleasant Caldera Complex: implications
for the timing of subvolcanic magmatism and caldera development. Atlantic
Geology, 49, 131-150.
Tischendorf, G., 1997. On Li-bearing micas: estimating Li from electron microprobe
analyses and an improved diagram for graphical representation. Mineralogical
Magazine 61, 809-834.
Tischendorf, G., Förster, H.-J., Gottesmann, B., 2001. Minor- and trace-element
composition of trioctahedral micas: a review. Mineralogical Magazine 65, 249-276.
Tucker, R.D., Bradley, D.C., Ver Straeten C.A., Harris, A.G., Ebert, J.R., McCutcheon,
S.R., 1998. New U-Pb zircon ages and the duration and division of Devonian time.
Earth and Planetary Science Letters 158, 175-186.
Van Middelaar, W.T., Keith, J.D., 1990. Mica chemistry as an indicator of oxygen and
halogen fugacities in the CanTung and other W-related granitoids in the North
American Cordillera. In Ore-bearing granite systems; Petrogenesis and mineralizing
process. Edited by Stein, H.J. and Hannah, J.L., Geological Society of America

216
216
Special Paper 246, 205-220.
Watson, E.B., Harrison, T.M., 1983. Zircon saturation revisited: temperature and
composition effects in a variety of crustal magma types. Earth and Planetary Science
Letters 64, 295-304.
Webster, J.D., 1997a. Exsolution of magmatic volatile phases from Cl-enriched
mineralizing granitic magmas and implications for ore metal transport. Geochimica
et Cosmochimica Acta 61, 1017-1029.
Webster, J.D., 1997b. Chloride solubility in felsic melts and the role of chloride in
magmatic degassing. Journal of Petrology 38, 1793-1807.
Whalen, J.B., 1993. Geology, petrography and geochemistry of Appalachian granites in
New Brunswick and Gaspésie, Quebec. Geological Survey of Canada, Bulletin 436,
130 p.
Whalen, J.B., Jenner, G.A., Longstaffe, F.J., Hegner, E., 1996. Nature and evolution of
the eastern margin of Iapetus: geochemical and isotopic constraints from Siluro-
Devonian granitoid plutons in the New Brunswick Appalachians. Canadian Journal
of Earth Sciences 33, 140-155.
William-Jones, A.E., Heinrich, C.A., 2005. Vapour transport of metals and the formation
of magmatic-hydrothermal ore deposits. Economic Geology 100, 1287-1312.
Wones, D.R., Eugster, H.P., 1965. Stability of biotite: experiment, theory, and application.
The American Mineralogist 50, 1228-1272.
Wood, S.A., 1992. Experimental determination of the solubility of WO3 and the
thermodynamic properties of H2WO4(aq) in the range 300-600 °C at 1 kbar:
Calculation of scheelite solubility. Geochimica et Cosmochimica Acta 56, 1827-

217
217
1836.
Wood, S.A., Samson, I.M., 1998. Solubility of ore minerals and complexation of ore
metals in hydrothermal solutions. Reviews in Economic Geology 10, 33–80.
Wood, S.A., Samson, I.M., 2000. The hydrothermal geochemistry of tungsten in
granitoid environments: I. Relative Solubilities of Ferberite and Scheelite as a
function of T, P, pH, and mNaCl. Economic Geology 95, 143-182.
Wood, S.A., Vlassopoulos, D., 1989. Experimental determination of the hydrothermal
solubility and speciation of tungsten at 500 °C and 1 kbar. Geochimica et
Cosmochimica Acta 53, 303-312.
Yang, X.M., Lentz, D.R., 2005. Chemical composition of rock-forming minerals in gold-
related granitoid intrusions, southwestern New Brunswick, Canada: implications for
crystallization conditions, volatile exsolution, and fluorine-chlorine activity.
Contributions to Mineralogy and Petrology 150, 287-305.
Yang, X.M., Lentz, D.R., Chi, G.X. and Thorne, K.G., 2008. Geochemical characteristics
of gold-related granitoids in southwestern New Brunswick, Canada. Lithos 104,
355-377.
Yokoi, K., Matsubayashi, N., Miyanaga, T., Watanabe, I., Ikeda, S., 1993. Studies on the
structure of molybdenum (VI) in acidic solution by XANES and EXAFS.
Polyhedron 12, 911-914.
Zaw, U.K., Clark, A.H., 1978. Fluoride–hydroxyl ratios of skarn silicates, Cantung E-
zone scheelite orebody, Tungsten, Northwest Territories. The Canadian Mineralogist
16, 207-221.
Zhu, C., Sverjensky, D.A., 1991. Partitioning of F-Cl-OH between minerals and

218
218
hydrothermal fluids. Geochimica et Cosmochimica Acta 55, 1837-1858.
Zhu, C., Sverjensky, D.A., 1992. F-Cl-OH partitioning between biotite and apatite.
Geochimica et Cosmochimica Acta 56, 3435-3467.

219
219
Fig. 5.1 Regional geological map showing the distribution of the Nashwaak Granites (1:50 000) and location of the Sisson Brook W-Mo-Cu deposit (modified after Smith and Fyffe, 2006a, b). Cambrian to Early Ordovician: ЄOTLgn - Trousers Lake Metamorphic Suite, ЄOKBmc, - Miramichi Group; Ordovician: OLCfi - Little Clearwater Brook Granite, OMKfi - McKiel Lake Granite, OPBD, OHLfc, OHLmv, OTUls, OTM, OHL - Tetagouche Group; Silurian: SCRfc, SBUmc, STRmc, SSMfc, SBOGii; Devonian: DHfia - Hawkshaw Granite, DBLmi - Becaguimec Lake Gabbro, DHPii - Howard Peak Granodiorite, DNWfia - Nashwaak biotite Granite, DNWfib - Nashwaak two-mica Granite, Carboniferous: CCLcc, CHRmv, CSNcc - Mabou Group, CMOmc - Pictou Group; ------- Fault, ● location of pluton samples, dyke samples are from star area around the Sisson Brook W-Mo-Cu deposit (see Fig. 5.2).

220
220
Fig. 5.2 Geological map of the local area around the Sisson Brook W-Mo-Cu deposit (modified after Fyffe et al., 2008). DNW Devonian Nashwaak Granite, DHP Devonian Howard Peak Diorite, DG Devonian gabbro, OPB Ordovician Push and Be Damned Formation, OHL Ordovician Hayden Lake Formation, OTM Ordovician Turnbull Mountain Formation, ЄM Cambro-Ordovician Miramichi Group, Dash line - fault, F - City of Fredericton. Zone I, II, and II of the deposit are noted.

221
221
Fig. 5.3 Representative photomicrographs of texture and mineralogy of the Nashwaak Granite and related dykes. a) muscovite and biotite cluster with a nearby apatite, plagioclase with altered core and magmatic rim, sample MBG5, cross polarized light (XPL); b) plagioclase inclusion in perthite, sample MBG5, XPL; c) plagioclase with zoning, sample MBG5, XPL; d) biotite inclusion in quartz grain, sample BG1, XPL; e) granophyre texture, sample BG1, XPL; f) relative fresh anhydral biotite occur with plagioclase, sample BGD11, XPL; g) skeletal or resorbed quartz phenocryst, sample PD, XPL; h) zoned plagioclase and biotite phenocryst, sample PD, XPL.

222
222
Fig. 5.4 Chemical compositional diagram of biotite from the Nashwaak Granite and related dykes. a) Ternary TiO2-FeO+MnO-MgO diagram (modified after Nachit et al., 2005), b) Ternary MgO-FeO-Al2O3 diagram (modified after Abdel-Rahman, 1994), c) Fe/(Fe+Mg)-Al diagram (modified after Rieder et al., 1998), d) Al-Mg diagram (modified after Stussi and Cuney, 1996) of biotite from Nashwaak Granite and related dykes. ■ two mica granite (Group I), ◆ biotite granite (Group II), ▲ biotite granite dykes (Group III), ● porphyry dyke (Group IV).
a b
c d

223
223

224
224
Fig. 5.5 Trace-element composition (in ppm) of biotite from the Nashwaak Granite and related dykes analyzed by LA-ICPMS. See Fig. 5.4 for symbols.

225
225
Fig. 5.6 Intercept value IV(F/Cl) plots against IV(F) for biotite from the Nashwaak Granite and related dykes (modified after Munoz, 1984). See Fig. 5.4 for symbols.

226
226
Fig. 5.7 a) log (Cl/OH), log(F/OH), and log(Cl/F) vs. XMg for the biotite from the Nashwaak Granite and related dykes. in each diagram, the relative log(fH2O/fHCl), log(fH2O/fHF), and log(fHF/fHCl) reference lines are calculated at 750 °C. b) detailed log(fH2O/fHCl), log(fH2O/fHF), and log(fHF/fHCl) value of biotite from the Nashwaak Granite and relate dykes, these values were calculated based on their relative zircon saturation temperature (TZr) (Watson and Harrison, 1983). All the calculated formulas are from Munoz (1984, 1992). See Fig. 5.4 for symbols.
a
b

227
227
Fig. 5.8 Temperature vs. oxygen fugacity diagram for biotite from the Nashwaak Granite and related dykes (see Candela 1989). See Fig. 5.4 for symbols. Grey pattern denotes contaminated I-type granite. Blue pattern represents strongly contaminated reduced I-type granitoids (modified after Ague and Brimhall, 1988).
Fig. 5.9 Classification of the Nashwaak Granite and related dykes according to the composition of their magmatic biotite composition (after Ague and Brimhall, 1988a). For comparison purposes, the biotites related to the Mo- and W-porphyry deposits are also shown (modified after Brimhall and Crerar, 1987). I-SC, strongly contaminated I-type; I-MC, moderately contaminated I-type, I-WC, weakly contaminated I-type, I-SCR, strongly contaminated and reduced I-type. See Fig. 5.4 for symbols.

228
228
Table 5.1 Average chemical compositions of bioitite from Nashwaak Granites and dykes analyzed by electron probe microanalysis (EPMA)
Notes: Formula calculations are based on 22 oxygen, OH is calculated by OH=4-(Cl+F), Intercept value IV(F), IV(Cl) and halogen fugacity are calculated by Munoz (1984, 1992). Tzr were calculated by Watson and Harrison (1983). Complete data see Appendix Table 7.
Sample Two-mica granite Biotite granite Biotite granitic dykes Porphyry dyke No. of samples 3 4 4 1 No. of analyse spots 20 33 16 5 Av. 1σ Av. 1σ Av. 1σ Av. 1σ TZr (°C) 774 60 794 15 757 25 772 0 SiO2 33.2 2.31 33.6 1.57 35.1 2.16 34.9 0.83 TiO2 2.65 0.47 3.47 0.49 2.49 0.43 4.03 0.38 Al2O3 20.2 2.97 16.5 0.96 17.9 0.66 16.4 2.38 FeO 23.0 1.35 21.9 2.32 21.9 2.57 22.7 0.48 MgO 5.83 0.01 8.02 1.56 8.44 1.75 8.07 1.48 MnO 0.45 0.05 0.36 0.07 0.30 0.09 0.29 0.06 BaO 0.04 0.10 0.03 0.05 0.07 0.09 0.06 0.06 CaO 0.09 0.09 0.07 0.07 0.09 0.09 0.04 0.02 ZnO 0.09 0.07 0.06 0.03 0.04 0.03 0.03 0.03 K2O 8.89 0.56 9.30 0.89 7.68 1.92 8.78 0.47 Na2O 0.18 0.17 0.20 0.14 0.23 0.14 0.20 0.08 Rb2O 0.08 0.01 0.02 0.03 0.03 0.03 0.00 0.01 F 0.55 0.32 0.33 0.11 0.49 0.16 0.51 0.15 Cl 0.04 0.09 0.06 0.05 0.12 0.06 0.14 0.04 H2O 3.58 0.09 3.61 0.08 3.64 0.11 3.62 0.09 O=F -0.23 0.14 -0.14 0.05 -0.21 0.07 -0.22 0.06 O=Cl -0.01 0.02 -0.01 0.01 -0.03 0.01 -0.03 0.01 Total 98.6 1.80 97.3 1.50 98.4 3.05 99.7 0.65 Si 5.17 0.42 5.31 0.19 5.40 0.15 5.36 0.11 Al
IV 2.83 0.42 2.69 0.19 2.60 0.15 2.64 0.11
Tsite 8.00 0.00 8.00 0.00 8.00 0.00 8.00 0.00 Ti 0.31 0.06 0.41 0.06 0.29 0.05 0.46 0.04 Al
Vi 0.87 0.09 0.40 0.12 0.65 0.10 0.32 0.33
V 0.00 0.00 0.00 0.00 0.00 0.00 0.03 0.00 Fe 3.00 0.15 2.90 0.33 2.84 0.41 2.92 0.09 Mg 1.36 0.02 1.89 0.37 1.93 0.36 1.85 0.35 Mn 0.06 0.01 0.05 0.01 0.04 0.01 0.04 0.01 Zn 0.01 0.01 0.01 0.00 0.00 0.00 0.00 0.00 O site 5.60 0.16 5.66 0.13 5.75 0.25 5.63 0.11 Ca 0.02 0.01 0.01 0.01 0.02 0.02 0.01 0.00 K 1.77 0.09 1.88 0.18 1.50 0.34 1.72 0.08 Na 0.05 0.05 0.06 0.04 0.07 0.04 0.06 0.02 F 0.27 0.16 0.17 0.06 0.24 0.07 0.25 0.07 Cl 0.01 0.02 0.02 0.01 0.03 0.02 0.04 0.01 OH 3.72 0.13 3.82 0.05 3.73 0.07 3.71 0.09 Al 3.70 0.51 3.09 0.18 3.25 0.17 2.96 0.42 X Mg 0.24 0.01 0.33 0.06 0.34 0.06 0.33 0.06 X Sid 0.69 0.14 0.49 0.10 0.51 0.09 0.45 0.15 X An 0.06 0.13 0.18 0.05 0.15 0.04 0.22 0.10 IV(F) 1.70 0.31 2.07 0.25 1.90 0.17 1.87 0.06 IV(Cl) -2.80 0.56 -3.20 0.36 -3.52 0.27 -3.62 0.24 log(fH2O)/(fHf) 4.12 0.13 4.39 0.25 4.31 0.16 4.23 0.09 log(fH2O)/(fHCl) 4.32 0.60 4.04 0.30 3.75 0.24 3.64 0.19
log(fHf/fHCl) 0.21 0.73 -0.35 0.46 -0.56 0.25 -0.58 0.12

229
229
Table 5.2 Average content of trace elements in biotite from Nashwaak Granite and related dykes analyzed by the laser ablation-inductively coupled plasma mass spectrometry (LA-ICPMS).
Sample MBG Int. LOD BG Int. LOD BGD Int2SE LOD PD Int. LOD
wt%
Ti 1.28 0.03 0.89 1.66 0.03 1.21 1.41 0.03 2.50 2.56 0.07 8.94
Al 9.06 0.15 5.13 7.98 0.13 7.14 9.43 0.18 6.07 7.44 0.12 8.26
Fe 14.8 0.30 11.6 13.9 0.28 12.2 18.2 0.40 13.8 16.3 0.33 15.5
Mn 0.35 0.01 1.10 0.28 0.01 0.76 0.31 0.01 1.07 0.25 0.00 0.94
Mg 2.77 0.05 4.03 4.27 0.08 3.60 4.16 0.08 2.49 5.31 0.10 4.31
Ca 0.07 0.01 59.5 0.17 0.02 38.2 0.17 0.01 60.3 0.62 0.04 45.9
Na 0.05 0.00 2.05 0.14 0.00 1.44 0.08 0.00 2.32 0.12 0.00 1.86
K 7.86 0.14 4.48 7.95 0.13 6.06 6.17 0.11 4.55 7.52 0.13 7.40
ppm
Li 674 11.3 0.10 165 2.81 0.06 281 5.45 0.07 184 3.00 0.07
Be 2.60 0.60 0.07 0.18 0.12 0.06 1.80 0.56 0.09 2.04 0.58 0.00
Rb 1287 24.6 0.06 718 13.0 0.05 619 11.5 0.05 395 7.07 0.14
Sr 3.05 0.25 0.00 2.66 0.14 0.00 3.12 0.14 0.00 7.45 0.19 0.00
Ba 319 5.96 0.03 306 5.27 0.06 75.8 1.18 0.01 2088 35.0 0.18
Cs 129 3.07 0.02 24.9 0.45 0.02 22.9 0.49 0.01 18.2 0.48 0.01
Ga 74.0 1.50 0.02 47.5 1.16 0.01 110 2.28 0.01 51.6 1.06 0.01
Tl 9.13 0.22 0.00 3.76 0.12 0.00 4.25 0.13 0.01 2.39 0.09 0.00
Ta 22.8 0.59 0.00 4.15 0.09 0.00 6.55 0.23 0.00 2.12 0.08 0.00
Sc 34.5 1.05 0.05 46.7 1.23 0.04 80.8 3.32 0.04 39.4 1.50 0.05
V 184 3.75 0.05 150 3.18 0.05 89.5 1.78 0.04 383 6.93 0.04
Cr 97.5 2.03 0.71 46.3 1.07 0.67 29.0 0.86 0.72 81.6 1.57 0.68
Co 33.4 0.78 0.01 49.1 1.09 0.01 29.9 0.75 0.01 42.6 0.91 0.01
Ni 37.7 1.14 0.07 40.8 1.28 0.07 24.5 0.90 0.09 27.1 0.87 0.05
Cu 5.38 0.52 0.04 4.44 0.38 0.04 6.19 1.21 0.05 3.59 1.11 0.03
Zn 799 12.1 0.15 580 8.80 0.10 546 76.1 0.13 280 3.90 0.12
Mo 0.21 0.02 0.00 0.15 0.02 0.00 0.09 0.02 0.00 0.53 0.04 0.00
Sn 56.8 1.18 0.04 21.9 0.72 0.03 72.5 1.58 0.04 11.6 0.35 0.03
W 2.45 0.06 0.00 2.10 0.04 0.00 2.73 0.11 0.00 3.31 0.19 0.00
Note: Stochiometric Si content for each spot measured by EMPA is used for internal standardization. Int. is analytical error. L.O.D is limit of detection which is shown in ppm for all the elements. Complete data see Appendix Table 10.

230
230
Chapter 6 Conclusions and recommendations for future work
Previous research in the Sisson Brook mineralized system and related rocks
included, mineral paragenetic studies, with fluid inclusion studies and a few
geochronology studies. However, the granitic system responsible for the mineralization
of Sisson Brook deposit is still unclear. This work aimed at gaining a better
understanding of the magmatic evolution history of the Nashwaak Granite and related
dykes that are spatially related to the Sisson Brook W-Mo-Cu deposit, through deducing
the various magma sources, tectonic setting, assimilation and fractional crystallization
conditions (P-T-H2O-fO2), as well as petrogenetic linkage between these magmas and
hydrothermal fluids exsolved during the late stage crystallization of the intrusion. Such a
task involved a detailed description of the rocks units in the field, optical microscopy
studies, mineralogical and whole-rock geochemistry studies, as well as geochronology.
The key conclusions are summarized as below:
1. The Nashwaak Granite and related dykes are generally classified into four groups
including two-mica granitic pluton, biotite granitic pluton, aplitic to pegmatoidal
biotite granitic dykes, and one porphyry dyke (364.5 ± 1.3 Ma, U-Pb zircon age;
Fyffe et al., 2008). Geochronology study shows the biotite granitic dyke formed at
405.6 ± 2.5 Ma (U-Pb zircon age) and is contemporaneous with the Pokiok
Batholith, which is located about 50 km south of the Nashwaak Granites.
Considering the Nashwaak pluton phases are cut by the biotite granitic dykes in
the trench, thus these pluton phases are considered to be older than 405 Ma. Three
Re-Os model ages for the molybdenites are ranging from 376.45 ± 1.64 Ma to

231
231
378.54 ± 1.71 Ma. Thus the syn-hydrothermal dykes could not be the medium- to
coarse-grained biotite granitic dykes because of the huge age gap between them,
but could be the dykes with different textures, i.e. the aplitic and pegmatoidal
dykes although they are volumetrically minor in this area. Further detailed dating
work is needed to differentiate the ages of these dykes.
2. The Nashwaak Granite and related dykes are highly siliceous (SiO2 > 69 wt.%),
peraluminous, calc-alkaline, and magnesian I-type granites. They formed in the
volcanic arc setting during the Acadian Orogeny, which was formed by the
subduction of the Avalon Zone beneath the Gander Zone. The fluids derived by
slab dehydration brought the water-soluble large ion lithophile elements (LILE:
K, Rb, Cs, Sr, and Ba) into the arc magma systems. The high field strength
elements (HFSE) Ti, Nb, and Ta are not significantly fluid soluble and are
retained in minerals in the slab or the mantle wedge (Pearce and Peate, 1995;
Muppy, 2007; Richards, 2011, and the references therein). Thus the the Nashwaak
Granite and related dykes are enriched in large ion lithophile elements and with
low content of the high field strength element abundances (HFSE) of Zr < 228
ppm, Hf < 6 ppm, U < 14.6 ppm, Th < 31.8 ppm, Nb < 23.1 ppm, and Ta < 3.5
ppm. Fractional crystallization plays a vital role in enrichment of incompatible
metallic elements (W and Mo), and amongst all these granites, the biotite granitic
dykes are the most differentiated that is indicated by the highest silica content and
largest compatible elements (Ba, Sr, P, and Ti) negative anomalies.
3. The water contents of initial felsic melts may have controlled the final water
saturation of the granitoid intrusions, and sufficiently affected viscosity of the

232
232
melts to segregate from the source area and to migrate through the crust. Water
solubility in felsic melts is a function of P, T, X, and water activity (Holtz et al.,
2001 and the references therein). The calculated zircon saturation temperature
shows the Nashwaak Granite and related dykes are ‘cold’ (TZr < 800°C, Miller et
al., 2003), low-temperature granites (inherited zircon presence, Chappell et al.,
1998). This type of granite is zircon inheritance-rich and the TZr represent the
maximum temperature of melts. The emplacement pressure of the Nashwaak
Granite plutons assessed by the Q-Ab-Or-H2O phase diagram is around 250 MPa
(7-8 km, typical 5-10 km for arc magmas, Richards, 2011) and the late dykes
ascended to much shallower depths. Furthermore, the andalusite and cordierite are
present in sedimentary rocks up to 2 km from the contact. This constrains the
emplacement pressure of lower than 300 MPa. Using the method developed by
Holtz et al. (2001), the initial H2O content of the parental magma of the
Nashwaak Granite and related dykes is 5-6 wt.% which is generally close to H2O
content (4-6 wt.%) of the calc-alkaline intermediate and silica magmas
(Anderson, 1979; Green, 1982; Barclay et al., 1998; Devine et al., 1998;
Carmichael, 2004; Blundy and Cashman, 2005). The relatively wet magmas of the
Nashwaak Granites intrude in a deeper level than the parental magma of the
typical porphyry-Cu deposit, and a greater degree of crystallization needs to take
place before water-saturation is achieved, and consequently contribute to the
continuously enrichment of the incompatible elements of W and Mo in the
residual melts and fluids.

233
233
4. The whole-rock δ18O (9.3-10.9‰) indicates that the Nashwaak Granite and
related dykes are ‘normal granites’ (Taylor, 1968, 1978) and they do not represent
partial melts of either depleted mantle or Gander Zone supracrustals. The ɛNd(t) (-
4.51 to -1.42), and the 206Pb/204Pb, 207Pb/204Pb, 208Pb/204Pb values of 18.3, 15.6,
and 38.3, respectively from Ayuso and Bevier (1991), imply that the Nashwaak
granitoids mainly originated from meta-igneous old crustal rocks (Bevier and
Whalen,1990; Whalen, 1993). Since the nature of the lower crust of the Gander
Zone is poorly known, it is hard to deduce the possible sources of the Nashwaak
Granite and related dykes. Possible basement fragments of the Gander Zone occur
in the Tetagouche Group as granodiorite cobbles, which yield late
Mesoproterozoic (ca. 1.09 Ga) U-Pb zircon crystallization ages and gave an ɛNd(t)
of -3.47; xenocrystic zircon grains in the cobbles range in age between ca. 1.16
and 1.55 Ga (van Staal et al., 1996). van Staal et al. (1996) argued that overlap of
the Nd crust formation ages of Plaeozoic granitoid plutons (1.3-1.7, Whalen,
1993) of the Gander Zone with the crystallization and xenocrystic zircon of these
cobbles indicates that the Paleozoic granites probably image or map an old
continental crustal basement. However, the ɛNd(0.4 Ga) of the granodiorite cobble
representing the old crustal basement is -8.8, and to form the Nashwaak Granite
and related dykes (ɛNd(t) = -4.51 to -1.42), mantle melts or mafic lower crustal
rocks are needed. Whalen et al. (1996) interpreted those granitic magmas as being
derived from bulk assimilation of Meso-proterozoic Gondwanan basement ± the
overlying Gander Zone sedimentary prism, by enriched asthenospheric mantle-
derived melts. The Meso-proterozoic basement could be the seismically imaged

234
234
Central Crustal Block beneath the Gander and Avalon zones (Keen et al., 1986;
Marillier et al., 1989; Quinlan et al., 1992). Unless more information of the end-
member sources are available, any attempt to quantify the relative amount of end-
members by simple mixing calculations would be meaningless.
5. Scanning Electron Microscopy-Cathodoluminescense (SEM-CL) images of
zircons from the Nashwaak Granite and dykes show they typically have bright
core and low-CL response thin rims. In the two-mica granite and biotite granitic
dykes, the δ18OZrc in the core domain of zircon lies in a large range broadly from
4.9 to 9.9‰ for both groups, and in the rim domain distributes from 4.9 to 7.4‰
for the two-mica granite, and 5.3 to 7.1‰ for biotite granitic dykes. Intragrain
variation of δ18OZrc from zircon core to rim is shown as decreasing when the core
with the δ18OZrc larger than 6‰, and increasing when the core with the δ18OZrc of
5.2‰. Oxygen isotope fractionation between zircon and quartz, zircon and whole
rock indicate that the overgrowth rims of zircon are not isotopically equilibrated
with the coexisting quartz and hosting melts in the two-mica granite and biotite
granitic dykes. Thus, some open-system processes might be involved in their
magma evolution. They are formed by mixing of mantle-derived melts with
partially melted lower crust magmas. Supracrustal materials were also added into
the magma system. On the other hand, the biotite granite pluton has relatively
homogeneous δ18OZrc within and between zircon grains with an average value of
6.8‰. The oxygen isotope composition is equilibrated at high temperature
between zircon and quartz, and zircon and whole rock. They could formed
mainly by partial melting of the lower crust with minor mantle melts.

235
235
6. The Ti concentration of quartz from different groups of the Nashwaak Granite
shows a constant or a slightly decreasing trend from core to rim, indicating a slow
cooling process. Varieties of quartz textures revealed by SEM-
Cathodoluminescense analysis suggest the quartz crystallized at different
conditions. The quartz from the Nashwaak plutonic phases with the oscillatory
zoning grew in a stable environment of gradual cooling (683 ° to 628 °C) from a
stagnant magma chamber undisturbed by replenishments. Thus quartz in them
was crystallized after supracrustal contamination and has higher δ18O than
calculated δ18O of quartz equilibrated with zircon. Quartz in biotite granitic dyke
also formed after contamination and later continued cooling caused the fluctuation
of the solubility of SiO2 and quartz dissolved and precipitated along the fractures
in the temperature range of 400 to 600 °C at the pressure below 1 kbar. Quartz
phenocrysts in a porphyry dyke recorded highest temperature of 706 to 741 °C
and the quartz formed in the deep level of crust and later rapid ascent of magma to
the shallow crust caused the resorption texture within quartz.
7. Detailed investigation of trace element concentration in quartz shows they have
no consistent relationship with these elements in the whole rock. The Al and Ge
concentration generally increase during magma fractional crystallization, whereas
the Ti content decreases, thus Al/Ti and Ge/Ti ratio is a reliable index of the
degree of magma evolution, although the Ge/Ti ratio seems more robust.
Aluminum incorporation into quartz might not only controlled by the aluminum
saturation index (ASI) of magma, but also by the water and F activities, and pH.
Lithium is more enriched in the Nashwaak dyke phases than the plutonic phases.

236
236
It substitutes into quartz with the combination of Al and behaves as incompatible
element, thus enriched in the highly evolved magmas and fluids.
8. According to the classification of I-type granitoids of the Sierra Nevada and
Peninsular Range Batholiths after Ague and Brimhall (1988a, b), trace element
contents of magmatic biotite from the Nashwaak Granite and related dykes show
that the biotite granitic pluton and all dyke phases are similar to the weakly to
moderately contaminated I-type granite with the oxygen fugacity above the QFM
buffer, whereas the muscovite-biotite granite is similar to strongly contaminated
and reduced I-type granites.
9. The K/Rb ratio of biotite has similar behaviour as the parameter mgli (=octahedral
Mg minus Li) developed by Tischendorf et al. (1997, 2001) and decreases with
magma fractionation. The same trend is observed for the compatible elements (in
felsic rocks) Cr, Ti, Co, V, and Ba in the Nashwaak Granite and dykes, except the
two-mica granite. The incompatible elements, Ta, Tl, Ga, Cs, and Li, show an
inverse distribution pattern relative to K/Rb. Interestingly the Ni is scattered in
those groups. The metallic elements W and Sn are rich in biotite granitc dyke, up
to 10.8 ppm and 124 ppm, respectively. Tungsten itself in Group IV is up to 10
ppm, and Mo in Group I is up to 148 ppm. Partitioning of W and Sn into biotite is
not (or not entirely) controlled by magma fractionation, since plotting of K/Rb vs.
W or Sn has no obvious correlation. Molybdenum in these magmas is lower than
1 ppm.
10. Compared to Cl-rich magma systems related to porphyry Cu deposits, the
porphyry Mo deposits are more enriched in F. The high F/Cl of magma in

237
237
porphyry Mo systems could be inherited from their metamorphic source rock or
due to the vapour exsolution during magma evolution leaching (removing) the Cl
out of the system. The halogen fugacity of the magma associated with the
Nashwaak Granite and related dykes, calculated on their zircon saturation
temperatures, shows that two-mica granite has higher fHF/fCl than the other
groups (between 0 and 1) and is similar to those magmas associated with the
Henderson porphyry Mo deposit. The fHF/fCl ratios of the other groups range
from -1 to 0 and are similar to Santa Rita porphyry Cu deposit (Munoz and
Swenson, 1981). The fH2O/fHCl and fH2O/fHF of the biotite from the Nashwaak
Granite and related dykes are from 3 to 5 and from 4 to 5, respectively. In these
granites, the biotite granitic dykes (Group III) have similarities to those granites
typically associated with W-Sn-Be deposits as investigated by Munoz (1984).
This could be explained as they have similar fHF/fHCl and/or they have similar
degrees of magmatic differentiation. The Mo-W are likely to form from a slightly
oxidized magma (Blevin and Champell, 1992), since Mo is more easily
sequestered from the magma system in reduced settings and W is less affected. In
the Nashwaak Granite, the dykes have the oxygen fugacity around the nickel-
nickel oxide buffers. The pluton phases crystallized from a reduced to oxidized
setting, which could be caused by H2 release at or near H2O vapour saturation at
high H2O/Fe2+ (cf. Lentz, 1992). Although several other vital factors could control
W and Mo mineralization processes, such as the ratio of initial water content to
saturation water content in the magma, the emplacement depth, the assimilation
and fractional crystallization process, the difference of those factors between each

238
238
group is difficult to determine. If only considering the halogen and oxygen
fugacity interpreted from the composition of biotite, the magmatic source of the
biotite dykes (Group III) is the plausible source of the hydrothermal fluids
responsible for the Sisson Brook deposit mineralization, since it has a similar F/Cl
to that of W-Sn-Be systems (Munoz, 1984) (i.e., CanTung tungsten deposit; van
Middelaar and Keith, 1990), and formed in an oxidized setting, which is critical to
concentrate Mo in the late stage fluids.
Future research should include further detailed geochronology study on the zircons
from different rock units to see if it could be possible to identify a dyke with the identical
age of ca. 377 Ma. The in situ U-Pb method is preferred since oxygen isotope
compositions of zircons are already analyzed by SIMS in this research and further
detailed dating on the same spot in those zircon grains could decipher the complex
magma process very well. Also this in situ dating could identify the effect of radiation
damage on zircons if it happens.
Early mineral chemistry and fluid inclusions research by Nast (1985) and Nast and
Williams-Jones (1991) show that there are 4 mineralization stages for the Sisson Brook
deposit): 1) Disseminated and vein-bearing molybdoscheelite with amphibole alteration.
This stage was controlled by the Ca supplement from host rock in a low fluid-rock
setting. Molybdenite in quartz veins with biotite alteration; 2) this stage is marked by
increasing fS2 and temperature; 3) scheelite in quartz veins with biotite alteration. This is
the result of high Ca contents of the hose rocks and/or biotitization; 4) wolframite and
chalcopyrite in quartz vein stockworks with phyllic alteration. This stage is probably
controlled by temperature decreasing, and/or increasing pH, and/or increasing fS2. After

239
239
recent years drilling program and more drill cores came out. Jim Lang (2011, pers.
comm.) summarized three types of alteration in this area including: 1) early sodic-calcic
alteration and amphibole veins; 2) early biotite and biotite-sulphide alteration; 3) late
calc-silicate alteration and three types of mineralization veins including: 1) early quartz-
shceelite veins; 2) intermediate-stage quartz-molybdenite veins; 3) later sulphide-rich and
quartz shear veins. Based on these new research results, the early fluid inclusion studies
of the Sisson Brook deposit might need to be re-examined and possibly modified in order
to obtain more reliable information about the ore-forming hydrothermal fluids, such as
the sources of these hydrothermal fluids (Are they magmatic, meteoric, or metamorphic?)
and the mechanisms to cause the deposition of ore-forming minerals in the veins
(temperature and pressure variation, pH fluctuation, trace element exchange between
hydrothermal fluids and hosting rock, and oxygen and sulfur fugacity). Combining all
these additional research aspects, it might be possible to build up a more reliable
petrogenetic model for the Sisson Brook deposit and gain better understanding of the
metallogenic activies in the Miramichi Highlands.
References
Ague, J.J., Brimhall, G.H., 1988a. Regional variations in bulk chemistry, mineralogy, and
the compositions of mafic and accessory minerals in the batholiths of California.
Geological Society of America Bulletin 100, 891-911.
Ague, J.J., Brimhall, G.H., 1988b. Magmatic arc asymmetry and distribution of
anomalous plutonic belts in the batholiths of California: Effects of assimilation,
crustal thickness, and depth of crystallization. Geological Society of America

240
240
Bulletin 100, 912-927.
Anderson, A.T., 1979. Water in some hypersthenic magmas. Journal of Geology 87, 509-
531.
Ayuso, R.A., Bevier, M.L., 1991. Regional differences in lead isotopic compositions of
feldspars from plutonic rocks of the northern Appalachian mountains, U.S.A. and
Canada: a geochemical method of terrane correlation. Tectonophysics 10, 191-212.
Barclay, J., Rutherford, M.J., Carroll, M.J., Murphy, M.D., Devine, J.D., Gardner, J.,
Sparks, R.S.J., 1998. Experimental phase equilibria constraints on pre-eruptive
storage conditions of the Soufrière Hills magma. Geophysical Research Letters 25,
3437-3440.
Bevier, M.L., Whalen, J.B., 1990. Tectonic significance of Silurian magmatism in the
Canadian Appalachians. Geology 18, 411-414.
Blevin, P.L., Chappell, B.W., 1992. The role of magma sources, oxidation states and
fractionation in determining the granite metallogeny of eastern Australia. Royal
Society of Edinburgh Transactions, Earth Sciences 83, 305-316.
Blundy, J., Cashman, K., 2005. Rapid decompression-driven crystallisation recorded by
melt inclusions from Mount St. Helens volcano. Geology 33, 793-796.
Carmichael, I.S.E., 2004. The activity of silica, water, and the equilibration of
intermediate and silicic magmas. American Mineralogist 89, 1438-1446.
Chappell, B.W., Bryant, C.J., Wyborn, D., White, A.J.R., Williams, I.S., 1998. High- and
low- temperature I-type granites. Resource Geology 48, 225-235.
Devine, J.D., Murphy, M.D., Rutherford, M.J., Barclay, J., Sparks, R.S.J., Carroll, M.R.,
Young, S.R., Gardner, J.E., 1998. Petrologic evidence for pre-eruptive pressure–

241
241
temperature conditions, and recent re-heating, of andesite magma at Soufrière Hills
Volcano, Montserrat, W.I. Geophysical Research Letters 25, 3669-3672.
Fyffe, L.R., Thorne, K.G., Dunning, G.R., Martin, D.A., 2008. U-Pb geochronology of
the Sisson Brook granite porphyry, York County, West-central New Brunswick. In:
Martin, G.L. (Eds), Geological Investigations in New Brunswick for 2007. New
Brunswick Department of Natural Resources. Minerals, Policy and Planning
Division, Mineral Resource Report 2008-1, 35-54.
Green, T.H., 1982. Anatexis of mafic crust and high pressure crystallisation of andesite.
In: Thorpe, R. S. (Eds), Andesites: Orogenic Andesites and Related Rocks.
Chichester: John Wiley, 465–487.
Holtz, F., Johannes, W., Tamic, N., Behrens, H., 2001. Maximum and minimum water
contents of granitic melts generated in the crust: a reevaluation and implications.
Lithos 56, 1-14.
Keen, C.E., Keen, M.J., Nichols, B., Reid, I., Stockmal, G.S., Colman-Sadd, S.P.,
O’Brien, S.J., Miller, H., Quinlan, G., Williams, H., Wright, J., 1986. A deep seismic
refection profile across the northern Appalachians. Geology 14, 141-145.
Lentz, D.R., 1992. Petrogenesis and geochemical composition of biotites in rare-element
granitic pegmatites in the Southwestern Grenville Province, Canada. Mineralogy
and Petrology 46, 239-256.
Marillier, F., Keen, C.E., Stockmal, G.S., Quinlan, G., Williams, H., Colman-Sadd, S.P.,
O’Brien, S.J., 1989. Crustal structure and surface zonation of the Canadian
Appalachians: implications of deep seismic reflection data. Canadian Journal of
Earth Sciences 26, 305-321.

242
242
Miller, C.F., McDowell, S.M., Mapes, R.W., 2003. Hot and cold granites? Implications of
zircon saturation temperatures and preservation of inheritance. Geology 31, 529-
532.
Munoz, J.L., 1984. F-OH and Cl-OH exchange in micas with applications to
hydrothermal ore deposits. Reviews in Mineralogy and Geochemistry 13, 469-493.
Munoz, J.L., Swenson, A., 1981. Chloride-hydroxyl exchange in biotite and estimation of
relative HCl/HF activities in hydrothermal fluids. Economic Geology 76, 2212-
2221.
Murphy, J.B., 2007. Igneous rock associations 8. Arc magmatism II: geochemical and
isotopic characteristics. Geoscience Canada 34, 7-35.
Nast, H.J., 1985. The geology and petrochemistry of the Sisson Brook W-Cu–Mo
deposit, New Brunswick. Unpublished M. Sc. thesis, McGill University, Montreal,
Quebec, 192 p.
Nast, H.J., Williams-Jones, A.E., 1991. The role of water–rock interaction and fluid
evolution in forming the porphyry–related Sisson Brook W–Cu–Mo deposit, New
Brunswick. Economic Geology 86, 302-317.
Pearce, J.A., Peate, D.W., 1995. Tectonic implications of the composition of volcanic arc
magmas. Annual Review of Earth and Planetary Sciences 23, 251-285.
Quinlan, G.M., Hall, J., Williams, H., Wright, J.A., Colman-Sadd, S.P., O’Brien, S.J.,
Stockmal, G.S., Marillier, F., 1992. Lithoprobe onshore seismic reflection transects
across the Newfoundland Appalachians. Canadian Journal of Earth Sciences 29,
1865-1877.
Richards, J.P., 2007. Magmatic to hydrothermal metal fluxes in convergent and collided

243
243
margins. Ore Geology Reviews 40, 1-26.
Robb, L., 2005. Introduction to ore-forming processes. Blackwell publishing, 373 p.
Taylor, H.P.Jr., 1968. The oxygen isotope geochemistry of igneous rocks. Contributions
to Mineralogy and Petrology 19, 1-71.
Taylor, H.P.Jr., 1978. Oxygen- and hydrogen- isotope studies of plutonic rocks. Earth and
Planetary Science Letters 38, 177-210.
Tischendorf, G., 1997. On Li-bearing micas: estimating Li from electron microprobe
analyses and an improved diagram for graphical representation. Mineralogical
Magazine 61, 809-834.
Tischendorf, G., Förster, H.-J., Gottesmann, B., 2001. Minor- and trace-element
composition of trioctahedral micas: a review. Mineralogical Magazine 65, 249-276.
van Middelaar, W.T., Keith, J.D., 1990. Mica chemistry as an indicator of oxygen and
halogen fugacities in the CanTung and other W-related granitoids in the North
American Cordillera. In Ore-bearing granite systems; Petrogenesis and mineralizing
process. Edited by Stein, H.J. and Hannah, J.L., Geological Society of America
Special Paper 246, 205-220.
van Staal, C.R., Sullivan, R.W., Whalen, J.B., 1996. Provenance and tectonic history of
the Gander margin in the Caledonian/Appalachian orogen: implications for the
origin and assembly of Avalonia. In Avalonian and related peri-Gondwanan terranes
of the Circum-North Atlantic. Edited by Nance, R.D. and Thompson, M.D.,
Geological Society of America, Special Paper 304, 347-367.
Whalen, J.B., 1993. Geology, petrography and geochemistry of Appalachian granites in
New Brunswick and Gaspésie, Quebec. Geological Survey of Canada, Bulletin 436.

244
244
Whalen, J.B., Jenner, G.A., Longstaffe, F.J., Hegner, E., 1996. Nature and evolution of
the eastern margin of Iapetus: geochemical and isotopic constraints from Siluro-
Devonian granitoid plutons in the New Brunswick Appalachians. Canadian Journal
of Earth Sciences 33, 140-155.

245
245
Appendix Table 1 Determined XRF data of the standard reference samples (SY-4, NIM-G, and 94-GS) and retative differences between
them and recommanded values Sample SY-4 NIM-G 94-GS
XRF S.V.1 R.D.2 XRF S.V. R.D XRF S.V. R.D.
Wt.%
SiO2 49.5 49.8 0.58 81.9 75.7 8.19 57.9 62.0 6.63
TiO2 0.34 0.29 18.3 0.10 0.09 8.83 0.92 0.76 20.8
Al2O3 21.4 20.8 3.22 14.4 12.1 19.4 18.1 15.2 19.3
Fe2O3T 5.66 6.18 8.47 1.99 2.02 1.47 8.72 7.80 11.8
MnO 0.11 0.11 4.53 0.02 0.02 25.1 0.07 0.06 10.1
MgO 0.83 0.55 50.1 <LD 0.06 6.52 3.66 78.1
CaO 8.92 8.09 10.3 0.93 0.78 18.9 0.09 0.05 82.0
Na2O 6.81 7.05 3.34 3.57 3.36 6.31 1.80 2.40 25.0
K2O 1.80 1.68 6.93 5.14 4.99 2.94 2.97 2.50 18.8
P2O5 0.11 0.13 15.11 0.01 0.01 24.5 0.10 0.11 8.21
ppm
S 342 234 6356
Cl 6549 334 170 96.7 82.0
Rb 61.0 56.5 7.90 312 315 1.01 86.1 98.0 12.2
Sr 1208 1203 0.38 10.1 10.0 0.88 31.6 70.0 54.9
Ba 404 345 17.0 93.0 109 14.2 445 340 30.8
Ga 32.0 34.0 4.66 29.0 27 6.48 21.0 18.0 16.8
Nb 16.4 14.0 17.0 63.4 61.5 3.13 11.2 10.0 12.2
Zr 549 533 3.03 287 276 3.87 146 140 4.55
Y 112 117 4.53 121 129 6.36 21.5 20.0 7.42
Th <LD 1.00 51.0 51.0 0.07 11.0 9.00 29.6
U <LD 1.00 21.0 21.0 2.52 7.00 4.00 92.1
Ce 126 144 12.4 227 207 9.50 65.0 49.0 31.8
Cr <LD <LD 297 190 56.4
Ni 13.0 10.0 30.7 16.0 8.00 97.2 109 100 9.43
Sc <LD <LD 1.00 30.0 22.0 38.2
V <LD <LD 187 150 24.4
Cu 7.00 7.00 1.25 7.00 11.0 34.3 29.0 32.0 9.82
Pb <LD 10.0 38.0 36.0 5.97 14.0 19.0 25.3
Zn 41.0 95.0 57.0 16.0 50.0 67.4 42.0 80.0 47.7
As <LD <LD 15.0 19.0 19.93
1. S.V. is reported values of the standard samples, SY-4 from Canada Centre for Energy and Mineral Technology (CANMET), NIM-G (Steele et al., 1978), and 94-GS (Lentz, 1995); 2, R.D. is relative difference, |Xsample-Xreference|/Xreference ×100.

246
246
Appendix Table 2 INAA data of the standard samples (SY-4, NIM-G, and 94-GS) and retalive difference between them and reference
values
SY-4 NIM-G 94-GS Sample D.L.
INNA S.V.1 R.D.2 INNA S.V. R.D. INNA S.V. R.D.
Au 2.00 < 2.00 < 2.00 < 2.00 <2.00
Ag 5.00 < 5.00 < 5.00 <0.10 < 5.00 0.15
As 0.50 < 0.50 22.1 17.3 27.8 26.0 19.0 36.8
Ba 50.0 < 50.0 340 < 50.0 120 480 340 41.2
Br 0.50 251 < 0.50 0.45 < 0.50 2.00
Ca 1.00 7.00 < 1.00 5400 < 1.00
Co 1.00 4.00 2.80 42.9 < 1.00 4.90 14.0 13.0 7.69
Cr 5.00 < 5.00 12.0 12.0 11.0 5.26 231 190 21.6
Cs 1.00 < 1.00 1.50 < 1.00 1.40 3.00 3.10 3.23
Fe 0.01 3.90 13200 13500 2.22 5.13
Hf 1.00 9.00 10.2 11.8 12.0 12.5 4.00 4.00 3.80 5.26
Hg 1.00 < 1.00 < 1.00 < 1.00 58.0
Ir 5.00 < 5.00 < 5.00 < 5.00
Mo 1.00 < 1.00 28.0 3.00 833 8.00 3.40 135.3
Na 0.01 4.59 22200 24800 10.5 1.65
Ni 20.0 < 20.0 9.00 < 20.0 8.00 170 100 70.0
Rb 15.0 < 15.0 55.0 289 320 9.69 98.0 98.0 0.00
Sb 0.10 < 0.10 1.10 1.00 10.0 1.30 0.80 62.5
Sc 0.10 1.00 1.00 9.09 0.60 0.45 33.0 20.8 22.0 5.45
Se 3.00 < 3.00 < 3.00 <7.00 < 3.00 <1.00
Sn 0.02 < 0.02 < 0.02 4.90 < 0.02 26.0
Sr 0.05 < 0.05 1191 < 0.05 10.0 < 0.05 70.0
Ta 0.50 < 0.50 0.90 3.10 4.50 31.1 1.10 0.60 83.3
Th 0.20 < 0.20 1.00 42.2 51.0 17.3 7.10 8.50 16.5
U 0.50 < 0.50 1.00 22.3 15.0 48.7 5.10 4.00 45.7
W 1.00 < 1.00 < 1.00 <3.00 < 1.00 1.00
Zn 50.0 110 95.0 15.8 < 50.0 50.0 < 50.0 80.0
La 0.50 55.6 57.0 2.46 109 109 0.00 24.8 25.0 0.80
Ce 3.00 127 124 2.42 192 195 1.54 52.0 49.0 6.12
Nd 5.00 48.0 56.0 14.3 57.0 65.9 13.5 20.0 22.0 9.09
Sm 0.10 10.9 12.3 11.4 10.1 13.8 26.8 3.30 4.30 23.3
Eu 0.20 1.90 1.96 3.06 < 0.20 0.33 1.10 1.10 0.00
Tb 0.50 2.20 2.50 12.0 2.2 2.38 7.56 < 0.50 0.62
Yb 0.20 19.8 15.2 30.3 19.5 14.4 35.4 3.20 2.50 28.0
Lu 0.05 2.35 2.20 6.82 2.61 2.11 23.7 0.56 0.37 51.4
1. S.V. is reported values of the standard samples, SY-4 from Canada Centre for Energy and Mineral Technology (CANMET), NIM-G (Steele et al., 1978), and 94-GS (Lentz, 1995); 2, R.D. is relative difference, |Xsample-Xreference|/Xreference×100.

247
Appendix Table 3 Results of repeated analyses of the NIST 610 standard by laser ablation-ICPMS and comparison with reference values
NIST610 Ti Al Fe Mn Mg Ca Na K P Li Be B Cl Cr Ge Rb Sr Sn Ba
ppm
1 432 10730 457 480 461 82000 99040 483 339 490 470 357 442 404 424 422 511 396 429
2 435 10800 457 488 466 81880 99300 486 343 481 461 351 432 404 425 426 515 394 434
3 436 10840 461 487 468 83400 100600 492 345 488 475 360 451 413 432 432 521 403 436
4 434 10810 458 489 468 82500 99650 485 341 484 469 359 431 404 424 426 515 396 438
5 435 10860 459 487 468 82400 99520 488 347 487 469 357 436 407 427 424 515 398 434
6 434 10860 462 485 465 81860 99460 488 345 486 464 351 435 405 429 428 520 398 438
7 431 10740 454 484 467 82100 99400 486 344 483 457 355 430 407 426 423 517 395 441
8 434 10810 459 481 465 82500 99960 488 340 486 462 356 441 405 428 428 521 399 436
9 434 10770 454 486 457 81300 99200 486 339 484 462 355 448 401 420 426 514 392 431
10 434 10770 459 486 464 82400 99020 484 342 485 474 358 430 404 424 424 512 394 431
11 433 10746 459 487 464 82100 99320 485 347 489 462 357 443 404 429 423 514 396 431
12 436 10730 463 485 464 82200 99150 488 346 482 466 360 442 406 428 427 515 395 432
13 440 10935 456 482 470 83200 99570 484 338 487 475 358 459 403 419 425 520 393 441
14 431 10830 460 484 464 81900 99200 485 338 487 465 354 437 405 426 426 516 397 440
15 433 10850 454 487 466 81900 100290 484 341 482 474 349 406 404 427 430 517 403 440
16 433 10752 451 484 462 81200 99900 485 343 480 465 353 409 402 425 425 515 396 443
17 437 10817 458 488 468 83000 99770 487 347 488 468 354 417 408 429 427 516 397 438
18 433 10716 465 484 463 82100 97950 488 346 487 461 365 488 405 425 423 513 390 427
19 436 10840 459 488 465 82900 99870 489 347 484 472 357 442 407 431 425 520 396 437
20 431 10788 457 482 462 81300 98770 483 340 480 460 358 439 402 423 424 511 395 433
21 436 10840 459 486 466 82400 99500 488 342 490 469 357 450 406 424 427 520 396 434
22 439 10710 458 484 468 82400 99910 486 344 484 463 357 415 405 427 426 513 395 437
23 432 10830 457 485 465 81800 99210 485 343 483 470 351 439 405 426 424 515 398 438
24 434 10810 455 489 465 82100 99510 484 342 486 460 354 441 404 426 429 517 397 433
25 433 10820 456 489 461 81600 99200 485 342 484 463 354 444 403 425 423 517 395 433
26 435 10790 461 482 466 82500 99510 488 345 484 476 363 431 406 427 426 515 396 436
27 433 10670 459 484 462 82000 98710 485 344 484 466 360 431 406 425 424 517 393 433
28 432 10836 460 485 467 81800 99700 486 342 487 471 358 462 405 427 427 513 396 437

248
29 436 10840 457 488 468 82300 99550 488 344 486 465 354 427 406 428 426 518 401 435
30 437 10892 459 485 466 82800 99780 487 343 481 469 356 420 404 426 427 516 396 435
31 432 10720 454 484 465 82200 99000 485 344 489 464 352 421 405 424 424 514 393 434
32 430 10739 456 483 464 82200 99490 484 340 478 455 352 419 407 425 423 516 395 434
33 436 10804 455 486 464 81600 99460 486 340 486 472 356 422 403 427 426 516 399 437
34 433 10833 461 484 467 82100 99330 485 346 484 466 361 447 405 424 425 513 394 433
35 436 10710 460 488 464 82700 99090 490 344 489 470 357 458 409 429 428 519 397 435
36 433 10790 459 483 465 81800 99330 486 341 487 465 355 447 405 427 425 516 396 436
37 435 10770 458 486 464 81900 99340 486 345 483 464 358 435 405 428 426 513 396 434
38 433 10770 458 486 465 82200 99320 489 341 481 467 357 430 405 424 426 517 396 435
39 435 10831 456 484 467 82500 99610 485 344 487 467 349 466 405 427 425 521 398 437
40 435 10831 457 487 466 82500 99520 485 347 486 469 358 426 406 426 428 514 395 434
41 435 10760 464 486 464 81900 99130 486 339 484 464 353 455 405 425 424 517 394 437
42 431 10790 456 483 464 82000 99430 487 345 485 466 360 425 404 427 428 513 398 434
Ref.a 452 10324 458 444 432 81429 99419 464 413 468 476 350 274 408 447 425.7 515.5 430 452
%RSDb 0.50 0.51 0.61 0.46 0.52 0.58 0.44 0.39 0.77 0.58 1.05 0.99 3.67 0.48 0.55 0.48 0.52 0.64 0.73
%RDc -3.97 4.56 -0.01 9.28 7.62 0.92 0.00 4.76 -16.98 3.62 -2.01 1.72 59.62 -0.72 -4.68 0.01 0.07 -7.90 -3.71
a. Ref. is the reference values for NIST 610 (Jochum et al., 2011); b. %RSD = standard deviation/average value × 100%; c. %RD=(ppmmean-ppmref.)/ppmref. × 100%.

249
Appendix Table 4 Limits of detection for the trace element concentrations in the quartz from the Nashwaak Granites and related dykes by laser ablation-ICPMS.
Li Be B Na Mg Al P Cl K Ca Ti Cr Mn Fe Ge Rb Sr Sn Ba
ppm
MBG6-1 0.39 0.00 5.62 1.25 0.02 1.36 5.31 23.8 0.68 297 0.68 0.65 0.95 4.44 0.22 0.10 0.01 0.04 0.16
MBG6-2 0.33 0.00 4.54 1.53 0.02 1.43 3.28 22.2 0.51 265 0.38 0.37 0.78 3.53 0.22 0.09 0.01 0.04 0.11
MBG6-3 0.29 0.00 5.23 1.91 0.02 2.15 4.19 25.4 0.51 251 0.56 0.51 0.72 4.15 0.30 0.11 0.02 0.03 0.08
MBG6-4 0.48 0.00 6.73 1.56 0.02 1.52 4.91 37.7 0.67 312 0.49 0.74 0.75 5.10 0.24 0.11 0.02 0.05 0.22
MBG6-5 0.42 0.00 5.91 1.37 0.02 1.33 4.32 33.1 0.59 274 0.43 0.65 0.66 4.48 0.21 0.10 0.01 0.04 0.19
MBG6-6 0.36 0.08 3.74 1.55 0.02 1.32 3.65 19.4 0.66 216 0.41 0.46 0.71 3.20 0.26 0.10 0.01 0.04 0.14
MBG6-7 0.30 0.00 5.05 1.22 0.02 1.30 4.08 22.5 0.68 288 0.41 0.63 0.64 3.99 0.15 0.10 0.01 0.04 0.15
MBG6-8 0.37 0.00 5.29 1.69 0.03 1.61 4.59 28.4 0.48 308 0.58 0.60 0.74 2.72 0.19 0.14 0.01 0.02 0.07
MBG6-9 0.41 0.00 5.89 1.88 0.03 1.79 5.11 31.6 0.54 342 0.64 0.66 0.83 3.03 0.21 0.16 0.01 0.02 0.08
MBG6-10 0.66 0.00 10.9 3.70 0.06 2.51 10.0 38.1 1.02 608 0.43 1.33 2.53 7.83 0.26 0.18 0.03 0.06 0.21
MBG6-11 1.05 0.00 8.38 2.70 0.06 3.15 7.03 25.8 1.30 458 0.31 1.49 1.56 8.46 0.40 0.22 0.03 0.07 0.27
MBG6-12 1.02 0.00 8.13 2.61 0.06 3.06 6.81 25.0 1.26 445 0.30 1.45 1.51 8.21 0.39 0.21 0.03 0.07 0.26
BG6-1 0.98 0.00 7.88 2.53 0.06 2.97 6.60 24.3 1.23 431 0.29 1.40 1.47 7.98 0.38 0.21 0.03 0.07 0.25
BG6-2 1.05 0.00 8.39 2.70 0.06 3.16 7.01 25.9 1.30 459 0.31 1.49 1.56 8.50 0.40 0.22 0.03 0.07 0.27
BG6-3 1.00 0.00 6.56 3.16 0.06 2.16 7.82 29.4 0.99 533 0.40 1.25 2.09 5.88 0.27 0.25 0.02 0.06 0.20
BG6-4 0.85 0.00 5.39 2.05 0.06 2.74 6.68 28.2 1.23 463 0.33 1.19 1.36 6.34 0.33 0.14 0.03 0.10 0.08
BG6-5 0.95 0.21 8.16 2.85 0.10 3.15 7.31 40.3 1.26 540 0.43 1.31 1.78 6.89 0.40 0.23 0.02 0.09 0.07
BG6-6 0.91 0.20 7.79 2.72 0.09 3.01 6.97 38.5 1.20 516 0.41 1.25 1.70 6.58 0.38 0.22 0.02 0.08 0.07
BG6-7 0.70 0.00 9.40 3.12 0.06 2.16 6.75 25.1 1.03 458 0.47 1.12 1.31 5.04 0.24 0.11 0.02 0.07 0.22
BG6-8 0.78 0.00 11.7 2.73 0.06 3.23 7.06 40.3 1.32 539 0.42 1.29 2.63 4.68 0.39 0.20 0.02 0.06 0.13
BG6-9 0.86 0.00 12.9 3.00 0.06 3.55 7.77 44.5 1.45 594 0.46 1.42 2.89 5.16 0.43 0.22 0.03 0.06 0.14
BGD2-1 0.51 0.00 6.02 1.80 0.02 1.31 3.62 26.0 0.49 279 0.59 0.75 0.86 3.81 0.26 0.10 0.01 0.03 0.12
BGD2-2 0.61 0.00 6.47 1.67 0.02 2.06 4.08 31.3 0.45 238 0.62 0.60 1.06 4.73 0.30 0.12 0.01 0.05 0.13
BGD2-3 0.44 0.15 6.93 1.31 0.02 1.43 4.67 22.7 0.46 160 0.68 0.76 0.97 3.34 0.16 0.11 0.02 0.03 0.12
BGD2-4 0.37 0.24 7.90 1.43 0.03 2.13 6.36 22.3 0.80 287 0.74 0.76 1.16 5.50 0.34 0.13 0.02 0.07 0.11
BGD2-5 0.31 0.00 5.63 1.67 0.02 1.42 4.34 19.0 0.46 276 0.45 0.62 0.63 3.19 0.19 0.12 0.02 0.04 0.11

250
BGD2-6 0.42 0.09 5.04 2.26 0.02 1.78 3.64 32.0 0.47 244 0.35 0.67 0.90 3.58 0.26 0.10 0.02 0.04 0.07
BGD2-7 0.37 0.16 4.52 1.29 0.02 1.27 3.97 20.6 0.64 275 0.59 0.48 1.05 3.96 0.16 0.11 0.01 0.04 0.12
BGD2-8 0.39 0.17 4.80 1.38 0.02 1.35 4.23 21.9 0.69 293 0.63 0.51 1.12 4.22 0.17 0.12 0.01 0.04 0.12
BGD2-9 0.67 0.00 8.72 2.53 0.03 1.57 5.22 28.1 0.73 431 0.66 0.77 1.16 5.75 0.22 0.16 0.02 0.06 0.15
BGD17-1 1.34 0.00 11.4 2.15 0.05 3.53 8.66 53.4 1.76 823 0.44 1.43 2.23 10.18 0.45 0.25 0.03 0.07 0.23
BGD17-2 1.22 0.00 10.4 1.97 0.04 3.23 7.91 48.8 1.61 752 0.40 1.31 2.04 9.31 0.42 0.23 0.02 0.07 0.21
BGD17-3 1.37 0.00 11.7 2.21 0.05 3.63 8.87 54.7 1.81 844 0.45 1.47 2.29 10.46 0.47 0.25 0.03 0.07 0.24
BGD17-4 0.82 0.00 11.4 3.17 0.09 2.53 9.14 36.0 1.44 409 0.69 1.92 2.23 10.12 0.41 0.26 0.03 0.09 0.00
BGD17-5 0.87 0.00 12.1 3.38 0.10 2.70 9.75 38.4 1.54 437 0.74 2.05 2.38 10.81 0.44 0.28 0.03 0.10 0.00
BGD17-6 0.79 0.00 13.2 3.45 0.06 3.91 12.1 30.4 2.07 731 0.70 2.15 1.65 8.90 0.47 0.20 0.04 0.08 0.44
BGD17-7 0.85 0.00 14.3 3.72 0.07 4.21 13.1 32.8 2.23 788 0.75 2.31 1.78 9.60 0.50 0.22 0.04 0.09 0.47
BGD17-8 0.90 0.00 7.49 3.19 0.07 2.92 10.4 38.4 0.91 486 0.48 1.14 2.33 7.40 0.44 0.25 0.03 0.07 0.18
BGD17-9 0.68 0.00 9.70 3.40 0.05 4.11 5.48 40.1 1.76 408 0.55 2.45 4.18 10.35 0.43 0.28 0.03 0.07 0.32
BGD17-10 0.44 0.13 4.57 1.48 0.02 1.22 2.91 19.2 0.46 235 0.42 0.52 0.82 3.04 0.14 0.08 0.02 0.04 0.10
BGD17-11 0.58 0.16 11.8 2.43 0.04 2.71 5.73 29.9 0.97 338 0.80 1.19 1.46 6.39 0.62 0.14 0.03 0.09 0.14
PD1-1 0.70 0.00 9.21 3.27 0.08 3.02 6.42 48.4 1.18 670 1.02 1.14 2.00 9.26 0.31 0.21 0.03 0.06 0.11
PD1-2 0.56 0.00 10.6 3.37 0.07 3.71 9.02 48.0 1.20 670 1.17 1.23 2.69 6.88 0.50 0.24 0.03 0.09 0.34
PD1-3 0.55 0.00 10.0 2.33 0.04 3.75 7.99 40.1 1.07 609 1.35 1.52 1.80 6.59 0.38 0.30 0.02 0.06 0.18
PD1-4 0.96 0.00 9.45 2.45 0.05 3.22 6.38 43.0 1.28 532 0.93 1.90 1.80 7.13 0.41 0.26 0.04 0.06 0.22
PD1-5 0.53 0.36 9.93 2.34 0.06 4.16 7.25 40.9 1.45 495 1.02 1.33 2.00 7.19 0.33 0.22 0.04 0.09 0.17
PD1-6 1.06 0.00 8.93 3.03 0.07 3.60 9.18 57.3 1.78 540 0.92 1.58 1.97 7.26 0.53 0.26 0.03 0.11 0.29
PD1-7 0.82 0.00 9.13 3.13 0.06 2.67 7.29 28.8 1.21 622 1.26 1.17 1.83 7.85 0.38 0.23 0.03 0.08 0.17
PD1-8 1.09 0.00 8.43 2.99 0.04 2.80 8.00 45.1 0.98 523 0.90 1.31 1.48 5.73 0.40 0.21 0.04 0.05 0.26
PD1-9 0.79 0.00 10.3 3.57 0.04 2.74 7.28 35.0 1.29 584 1.27 1.06 1.78 7.33 0.39 0.25 0.04 0.04 0.19
PD1-10 0.79 0.00 8.93 3.65 0.03 2.79 9.61 35.2 1.40 682 1.09 1.73 1.72 8.83 0.52 0.28 0.04 0.09 0.22
PD1-11 0.75 0.00 9.79 2.70 0.03 2.10 9.54 27.2 1.29 502 0.89 1.44 1.58 9.52 0.51 0.26 0.04 0.08 0.28
PD1-12 0.56 0.00 6.42 2.16 0.03 2.86 10.3 31.7 1.15 485 0.86 0.68 1.60 5.61 0.56 0.22 0.03 0.08 0.19
PD1-13 0.56 0.00 6.46 2.18 0.03 2.88 10.3 32.0 1.16 489 0.87 0.69 1.61 5.65 0.56 0.22 0.03 0.08 0.19

251
Appendix Table 5 Trace element compositions of quartz from the Nashwaak Granites and related dykes analyzed by laser ablation-ICPMS
Ti Int2SE* Al Int2SE Fe Int2SE Mn Int2SE Mg Int2SE Ca Int2SE Na Int2SE K Int2SE P Int2SE Li Int2SE
ppm
MBG6-1 26.7 1.50 96.2 5.40 0.00 4.10 0.00 0.77 0.11 0.06 0.00 310 0.00 1.70 1.65 0.79 12.2 4.20 1.81 0.46
MBG6-2 28.5 1.30 112 9.70 0.00 4.50 1.80 1.10 0.18 0.16 0.00 260 4.70 2.90 1.43 0.55 11.8 3.60 3.11 0.86
MBG6-3 29.1 1.30 121 23.0 0.00 3.80 1.57 0.77 0.11 0.06 0.00 190 35.9 7.80 3.35 0.73 8.80 4.60 4.01 0.67
MBG6-4 34.0 7.80 127 39.0 27.0 14.0 0.00 0.95 0.44 0.21 0.00 190 60.0 17.0 30.0 11.0 0.00 3.50 3.50 1.30
MBG6-5 22.8 1.30 85.0 6.20 26.0 14.0 1.73 0.94 0.35 0.36 0.00 220 23.9 8.30 5.50 2.80 8.10 5.10 1.58 0.52
MBG6-6 23.1 1.70 182 26.0 290 100 15.0 4.30 4.30 1.20 0.00 350 60.0 14.0 42.7 8.60 0.00 3.90 1.48 0.57
MBG6-7 63.7 6.50 1290 160 9290 890 79.9 8.30 75.6 5.80 0.00 170 824 42.0 761 44.0 36.5 5.40 4.02 0.82
MBG6-8 24.5 1.00 88.8 2.50 0.00 5.20 0.00 1.20 0.28 0.20 0.00 180 0.00 1.80 0.00 0.83 0.00 4.90 4.76 0.86
MBG6-9 41.4 3.40 594 72.0 439 54.0 41.9 7.90 47.1 7.40 0.00 180 166 24.0 231 30.0 7.30 4.00 3.89 0.71
MBG6-10 19.3 1.10 65.3 2.20 7.60 4.70 0.00 0.96 0.08 0.05 0.00 190 7.70 3.00 0.00 0.46 0.00 3.80 1.02 0.32
MBG6-11 20.2 1.30 50.7 2.60 0.00 3.10 0.00 0.85 0.11 0.06 0.00 160 20.0 2.50 0.00 0.44 11.9 4.10 0.00 0.39
MBG6-12 20.2 1.30 51.0 13.0 23.9 5.90 20.0 6.70 0.30 0.28 0.00 150 7.30 2.60 10.5 8.30 18.0 5.20 0.00 0.27
BG6-1 22.6 0.73 85.0 7.60 5.00 5.20 0.00 0.40 0.42 0.18 0.00 170 9.40 2.10 14.1 3.90 0.00 2.70 2.28 0.30
BG6-2 22.4 1.00 78.0 20.0 7.00 2.20 0.84 0.54 0.57 0.29 0.00 100 8.20 1.10 10.1 2.50 5.50 1.50 0.49 0.21
BG6-3 20.4 0.89 190 30.0 16.0 8.20 1.04 0.46 1.62 0.64 0.00 130 23.9 3.00 63.0 12.0 6.00 1.90 0.00 0.15
BG6-4 51.0 27.0 260 75.0 328 71.0 6.80 1.90 6.90 1.00 0.00 120 51.8 6.40 70.0 22.0 10.9 2.40 0.00 0.21
BG6-5 22.7 1.50 42.3 2.60 8.00 3.30 0.76 0.57 0.18 0.11 0.00 120 4.16 0.97 2.25 0.67 4.50 2.50 3.55 0.42
BG6-6 14.7 1.10 73.5 9.30 165 31.0 3.40 1.00 1.54 0.34 0.00 120 15.6 4.40 8.10 2.70 9.50 2.60 0.00 0.11
BG6-7 36.0 10.0 450 290 65.0 38.0 2.30 1.10 10.2 7.70 0.00 110 22.6 4.90 230 160 0.00 2.10 1.13 0.26
BG6-8 23.2 3.00 179 46.0 194 63.0 64.0 20.0 5.30 1.90 0.00 110 35.5 7.00 35.6 8.80 6.70 2.70 0.00 0.14
BG6-9 30.8 2.40 454 68.0 459 86.0 8.20 1.40 27.1 5.30 420 110 142 23.0 194 34.0 8.30 2.60 0.66 0.17
BGD2-1 16.7 0.65 41.1 6.70 5.90 2.90 0.00 0.35 0.31 0.19 0.00 170 13.3 2.20 2.06 0.63 0.00 2.10 0.00 0.15
BGD2-2 15.0 0.86 94.0 45.0 38.0 16.0 7.90 2.60 1.10 0.50 0.00 190 134 29.0 18.7 5.50 4.50 2.50 0.00 0.12
BGD2-3 14.6 0.83 58.0 25.0 20.0 16.0 1.90 1.40 3.70 2.70 410 260 14.3 6.30 11.6 9.30 0.00 1.50 0.00 0.15
BGD2-4 14.7 0.81 31.4 6.10 90.0 21.0 6.30 1.80 3.70 1.60 7300 2800 7.70 3.20 1.70 0.64 0.00 2.40 0.00 0.23
BGD2-5 18.0 0.96 63.0 17.0 12.0 10.0 0.70 1.20 1.33 0.72 0.00 160 16.0 11.0 4.40 2.90 0.00 1.80 1.43 0.29

252
BGD2-6 17.4 0.86 46.0 19.0 0.00 1.90 0.00 0.36 0.53 0.44 0.00 110 20.3 3.60 4.32 0.54 0.00 1.80 0.86 0.30
BGD2-7 21.8 0.92 32.9 6.10 0.00 1.70 0.00 0.32 0.24 0.15 0.00 110 5.30 3.10 0.00 0.32 4.80 1.80 1.55 0.35
BGD2-8 20.3 0.65 29.5 9.00 0.00 3.80 0.00 0.41 0.09 0.04 0.00 87.0 11.9 5.80 2.02 0.99 6.50 1.80 0.00 0.15
BGD2-9 6.91 0.62 11100 2100 56.0 11.0 3.80 1.10 7.50 1.60 2590 490 6700 1200 289 51.0 11.2 2.90 2.45 0.67
BGD17-1 16.8 1.10 52.2 2.80 0.00 3.50 0.00 1.70 0.14 0.06 0.00 240 6.40 3.00 2.22 0.98 0.00 4.80 6.95 0.67
BGD17-2 20.9 1.20 86.0 25.0 0.00 9.20 0.00 0.61 0.45 0.46 0.00 220 3.30 2.30 1.80 1.10 8.00 3.90 7.83 0.80
BGD17-3 17.9 1.30 76.1 4.30 0.00 4.90 0.00 0.47 0.28 0.17 0.00 260 2.80 1.80 3.70 2.00 0.00 4.30 11.1 1.20
BGD17-4 26.4 1.40 114 6.90 0.00 6.90 0.00 1.30 0.48 0.12 0.00 190 15.3 4.40 8.30 1.70 0.00 5.10 13.5 1.10
BGD17-5 19.5 1.10 100 3.70 0.00 4.10 0.00 1.00 0.60 0.22 0.00 220 59.0 34.0 7.40 1.50 0.00 5.60 9.02 0.84
BGD17-6 34.0 1.70 99.5 5.50 10.2 6.10 0.00 1.20 0.54 0.31 0.00 340 12.0 10.0 10.50 4.80 0.00 4.60 11.7 1.20
BGD17-7 17.8 3.00 560 290 310 150 4.00 2.80 69.0 22.0 0.00 380 500 260 174 74.0 0.00 6.60 1.99 0.73
BGD17-8 18.4 1.00 147 97.0 11.5 7.20 0.00 0.78 1.74 0.82 0.00 170 14.9 3.30 11.2 6.10 0.00 5.00 4.73 0.77
BGD17-9 16.2 1.40 42.3 2.90 0.00 4.30 0.00 1.10 0.53 0.47 0.00 270 26.4 5.60 5.40 1.90 7.10 5.80 0.00 0.35
BGD17-10 19.1 1.30 58.0 27.0 0.00 4.50 0.00 1.10 0.18 0.07 0.00 250 16.0 11.0 0.00 0.75 0.00 5.10 0.00 0.38
BGD17-11 8.91 0.98 30000 6900 38.0 47.0 0.00 1.50 3.55 0.77 0.00 340 23300 5200 46.7 9.90 0.00 8.00 0.00 0.39
PD1-1 106 27.0 26800 3300 720 190 15.4 5.20 197 61.0 680 270 7600 1400 23400 4000 18.9 5.20 6.50 1.00
PD1-2 57.0 3.30 132 6.70 9.30 5.10 0.00 1.20 0.94 0.26 0.00 500 10.5 5.70 6.80 1.80 0.00 6.00 16.1 1.40
PD1-3 42.1 1.90 92.1 3.10 9.80 2.90 2.30 4.40 0.71 0.23 0.00 290 15.1 3.50 0.00 0.71 0.00 5.70 10.2 0.97
PD1-4 57.2 2.70 99.2 5.20 15.0 10.0 4.90 3.10 2.20 1.30 0.00 380 10.0 6.30 3.70 1.50 10.9 8.40 13.6 1.60
PD1-5 56.0 2.50 97.8 4.50 9.50 5.00 0.00 1.20 0.93 0.47 0.00 300 2.90 2.00 0.00 0.67 0.00 5.60 15.5 1.40
PD1-6 56.9 3.00 93.5 3.60 0.00 5.80 0.00 1.80 1.10 0.31 0.00 360 0.00 2.10 0.00 0.80 0.00 6.50 15.9 1.50
PD1-7 51.2 1.70 84.7 3.40 10.3 4.80 0.00 0.94 0.63 0.16 0.00 270 0.00 2.10 1.21 0.75 8.50 5.30 12.6 1.10
PD1-8 42.6 2.10 85.2 5.10 0.00 5.30 0.00 0.87 0.88 0.45 0.00 500 0.00 1.30 1.63 0.74 0.00 5.30 10.6 0.93
PD1-9 46.8 1.80 101 3.70 14.0 7.60 0.00 1.40 2.02 0.91 0.00 340 0.00 2.90 1.90 2.00 0.00 5.30 14.9 1.60
PD1-10 48.5 1.60 104 3.20 0.00 6.70 0.00 1.10 0.79 0.11 0.00 340 28.0 11.0 1.97 0.77 0.00 6.10 15.1 1.10
PD1-11 45.5 1.90 97.4 6.20 0.00 4.60 1.96 0.87 0.62 0.15 510 210 6.30 2.20 2.95 0.85 0.00 7.90 10.9 0.96
PD1-12 44.6 1.60 95.7 4.10 6.80 6.90 2.40 2.30 0.57 0.16 0.00 270 5.40 2.30 1.85 0.90 0.00 4.90 12.4 1.10
PD1-13 45.1 2.40 88.1 3.40 8.60 5.70 0.00 0.88 0.42 0.11 0.00 300 7.90 1.90 2.40 1.60 0.00 5.10 13.0 1.10

253
Be Int2SE B Int2SE Cl Int2SE Cr Int2SE Ge Int2SE Rb Int2SE Sr Int2SE Sn Int2SE Ba Int2SE
ppm
MBG6-1 0.04 0.07 18.4 4.40 129 49.0 7.70 1.20 0.91 0.16 0.00 0.07 0.00 0.03 0.00 0.03 0.00 0.06
MBG6-2 0.02 0.05 17.3 4.30 118 59.0 8.09 0.82 0.97 0.16 0.00 0.09 0.00 0.02 0.00 0.02 0.00 0.07
MBG6-3 0.00 1.00 21.4 4.70 137 53.0 6.36 0.78 1.11 0.19 0.00 0.07 0.00 0.02 0.00 0.02 0.00 0.09
MBG6-4 0.00 1.00 27.0 6.10 140 46.0 7.11 0.68 1.10 0.17 0.32 0.16 0.07 0.04 0.00 0.02 0.00 0.08
MBG6-5 0.02 0.04 14.6 4.50 128 43.0 6.71 0.62 1.18 0.18 0.00 0.07 0.04 0.02 0.00 0.03 0.00 0.07
MBG6-6 0.00 1.00 11.1 5.00 203 66.0 5.49 0.61 0.91 0.12 0.00 0.10 0.17 0.05 0.00 0.03 0.46 0.17
MBG6-7 0.00 1.00 9.50 4.50 595 38.0 8.50 0.71 1.19 0.18 5.45 0.37 1.76 0.16 0.88 0.21 3.83 0.53
MBG6-8 0.00 1.00 9.70 3.80 104 51.0 6.25 0.72 0.82 0.18 0.00 0.08 0.00 0.02 0.00 0.03 0.00 0.04
MBG6-9 0.00 1.00 0.00 5.10 198 40.0 5.63 0.62 0.98 0.15 1.58 0.24 0.67 0.10 0.20 0.09 2.01 0.49
MBG6-10 0.00 1.00 12.8 5.30 67.0 48.0 6.33 0.78 1.13 0.16 0.00 0.05 0.05 0.02 0.00 0.02 0.00 0.06
MBG6-11 0.00 1.00 0.00 5.50 121 33.0 5.64 0.55 1.10 0.14 0.00 0.07 0.06 0.02 0.00 0.02 0.00 0.04
MBG6-12 0.00 1.00 13.8 4.50 112 42.0 6.18 0.62 1.05 0.18 0.00 0.10 0.00 0.02 0.08 0.03 0.34 0.16
BG6-1 0.07 0.07 10.1 2.60 133 31.0 5.60 0.32 0.85 0.12 0.00 0.04 0.23 0.09 0.00 0.02 0.32 0.11
BG6-2 0.06 0.07 11.7 2.40 117 20.0 5.09 0.35 0.85 0.08 0.11 0.05 0.03 0.01 0.00 0.02 0.00 0.04
BG6-3 0.03 0.04 9.10 2.60 102 22.0 5.12 0.42 1.11 0.13 0.48 0.09 0.31 0.04 0.05 0.03 0.55 0.13
BG6-4 0.07 0.07 9.70 3.30 254 38.0 5.22 0.40 0.53 0.14 0.36 0.14 0.39 0.05 0.44 0.22 1.26 0.29
BG6-5 0.00 1.00 9.20 2.40 77.0 23.0 4.60 0.38 0.53 0.07 0.00 0.05 0.06 0.03 0.00 0.02 0.00 0.06
BG6-6 0.03 0.04 7.30 2.50 147 26.0 5.10 0.42 0.27 0.13 0.00 0.04 0.10 0.03 0.07 0.04 0.20 0.09
BG6-7 0.00 0.03 14.7 2.10 132 21.0 5.10 0.51 1.03 0.09 1.60 1.10 0.14 0.02 0.13 0.10 0.75 0.53
BG6-8 0.03 0.04 10.1 2.80 236 31.0 5.21 0.41 0.99 0.09 0.26 0.05 0.24 0.08 0.08 0.04 0.57 0.27
BG6-9 0.15 0.09 8.10 2.50 257 41.0 6.14 0.99 1.25 0.12 0.86 0.19 0.57 0.12 0.13 0.06 1.49 0.35
BGD2-1 0.00 1.00 10.8 2.80 130 23.0 5.39 0.50 1.51 0.09 0.00 0.04 0.11 0.03 0.06 0.04 0.22 0.10
BGD2-2 0.00 1.00 10.3 3.20 345 58.0 5.31 0.35 0.51 0.14 0.33 0.09 1.05 0.23 0.10 0.04 0.23 0.11
BGD2-3 0.00 1.00 12.4 2.60 90.0 28.0 5.10 0.56 0.95 0.11 0.00 0.08 0.58 0.61 0.08 0.03 0.34 0.20
BGD2-4 0.38 0.19 14.0 3.10 114 31.0 5.45 0.43 0.55 0.13 0.00 0.04 3.50 0.97 0.09 0.05 0.00 0.07
BGD2-5 0.00 0.03 11.7 2.60 108 30.0 5.63 0.38 1.00 0.08 0.00 0.06 0.05 0.04 0.00 0.02 0.00 0.08
BGD2-6 0.00 1.00 16.3 3.30 106 31.0 5.34 0.49 0.70 0.12 0.11 0.05 0.02 0.02 0.00 0.02 0.00 0.05
BGD2-7 0.00 1.00 11.2 3.20 84.0 21.0 5.58 0.36 0.87 0.09 0.00 0.03 0.01 0.01 0.00 0.02 0.00 0.02
BGD2-8 0.00 1.00 6.90 2.70 115 24.0 5.33 0.47 0.83 0.10 0.00 0.05 0.07 0.03 0.00 0.02 0.00 0.03
BGD2-9 3.63 0.91 18.4 3.40 171 32.0 5.44 0.51 2.97 0.22 2.44 0.43 60.0 14.0 0.25 0.08 3.40 0.66
BGD17-1 0.00 1.00 18.8 5.30 84.0 45.0 6.84 0.69 1.59 0.17 0.00 0.09 0.00 0.01 0.00 0.03 0.00 0.07

254
BGD17-2 0.00 1.00 11.2 4.70 116 34.0 6.48 0.78 1.86 0.13 0.00 0.08 0.00 0.02 0.00 0.03 0.00 0.10
BGD17-3 0.00 1.00 14.9 4.60 85.0 44.0 6.62 0.77 1.10 0.15 0.00 0.09 0.03 0.02 0.00 0.03 0.00 0.06
BGD17-4 0.10 0.11 12.2 6.50 133 54.0 6.17 0.86 1.62 0.19 0.00 0.10 0.09 0.05 0.00 0.03 0.11 0.08
BGD17-5 0.00 1.00 0.00 5.30 370 210 5.66 0.89 1.96 0.22 0.00 0.12 1.70 1.30 0.00 0.03 0.38 0.15
BGD17-6 0.00 1.00 0.00 3.80 138 69.0 6.14 0.76 1.53 0.15 0.00 0.12 0.07 0.05 0.00 0.04 0.00 0.03
BGD17-7 0.06 0.09 0.00 6.20 730 180 8.20 1.20 1.68 0.17 1.14 0.45 2.80 1.10 4.00 2.30 1.31 0.55
BGD17-8 0.04 0.08 9.50 5.10 97.0 56.0 5.50 0.84 0.94 0.16 0.00 0.09 0.23 0.05 0.00 0.05 0.00 0.11
BGD17-9 0.00 1.00 14.5 4.40 212 63.0 6.43 0.68 0.98 0.17 0.00 0.10 0.20 0.06 0.00 0.03 0.00 0.07
BGD17-10 0.00 1.00 16.3 6.40 93.0 56.0 6.26 0.81 1.02 0.19 0.00 0.09 0.11 0.07 0.00 0.03 0.00 0.03
BGD17-11 1.66 0.67 25.8 6.70 1220 110 6.22 0.94 0.00 0.21 0.00 0.09 28.1 9.90 0.00 0.03 0.00 0.10
PD1-1 0.72 2.70 14.6 5.10 177 42.0 6.54 0.54 0.83 0.22 98.0 16.0 40.4 4.40 0.42 0.13 415 65.0
PD1-2 0.12 2.70 0.00 6.50 89.0 51.0 6.05 0.62 0.00 0.25 0.00 0.14 0.08 0.05 0.00 0.03 0.00 0.14
PD1-3 0.00 2.70 0.00 5.10 90.0 67.0 5.42 0.66 0.65 0.16 0.00 0.12 0.07 0.02 0.00 0.04 0.00 0.07
PD1-4 0.00 2.70 0.00 6.30 134 72.0 6.43 0.98 0.59 0.24 0.00 0.17 0.17 0.17 0.00 0.04 0.49 0.45
PD1-5 0.00 2.70 0.00 5.30 67.0 66.0 5.67 0.84 0.51 0.24 0.00 0.15 0.00 0.03 0.00 0.04 0.00 0.09
PD1-6 0.00 2.70 0.00 5.60 72.0 60.0 6.23 0.59 0.00 0.31 0.00 0.12 0.00 0.03 0.00 0.04 0.00 0.14
PD1-7 0.03 2.70 10.20 3.90 44.0 58.0 5.44 0.61 0.85 0.16 0.00 0.09 0.00 0.02 0.00 0.03 0.00 0.08
PD1-8 0.00 2.70 9.20 4.90 84.0 46.0 5.81 0.63 1.01 0.19 0.00 0.11 0.00 0.02 0.00 0.04 0.00 0.07
PD1-9 0.02 2.70 0.00 4.70 61.0 69.0 5.72 0.67 0.73 0.15 0.00 0.13 0.05 0.06 0.00 0.04 0.00 0.11
PD1-10 0.00 2.70 14.2 5.40 350 130 6.03 0.77 0.91 0.18 0.00 0.11 0.40 0.16 0.00 0.03 0.00 0.11
PD1-11 0.04 2.70 11.3 5.80 89.0 41.0 5.45 0.86 0.61 0.17 0.00 0.14 0.00 0.02 0.00 0.03 0.00 0.14
PD1-12 0.00 2.70 8.20 5.00 123 38.0 5.68 0.62 0.00 0.15 0.00 0.14 0.05 0.04 0.00 0.04 0.00 0.11
PD1-13 0.00 2.70 0.00 3.70 99.0 38.0 5.56 0.67 0.00 0.22 0.00 0.11 0.12 0.03 0.10 0.05 0.00 0.17
*Analytical error

255
Appendix Table 6 Oxygen isotope compositions of quartz from the Nashwaak Granites, dykes, and the quartz veins in dykes, measured
by in situ Secondary Ion Mass Spectrometer (SIMS)
Sample Grain 18
O/16
O 1σ (%) inter-session δ
18O (SMOW)
2σ (‰) inter-session
two-mica granite
MBG5_1 Grain 1 0.00202616 0.008563596 10.45 0.17
MBG5_2 Grain 1 0.00202548 0.009240772 10.11 0.18
MBG5_3 Grain 1 0.00202566 0.008976584 10.21 0.18
MBG5_4 Grain 1 0.00202576 0.009735859 10.25 0.19
MBG5_5 Grain 1 0.00202570 0.008145932 10.22 0.16
MBG5_6 Grain 1 0.00202589 0.008788174 10.32 0.18
MBG5_7 Grain 1 0.00202562 0.008433541 10.18 0.17
MBG5_8 Grain 1 0.00202585 0.008339874 10.30 0.17
MBG5_9 Grain 1 0.00202561 0.008219924 10.18 0.16
MBG5_10 Grain 1 0.00202585 0.008903242 10.30 0.18
MBG5_11 Grain 1 0.00202561 0.008594672 10.18 0.17
biotite granite
BG3_1 Grain 1 0.00202210 0.008808097 8.43 0.18
BG3_2 Grain 1 0.00202172 0.008587926 8.24 0.17
BG3_3 Grain 1 0.00202162 0.008569104 8.19 0.17
BG3_4 Grain 1 0.00202157 0.00886874 8.16 0.18
BG3_5 Grain 1 0.00202235 0.009281807 8.55 0.19
BG3_6 Grain 1 0.00202177 0.009142335 8.27 0.18
BG3_7 Grain 1 0.00202166 0.008711057 8.21 0.17
BG3_8 Grain 1 0.00202153 0.008625565 8.14 0.17
BG3_9 Grain 1 0.00202167 0.008750447 8.21 0.18
BG3_10 Grain 1 0.00202155 0.008032875 8.15 0.16
BG3_11 Grain 1 0.00202192 0.008735444 8.34 0.17
BG3_12 Grain 1 0.00202190 0.008501613 8.33 0.17

256
Sample Grain 18
O/16
O 1σ (%) inter-session
δ18
O (SMOW)
2σ (‰) inter-session
biotite granitic dykes
BGD17_Q1_1 grain1 0.00202436 0.008905656 9.55 0.18
BGD17_Q1_2 grain1 0.00202465 0.008553433 9.70 0.17
BGD17_Q1_3 grain1 0.00202481 0.008759964 9.78 0.18
BGD17_Q2_1 grain2 0.00202480 0.008898677 9.78 0.18
BGD17_Q2_2 grain2 0.00202476 0.008851352 9.76 0.18
BGD17_Q2_3 grain2 0.00202465 0.008173729 9.70 0.16
BGD17_Q3_1 grain3 0.00202455 0.008660697 9.65 0.17
BGD17_Q3_2 grain3 0.00202488 0.008918007 9.81 0.18
BGD17_Q3_3 grain3 0.00202473 0.009081026 9.74 0.18
Quartz vein in BGD17
BGD17_1 vein1 0.00202421 0.008244756 9.48 0.16
BGD17_2 vein1 0.00202462 0.008339828 9.69 0.17
BGD17_3 vein1 0.00202451 0.008967347 9.63 0.18
BGD17_4 vein1 0.00202415 0.008744259 9.45 0.17
BGD17_5 vein1 0.00202443 0.0087863 9.59 0.18
BGD17_6 vein1 0.00202427 0.01038343 9.51 0.21
BGD17_7 vein1 0.00202438 0.00862012 9.57 0.17
BGD17_8 vein1 0.00202467 0.008069974 9.71 0.16
BGD17_9 vein1 0.00202455 0.008530475 9.65 0.17
BGD17_10 vein1 0.00202471 0.0082207 9.73 0.16
biotite granitic dykes
BGD2_1 grain 1 0.00202511 0.008309713 9.93 0.17
BGD2_2 grain 1 0.00202465 0.009179807 9.70 0.18
BGD2_3 grain 1 0.00202455 0.008364215 9.65 0.17
BGD2_4 grain 1 0.00202418 0.009034326 9.47 0.18
BGD2_5 grain 1 0.00202424 0.009009034 9.50 0.18
BGD2_6 grain 1 0.00202474 0.00822425 9.74 0.16
BGD2_7 grain 1 0.00202466 0.009369272 9.70 0.19
BGD2_8 grain 1 0.00202462 0.007960968 9.68 0.16
BGD2_1 grain 2 0.00202510 0.00837507 9.93 0.17
BGD2_2 grain 2 0.00202486 0.01016851 9.81 0.20
BGD2_3 grain 2 0.00202512 0.007972853 9.93 0.16
quartz vein in BGD2
BGD2_4 vein 1 0.00202547 0.008794549 10.11 0.18
BGD2_5 vein 1 0.00202569 0.009141544 10.22 0.18
BGD2_6 vein 1 0.00202913 0.009361654 11.93 0.19
BGD2_7 vein 1 0.00202549 0.00827044 10.12 0.17
BGD2_8 vein 1 0.00202707 0.008629907 10.90 0.17
BGD2_9 vein 1 0.00202754 0.009368904 11.14 0.19
BGD2_10 vein 1 0.00202604 0.008230173 10.40 0.16

257
Sample Grain number 18
O/16
O 1σ (%) inter-session δ
18O (SMOW)
2σ (‰) inter-session
porpyry dyke
PD1_1 grain 1 0.00202322 0.008766138 8.99 0.18
PD1_2 grain 1 0.00202360 0.007981402 9.18 0.16
PD1_3 grain 1 0.00202357 0.008968866 9.16 0.18
PD1_4 grain 1 0.00202351 0.009704289 9.13 0.19
PD1_5 grain 1 0.00202352 0.009528162 9.14 0.19
PD1_6 grain 1 0.00202372 0.008589736 9.24 0.17
PD1_7 grain 1 0.00202341 0.008555517 9.08 0.17
PD1_8 grain 1 0.00202363 0.008547981 9.19 0.17
PD1_9 grain 1 0.00202338 0.009179002 9.07 0.18
PD1_1 grain 2 0.00202347 0.009248734 9.11 0.18
PD1_2 grain 2 0.00202338 0.009257406 9.07 0.19
PD1_3 grain 2 0.00202326 0.009518685 9.01 0.19
PD1_4 grain 2 0.00202302 0.008577885 8.89 0.17
PD1_5 grain 2 0.00202348 0.008023347 9.11 0.16
PD1_6 grain 2 0.00202340 0.009747767 9.08 0.19
PD1_7 grain 2 0.00202323 0.008602498 8.99 0.17
PD1_8 grain 2 0.00202377 0.008859052 9.26 0.18
PD1_9 grain 2 0.00202364 0.008567955 9.19 0.17
PD1_10 grain 2 0.00202373 0.008424653 9.24 0.17
PD1_11 grain 2 0.00202378 0.009230702 9.27 0.18
PD1_12 grain 2 0.00202328 0.009666936 9.02 0.19
PD1_13 grain 2 0.00202358 0.008255199 9.16 0.17
S0033_GeeWiz
S0033_1 0.002029842 0.0086422 12.29 0.17
S0033_2 0.002029969 0.0080654 12.35 0.16
S0033_3 0.002030017 0.0093393 12.38 0.19
S0033_4 0.002029833 0.0085168 12.28 0.17
S0033_5 0.002029779 0.0081198 12.26 0.16
S0033_6 0.002029774 0.0087762 12.26 0.18
S0033_7 0.002029948 0.0089583 12.34 0.18
S0033_8 0.002030054 0.0087615 12.39 0.18
S0033_9 0.002029628 0.0086903 12.18 0.17
S0033_10 0.002030137 0.0093479 12.44 0.19
S0033_11 0.002030071 0.0092672 12.40 0.19
S0033_12 0.002030323 0.0094365 12.53 0.19

258
Appendix Table 7 Chemical composition of bioitite from Nashwaak Granites and dykes analyzed by electron probe microanalysis
(EPMA) Group I
MBG3 MBG5 Sample 1 2 3 4 5 1 2 3 4 5 6 7
TZr (°C) 815 815 815 815 815 776 776 776 776 776 776 776
SiO2 35.9 37.3 36.9 36.6 36.3 32.3 32.0 32.4 31.0 31.0 31.4 32.5
TiO2 2.82 3.69 2.18 2.93 1.84 2.88 2.87 2.87 2.11 2.60 2.87 3.09
Al2O3 17.8 20.8 20.6 22.0 20.8 19.7 19.5 19.7 20.6 19.4 19.1 20.2
FeO 18.6 21.2 24.8 23.1 24.1 24.1 24.3 22.9 24.0 25.9 23.6 23.8
MgO 6.39 4.72 5.54 5.19 5.96 5.53 5.53 6.13 6.52 5.09 5.45 5.45
MnO 0.45 0.41 0.38 0.53 0.54 0.37 0.40 0.62 0.56 0.45 0.44 0.45
BaO 0.14 0.00 0.01 0.07 0.00 0.05 0.00 0.10 0.00 0.07 0.00 0.13
CaO 0.24 0.01 0.13 0.28 0.21 0.02 0.01 0.11 0.16 0.13 0.00 0.05
ZnO 0.02 0.02 0.14 0.05 0.07 0.07 0.09 0.04 0.08 0.08 0.17 0.14
K2O 8.64 10.2 6.72 5.76 6.37 10.1 9.99 9.81 8.29 8.70 9.85 9.98
Na2O 0.47 0.35 0.25 0.12 0.20 0.12 0.15 0.12 0.10 0.15 0.08 0.14
Rb2O 0.05 0.07 0.06 0.03 0.06 0.09 0.09 0.09 0.07 0.06 0.19 0.07
F 0.35 0.41 0.53 0.27 0.34 0.59 0.63 0.70 0.42 0.60 0.55 0.47
Cl 0.15 0.11 0.05 0.07 0.05 0.03 0.03 0.02 0.01 0.04 0.01 0.02
H2O 3.61 3.86 3.78 3.90 3.82 3.53 3.49 3.49 3.57 3.43 3.46 3.62
O=F -0.15 -0.17 -0.22 -0.12 -0.14 -0.25 -0.27 -0.29 -0.18 -0.25 -0.23 -0.20
O=Cl -0.03 -0.02 -0.01 -0.02 -0.01 -0.01 -0.01 0.00 0.00 -0.01 0.00 0.00
Total 95.5 103 102 101 100 99.2 98.7 98.8 97.3 97.4 97.0 99.9
Si 5.64 5.48 5.47 5.41 5.44 5.07 5.06 5.08 4.94 4.99 5.06 5.06
Al IV 2.36 2.52 2.53 2.59 2.56 2.93 2.94 2.92 3.06 3.01 2.94 2.94
Tsite 8.00 8.00 8.00 8.00 8.00 8.00 8.00 8.00 8.00 8.00 8.00 8.00
Ti 0.33 0.41 0.24 0.33 0.21 0.34 0.34 0.34 0.25 0.32 0.35 0.36
Al Vi 0.94 1.08 1.06 1.25 1.12 0.72 0.68 0.71 0.80 0.66 0.69 0.77
V 0.00 0.00 0.00 0.00 0.00 0.00 0.00 0.00 0.00 0.00 0.00 0.00
Fe 2.45 2.61 3.07 2.86 3.02 3.16 3.21 2.99 3.20 3.49 3.18 3.10
Mg 1.50 1.03 1.23 1.15 1.33 1.29 1.30 1.43 1.55 1.22 1.31 1.27
Mn 0.06 0.05 0.05 0.07 0.07 0.05 0.05 0.08 0.08 0.06 0.06 0.06
Zn 0.00 0.00 0.02 0.01 0.01 0.01 0.01 0.00 0.01 0.01 0.02 0.02
O site 5.28 5.19 5.67 5.66 5.75 5.57 5.59 5.56 5.88 5.76 5.60 5.57
Ca 0.04 0.00 0.02 0.04 0.03 0.00 0.00 0.02 0.03 0.02 0.00 0.01
K 1.73 1.92 1.27 1.09 1.22 2.03 2.01 1.96 1.68 1.79 2.02 1.98
Na 0.14 0.10 0.07 0.03 0.06 0.04 0.05 0.04 0.03 0.05 0.02 0.04
F 0.17 0.19 0.25 0.13 0.16 0.29 0.32 0.35 0.21 0.30 0.28 0.23
Cl 0.04 0.03 0.01 0.02 0.01 0.01 0.01 0.00 0.00 0.01 0.00 0.00
OH 3.79 3.78 3.74 3.85 3.83 3.70 3.67 3.65 3.79 3.68 3.72 3.76
Al 3.30 3.60 3.59 3.84 3.68 3.64 3.62 3.64 3.87 3.67 3.62 3.71
X Mg 0.28 0.20 0.22 0.20 0.23 0.23 0.23 0.26 0.26 0.21 0.23 0.23
X Sid 0.53 0.68 0.66 0.72 0.67 0.71 0.70 0.68 0.73 0.74 0.70 0.72
X An 0.19 0.12 0.12 0.07 0.10 0.06 0.06 0.06 0.01 0.05 0.06 0.05
IV(F) 1.95 1.79 1.69 1.96 1.90 1.62 1.59 1.58 1.81 1.57 1.65 1.72
IV(Cl) -3.59 -3.25 -2.97 -3.07 -3.01 -2.77 -2.85 -2.56 -2.13 -2.87 -2.41 -2.54
log(fH2O)/(fHf) 4.23 4.10 4.01 4.29 4.22 4.03 4.00 3.98 4.22 3.99 4.06 4.14
log(fH2O)/(fHCl) 3.57 3.78 4.09 3.96 4.07 4.35 4.26 4.58 5.03 4.22 4.70 4.56
log(fHf/fHCl) -0.67 -0.32 0.08 -0.33 -0.15 0.31 0.26 0.60 0.81 0.22 0.64 0.42 .

259
Group I Group II
MBG5 MBG11 BG3 Sample
8 9 10 1 2 3 4 5 1 2 3 4
TZr (°C) 776 776 776 731 731 731 731 731 774 774 774 774
SiO2 32.0 32.6 32.0 32.6 32.2 30.5 34.2 32.7 33.2 34.4 35.1 34.4
TiO2 3.46 3.29 2.63 2.40 2.40 1.94 1.89 2.15 3.16 2.99 3.06 2.82
Al2O3 19.4 19.6 18.8 20.2 20.5 20.8 22.2 22.0 15.4 15.8 15.3 15.2
FeO 24.5 23.7 25.1 21.9 21.6 23.3 19.1 20.5 18.7 19.0 19.0 19.2
MgO 5.29 5.63 6.23 6.49 6.39 7.04 5.73 6.38 10.03 10.27 10.45 10.65
MnO 0.45 0.44 0.46 0.47 0.46 0.42 0.34 0.38 0.31 0.27 0.35 0.32
BaO 0.02 0.04 0.00 0.13 0.03 0.06 0.05 0.00 0.00 0.00 0.00 0.00
CaO 0.09 0.00 0.02 0.03 0.05 0.08 0.09 0.12 0.12 0.16 0.04 0.13
ZnO 0.06 0.06 0.13 0.12 0.10 0.12 0.04 0.12 0.09 0.09 0.09 0.07
K2O 9.48 10.12 9.08 10.01 9.78 6.86 8.59 9.43 8.80 8.04 9.15 8.32
Na2O 0.10 0.18 0.15 0.33 0.12 0.11 0.11 0.23 0.22 0.23 0.20 0.20
Rb2O 0.14 0.08 0.08 0.04 0.11 0.05 0.06 0.07 0.00 0.00 0.00 0.00
F 0.46 0.68 0.19 0.83 0.78 0.59 0.70 0.81 0.30 0.26 0.28 0.22
Cl 0.02 0.03 0.03 0.06 0.02 0.02 0.01 0.03 0.05 0.08 0.04 0.06
H2O 3.57 3.52 3.67 3.44 3.45 3.44 3.54 3.49 3.55 3.64 3.68 3.65
O=F -0.20 -0.29 -0.08 -0.35 -0.33 -0.25 -0.29 -0.34 -0.13 -0.11 -0.12 -0.09
O=Cl 0.00 -0.01 -0.01 -0.01 0.00 -0.01 0.00 -0.01 -0.01 -0.02 -0.01 -0.01
Total 98.8 99.6 98.4 98.7 97.8 95.1 96.3 98.1 93.9 95.1 96.6 95.2
Si 5.05 5.08 5.09 5.08 5.06 4.91 5.29 5.05 5.38 5.46 5.50 5.47
Al IV 2.95 2.92 2.91 2.92 2.94 3.09 2.71 2.95 2.62 2.54 2.50 2.53
Tsite 8.00 8.00 8.00 8.00 8.00 8.00 8.00 8.00 8.00 8.00 8.00 8.00
Ti 0.41 0.39 0.32 0.28 0.28 0.23 0.22 0.25 0.38 0.36 0.36 0.34
Al Vi 0.66 0.67 0.61 0.80 0.86 0.86 1.34 1.06 0.32 0.40 0.33 0.32
V 0.00 0.00 0.00 0.00 0.00 0.00 0.00 0.00 0.00 0.00 0.00 0.00
Fe 3.23 3.09 3.34 2.85 2.84 3.14 2.47 2.66 2.53 2.52 2.50 2.56
Mg 1.25 1.31 1.48 1.51 1.49 1.69 1.32 1.47 2.42 2.43 2.44 2.53
Mn 0.06 0.06 0.06 0.06 0.06 0.06 0.05 0.05 0.04 0.04 0.05 0.04
Zn 0.01 0.01 0.02 0.01 0.01 0.01 0.00 0.01 0.01 0.01 0.01 0.01
O site 5.62 5.53 5.83 5.51 5.55 5.99 5.41 5.50 5.72 5.76 5.69 5.80
Ca 0.02 0.00 0.00 0.01 0.01 0.01 0.02 0.02 0.02 0.03 0.01 0.02
K 1.91 2.01 1.84 1.99 1.96 1.41 1.70 1.86 1.82 1.63 1.83 1.69
Na 0.03 0.05 0.05 0.10 0.04 0.03 0.03 0.07 0.07 0.07 0.06 0.06
F 0.23 0.34 0.10 0.41 0.39 0.30 0.34 0.39 0.15 0.13 0.14 0.11
Cl 0.00 0.01 0.01 0.02 0.00 0.01 0.00 0.01 0.01 0.02 0.01 0.02
OH 3.76 3.66 3.89 3.58 3.61 3.69 3.65 3.60 3.83 3.85 3.85 3.87
Al 3.61 3.60 3.52 3.72 3.80 3.95 4.05 4.01 2.95 2.95 2.83 2.85
X Mg 0.22 0.24 0.25 0.27 0.27 0.28 0.24 0.27 0.42 0.42 0.43 0.44
X Sid 0.71 0.69 0.66 0.68 0.70 0.72 0.73 0.73 0.39 0.38 0.34 0.35
X An 0.07 0.07 0.08 0.05 0.03 0.00 0.02 0.00 0.19 0.20 0.23 0.22
IV(F) 1.72 1.57 2.16 1.51 1.53 1.66 1.56 1.51 2.20 2.27 2.26 2.37
IV(Cl) -2.48 -2.79 -2.86 -3.22 -2.66 -2.78 -2.49 -2.79 -3.39 -3.54 -3.32 -3.46
log(fH2O)/(fHf) 4.13 3.98 4.56 4.03 4.06 4.19 4.09 4.04 4.54 4.61 4.59 4.69
log(fH2O)/(fHCl) 4.62 4.33 4.28 4.00 4.54 4.45 4.69 4.41 3.99 3.84 4.07 3.94
log(fHf/fHCl) 0.49 0.35 -0.28 -0.03 0.49 0.26 0.60 0.37 -0.55 -0.77 -0.52 -0.76

260
Group II
BG7 BG8 Sample
1 2 3 4 5 6 7 8 1 2 3 4
TZr (°C) 804 804 804 804 804 804 804 804 811 811 811 811
SiO2 31.5 31.8 31.7 31.6 32.3 32.4 32.5 32.5 32.6 32.3 30.6 32.7
TiO2 3.98 3.68 3.78 3.84 3.66 3.82 4.09 3.94 3.95 3.19 2.60 3.99
Al2O3 16.6 16.4 16.2 16.4 16.6 16.4 16.5 16.5 17.6 17.8 17.6 17.8
FeO 24.7 24.6 25.2 24.5 24.6 24.5 24.3 24.4 23.0 23.0 25.0 23.3
MgO 6.58 6.44 6.54 6.48 6.90 6.51 6.34 6.51 6.71 7.11 7.46 6.60
MnO 0.42 0.45 0.45 0.51 0.43 0.44 0.43 0.41 0.41 0.39 0.42 0.40
BaO 0.10 0.02 0.00 0.06 0.13 0.03 0.16 0.03 0.05 0.14 0.08 0.08
CaO 0.03 0.02 0.07 0.14 0.02 0.00 0.03 0.04 0.02 0.09 0.23 0.02
ZnO 0.02 0.09 0.06 0.08 0.04 0.06 0.07 0.05 0.05 0.11 0.08 0.05
K2O 10.01 9.99 9.77 9.59 9.90 10.24 10.11 10.16 10.20 10.06 7.98 10.2
Na2O 0.14 0.13 0.21 0.20 0.12 0.13 0.19 0.25 0.18 0.09 0.06 0.13
Rb2O 0.03 0.02 0.06 0.07 0.04 0.06 0.05 0.00 0.05 0.06 0.04 0.08
F 0.50 0.46 0.50 0.46 0.51 0.47 0.47 0.45 0.42 0.33 0.26 0.41
Cl 0.03 0.04 0.07 0.06 0.03 0.03 0.06 0.07 0.05 0.02 0.02 0.03
H2O 3.48 3.48 3.46 3.47 3.51 3.52 3.53 3.53 3.59 3.61 3.54 3.61
O=F -0.21 -0.19 -0.21 -0.19 -0.22 -0.20 -0.20 -0.19 -0.18 -0.14 -0.11 -0.17
O=Cl -0.01 -0.01 -0.02 -0.01 -0.01 -0.01 -0.01 -0.02 -0.01 0.00 0.00 -0.01
Total 97.8 97.4 97.8 97.3 98.5 98.5 98.6 98.6 98.7 98.2 95.8 99.3
Si 5.08 5.14 5.11 5.12 5.15 5.17 5.18 5.17 5.14 5.14 5.00 5.14
Al IV 2.92 2.86 2.89 2.88 2.85 2.83 2.82 2.83 2.86 2.86 3.00 2.86
Tsite 8.00 8.00 8.00 8.00 8.00 8.00 8.00 8.00 8.00 8.00 8.00 8.00
Ti 0.48 0.45 0.46 0.47 0.44 0.46 0.49 0.47 0.47 0.38 0.32 0.47
Al Vi 0.22 0.27 0.20 0.25 0.26 0.27 0.28 0.28 0.43 0.47 0.40 0.44
V 0.00 0.00 0.00 0.00 0.00 0.00 0.00 0.00 0.00 0.00 0.00 0.00
Fe 3.33 3.33 3.39 3.31 3.29 3.28 3.24 3.25 3.04 3.06 3.42 3.06
Mg 1.58 1.55 1.57 1.56 1.64 1.55 1.51 1.55 1.58 1.68 1.82 1.55
Mn 0.06 0.06 0.06 0.07 0.06 0.06 0.06 0.05 0.05 0.05 0.06 0.05
Zn 0.00 0.01 0.01 0.01 0.00 0.01 0.01 0.01 0.01 0.01 0.01 0.01
O site 5.67 5.67 5.70 5.67 5.69 5.63 5.58 5.60 5.57 5.66 6.02 5.58
Ca 0.00 0.00 0.01 0.02 0.00 0.00 0.00 0.01 0.00 0.01 0.04 0.00
K 2.06 2.06 2.01 1.98 2.01 2.09 2.06 2.06 2.06 2.04 1.67 2.04
Na 0.05 0.04 0.06 0.06 0.04 0.04 0.06 0.08 0.06 0.03 0.02 0.04
F 0.25 0.23 0.25 0.23 0.26 0.24 0.23 0.23 0.21 0.17 0.13 0.20
Cl 0.01 0.01 0.02 0.02 0.01 0.01 0.02 0.02 0.01 0.01 0.01 0.01
OH 3.74 3.76 3.73 3.75 3.73 3.76 3.75 3.75 3.78 3.83 3.86 3.79
Al 3.14 3.13 3.09 3.13 3.11 3.10 3.10 3.11 3.28 3.34 3.40 3.30
X Mg 0.28 0.27 0.28 0.28 0.29 0.28 0.27 0.28 0.28 0.30 0.30 0.28
X Sid 0.57 0.56 0.56 0.57 0.55 0.55 0.55 0.55 0.59 0.59 0.61 0.59
X An 0.15 0.16 0.17 0.16 0.16 0.17 0.18 0.17 0.13 0.12 0.09 0.13
IV(F) 1.77 1.80 1.77 1.81 1.78 1.81 1.80 1.82 1.86 1.98 2.08 1.86
IV(Cl) -2.95 -2.98 -3.24 -3.20 -2.87 -2.85 -3.17 -3.25 -3.08 -2.76 -2.79 -2.91
log(fH2O)/(fHf) 4.09 4.12 4.08 4.12 4.09 4.12 4.11 4.13 4.16 4.28 4.39 4.16
log(fH2O)/(fHCl) 4.20 4.16 3.91 3.95 4.29 4.30 3.98 3.90 4.07 4.41 4.39 4.23
log(fHf/fHCl) 0.12 0.05 -0.17 -0.17 0.21 0.19 -0.13 -0.23 -0.09 0.14 0.00 0.07

261
Group II Group III
BG8 BGD5 BGD16 Sample
5 6 7 8 9 1 2 3 1 2 3 4
TZr (°C) 811 811 811 811 811 748 748 748 783 783 783 783
SiO2 33.0 32.9 32.4 32.8 32.1 32.2 33.0 33.1 34.8 36.2 38.0 37.8
TiO2 4.29 3.81 3.62 3.47 3.40 3.06 2.94 2.50 1.76 1.92 2.70 2.47
Al2O3 18.3 17.7 18.2 17.8 17.5 17.5 17.9 18.1 16.3 17.2 17.8 18.3
FeO 22.7 23.4 23.4 23.2 23.1 24.9 25.4 25.9 21.4 21.1 18.5 18.3
MgO 6.33 6.69 6.90 6.73 6.90 5.78 6.30 6.11 10.6 11.4 10.2 9.83
MnO 0.39 0.42 0.37 0.37 0.39 0.27 0.25 0.35 0.22 0.22 0.22 0.26
BaO 0.03 0.05 0.05 0.02 0.08 0.00 0.00 0.00 0.04 0.04 0.18 0.31
CaO 0.03 0.00 0.05 0.00 0.05 0.21 0.09 0.16 0.11 0.04 0.05 0.03
ZnO 0.00 0.03 0.04 0.04 0.02 0.01 0.03 0.03 0.00 0.00 0.00 0.04
K2O 10.3 10.4 9.88 10.3 10.2 6.14 7.21 5.81 5.94 5.92 9.56 9.96
Na2O 0.10 0.07 0.12 0.14 0.06 0.17 0.15 0.15 0.25 0.15 0.28 0.30
Rb2O 0.05 0.05 0.07 0.02 0.07 0.00 0.00 0.00 0.05 0.06 0.06 0.02
F 0.35 0.42 0.38 0.40 0.33 0.32 0.40 0.40 0.47 0.57 0.68 0.61
Cl 0.03 0.03 0.03 0.03 0.02 0.07 0.04 0.16 0.13 0.08 0.14 0.14
H2O 3.66 3.62 3.62 3.61 3.58 3.49 3.57 3.53 3.56 3.67 3.73 3.76
O=F -0.15 -0.17 -0.16 -0.17 -0.14 -0.14 -0.17 -0.17 -0.20 -0.24 -0.29 -0.26
O=Cl -0.01 -0.01 -0.01 -0.01 -0.01 -0.02 -0.01 -0.04 -0.03 -0.02 -0.03 -0.03
Total 99.3 99.4 99.0 98.8 97.7 93.9 97.1 96.1 95.4 98.3 102 102
Si 5.15 5.17 5.10 5.17 5.14 5.26 5.24 5.28 5.47 5.47 5.57 5.56
Al IV 2.85 2.83 2.90 2.83 2.86 2.74 2.76 2.72 2.53 2.53 2.43 2.44
Tsite 8.00 8.00 8.00 8.00 8.00 8.00 8.00 8.00 8.00 8.00 8.00 8.00
Ti 0.50 0.45 0.43 0.41 0.41 0.38 0.35 0.30 0.21 0.22 0.30 0.27
Al Vi 0.52 0.44 0.48 0.49 0.44 0.64 0.60 0.69 0.48 0.53 0.65 0.72
V 0.00 0.00 0.00 0.00 0.00 0.00 0.00 0.00 0.00 0.00 0.00 0.00
Fe 2.96 3.07 3.08 3.06 3.10 3.41 3.37 3.45 2.82 2.67 2.27 2.24
Mg 1.48 1.56 1.62 1.58 1.65 1.41 1.49 1.45 2.49 2.57 2.22 2.15
Mn 0.05 0.06 0.05 0.05 0.05 0.04 0.03 0.05 0.03 0.03 0.03 0.03
Zn 0.00 0.00 0.00 0.00 0.00 0.00 0.00 0.00 0.00 0.00 0.00 0.00
O site 5.52 5.58 5.66 5.60 5.64 5.87 5.85 5.95 6.02 6.03 5.46 5.43
Ca 0.01 0.00 0.01 0.00 0.01 0.04 0.02 0.03 0.02 0.01 0.01 0.00
K 2.04 2.08 1.98 2.07 2.09 1.28 1.46 1.18 1.19 1.14 1.79 1.87
Na 0.03 0.02 0.04 0.04 0.02 0.05 0.05 0.05 0.08 0.05 0.08 0.09
F 0.17 0.21 0.19 0.20 0.17 0.17 0.20 0.20 0.24 0.27 0.32 0.28
Cl 0.01 0.01 0.01 0.01 0.01 0.02 0.01 0.04 0.03 0.02 0.04 0.03
OH 3.82 3.79 3.80 3.79 3.83 3.81 3.79 3.75 3.73 3.71 3.65 3.68
Al 3.37 3.27 3.38 3.32 3.30 3.37 3.36 3.41 3.01 3.06 3.08 3.17
X Mg 0.27 0.28 0.29 0.28 0.29 0.24 0.26 0.24 0.41 0.43 0.41 0.40
X Sid 0.62 0.58 0.61 0.59 0.58 0.62 0.61 0.63 0.40 0.40 0.40 0.43
X An 0.12 0.14 0.11 0.13 0.12 0.13 0.13 0.13 0.19 0.18 0.19 0.17
IV(F) 1.92 1.86 1.91 1.88 1.97 1.90 1.84 1.82 1.99 1.93 1.84 1.88
IV(Cl) -2.85 -2.81 -2.92 -2.81 -2.77 -3.18 -2.99 -3.53 -3.77 -3.56 -3.78 -3.74
log(fH2O)/(fHf) 4.23 4.16 4.21 4.18 4.27 4.37 4.29 4.28 4.30 4.25 4.16 4.20
log(fH2O)/(fHCl) 4.28 4.34 4.24 4.34 4.39 3.97 4.18 3.63 3.59 3.82 3.57 3.60
log(fHf/fHCl) 0.06 0.18 0.02 0.16 0.12 -0.39 -0.11 -0.65 -0.71 -0.43 -0.59 -0.60

262
Group III Group IV
BGD16 BGD2 BGD6 BGD11 PD1
Sample 5 6 1 2 3 1 1 2 3 1 2 3 4 5
TZr (°C) 783 783 747 747 747 774 719 719 719 772 772 772 772 772
SiO2 39.1 36.9 33.4 35.4 35.9 35.4 34.9 34.4 31.6 34.4 34.6 34.0 35.2 36.2
TiO2 2.07 2.32 2.12 3.03 3.05 2.22 2.48 2.98 2.21 3.87 3.82 3.62 4.27 4.55
Al2O3 18.0 17.9 19.2 17.8 17.7 17.6 18.1 18.8 18.4 15.1 18.4 19.4 14.3 14.5
FeO 17.9 20.4 22.3 22.8 22.4 25.5 22.0 20.2 22.6 23.5 22.4 22.8 22.7 22.3
MgO 10.4 9.52 6.90 7.41 7.49 8.82 7.87 7.74 8.78 9.12 7.19 5.89 9.36 8.79
MnO 0.22 0.29 0.37 0.44 0.40 0.49 0.23 0.25 0.31 0.26 0.27 0.40 0.26 0.26
BaO 0.12 0.23 0.01 0.01 0.06 0.09 0.00 0.00 0.00 0.03 0.00 0.01 0.11 0.13
CaO 0.03 0.04 0.04 0.00 0.01 0.12 0.07 0.36 0.12 0.04 0.01 0.05 0.06 0.04
ZnO 0.03 0.03 0.08 0.06 0.09 0.03 0.06 0.04 0.03 0.00 0.03 0.08 0.00 0.02
K2O 10.1 8.59 9.85 9.79 9.77 5.39 7.72 5.34 5.78 7.97 9.19 8.88 8.99 8.85
Na2O 0.20 0.19 0.70 0.26 0.28 0.21 0.18 0.07 0.09 0.13 0.27 0.31 0.13 0.17
Rb2O 0.08 0.06 0.07 0.00 0.06 0.05 0.00 0.00 0.00 0.00 0.02 0.00 0.00 0.00
F 0.83 0.15 0.49 0.53 0.55 0.33 0.54 0.42 0.49 0.58 0.42 0.30 0.68 0.59
Cl 0.15 0.11 0.27 0.09 0.14 0.20 0.07 0.05 0.06 0.15 0.09 0.11 0.18 0.17
H2O 3.70 3.89 3.55 3.67 3.67 3.74 3.60 3.60 3.46 3.54 3.71 3.72 3.52 3.61
O=F -0.35 -0.06 -0.21 -0.22 -0.23 -0.14 -0.23 -0.18 -0.20 -0.25 -0.18 -0.13 -0.29 -0.25
O=Cl -0.03 -0.02 -0.06 -0.02 -0.03 -0.05 -0.02 -0.01 -0.01 -0.03 -0.02 -0.03 -0.04 -0.04
Total 102 101 99.15 101 101 100 97.6 94.0 93.7 98.7 100 99.7 99.7 100
Si 5.66 5.53 5.20 5.38 5.43 5.38 5.40 5.41 5.11 5.35 5.27 5.24 5.42 5.52
Al IV 2.34 2.47 2.80 2.62 2.57 2.62 2.60 2.59 2.89 2.65 2.73 2.76 2.58 2.48
Tsite 8.00 8.00 8.00 8.00 8.00 8.00 8.00 8.00 8.00 8.00 8.00 8.00 8.00 8.00
Ti 0.23 0.26 0.25 0.35 0.35 0.25 0.29 0.35 0.27 0.45 0.44 0.42 0.49 0.52
Al Vi 0.73 0.71 0.73 0.57 0.58 0.54 0.71 0.90 0.61 0.12 0.58 0.76 0.02 0.13
V 0.00 0.00 0.00 0.00 0.00 0.00 0.00 0.00 0.00 0.03 0.03 0.03 0.03 0.04
Fe 2.16 2.56 2.90 2.90 2.83 3.24 2.85 2.66 3.06 3.06 2.85 2.93 2.92 2.85
Mg 2.24 2.13 1.60 1.68 1.69 2.00 1.82 1.82 2.12 2.11 1.63 1.35 2.15 2.00
Mn 0.03 0.04 0.05 0.06 0.05 0.06 0.03 0.03 0.04 0.03 0.04 0.05 0.03 0.03
Zn 0.00 0.00 0.01 0.01 0.01 0.00 0.01 0.01 0.00 0.00 0.00 0.01 0.00 0.00
O site 5.39 5.69 5.54 5.55 5.51 6.10 5.71 5.77 6.10 5.81 5.57 5.55 5.65 5.57
Ca 0.00 0.01 0.01 0.00 0.00 0.02 0.01 0.06 0.02 0.01 0.00 0.01 0.01 0.01
K 1.86 1.64 1.96 1.90 1.89 1.05 1.53 1.07 1.19 1.58 1.79 1.74 1.77 1.72
Na 0.06 0.06 0.21 0.08 0.08 0.06 0.05 0.02 0.03 0.04 0.08 0.09 0.04 0.05
F 0.38 0.07 0.24 0.25 0.26 0.16 0.26 0.21 0.25 0.29 0.20 0.15 0.33 0.29
Cl 0.04 0.03 0.07 0.02 0.03 0.05 0.02 0.01 0.02 0.04 0.02 0.03 0.05 0.04
OH 3.58 3.90 3.69 3.72 3.70 3.79 3.72 3.78 3.73 3.67 3.77 3.83 3.62 3.67
Al 3.07 3.17 3.53 3.18 3.15 3.15 3.31 3.49 3.50 2.77 3.30 3.52 2.60 2.61
X Mg 0.42 0.37 0.29 0.30 0.31 0.33 0.32 0.31 0.35 0.36 0.29 0.24 0.38 0.36
X Sid 0.39 0.45 0.62 0.52 0.51 0.50 0.53 0.57 0.57 0.39 0.57 0.65 0.32 0.32
X An 0.20 0.18 0.09 0.18 0.19 0.18 0.15 0.12 0.08 0.25 0.14 0.10 0.30 0.32
IV(F) 1.76 2.46 1.78 1.81 1.79 2.06 1.80 1.90 1.85 1.84 1.88 1.96 1.80 1.85
IV(Cl) -3.83 -3.58 -3.85 -3.41 -3.57 -3.78 -3.33 -3.17 -3.32 -3.73 -3.37 -3.36 -3.87 -3.77
log(fH2O)/(fHf) 4.08 4.79 4.25 4.25 4.23 4.42 4.32 4.43 4.38 4.18 4.28 4.36 4.14 4.18
log(fH2O)/(fHCl) 3.53 3.72 3.37 3.83 3.67 3.47 3.95 4.12 4.00 3.55 3.90 3.76 3.44 3.55
log(fHf/fHCl) -0.55 -1.07 -0.88 -0.41 -0.56 -0.95 -0.37 -0.31 -0.38 -0.62 -0.37 -0.60 -0.70 -0.62
Notes: Formula calculations are based on 22 oxygen, OH is calculated by OH=4-(Cl+F), Intercept value IV(F), IV(Cl) and halogen fugacity are calculated after Munoz (1984, 1992)

263
Appendix Table 8 Results of repeated analyses of the GOR 128-G standard by laser ablation-ICPMS and comparison with reference
values
1 2 3 4 5 6 7 8 9 10 11
ppm
Ti 1445 1464 1362 1458 1438 1478 1474 1456 1505 1437 1447
Al 55700 55600 50000 52000 56100 54200 55700 54500 56100 54700 54300
Fe 75000 73800 68500 74000 75800 74100 74400 73900 75500 73400 76400
Mn 1433 1451 1370 1480 1460 1426 1450 1498 1477 1418 1495
Mg 146500 149000 145300 144700 151100 158500 153000 151600 149600 153900 149300
Ca 41000 41940 38890 39910 39700 41000 41250 40600 41700 40100 40200
Na 4140 4120 3906 4150 4220 4230 4207 4207 4200 4120 4160
K 303 302 295 309 292 300 310 312 304 308 298
Li 10.8 10.7 10.5 11.3 11.4 10.8 11.3 11.0 11.0 11.0 10.9
Be 0 0 0 0 0 0 0 0 0 0 0
Rb 0.38 0.38 0.36 0.35 0.38 0.41 0.43 0.36 0.40 0.34 0.36
Sr 27.5 26.9 25.1 26.3 27.2 26.5 27.8 27.1 26.9 26.5 27.0
Ba 0.94 0.86 0.88 0.92 0.97 0.97 1.04 1.01 0.85 1.02 0.89
Cs 0.21 0.21 0.18 0.21 0.19 0.21 0.22 0.23 0.22 0.18 0.17
Ga 8.96 8.96 8.89 9.36 8.85 8.93 9.15 8.94 9.19 8.78 8.94
Tl 0.00 0.00 0.00 0.00 0.00 0.00 0.00 0.00 0.00 0.01 0.00
Ta 0.01 0.01 0.01 0.01 0.02 0.01 0.01 0.02 0.01 0.01 0.01
Sc 28.9 29.1 25.0 26.5 28.8 27.8 29.5 28.1 28.9 28.5 29.0
V 179 176 174 178 180 178 181 178 178 177 179
Cr 2155 2122 1979 2074 2117 2142 2179 2150 2125 2151 2142
Co 84.7 86.3 80.4 83.5 86.9 86.2 88.7 86.3 84.5 86.3 86.5
Ni 1007 1058 996 986 1102 1097 1120 1078 1039 1113 1066
Cu 64.2 63.2 62.3 66.0 60.7 61.4 61.2 61.6 61.0 59.4 63.2
Zn 74.6 74.3 75.1 77.7 73.2 73.9 75.6 75.3 76.0 74.1 76.4
Mo 0.54 0.44 0.45 0.54 0.51 0.51 0.50 0.52 0.61 0.52 0.51
Sn 0.20 0.12 0.16 0.19 0.13 0.11 0.23 0.20 0.13 0.13 0.11
W 15.2 15.0 14.3 15.1 15.1 15.1 15.5 15.3 15.3 14.8 15.3

264
12 13 14 15 16 17 18 19 20 ref.a RDb RSDc
Ti 1470 1495 1488 1409 1402 1421 1503 1380 1397 1728 -16.3 2.83
Al 56000 54400 54500 51500 53400 53300 55700 50300 52460 52465 2.97 3.51
Fe 75300 75700 73600 71300 72100 77500 75900 69300 71400 76300 -3.22 3.15
Mn 1472 1448 1491 1366 1412 1501 1482 1416 1454 1363 6.35 2.73
Mg 146300 151600 150700 145200 152400 153800 152100 141600 141400 156000 -4.24 2.94
Ca 41100 40500 39100 38600 40600 40800 40900 38610 38340 44571 -9.71 2.64
Na 4205 4220 4182 3850 3954 4140 4100 3883 4044 4259 -3.45 2.93
K 289 301 302 294 292 297 296 283 297 299 0.14 2.51
Li 10.9 10.9 10.7 10.6 10.8 11.0 11.1 10.3 10.5 10.4 4.44 2.60
Be 0 0 0 0 0 0 0 0.034
Rb 0.39 0.34 0.39 0.36 0.36 0.34 0.37 0.39 0.38 0.41 -8.60 6.52
Sr 27.0 27.1 26.3 25.9 26.0 26.1 26.9 25.9 26.6 30.0 -11.3 2.43
Ba 0.95 0.98 0.86 0.79 0.89 0.86 0.90 0.89 0.99 1.06 -12.9 7.17
Cs 0.20 0.19 0.30 0.21 0.20 0.22 0.17 0.21 0.19 0.24 -14.2 13.9
Ga 8.97 8.82 9.11 8.39 8.89 8.84 8.78 8.67 3.01 2.28
Tl 0.00 0.00 0.00 0.00 0.00 0.00 0.00 <0.003
Ta 0.02 0.01 0.02 0.02 0.01 0.01 0.01 0.01 0.01 0.02 -27.4 18.6
Sc 28.6 29.2 28.2 27.4 28.1 27.6 29.4 32.1 -12.0 4.00
V 175 181 179 175 176 176 180 189 -5.94 1.19
Cr 2046 2175 2121 2074 2107 2170 2148 2272 -6.65 2.39
Co 85.4 85.0 85.6 83.1 84.9 85.9 87.8 92.4 -7.53 2.18
Ni 1010 1057 1040 1011 1074 1092 1064 1074 -1.67 3.91
Cu 61.5 61.6 60.1 61.1 60.3 60.5 63.0 63.8 -3.14 2.62
Zn 74.1 73.0 74.8 72.1 72.1 75.0 75.2 73.1 75.4 74.7 -0.20 1.90
Mo 0.54 0.51 0.76 0.53 0.47 0.56 0.51 0.50 0.48 0.71 -26.0 12.7
Sn 0.18 0.13 0.14 0.13 0.15 0.22 0.17 0.15 0.13 0.22 -31.1 24.2
W 15.0 15.3 15.0 14.6 14.6 14.9 15.1 16.2 16.3 15.5 -2.25 3.08
a. Ref. is the reference values for GOR128-G (Jochum et al., 2006); b. %RD=(ppmmean-ppmref.)/ppmref. × 100%; c. %RSD = standard deviation/average value × 100%.

265
Appendix Table 9 Limits of detection for the trace element concentrations in the quartz from the Nashwaak Granites and related dykes by laser ablation-ICPMS
MBG3 MBG5 BG3 BG7
ppm 1 1 2 3 4 5 6 7 8 9 1 2 3 4 1 2 3 4 5 6
Ti 2.38 0.99 0.58 1.49 1.41 0.14 0.43 0.43 0.45 0.58 0.13 1.95 1.83 1.05 0.79 1.30 2.22 1.43 1.46 0.88
Al 5.38 4.69 2.02 3.78 4.12 2.15 3.00 3.01 7.32 15.83 3.09 9.72 7.48 8.61 3.14 3.21 34.6 17.3 17.6 7.86
Fe 9.51 8.64 5.75 6.10 53.7 11.4 6.68 6.75 3.53 3.75 63.6 13.1 25.8 6.50 7.72 8.22 33.2 8.91 9.07 10.2
Mn 1.12 1.18 0.87 1.08 0.87 0.93 1.29 1.30 1.09 1.26 0.71 1.20 0.87 0.62 0.91 0.74 0.97 1.28 1.30 0.79
Mg 2.49 1.44 0.69 1.76 1.02 27.52 1.46 1.47 1.45 1.01 8.02 7.11 7.04 1.27 4.39 2.73 9.87 7.57 7.75 3.00
Ca 44.0 44.7 52.2 61.9 59.7 57.8 71.1 71.7 74.7 57.1 34.6 49.6 44.1 58.3 64.3 42.6 43.2 47.8 48.9 64.2
Na 1.93 2.09 2.03 2.08 1.84 1.43 2.48 2.49 1.90 2.19 1.87 1.41 2.08 1.62 1.84 2.03 1.77 2.19 2.24 1.59
K 8.46 3.53 3.03 2.11 2.34 1.62 7.98 8.04 5.40 2.26 1.52 5.50 8.32 9.59 4.37 3.94 13.4 10.7 10.9 3.4
Li 0.09 0.08 0.08 0.12 0.09 0.07 0.12 0.12 0.09 0.10 0.07 0.10 0.09 0.07 0.06 0.06 0.11 0.06 0.06 0.07
Be 0.00 0.00 0.00 0.13 0.00 0.00 0.20 0.20 0.00 0.13 0.14 0.25 0.00 0.00 0.00 0.10 0.00 0.00 0.00 0.11
Rb 0.06 0.05 0.05 0.06 0.05 0.03 0.10 0.11 0.05 0.04 0.02 0.08 0.05 0.08 0.11 0.04 0.14 0.11 0.11 0.03
Sr 0.00 0.00 0.00 0.00 0.00 0.00 0.00 0.00 0.00 0.00 0.00 0.00 0.00 0.00 0.00 0.00 0.00 0.00 0.00 0.00
Ba 0.13 0.01 0.00 0.02 0.04 0.02 0.00 0.00 0.09 0.03 0.00 0.04 0.04 0.01 0.03 0.03 0.04 0.03 0.03 0.03
Cs 0.01 0.02 0.03 0.01 0.01 0.01 0.04 0.04 0.02 0.01 0.01 0.01 0.06 0.01 0.01 0.01 0.01 0.01 0.01 0.01
Ga 0.02 0.02 0.00 0.01 0.03 0.01 0.03 0.03 0.02 0.01 0.00 0.01 0.02 0.03 0.00 0.00 0.05 0.01 0.01 0.01
Tl 0.01 0.01 0.01 0.01 0.00 0.01 0.00 0.00 0.01 0.01 0.01 0.00 0.01 0.00 0.00 0.00 0.01 0.00 0.00 0.00
Ta 0.00 0.00 0.00 0.00 0.00 0.00 0.00 0.00 0.00 0.00 0.00 0.00 0.00 0.00 0.00 0.00 0.00 0.00 0.00 0.00
Sc 0.05 0.05 0.05 0.05 0.05 0.04 0.05 0.05 0.04 0.04 0.04 0.06 0.05 0.05 0.04 0.04 0.04 0.04 0.04 0.04
V 0.04 0.04 0.03 0.14 0.04 0.05 0.05 0.05 0.04 0.04 0.04 0.06 0.05 0.04 0.05 0.03 0.11 0.07 0.07 0.06
Cr 0.76 0.67 0.63 0.57 0.69 0.72 0.82 0.83 0.76 0.69 0.74 0.64 0.79 0.58 0.54 0.60 0.69 0.65 0.66 0.77
Co 0.02 0.01 0.04 0.02 0.01 0.00 0.01 0.01 0.00 0.00 0.00 0.01 0.01 0.00 0.00 0.00 0.03 0.02 0.02 0.01
Ni 0.07 0.04 0.07 0.04 0.07 0.07 0.10 0.10 0.07 0.09 0.11 0.13 0.04 0.06 0.05 0.08 0.08 0.05 0.05 0.06
Cu 0.04 0.04 0.04 0.05 0.04 0.04 0.05 0.05 0.04 0.04 0.03 0.05 0.03 0.04 0.05 0.04 0.03 0.04 0.04 0.03
Zn 0.18 0.14 0.17 0.12 0.16 0.12 0.16 0.16 0.17 0.13 0.11 0.12 0.15 0.12 0.15 0.14 0.17 0.12 0.12 0.12
Mo 0.00 0.01 0.01 0.00 0.00 0.00 0.00 0.00 0.00 0.00 0.00 0.00 0.00 0.00 0.00 0.00 0.01 0.00 0.00 0.00
Sn 0.03 0.04 0.05 0.04 0.03 0.03 0.04 0.04 0.04 0.05 0.04 0.04 0.04 0.03 0.03 0.03 0.04 0.03 0.03 0.03
W 0.00 0.00 0.00 0.00 0.00 0.00 0.00 0.00 0.00 0.00 0.00 0.00 0.00 0.00 0.00 0.00 0.00 0.00 0.00 0.00

266
BG7 BG8 BGD5 BGD11 BGD16 PD1
ppm 7 8 1 2 3 4 5 6 7 8 9 1 2 3 1 2 1 1 2 3
Ti 2.86 2.12 1.17 0.61 1.02 0.86 0.54 0.15 1.47 0.76 0.74 2.25 1.49 2.57 2.45 2.39 3.86 15.1 4.35 7.41
Al 6.44 4.45 3.99 3.68 2.02 1.84 3.56 0.31 7.06 1.93 1.87 6.37 2.50 6.58 5.80 5.67 9.48 3.87 12.4 8.53
Fe 6.53 12.0 5.25 13.85 5.53 1.85 9.39 0.84 6.35 4.30 4.14 13.5 12.8 14.3 14.5 14.2 13.5 20.8 14.5 11.3
Mn 1.46 0.92 0.43 0.48 0.49 0.58 0.51 0.39 0.47 0.47 0.46 1.28 1.02 0.97 1.00 0.97 1.17 1.03 0.92 0.86
Mg 1.83 4.82 2.07 1.26 0.62 2.56 1.22 0.17 1.48 0.37 0.36 1.99 0.97 2.80 3.66 3.59 1.92 6.02 2.03 4.89
Ca 38.5 43.4 19.2 26.0 26.8 20.5 20.2 25.5 25.4 30.3 29.4 50.8 67.0 52.4 69.2 67.6 55.0 57.3 42.8 37.5
Na 1.83 1.96 0.99 0.89 0.87 0.75 1.27 0.76 0.78 0.77 0.74 1.59 1.94 1.86 3.06 2.99 2.49 1.88 1.82 1.88
K 12.3 10.1 8.78 4.56 7.96 2.70 1.73 1.04 4.31 1.10 1.05 3.36 2.21 6.44 6.72 6.56 2.01 10.2 5.05 7.00
Li 0.08 0.07 0.05 0.04 0.04 0.04 0.04 0.03 0.04 0.04 0.04 0.07 0.07 0.07 0.07 0.07 0.08 0.07 0.09 0.06
Be 0.10 0.00 0.00 0.15 0.11 0.14 0.14 0.00 0.00 0.00 0.00
Rb 0.05 0.06 0.04 0.06 0.01 0.03 0.02 0.01 0.07 0.02 0.02 0.04 0.05 0.05 0.05 0.05 0.04 0.08 0.29 0.04
Sr 0.00 0.00 0.00 0.00 0.00 0.00 0.00 0.00 0.00 0.00 0.00 0.00 0.00 0.00 0.00 0.00 0.00 0.00 0.00 0.00
Ba 0.03 0.02 0.01 0.01 0.00 0.01 0.01 0.00 0.01 0.50 0.49 0.01 0.02 0.01 0.02 0.02 0.01 0.11 0.23 0.20
Cs 0.01 0.01 0.01 0.01 0.01 0.01 0.01 0.00 0.00 0.13 0.12 0.01 0.01 0.01 0.01 0.01 0.02 0.01 0.01 0.01
Ga 0.01 0.00 0.03 0.01 0.01 0.01 0.01 0.02 0.02 0.00 0.01
Tl 0.00 0.00 0.00 0.01 0.00 0.01 0.01 0.00 0.01 0.00 0.01
Ta 0.00 0.00 0.00 0.00 0.00 0.00 0.00 0.00 0.00 0.02 0.02 0.00 0.00 0.00 0.00 0.00 0.00 0.00 0.00 0.00
Sc 0.03 0.04 0.03 0.06 0.03 0.05 0.04 0.05 0.05 0.04 0.05
V 0.04 0.05 0.05 0.06 0.04 0.03 0.03 0.04 0.04 0.04 0.05
Cr 0.73 0.65 0.61 0.75 0.62 0.78 0.76 0.78 0.74 0.65 0.66
Co 0.01 0.01 0.01 0.00 0.00 0.01 0.01 0.02 0.01 0.01 0.01
Ni 0.08 0.06 0.08 0.08 0.08 0.11 0.11 0.07 0.06 0.04 0.04
Cu 0.04 0.05 0.06 0.04 0.05 0.05 0.05 0.06 0.03 0.03 0.03
Zn 0.12 0.13 0.06 0.05 0.06 0.06 0.07 0.05 0.05 0.05 0.05 0.12 0.17 0.12 0.14 0.14 0.10 0.15 0.10 0.12
Mo 0.00 0.00 0.00 0.00 0.00 0.00 0.00 0.00 0.00 0.00 0.00 0.00 0.00 0.00 0.00 0.00 0.00 0.00 0.00 0.00
Sn 0.03 0.04 0.03 0.02 0.02 0.01 0.02 0.01 0.02 0.07 0.07 0.03 0.04 0.04 0.04 0.04 0.04 0.03 0.03 0.04
W 0.00 0.00 0.00 0.00 0.00 0.00 0.00 0.00 0.00 0.01 0.01 0.00 0.00 0.00 0.00 0.00 0.00 0.00 0.00 0.00

267
Appendix Table 10 Trace element compositions of biotite from the Nashwaak Granites and related dykes analyzed by laser ablation-ICPMS
MBG3 MBG5 BG3 BG7
1 1 2 3 4 5 6 7 8 9 1 2 3 4 1 2 3 4 5 6
wt%
Ti 1.36 1.23 1.43 1.27 1.23 1.29 1.23 1.06 1.33 1.34 1.75 1.61 1.62 1.62 1.65 1.39 2.00 1.61 2.03 1.88
Int2SE 0.04 0.02 0.04 0.03 0.03 0.04 0.03 0.03 0.03 0.03 0.03 0.03 0.04 0.06 0.02 0.03 0.05 0.05 0.05 0.03
Al 8.65 9.24 9.23 9.19 8.70 8.78 9.23 8.88 9.41 9.27 7.38 7.95 7.75 7.67 7.67 7.55 7.92 6.93 8.19 7.70
Int2SE 0.17 0.16 0.12 0.14 0.13 0.13 0.15 0.14 0.15 0.22 0.11 0.16 0.17 0.15 0.12 0.12 0.11 0.15 0.15 0.13
Fe 12.9 15.5 14.8 14.5 13.6 15.0 15.8 14.9 15.6 15.6 13.0 14.2 13.7 13.9 13.8 13.2 14.4 12.4 14.2 14.3
Int2SE 0.29 0.30 0.37 0.33 0.33 0.28 0.33 0.27 0.27 0.25 0.30 0.29 0.43 0.43 0.17 0.20 0.40 0.44 0.26 0.29
Mn 0.34 0.28 0.31 0.45 0.41 0.35 0.32 0.32 0.35 0.35 0.26 0.27 0.27 0.26 0.28 0.27 0.31 0.27 0.32 0.31
Int2SE 0.01 0.00 0.01 0.01 0.01 0.01 0.01 0.01 0.01 0.01 0.00 0.01 0.01 0.01 0.00 0.01 0.01 0.01 0.01 0.01
Mg 3.22 2.75 2.59 2.94 2.82 2.56 2.86 2.60 2.65 2.69 5.14 5.67 5.51 5.56 5.35 5.36 4.98 4.49 4.92 4.88
Int2SE 0.07 0.05 0.05 0.06 0.04 0.03 0.05 0.04 0.03 0.05 0.10 0.14 0.13 0.15 0.08 0.08 0.09 0.10 0.07 0.12
Ca 0.39 0.02 0.02 0.02 0.10 0.04 0.02 0.05 0.01 0.08 0.22 0.18 0.01 0.03 0.02 0.01 0.17 0.45 0.20 0.25
Int2SE 0.05 0.00 0.00 0.01 0.01 0.01 0.01 0.01 0.00 0.01 0.02 0.05 0.00 0.01 0.01 0.00 0.01 0.04 0.05 0.06
Na 0.05 0.04 0.03 0.05 0.04 0.06 0.06 0.06 0.06 0.05 0.06 0.06 0.07 0.07 0.07 0.06 0.08 0.90 0.07 0.06
Int2SE 0.00 0.00 0.00 0.00 0.00 0.00 0.00 0.00 0.00 0.00 0.00 0.00 0.00 0.00 0.00 0.00 0.00 0.05 0.00 0.00
K 7.81 8.23 8.10 8.26 7.41 6.92 8.00 7.09 8.38 8.37 7.70 8.50 8.32 8.54 8.28 7.98 8.17 7.25 8.68 8.72
Int2SE 0.18 0.14 0.13 0.12 0.13 0.09 0.15 0.09 0.15 0.17 0.17 0.16 0.18 0.18 0.12 0.10 0.15 0.19 0.14 0.18

268
BG7 BG8 BGD5 BGD11 BGD16 PD1
7 8 1 2 3 4 5 6 7 8 9 1 2 3 1 2 1 1 2 3
wt%
Ti 1.64 1.91 1.85 1.84 1.42 1.33 1.76 1.46 1.43 1.62 1.52 1.22 1.67 1.23 1.44 1.29 1.60 2.83 2.70 2.16
Int2SE 0.04 0.04 0.03 0.04 0.03 0.02 0.03 0.02 0.02 0.03 0.02 0.04 0.03 0.03 0.02 0.02 0.05 0.09 0.07 0.05
Al 7.60 8.14 8.87 8.75 8.42 8.14 8.46 8.03 7.71 8.42 8.24 8.90 9.51 9.82 8.73 8.84 10.8 7.42 7.41 7.49
Int2SE 0.11 0.14 0.12 0.13 0.13 0.15 0.16 0.13 0.11 0.12 0.09 0.19 0.19 0.16 0.17 0.12 0.27 0.14 0.11 0.11
Fe 13.7 15.5 15.1 15.2 14.6 13.8 14.4 12.2 12.7 14.3 13.7 19.6 19.4 14.6 15.9 15.5 23.9 16.3 16.0 16.5
Int2SE 0.32 0.34 0.28 0.33 0.19 0.17 0.19 0.20 0.18 0.19 0.18 0.46 0.42 0.38 0.32 0.32 0.47 0.36 0.34 0.30
Mn 0.27 0.30 0.31 0.31 0.29 0.28 0.29 0.25 0.25 0.28 0.27 0.33 0.32 0.25 0.27 0.27 0.41 0.25 0.25 0.26
Int2SE 0.01 0.01 0.00 0.01 0.00 0.00 0.00 0.00 0.00 0.00 0.00 0.01 0.01 0.01 0.01 0.01 0.01 0.00 0.00 0.00
Mg 5.08 5.06 3.27 3.27 3.23 3.16 3.13 2.62 2.82 3.20 2.99 3.48 3.55 2.91 5.16 5.07 4.79 4.93 5.33 5.68
Int2SE 0.10 0.09 0.05 0.05 0.04 0.04 0.06 0.04 0.05 0.04 0.04 0.08 0.06 0.06 0.09 0.08 0.08 0.10 0.09 0.12
Ca 0.72 0.19 0.12 0.26 0.05 0.03 0.01 0.35 0.13 0.04 0.07 0.09 0.26 0.12 0.05 0.26 0.23 0.99 0.76 0.12
Int2SE 0.03 0.02 0.01 0.02 0.01 0.01 0.00 0.01 0.01 0.01 0.00 0.01 0.02 0.01 0.01 0.02 0.02 0.06 0.05 0.01
Na 0.07 0.08 0.07 0.08 0.06 0.05 0.08 0.58 0.25 0.06 0.14 0.06 0.07 0.07 0.10 0.08 0.07 0.08 0.12 0.14
Int2SE 0.00 0.00 0.00 0.00 0.00 0.00 0.00 0.02 0.00 0.00 0.00 0.00 0.00 0.00 0.01 0.00 0.01 0.00 0.00 0.00
K 8.02 8.58 8.32 8.23 7.72 7.58 8.05 6.44 6.71 7.82 7.25 5.03 6.38 5.95 7.04 6.48 6.14 6.98 7.42 8.17
Int2SE 0.15 0.16 0.12 0.12 0.08 0.09 0.13 0.10 0.08 0.09 0.09 0.10 0.11 0.11 0.13 0.09 0.11 0.11 0.11 0.17

269
MBG3 MBG5 BG3 BG7 1 1 2 3 4 5 6 7 8 9 1 2 3 4 1 2 3 4 5 6 ppm Li 449 767 771 723 636 625 762 541 748 717 130 145 146 160 149 138 123 102 107 105 Int2SE 9.70 11.0 15.0 14.0 11.0 9.80 15.0 7.40 10.0 10.0 2.20 2.80 2.90 4.50 2.60 2.10 3.00 2.90 2.00 2.10 Be 1.07 1.36 1.48 1.89 4.27 3.42 2.85 7.50 0.91 1.28 0.05 0.14 0.12 0.10 0.05 0.51 0.42 0.12 Int2SE 0.39 0.50 0.41 0.48 0.94 0.62 0.69 1.20 0.32 0.47 0.07 0.12 0.11 0.10 0.08 0.23 0.19 0.11 Rb 747 1253 1732 1183 1143 1123 1952 1292 1227 1222 588 631 629 638 618 574 606 598 641 615 Int2SE 15.0 19.0 43.0 28.0 19.0 18.0 38.0 19.0 23.0 24.0 9.80 12.0 14.0 18.0 7.60 5.90 16.0 29.0 9.7 16.0 Sr 7.55 1.00 1.32 1.12 5.85 3.44 2.71 5.48 0.78 1.20 0.87 1.29 0.70 0.73 1.05 0.79 1.32 4.17 1.14 1.14 Int2SE 0.29 0.12 0.12 0.22 0.52 0.29 0.43 0.25 0.13 0.17 0.05 0.18 0.08 0.06 0.10 0.06 0.10 0.22 0.12 0.15 Ba 1108 137 47.2 239 333 514 33.7 254 232 292 321 406 369 371 360 353 191 189 480 225 Int2SE 24.0 2.20 1.30 3.40 7.60 7.90 1.10 4.20 3.00 4.90 4.20 7.30 8.40 11.0 4.50 4.70 4.40 5.80 7.00 3.90 Cs 15.5 30.5 343 42.2 51.9 54.8 557 108 25.2 63.7 20.4 18.7 19.4 15.9 21.2 23.8 11.1 15.4 8.79 7.30 Int2SE 0.51 0.52 8.60 0.88 1.70 0.97 12.0 3.80 0.50 1.20 0.55 0.33 0.40 0.42 0.41 0.52 0.33 0.73 0.21 0.14 Ga 52.9 88.6 84.1 74.8 92.2 68 76.8 74.5 63.6 65.0 45.1 44.0 43.7 42.1 45.9 44.8 53.7 56.9 50.3 47.8 Int2SE 1.40 1.80 1.50 1.60 2.20 1.10 1.70 1.20 0.99 1.50 1.00 1.00 1.00 1.40 0.90 1.10 1.50 1.80 1.00 1.10 Tl 5.70 10.2 10.2 9.13 8.47 8.45 10.79 9.03 9.81 9.58 3.57 3.96 3.81 3.90 3.81 3.34 3.74 3.61 4.06 3.62 Int2SE 0.15 0.22 0.27 0.20 0.21 0.21 0.25 0.25 0.19 0.24 0.09 0.10 0.10 0.15 0.12 0.09 0.10 0.15 0.13 0.11 Ta 3.32 22.3 33.5 8.13 8.02 16.1 61.2 28.9 27.6 18.8 0.52 0.42 0.41 0.60 0.51 0.46 2.95 2.01 3.07 2.84 Int2SE 0.12 0.52 0.85 0.20 0.25 0.69 1.50 0.80 0.45 0.48 0.02 0.02 0.02 0.04 0.03 0.02 0.08 0.07 0.08 0.09 Sc 29.9 43.3 46.5 35.8 37.3 30.2 36.3 34.1 25.9 25.9 38.5 44.9 39.81 42 38.9 40.1 53.8 46.3 55.6 52.0 Int2SE 1.00 1.00 1.10 0.95 1.00 1.30 1.10 1.40 0.81 0.81 0.72 0.97 0.78 1.40 0.93 0.86 1.70 1.30 1.50 1.60 V 245 202 215 191 173 166 180 168 149 147 118 132 131 106 127 118 179 179 217 181 Int2SE 6.40 4.10 5.10 3.80 3.70 2.60 3.90 3.00 1.90 3.00 1.90 2.70 2.50 3.30 1.60 1.90 5.00 5.90 4.10 3.30 Cr 98.2 99.5 75.2 137 108 118 75.4 82.4 94.2 86.8 32.6 75.9 74.2 52.3 33.6 40.4 27.9 19.8 68.1 51.8 Int2SE 2.80 2.10 2.10 3.10 2.00 2.10 1.40 1.60 1.60 1.50 0.72 1.30 1.80 1.70 0.75 0.92 0.94 0.76 0.99 1.00 Co 32.2 37.6 35.7 28.3 26.6 34.3 35.4 35.0 34.4 33.9 46.2 49.8 48.5 49.2 52.6 50.8 52.4 45.2 48.3 49.0 Int2SE 0.98 0.87 0.79 0.77 0.58 0.76 0.91 0.74 0.70 0.66 0.86 0.99 1.30 1.20 0.94 0.70 1.00 1.60 0.93 1.10 Ni 33.6 44.9 41.6 35.2 32.3 40.9 37.0 34.5 38.1 38.6 33.1 36.9 35.6 33.9 35.7 35.5 47.9 40.8 47.5 47.7 Int2SE 1.20 1.30 1.20 0.96 1.20 1.10 1.40 1.10 0.84 1.10 1.00 0.94 1.40 1.30 0.98 0.86 1.30 1.50 1.40 1.80 Cu 16.8 1.80 3.01 1.30 2.70 11.31 3.01 12.10 0.54 1.26 2.04 0.39 0.59 1.39 1.75 0.72 12.9 8.44 2.75 1.18 Int2SE 1.30 0.24 0.30 0.33 0.33 0.79 0.45 1.10 0.15 0.17 0.24 0.08 0.15 0.69 0.57 0.26 0.67 0.46 0.25 0.12 Zn 510 896 854 708 682 873 889 870 848 865 603 669 659 675 887 848 778 637 670 701 Int2SE 12.0 13.0 11.0 11.0 9.60 11.0 17.0 14.0 9.90 12.0 8.10 11.0 11.0 11.0 10.0 12.0 14.0 13.0 9.30 11.0 Mo 0.16 0.07 0.10 0.16 0.16 0.38 0.11 0.75 0.10 0.12 0.20 0.06 0.06 0.07 0.06 0.06 1.57 0.06 0.09 0.07 Int2SE 0.02 0.01 0.02 0.01 0.03 0.02 0.02 0.06 0.01 0.01 0.02 0.01 0.01 0.02 0.01 0.01 0.08 0.01 0.02 0.01 Sn 51.3 60.6 58.2 34.8 44.7 66.8 63.3 60.0 65.3 62.8 14.0 15.2 14.5 14.4 19.0 15.0 35.5 31.1 30.3 29.3 Int2SE 1.60 1.10 1.00 0.78 1.40 1.40 1.70 0.82 1.00 1.00 0.27 0.44 0.35 0.78 3.50 1.40 0.82 0.91 0.75 0.72 W 0.93 1.78 4.24 1.63 1.92 1.91 6.16 2.70 1.72 1.50 1.28 1.16 1.07 1.54 1.21 1.02 1.98 1.20 1.87 1.60 Int2SE 0.04 0.05 0.09 0.04 0.06 0.04 0.15 0.08 0.04 0.05 0.04 0.04 0.05 0.05 0.04 0.04 0.05 0.06 0.05 0.05

270
BG7 BG8 BGD5 BGD11 BGD16 PD1 7 8 1 2 3 4 5 6 7 8 9 1 2 3 1 2 1 1 2 3 ppm Li 94 108 246 234 230 222 237 181 191 222 207 285 279 222 262 274 365 177 189 187 Int2SE 2.20 1.90 4.10 3.90 3.20 2.50 3.50 3.10 2.70 2.40 2.50 6.50 5.60 6.70 3.90 5.30 4.70 3.20 3.30 2.50 Be 0.19 0.09 2.18 1.95 3.26 0.47 0.75 2.18 2.27 2.80 1.04 Int2SE 0.14 0.10 0.58 0.65 0.77 0.24 0.37 0.74 0.63 0.77 0.35 Rb 587 645 953 931 872 835 889 754 760 899 815 504 621 632 669 631 655 319 401 464 Int2SE 12.0 11.0 21.0 15.0 10.0 8.50 14.0 12.0 12.0 10.0 9.80 12.0 10.0 12.0 14.0 10.0 11.0 6.70 6.30 8.20 Sr 3.50 1.95 1.71 1.22 2.50 1.22 0.97 16.4 8.47 0.58 4.18 2.45 3.56 2.82 1.45 2.99 5.46 5.73 7.49 9.12 Int2SE 0.11 0.07 0.13 0.07 0.32 0.14 0.16 0.47 0.16 0.04 0.11 0.10 0.15 0.10 0.09 0.18 0.25 0.20 0.20 0.16 Ba 783 244 216 225 280 201 268 197 196 346 201 31.4 37.3 30.3 51.2 257 47.5 2219 2366 1680 Int2SE 18.0 3.70 3.30 3.20 3.10 3.00 3.60 2.90 2.70 4.10 1.90 0.70 0.64 0.89 0.86 3.30 0.66 47.0 34.0 24.0 Cs 10.0 14.1 40.7 39.7 25.4 40.5 41.0 39.2 22.4 26.4 61.6 15.0 20.8 25.4 20.0 21.8 34.4 26.2 18.6 9.79 Int2SE 0.29 0.30 0.74 0.71 0.38 0.41 0.60 0.58 0.32 0.36 0.75 0.45 0.43 0.48 0.53 0.43 0.61 0.68 0.55 0.21 Ga 47.6 48.2 140 106 94.5 84.7 84.4 152 58.1 49.2 47.5 Int2SE 1.10 1.00 3.40 2.20 2.10 1.90 1.20 2.90 1.20 1.00 0.99 Tl 3.70 4.03 3.28 4.24 4.07 4.41 4.32 5.16 2.04 2.51 2.62 Int2SE 0.11 0.14 0.11 0.14 0.10 0.15 0.12 0.16 0.08 0.09 0.09 Ta 2.98 4.12 8.37 8.05 6.53 6.26 8.71 6.43 6.50 7.91 7.42 7.85 9.33 7.18 3.26 2.66 8.99 1.95 2.38 2.02 Int2SE 0.10 0.09 0.17 0.12 0.13 0.13 0.16 0.12 0.10 0.14 0.11 0.27 0.32 0.19 0.09 0.08 0.40 0.11 0.08 0.06 Sc 50.7 58.1 60.1 71.8 51.1 94.5 91.2 116 56.1 34.2 28.0 Int2SE 1.70 1.30 2.90 3.50 1.40 3.50 2.40 6.20 2.70 0.98 0.81 V 145 171 107 117 56.7 80.1 91.6 83.9 416 362 371 Int2SE 2.90 3.10 2.50 2.10 1.50 1.30 1.20 2.10 9.00 5.90 5.90 Cr 34.4 44.8 18.7 37.0 34.2 34.5 33.3 16.5 92.7 75.9 76.3 Int2SE 0.89 1.10 0.52 0.90 1.00 0.87 0.77 1.10 2.10 1.40 1.20 Co 48.7 48.0 20.9 20.5 19.7 38.3 38.4 41.4 37.8 42.0 48.0 Int2SE 1.30 1.20 0.60 0.53 0.57 0.95 0.85 0.97 0.95 1.00 0.79 Ni 47.5 47.7 26.3 19.4 23.6 36.3 34.9 6.4 22.8 28.2 30.2 Int2SE 1.50 1.40 0.99 0.88 0.69 1.40 1.00 0.44 0.59 0.92 1.10 Cu 14.2 6.91 7.63 2.68 10.1 4.90 6.40 5.40 6.70 1.84 2.23 Int2SE 0.55 0.54 0.85 0.59 1.30 1.40 1.00 2.10 2.30 0.54 0.48 Zn 613 645 446 440 463 429 432 361 380 436 408 368 341 238 640 1380 309 240 268 331 Int2SE 10.0 11.0 7.80 7.40 5.40 5.20 6.30 6.30 5.40 4.50 5.20 16.0 10.0 13.0 38.0 370 9.30 3.30 4.30 4.10 Mo 0.12 0.07 0.08 0.08 0.07 0.06 0.12 0.06 0.06 0.08 0.06 0.13 0.07 0.08 0.06 0.07 0.16 0.47 0.51 0.61 Int2SE 0.02 0.01 0.01 0.01 0.01 0.01 0.01 0.01 0.01 0.01 0.01 0.02 0.02 0.02 0.01 0.01 0.02 0.04 0.04 0.04 Sn 33.2 31.8 21.0 20.5 21.7 20.3 20.5 16.6 17.0 20.0 18.3 62.1 60.0 52.6 48.4 61.8 150 15.3 12.8 6.69 Int2SE 1.10 0.81 0.43 0.48 0.38 0.36 0.34 0.32 0.34 0.28 0.27 1.10 1.60 1.60 0.87 1.10 3.20 0.40 0.39 0.25 W 1.62 1.83 3.33 3.44 3.39 2.80 3.43 2.79 2.29 3.13 2.12 2.38 4.33 2.89 1.41 2.28 3.07 5.00 4.30 0.62 Int2SE 0.05 0.06 0.04 0.06 0.05 0.04 0.06 0.05 0.03 0.04 0.03 0.11 0.16 0.11 0.05 0.13 0.10 0.29 0.24 0.04

Curriculum Vitae
Candidate’s full name:
Wei Zhang
Universities attended:
Ph.D (Economic Geology), 2009-2015
University of New Brunswick, New Brunswick, Canada
M.Sc (Structureal Geology), 2006-2009
China University of Geosciences (Beijing), Beijing, China
B.Eng. (Geology), 2002-2006
China University of Geosciences (Beijing), Beijing, China
Publications:
Liu, J, Ye, H.S., Xie, G.Q., Yang, G.Q., Zhang, W., 2008. Re-Os dating of molybdenite from the Hukeng tungsten deposit in Wugongshan area, Jiangxi China and its geological implications. Acta Geologica Sinica 82, 1572-1579.
Liu, J., Mao, J.W., Ye, H.S., Zhang, W., 2011. Geology, geochemistry and age of the Hukeng tungsten deposit, southern China. Ore Geology Reviews 43, 50-61.
Zhang, W., Chen, M.H., Ye, H.S., Liu, J., 2008. The Geological Features and Evolution of Metallogenic Tectonics of the Ore Bearing Quartz Veins at Hukeng Tungsten Deposit, Jiangxi Province. Acta Geologica Sinica 82, 1531-1539.
Conference Presentations:
Liu, J., Mao, J.W., Ye, H.S, Zhang, W., 2008. Geochemical characteristics and zircon LA-ICP-MS U-Pb dating of granite from Hukeng Intrusion, Jiangxi Province, south China. Geochimica et Cosmochimica Acta 72, A558.
Liu, J., Ye, H.S., Xie, G.Q., Zhang, W., 2009. Lead isotope determination of the Hukeng tungsten deposit, Jiangxi Province, south China. Geochimica et Cosmochimica Acta 73, A778.
Zhang, W., Chen, M.H., Ye, H.S., Yang, Z.X., 2009. 40Ar-39Ar geochronological

constraints of the ore-bearing ductile shear zones at Hukeng tungsten deposit, Jiangxi Province. In Proceeding of the 24th IAGS, Fredericton, Canada. Edited by Lentz, D.R., Thorne, K.G., and Beal, K-L., pp. 225-228.
Zhang, W., Lentz, D.R., Thorne, K.G., McFarlane, C.R.M., 2011. Mineralogical, petrological, and petrogenetic analysis of felsic intrusive rocks at the Sisson Brook W-Mo-Cu deposit, west-central New Brunswick. Atlantic Geology 47, 52.
Zhang, W., Lentz D.R., Thorne, K.G., McFarlane, C.R.M., 2011. Biotite analysis of felsic intrusive rocks near the Sisson Brook W-Mo-Cu deposit, west-central New Brunswick. Atlantic Geology 48, 52-53.
Zhang W., McFarlane, C.R.M., Lentz, D.R., 2013. Mineralogical, petrological, and petrogenetic analysis of felsic intrusive rocks at the Sisson Brook W-Mo-Cu deposit, west-central New Brunswick. ACTA GEOLOGICA SINICA(English edition) 87(z1), 831-834.