of the florida utility industry - welcome to the psc web ... · of the florida utility industry ......
TRANSCRIPT

Facts and Figures of the
Florida Utility Industry
MARCH 2015

This publication is a reference manual for anyone needing quick information
about the electric, natural gas, telecommunications, and water and
wastewater industries in Florida. The facts have been gathered from in-
house materials, outside publications, and websites. Every effort has been
made to accurately reference the source of the information used. Though
most of the data refers specifically to Florida, some data from other states
and national averages are included for comparison purposes. If you have
questions about this publication, please contact:
Office of Consumer Assistance & Outreach
Florida Public Service Commission
2540 Shumard Oak Boulevard
Tallahassee, Florida 32399-0850
(850) 413-6482


i
F A C T S & F I G U R E S O F T H E F L O R I D A U T I L I T Y I N D U S T R Y
E L E C T R I C
Table of Contents
Quick Facts
Regulatory Authority ............................................................................................. 1
Generating Capacity .............................................................................................. 1
Transmission Capability for Peninsular Florida .................................................... 1
Florida Energy Generation by Fuel Type .............................................................. 2
Energy Sources ..................................................................................................... 2
Florida’s Renewable Capacity ............................................................................... 3
Customers
Average Number of Customers ............................................................................. 4
Rates
Typical Electric Bill Comparisons ......................................................................... 5
Average Residential Price of Electricity by State .................................................. 6
Nuclear Power
Nuclear Waste Policy ............................................................................................... 7
Operating Nuclear Power Reactors .......................................................................... 8
Maps
Reliability Councils ................................................................................................ 9
Investor-Owned Electric Utilities .......................................................................... 10
Municipal Electric Utilities .................................................................................... 11
Rural Electric Cooperatives ................................................................................... 12
ii
F A C T S & F I G U R E S O F T H E F L O R I D A U T I L I T Y I N D U S T R Y
Quick Facts
Regulatory Authority ............................................................................................ 13
Transmission ......................................................................................................... 13
Customers
Number of Customers ............................................................................................ 14
Rates
Typical Natural Gas Bill Comparisons ................................................................. 15
Sales
Annual Therm Sales .............................................................................................. 16
Map
Natural Gas Companies in Florida ........................................................................ 17
Quick Facts
Regulatory Authority ............................................................................................ 18
Definitions ............................................................................................................. 18
Broadband, VoIP, and Wireless ............................................................................ 19
Customers
Access Lines ......................................................................................................... 20
Universal Service Programs .................................................................................. 21
Universal Service Program Developments in Florida .......................................... 24
Universal Service Support Mechanisms by Program for Florida ......................... 26
Universal Service Support Mechanisms by State ................................................. 27
Telephone Subscribership ..................................................................................... 28
Lifeline Assistance Subscribership ....................................................................... 28
N A T U R A L G A S
T E L E C O M M U N I C A T I O N S

iii
F A C T S & F I G U R E S O F T H E F L O R I D A U T I L I T Y I N D U S T R Y
Quick Facts
Regulatory Authority ............................................................................................ 30
Reuse of Reclaimed Water Data ........................................................................... 30
Florida’s Reuse Growth ........................................................................................ 31
Reclaimed Water Utilization ................................................................................. 31
Customers & Rates
Utility Classifications ............................................................................................. 32
Rate Structure ......................................................................................................... 32
Residential Wastewater Gallonage Cap ................................................................. 32
Water & Wastewater Utility Rates ........................................................................ 32
Maps
Water & Wastewater Jurisdictional Counties ....................................................... 33
Florida’s Water Management Districts ................................................................. 34
W A T E R & W A S T E W A T E R

1
F L O R I D A E L E C T R I C I N D U S T R Y
Q U I C K F A C T S
Sources:
Statistics of the Florida Electric Utility Industry, October 2014
http://www.floridapsc.com/utilities/electricgas/statistics/statistics-2014.pdf
2014 Ten-Year Site Plan Workshop FRCC Studies and Reports
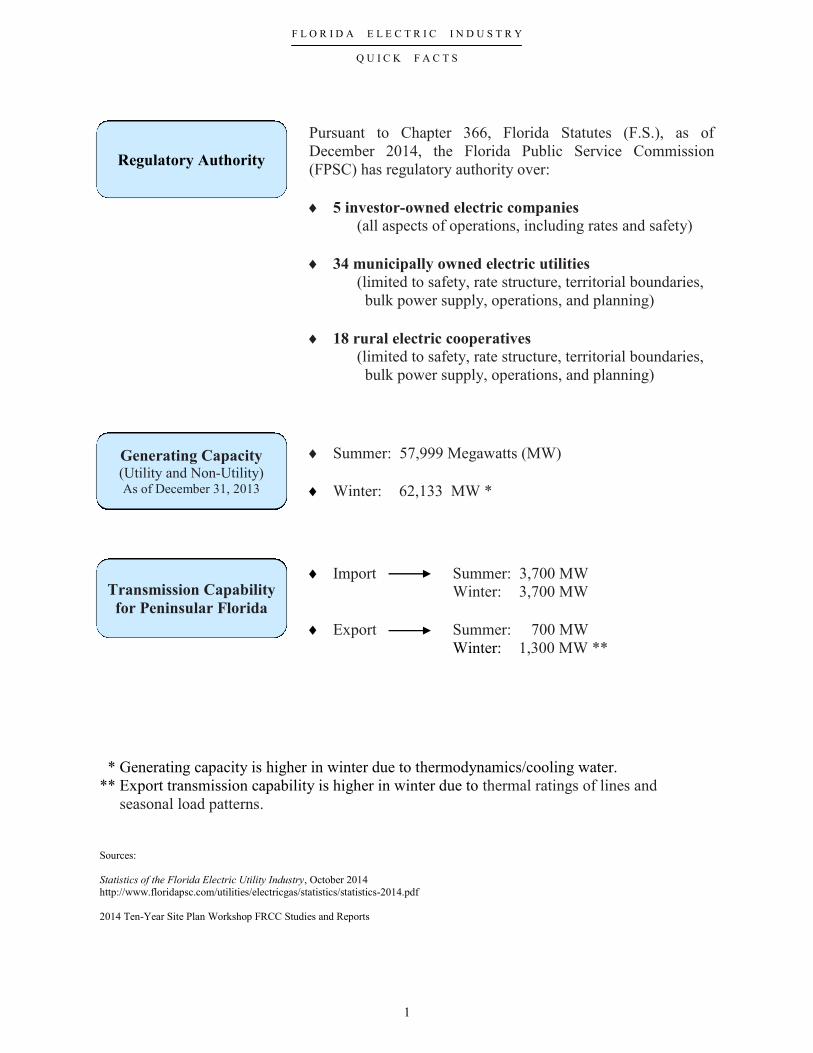
Regulatory Authority
Generating Capacity (Utility and Non-Utility) As of December 31, 2013
Transmission Capability
for Peninsular Florida
Pursuant to Chapter 366, Florida Statutes (F.S.), as of
December 2014, the Florida Public Service Commission
(FPSC) has regulatory authority over:
5 investor-owned electric companies
(all aspects of operations, including rates and safety)
34 municipally owned electric utilities
(limited to safety, rate structure, territorial boundaries,
bulk power supply, operations, and planning)
18 rural electric cooperatives
(limited to safety, rate structure, territorial boundaries,
bulk power supply, operations, and planning)
Summer: 57,999 Megawatts (MW)
Winter: 62,133 MW *
* Generating capacity is higher in winter due to thermodynamics/cooling water.
** Export transmission capability is higher in winter due to thermal ratings of lines and
seasonal load patterns.
Import Summer: 3,700 MW
Winter: 3,700 MW
Export Summer: 700 MW
Winter: 1,300 MW **

2
F L O R I D A E L E C T R I C I N D U S T R Y
Q U I C K F A C T S
* Percentages do not add up to 100% due to rounding.
Source:
FRCC 2014 Regional Load & Resource Plan, July 2014 http://www.floridapsc.com/utilities/electricgas/docs/FRCC_2014_Load_Resource_Plan.pdf
Florida Energy Generation by Fuel Type
Energy Sources (GWH)
2013
(Actual %)
2023
(Forecast %)*
140,187
50,775
26,672
13,884
3,020
487
151,085
59,978
43,891
11,967
3,504
348
0 50,000 100,000 150,000 200,000
Natural gas
Coal
Nuclear
Other
Renewables
Oil
2023 Proposed
2013 Actual

3
Municipal Solid Waste25%
Landfill Gas3%
Waste Heat19%
Hydro4%
Biomass36%
Solar13%
F L O R I D A E L E C T R I C I N D U S T R Y
Q U I C K F A C T S
Source: FPSC’s Review of 2013 Ten-Year Site Plans for Florida’s Electric Utilities, October 2014
http://www.psc.state.fl.us/publications/pdf/electricgas/TYSP2014.pdf
Florida’s Renewable Capacity in MW (2013) (Total: 1,617 MW)
Total Florida Renewable Capacity: 1,617 MW
Total Florida Electric Generation Capacity: 57,375 MW (Summer)
Biomass: Material collected from wood processing, forestry, urban wood waste, and agricultural waste.
Landfill Gas: Methane collected from landfills.
Waste Heat: Collected in processing phosphate into fertilizer and other products.
4
F L O R I D A E L E C T R I C I N D U S T R Y
C U S T O M E R S
Sources: 2014 Ten-Year Site Plans, Schedules 2.1 - 2.3
http://www.floridapsc.com/utilities/electricgas/10yrsiteplans.aspx
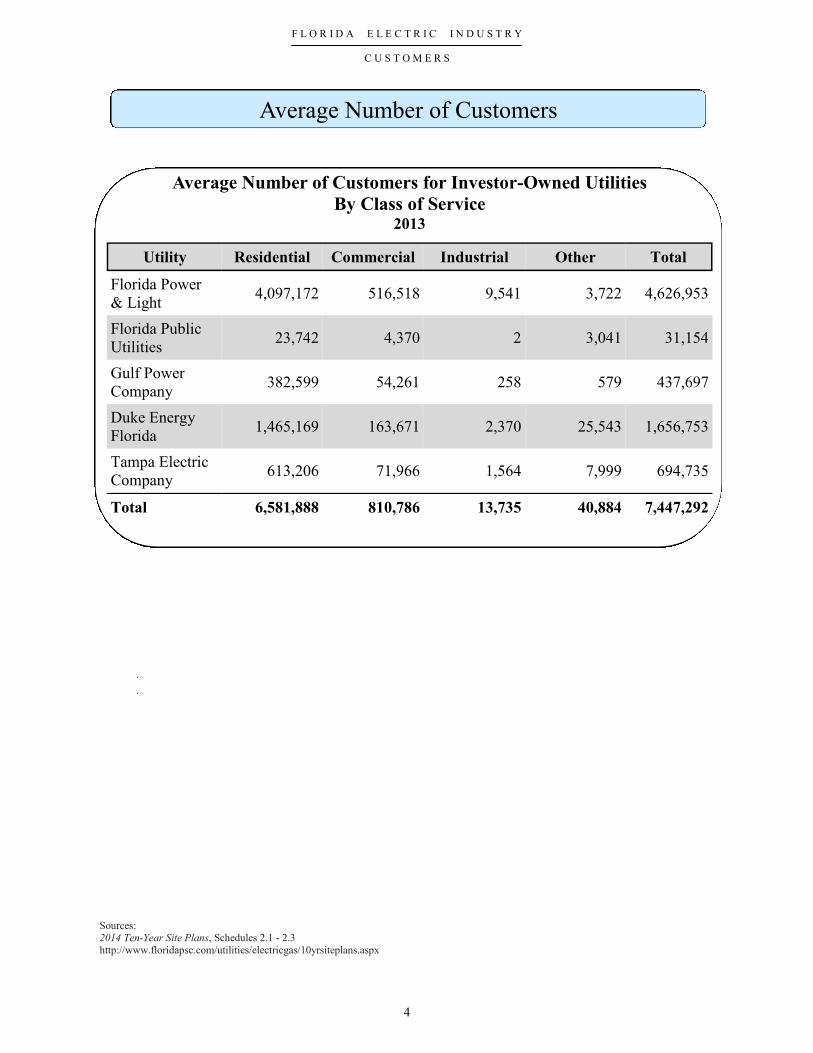
Average Number of Customers
Average Number of Customers for Investor-Owned Utilities
By Class of Service 2013
Utility Residential Commercial Industrial Other Total
Florida Power
& Light 4,097,172 516,518 9,541 3,722 4,626,953
Florida Public
Utilities 23,742 4,370 2 3,041 31,154
Gulf Power
Company 382,599 54,261 258 579 437,697
Duke Energy
Florida 1,465,169 163,671 2,370 25,543 1,656,753
Tampa Electric
Company 613,206 71,966 1,564 7,999 694,735
Total 6,581,888 810,786 13,735 40,884 7,447,292

5
F L O R I D A E L E C T R I C I N D U S T R Y
R A T E S
Note: Typical electric bill comparisons for municipally and cooperatively owned electric utilities are available
in the Comparative Rate Statistics report available at:
http://www.floridapsc.com/publications/pdf/general/comparativerate.aspx
.
Residential Service Provided by Investor-Owned Utilities December 31, 2014
Florida Power & Light Company $ 7.57 $ 98.97
Duke Energy Florida $ 8.76 $ 122.16
Tampa Electric Company $ 15.00 $ 107.39
Gulf Power Company $ 18.00 $ 128.70
Florida Public Utilities Company
Northwest $ 14.00 $ 132.00
Northeast $ 14.00 $ 124.35
Minimum Bill or 1,000
Utility Customer Charge* Kilowatt Hours*
Commercial/Industrial Service Provided by Investor-Owned Utilities December 31, 2014
Florida Power & Light Company $ 32,560
Duke Energy Florida $ 33,830
Tampa Electric Company $ 34,810
Gulf Power Company $ 36,372
Florida Public Utilities Company
Northwest $ 42,526
Northeast $ 39,646
400,000
Utility Kilowatt Hours
1,000 KW Demand*
Excludes local taxes, franchise fees, and gross receipts taxes that are billed as a separate line item.
Includes cost recovery clause factors effective December 2014.
Typical Electric Bill Comparisons

6
F L O R I D A E L E C T R I C I N D U S T R Y
R A T E S
Source: Energy Information Administration’s Electric Power Monthly, Table 5.6.A, November 2014
http://www.eia.gov/electricity/monthly/epm_table_grapher.cfm?t=epmt_5_06_a
Note: The average revenue per kilowatt-hour of electricity sold is calculated by dividing revenue by sales.
Average Residential Price of Electricity by State (2014) (U.S. Residential Average Price per kWh = 12.46 cents)

7
F L O R I D A E L E C T R I C I N D U S T R Y
N U C L E A R P O W E R
Sources: Responses to information requests provided by Florida Power & Light Company and Duke Energy Florida
Florida Power & Light Company (FPL) and Duke Energy Florida (DEF) currently store 2,600
metric tons of radioactive waste called “spent nuclear fuel” in water-filled pools inside contain-
ment structures at plant sites. As these pools become filled to capacity, some of the spent fuel
will be removed and placed in steel and concrete storage containers (dry casks) on-site.
Federal law requires the U.S. Department of Energy (DOE) to store and ultimately dispose of
spent nuclear fuel and high-level radioactive waste in a geologic repository. Since 1983, Florida
ratepayers have paid $842.4 million ($1.5 billion with interest) into the federal nuclear waste
fund established to cover the cost of transportation, storage, and disposal of spent fuel. DOE
suspended collection of the nuclear waste fee in May 2014.
Florida Nuclear Power Reactors December 31, 2014
Metric Tons in Metric Tons in NRC License
Reactor Utility Spent Fuel Pool Dry Cask Storage Expires
Crystal River 3
St. Lucie 1
St. Lucie 2
Turkey Point 3
Turkey Point 4
DEF
FPL
FPL
FPL
FPL
590
552
448
499
511
N/A
186
137
131
131
2016*
2036
2043
2032
2033
* Duke Energy filed notification of cessation of operations with the Nuclear Regulatory Commission on February 20, 2013
Proposed Nuclear Power Reactors
Estimated
Reactor Utility In-Service Date**
Turkey Point 6
Turkey Point 7
FPL
FPL
2027
2028
** FPL has not made a final determination whether to construct Turkey Point 6 & 7.
Nuclear Waste Policy

8
F L O R I D A E L E C T R I C I N D U S T R Y
N U C L E A R P O W E R
Source: Nuclear Regulatory Commission
http://www.nrc.gov/info-finder/region-state/#listAlpha
Operating Nuclear Power Reactors
Alabama
Browns Ferry
Units 1, 2, and 3
Joseph M. Farley
Units 1 and 2
Arizona
Palo Verde
Units 1, 2, and 3
Arkansas
Arkansas Nuclear
Units 1 and 2
California
Diablo Canyon
Units 1 and 2
Connecticut
Millstone
Units 1 and 2
Florida
St. Lucie
Units 1 and 2
Turkey Point
Units 3 and 4
Georgia Edwin I. Hatch
Units 1 and 2
Vogtle
Units 1 and 2
Illinois
Braidwood
Units 1 and 2
Byron
Units 1 and 2
Clinton
Dresden
Units 2 and 3
Illinois cont’d
La Salle County
Units 1 and 2
Quad Cities
Units 1 and 2
Iowa
Duane Arnold
Kansas
Wolf Creek
Louisiana
River Bend
Waterford
Maryland
Calvert Cliffs
Units 1 and 2
Massachusetts
Pilgrim
Michigan
D. C. Cook
Units 1 and 2
Fermi
Unit 2
Palisades
Minnesota
Monticello
Prairie Island
Units 1 and 2
Mississippi
Grand Gulf
Missouri
Callaway
Nebraska
Cooper
Fort Calhoun
New Hampshire
Seabrook
New Jersey
Hope Creek
Oyster Creek
Salem
Units 1 and 2
New York
James A. Fitzpatrick
Ginna
Indian Point
Units 2 and 3
Nine Mile Point
Units 1 and 2
North Carolina
Brunswick
Units 1 and 2
McGuire
Units 1 and 2
Shearon Harris
Ohio
Davis-Besse
Perry
Pennsylvania
Beaver Valley
Units 1 and 2
Limerick
Units 1 and 2
Peach Bottom
Units 2 and 3
Susquehanna
Units 1 and 2
Three Mile Island
South Carolina
Catawba
Units 1 and 2
Oconee
Units 1, 2, and 3
H. B. Robinson
Unit 2
Summer
Tennessee
Sequoyah
Units 1 and 2
Watts Bar
Texas
Comanche Peak
Units 1 and 2
South Texas Project
Units 1 and 2
Virginia
North Anna
Units 1 and 2
Surry
Units 1 and 2
Washington
Columbia
Generating Station
Wisconsin
Point Beach
Units 1 and 2

9
F L O R I D A E L E C T R I C I N D U S T R Y
M A P S
Source: North American Electric Reliability Corporation
http://www.nerc.com/AboutNERC/keyplayers/Documents/NERC_Regions_Color.jpg
North American Electric Reliability Corporation (NERC) is a not-for-profit
organization whose members are eight Regional Reliability Councils.
FRCC Florida Reliability Coordinating Council
MRO Midwest Reliability Organization
NPCC Northeast Power Coordinating Council
RF ReliabilityFirst Corporation
SERC SERC Reliability Corporation
SPP RE Southwest Power Pool
TRE Texas Reliability Entity
WECC Western Electricity Coordinating Council
Reliability Councils

10
F L O R I D A E L E C T R I C I N D U S T R Y
M A P S
Source: Florida Public Service Commission
Additional information about Florida’s investor-owned electric utilities is available from: FPSC’s Statistics of the Florida Electric Utility Industry October 2014
http://www.floridapsc.com/utilities/electricgas/statistics/statistics-2014.pdf
Investor-Owned Electric Utilities Approximate Company Service Areas
Service areas are approximations.
Information on this map should be used only as a general guideline.
For more detailed information, contact individual utilities.

11
F L O R I D A E L E C T R I C I N D U S T R Y
M A P S
Source: Florida Public Service Commission
Additional information about Florida’s municipal electric utilities is available from: FPSC’s 2012 Statistics of the Florida Electric Utility Industry, September 2013
http://www.floridapsc.com/utilities/electricgas/statistics/statistics-2013.pdf
Information on this map should be used only as a general guideline.
For more detailed information, contact individual utilities.
Municipal Electric Utilities
Approximate Utility Locations

12
F L O R I D A E L E C T R I C I N D U S T R Y
M A P S
Source: Florida Public Service Commission
Additional information about Florida’s rural electric cooperatives is available from: FPSC’s Statistics of the Florida Electric Utility Industry, October 2014
http://www.floridapsc.com/utilities/electricgas/statistics/statistics-2014.pdf
Service areas are approximations.
Information on this map should be used only as a general guideline.
For more detailed information, contact individual utilities.
Rural Electric Cooperatives Approximate Company Service Areas

13
F L O R I D A N A T U R A L G A S I N D U S T R Y
Q U I C K F A C T S
Sources:
Florida Gas Transmission Company
http://www.panhandleenergy.com/comp_fld.asp
Gulfstream Natural Gas System
http://www.gulfstreamgas.com/
Pursuant to Chapter 366, F.S., as of December 2013, the FPSC has
regulatory authority over:
8 investor-owned natural gas utilities (all aspects of operations, including safety)
27 municipally owned natural gas utilities
(limited to safety and territorial boundaries)
4 special gas districts (limited to safety and territorial boundaries)
Safety jurisdiction also applies to housing authorities and sales
laterals off of interstate pipelines. (Interstate pipelines are subject
to the direct jurisdiction of the U.S. Dept. of Transportation.)
Regulatory
Authority
Transmission Natural gas is transported to Florida customers through two major
and two small interstate pipelines:
Major 1. Florida Gas Transmission Company (FGT)
2. Gulfstream Natural Gas System
Small 1. Gulf South Pipeline Company
2. Southern Natural Gas
FGT’s pipeline capacity is nearly 3 billion cubic feet per day.
Gulfstream’s pipeline capacity is 1.3 billion cubic feet per day.

14
F L O R I D A N A T U R A L G A S I N D U S T R Y
C U S T O M E R S
Source: FPSC, 2013 Annual Reports filed by Natural Gas Utilities
Number of Customers
Number of Customers for Investor-Owned Utilities
By Customer Type December 31, 2013
Utility Residential Commercial
& Industrial FTS* Other** Total
Chesapeake Utili-
ties *** 0 0 15,324 0 15,324
Florida
City Gas 97,335 5,058 1,907 0 104,300
Florida Public
Utilities Co. 48,698 4,505 931 57 54,191
FPUC
Ft. Meade
Division**** 655 20 6 0 681
FPUC
Indiantown
Division *** 0 0 705 0 705
Peoples Gas
System 313,750 13,592 19,934 83 347,359
St. Joe
Natural Gas 2,699 206 1 1 2,907
Sebring Gas
System *** 0 0 525 0 525
Total 463,137 23,381 39,333 141 525,992
* Firm Transportation Service
** Other includes Off System Sales, Interruptible Sales, Natural Gas Vehicle Sales, and Other Sales to Public Au-
thorities
*** Exited the merchant function. All sales are firm transportation customers.
**** On December 2, 2013 FPUC purchased the natural gas operating assets of The City of Fort Meade which
provides natural gas distribution services. Number of customers was supplied by the company.
15
F L O R I D A N A T U R A L G A S I N D U S T R Y
R A T E S
Source: Company tariffs
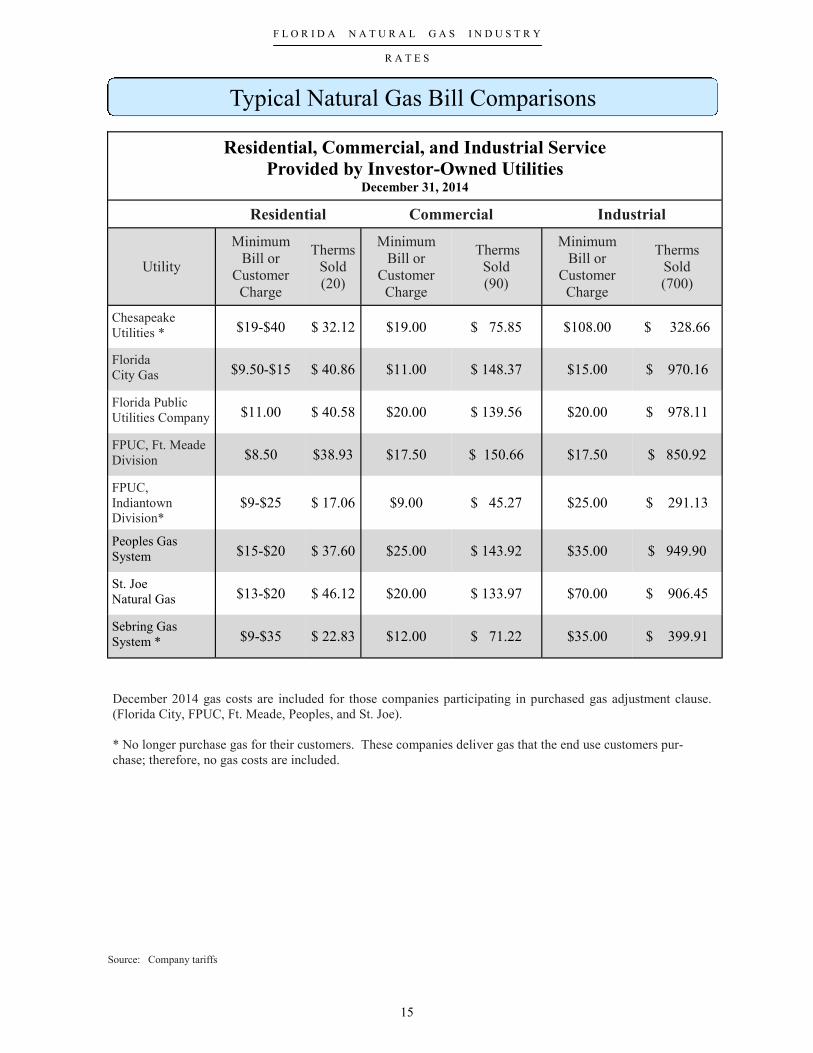
Typical Natural Gas Bill Comparisons
Residential, Commercial, and Industrial Service
Provided by Investor-Owned Utilities December 31, 2014
Residential Commercial Industrial
Utility
Minimum
Bill or
Customer
Charge
Therms
Sold
(20)
Minimum
Bill or
Customer
Charge
Therms
Sold
(90)
Minimum
Bill or
Customer
Charge
Therms
Sold
(700)
Chesapeake
Utilities * $19-$40 $ 32.12 $19.00 $ 75.85 $108.00 $ 328.66
Florida
City Gas $9.50-$15 $ 40.86 $11.00 $ 148.37 $15.00 $ 970.16
Florida Public
Utilities Company $11.00 $ 40.58 $20.00 $ 139.56 $20.00 $ 978.11
FPUC, Ft. Meade
Division $8.50 $38.93 $17.50 $ 150.66 $17.50 $ 850.92
FPUC,
Indiantown
Division* $9-$25 $ 17.06 $9.00 $ 45.27 $25.00 $ 291.13
Peoples Gas
System $15-$20 $ 37.60 $25.00 $ 143.92 $35.00 $ 949.90
St. Joe
Natural Gas $13-$20 $ 46.12 $20.00 $ 133.97 $70.00 $ 906.45
Sebring Gas
System * $9-$35 $ 22.83 $12.00 $ 71.22 $35.00 $ 399.91
December 2014 gas costs are included for those companies participating in purchased gas adjustment clause.
(Florida City, FPUC, Ft. Meade, Peoples, and St. Joe).
* No longer purchase gas for their customers. These companies deliver gas that the end use customers pur-
chase; therefore, no gas costs are included.
Typical Natural Gas Bill Comparisons

16
Annual Therm Sales for Investor-Owned Utilities December 31, 2013
Utility Residential Commercial &
Industrial FTS* Other** Total
Chesapeake
Utilities *** 0 0 121,414,123 0 121,414,123
Florida
City Gas 15,576,646 24,722,736 84,989,465 0 125,288,847
Florida Public
Utilities Co. 11,967,185 26,527,216 22,968,683 6,408,687 68,571,771
FPUC
Ft. Meade
Division ****
FPUC
Indiantown
Division *** 0 0 7,915,381 0 7,915,381
Peoples Gas
System 65,161,183 38,736,605 405,210,670 1,159,452,010 1,668,560,468
St. Joe
Natural Gas 595,066 360,481 415,610 11,603 1,382,760
Sebring Gas
System *** 0 0 1,141,964 0 1,141,964
Annual Therm Sales
* Firm Transportation Service
** Other includes Off System Sales, Interruptible Sales, Natural Gas Vehicle Sales, and Other Sales to Pub-
lic Authorities
*** Exited the merchant function. All sales are firm transportation customers.
**** On December 2, 2013 FPUC purchased the natural gas operating assets of The City of Fort Meade
which provides natural gas distribution services.
Source: FPSC, 2013 Annual Reports filed by Natural Gas Utilities
F L O R I D A N A T U R A L G A S I N D U S T R Y
ANNUAL THERM SALES

17
F L O R I D A N A T U R A L G A S I N D U S T R Y
M A P
Source: FPSC Map
http://www.floridapsc.com/publications/pdf/electricgas/naturalgasutilities.pdf
Service areas are approximations.
Information on this map should be used only as a general guideline.
For more detailed information, contact individual utilities.
Natural Gas Companies in Florida
Approximate Company Service Areas
18
F L O R I D A T E L E C O M M U N I C A T I O N S I N D U S T R Y
Q U I C K F A C T S
Source:
Florida Public Service Commission 2014 Annual Report
http://www.floridapsc.com/publications/pdf/general/annualreports/2014.pdf
FPSC’s Telecommunications Terms and Definitions http://www.floridapsc.com/publications/telecomm/telterms.aspx
Pursuant to Chapter 364, F.S., as of December 31, 2014, the FPSC has regulatory
authority over:
10 incumbent local exchange companies (ILECs)
252 competitive local exchange companies (CLECs)
63 pay telephone service companies (PATS)
21 alternative access vendors (AAVs)
15 shared tenant service providers (STS)
Incumbent Local Exchange Telecommunications Company (ILEC)
- any company certificated by the Commission to provide local exchange
telecommunications service in Florida on or before June 30, 1995.
Competitive Local Exchange Telecommunications Company (CLEC)
- any company certificated by the Commission to provide local exchange
telecommunications service in Florida on or after July 1, 1995.
Pay Telephone Service Company (PATS) - any certificated telecommuni-
cations entity which provides pay telephone service.
Alternative Access Vendor (AAV) - AAVs provide private line service be-
tween an entity and facilities at another location, whether owned by the enti-
ty or an unaffiliated entity, or access service between an end-user and an
interexchange carrier by other than a local exchange telecommunications
company. The private line service is dedicated point-to-point or point-to-
multipoint service for the transmission of any telecommunication service.
Shared Tenant Service (STS) - Any certificated telecommunications com-
pany that provides service which duplicates or competes with local service
provided by an existing local exchange telecommunications company and is
furnished through a common switching or billing arrangement to tenants by
an entity other than an existing local exchange telecommunications compa-
ny.
Regulatory
Authority
Definitions

19
F L O R I D A T E L E C O M M U N I C A T I O N S I N D U S T R Y
Q U I C K F A C T S
Source:
FPSC’s Report on the Status of Competition in the Telecommunications Industry, As of December 31, 2013 http://www.floridapsc.com/publications/pdf/telecomm/20140730MasterComp.pdf
Broadband is a term describing evolving digital technologies offering consumers integrated access
to voice, high-speed data services, video on demand services, and interactive information delivery
services. Voice over Internet Protocol (VoIP) and wireless services compete with traditional
wireline service and represent a significant portion of today’s communications market in Florida.
VoIP is not the same as the Internet. It is a technology that allows you to make voice calls using a
broadband internet connection instead of a regular telephone line. Broadband service also provides
the basis for some VoIP services. These three services are not subject to FPSC jurisdiction.
Broadband
Approximately 58 percent of broadband connections are at download speeds of 3 Mbps or great-
er; however, 75 percent of those connections are greater than or equal to 200 Mbps.
Residential subscribership in Florida reached 75 percent, as of June 2013, which is 6 percent
above the current national average.
VoIP
As of December 2013, there were an estimated 2.8 million residential VoIP subscribers in Flori-
da, an increase of 5 percent over the 2.7 million estimated in 2012.
Fifty-nine CLECs and 4 ILECs voluntarily reported 1.2 million (residential and business) VoIP
lines to the FPSC in response to its 2013 Local Competition data request.
The Florida Cable Telecommunications Association (FCTA) reported 2.1 million residential
cable digital voice (VoIP) subscribers as of December 2013, about the same number as reported
for December 2012.
Wireless
Wireless subscribers in Florida, as of June 2013, reached 18.5 million handsets.
The Centers for Disease Control (CDC) estimates that nearly 41 percent of U.S. households are
wireless-only as of December 2013.
Broadband, VoIP, and Wireless

20
F L O R I D A T E L E C O M M U N I C A T I O N S I N D U S T R Y
C U S T O M E R S
Sources: FPSC’s Report on the Status of Competition in the Telecommunications Industry, As of December 31, 2013, Figures 3-3 & 3-4
http://www.floridapsc.com/publications/pdf/telecomm/20130722MasterComp.pdf
An access line is a telephone line extending from the telecommunications company’s central office
to a point of demarcation, usually on the customer’s premises.
Access Lines
Florida Access Lines As of December 2013
Residential* Business* Total* Change since
2012
AT&T Florida 914 914 1,828 -17%
CenturyLink FL 636 316 952 -7%
Verizon FL 266 246 512 -25%
Rural ILECs 93 41 134 -6%
CLECs 39 1,605 1,644 +13%
Total 1,948 3,122 5,070 -7%
* In thousands, rounded to the nearest thousand

21
F L O R I D A T E L E C O M M U N I C A T I O N S I N D U S T R Y
C U S T O M E R S
The Federal Communications Commission (FCC) and Congress recognize that telephone
service provides a vital link to emergency services, government services, and surrounding
communities. To help promote telecommunications service nationwide, the FCC, as
directed by Congress, developed the Federal Universal Service Fund (USF). The USF is
administered by the Universal Service Administrative Company (USAC). The USF
includes the High-Cost, Low-Income, Schools and Libraries, and Rural Health Care
Programs.
High-Cost Program. The federal universal service high-cost program (also known as
the Connect America Fund) is designed to ensure that consumers in rural, insular, and
high-cost areas have access to modern communications networks capable of providing
voice and broadband service, both fixed and mobile, at rates that are reasonably compa-
rable to those in urban areas. The program fulfills this universal service goal by allow-
ing eligible carriers who serve these areas to recover some of their costs from the federal
Universal Service Fund.
Low-Income Program. Provides telephone service discounts to qualifying low-income
consumers. It offers benefits through the Lifeline Assistance program:
The Lifeline Assistance Program: Provides a monthly credit of at least $9.25 on
basic monthly service or the option of receiving a free Lifeline cell phone and
monthly minutes at the primary residence for qualified telephone subscribers. The
telephone subscriber may receive a credit less than $9.25 if the subscriber’s bill for
basic local telephone service is less than that amount.
Tribal Benefits: Residents living on federally recognized tribal lands may receive a
one-time discount of up to $100.00 in Link-Up support and enhanced Lifeline sup-
port (up to an additional $25.00 in support beyond current levels). Link-Up helps
income-eligible consumers on tribal lands with initial installation or activation of a
wireline or wireless telephone for the primary residence.
Monthly Lifeline Credit: Under the FCC’s rules, monthly federal Lifeline support
consists of at least a $9.25 monthly credit on basic monthly service or the option of
receiving a free Lifeline cell phone and monthly minutes. Eligible subscribers living
on tribal lands can receive a monthly discount of up to $34.25 ($9.25 plus an addi-
tional $25).
1
2
Universal Service Programs

22
F L O R I D A T E L E C O M M U N I C A T I O N S I N D U S T R Y
C U S T O M E R S
* Known as Temporary Assistance to Needy Families (TANF) for federal Universal Service purposes. ** Eligible consumers living on tribal lands qualify for Link-Up and Lifeline if they participate in one of the following federal assistance
programs: (1) Tribal TANF, (2) National School Lunch Free Lunch Program, or (3) Head Start Subsidy.
Low-Income Program (continued)
Customer Eligibility: Customers with annual incomes up to 150 percent of the
federal poverty guidelines may be eligible to participate in the Lifeline program. In
addition, eligibility is determined by customer enrollment in any one of the following
programs:
→ Temporary Cash Assistance (TCA)*
→ Supplemental Security Income (SSI)
→ Supplemental Nutritional Assistance Program (SNAP)
→ Medicaid
→ Federal Public Housing Assistance (Section 8)
→ Low-Income Home Energy Assistance Program (LIHEAP)
→ National School Lunch Program’s Free Lunch Program
→ Bureau of Indian Affairs Programs**

23
F L O R I D A T E L E C O M M U N I C A T I O N S I N D U S T R Y
C U S T O M E R S
Schools and Libraries (or E-Rate) Program. Helps to ensure that the nation’s
classrooms and libraries receive access to the vast array of educational resources that are
accessible through the telecommunications network. While funding for the program is
capped, the FCC has included an index for inflation to preserve the purchasing power of
the program. Recently, the FCC increased the annual cap from $2.4 billion to $3.9 bil-
lion. The E-Rate program offers the following benefits:
Eligible schools and libraries receive discounts on telephone service, Internet access,
and internal connections (i.e., network wiring) within school and library buildings.
The discounts range from 20 percent to 90 percent, depending on the school’s
eligibility for the National School Lunch program (or a federally approved
alternative mechanism) and whether or not the school or library is located in an
urban or rural area.
Rural Health Care Program. Helps to link health care providers located in rural areas
to urban medical centers so that patients living in rural America will have access to the
same advanced diagnostic and other medical services that are enjoyed in urban
communities. Funding is capped at $400 million annually. This program offers many
benefits:
Public and non-profit health care providers in rural areas can receive discounts on
monthly telecommunications charges, installation charges, and long distance Inter-
net connection charges.
Rural health care providers are using funds from this program for a variety of patient
services, such as transmitting x-rays from remote areas to be read by health care
professionals and experts in urban areas.
The FCC has augmented the existing support with a pilot program to fund the
construction of dedicated broadband networks that connect health care providers in a
state or region. This program will provide funding for up to 85 percent of an
applicant’s costs of deploying a dedicated broadband network, including any
necessary network design studies, as well as the costs of advanced
telecommunications and information services that will ride over this network.
Participants deploying dedicated broadband health care networks would also have
the option of connecting those systems to Internet-2, National LambdaRail, or the
public Internet.
Eligible entities include:
→ post-secondary educational institutions offering health care instruction, including
teaching hospitals and medical schools
→ community health centers or health centers providing health care to migrants
→ community mental health centers
4
Source: Federal Communications Commission
http://www.fcc.gov/cgb/consumerfacts/universalservice.html
3
24
F L O R I D A T E L E C O M M U N I C A T I O N S I N D U S T R Y
C U S T O M E R S
Source:
FPSC’s Number of Customers Subscribing to Lifeline Service and the Effectiveness of Procedures to Promote Participation, December 2014 http://www.floridapsc.com/publications/pdf/telecomm/tele-lifelinereport2014.pdf
Universal Service Program Developments in Florida
Low-Income Program
Coordinated Enrollment Process In 2006, FPSC and the Department of Children and
Families (DCF) staff developed a process whereby potential Lifeline customers, once certi-
fied through a DCF program, could receive Lifeline discounts. From the perspective of the
client, the coordinated enrollment process established by the FPSC and DCF is seamless,
from filling out the DCF web application to receiving Lifeline discounts.
The coordinated enrollment process entails the DCF client checking a “yes” or “no” box.
DCF then forwards the names of the clients who have chosen and been approved for Life-
line, along with their relevant enrollment information, to the FPSC. The FPSC electronical-
ly sorts the information by eligible telecommunications carrier (ETC) and places the names
on a secure Web site for retrieval and enrollment by the appropriate ETC.
Lifeline Annual Recertification All ETCs are now required to perform an annual recertifi-
cation of their Lifeline subscribers to verify their ongoing eligibility. Subscribers failing to
respond to recertification efforts must be de-enrolled from Lifeline. ETCs may contact and
receive recertification responses from subscribers in writing, by phone, by text message, by
e-mail, by Interactive Voice Response, or otherwise through the internet using an electronic
signature. If an ETC is unable to recertify a subscriber because the subscriber did not re-
spond to the recertification request, the ETC must de-enroll the subscriber. If an ETC re-
ceives a response that the subscriber is no longer eligible, the subscriber must be de-enrolled
within five business days, and offered transitional Lifeline benefits for up to 12 months.
National Lifeline Accountability Database (NLAD) The FCC directed the Universal Ser-
vice Administrative Company to establish a database to both eliminate existing duplicative
support and prevent duplicative support in the future. To prevent waste in the Universal
Service Fund, the FCC created and mandated the use by ETCs of a National Lifeline Ac-
countability Database to ensure that multiple ETCs do not seek and receive reimbursement
for the same Lifeline subscriber. The NLAD conducts a nationwide real-time check to de-
termine if the consumer, or another person at the address of the consumer, is already receiv-
ing a Lifeline-supported service.

25
F L O R I D A T E L E C O M M U N I C A T I O N S I N D U S T R Y
C U S T O M E R S
Low-Income Program
Continued
Eligible Telecommunications Carriers (ETC) A carrier that is granted ETC status is
eligible to receive federal universal service support pursuant to FCC rules. To qualify as
an ETC, a common carrier must offer services that are supported by federal universal
service support mechanisms either using its own facilities or using a combination of its
own facilities and another carrier’s resold service. Additionally, the carrier must adver-
tise the availability of such services and charges using media of general distribution. As
of June 2014, Florida had 22 ETCs, comprised of 10 incumbent local exchange compa-
nies, 8 competitive local exchange companies, and 4 wireless companies. FCC rules al-
low state commissions, upon their own motion or upon request, to designate a common
carrier that meets certain requirements as a landline ETC. As of July 2012, the Federal
Communications Commission approves wireless providers applying for ETC designa-
tion in Florida. As of June 2014 there were 34 Florida ETC wireless petitions pending at
the FCC.
Income Eligibility Section 364.10(2)(a), F.S., allows any local exchange company des-
ignated as an ETC with more than 1 million access lines and any commercial mobile ra-
dio service provider designated as an ETC carrier pursuant to 47 U.S.C. §214(e), upon
filing a notice of election to do so with the Commission, to provide Lifeline service to
any customer who meets an income eligibility test of 150 percent or less of the federal
poverty income guidelines. All other ETCs must use 135 percent or less of the Federal
Poverty Level guidelines for income eligibility.

26
Source: Federal Communications Commission’s Universal Service Monitoring Reports, http://www.fcc.gov/wcb/iatd/monitor.html
2 0 1 3 (Annual Payments and Contributions in Thousands)
2 0 1 2 (Annual Payments and Contributions in Thousands)
2 0 1 1 (Annual Payments and Contributions in Thousands)
Program
Payments
from USAC
Estimated
Contributions
to USAC
Estimated
Net Dollar
Flow
High-Cost $65,341 265,968 ($200,627)
Low-Income 101,373 114,791 (13,418)
Schools & Libraries 89,269 140,752 (51,483)
Rural Health Care 282 10,151 (9,869)
Administrative Expense 6,881 (6,881)
TOTAL $256,265 $538,543 ($282,278)
Program
Payments
from USAC
Estimated
Contributions
to USAC
Estimated
Net Dollar
Flow
High-Cost $59,281 $268,520 ($209,239)
Low-Income 118,154 141,767 (23,613)
Schools & Libraries 80,450 143,625 (63,175)
Rural Health Care 457 10,064 (9,607)
Administrative Expense - 7,172 (7,172)
TOTAL $258,342 $571,148 ($312,806)
Program
Payments
from USAC
Estimated
Contributions
to USAC
Estimated
Net Dollar
Flow
High-Cost $54,708 $261,019 ($206,311)
Low-Income 112,350 113,357 (1,007)
Schools & Libraries 76,928 144,554 (67,626)
Rural Health Care 572 9,130 (8,558)
Administrative Expense - 6,934 (6,934)
TOTAL $244,558 $540,994 ($290,436)
F L O R I D A T E L E C O M M U N I C A T I O N S I N D U S T R Y
C U S T O M E R S
Universal Service Support Mechanisms by Program for Florida

27
F L O R I D A T E L E C O M M U N I C A T I O N S I N D U S T R Y
C U S T O M E R S
Source:
Federal Communications Commission’s Universal Service Monitoring Reports, Table 1.13
http://www.fcc.gov/wcb/iatd/monitor.html
* Net dollar flow is positive when payments from USF to carriers exceed contributions to USF.
Payments Estimated Estimated
from USAC Contributions to USAC Net Dollar
State (in Thousands) (in Thousands) Flow
Alabama $ 255,080 $ 130,750 $ 124,330
Alaska 278,670 21,765 256,905
American Samoa 4,714 777 3,937
Arizona 186,654 160,729 25,925
Arkansas 138,099 74,445 63,654
California 577,921 910,070 (332,149)
Colorado 110,891 149,135 (38,244)
Connecticut 30,068 110,731 (80,663)
Delaware 5,696 30,098 (24,402)
Dist. of Columbia 14,254 44,728 (30,474)
Florida 256,265 538,543 (272,278)
Georgia 294,990 270,175 24,815
Guam 13,973 4,643 9,330
Hawaii 30,191 45,279 (15,088)
Idaho 58,309 40,382 17,927
Illinois 241,481 335,075 (93,594)
Indiana 149,707 157,486 (7,779)
Iowa 158,672 76,338 82,334
Kansas 192,134 72,010 120,124
Kentucky 199,168 112,124 87,044
Louisiana 185,845 124,995 60,850
Maine 47,045 37,064 9,981
Maryland 64,548 186,146 (121,598)
Massachusetts 58,439 210,158 (151,719)
Michigan 173,709 238,363 (64,654)
Minnesota 146,141 137,094 9,047
Mississippi 261,049 72,277 188,772
Missouri 168,458 160,508 7,950
Montana 95,921 28,149 67,772
Nebraska 88,711 49,408 39,303
Nevada 53,774 71,086 (17,312)
New Hampshire 16,121 38,965 (22,844)
New Jersey 90,297 286,397 (196,100)
New Mexico 127,073 51,494 75,579
New York 282,169 579,551 (297,382)
North Carolina 235,550 260,090 (24,540)
North Dakota 102,044 20,032 82,012
Northern Mariana Islands 2,474 1,339 1,135
Ohio 205,477 288,632 (83,155)
Oklahoma 395,058 90,739 304,319
Oregon 104,890 97,557 7,333
Pennsylvania 228,075 364,443 (136,368)
Puerto Rico 218,060 89,119 128,941
Rhode Island 13,930 30,578 (16,648)
South Carolina 183,308 123,771 59,537
South Dakota 79,785 21,962 57,823
Tennessee 157,025 172,582 (15,557)
Texas 588,729 585,563 3,166
Utah 48,518 62,396 (13,878)
Vermont 26,978 19,813 7,165
Virgin Islands 23,741 6,354 17,387
Virginia 143,173 253,187 (110,014)
Washington 132,191 171,410 (39,219)
West Virginia 143,051 56,417 86,634
Wisconsin 185,860 144,558 41,302
Wyoming 52,017 16,452 35,565
Total $ 8,326,171 8,433,931 ($ 107,760)*
Universal Service Support Mechanisms by State (2013)

28
F L O R I D A T E L E C O M M U N I C A T I O N S I N D U S T R Y
C U S T O M E R S
Source:
United States Department of Agriculture Supplemental Nutrition Assistance Program: Number of Households Participating June 2014
FPSC’s 2014 Lifeline Report December 2014
http://www.floridapsc.com/publications/pdf/telecomm/tele-lifelinereport2014.pdf
Percentage of Households with Telephone in Unit
2009 2010 2011 2012 2013
Florida 93.0% 93.7% 93.2% 94.2% 93.5%
United States 95.7% 95.8% 95.7% 95.9% 95.9%
Lifeline Assistance Subscribers in Florida
Date
Lifeline
Enrollment
Eligible
Households
Participation
Rate
6/2008 183,972 1,186,015 15.5%
6/2009 618,774 1,185,516 52.2%
6/2010 642,129 1,422,837 45.1%
6/2011 943,854 1,690,512 55.8%
6/2012 1,035,858 1,864,183 55.6%
6/2013 918,245 1,952,890 47.0%
6/2014 957,792 1,930,106 49.6%
Telephone Subscribership
Lifeline Subscribership

29
F L O R I D A T E L E C O M M U N I C A T I O N S I N D U S T R Y
C U S T O M E R S
Source: FPSC’s Number of Customers Subscribing to Lifeline Service and the Effectiveness of Procedures to Promote Participation, December 2014
http://www.floridapsc.com/publications/pdf/telecomm/tele-lifelinereport2014.pdf
Lifeline Subscribership by Eligible Telecommunications Carriers
As of June 2014
Company Access Lines Subscribed
to Lifeline Service
SafeLink** 543,174
Assurance** 249,664
i-wireless/Access** 97,044
AT&T 28,156
CenturyLink 18,756
Verizon 8,245
Windstream 4,348
T-Mobile** 3,091
FairPoint 1,307
TeleCircuit* 666
Non-ETC Reseller 658
NEFCOM 545
Cox Telecom* 522
Budget Phone* 407
TDS Telecom 406
Knology d/b/a WOW* 294
Global Connection* 275
Frontier 84
ITS Telecom 77
Nexus* 51
Smart City 12
FLATEL* 10
Total 957,792
* Competitive Local Exchange Carrier
**Wireless Carrier
Lifeline Subscribership (continued)

30
F L O R I D A W A T E R & W A S T E W A T E R I N D U S T R Y
Q U I C K F A C T S
* Most current data available as of May 2014.
** Million gallons per day
Sources:
Florida Department of Environmental Protection’s 2012 Reuse Inventory, May 2014
http://www.dep.state.fl.us/water/reuse/inventory.htm
Regulatory
Authority
Pursuant to Chapter 367, F.S., as of December 2014, the FPSC has
regulatory authority over 149 investor-owned water and/or wastewater
utilities in 37 of Florida’s 67 counties.
719 mgd** of reclaimed water was reused for beneficial purposes.
The total reuse capacity of Florida’s domestic wastewater
treatment facilities was 1,691 mgd, representing 66 percent of the
total permitted domestic wastewater treatment capacity in Florida.
Reuse of
Reclaimed Water
Data for 2013*

31
F L O R I D A W A T E R & W A S T E W A T E R I N D U S T R Y
Q U I C K F A C T S
Source: Florida Department of Environmental Protection’s 2013 Reuse Inventory, May 2014
http://www.dep.state.fl.us/water/reuse/inventory.htm
Florida’s Reuse Growth Millions of Gallons Per Day (mgd)
Reclaimed Water Utilization (2013)

32
F L O R I D A W A T E R & W A S T E W A T E R I N D U S T R Y
C U S T O M E R S & R A T E S
Source: FPSC Staff
The National Association of Regulatory Utility Commissioners uses three classes to define the size
of water and wastewater utilities:
A Class C utility may serve as few as 50 customers, while a Class A utility serves thousands.
The number of customers served may be obtained from each utility’s annual report filed at the
FPSC and available online at http://www.floridapsc.com/utilities/mcd/.
The base facility charge and gallonage charge rate structure is the most common rate structure
used by FPSC-regulated water and wastewater utilities.
The base facility charge is a flat charge that recovers the fixed costs of utility service that re-
main the same each month regardless of consumption.
The gallonage charge recovers the variable costs associated with the utility service such as
electricity, chemicals, and labor.
The gallonage charge is assessed for each 1,000 gallons of water that is registered on the cus-
tomer’s meter.
Inclining block rate structures are used to encourage water conservation. (The inclining block is
similar to the base facility charge and gallonage charge rate structure, but includes additional
gallonage charges for higher levels or blocks of usage.)
A maximum (or cap) is set on the number of gallons of water consumption a customer is billed
for wastewater service.
The monthly cap is normally between 6,000 and 10,000 gallons. (Any water consumption over
that amount is generally considered to be used for purposes such as irrigation or washing cars.)
The rates charged by all water and wastewater utilities under the Commission’s jurisdiction are
shown in alphabetical order by county in the FPSC’s Comparative Rate Statistics report,
available online at http://www.floridapsc.com/publications/reports.aspx.
Utilities having annual water or wastewater revenues of $1,000,000 or more
Utilities having annual water or wastewater revenues of $200,000 or more
but less than $1,000,000
Utilities having annual water or wastewater revenues of less than $200,000
Class B
Class A
Class C
Utility Classifications
Rate Structure
Residential Wastewater Gallonage Cap
Water & Wastewater Utility Rates

33
F L O R I D A W A T E R & W A S T E W A T E R I N D U S T R Y
M A P S
Source: Florida Public Service Commission Map
http://www.floridapsc.com/utilities/waterwastewater/wawmap.pdf
Water & Wastewater Jurisdictional Counties (37)

34
F L O R I D A W A T E R & W A S T E W A T E R I N D U S T R Y
M A P S
Source: Florida Department of Environmental Protection
http://www.dep.state.fl.us/secretary/watman/
Florida’s Water Management Districts (5)
