of sussex dphil thesissro.sussex.ac.uk/6315/1/arellano_yanguas,_javier.pdf · of the university of...
TRANSCRIPT

A University of Sussex DPhil thesis
Available online via Sussex Research Online:
http://sro.sussex.ac.uk/
This thesis is protected by copyright which belongs to the author.
This thesis cannot be reproduced or quoted extensively from without first obtaining permission in writing from the Author
The content must not be changed in any way or sold commercially in any format or medium without the formal permission of the Author
When referring to this work, full bibliographic details including the author, title, awarding institution and date of the thesis must be given
Please visit Sussex Research Online for more information and further details

Local politics, conflict and development
in Peruvian mining regions
Javier Arellano Yanguas
A dissertation submitted in fulfilment of the requirements
for the degree of Doctor of Philosophy
of the University of Sussex
Institute of Development Studies
University of Sussex
October 2010

− i −
I hereby declare that this thesis has not been, and will not be, submitted in
whole or part to another university for the award of any other degree.
Signature

− ii −
UNIVERSITY OF SUSSEX
JAVIER ARELLANO YANGUAS
DPHIL DEVELOPMENT STUDIES
LOCAL POLITICS, CONFLICT AND DEVELOPMENT
IN PERUVIAN MINING REGIONS
SUMMARY
This thesis examines the effects of a collection of policies that determine the mandatory distribution of mining, gas and oil revenues between national and sub-national governments, and the greater involvement of mining companies in local development. I have labelled this set of policies, which aims to reduce social conflict and promote local development, the New Extractive Industry Strategy (NEIS).
Chapter 1 describes the implementation of these policies in Peru and highlights their significance to the mining industry worldwide. Chapter 2 describes the methodology of the thesis and introduces the three field research regions. Chapter 3 outlines the national socio-political context for the implementation of the NEIS.
Chapters 4–6 deal with the effects of the NEIS on social conflict. I argue that the implementation of the NEIS has not only failed to reduce conflict but has actually exacerbated it. After reviewing the debates linking extraction and conflict (Chapter 4), Chapter 5 demonstrates that conflict is strongly associated with the volume of mining revenue received by sub-national governments.
Chapter 6 presents a typology of conflicts that helps to explain the correlation between mining revenue and unrest. In addition to well-known conflicts that are related to the adverse impact of mining on livelihoods and the environment, the study identifies two other types. In the first, peasant communities employ social conflict to increase their bargaining power with the mining companies for material compensation. In the second, the large volume of mining revenue generates disputes over access to or use of these financial transfers.
Chapters 7–8 show that the NEIS has not delivered its development promises. Chapter 7 illustrates how regional and municipal governments in receipt of high per capita volumes of mining revenue transfers did not improve their economic and welfare indicators any more than the rest of the country. Chapter 8 proposes that a combination of obstructive political factors trapped regional and municipal authorities and local populations in a myopic political game that prioritised quick short-term spending over any long-term benefits to be gained from better planned expenditure. Finally, Chapter 9 draws some conclusions and makes some suggestions.

− iii −
Acknowledgments
The completion of this thesis was only made possible due to the cooperation and
support of a number of people and organisations. I embarked upon my DPhil
because Professor Mick Moore helped me discover that I had a relevant topic. I
continued to enjoy Mick’s help during the three years I spent researching and
writing the thesis, and owe both him and Professor Fiona Wilson a debt of gratitude
for their wise guidance. During my field research, they encouraged me to embrace
the unexpected and not to be held back by preconceived notions and
predetermined methodologies. This advice allowed me to go beyond the original
scope of the study, prompting me to learn and employ different methodologies. In
writing up the thesis, I also benefited from their insightful comments on various
drafts. Sometimes, I felt overwhelmed at having two demanding supervisors but I
very much appreciated their frankness and trust in my ability to improve the thesis.
Thanks are due to the Government of Navarre for the doctoral scholarship that
made this study possible, and to the Society of Jesus (Loyola Province) for financial
support in the initial stages. I am also grateful to the Centre for the Future State at
IDS for supporting my participation in international seminars on The political
management of natural resource revenues in Lima and Quito; for giving me the
opportunity to attend the Institute for Qualitative and Multi-method Research at the
University of Syracuse; and for facilitating the publication of my findings on conflict
in mining regions.
The research behind this thesis would not have been possible without the
cooperation of all the interviewees who graciously gave up their time and granted
me the benefit of their knowledge. I am especially indebted to those who helped me
identify the right people and obtain their contact details, and those who assisted me
in planning the practicalities of travelling around the mining areas of Pasco,
Ancash, and Moquegua.
In Lima, José de Echave (Cooperacción), Nilton Quiñones and Epifanio Baca
(Propuesta Ciudadana), and Edgardo Cruzado facilitated access to the relevant
people and organisations. In Cerro de Pasco, Cesar López Jurado and Andrés
Avelino (Labor) were immensely helpful in providing background information,

− iv −
facilitating contact with mayors and peasant communities, and advising on travel
and accommodation in the region.
In Ancash, Richard Moreno and Manuel Huaray (CEPES) provided vital information
about the region and contact details for its authorities. Alfredo Gamio, Elena
Marquina, Jaime Mendoza, Hernan Pacha, and Silvia of CEOP-Ilo were wonderful
hosts during my field research in Moquegua. Here, I also enjoyed fascinating
conversations and a most useful seminar with Denis Rojas, Juan Zúñiga, and other
colleagues at Labor.
Thanks are due to the mining companies that were willing to discuss their
perspectives of the situation: Antamina, Barrick, Atacocha, Milpo, El Brocal,
Buenaventura, Volcan, Pan American Silver, Southern Peruvian Cooper
Corporation, and Anglo American.
During my stay in Peru, I was an associate member of the Institute of Peruvian
Studies and the Catholic University. I am most grateful to Marisa Remy of the
former for her openness in sharing her knowledge of regional and local politics, and
for organising a mesa verde (green table) in September 2008 for the discussion of
the preliminary findings of my field research. The comments of colleagues who
participated in this seminar were very helpful in identifying threads in the data I had
collected.
At different times, Javier Iguiñiz, Alejandro Diez, Federico Helfgott, Martin Scurrah,
María Burneo, and Bruno Revesz provided information, bibliographies and helpful
reflections on my research. I also owe a special debt of gratitude to Miguel Zegarra
for helping me compile the municipal figures dataset that I use in Chapters 7 and 8.
At IDS, I am most grateful to Angela Dowman for her help with all the administrative
formalities, and her genuine interest in the well-being of each individual DPhil
candidate. Thanks are also due to Diana Conyers, David Leonard, Anu Joshi,
Andrés Mejía, Peter Houtzager, Richard Crook, Mark Berenson, Lindan Waldman
and other colleagues who made helpful comments during and after my research
outline and work in progress seminars.
During my time in Brighton, I learnt a lot through participating in Governance Team
reading groups and seminars, with the additional advantage of the sessions being

− v −
more fun than spending long hours by myself. I also enjoyed the kindness and
efficiency exhibited by the Governance Team administrators – thanks to Caroline,
Camila, Adam, Chris, and a particular tribute to the late Linda Bateman.
At IDS, I also met a wonderful group of fellow DPhil candidates. I was fortunate
enough to enjoy discussions with, receive advice from, and share time, concerns
and joy with Santhosh Mathew, Louise Tillin, Julian Salazar, María Teresa Armijos,
Will Pritchard, Phemo Kgomotso, Linnet Taylor, Florence Dafe, Machiko Tsubura,
Marika Djolai, Suchi Pande, Ronald Adamtey, Dario Debowicz, Pedro Martin,
Sunita Abrahams, Tobias Denskus, Shandana Mohmand, and Rehab Osman.
I am grateful to Tony Bebbington for his invitation to participate in the Territory,
Conflict and Development in the Andes seminars organised by the School of
Environment and Development at the University of Manchester; and I would like to
thank the participants of these seminars for stimulating discussions and insightful
comments on data that I used in some chapters of my thesis.
Santiago Manuin (see Chapter 1), Carlos Diharce, and Mimi Cuq reinforced my
motivation to conclude this thesis by making me appreciate that the study was
important for other people as well; and their encouragement and friendship fortified
me during the long months of writing. I would also like to thank Javier and Jenny,
Manolo and Amelia, Nilton and Lucía, and Edgardo Cruzado for making us
welcome at their homes during our visits to Lima.
Above all, I am grateful to Noemí. We began our journey together in Cerro de
Pasco, during the initial stage of my field research. Living in the self-proclaimed
highest city in the world proved to be a tough beginning, but she took it in good
spirit, helped me cope with the harsh conditions, and collaborated in the
compilation of data on the municipalities of the region. Unfortunately, I could not
repay her when it came to writing up the thesis in Brighton. The need to devote
longer hours than expected to analysis and composition ruined our plans for a
quiet, enjoyable life. Nevertheless, she not only overcame the initial frustration but
generously continued to offer her support during the final stressful months.

− vi −
CONTENTS
Chapter 1: The New Extractive Industry Strategy (NEIS): the Peruvian testing ground .......................................................................................................... 1
1.1 The Peruvian testing ground .................................................................... 1
1.2 The NEIS: making a virtue out of necessity? ........................................ 12
1.2.1 Conflicts, ‘new mining’ and ‘going local’ .............................................. 12
1.2.2 The legitimising logic: radical polycentrism ........................................ 14
1.3 The Peruvian version of the NEIS ........................................................... 15
1.3.1 The canon minero ................................................................................ 17
1.3.2 The Mining Programme of Solidarity with the People (MPSP) ............ 21
1.4 The current debate on extractive industries, conflict and development ............................................................................................. 23
1.5 Thesis outline ........................................................................................... 28
Chapter 2: The research journey ......................................................................... 30 2.1 Thesis methodology ................................................................................ 31
2.1.1 What did I want to know? .................................................................... 31
2.1.2 How did I set about finding the answers? ............................................ 33
2.1.3 Selection of the field research sites ..................................................... 36
2.2 The research sites .................................................................................... 38
2.2.1 Pasco ................................................................................................... 39
2.2.2 Ancash ................................................................................................. 42
2.2.3 Moquegua ............................................................................................ 44
Chapter 3: Where the mines are: the socio-political landscape of the Peruvian countryside ............................................................................................ 46
3.1 Changes in state-citizen relations in the countryside .......................... 48
3.1.1 The revolutionary experiment of Velasco Alvarado (1968–1975) ....... 49
3.1.2 The restoration of democracy and the internal war (1980-1990) ........ 52
3.1.3 Fujimori (1990-2001): authoritarianism and neo-liberalism. ................ 53
3.1.4 The new democratic era (2001–2008): political reform straitjacketed by an untouchable economic model. ................................................... 56
3.2 The unsatisfactory outcomes of neoliberal policies: territorial inequalities and lack of trust in public institutions .............................. 58

− vii −
3.2.1 The poverty gap between rural and urban population ......................... 59
3.2.2 Erosion of public’s trust in political institutions .................................... 63
3.3 Economy of extraction in its historical perspective: political dynamics and social outcomes .............................................................. 64
3.3.1 Economic cycles and political dynamics ............................................. 64
3.3.2 Social outcomes of the extractive economy ........................................ 67
3.4 The emergence of new and more dispersed political actors ............... 69
3.4.1 Peasant communities .......................................................................... 69
3.4.2 Regional movements and other local actors ....................................... 71
Chapter 4: Perspectives on social conflict in mining areas .............................. 74 4.1 What do different Peruvian actors think about social conflict and
mining? ..................................................................................................... 75
4.2 What does the academic literature say about the relationship between mining and social conflict? ..................................................... 79
4.2.1 The comparative literature ................................................................... 80
4.2.2 Literature on Peruvian cases ............................................................... 81
4.3 A new analytical framework for the study of the relationship between mining and conflict. .................................................................. 83
4.3.1 The identification of new mining-related conflicts ................................ 85
4.3.2 The relationship between intentions and legitimising discourses ........ 86
Chapter 5: More money, more conflict ................................................................ 89 5.1 The dataset ............................................................................................... 90
5.2 Main features of social conflict in Peru (2004-2008): the growing importance of mining ............................................................................... 92
5.3 What factors explain regional and temporal variations in conflict? .................................................................................................... 96
Chapter 6: How the NEIS multiplied conflicts: a local perspective ................ 107 6.1 A typology of mining-related social conflicts ..................................... 109
6.2 Anti-mining conflicts: showing the way .............................................. 111
6.2.1 Actors and motives ............................................................................ 113
6.2.2 Mobilisation structures and alliances ................................................. 114
6.2.3 The development of an attractive and flexible narrative .................... 115
6.2.4 The adaptation of the repertoire ........................................................ 116
6.2.5 The influence of the NEIS on emblematic anti-mining conflicts ........ 117

− viii −
6.3 Communities enhancing their bargaining power to negotiate the redistribution of mining benefits .......................................................... 120
6.3.1 Peasant communities and companies interacting in a changing environment ....................................................................................... 121
6.3.2 Triggers of ‘distributive’ conflicts ........................................................ 122
6.3.3 The case of Pierina ............................................................................ 123
6.3.4 Cases around Antamina .................................................................... 125
6.3.5 Cases in Pasco .................................................................................. 129
6.3.6 How do communities and companies engage in social conflict? ...... 133
6.4 Canon minero transfers at local level: pouring oil on the flames ..... 135
6.4.1 The Moqueguazo: the curious path from the hills to the bridge ........ 137
6.4.2 The domino effect in Ancash: from pressuring the mayors to enlisting the whole region in the battle against national policies ....... 140
6.5 Conclusion .............................................................................................. 143
Chapter 7: Fiscal transfers and local welfare ................................................... 147 7.1 What does the literature say about development in mining and
oil regions? ............................................................................................. 150
7.2 Regional level analysis .......................................................................... 154
7.3 Municipal level analysis ........................................................................ 159
7.3.1 The application of propensity score matching methods .................... 161
7.3.2 The results: canon transfers had very little impact ............................ 164
7.3.3 Checking the robustness of the results ............................................. 167
Chapter 8: Why has the New Extractive Industries Strategy (NEIS) failed? ................................................................................................................... 170
8.1. Decision-making mechanisms for public capital investment in sub-national governments .................................................................... 171
8.1.1 Rules for the utilisation of different types of revenue ........................ 172
8.1.2 The budgeting schedule .................................................................... 173
8.1.3 Distribution of functions among levels of government ....................... 174
8.1.4 Participatory mechanisms for decision-making at sub-national level 176
8.1.5 Quality control of capital expenditure ................................................ 178
8.2 Influence of canon transfers on municipal capital expenditure patterns ................................................................................................... 179
8.2.1 Variables and method specification ................................................... 179
8.2.2 Results: less spending on basic services and more on concrete ...... 182

− ix −
8.3 Lack of technical capacity does not explain everything .................... 186
8.3.1 The technical capacity of municipal government: putting the concept into action .......................................................................................... 187
8.3.2 The non-correlation between capacity and quick spending .............. 192
8.4 Political survival, canon transfers, jobs, mafias, and popular participation in Conchucos Valley (Ancash) ....................................... 193
8.4.1 The tolerance of corruption ................................................................ 195
8.4.2 The distortion of participatory mechanisms ....................................... 200
8.4.3 The limitations of transparency and capacity building ....................... 204
8.5 Variations on the same theme: higher technical capacity and the promotion of clientelism in Moquegua ................................................ 207
8.6 Conclusion .............................................................................................. 211
Chapter 9: Conclusion ........................................................................................ 214 9.1 What does this study say about the implementation of the NEIS? ... 214
9.1.1 The main argument ........................................................................... 215
9.1.2 Limitations of the analysis ................................................................. 217
9.2 Lessons from the Peruvian case .......................................................... 220
REFERENCES ...................................................................................................... 225
APPENDIX I: Change in production and international prices for principal Peruvian minerals (2000–2008), taking 2000 as the base year ............................ 243
APPENDIX II: Poverty levels and income per capita in different geographical regions of Peru ...................................................................................................... 244
APPENDIX III: Summary of principal mining companies in the field research regions ................................................................................................................... 245
APPENDIX IV: Main features of municipalities included in the field study ........... 246
APPENDIX V: Criteria for the definition of categories in the three different classifications of conflict ........................................................................................ 247
APPENDIX VI: Summary of variables used in the regression analysis of conflicts .................................................................................................................. 248
APPENDIX VII: Quantitative analysis of the impact of mining on economic and welfare indicators in Peruvian regions ............................................................ 250
APPENDIX VIII: Variables used in the regression analysis of mining-related variables over changes in economic and welfare indicators at regional level ....... 263

− x −
APPENDIX IX: Summary of variables used in the analysis of differences in welfare indicators between canon-rich and canon-poor Peruvian localities (1993–2007) .......................................................................................................... 266
APPENDIX X: Robustness of PSM results ........................................................... 268
APPENDIX XI: Summary of variables used in the regression analysis of canon minero transfers and other socio-economic variables for the allocation of capital investment in municipalities with more than 3,000 inhabitants .............. 271
APPENDIX XII: Summary of the percentage of the capital investment budget allocated to main sectors in researched municipalities by municipality and year (2005–2008) .................................................................................................. 272
APPENDIX XIII Summary of welfare indicators in researched municipalities over the period 1993–2007 .................................................................................... 278

− xi −
LIST OF FIGURES
Figure 1.1 Relationship between social conflict and poor developmental performance in mining regions: two competing conceptual overviews ..................... 8
Figure 1.2 Per capita fiscal transfers to sub-national governments in Peruvian Nuevos Soles (2007) ................................................................................ 16
Figure 1.3 Canon minero and royaltya transfers to sub-national governments (1997−2008) ............................................................................................................ 21
Figure 2.1 The six main Peruvian mining regions (the three regions selected for the study are shaded in orange) ......................................................................... 39
Figure 2.2 Field research sites in Pasco ................................................................. 40
Figure 2.3 Field research sites in Ancash ............................................................... 43
Figure 2.4 Field research sites in Moquegua ......................................................... 45
Figure 3.1 Net inflow of foreign direct investment as a percentage of GDP for Peru and other groups of relevant countries, 1970–2007 ....................................... 55
Figure 3.2 Change in GDP and GDP per capita, 1950–2008 (PEN at 1994 rates) ........................................................................................................................ 65
Figure 3.3 Peruvian exports per capita, 1950–2008 (USD at 1950 rates) / minerals and fuel as a percentage of total Peruvian exports, 1950–2008 .............. 67
Figure 5.1 Comparison of the number of new conflicts breaking out year by year with those reported to be in progress in the last month of each year (2004–2008) ............................................................................................................ 93
Figure 5.2 Conflicts by principal actor 2004−2008 (number of conflicts and percentage of total) .................................................................................................. 95
Figure 5.3 Conflict by motive 2004−2008 (number of conflicts in each category and percentage of total) ............................................................................ 96
Figure 5.4 Correlation between canon minero transfers per capita and ACII at regional level in the period 2005–2008.................................................................. 102
Figure 5.5 Correlation between poverty and ACII at regional level in the period 2005–2008 .................................................................................................. 103
Figure 7.1 Map of Peruvian districts according to different levels of total canon transfers per capita during the period 2001-2007 ....................................... 163

− xii −
LIST OF TABLES
Table 1.1 Changes in the criteria for the distribution of the canon .......................... 20
Table 2.1 Statistics for Pasco, Ancash, and Moquegua ......................................... 38
Table 3.1 Evolution of Gini coefficient, 1986–2003 ................................................. 59
Table 3.2 Percentage of population below the poverty line in different geographical regions of Peru, 2008 ......................................................................... 60
Table 3.3 Average monthly per capita income in different geographical areas of Peru, 2008 ........................................................................................................... 60
Table 3.4 Relative importance of the main metropolitan area in relation to the rest of the country, and the poverty gap with respect to different geographical areas in various Latin American Countries .............................................................. 62
Table 3.5 Level of trust in political institutions: a comparison between Peru and Latin America (LA) as a whole .......................................................................... 63
Table 5.1 Number, intensity and duration of social conflicts in Peru, by year of outbreak and connections with mining .................................................................... 94
Table 5.2 Regression of poverty levels and mining-related variables on the incidence of conflict by region (2005–2008) .......................................................... 101
Table 5.3 Complementary regression models of canon minero transfers, poverty levels and other variables on the incidence of conflict by region (2005–2008) .......................................................................................................... 105
Table 6.1 Typology of social conflicts in Peruvian mining regions ........................ 110
Table 6.2 Per capita canon minero transfers (US dollars) in the three Andean municipalities of Mariscal Nieto-Moquegua (2004–2008) ..................................... 138
Table 6.3 Percentage of the 2007 capital expenditure budget actually spent and percentage of the vote secured by the winning candidate in the 2006 municipal elections, in the main municipalities around Antamina ......................... 141
Table 7.1 Distribution of actual public capital expenditure according to different levels of government (2001-2008) ........................................................... 148
Table 7.2 Summary of panel regressions of mining-related variables on the annual change in economic and welfare indicators in Peruvian regions ............... 158
Table 7.3 Estimate of the average effect of high canon transfers to Peruvian municipalities (2001-2007) on the change in the percentage of people between 15 and 24 year old with secondary education over the period 1993-2007 ....................................................................................................................... 165

− xiii −
Table 7.4 Estimate of the average effect of high canon transfers to Peruvian municipalities (2001-2007) on the change in the percentage of households with drinking water supply at home over the period 1993-2007 ............................ 166
Table 7.5 Estimate of the average effect of high canon transfers to Peruvian municipalities (2001-2007) on the change in the percentage of households with sanitation facilities at home over the period 1993-2007 ................................. 166
Table 7.6 Estimate of the average effect of high canon transfers to Peruvian municipalities (2001-2007) on the change in the percentage of households with electricity supply at home over the period 1993-2007 ................................... 167
Table 8.1 Percentage of actual capital expenditure by sector and year in Peruvian municipalities with between 3,000 and 200,000 inhabitants .................. 181
Table 8.2 Regression of canon minero transfers and other socio-economic variables on the allocation of capital investment in municipalities with more than 3,000 inhabitants, by sector according to annual budget execution (2005–2008) .......................................................................................................... 184
Table 8.3 Municipal capacity index (MCI) for 18 municipalities and comparative proportional execution of the capital investment budget (2007–2008) ...................................................................................................................... 190

− xiv −
LIST OF ACRONYMS ACII Annual Conflict Incidence Index
AMF Antamina Mining Fund
APRA American Popular Revolutionary Alliance
CIDA Canadian International Development Agency
CONACAMI National Confederation of Communities Affected by Mining − Confederación Nacional de Comunidades Afectadas por la Minería.
CPCC Cerro de Pasco Copper Corporation
CSR Corporate Social Responsability
DFID United Kingdom Department for International Development
ECOSERM Communal Multiple Services Company − Empresa Comunal de Servicios Multiples de la Comunidad de Rancas
EITI Extractive Industries Transparency Initiative
FEDIPM Front for the Defence of the Interests of the People of Moquegua − Frente de Defensa de los Intereses de Moquegua
GMI Global Mining Initiative
HDR Human Development Report
ICMM International Council on Mining and Metals
IDS Institute of Development Studies
IFC International Financial Corporation
IFI International Financial Institutions
IMF International Monetary Fund
MCI Municipal Capacity Index
MEF Ministry of Economy and Finance
MEM Ministry of Energy and Mining
MIB Modified Institutional Budget

− xv −
MMP Medium-term Municipal Plan
MMSD Mining, Minerals and Sustainable Development
MP Member of Parliament
MPSP Mining Programme of Solidarity with the People (MPSP) − Programa Minero de Solidaridad con el Pueblo
NEIS New Extractive Industry Strategy
NGO Non-Governmental Organisation
NICS National Institute of Computing and Statistics − Instituto Nacional de Informática y Estadística (INEI)
NOEP National Institute of Computing and Statistics − National Office of Electoral Processes (ONPE)
NPIS National Public Investment System
NSMOE National Society for Mining, Oil, and Energy − Sociedad Nacional de Minería, Petróleo y Energia (SNMPE)
OIB Opening Institutional Budget
OIMI Organisation for the Improvement of Municipal Investment − Mejorando la Inversión Municipal (MIM)
OLS Ordinary Least Squared
PEN Peruvian New Sol
PSM Propensity Score Matching
RE Random Effects
REI Resource Endowment Initiative
SINAMOS National System of Social Mobilisation
SPCC Southern Peru Copper Corporation
USAID United States Agency for International Development
USD United States Dollar
VAT Value Added Tax

− 1 −
Chapter 1
The New Extractive Industry Strategy (NEIS): the Peruvian testing ground
1.1 The Peruvian testing ground
On the 5th of June 2009, as I was reading the Peruvian newspapers on the internet,
I got quite a jolt. A serious clash in the northern town of Bagua between riot police
and a crowd of Awajun and Wampis indigenous people dominated the front-page
headlines. The pictures showed a fierce battle, and the name of the spot, the
Devil’s Curve, did not augur well. I immediately thought of my Awajun friends,
knowing that some of them were involved in the protest. A frantic online search for
further details confirmed my fears; there had been a bloodbath with the police firing
on protesters. Santiago Manuin, the respected Awajun leader and a very close
friend of mine, was among the victims. After several phone calls I managed to
piece together what had happened: a bullet had hit Santiago in the abdomen while
he was attempting to negotiate the withdrawal of the protesters with the police. His
condition was critical but the doctors hoped to save him.
The protest in Bagua challenged a new law1 that made it easier for private
investors to acquire and lease communal land in the Amazon. The new law aimed
to facilitate new investment in mining and oil exploration. Indigenous groups in the
Peruvian Amazon had opposed this law for more than a year, convinced that it
eroded their capability to manage their territories according to their needs. The
Awajun and Wampis people vigorously supported the protest because the oil and
mining companies had intruded into their homeland and the new law made this
even easier (ODECOFROC, 2009).
In September 2009, I flew to Peru and went to meet Santiago, who was still in
hospital in the coastal town of Chiclayo, a long way from his home. After more than
three months, he was still trying to make sense of what had happened in Bagua,
and the implications for the future of the Awajun people. Santiago knew that I had
spent many months researching into issues of social conflict and development in
different mining regions of Peru. He was interested to learn what was happening in
other parts of the country. I told him that although the level of casualties was 1 Legislative decree Nº 1015

− 2 −
unusually high in Bagua, conflict was not unusual. The rapid increase in mineral
prices (2004–2008) had been accompanied by an upsurge in the incidence of
social conflict in mining regions (Defensoría del Pueblo, 2009). However, as I
explained to Santiago, not all disputes over mining were the same. In fact, the
social conflicts I had studied were different from the one in which he had been
engaged.
To illustrate my point, I told Santiago the stories of Antonio and Isabel, who I had
met during my research.2 Antonio was a veteran social leader in one of the
communities close to the Antamina mine in the highlands of Ancash. He had
recently been involved in a dispute between his community and the Antamina
Company about the planned expansion of the mining operation. Back in the 1990s,
Antonio had been strongly opposed to large-scale mining in his region, but his
position had since softened. His current struggle no longer focused on the outright
rejection of mining, but on seeking fairer compensation for selling community land
to the mining company.
Isabel was a young woman from a landless family living in an Andean district in
Moquegua. She had been among the protesters who in July 2008 blockaded the
Montalvo Bridge in Moquegua and took more than 70 policemen hostage in an
attempt to force the national government and Parliament to change the rules
guiding the distribution of mining revenue between Moquegua and the neighbouring
region of Tacna (El Comercio, 2008d). When she told me her story two months
later, she said that she still felt frightened at the thought of the risks they had taken.
However, she did not seem to regret what she had done. On the contrary,
participating in the demonstration had helped her get a job in her municipality
employed in public works financed by mining revenue transferred from central
government to her municipality.
Santiago, Isabel and Antonio expressed different views on to the benefits and costs
that the expansion in mining could bring to their lives, and all three had become
involved in mining-related social conflicts. During the period 2002−2008, mining
appears to have been mainly responsible for the exceptional rates of economic
growth and the upsurge in social conflict that threatens Peru’s political stability (The
Economist, 2008). The Peruvian economy grew at an annual average rate of 7 per
2 I have changed names and some contextual references to preserve anonymity.

− 3 −
cent (INEI, 2009d) and some international pro-market analysts suggested Peru was
likely to become one of the new Latin-American ‘dragons’ (The Economist, 2009).
The expansion of the extractive sector was the reason (Macroconsult, 2008).3 By
2007, mining and oil constituted 70 per cent of Peru’s exports and almost 30 per
cent of the internal tax revenue (Ministerio de Economía y Finanzas, 2009a). The
economic upturn appeared to have positive welfare effects with the overall poverty
level declining from an estimated 54 per cent of the population in 2001 to 36 per
cent in 2008 (INEI, 2009a).
Yet despite these positive aspects of mining expansion, social conflicts, often
violent ones, multiplied. According to the Ombudsman’s office4, from February
2004 to December 2008 the number of conflicts in the country increased from 47 to
197 (Defensoría del Pueblo, 2009). The majority were either directly related to
mining or took place in mining regions (Apoyo, 2009b; Panfichi, 2009).
The assertion that there is a close connection between mining and social conflict is
not surprising, as experiences of large scale mining in other poor countries has
shown. This relationship has been widely studied in Peru and elsewhere (see
Chapter 4). At first glance, therefore there would seem to be nothing unusual or
puzzling about Peru’s recent experience.
Yet it is my contention that there is a puzzle. This is because conflicts multiplied
during a period when the Peruvian authorities implemented a set of policies
deliberately designed to reduce social unrest related to mining. These policies were
a response to social mobilisation in the early 2000’s that raised questions about the
political feasibility of further expansion of the mining sector. The government and 3 From 2001 to 2008 the importance of mining to the national economy grew steadily. In 2001-2004, there was an important increase in the production of copper and gold, the two main minerals in the Peruvian mining sector (see appendix I). In 2005-2008, although the production of most minerals tended to remain stable, the boom in international prices multiplied the importance of mining in terms of exports and tax revenue. A report commissioned by the National Society for Mining, Oil, and Energy (NSMOE) estimated that, taking 2006 as the baseline, a decrease in mining activity or mineral prices would have had a critical negative impact on economic growth and the balance of public finances (Macroconsult, 2008). Despite this rising dependency of the economy on mining production, the government kept control of the fiscal balance, the balance of international payments and inflation; they reduced the external debt, increased the foreign currency reserves and maintained a reasonable foreign currency exchange rate (Ministerio de Economía y Finanzas, 2009a). 4 The Ombudsman’s office − called Defensoría del Pueblo in Spanish − is an state institution created to protect citizens’ fundamental and constitutional rights, and to oversee the state government, its administration, and the public services provided to the population. In contrast to most state institutions, the Ombudsman’s office is widely trusted by the public.

− 4 −
the mining companies faced massive local opposition to the expansion of the
Yanacocha mine in Cajamarca, and to the construction of new mines in
Tambogrande (Piura) and Quellaveco (Moquegua).
In response, the government and mining companies addressed this opposition by
formulating a set of policies designed to convince local people that mining could
benefit them, and to project a more benevolent image of the mining companies.
Two policy innovations are especially important. The devolution of a substantial
volume of mining revenue from central government to sub-national governments in
mining areas means sub-national governments in the mining areas now have
incomes many times higher than those of sub-national governments elsewhere in
the country. The second policy innovation is the promotion of greater involvement
by mining companies in developmental activities at local level. Companies have
increased their Corporate Social Responsibility (CSR)5 budgets and apparatuses in
order to spend these funds locally in the areas of the country where they operate.
These policies are not unique to Peru. They are part of the attempt of the
International Financial Institutions (IFI) and transnational mining companies to
project a more responsible and developmental image of the mining industry
worldwide. Accordingly, I have labelled these policies the ‘New Extractive Industries
Strategy’ (NEIS).
The result of the implementation of this strategy in Peru is especially important for
the international mining companies because the mining industry has planned
further massive investments in the country. At the end of 2009, Peru had a pipeline
of mining projects valued at over USD 31 billion, representing 6 per cent of the total
mining investment forecast worldwide.6 Peru is thus fifth in the global ranking of
mining investment, below only the mining giants of Canada, Australia, Brazil and
Russia. This means that Peru is the highest among the so-called ‘developing
countries’, and also the smallest and most dependent economy among the top ten
nations on the list (Raw Material Group, 2010). 5 In this thesis I use the term CSR in a quite restricted sense to refer to corporate philanthropy - mining companies donate some of their profits or resources to promote local development. Donations may come from the company directly or through a separate, company-sponsored foundation or public charity. 6 The Peruvian Ministry of Energy and Mining is even more optimistic, reporting a project pipeline valued in excess of USD 35 billion at the beginning of 2010 (Ministerio de Energía y Minas, 2010a).

− 5 −
Second, the result of the new policies is also important because Peru has become
a testing ground for their implementation. The steadily growing demand for
commodities by emerging economies and the resultant high price of minerals has
boosted the investments made by mining companies worldwide (UNCTAD, 2007).
As in Peru, the expansion of mining activities has been frequently met by
opposition from local communities who remain unconvinced that mining will benefit
them (Ballard & Banks, 2003; Bebbington, Hinojosa, Humphreys-Bebbington,
Burneo, & Warnaars, 2008; Evans, Goodman, & Lansbury, 2002; Filer & Macintyre,
2006; Hilson, 2002; IIED, 2002; MacIntyre & Foale, 2002; Mate, 2002; Moody,
2007). A similar set of NEIS-like policies has been promoted in different countries
(ICMM, 2006c:57-58). Therefore, the outcome of NEIS in Peru constitutes a
potential template for a new strategy that the mining industry could adopt for the
intensification of mining activities in other developing countries.
When I met my friend Santiago after the Bagua clash, I had already spent two
years researching the impact of the implementation of the NEIS in Peruvian mining
regions. I set out to answer two main questions: (i) why did social conflict escalate
so dramatically in the Peruvian mining regions after the implementation of the
NEIS? (ii) is there evidence to suggest that the implementation of NEIS has
improved the economic and social wellbeing of people in mining areas?
The short answers to these questions are as follow:
(i) The new rules for the distribution of the profits from the mining operations
provide incentives for local actors to resort to strategies of conflict in order to
maximise their share in these profits.
(ii) The NEIS has not had any significant effect on measurable changes in
economic and welfare indicators in the sub-national jurisdictions whose
governments receive high volumes of mining revenue transfers.
The methodology I chose to answer these questions was the following. Firstly, I
compiled two comprehensive datasets relating to welfare, economy, budget, politics
and mining at regional and municipal levels. I used these datasets to compare
different regions and municipalities. Secondly, I undertook detailed field research in
some of the most remote mining areas of the country to get to know the local
dynamics generated by the implementation of the NEIS. Thirdly, I interviewed,

− 6 −
company representatives and government officials in an attempt to understand the
complexities of the situation.
In this thesis I argue that the implementation of the NEIS has not only failed to
reduce social conflict but has increased it. I first show the association between such
conflict and the mining revenue received by the sub-national governments of the
region (Chapter 5). Second, I explain the local political processes behind this
association (Chapter 6). My findings significantly modify the conventional accounts
of conflicts and mining that focus predominantly on the adverse impacts of mining
on livelihoods and the environment. Although I do not deny the harmful effects that
mining can have on the environment and local people’s livelihoods, I find that
mobilisation around these issues was not responsible for the dramatic increase in
conflict in the period 2005 to 2008. Instead, conflict became increasingly
concentrated in the regions with the most profitable mines, which had therefore
received the highest per capita transfers of mining revenue from the central
government. I argue that two different mechanism account for this ‘income’ effect.
First, as part of the NEIS, the Peruvian government allowed the mining companies
to retain the largest proportion of the windfall profits generated by the dramatic
increase in mineral prices and depicted them as key actors with a moral duty to
promote local development. This reinforced the popular perception of both state
capture by mining companies and the companies’ obligation to take better care of
the local population. In the absence of other effective institutional mechanisms,
local populations, especially the peasant communities closest to the mines, used
social conflict to negotiate for greater monetary compensation and employment
opportunities with the companies. The second mechanism I discovered is even
more unexpected: the large volume of mining revenues accruing to the sub-national
governments generated new disputes over access to or use of these financial
transfers. Local populations and sub-national governments engaged in protracted
conflicts to maximise any advantage they could gain from these transfers.
The strategy did not deliver its developmental promises. Despite the significant
amount of revenue allocated to the regional and municipal governments in mining
areas and the increase in the money spent by mining companies in social projects,
my analysis reveals that over the period 2002-2008, economic and welfare
indicators did not improve more in those areas than in the rest of the country.
Official accounts explain this as a lack of managerial capacity in the sub-national

− 7 −
governments. However, my investigation into the processes involved in the
allocation of resources in mining municipalities reveals a more complex story in
which political incentives for short-term spending and rent seeking rather than ‘lack
of capacity’ played a central role.
Sub-national governments receiving high levels of mining revenue transfers had to
operate in a political context not conducive to the efficient spending of large capital
investment budgets. Three factors were especially problematic. First, sub-national
governments needed to comply with a welter of centrally imposed regulations on
capital spending that were originally designed not to facilitate spending, but to deal
with scarcity. Second, the population in rural areas of the country do not trust
political institutions, whether national or local. They have historical reasons to be
sceptical about the stability of public policies and the management of financial
resources, thus, they demanded quick spending of the mining revenue transfers
because they feared that delay would lead to a loss of resources due to the
corruption of sub-national authorities or confiscation by the central government.
Moreover, the introduction of participatory governance mechanisms in Peru’s
decentralisation policy increased popular power to enforce quick spending while
failing to tackle corruption. Third, the escalation of conflicts in mining regions
caused the national government and mining companies to put pressure on local
authorities to speed up the implementation of the capital investment budgets. They
wanted to reduce the incidence of disturbance by demonstrating that mining could
bring real benefits to the population. The combination of these three political
circumstances trapped regional and municipal authorities and local populations in a
myopic political game that prioritised the short-term redistributive advantage of
creating jobs in the public sector over any long-term benefits from better planned
expenditure.
The government and mining companies have drawn their own conclusions as to the
connection between increased social conflict and the use of financial resources
transferred to sub-national governments. They argue that inefficient spending by
sub-national governments was a major cause of conflict in mining areas. While I
agree that it is part of the explanation, it is far too simplistic and takes no account of
the context in which sub-national governments have to operate. I argue that the
opposite is also the case: the threat of violence in combination with other features
of the Peruvian polity, exacerbated the inefficient use of mining revenue by sub-
national governments. In Figure 1.1, I summarise these two competing narratives

− 8 −
on the relationship between conflict and the poor developmental performance of
sub-national governments in mining regions.
Figure 1.1 Relationship between social conflict and poor developmental performance in mining regions: two competing conceptual overviews
Trad
ition
al a
ccou
nt
Conflict Poor performance
of sub-national governments +
Lack of technical capability and weak local institutions
Main contextual factor: High local expectations
Devolution of mining revenue to sub-national governments
Alte
rnat
ive
acco
unt
Poor performance of
sub-national governments
Conflict
+
Main contextual factor: Population’s lack of trust in political institutions + perception of state capture by mining companies
Devolution of mining revenues to sub-national governments
Untaxed windfall corporate profits
Participatory governance mechanisms
National government and mining companies ask for quick spending
Population fears confiscation and demands quick spending
Prioritisation of short-term redistribution through jobs in public works
+
Centrally imposed regulations

− 9 −
Some key terms
In some chapters my analysis becomes technical. This is mainly where I deal with
large quantitative data sets and undertake econometric analysis. I do my best to
explain the technical issues clearly and have chosen to relegate the more complex
tables and explanations to annexes and footnotes. In this thesis I use frequently
three terms: conflict, rent and sub-national government. Although they are not
especially technical terms, I use them with particular meanings.
In ordinary language the meaning of ‘conflict’ is very wide. The term refers to highly
dissimilar realities, from wars with thousands of casualties to personal
psychological processes. I am in general talking of a middle ground: social conflicts
that involve confrontation and dispute, but may or may not involve violence. I have
started with an official data base on social conflict compiled by the Peruvian
Ombudsman (Defensoría del Pueblo, 2009), and have thus accepted the official
definition of what constitutes a social conflict. Since 2004 the Ombudsman has
reported monthly on incidents in which a group of protesters resorted to at least
one of the following practices: (i) threats to the integrity of life or health; (ii) damage
to private or public property; (iii) obstruction to freedom of movement; (iv)
impediment of the exercise of public authority; and (v) obstruction of public service
delivery (Defensoría del Pueblo, 2009). Violent demonstrations, roadblocks and
assaults on premises, buildings and land are the most frequently reported events.
These activities tend to involve peasant and indigenous communities, and the
inhabitants of small urban settlements in remote areas of the country (Chapter 5).
Despite the diverse nature of their demands, they always ask for some official level
of involvement in seeking a solution. These type of conflicts conform to the
definition of contentious politics (McAdam, Tarrow, & Tilly, 2001:5) as ‘…episodic,
public collective interaction among makers of claims and their objects when (i) at
least one government is a claimant, an object of claims, or a party to the claims and
(ii) the claims would, if realized, affect the interests of at least one of the claimants.’
Rent or ‘economic rent’ is a second concept central to my argument. I use it in its
economic meaning as the difference between (i) the price obtained from using a
factor of production in the market and, (ii) the price needed to persuade the
entrepreneur to use that factor rather than simply hoard it. For example, a taxi
driver in a remote small town in the mountains, far from cities and good roads
− 10 −
normally charges one dollar per km for out-of-town trips. However, there is a major
natural disaster not far away and vast numbers of aid workers, journalists etc all
want to hire the taxi at almost any price. The taxi driver can now charge 10 dollars
per kilometre although he would be willing in principle to drive for one dollar per km,
but following this artificially inflated market charges 10 dollars, hence his economic
rent is 9 dollars per km.
A similar logic applies to the income of mining companies and the effect of the
increase in international mineral prices. An example is Antamina, a large mine that I
analyse at various points in this thesis. In 1998, a feasibility study estimated that at
international copper prices of 0.90 USD/lb, Antamina would yield a rate of return of
14 per cent for the capital invested in the construction of the mine.7 Antamina’s
parent companies and the banks financing the operation considered that it was a
good enough return to take the risk. However, during the period 2006-2008, the
average international price of copper was 3.2 USD/lb (Ministerio de Energía y
Minas, 2010c). As a result, more than 70 per cent of Antamina’s income from the
sale of copper during that period was economic rent. In addition to Antamina, the
dramatic increase in international mineral prices in the period 2004-2008 multiplied
the size of mining rents in general.8
The distribution of economic rents is highly political. Rents are an economic surplus
that is not necessary for the profitable survival of enterprises. Thus, they often
attract the interest of people who can use political power to extract that rent. Take
the taxi example above. Seeing how much money the taxi drivers are making, a
local criminal gang might move in and establish a protection racket, allowing only
taxis that pay protection money to continue to operate. If they immediately establish
7 Presentation of Mr. Augusto Baertl to the parliamentary commission on mining and energy (29 September 1998). 8 Four types of factor determine the size of rents in the mining sector. First, there are the geological and geographical conditions that influence the cost of extraction: the size, the metallurgical composition, and the location of the deposit are all important features. Second, the initial capital investment and the technology used in the construction of the mine also affect the cost of production − usually, the larger the scale the lower the production cost. This means big international mining companies with large financial capacity tend to construct and operate more cost-effective mines. Public policy is the third factor influencing the size of the surplus. Government influences both the production costs and the companies’ perception of what a reasonable level of profit is. The regulation of prices of key inputs, such as energy, and the provision of transport infrastructure are among the factors influencing production costs. Regarding the calculation of a reasonable profit, investors reward political and regulatory stability by demanding a low risk premium which, consequently, increases the surplus (Eggert, 2001:47). Finally, the international price of minerals determines company profits.

− 11 −
their undisputed authority, this gang might ‘persuade’ the taxi drivers to hand over
most of their 9 dollars per kilometre rent. Much as they might resent it, the taxi
drivers would still be running an economically viable business. In such cases, the
distribution of rents is determined not by the operation of competitive markets, but
by power and force. Large rents motivate people to engage in political action to
obtain a share. To extend the example further, the taxi drivers’ union, the local
police force and local political leaders may all compete with the criminal gang to get
a share of the taxi hire rents. In the case of mining activity, mining companies,
unionised miners, different levels of government and local communities all seek to
capture a larger share of the rent (Eggert, 2001:47). During recent years, access to
and control over mining rents has become a big political game not only in
‘developing countries’. In June 2010 the Australian government introduced a
Resource Super-Profits Tax to collect 40 per cent of mining profits above a ‘normal’
rate of return. BHP Billiton, Rio Tinto, Xstrata, and other big mining companies
furiously opposed the new policy and played an important role in forcing the
resignation of the Prime Minister (The Economist, 2010a, 2010b).
In Peru, the national government has allowed mining companies to retain the
largest proportion of these rents through fiscal policies based on flat-rate taxes. The
government collect 30 per cent of the corporate profit whatever this amount is.
However, municipalities and regional governments close to the mines have also
benefited substantially through the introduction of revenue-sharing mechanisms.
The third term is sub-national government. Since 2002, there have been three
levels of democratically elected territorial government in Peru: (i) the national
government; (ii) 25 regional governments that rule over the regions – previously
called departments; and, (iii) 1,834 municipal governments. I use ‘sub-national
government’ to refer jointly to municipal and regional governments. Accordingly, I
will use ‘regions’ and ‘municipalities’ to refer to the territories over which these
governments have jurisdiction.9
9 According to the law, the municipal tier is disaggregated into two different levels: provinces and districts. There are 195 provinces that comprise 1,834 districts. In theory, the provincial governments should coordinate the work of the district governments within their jurisdiction, but this rarely happens because each municipal government receives most of their financial resources directly from the national government. From a functional perspective, provincial governments have become the government of the district where the capital of the province is placed. Thus, in this thesis I use the term municipal government to refer to the 1,834 district municipalities.

− 12 −
I now set out the conceptual foundation of the thesis. After analysing the features of
the NEIS and its implementation in Peru, I review the main literature, especially on
the resource curse, which constitutes an important background to my analysis.
1.2 The NEIS: making a virtue out of necessity?
I use NEIS to refer to a collection of policies that determine the mandatory
distribution of mining, gas and oil revenues between national and sub-national
governments and the greater involvement of firms in local development. These
policies aimed to counteract the popular hostility towards extractive industries
worldwide. However, I am not suggesting that a group of institutions and
corporations intentionally came together at a single point in time to propose a
precise policy framework. Rather, the NEIS reflects the confluence of a number of
political pressures, interests, opportunities and ideas that diverse actors use to
promote similar types of policy in different countries. In the following subsections, I
analyse how mining companies, governments and international financial institutions
have managed these factors and generated the NEIS in order to improve the
prospects for a long-term viable mining industry.
1.2.1 Conflicts, ‘new mining’ and ‘going local’
There is nothing new about the link between mining and conflict. However, the
causes of disputes around mining and their social and political relevance have
changed over time. For centuries, labour was the main productive factor.
Exploitative working conditions were the rule of the day and demarcated the
predominant types of conflict: labour versus capital.
In the second half of the 20th century, the convergence of two mutually reinforcing
factors imposed a change in the productive model of the mining industry and
therefore the prevalent type of dispute. First, the emergence of trade unions with
the subsequent expansion of workers’ consciousness of their rights and second,
the formulation of national and international regulations for labour standards
increased company overheads. The combination of these two factors along with the
long-term decline in metal prices made traditional mining unprofitable (Sullivan,
Sznopek, & Wagner, 2001). A revolutionary change in technology and scale was
the way out of this troubled situation. Intensive mechanisation gave birth to a
modern mining industry able to operate with a much smaller workforce to obtain

− 13 −
much larger quantities of minerals. This transformation in turn affected the nature of
the conflicts surrounding mining. Larger open pit mines required more land and
water. They generated mountains of potentially lethal tailings that polluted streams
and rivers. Thus, modern mining employed fewer local workers but, in contrast, its
activities affected the lives far more ordinary people than before. The result was
that conflicts between large and powerful companies and local communities came
to the fore in this new era.
This is demonstrated by the case of the Bougainville rebellion, which led to the
forced closure of the Panguna mine in Papua New Guinea – the then largest
copper mine in the world – (Filer, 1990), and the evidence of a mining induced
environmental disaster at the Ok Tedi mine in the same island group. These two
episodes shook the foundations of the mining industry (Filer & Macintyre, 2006).
Under pressure from civil society activists in their home countries, mining
companies grew increasingly concerned about the impact of their operations on
people living in the extraction areas and the potential for a backlash unless they
could demonstrate more convincingly that these people also benefited (Ballard &
Banks, 2003). The world’s largest mining companies thus felt that they were losing
the battle for legitimacy and facing the risk of stricter, externally imposed
regulations that could harm their long term interests (Szablowski, 2007:77).
In the mid-1990s, the industry started to tackle the problem through the promotion
of self-regulation. It adopted the discourse of benevolent ‘new mining’ as opposed
to the irresponsible ‘old mining’. The ‘new mining’ industry would be considerate
towards local people, environmentally responsible and promote local development
as one of its main objectives. This shift was powerful, as mining switched from
being the villain to being the hero: the new mining was going to solve the evils that
the old mining had caused.
Both the mining industry and the World Bank undertook internal reviews and
commissioned research (McMahon & Remy, 2001). In 1999, nine of the largest
mining companies launched the Global Mining Initiative (GMI); and the following
year, they inaugurated the Mining, Minerals and Sustainable Development (MMSD)
project, which heralded the way forward for the sector. The results were crucial in
the light of the past social and environmental behaviour of the mining companies
(IIED, 2002) and led to an agenda for the complete overhaul of the sector. At the

− 14 −
same time, the World Bank was facing mounting criticism of its financial support for
extraction activities. The bank also undertook a complete revision of its policies for
the industry and promoted the scrupulous observance of human rights, sustainable
development and poverty reduction (Weber-Fahr, 2002; World Bank, 2003).
The result is that ‘promoting local development’ has become the leitmotif of the
mining industry worldwide (IIED, 2002:198-229; 2003). Mining companies and
international institutions have pursued a double strategy. First, they have proposed
revenue-sharing mechanisms that privilege the producing localities (IIED,
2002:209-212; UNCTAD, 2007:89-90). In recent years, the governments of Bolivia,
Brazil, Colombia, the Democratic Republic of the Congo, Indonesia, Kazakhstan,
Madagascar, Nigeria, the Philippines, Russia and South Africa have all reallocated
oil and mining revenue to sub-national levels of government (E. Ahmad & Mottu,
2003; Brosio, 2003; Morgandi, 2008). Corporate social responsibility (CSR) is the
second component of this corporate strategy. Mining companies have
enthusiastically embraced the cause of CSR to show that they are now ready to
operate for the good of local populations, overcoming their disgraceful past records
(ICMM, 2006d; IFC, 2000; IIED, 2003; Yakovleva, 2005). Mining companies
generally enjoy tax exemptions in exchange for the expansion of their CSR
activities.
1.2.2 The legitimising logic: radical polycentrism
The implementation of the NEIS requires the collaboration of governments in order
to reform public policies. However, companies do not normally need to negotiate
these policies directly with governments as part of a sector-specific agenda. The
NEIS fits perfectly within the fashionable agenda of good governance and with the
need of governments to respond to the worldwide emergence of a new political
ethos demanding greater local control over natural resources (Larson, 2004; Ribot,
2004).
Since the early 1990s until very recently, a set of political ideas, labelled ‘radical
polycentrism’ by Houtzager (2003:4-7), have strongly influenced opinions about
how polities should be structured. The main feature of this ideological standpoint is
a deep suspicion of large-scale, authoritative political institutions, especially the
centralised state. The response has been consistent attempts to disperse power

− 15 −
towards the sub-national levels of government, the public, and to non-governmental
organisations (NGOs) of all kinds, whether commercial or not-for-profit. This set of
ideas appeals both to ideological supporters of market competition and private
enterprise (neo-liberals) who wish to minimise the role of the state, and to
enthusiasts of decentralisation, empowerment of the people, and radical
participatory democratisation who aspire to the attainment of a space for greater
social engagement (Houtzager, 2003:7).
Moreover, as I will reveal later in this chapter, in most interpretations of the politics
behind the resource curse, the core problem is that resource revenues empower
the central state apparatus. Therefore, it seems to follow that a combination of
devolution of decision-making to the sub-national governments and the populations
of the areas from which natural resource revenues originate, together with the
involvement of companies and civil society organisations in decision-making should
counter the adverse effects of the centralised appropriation of resource rents. The
latter includes rent-taking at central level, lack of downward accountability, secrecy
over the use of public finances, and the limited capability of the central bureaucratic
apparatus to reach remote areas of developing countries (IIED, 2002).
Thus, the mining companies have gained the support of a collection of disparate
and, at times, unexpected allies in fostering the policies that constitute the NEIS.
Local authorities of different types; local populations around mines and oil wells;
civil society organisations; technocrats in the official apparatus; regional
movements seeking greater autonomy from the centre; and international institutions
advising on improved governance have all supported the same vague policies,
regardless of the fact that they might have different standpoints and motives.10 The
next section examines how the NEIS has been implemented in Peru.
1.3 The Peruvian version of the NEIS
Since 2002, 50 per cent of the profit taxes paid by mining companies to the national
government have been transferred to sub-national governments, mainly to those of
the regions and municipalities where the mines are located. These
10 In Latin America, these policies have been challenged by the ‘heterodox’ left-wing governments of Venezuela, Bolivia and Ecuador, which have tended to recentralise the management of oil and gas revenues, with varying success.

intergove
2008 thes
transform
Peruvian
2007, the
average
15,123 (U
mine. In t
of all fisca
made to
Moquegu
population
Figure 1.2Nuevos S
11 In Peruvgovernmen12 The aveFinanzas -
50
100
150
200
250
300
350
400
PE
N p
er c
apita
c
SourceGraphi
rnmental tr
se canon t
med the Per
municipali
e main mu
canon min
USD 4,741
the same y
al transfers
6 out of
a and Pas
n (Figure 1
2 Per capSoles (2007
vian Spanishnts of revenuerage exchan
Perú, 2010)
0
00
00
00
00
00
00
00
00
canon miner
e: Ministerio de c representation
ransfers ar
transfers w
ruvian fisca
ities was P
nicipalities
nero transf
) for the m
year, two-th
from the c
the total
sco –. The
.2).
pita fiscal t7)
h, canon ha
ue collected bnge rate for .
o canon
Economía y Finn: the author
− 1
re called ‘c
were so sub
al landscap
Peruvian n
around th
fer of PEN
municipality
hirds of tota
central gove
25 regions
se regions
transfers t
as come to mby central go2007 was 3
n oil can
nanzas - Perú, 2
16 −
canon mine
bstantial an
pe. While th
nuevos sole
he Antamin
N 9,287 (U
y of San M
al canon m
ernment to
s – Ancas
s account f
to sub-nati
mean ‘a ruleovernment’. .19 PEN to
non gas
2009
ero’.11 Dur
nd so unev
he average
es (PEN)
na mine in
USD 2,911
Marcos, the
minero trans
sub-nation
sh, Tacna,
for just 16
onal gove
e for the de
the USD (M
other canon
ring the pe
venly distri
e per capita
406 (USD
Ancash re
), rocketin
e district h
sfers and 5
nal governm
Cusco, C
per cent o
rnments in
evolution to
Ministerio de
ns othe
eriod 2004-
buted they
a budget of
127),12 in
eceived an
ng to PEN
hosting the
52 per cent
ments were
Cajamarca,
of the total
n Peruvian
sub-national
Economía y
r transfers
-
y
f
n
n
N
e
t
e
,
l
n
l
y

− 17 −
The changes in the rules for the distribution of these canon minero transfers are
one of the two institutional innovations of the Peruvian version of the NEIS. The
second, known as the Mining Programme of Solidarity with the People (MPSP),
fosters greater involvement of the mining companies in the promotion of local
development in exchange for the national government’s undertaking not to
introduce a windfall tax. These two innovations were used to respond to existing
local pressure and to convince the population of the benefits of mining.13
1.3.1 The canon minero
The introduction of the canon to compensate for the extraction of natural resources
can be traced back to 1976. The discovery of important oil fields in the Amazonian
region of Loreto prompted social mobilisation demanding that a portion of the oil
revenue be directly transferred to regional institutions. The central government
decided to give 10 per cent of the value of the regional oil production to Loreto,
labelling this revenue transfer ‘canon oil’. In 1992, in line with the new General
Mining Law designed to attract foreign investment in the sector,14 the government
introduced the concept of the canon minero, allocating 20 per cent of the profit tax
paid by mining companies to the territory in which the profits were generated.
In 2001, the legislature approved the canon law − Law Nº 27506 − that extended
these policies beyond oil and mining to other extraction industries and increased
the canon minero from 20 per cent to 50 per cent of the taxes paid by the
companies.15 Two factors influenced this reform. On the one hand, this policy fitted
perfectly into the decentralisation process prompted by the fall of the Fujimori
regime and the subsequent reinstallation of democracy in 2001. On the other hand,
13 The creation of trusts (fideicomisos) from the proceeds of the sale of state-owned mineral deposits to private firms is a third mechanism following the same logic. The most important trusts are in Las Bambas (Huancavelica − USD 59 millions − Xstrata), Michiquillay (Cajamarca – USD 201 millions − Anglo American), and La Granja (Cajamarca – USD 11 millions − Rio Tinto). The state and the mining companies agreed to use 50 per cent of the money paid to the state by the companies to create trusts. The companies assume an important role in the management of the trusts that should spend their funds on the promotion of local development. The idea is to gain popular support during the initial phases of the presence of the companies. In this thesis I do not analyse the influence of these trusts because the majority of them had little activity during the period of my study. 14 The new law simplified the fiscal regime for mining companies, eliminated differences between national and foreign capitals, conferred the government with the power to sign fiscal stability agreements with the companies, and removed restrictive foreign exchange rate policies. 15 In practice the canon was restricted to 50 per cent of the corporation tax.

− 18 −
the recent conflicts at Tambogrande (Piura), Cerro Quilish (Cajamarca) and
Quellaveco (Moquegua), in which local populations successfully opposed new
mining operations, jeopardised the hitherto good prospects for the revitalisation of
the mining sector.
The new law had a basic design flaw because the formula for the distribution of
revenues did not give enough weight to proximity to the mine. Thus, the main towns
of the mining regions ended up receiving more resources than the rural
municipalities closest to the mines (Zavalla, 2004). Additionally, the government
was unhappy with the ambiguity of the law regarding the calculation of the total
amount of revenue to be distributed. Article nº 9 of the law seemed to imply that tax
exemptions granted to mining companies should not be deducted from canon
transfers. Thus, the central government worried that a strict interpretation of the law
opened the door to demands from regional and municipal governments for
additional transfers. Immediately following the introduction of the new law, the
government and parliamentarians in the mining regions started to draft
amendments. From November 2001 to the first quarter of 2003, they submitted
more than 20 reform proposals that according to their objectives can be grouped
into three different categories.16
First, the government proposals intended to make it clear that only the mining
companies’ actual payments under their official contract to the state were to be
taken into account in the calculation of the canon. Second, taking an opposing
stance, a sector of the legislature representing the mining regions asked for all the
resources that the state would have received if Fujimori’s government had not
signed legal stability contracts with the mining companies locking in the favourable
tax status granted to them during his administration to be included in the canon.17
These proposals called into question the legitimacy of the mining agreements
signed during the Fujimori regime and demanded their repeal. Finally,
representatives of the mining regions demanded a modification to the rules for the
16 A summary of the proposals can be found in the parliamentarian report that the Energy and Mining Commission submitted to the Plenary of the Parliament for a debate on the amendments (Congreso de la República - Perú, 2003b). 17 MPs from Cajamarca, Ancash, Pasco, Cusco, Moquegua, Huancavelica, La Libertad and Piura were especially active in their submission of proposals and in voicing their opinions during parliamentary debate.

− 19 −
distribution of the canon in order to benefit the municipalities closest to the mines,
thus overcoming the flaw in the previous law.
The proposals were put before Parliament in August 2003. The debate did not
follow ideological lines but loyalty to regional constituencies.18 In the context of a
weak party system, parliamentarians from mining regions saw an opportunity to
gain popular support. Thus, they demanded an increase in transfers and a fairer
distribution of them (Congreso de la República - Perú, 2003a).
After five sessions, parliamentarians from the mining regions gave up their
demands for the revision of the legal stability contracts and focused the debate on
the criteria for the distribution of the canon minero. This change signalled an
agreement between the government and these parliamentarians: the executive
would endorse any reform approved by parliament in exchange for their
renunciation of modifications related to fiscal stability contracts.19 Finally,
parliament approved a twofold reform.20 First, it agreed on a new set of criteria for
the distribution of the canon to the jurisdictions in which the mineral was extracted.
Second, the new law deleted a paragraph in the previous version that could be
understood as the central government’s obligation to include in the calculation of
the canon transfers the full amount that the state would have received if the stability
agreements had not existed.21
The government and the mining companies were both satisfied with the new law:
firstly, the amendment did not question the tax regime and secondly, they
anticipated that additional revenue would now be allocated to those municipalities
close to mining operations, thus calming the growing social unrest (Zavalla,
2004:162).
18 Personal interviews with Eduardo Carhuaricra (2008-024; Lima, 17-04-2008) and Ernesto Herrera (2008-151; Lima, 08-08-2008), who at the time were Members of Parliament (MP) representing Pasco and Moquegua respectively. 19 Personal Interview with Javier Diez Canseco (2007-009, Lima, 12-06-2007) 20 Law Nº 28077 21 Only two MPs voted against the approval of the new law, although they did so for quite different reasons. Javier Diez Canseco of the Socialist Party opposed it because it did not address the tax privileges of the mining companies. Juan Valdivia Romero (Minister of Energy and Mines from July 2006 to October 2008) of the APRA (American Popular Revolutionary Alliance) voted contrary to the opinion of his party colleagues because he wanted the law to be more explicitly restrictive about the type of taxes that could be taken into account in calculating the canon.

− 20 −
However, assigning resources to different sub-national governments without a
preliminary technical study resulted in an unexpected absurdity when, in 2004,
some municipalities hosting the operations received lower per capita transfers than
their neighbours. Consequently, another round of reform proposals flooded
Parliament, demanding greater prioritisation for the producing municipalities in the
distribution of resources (Congreso de la República - Perú, 2004b). The resulting
new law (Nº 28,332) was unanimously approved in July 2004 (Congreso de la
República - Perú, 2004a). Table 2.1 summarises the successive changes in the
rules for distribution of the canon transfers.
Table 1.1 Changes in the criteria for the distribution of the canon.a
Law Nº 25,506 (Approved in 2001)
Law Nº 25,007 (Approved in 2003)
Law Nº 28,332 (Approved in 2004)
Beneficiary % Beneficiary % Beneficiary %
Regional government. 20 Regional government plus 5% for public universities of the region.
25 Regional government plus 5% for public universities of the region.
25
Municipalities of the provinceb in which the resource is extracted.
20
Municipality of the district in which the resource is extracted.
10 Municipality of the district in which the resource is extracted.
10
Municipalities of the province in which the resource is extracted, excluding the district of the mine
25 Municipalities of the province in which the resource is extracted.
25
Municipalities of the region in which the resource is extracted.
60 Municipalities of the region in which the resource is extracted.
40 Municipalities of the region in which the resource is extracted.
40
a With the exception of oil b For an explanation of the relationship between provinces and districts see footnote nº 9.
In addition to these changes in the canon law, in December 2004, the President
issued a decree regulating the payment and distribution of mining royalties for new
mines.22 It represented a change in the previous policy because the fiscal stability
contracts had exempted mining operations starting between 1992 and 2004 from
the payment of royalties. The decree stated that all the royalties should be
22Supreme Decree Nº 157-2004-EF. Royalties are usage-based payments that compensate the state for the extraction of its mineral assets. In the Peruvian case, payments range from 1 per cent to 3 per cent of the market value of the mineral extracted, depending on the total value of the mine sales.

distributed
concentra
In 2004, w
transfers
The subs
fold in rea
escalation
Figure 1.(1997−200
1.3.2 Th
The MPS
of the 20
mineral
agreeme
windfall t
23 Formula the resourcommunitieextracted; 4per cent toregion.
1
1
2
2
3
3
4
4
Milli
ons
of P
eruv
ian
Nue
vos
Sol
es)
Con
stan
t pric
es 1
996
a Refer tSource: Graphic
d to the
ation in the
when this
amounted
equent rise
al terms in
n was highl
3 Canon m08)
he Mining P
SP is the se
006 preside
prices, var
ents signed
tax and th
for the distri
rce is extraes); 20 per 40 per cent o the region
0
500
1000
1500
2000
2500
3000
3500
4000
4500
1997
o royalties in fo(Ministerio de Erepresentation:
sub-nation
producer m
new legisla
to PEN 30
e in world m
3 years (F
ly concentr
minero and
Programme
econd main
ential electi
rious actor
d with the m
e payment
ibution of micted (in thecent to the
to the munical governme
1998 1999
otnote nº 22Economía y Fina the author
− 2
nal govern
municipality
ation was
8 million at
mineral pric
Figure 2.2).
rated in a fe
d royaltya
of Solidari
n feature o
ons, in the
rs argued
mining com
t of royaltie
ning royaltieeory 50 pere municipalitcipalities of tent; and fina
2000 2001
anzas - Perú, 20
21 −
nments ac
y.23
drawn up,
t constant p
ces meant
Due to the
ew regions
transfers
ity with the
f the Peruv
e face of a
against a
mpanies by
es by the
s: 20 per cenr cent of thties of the the region inally, 5 per c
1 2002 2003
009)
ccording to
total cano
prices of 19
that the tra
e changes
.
to sub-na
People (M
vian version
steady inc
revision o
y Fujimori. T
mines tha
nt to the disthis should gprovince in which the rent to the p
3 2004 200
o strong
n minero a
996 (USD 9
ansfers inc
in the legis
tional gov
MPSP)
n of the NE
crease in in
of the fisc
The introdu
t were bui
trict municipago to affect
which the resource is epublic univer
05 2006 200
pattern of
and royalty
90 million).
reased 13-
slation, this
vernments
EIS. Ahead
nternational
cal stability
uction of a
lt between
ality in whichted peasantresource is
extracted; 15rsities of the
07 2008
f
y
.
-
s
d
l
y
a
n
h t s 5 e

− 22 −
1992 and 2004 were the most common and popular demands. The successful
presidential candidate, Alan Garcia, adopted these concerns as part of his
electoral platform. However, as soon as he took office, he backed down and
acquiesced to the mining companies, stating that some palliative measures would
be implemented instead of the payment of royalties or windfall taxes.
In December 2006, Garcia published the MPSP, popularly christened the ‘mining
alms’. It was an agreement between the government and the mining companies
that exempted the companies from paying windfall taxes in exchange for a
commitment to invest a predetermined amount of money in social development
projects in the mining regions for the following five years. Private trusts under
company control were to be responsible for the allocation of these resources
according to a loose set of rules. This agreement fuelled popular discontent and
criticism because it indicated the clear subordination of the government to mining
interests.24
The president of the powerful NSMOE was exultant because the agreement killed
two birds with one stone: the companies avoided paying higher taxes and could
also use some of the savings to boost their investment in development at local
level. Another leader of the mining industry declared that the “companies were
passing from being defensive regarding environmental conflicts to becoming
proactive in the development of communities”.25
Both mechanisms, the canon minero and the MPSP, affect the distribution of
mining rents. While the canon minero allocates a proportion of the rent to the sub-
national governments closest to the mines generating it, the introduction of the
MPSP allows the companies to retain most of the economic surplus produced by
the boom in mineral prices. This thesis claims that this distribution of rents is
responsible for both the increase in conflicts and the ineffective way in which the
money is spent at local level. Before I analyse the impact of the implementation of
the NEIS, I review what the academic literature says about the relationship
between extractive industries, conflict and development.
24 Amazingly, Alan Garcia was more of a royalist than the King in supporting companies’ interests. In a personal interview (2008-199; Lima, 16-09-2008), the president of the NSMOE confirmed that although the companies would have opposed the introduction of new royalties because they were not tied to profit, they were ready to discuss a reasonable windfall tax. 25 Personal interview with Raúl Benavides (2007-005; Lima, 11-06-2007).

− 23 −
1.4 The current debate on extractive industries, conflict and development
The NEIS was a practical response to the growing social unrest generated by the
large-scale extraction of oil and minerals. While companies and governments were
developing the NEIS, social scientists were more interested in these issues and
developed an argument now generally labelled the ‘resource curse’. It refers to a
collection of different observable negative outcomes that a country highly
dependent on the exploitation of its natural resources may experience. So-called
‘point source’ (geographically concentrated) natural resources, especially minerals
and fuels, correlate more strongly with the generation of economic and social
problems than do other kinds of geographically diffuse resources (Isham,
Woolcock, Pritchett, & Busby, 2005).
In the 1950s and 1960s, the Latin American structuralism and dependency theory
schools were already warning about the dangers of the primary sector-led
development due to a long-term decline in the terms of trade and the subordination
of the economies of the region to foreign capital (Graulau, 2008:137-149; Ross,
1999:301-302). However, it was still widely argued that natural resource
endowment provided comparative advantages that poor countries could use to
advance their economic development (Rosser, 2006b:7). Thus, in 1993, when
Richard Auty originally coined the term ‘resource curse’ (Auty, 1993), the concept
was still considered to be counterintuitive and triggered further research into the
topic. Subsequently, four types of potential problems have come to dominate the
literature.
The negative impact of the intensive exploitation of minerals and oil deposits on
economic growth is the first problem that attracted researchers’ attention (Auty,
1993; Sachs & Warner, 1997; Sala-i-Martin & Subramanian, 2003). Their findings
signalled the the existence of the ‘curse’ and provided a general explanation for the
paradoxical situation. A boom in investment in extraction industries or increase in
international commodity prices generates an inflow of capital that tends to increase
exchange rates, create high levels of consumption, soaring public spending and, as
a result, inflation. The combination of these factors promotes the imports while
hindering the country’s capacity to export and, therefore, the national production of
tradable goods.26 Moreover, the concentration of capital investment and skilled
manpower in the extraction industries deprives other sectors of scarce resources, 26 This set of negative outcomes has been traditionally labelled ‘Dutch disease’.

− 24 −
weakening the economy still further and increasing dependency on the extractive
sector (Shafer, 1994). In turn, this increases vulnerability to external shocks
because international commodity prices are traditionally volatile, and a boom today
turns into a bust tomorrow. When this happens, private and public spending dries
up and the country’s economy is ill-equipped to deal with the new situation.
Authoritarianism and lack of state responsiveness to the needs of the population
are the second possible manifestation of the resource curse. Ross (2001) argues
that oil and mineral wealth impede the democratic process through three different
mechanisms:
…a rentier effect, through which governments use low tax rates and high spending to dampen pressures for democracy; a repression effect, by which governments build up their internal security forces to ward off democratic pressures; and a modernization effect, in which the failure of the population to move into industrial and service sector jobs renders them less likely to push for democracy (pp. 356–357).
Moreover, even in formally recognised democracies, dependence on income from
natural resources provides the state with autonomy from its citizens, which, in turn,
leads to poor responsiveness, corruption and the inappropriate use of state
revenue (Karl, 1997; Moore, 2004).
The difficulty of translating mineral riches into the reduction of poverty levels is the
third problem (Pegg, 2006b; Ross, 2004b, 2007). To some extent, this is a
consequence of the two previous problems. On the one hand, lack of economic
growth makes the reduction of poverty levels virtually impossible. Moreover, high
inflation rates hit poor people more severely than the rest of the population. On the
other hand, the lack of state responsiveness to its citizens tends to reduce public
spending in social sectors (Gylfason, 2001; Stijns, 2006). In addition, Ross
(2004b:32-35) and Auty (2006) argue that the lack of non-skilled or even semi-
skilled jobs in the modern extractive sector and weak linkage with other economic
activities are also important factors in the persistence of poverty in mineral-rich
countries.
An increase in social unrest is the fourth problem linked to the intensive exploitation
of natural resources. Collier and Hoeffler (1998) argue that primary commodity
exports are significant determinants of the duration and probability of internal
armed conflict. Their subsequent work (P. Collier & Hoeffler, 2004a, 2004b) framed
the debate around the question of ‘grievance or greed’ as the major drivers of civil
− 25 −
strife. Their main contribution was to highlight the notion that the rent generated
and the ways in which it can be controlled – rather than pure economic
dependence – is an important variable in explaining the association between
resources and conflict (P. Collier & Hoeffler, 2005).27
The resource curse hypothesis has not gone uncontested. Some challengers deny
the existence of a curse altogether on the basis of a misleading conceptualisation
of resource dependence and the subsequent use of inappropriate indicators
(Brunnschweiler, 2008; Davis, 1995; Lederman & Maloney, 2006). However, this
categorical denial is not common. Most recent studies corroborate the existence of
a resource curse, but stress that negative outcomes are probable, not guaranteed.
Pre-existing socio-economic conditions, the quality of institutions, and the
implementation of appropriate policies all matter. This approach accounts more
convincingly for the significant performance variation among natural resource-rich
countries, and the existence of what were previously considered to be positive
exceptions such as Chile, Botswana, Indonesia and Malaysia (Rosser, 2006a). The
work of Sala-i-Martin and Subramanian (2003) points to institutional deterioration
as the causal link connecting resource abundance with economic stagnation.
In the ensuing years, different authors came up with more sophisticated
explanations of how resource dependency affects economic growth (Auty, 2007;
Bosschini, Petterson, & Roine, 2005; Hausmann & Rigobon, 2003; Mehlum,
Moene, & Torvik, 2006; Van der Ploeg, 2008) and increases poverty and inequality
(Bulte, Damania, & Deacon, 2005; Goderis & Malone, 2008; Ross, 2007) and the
likelihood of conflict (Basedau & Lay, 2009; Fearon, 2005; Humphreys, 2005) and
authoritarianism (Auty, 2007; Dunning, 2008).
These more nuanced explanations highlight the importance of institutions and
governance, opening a window of opportunity for the extraction companies and IFIs
to exploit the developmental potential of the sector. After admitting the existence of
problems (IIED, 2002), companies quickly focused on the positive side, advertising
the benefits that mining could bring to poor countries and communities if some
conditions are met (ICMM, 2006b, 2006d; Wise & Shtylla, 2007).
27 However, the exclusive dichotomy ‘greed or grievance’ seems to be too simplistic to grasp the intricate dynamics behind most of the armed conflicts. Studies of Indonesia (Murshed & Tadjoeddin, 2009) and the Philippines (Holden & Jacobson, 2007) reveal that actually, these two factors are not mutually exclusive but complementary.
− 26 −
The International Council on Mining and Metals (ICMM), which represents the
world’s largest mining companies, has been especially active in commissioning
studies. This corporate literature tends to propose ideal policies that the companies
themselves and their host countries should pursue in order to promote
development. Strict respect for human rights, building constructive partnerships
with authorities and communities, and scaling up CSR activities are the industry’s
main commitments (ICMM, 2006d, 2009, 2010a). Regarding governance, the
ICMM adheres to the Word Bank good governance agenda, adding the importance
of building technical capacity in municipal and regional governments (ICMM,
2006a:14-19). In addition, the main companies endorsed the Extractive Industries
Transparency Initiative (EITI, 2005), agreeing to disclose their payments to the
governments implementing the initiative.
In the academic sphere, there has also been an upsurge in research into potential
policy solutions for ‘escaping’ the resource curse. The collections edited by
Humphreys (2007) and Khodeli (2009) agree that “domestic institutions make a
significant difference: with good governance the exploitation of resources can
generate revenues that will foster growth and reduce poverty” (Khodeli, 2009:6).
Their recommendations include state capacity building to facilitate negotiations with
private companies and enable the management of revenue; sound macroeconomic
and fiscal policies; institutional arrangements fostering transparency and
anticorruption safeguards; reform of state bureaucracy in order to reinforce efficient
service delivery and the setting up of natural resource funds to sterilise revenue
windfalls.28
This thesis relates to this rich body of literature on the resource curse in three
different ways. First, I complement the existing literature by examining the
existence of a sub-national version of the curse. The studies of the resource curse
have traditionally focused on national aggregate figures, processes, institutions and
policies, paying little attention to local dynamics. However, in the context of the
implementation of the NEIS and increasing international emphasis on
28 In recent years, proposals for the direct distribution of state revenue from the exploitation of natural resources to the inhabitants of mining areas also resonate as a radical method of bypassing the problems associated with the appropriation of rent by the state (Birdsall & Subramanian, 2004; Moss & Young, 2009; Sala-i-Martin & Subramanian, 2003; Sandbu, 2006; Segal, 2009).

− 27 −
decentralisation in developing countries, analysis at the sub-national level becomes
crucial to the understanding of new problems associated with these new strategies.
Second, I challenge the common assumption that institutional reforms and the
pursuit of new policies to deal with the resource curse are largely technical issues
that can be resolved by means of following the advice of experts and the
implementation of capacity building activities. My research highlights how the
outcomes of purely technical proposals are frequently unable to live up to
expectations (Bebbington, Hinojosa et al., 2008; Pegg, 2006a) because they do not
consider sufficiently the political dimensions of the resource curse (Karl, 1997,
2007). More specifically, these proposals do not take into account how dependence
on extraction shapes the nature of the state (Moore, 2004) and the process of
institutional reform itself (Stevens & Dietsche, 2008).
Finally, I find that the size of the rent generated by extractive activities is a key
factor for a better understanding of the resource curse, whose earliest
conceptualisations had already signalled the different problems mineral/oil rents
caused (Ross, 1999:312-319). However, lack of consistent data on the size of rents
on a cross-national basis has made academics use alternative economic
aggregates to test the theory at the macro level.29 Very recently the World Bank’s
Adjusted Saving Project published a dataset of oil rents that allowed researchers to
test directly the influence of oil and mineral rents on the outset of civil wars and
political instability (P. Collier & Hoeffler, 2005; De Soysa & Neumayer, 2007;
Omgba, 2009). This ‘rent-effect’ accounts for local differences and highlights the
importance of specific conditions in the exploitation of natural resources. These
approaches highlight that it is the rent that matters , not just the relative importance
of natural resources production and exports (Dunning, 2010; Weyland, 2009). In
this thesis I also test this ‘rent-effect’ and find a convergence between the results in
my sub-national research and the more widespread cross-national analyses.
29 Until very recently, a measure of mineral/oil dependency, defined as the proportion of production in relation to GDP as a percentage of total exports or as a combination of both, has been used to examine statistically the effect of natural resource wealth on different social and political outcomes.

− 28 −
1.5 Thesis outline
The next chapter describes the research methodology and presents the field sites.
After discussing the research process as a three-dimensional journey through
emotions, intellectual challenges, and unfamiliar geographies, the chapter sets out
to answer the three key methodological questions: (i) what did I want to know?; (ii)
how did I set about finding the answers?; and (iii) how did I select the most
appropriate places to undertake field research? It concludes by presenting the
three regions where I conducted field research.
Chapter 3 sets the implementation of the NEIS in context by analysing four factors
of the Peruvian political economy affecting the rural population: (i) the change in
state-citizens relations promoted by the implementation of neoliberal policies after
the 1980s, (ii) the uneven distribution of the benefits of the recent economic growth
that excludes, to a large extent, the Andean and Amazonian rural populations; (iii)
the experience of previous historical cycles of extraction in Peru, their related
political dynamics and the repercussions on the population close to the mines; and
(iv) the recent emergence of local actors in the countryside who challenge the
state’s authority.
Chapters 4-6 examine the relationship between social conflict and the
implementation of the NEIS in Peruvian mining regions. The overall conclusion is
that the NEIS has not only failed to reduce conflict, but in fact has increased the
number of disturbances. The three chapters substantiate this claim through a three
step analysis. Chapter 4 reviews what different Peruvian actors and the academic
literature say about the relationship between mining and social conflict. Chapter 5
presents the results of the quantitative analysis of the factors affecting the
variations in the incidence of social conflict across the Peruvian regions. It
concludes that there is a clear correlation between the increase in conflict and the
amount of canon minero transfers received by the sub-national governments of the
region. The result is puzzling because previous studies of the topic did not
anticipate that these transfers could cause social conflict. Chapter 6 presents the
results of my field research on conflict in Pasco, Ancash, and Moquegua regions.
The analysis confirms that the level of mining rents is the dominant driver of conflict
and provides information about the causal mechanism linking ‘money’ to social
disturbances.

− 29 −
Chapters 7 and 8 deal with the impact of the NEIS on economic and wellbeing
indicators. Chapter 7 shows that the implementation of the NEIS has not led to the
improvement of economic and wellbeing indicators at regional or municipal level.
The econometric analysis helps to distinguish the effect of the NEIS from that of
potential spill over effects of mining activity per se. Chapter 8 sets out to respond to
the puzzle posed by the results of the previous chapter: how is it possible that in
regions and municipalities receiving high volumes of canon transfer the living
standards of their inhabitants do not improve more than in the rest of the country?
First, the chapter presents the results of a quantitative investigation into the
expenditure patterns of Peruvian municipalities, showing that canon-rich
municipalities have a specific, less developmental way of spending money.
Second, the chapter provides detailed information from my field research in 18
canon-rich municipalities to clarify the local processes that lie behind this pattern of
expenditure. It concludes that ‘lack of capacity’ is usually overstated in official
accounts of local governance problems, and proposes an alternative and more
plausible explanation for the poor use of public money: the implementation of the
NEIS provides incentives for municipal authorities to pursue short-term spending.
Finally, Chapter 9 summarises the main findings regarding the effects of the
implementation of the NEIS on social conflict and development in Peruvian mining
regions. It also draws some conclusions about the relevance of the Peruvian case
to other resource-rich countries that might pursuit similar policies.

− 30 −
Chapter 2
The research journey
The process of researching this thesis has been a three-dimensional journey:
geographical, intellectual and emotional. From the beginning I was aware that the
research would involve extensive travelling in different parts of the country. I also
realised quite early on that I should venture into some areas of knowledge and
research methodologies that were previously unknown to me. However, I did not
expect that this research would also test my personal emotions.
Mining has proved to be a highly controversial topic and I have needed
continuously to take stock of my own feelings on the subject. During my field
research, I heard accounts of conflicts, suffering and frustration that aroused
differing reactions in me. Almost everywhere I met people with strong opinions who
demanded my endorsement of their views. The mining companies and the
authorities were frequently suspicious of an academic going around in the mining
areas. I also faced the scepticism of some of my friends in social movements
because they thought that my emphasis on the role of rents (Chapters 5 and 6) as
a cause of the conflicts downplayed what they saw as the direct responsibility of
mining companies. They, like many others during the research period, asked me to
make it clearer whether I was for or against mining.
I had to explain to the people I met, and frequently I had to repeat to myself, that I
was not looking for confirmation of any personal conviction about the topic. I did not
prejudge whether mining and/or canon minero transfers may or may not bring
development and prosperity to the Peruvian people, especially those living in the
remote areas of the country where many of the mines are located. Indeed, given
the natural endowment of the country, I would be delighted if the road from natural
resource exploitation to generalised human well-being was smoothly paved. This
would provide a better prospect for lot of my friends and many other people I had
met in recent years. However, I discovered through my research that such a
positive outcome is unlikely. On the contrary, there are clear signs of serious
obstacles. Thus, in this thesis, I first try to ascertain the magnitude of these
problems and second, I attempt to comprehend the dynamics behind them. I hope

− 31 −
that a better understanding of these forces will help the government, mining
companies, and social movements make better informed decisions.
This kind of analytical distance does not imply lack of passion and commitment.
The encounters with people in remote parts of the country during the field research
encouraged me to be even more rigorous. Some people asked me how my
research was going to help them. I tried to be honest and explained to them that it
was very unlikely that it could help them in the short term. However, I hoped that
my work would make a contribution, even if a very small one, to the improvement of
their lives by gaining a better understanding of the processes hindering
development in their localities. This hope gave me extra motivation during the
research process. It also pushed me to go further geographically and deeper
intellectually. The energy to visit one more community when I was already tired, to
endure the harshness of high altitude places, and to try some new analytical tools
when I already had enough material to write a thesis came, at least partially, from
this motivation.
In this chapter I give details of key aspects of my research. First, I describe the
research methodology, and then I present the field sites. The section on
methodology emphasises the intellectual dimension of the research journey, while
the presentation of the field research sites provides geographical information.
However, the three dimensions of the journey − geographical, intellectual and
emotional − frequently intertwine.
2.1 Thesis methodology
In this section I answer three questions: (i) what did I want to know?; (ii) How did I
set about finding the answers?; and (iii) how did I select the most appropriate
places to undertake field research?
2.1.1 What did I want to know?
It was almost by chance that I embarked on this study. In December 2006 I
travelled to Peru to visit my Awajun friends. On my way to the jungle, I was stopped
in the northern town of Jaen by a massive march of peasants protesting against
mining exploration in their communities. This awakened my interest. At the end of
my journey, back in Lima, I met two friends, an economist and a social activist. I

− 32 −
told them about the demonstration in Jaen. They had different opinions of mining.
The economist perceived mining as a great opportunity for the country, while the
activist informed me about the potential negative effects of mining on local
populations. However, they both agreed that mining would be one of the main
issues for the future of the country. I felt attracted to study the topic.
In June 2007 I was back in Peru ready to carry out the first round of field research.
Initially, I did not have a clear set of working hypotheses to test. I just wanted to
know what was happening at the grass roots. Because I was interested in clashes
between the mining companies and local populations, I chose to visit Cajamarca
and Espinar, two mining hotspots. In Cajamarca there had been recurrent social
conflict between Yanacocha, the largest gold mine in Latin America, and local
communities (Lingan, 2008; Tanaka & Meléndez, 2009). In Espinar, a remote
locality in Cusco, the Tintaya mine had also been plagued by disturbances,
sometimes violent ones. In 2004, the company agreed with the local authorities to
finance a fund to promote local development.30 However, the move did not prevent
the outburst of new clashes.
I expected to find a coherent story with good and bad guys, environmental damage,
abuse of local people by powerful transnational companies, and popular resistance
to mining. There was something of all this in both places, but it was not the whole
picture. In fact, what was happening there was much more intriguing. Pollution of
the environment, growing uncertainty over traditional livelihoods, a widespread
sense of dispossession among the locals and other grievances co-existed with a
popular acceptance of mining, substantial amounts of canon minero flowing to the
municipal coffers and the generation of a large number of jobs in public works. My
enquiries about the disagreement with mining activities were frequently met with
surprise. Most of the people wanted more benefits, not less mining. But clearly, the
existing canon transfers and corporate sponsored projects did not satisfy people’s
aspirations.
This preliminary research suggested that the implementation of the New Extractive
Industries Strategy (NEIS) had locked sub-national governments, mining
companies and local people into complex relationships that were difficult to
30 This agreement is seen as the precursor to the Mining Programme of Solidarity with the People (MPSP).

− 33 −
negotiate and into confrontations that could not easily be resolved (Arellano-
Yanguas, 2008). This initial insight helped me to focus my research on the two
questions that are at the heart of this thesis:
(i) Why did social conflict escalate so dramatically in the Peruvian mining regions
after the implementation of the NEIS?
(ii) Is there evidence to suggest that the implementation of NEIS has improved the
economic and social wellbeing of people in mining areas?
2.1.2 How did I set about finding the answers?
Answering these questions demanded a multi-method approach to the analyses at
both national and sub-national levels (Snyder, 2001). At national level, I reviewed
secondary information, examined the parliamentary archives and interviewed
relevant actors to get a better understanding of (i) the ways in which the NEIS was
designed, and (ii) the political and institutional context affecting its implementation.
In the investigation at the sub-national level, I used quantitative techniques to
compare the incidence of conflict and differences in economic and welfare
indicators between mining and non-mining jurisdictions.
To make this comparison I built two comprehensive datasets. In the first, I
assembled statistics from seven different sources for the 25 regions of Peru from
2001 to 2008: (i) the monthly incidence of social conflicts from the Ombudsman’s
office; (ii) geographical data from National Institute of Computing and Statistics
(NICS); (iii) demographics from the national censuses of 1993 and 2007; (iv)
electoral participation and results from the National Office of Electoral Processes
(NOEP); (v) social and economic indicators from the NICS; (vi) data on mining
production and investment from the Ministry of Energy and Mining (MEM); and (vii)
data on canon transfers to regional and municipal governments from the Ministry of
Economy and Finance (MEF).31 The second dataset includes data for the 1,834
municipalities in the country collected from five different sources for the same
period: (i) geographical data from the NICS; (ii) demographics from the national
censuses of 1993 and 2007; (iii) electoral participation and results from the NOEP;
31 Budgetary statistics for the regional governments only include data for the period 2004–2008 because they were created in 2003.

− 34 −
(iv) detailed budgetary data from the Ministry MEF; and (v) social indicators from
1993 to 2007 from the national censuses for these years.
I use these data in different ways. In the analysis at the regional level I combine
panel data regression techniques and Ordinary Least Square (OLS) regression to
elucidate (i) the correlates of the variation in the incidence of disturbances across
the Peruvian regions (Chapter 5); and, (ii) the influence of different mining related
variables - including canon transfers - on the change in economic and welfare
indicators (Chapter 7). At municipal level, I used Propensity Score Matching (PSM)
analysis to compare differences in changes in welfare indicators between canon-
rich and canon-poor municipalities over the period 1993-2007 (Chapter 7). Second,
through panel regression techniques I examined the spending patterns of municipal
governments receiving high volumes of canon minero transfer in the period 2005-
2008 (Chapter 8). I give methodological details of how I conducted these analyses
in the relevant chapters.
These quantitative analyses helped me to find plausible explanations for
differences across regions and municipalities that, in aggregate, made up the
national picture of the results of the NEIS. However, statistical results alone do not
provide sufficiently robust causal explanations. Consequently, I undertook detailed
fieldwork to explore local politics in regions and municipalities receiving high
volumes of canon minero transfers. I selected three mining regions – Pasco,
Ancash, and Moquegua– in which to focus the field research in order to gain a
better understanding of the processes and dynamics that lie behind the quantitative
results.
I conducted extensive field research in Pasco, Ancash and Moquegua between
April and October of 2008, and between September 2009 and March 2010. I used
four different methods of data collection. First, I conducted over 200 semi-
structured interviews. In Lima I interviewed 53 people: 15 academics and
consultants, 7 politicians, 13 leaders of social movements and members of NGOs;
8 senior government officials; 8 managers of mining companies, and 2
representatives of donor institutions. In the three regions together I interviewed the
three regional presidents, 20 mayors, 34 officials in regional and municipal
governments, 18 representatives of peasant communities - mainly their presidents
and members of the board - 23 local social leaders, including journalists, members

− 35 −
of social movements, and priests; 14 employees of the mining companies; 13
members of NGOs; 7 consultants working for regional and municipal governments;
the regional representatives of the Ombudsman and other relevant people including
policemen, anticorruption prosecutors, and workers in the public works of the
municipalities.
Second, I collected information on management capacity in the 18 municipalities I
studied. I followed a consistent strategy in all the municipalities in order to draw
meaningful comparisons. First, I phoned the mayors and agreed a date for the
personal interviews. In this first phone call I informed them that I would also like to
interview the general manager of the municipality. I also asked them for their e-mail
addresses to send a reminder of the appointment and a list of the data I would like
to collect during my visit. In Chapter 8 I use this information to assess the
managerial capacity of the 18 municipalities.
Third, I participated in popular assemblies, negotiation processes between local
communities and mining companies, participatory budgeting workshops, and public
hearings with mayors and MPs. In a few cases, the meeting had so many
participants that my presence went unnoticed. However, most of the time, in small
villages and peasant communities, I needed to introduce myself as an academic
interested in how they deal with local problems. In all cases I chose a discreet
place and remained passive but attentive. Generally, I took notes that I transcribed
at the end of the day including, separate contextual information and my own
reflections, My participation in these gatherings gave me a wealth of information
about local processes that frequently contrasted with what authorities expressed in
formal interviews. I also deliberately used public transport to travel within the mining
regions to differentiate myself from mining companies’ employees. This meant that
I had to chase ‘group taxis’ (colectivos) at the crossroads and had to spend many
hours waiting either for the arrival of the next taxi or for enough people to fill the
car. However, these journeys turned out to provide great opportunities to interact
with local people and to get opinions and information to complement those that I
got in more formal meetings.
Finally, I collected local newspapers, listened to local radio, and consulted web
pages with regional information. With some exceptions, the local media were highly
partisan. They supported the interests of those who paid them best. Thus, although

− 36 −
I could not rely on them for accurate information, a comparison of their different
approaches offered valuable insights into the local power dynamics.
At the end of the field research I had a wealth of information coming from different –
and frequently conflicting – perspectives. I cross-checked the different sources to
have a better understanding of the mechanisms behind the escalation of conflicts
(Chapter 6), and the processes driving the allocation of mining resources at local
level (Chapter 8). In this thesis, I sometimes bring stories and direct quotations
from my fieldwork into the discussion. I also have distilled much of this material to
summarise different perspectives. When I do this, I use footnotes to link these
syntheses with the source material, maintaining anonymity when necessary or
required by the interviewees.
It could appear that the qualitative analysis followed the quantitative one in a clear
time order. In fact, the research process was far more iterative. I undertook some
preliminary quantitative analysis of the data before the field research, and insights
from my visits to the mining areas provided me with new information to select new
variables and to check different hypotheses. Thus, most of the quantitative
analyses that I present in this thesis were carry out after the field research.
2.1.3 Selection of the field research sites
The analysis of sub-national dynamics as a way to understand the wider national
picture is the distinctive approach of this thesis. To capture both the fragmentation
and interconnection of sub-national politics demanded analyses at two different
levels − regional and municipal − in order to address the two questions driving the
research.
First, social conflict in Peru frequently involves the interaction of local and regional
actors. Although protests may begin in a small municipality, they are usually
embedded in wider regional dynamics and build on coalitions with groups outside
their municipal jurisdiction. Prolonged disputes demand the attention of regional or
national bodies and the mediation of authorities from the outside. This meant
regions were the most relevant units for analysing the influence of the NEIS on the
incidence of social conflict, though not precluding more detailed analysis of local
dynamics.

− 37 −
Second, the impact of the implementation of the NEIS on economic and social
wellbeing needs to be addressed at both regional and municipal levels. In Peru, the
central government transfers resources directly to each regional and municipal
government’s bank account. Accordingly, municipal governments bypass the
regional government when handling their budgets, resulting in a completely
independent management process. Thus, a separate assessment of the
performance of these two levels of government is crucial to understand the impact
of the NEIS.
Consequently, I was faced with the challenge of combining the two units of analysis
− regional and municipal − in such a way that I could examine in the same region
processes explaining the incidence of social conflict and the performance of
municipal governments. In terms of choosing the regions in which to undertake my
research, it was clear that I needed to select them from the six regions receiving
the greatest volume of canon transfers: Ancash, Cajamarca, Cusco, Moquegua,
Pasco and Tacna (Figure 1.2). As part of the selection process, I reviewed the
Ombudsperson’s report on social conflict (Defensoría del Pueblo, 2009) and found
that the six regions had also suffered a high incidence of social conflicts in recent
years. Thus, I was left with the task of identifying the three regions that included the
highest number of municipalities in receipt of significant canon minero transfers.
This criterion allowed a consistent sample of municipalities in which canon transfers
made a clear difference.
In order to better understand the situation, I analysed all 6 regions, identifying the
90 municipalities most affected by major mining operations32, ascertaining their
populations and the level of transfer they received. Then, to determine the regions
and municipalities most relevant to my research aims, I decided to select regions
with the most municipalities that in 2007 met two conditions. First, the population
should be over 3,000 inhabitants because municipal performance was more likely
to depend on established institutional patterns and procedures than in very small
localities.33 Second, the municipalities should be in receipt of canon minero
transfers in excess of PEN 1,500 (USD 470) per capita. Ancash, with seven
32 I identified municipalities according to the extent of canon minero transfer they received in 2007. These 90 municipalities accounted for 5 per cent of the country’s population, and received 46 per cent of the total canon transfers made to municipal governments that year. 33 This criterion implies the omission of municipalities with the highest per capita transfer.

− 38 −
municipalities meeting the selected criteria, Pasco with six, and Moquegua with five
seemed to be the appropriate regions.34
2.2 The research sites
The mining sector is extremely important to the economy and society of the
Ancash, Moquegua and Pasco regions, but they are sufficiently different to ensure
that they constitute a representative sample of the Peruvian mining sector. Table
2.1 shows some of the main features of these regions and a discussion of the
general dynamics around mining to which they are subject follows. I present the
regions in the order in which I undertook the field research. In addition, the basic
features of the mining operations and municipalities included in the fieldwork are
tabulated in appendices III and IV.
Table 2.1 Statistics for Pasco, Ancash, and Moquegua
Region Populationa Rural populationa
Mining as a percentage of regional GDPb Povertyc
Poverty evolution 2004–08 2005 2006 2007 2008
Pasco 280,449 38 % 59% 64% 74% 61% 64% -8%
Ancash 1,063,459 36 % 39% 38% 49% 42% 38% -15%
Moquegua 161,533 15 % 36% 30% 43% 43% 30% -1% a Data for 2007; b current prices; c data for 2008; source (INEI, 2009c).
34 In my assessment of Ancash, I excluded Huantar from the study because the official figures when I carried out the field research (prior to the dissemination of the 2007 national census) indicated that it had less than 3,000 inhabitants (as opposed to 3,098 revealed by the census published in June 2008). On the other hand, in considering Pasco, I initially incorporated Ticlacayan, Paucartambo and Chaupimarca into the study because 2007 per capita canon minero transfers seemed to be higher than PEN 1,500. However, adjustments to both canon minero transfers and population rates resulted in actual transfers being below this amount. Then, although I conducted field research in these three localities, and in fact used data collected there for the analysis of conflict, I finally excluded them from my enquiry into the municipal dynamics surrounding the spending of the mining revenues.

− 39 −
Figure 2.1 The six main Peruvian mining regions (the three regions selected for the study are shaded in orange)
2.2.1 Pasco
Mineral exploitation in Pasco stretches back to colonial times. More recently, the
first modern international mining company in Peru located its operations in Pasco
and American investors founded the Cerro de Pasco Copper Corporation (CPCC)
at the beginning of the 20th century, buying up nationally owned enterprises. As the
famous novel Redoble por Rancas (Scorza, 1970) vividly portrays, the
confrontations of the surrounding peasant communities with this company became
legendary, becoming an early symbol of local resistance to international capitalist
forces.

− 40 −
Figure 2.2 Field research sites in Pasco
As the century progressed, new investors established another four middle-size
operations in Pasco (Atacocha, Milpo, Huarón and Brocal).35 These ventures
definitively shaped the economy of the region. Mining dynamism promoted
migration and the expansion of the town of Cerro de Pasco around the pitheads of
the old tunnels. In 1956, CPCC converted the traditional underground mine into an
open pit operation, which had the distinctive feature of being virtually in the middle
of the town. Since then, the mine has steadily encroached on the urban area in
order to maintain output.36 Despite a long tradition of protest, the population has
ended up tolerating this ‘parasitism’ because economic activity linked to mining is
the only opportunity for making a living in the self-proclaimed highest city in the
world (4,380 metres above sea level).
I spent two and a half months in Pasco between April and June 2008. I was not
surprised that organisations opposing mining activities across the country arranged
excursions to Cerro de Pasco to show the damage that mining can cause. If the
town ever had any kind of beauty, it has definitively been lost. A pit of more than
35 See appendix III for more details of these operations. 36 Google Earth <Cerro the Pasco, Peru> contains photos of old buildings which have disappeared into the mine with their location.

− 41 −
1.5 km2 in area and 1 km deep now occupies the centre of the old town. Mountains
of tailings, polluted streams, lead dust, and daily explosions in the pit combined
with a lack of basic services, the high altitude and the extreme weather conditions
make Cerro de Pasco one of the most inhospitable places on earth. During my first
days in Cerro de Pasco, a national television station broadcast a documentary on
the town with a revealing title: Cerro de asco (‘disgusting hill’)37. The environmental
situation in the other mining municipalities was not so tragic, but there are still
widespread signs of environmental damage.
After some decades of mineral production decay, in recent years, mining has once
again become crucial to the regional economy, rising to above 60 per cent of total
GDP during the period 2005–2008 (Table 2.1). This means that in the
municipalities in Pasco where the mines are concentrated, mining represents more
than 90 per cent of local GDP.
The development record of this long history of mining is not good. The region as a
whole remains very poor. According to 2007 figures (INEI, 2009b), some
municipalities are numbered among the poorest in the country. Moreover, during
the mining boom of 2004–2008, poverty reduction was significantly below the
national average (Table 2.1.). People in Pasco could not understand why, if the
country had benefited so greatly for so long from the mineral riches of Pasco, they
had received so little attention. Moreover, from the perspective of a government
wanting to convince the population of rural areas of the benefits of mining, the
situation in Cerro de Pasco is not helpful.
As emerged from the previous description, I found research work in Pasco tough. I
spent 70 days there but I never got really accustomed to the lack of oxygen, the
cold, the pollution, and the black dust penetrating the nose. Despite the caring
support of some friends there and the opportunity to enjoy the beauty of some
surrounding spots, I felt deeply relieved when I finished the field research in Pasco
and could move to Ancash.
37 The documentary is posted at http://www.youtube.com/watch?gl=ES&hl=es&v=gtVRgs83Ayo

− 42 −
2.2.2 Ancash
Large-scale mining is a comparatively recent development in Ancash. Antamina
and Pierina, the two companies operating in the region, are the epitome of the new
mining sector, with modern operations and relatively high social and environmental
standards.38 Both mines are situated in the highlands, at over 4,000 metres above
sea level (MSL). Antamina, the main company, operates in the most
underdeveloped area of the region, the Conchucos Valley, which has about 62,500
inhabitants (INEI, 2008a). The company started production in 2001, after making
the largest mining investment in the world in the previous 15 years39. The result is
one of the biggest and most profitable mining operations ever undertaken40. Annual
profits after reinvestment and taxation ranged between USD 1,383 and 1,822
million for the period 2006–2008 (BHP Billinton, 2009:29). This means that with
these windfall profits Antamina’s parent companies recouped their investment in
less than two years. It also generated massive canon minero transfers to the
region, especially to the districts surrounding the mine in the province of Huari.
Moreover, Antamina’s social responsibility programme is the most ambitious in the
country, and in 2007, amounted to nearly $USD 67 million for local development.41
Unsurprisingly, despite the vastness of the region, Antamina has made a significant
economic and political impact on Ancash.
However, the poverty level in the region as a whole improved less − 15 percentage
`points − than the national average from 2004–2008; and in 2007, the districts
closest to the mine still appeared in the country’s lowest quintile in terms of the
human development index, as recorded by the Human Development Report (HDR)
2009 (UNDP, 2010).
The Canadian company Barrick is exploiting the Pierina mine in the district of
Jangas, Huaraz province. Pierina started its operations in 1998 and is currently
approaching the end of its economic life. Although Pierina is much smaller than
Antamina, its proximity to Huaraz, the regional capital, puts the operation at the
38 The main features of the mining companies in the study regions can be found in appendix III. 39 USD 2,300 million. 40 According to company sources, Antamina is the third largest mine in the world and the fifth most profitable. 41 Including a USD 64.3 million contribution to the MPSP. Only a proportion of that budget was actually spent in 2007.

− 43 −
centre of public awareness. Figure 2.3 shows the locations of the two mines and
districts where I conducted my field research.
Figure 2.3 Field research sites in Ancash
I used San Marcos, the capital of the district hosting Antamina, as my base during
the field research in Ancash. From there I travelled to the communities surrounding
the mine and to other municipalities. Despite hosting one of the biggest mines in
the world and the high volume of canon minero transfers accruing to the
municipality, public services in San Marcos were poor. Public transport to the
smaller districts was scarce and erratic; telephone lines in the rural municipalities
were faulty; internet connections in the cyber centres were desperately slow and
frequently out of order; and there was neither a fully operational bank branch nor a
cash machine within five hours travel. In sharp contrast, Antamina is one of the
most technologically advanced mines in the world: a satellite system helps to
choose the most efficient route for the gigantic trucks in the pit; the minerals travel
directly from the mine to the seaport in Huarmey through a 300 km pipeline; and
the 4,000 workers who live in the mining camp enjoy facilities and living standards
that local people cannot even dream of.

− 44 −
2.2.3 Moquegua
Moquegua has a well-established mining tradition. Since 1976, the Southern Peru
Copper Corporation (SPCC) has been exploiting the Cuajone mine, which is
currently among the three largest copper operations in the country. In addition to
Cuajone, SPCC owns an important cluster comprising the Toquepala mine in the
neighbouring region of Tacna, and a copper smelter and refinery in Ilo (Moquegua).
As a result, SPCC has greatly influenced the economic, social and political life of
this small region. In 1999, Grupo Mexico acquired the majority of the equity from
the original North American owners. From2006–2008, SPCC reported net profits of
USD 1,274 million, 1,415 million, and 1,092 million respectively for its Peruvian
operations in Moquegua and Tacna (CONASEV, 2010). This considerable revenue
meant that a significant amount of canon minero flowed to the regional government
of Moquegua and to the municipalities around the mine, the average for the latter
being approximately PEN 5,000 (USD 1,570) per capita in 2007.
Since 2001, Anglo American has been trying to procure a social licence to exploit
Quellaveco, a mineral deposit close to Cuajone. The new mine would double the
copper production of the region. After popular rejection of the plan in 2001, in 2008,
it looked as though Anglo American had finally got the green light to go ahead with
its plans for Quellaveco.
In contrast to other mining regions in the country, Moquegua ranks highly in terms
of economic and social indicators, enjoying the second highest level of all 25
Peruvian regions in the human development index. However, figures show that
there are significant disparities between lowland and Andean localities (INEI,
2009b, 2009c; UNDP, 2010). The districts of Moquegua42, Samegua and Torata
rank among the 80 (out of 1,834) most developed in the country, while Carumas
and San Cristobal are in the middle to low reaches of the table. Moreover, the
region had a dismal record in terms of improving living standards between 2004–
2008, when the level of poverty dropped by merely 1 percentage point cent, the
lowest rate in the country and in sharp contrast to the national average.
42 The district of Moquegua is the capital of Moquegua region, however, it is located in the province of Mariscal Nieto.

− 45 −
Figure 2.4 Field research sites in Moquegua
Moquegua was the last leg of my research journey. First, I visited the town of Ilo to
have a better understanding of the innovative process of participatory local
governance set up there during the 1980s and 1990s, and the long lasting conflict
between the town and the SPCC due to the pollution from its smelter facility. From
there I moved to Moquegua, the capital of the region, where I established my
centre of operations. Life in Moquegua was much easier than in Ancash and
Pasco, at least for a temporary visit. Yet journeys to the Andean districts of the
region were physically demanding and revealed the existence of enormous
economic and welfare differences between the capital and the rural areas.
After this brief description of regions where I carried out my field research, the next
chapter examines the historical, social and political context of life in the Peruvian
countryside. It will provide the background necessary to understand the dynamics
around the implementation of the NEIS.

− 46 −
Chapter 3
Where the mines are: the socio-political landscape of the Peruvian countryside
The old image of Peru as “a beggar sitting on a bench of gold” is still one of the
most frequently quoted diagnoses of the country’s troubles.43 I have heard the
same aphorism recounted in government offices and company headquarters, at
meetings with members of the political opposition to the ruling party and radical
activists, and at peasant community assemblies. In every case, the management of
the nation’s natural resources is at the top of the agenda to explain the country’s
problems and where to look for remedies. However, though using the same phrase
there is no unanimity as to its meaning; different people use the same words to
signal very different things.
The economic elite, mining companies, and national government have long
considered the mass of the Peruvian population to represent the beggar living on
top of vast natural resource wealth who does not have the capacity to take
advantage of it. They emphasise the need for entrepreneurial spirit and skills to
develop this golden endowment. They argue that the lack of private initiative in the
exploitation of the nation’s resources is responsible for the persistence of poverty
and related social discontent in the country. Accordingly, they aim to generate
better conditions to attract more private investment into the extraction sector. New
mining, gas and oil operations could then provide financial resources for the
country and bring modernisation, jobs, and much-needed ‘cultural’ improvement to
the countryside.
People living in the mining regions have a different interpretation of the situation.
For them, the Peruvian government, in collusion with the economic elite, has
throughout history condemned local people to penury, cheating them out of the
benefits of the fabulous wealth of their homeland. The state and powerful elite living
in Lima are seen to have benefited from the export of minerals, leaving local
43 The saying has been common in Peru since the end of the 19th Century. Although traditionally, one Antonio Raimondi, the famous Italian naturalist and traveller who explored the Peruvian regions from 1851 to 1869, is thought to have coined the phrase, recent research points to a more complex social evolution (Alcocer Martínez, 2006).

− 47 −
populations worse off than before the existence of mines. The current levels of
canon minero transfer represent the bare minimum reparation for these long
standing legitimate grievances.
President Garcia has recently introduced a new twist to the elite’s old ancestral
tale, adding to it a chapter that is more confrontational and unpalatable for a large
section of the population. In his newspaper article El perro del hortelano (the dog in
the manger)44 (García Pérez, 2007a), Garcia proposed increased exploitation of
natural resources (minerals, oil, gas, timber, water for electricity, extensive
industrial crop production in the Amazon, and fisheries) should drive Peruvian
economic development. He argued that only big private investors can afford to
invest in technology and provide the capital that modern firms require.
Consequently, the government should surrender control of the land, water and
other resources to them.
At the same time, Garcia portrays the leftist opposition, environmental NGOs,
defenders of indigenous rights, local populations resisting extraction activities, and,
in general, anyone who opposes his vision of development as dogs in the manger
who want to prevent progress in the country. Here is the twist: the beggar who once
represented the whole population has been transformed into the dog, no longer a
victim of underdevelopment, but an active opponent of development and, therefore,
responsible for the backwardness of the country. This discourse has put Garcia at
odds with the majority of the population in the rural areas of the Andean and
Amazonian regions, who feel themselves both insulted and also threatened with
being dispossessed of their most valuable assets. Even those who do not oppose
the expansion of the mining sector fear that Garcia’s way of thinking will weaken
their bargaining position vis-à-vis the mining and oil companies.
Garcia has been more outspoken and tactless than his predecessors, but his policy
proposals are not new. Since the end of the reforming military government under
Juan Velasco Alvarado in 1975, and most intensively when Alberto Fujimori took
power in 1990, Peruvian governments have engaged in market-oriented reforms
that eroded the ‘corporatist citizenship regime’ developed between 1968 and 1975
44 A reference to Aesop’s fable about a dog that does not allow the cattle to eat hay because it cannot eat hay.

− 48 −
(Yashar, 2005).45 This erosion particularly affected the rural population in the
Andean and Amazonian regions. The liberalisation of agriculture prices, eradication
of agriculture subsidies, elimination of public credit programmes for peasants, and
the promotion of free land markets hit the rural population (Yashar, 2005:67-68).
The adoption of this neo-liberal agenda transformed the relationship between the
state and citizens in rural areas.
During Velasco’s regimen the state assumed the role of protector of collective
rights and provider of social services. Although these policies did not last very long,
they had an important impact on shaping public ideas about citizens’ entitlements.
People in rural areas of the country learnt that they had the right to enjoy good
public services. The subsequent neoliberal change in policies alienated once again
the rural population from the state. They perceived that the state had no interest or
presence in remote communities except when it needed to impose – frequently by
violent means – the interests of the economic elite. The recent government support
for mining and oil companies in their confrontations with local populations
reinforced this perception.
My aim in this chapter is to set the implementation of the New Extractive Industry
Strategy (NEIS) in context by giving a brief historical account of this change in
state-citizens relations. It then briefly reviews three aspects of Peru’s political
economy that have affected the outcome of the NEIS. The first is the uneven
distribution of the benefits of the recent economic growth and the widespread lack
of trust in public institutions. The second is the experience of previous cycles of
extraction in Peru, their related political dynamics repercussions on the populations
close to the mines. The third is the emergence of local actors in the countryside as
the main challengers to the state’s authority. The analysis of these three factors
helps an understanding of the outcomes and political dynamics triggered by the
implementation of the NEIS.
3.1 Changes in state-citizen relations in the countryside
The relationship between the state and the rural population in the Andean areas
has been problematic throughout the history of the Republic of Peru. In 1928, 45 For an analysis of the installation and achievements of the corporatist regime of Velasco Alvarado in Peru see Stepan (1978). Collier (1995) offers a comparative perspective of corporatism in Latin America.

− 49 −
Mariategui argued that the persistence of a very unequal pattern of land ownership
was responsible for the backwardness of the country and the miserable conditions
of the rural population (Mariategui, 2007):
The individualistic character of the Republic's legislation has favoured the absorption of Indian property by the latifundistas46. The appropriation of most communal and individual Indian property is an accomplished fact. (p. 30) There are two expressions of feudalism that survive: the latifundium model and servitude. Inseparable and of the same substance, their analysis leads us to the conclusion that the servitude oppressing the indigenous race cannot be abolished unless the latifundium is abolished. (p. 40)
These problems remained unresolved for another 30 years. During the 1950’s
increasing numbers of Andean people migrated to Lima to look for a better life and
escape their grim fate.47 Massive migration changed the appearance and the social
dynamics of the once aristocratic Lima and also contributed to the transformation of
the countryside. Migrants in the capital maintained their links with their families in
the countryside and helped to diffuse new social, cultural and political customs in
the rural areas (Cotler, 1968:241). These changes in rural societies, the
peasantry’s per capita income stagnation, and the modernisation interests of an
incipient bourgeois in the towns of the highland provinces combined to challenge
the concentration of land in the hands of a few owners. In the early 1960’s Peru
experienced one of the largest peasant mobilisations in Latin American history
(Stepan, 1978:123). The invasion of land in Pasco, Junín and Cusco constituted
the peak of this wave of contention, which preceded the appearance of ‘Cuban-
style’ guerrilla groups in Junín, Cusco and Ayacucho (Bourque & Palmer, 1975;
Harding, 1975). The situation demanded reforms but the weak government of
Belaunde (1963–1968) was incapable of providing them.
3.1.1 The revolutionary experiment of Velasco Alvarado (1968–1975)
The military government of Velasco Alvarado (1968–1975) made a serious attempt
to overcome these problems. The Peruvian military knew at first hand the severity
of the situation because they had had to deal with insurgency and social protest in
46 Owners of large rural states. 47 The population of Lima grew from 645,000 in 1950 to 1,847,000 in 1960, and 3,300,000 in 1970.

− 50 −
the pueblos jóvenes48 and during the peasant uprisings. The army also realised
that lack of development was the main threat to national security (Stepan,
1978:127-136). Thus, in contrast to the traditional military coalition with the
oligarchy, the new government aimed to transform Peruvian social structure
completely.
The ‘Peruvian experiment’ received as much initial support as it has subsequent
criticism. Setting aside the endless argument over its real achievements, both its
successes and failures had a significant and long-lasting impact on the
transformation of political actors and culture. Velasco Alvarado gave the non-white
population – the majority of Peruvians – the opportunity to identify themselves with
a president whose nickname, the chino, referred to his cholo [brown skinned]
appearance. Moreover, the revolutionary rhetoric that spoke of forging the ‘new
Peruvian’ through the extension of high quality education brought hope to the rural
masses and the urban poor.
The ‘revolutionary government’ undertook a series of far-reaching economic and
social reforms – Peruvian land reform was the most comprehensive in Latin
America. By 1979, the hacienda tenure system had disappeared. Approximately
nine million hectares, which accounted for 60 per cent of total agricultural income,
were distributed to 375,000 families, 25 per cent of the total farming population
(Eguren, 2006:12; Klarén, 2000:347).
In the economic field, the new regime promoted greater involvement by the state.
The diagnosis was that the old provincial elite, or ‘gamonales’, and foreign
companies had been capturing most of the economic surplus without reinvesting it.
Thus, the solution was to nationalise the large foreign concerns in the oil and
mining sectors and promote an autonomous model of economic development
based on import-substituting industrialisation rather than on the export of
commodities (Thorp & Bertram, 1978).
The results were mixed.49 Land reform did not benefit the poorest peasants who
lived outside the confines of the expropriated haciendas (Bourque & Palmer, 1975;
48 ‘New towns’: the name given to the shanty towns on the outskirts of Lima to project the idea of a more positive future. 49 A comprehensive evaluation of the sectoral policies of the revolution can be found in Lowenthal (1975).

− 51 −
Harding, 1975). Moreover, the rapid growth of the population conflicted with the
scarcity of fertile land in the Andes and few opportunities in other economic
activities (Sheahan, 1999:172). People continued flowing into the cities, searching
for jobs, but the state could not offer them a basic infrastructure or services (D.
Collier, 1975). The industrialisation process achieved some initial success in
expanding the manufacturing sector, but foreign investment soon dried up and the
state had to subsidise private initiatives. The failure to run state-owned companies
on profitable lines and the expansion of public expenditure led to an unsustainable
fiscal deficit that reached a critical level in 1975, when the international banks
curtailed their previously generous lending policies (Thorp & Bertram, 1978).
Furthermore, the inability of the state to meet popular expectations spawned social
mobilisation that ran out of control. The government tried to tame these
spontaneous movements, launching the National System of Social Mobilisation
(SINAMOS), which promoted and managed popular organisations (Stepan, 1978).
It also sought to create a social basis for the revolution, eroding the popular support
for political parties. However, the attempt to mobilise the populace came too late.
Economic problems and social unrest – in combination with Velasco’s ill health –
led to a change in leadership and a complete revision of policies.
A group of conservative army officers took power in 1975, restoring orthodox
economic policies under the supervision of the International Monetary Fund (IMF).
Although it was relatively easy to reverse a highly centralised ‘top-down’ revolution,
the new ‘counterrevolution’ faced mounting popular opposition from an array of
groups and social organisations that had blossomed in the shadow of the
revolutionary impulse (Klarén, 2000:359-361). This process initiated a very
unstable period. Realising that they were unable to steady the polity, the army
prepared for the transition to democracy, calling for free elections in 1980.
Despite Velasco’s apparent failure, his tenure had important and long-lasting
consequences in terms of the advent of new political actors. His government
fostered the emergence of hitherto unseen processes, so that new entrepreneurs,
middle class professionals, peasant and popular organisations, and labour unions
increased their political visibility (Morón & Sanborn, 2006:14-15). In the
countryside, the land reform transformed the social landscape and the self-image of
the peasantry. The revolutionary government used the term ‘peasant’ to include

− 52 −
both the mestizo and the indigenous population. However, the prescriptive rhetoric
echoed the words of the indigenous leader, Túpac Amaru II, who had fought for
independence “Peasant, the landlord will eat no more from your poverty” (Klarén,
2000:346).
This combination of discourses and historical figures prompted a threefold process
of awareness among the peasants of the Andean provinces of their: (i) indigenous
identity - their rights as the original population; (ii) class identity - their rights
because they work the land; and, (iii) nationalist identity - their rights as Peruvian
citizens. These three aspects of identity were weighted differently according to the
group, time or political opportunity.
3.1.2 The restoration of democracy and the internal war (1980-1990)
The restoration of democracy in 1980 did not improve the situation. The two
subsequent governments of Belaunde (1980–1985) and Garcia (1985–1990)
implemented a mixture of orthodox and populist policies. Their economic strategies
were at least partially responsible for the grim legacy of political violence,
hyperinflation, fiscal bankruptcy and discredited institutions (Crabtree, 1992;
Sheahan, 1999). Public foreign debt increased from USD 6.9 billion (28 per cent of
GDP) in 1982 to USD 16.27 billion (69 per cent of GDP) in 1988 (Ministerio de
Economía y Finanzas - Perú, 2009). Moreover, GDP per capita fell by 25 per cent
between 1980 and 1989; and inflation escalated from an already high 59 per cent in
1980 to 7,482 per cent in 1990 (Banco Central de Reserva del Perú, 2009).
Furthermore, the violence of the Shining Path swept the countryside, causing
terror, thousands of victims, and the frequent destruction of the existing forms of
political organisation. A combination of three factors generated the conditions for
this violent eruption. First, the agrarian reform had put an end to relations and
destroyed the political power of landlords, opening new political spaces that the
state was unable to fill (Kay, 2001). Second, the distance between the radical
discourse of the revolution and its real achievements on the ground nurtured
frustration and increased the popularity of more radical discourses (Mallon, 1998).
Finally, the retreat of the state from the countryside in the late 1970’s gave the
Shining Path the opportunity to spread its radical ideology and to build its
stronghold in rural areas of the Andes.

− 53 −
The Shining Path used Maoist strategies and took advantage of this political
opportunity to challenge the power of the Peruvian state from the countryside.
Brutal reprisals from the army often followed the escalating atrocities of the
guerrillas. Consequently, the peasantry was caught in the crossfire in wide areas of
the sierra, placing an additional and cruel burden on the rural and – frequently –
indigenous population. Meanwhile, for almost the entire decade, the economic and
political elite in Lima was apparently unaware of what was happening in the
countryside. As one of the rural victims reported:
The state still discriminates against the Andean people, considering us second class citizens. Only when the bombazos [car bombs] went off in Tarata50, did the people in Lima realise that something was happening in the country; what was going on before in the countryside was only to do with the cholos as far as they were concerned (CVR/Peru, 2004:101).
This testimony illustrates the way in which the rural population in remote areas of
the country perceived ‘Lima’, ‘the government’, and ‘the rich’ to be completely
indifferent to what was going on in the hinterland.
In the late 1980s, the state was so impotent that political analysts did not rule out a
Shining Path takeover of the country, if only in the short-term. The sense of chaos
was pervasive. Political parties, politicians and institutions were completely
discredited and the population demanded a heavy hand to restore order.
3.1.3 Fujimori (1990-2001): authoritarianism and neo-liberalism.
In the presidential elections of 1990, Alberto Fujimori emerged as the country’s
saviour. Fujimori, an academic born into a humble family of Japanese immigrants
to Peru, appeared as the ‘brand new’ outsider who was able to break the
hegemony of the white ruling class (Murakami, 2007:207-218). The people wanted
a new style of leadership and Fujimori offered an alternative to the orthodox
formula of Vargas Llosa, the neoliberal and ‘white-rich’ candidate.
Fujimori initially gained popular support by making a mockery of the elite-controlled
Parliament, judiciary and traditional political parties. He governed the country by 50 This testimony from Edilberto Oré (December 2002) refers to the first car bomb in Lima, in Tarata Street, in July 1992. Shining Path’s activities in the capital had started to escalate some years previously, in 1988, when the Central Committee of the Shining Path decided to move the war from its bases in the countryside to the cities (CVR/Peru, 2004:411-417). The sense of real danger reached its peak in 1991–1992, when the government was forced to impose a nightly curfew in Lima.
− 54 −
exploiting his direct rapport with the population and marginalising representative
institutions (Crabtree, 2000), instilling in the people a suspicion of politics,
politicians and institutions.
In the economic field, reneging on his electoral campaign promises, he
implemented an orthodox and drastic neoliberal agenda.51 The ensuing harsh
economic readjustment plan brought soaring prices under control, granting Fujimori
further credibility among the sectors of society that had suffered the most from the
devastating effects of hyperinflation (Murakami, 2007:258-267).
With the backing of the army and popular support, in 1992 Fujimori dissolved
Parliament, reformed the constitution and initiated an austerity programme that
promised ‘efficient technical solutions’ in contrast to the chaos of the policies of
previous governments. Moreover, his victory by force over the Shining Path and
MRTA52 guerrilla groups in the first years of his mandate legitimised and reinforced
his authoritarian regime.
Fujimori succeeded in stabilising the economy and led the country to recover its
attractiveness as an investment prospect. Accordingly, the privatisation of state-
owned utility monopolies and the mining companies promoted foreign investment
from 1992, rehabilitating Peru back into the world economy. Since then, Peru has,
on average, scored higher than neighbouring countries in capacity to attract foreign
capital – an achievement in sharp contrast to Peru’s performance over the previous
twenty years, when the country consistently ranked below its neighbours (Figure
3.1). As a result, by 1994, the country had resumed its export tradition.
Market liberalisation promoted the greater involvement of foreign capital, which
assumed control of key economic sectors (Durand, 2007), limiting local capitalists’
room to manoeuvre. However, the traditional alliance between foreign and
domestic investment found a new equilibrium. A leaner and fitter elite reinforced its
position by brokering relations between foreign interests and local political powers.
The desperate attempt of the Peruvian government to demonstrate its commitment
51 In the introduction to the most recent edition of his best-seller, The Other Path (1989), the confessional Peruvian neoliberal Hernando De Soto explains how he personally took Fujimori to the IMF and the World Bank in the first weeks of his tenure to convince him of the benefits of adhering to liberal principles. 52 Túpac Amaru Revolutionary Movement.

to orthodo
over the
economy
business
Figure 3.Peru and
Sourc
In relatio
marginalis
eroded th
centralise
purposes
announce
infrastruct
eliminated
Land Law
allowing t
53 By such principal exbusiness se
ox econom
state (Du
to neolib
sector, and
1 Net infloother grou
ce: (World Ban
on to the
sed commu
he peasants
ed social sp
(Schady,
ements abo
ture. On
d complete
w (Law 26
the sale of c
means, the xtractive indector (Duran
mic policies
rand, 2005
eral techn
d, in return,
ow of foreiups of relev
nk, 2010).
rural po
unities with
s’ collective
pending in
1999). He
out the con
the other
ely public c
6505) mark
community
National Soc
dustry compand, 2005:212
− 5
gave this
5:251-267)
ocrats, wh
, his politica
gn direct ivant count
opulation,
h the implem
e power (C
the Minist
flew freque
nstruction
hand, Fu
credit facilit
ked a mile
y-held lands
ciety of Mininanies togeth).
55 −
new busin
.53 Fujimor
ho were e
al style gain
investmenttries, 1970–
Fujimori c
mentation o
Crabtree, 20
try of the P
ently to rura
of school
ujimori libe
ies to peas
stone in th
s to private
ng, Oil, and Eer, emerged
ess allianc
ri left the
endorsed b
ned interna
t as a perc–2007
combined
of radical n
000: 174).
Presidency
al areas br
buildings a
eralised the
sants and f
his process
investors (
Energy (NSMd as the ma
ce importan
managem
by the IFIs
ational legit
centage of
popular s
neoliberal p
On the one
using it fo
ringing don
and other b
e land ma
farmers. In
s of libera
(Yashar, 20
MOE), whichain represent
nt leverage
ent of the
s and the
timacy.
f GDP for
support in
olicies that
e hand, he
or electoral
nations and
basic local
arket, and
n 1995, the
alisation by
005:238).
h brought thetative of the
e
e
e
n
t
e
l
d
l
d
e
y
e e

− 56 −
The abrupt end of Fujimori’s third term of office – prompted by the disclosure of
evidence of widespread corruption at the top levels of his regime – demanded the
thorough reformation of the Peruvian political system. From a social perspective,
the persistence of endemic poverty generated growing unrest that threatened
political stability (Schuldt, 2004). In the political field, different actors challenged
authoritarianism and the reinforced centralisation of the state. The provisional
government of Valentín Paniagua (2000–2001) and the subsequently elected
president, Alejandro Toledo (2001–2006), undertook the task of implementing the
reforms.
3.1.4 The new democratic era (2001–2008): political reform straitjacketed by an
untouchable economic model.
Innovations in the immediate post-Fujimori period were asymmetric. The main
political forces simply agreed to the reformation of the political system without any
revision of economic policy. The international institutions supported this dual
approach to safeguarding the recovery of economic growth. Their stance was in
line with the second generation of structural reform of the state that the IFIs
advocated in the late 1990s in order to sustain the achievements of neoliberal
economic adjustment in that decade (Inter-American Development Bank, 2003).
This approach weakened the transformative capacity of the political reforms.
The process of democratisation encompassed a broad reform agenda, fostering
decentralisation, direct popular participation and administrative transparency
(Remy, 2005:23-31; Tanaka, 2005:42-54). These innovations attempted to respond
to the popular demand for a more inclusive polity. In particular, decentralisation was
hailed as a sort of political talisman to (i) promote political participation; (ii) generate
the incentive to respond to the demands of the public; (iii) solve long-term tensions
between Lima and the regions; (iv) foster accountability; (v) reinforce the presence
of the state at local level; (vi) distribute public resources more fairly; (vii) improve
services for the population; (viii) encourage the economic development of the
regions through the coordination of public and private investment; and (ix) drive the
modernisation and rationalisation of the state apparatus (Monge, 2006; Polastri &
Rojas, 2006; Ugarte, 2006: 24-25; UNDP, 2006). 54
54 The demand for political and administrative decentralisation goes back to the nineteenth century. During the last years of the first government of Alan Garcia, there was an attempt to

− 57 −
With such high expectations, Parliament reached a consensus on some key basic
reforms and called for new presidential and parliamentary elections by 2001. The
change from a single national electoral constituency to 25 regional constituencies
was the first decentralisation policy that triggered later reforms. In the resulting
parliament, 85 out of 120 members were provincianos, representatives of the
regions (Pease, 2006:87). Between 20th July 2002 and 9th July 2004, the new
legislature approved 11 laws directly related to decentralisation, laying the
normative foundations of this reform process (Zas Friz Burga, 2005:29-30).
Originally, the national parties thought that decentralisation would help them
develop power bases in the regions. However, right from the beginning, the
disparity between national and local politics was patent. In the first regional
elections, Alejandro Toledo’s party won control of only 1 out of 25 new regional
governments; the main opposition party, the American Popular Revolutionary
Alliance (APRA), gained 12. However, by the time of the next regional election in
November 2006, when the APRA leader, Alan Garcia, was president of the
Republic, his party gained control of only two regional governments. An array of
regional movements with no connection to any of the national political groups
dominated the ballot. The failure of national parties to gain popular support in the
regions slowed down the decentralisation process and, more importantly, shaped
the form it would later take. The central government reinforced its control over the
process, predetermining the function of the new governments through increasing
the number of centrally imposed norms and regulations (Revesz, 2009a:39-40).
In the economic realm, the new democratic governments did not tamper with
inherited economic policies, tending to reinforce existing patterns. The
governments of Toledo and Garcia repeatedly appointed technocrats to manage
the Ministry of Economy and Finance (MEF) and the Central Reserve Bank. Most
Economic ministers during the period 2001–2008 belonged to an exclusive club of
highly qualified professionals who had previously worked for the World Bank, the
IMF or various international companies.55 They constituted a nucleus that
promote decentralisation as the answer to the persistence of regional pressure groups active in the 1960s and 1970s (Crabtree, 1992:67). However, Fujimori aborted the process at its embryonic stage. 55 This was the case with Javier Silva Ruete (2000–2001; 2002–2003); Pedro Pablo Kuczynski (2001–2002; 2004–2005); Luis Carranza (2006–2008; 2009–2010); and Luis Valdivieso (2008–2009).

− 58 −
guaranteed the continuity of the neoliberal agenda: price stability, sound fiscal
policies, reduction of the national debt, liberalisation of trade and, above all, the
promotion of a favourable environment for investment.
The alliance between the MEF and the business sector, especially the mining
companies, dominated the political landscape during the previous two presidential
terms. Some analysts have declared that, “the big corporations elect the minister of
the economy, and the MEF controls the government on their behalf.”56 Moreover,
the public relations director of the most profitable company in Peru, the Southern
Peru Copper Corporation (SPCC), openly confirmed the corporations’ policy:
“Private companies are the only actors who can generate wealth and provide
stability to this troublesome country. Thus, it is clear that the government should
subordinate the rest of its policies to the smooth running of private businesses.”57
This alliance rests on the assumption that economic growth automatically reduces
poverty, which, in turn, generates political stability.
3.2 The unsatisfactory outcomes of neoliberal policies: territorial inequalities and lack of trust in public institutions
The strategy of the last governments appears to have been successful, as Peru
has consistently been named among the Latin American countries in the best
shape to face the global crisis that began in 2008 (The Economist, 2009, 2 May:
49-50). However, the lustre of the macroeconomic figures hides some less positive
outcomes. Two problems illustrate the shortcomings of the strategy. First, the
poverty gap between rural and urban Peru has widened during the last years (see
Table 3.2). Second, there is widespread suspicion of state capture by private
interests, especially the mining and oil companies. The sanctioning of the Mining
Programme of Solidarity with the People (MPSP) and the revelation in October
2008 of evidence of corruption in the granting of exploration rights to a Norwegian
oil company reinforced this popular belief (O`Brien, 2009), further eroding the
already weak legitimacy of the state.
56 Interview with Sinesio López (2007-011; Lima, 12-06-2007). 57 Interview with Guillermo Vidalón (2008-149; Lima, 06-08-2008).

− 59 −
3.2.1 The poverty gap between rural and urban population
Poverty and inequality have marked Peruvian history. Although this is a common
feature in the Global South, the Peruvian record during the last four decades is
sadly outstanding. In the 1970s and 1980s, the incidence of poverty increased in
comparison to previous decades and to the rest of Latin America (Sheahan, 1999:
105). In 2001–2008, impressive economic growth fostered a significant
improvement in the overall level of poverty, which dropped from 54 per cent to 36
per cent (INEI, 2009c). Yet, this reduction was concentrated in coastal and urban
areas, leaving the rural hinterland of the Andean and Amazonian regions worse off
in comparative terms.
Table 3.1 Evolution of Gini coefficient, 1986–2003*
Year Gini
1986 0.457
1990 0.439
1996 0.462
2002 0.546
2005 0.520 * Data for 1990 are based on expenditure at household level, whilst data for the remaining years are income-based. Source: (World Bank, 2010).
Levels of inequality have increased in Peru in recent years. The Gini index was
0.520 for 2005 (Table 3.1), meaning that Peru ranked among the most unequal
countries in the world: 109th out of 126 (World Bank, 2010).
A deeper analysis shows that this income inequality strongly correlates with
geographical factors; and, that in the context of runaway economic growth, the gap
between urban and rural areas has widened. Lima and the coastal regions have
enjoyed the lowest levels of poverty and consistently improved their indicators over
recent years, dropping from 39 per cent in 2001 to 21 per cent in 2008. However, in
sharp contrast, the Andean sierra (especially its rural areas), which was already
poorer, has made significantly weaker progress, with its level of poverty stagnating
at a shocking 69 per cent in 2008 (Table 3.2).58 In the same year, the Pearson
58 See Appendix II for additional statistics for the period 2001–2008 on the percentage of the population living below the poverty line in different geographical regions.

− 60 −
correlation between the level of poverty and the percentage of rural population was
0.6 and 0.9 at municipal and regional level respectively.59
Table 3.2 Percentage of population below the poverty line in different geographical regions of Peru, 2008
Lima Coastal region Andean Sierra Amazon rainforest
Urban* Rural Urban Rural Urban Rural
Poverty % 18 23 35 34 69 31 49 * Excluding Lima. Source: (INEI, 2009a).
The figures in Table 3.2 tend to understate the real differences between regions.
This is because official poverty levels are measured against minimum consumption
expenditure, which varies from region to region according to an (also variable)
basket of basic goods and services (INEI, 2009a:1-4). Differences become more
acute on comparing per capita average monthly income by geographical areas
(Table 3.3).60 As the figures indicate, differences in income are remarkably high
and, although all geographical areas show improvement in average income, the
change in rural areas – especially in the Andes– is notably smaller than in the rest
of the country (see evolution in Appendix II).
Table 3.3 Average monthly per capita income in different geographical areas of Peru, 2008
Lima Coastal area Andean Sierra Amazon rainforest
Urbana Rural Urban Rural Urban Rural
Incomeb 703 482 334 505 185 431 224 a Excluding Lima; b PEN at 2001 rates. Source: (INEI, 2009a).
These differences between regions are more severe in Peru than in other Latin
American countries. Moreover, despite the existence of a process of political
decentralisation, economic activity remains highly centralised in Lima. In 2007, 31
per cent of the population lived in Lima, but the metropolitan area accounted for 47
59 Author’s elaboration with data from INEI (2008a, 2009c). 60 The income estimate includes domestic production, payments in kind, and donations (INEI, 2009a).

− 61 −
per cent of national GDP, 87 per cent of internal tax revenue, and 50 per cent of
central government’s total expenditure (INEI, 2009c, 2009d). Furthermore, Peru
represents the most extreme case in the Latin American context of the poverty gap
between the capital city and the rural areas of the country (Table 3.4).
The recent democratic governments have paid little attention to these problems.
They have prioritised economic growth over poverty alleviation, trusting in the
conventional trickle-down effect to reduce poverty (García Pérez, 2007b, 2008).
Moreover, they perceived inequality as a mere transitory by-product of growth and
modernisation.61 However, the fact that inequality is grounded in geographical
cleavages challenges the government’s conviction because, in the absence of
corrective measures, economic growth tends to exacerbate the differences. The
government’s denial of this factor is likely to increase political instability.
61 This is the Kuznets hypothesis, although there is no conclusive empirical evidence in the Latin American context, where economic growth has traditionally gone hand in hand with an increase in inequality (Székely & Montes, 2006:599-602).

Table 3.4 Relative importance of the main metropolitan area in relation to the rest of the country, and the poverty gap with respect to different geographical areas in various Latin American Countries
Bolivia Brazil Colombia Chile Ecuador Mexico Peru
Index of metropolitan concentrationa 48 54 55 74 51 66 81
Percentage of rural populationb 36 17 23 14 37 24 27
Percentage of population living in poverty nationwidec 54 30 45 14 43 32 39
Percentage of population living in poverty in metropolitan areasc 41 27 34 10 na 27 18
Percentage of population living in poverty in rural areasc 76 46 51 12 50 40 65
Poverty gap incidence between rural areas and the national average 22 16 6 (2) 7 8 26
Poverty gap incidence between rural areas and the capital 35 19 17 2 na 13 47
a Percentage of the combined population of the four largest cities that lives in the largest city. The data are for different years: Peru 2007; Ecuador 2003; Bolivia 2008; Colombia 2007; Chile 2002; Mexico 2005; Brazil 2007.
b Estimated data for 2005 (ECLAC, 2010). The criteria for differentiating rural from urban areas vary from country to country (ECLAC, 2005): Bolivia: population living in towns of less than 2,000 inhabitants; Brazil: population living outside the limits of rural areas, according to the boundaries of municipalities; Colombia: population living in towns of less than 1,500 inhabitants; Chile: population living in towns of less than 1,000 inhabitants, or in towns of between 1,000 and 2,000 inhabitants in which at least 50 per cent of the active population works in the secondary sector; Ecuador: population living in rural parishes and on the outskirts of provincial capitals; Mexico: population living in towns of less than 2,500 inhabitants; Peru: population living outside district capitals in agglomerations of less than 100 houses.
c The data are for different years: Peru 2007; Ecuador 2007; Bolivia 2007; Colombia 2005; Chile 2006; Mexico 2006; Brazil 2007. Sources: (ECLAC, 2005, 2010; INEI, 2008b; World Bank, 2010), adapted by the author.

− 63 −
3.2.2 Erosion of public’s trust in political institutions
Unsurprisingly, despite more than eight years of significant economic growth and
poverty reduction at national level, the Peruvian public’s trust in the principal
political institutions ranks consistently below the Latin American average (Table
3.5), which, in turn, is not the most positive region when it comes to judging its
institutions (World Values Survey, 2009).
Table 3.5 Level of trust in political institutions: a comparison between Peru and Latin America (LA) as a whole
Trust ina 1996 2001 2004 2007
Peru LA Peru LA Peru LA Peru LA
Parliament 35 26 23 25 15 26 17 31
Judiciary 26 34 16 28 20 33 16 31
Government 29 35 - - 9 31 22 39
President 34b 40b 31 31 7 37 25 46
Political parties 20 22 24 20 11 19 14 20
Police 31 31 23 30 24 36 33 40 a Percentage of people who said they had ‘strong’ or ‘some’ trust in the institutions. b 1997 data. Source: (Latinobarómetro, 1995-2008).
Trust in Parliament, the judiciary and political parties tends to decline.
Circumstantial factors determine the scores for the government and president.
Ironically, before the revelations of widespread mismanagement, Fujimori and his
government (1996) achieved the highest Peruvian score. In contrast, Toledo (2004)
attained the lowest level of popular trust ever enjoyed by any Latin American
authority in this kind of survey. Finally, trust in Garcia’s government started to
decline after the first year of relatively generous public support, as his 22 per cent
rating of 2007 declined to 15 per cent in 2008 (Latinobarómetro, 1995-2008).
This general distrust of political institutions goes hand in hand with increasing
discontent with the current democratic system. Only 16 per cent of the Peruvian
population appeared to be satisfied with the political situation in 2008, the lowest
percentage in Latin America and 21 points below the average for all Latin American
countries. In contrast, 88 per cent believed that a few powerful groups controlled

− 64 −
the country in their own interests (Latinobarómetro, 1995-2008). This lack of public
trust in political institutions is an important factor in the explanation for the local
dynamics behind the increase in social conflict (Chapter 6) and the waste of
financial resources at local level (Chapter 8).
3.3 Economy of extraction in its historical perspective: political dynamics and social outcomes
Post-independence Peru did not escape the mining character of colonial rule. The
Spanish crown’s avarice for Peru’s gold and silver shaped not only relations
between colony and crown for 300 years, but also the internal economic and
political structures inherited by the newly independent republic. This section
examines the political dynamics and the social consequences related to this
economy based on extraction highlighting their relevance for the implementation of
the NEIS.
3.3.1 Economic cycles and political dynamics
Thorp and Bertram (1978) propose a still widely accepted view of post-colonial
economic history structured around three major export cycles of about fifty years
each. The guano economy characterised the first cycle, beginning in the 1830s and
expanding until the War of the Pacific with Chile (1879–83). Peru’s defeat meant
the destruction of the country’s economic infrastructure and brought about a time of
political and social turmoil (Klarén, 2000:191-194).
The second cycle began in the late 1880s, with the reconstruction of the country.
The exploitation of minerals and the growing participation of foreign companies
were the main features of this period, which came to an end with the Great
Depression of 1929 (Dore, 1988).
The third cycle ran between the economic recovery of the 1930s and the early
1980’s.62 The Second World War and the subsequent expansion of the world
economy fostered Peruvian exports of agricultural products, fish and minerals.
Crops and fisheries comprised the bulk of exports in the early 1940s, but minerals 62 Thorp and Bertram dated in 1974 the end of this cycle. However, according to data now available (Figure 3.2), this period can be extended to the early 1980s. When the book was published in 1978, they could not predict that the crisis of the early 1970’s was only an early sign of the definitive collapse of this cycle of exportation.

began to
cent of to
1970s, Pe
1980, larg
an unpara
in public
hyperinfla
long-lastin
1992 (from
for GDP p
three.
Figure 3.2
S
With resp
(1978) no
phases of
the expor
the gover
counterac
Moreover
new phas
the cycle,
increase i
otal exports
eruvian exp
gely due to
alleled fall i
foreign de
ationary cri
ng effects:
m PEN 5,5
per capita
2 Change i
Sources: (Banc
pect to the
ote that per
f upturn in
rt economy
rnment in
ct the previo
r, in the thr
se of expor
, foreign co
in importan
s by 1974 (
ports under
o a rise in
in Peruvian
ebt, the dra
sis of the
GDP per c
542 to PEN
to recover
n GDP and
co Central de
interplay b
riods of rela
exports. In
y. In the thr
the econo
ous free tra
ee cycles,
rts had com
ompanies to
− 6
nce during
(Thorp & B
rwent a sha
mineral pri
n exports, w
amatic dro
late 1980s
capita fell b
N 3,686), an
r to 1975 le
d GDP per c
Reserva del P
between ec
ative politic
n contrast,
ree cycles,
omy and th
ade orienta
foreign inv
me into play
ook the lea
65 −
this period
Bertram, 19
arp increas
ices. Howe
which prece
op in nation
s. The neg
by 33 perce
nd it took a
evels. It wa
capita, 195
Perú, 2009; EC
conomics a
cal stability
political un
crises fost
he introduc
ation.
vestment pl
y. In the m
ad with the
d, until the
978: 208). A
se during th
ever, the ea
eded the un
nal GDP (
gative impa
entage poin
a further 14
as not just
50–2008 (PE
CLAC, 2010).
and politics
and conse
nrest corre
tered the g
ction of pro
layed a sig
iddle of the
collaborati
ey constitut
After the c
he short pe
arly 1980s
nsustainabl
(Figure 3.2
act of this
nts between
4 years – u
one lost d
EN at 1994
s, Thorp an
ervatism co
sponds wit
greater inte
otectionist
gnificant rol
e expansiv
ion of local
ted 53 per
crisis of the
riod 1978–
witnessed
le increase
2), and the
phase had
n 1975 and
ntil 2006 –
ecade, but
rates)
nd Bertram
oincide with
th crises in
rvention of
policies to
e once the
e phase of
capitalists
r
e
–
d
e
e
d
d
–
t
m
h
n
f
o
e
f
s

− 66 −
seeking opportunities to gain access to technology, financial resources and
international links. The political position of this coalition of local and foreign
capitalists was reinforced by the model of export-oriented growth:
Periods of successful export growth rapidly consolidated the political power of those who reaped the benefits of comparative advantage, and thus ensured the supremacy of policies which served their interests, so that the familiar orthodox policy mix of laissez-faire liberalism and encouragement for foreign investment grew naturally out of export growth, rather than vice versa. Once adopted, of course, such policies thereafter produced acceleration of the growth of export-linked activities, encouraging the concentration of economic activity in parts of the modern sector while the rest of the economy was left to drift (Thorp & Bertram, 1978:323).
Following Thorp and Beltran’s analysis, the existence of a fourth cycle that started
in the early 1980s and is currently at the peak of a remarkable export phase (Figure
3.3) is a reasonable hypothesis. Minerals account for almost 70 per cent of total
exports in this most recent phase. As with the previous cycles, it started with the
instability generated by the collapse of the preceding one, which, in turn, led to an
initial recovery and, finally, a boom phase.63 In relation to the questions driving this
thesis, it is relevant to analyse how this new economic cycle interacts with the
political domain and, therefore, how it influences the implementation of the NEIS.
As has happened in previous cycles, representatives of the leading economic
sector gained political leverage and fostered policies favouring their interests. In
this case, mining companies have widely publicised the importance of mining for
the country’s economic growth and for its fiscal balance (Macroconsult, 2008). They
tried to reinforce their political position with the government and to attract popular
support for their activities. It is clear that during the last years, mining companies
received full government backing by making regulations responsive to their
commercial interests. However, this close collaboration between the mining
companies and the government has provoked a political backlash from different
segments of society. First, some political groups perceive the alliance between the
government and the companies as an attempt to sell the nation’s riches off cheaply
to foreign interests for the private gain of an elite. This nationalist discourse is
popular with poor populations in rural areas of the Andes, the stronghold of Ollanta
Humala, the 2006 nationalist Presidential candidate. Second, ecology groups fear 63 A more detailed analysis of the specific features of this hypothetical new economic cycle can be found in Gonzales de Olarte (2005).

− 67 −
that the government prioritises economic growth over the enforcement of
environmental regulations. Finally, people living in resource rich areas feel that the
government has become too close to the mining companies to be a fair arbitrator in
their frequent disputes with them. The result is the further erosion of public trust in
the government.
Figure 3.3 Peruvian exports per capita, 1950–2008 (USD at 1950 rates) / minerals and fuel as a percentage of total Peruvian exports, 1950–2008
Sources: (Banco Central de Reserva del Perú, 2009; ECLAC, 2010).
3.3.2 Social outcomes of the extractive economy
According to Thorp and Bertram (1978:326), acute inequality and widespread
poverty have usually been the consequences of these economic cycles driven by
natural resource booms. The picture of the national long-term perspective is grim
enough, but the experience at regional level was more intricate and multifaceted.
Mining development in the central highlands during the 20th century is a good
example of this complexity. Academics have reached different conclusions about
the impact of mining activities in Peruvian mining regions during the 20th century.
Some of the pioneering studies affirmed that mining conformed to an enclave
economy, with no linkages to other local economic sectors (Flores Galindo, 1974;
Kruijt & Vellinga, 1979). According to these analyses, the local population did not
0
10
20
30
40
50
60
70
80
0
20
40
60
80
100
120
%US
D
Total exports per capita Mining and Fuel as percentage of total exports

− 68 −
benefit substantially from mining because they were exploited (miners),
dispossessed of their land (smallholder peasants), or simply neglected.
Subsequent analyses contested, at least partially, this perspective. De Wind (1985,
1987) agreed mining had a negative impact, but he challenged the view that
mining was isolated from other economic activities. From the perspective of
dependency theory, he analysed the presence of the Cerro de Pasco Copper
Corporation (CPCC) in the central highlands and argued that by buying large land
holdings the company tried to reduce job opportunities and salaries in the
agriculture sector. This move aimed to facilitate the recruitment of enough workers
for the mines. These dynamics transformed the traditional labour organisation in
the agriculture sector and the use of land, generating long-lasting socio-economic
changes in the rural areas. He concluded that the mining industry accumulated
wealth at the expense of the rural agricultural sector.
Long and Roberts (1984), not disputing the subordination of agriculture to the
company’s interests, pointed out three main positive linkages between mining and
the regional economy. First, mining was labour-intensive employing large number
of miners who alternated between periods of work in the mines and subsistence
farming. They spent their wages in the local markets, fostering a multitude of
informal small-scale enterprises. Moreover, there were a large number of
independent producers of ore scattered across the region that sold their production
to the CPCC. They also required workers for their enterprises. Second, the CPCC
and the independent producers purchased local construction materials, machinery
and other supplies promoting local commerce and small scale manufacturing (Long
& Roberts, 1984: 47-49). Finally, the need to ship the ores produced in small mines
to the CPCC smelter facilities, the commercial dynamism of the region, and the
growing mobility of people demanded transport that was mainly supplied by local
firms. These linkages were enough to stimulate economic dynamism in the region.
The situation started to change in the 1960s, when technological improvements in
the mining sector reduced the workforce and transformed the relationship between
the company and the local economy (De Wind, 1987). The process of capital
intensification weakened the demand for local unskilled labour and locally
manufactured machinery, eroding links with the local economy. This tendency was
reinforced in subsequent years. Mining companies now hire qualified people from

− 69 −
Lima or other cities in the country. They purchase machinery abroad, and even the
food supply for the workforce comes from Lima to meet the standards demanded
by the labour unions. Nowadays inhabitants in mining areas perceive the mines to
be controlled from Lima and bring little benefit to the locals. Not surprisingly, job
opportunities in the mines for locals are the most frequent demand in mining
regions.
3.4 The emergence of new and more dispersed political actors
The agrarian reform, the internal war, and the crisis of the political parties and
labour unions have nurtured a redrawing of the map of Peruvian political actors. In
the last few decades, the Peruvian elite and its challengers have moved in opposite
directions. On the one hand, the elite has become increasingly concentrated – both
in terms of membership and location – in Lima (Cotler, Barrenechea, Glave,
Grompone, & Remy, 2009:13-23; Manrique, 2006:24). On the other hand, the
challengers are now more dispersed. Local and regional movements of different
kinds have multiplied and replaced political parties, labour unions and more
organised urban social movements. They frequently build their constituency and
legitimacy by echoing long fomented local struggles actualised through the
articulation of new grievances and claims. This section presents two actors that
strongly influence the local dynamics around the implementation of the NEIS:
peasant communities and regional political movements.
3.4.1 Peasant communities
The ‘peasant community’ is a concept that includes diverse types of entity. There
are three basic features of a community: (i) the control of resources within a
delimited territory, (ii) some degree of communal management of these resources,
and (iii) the existence of institutionalised organs for decision-making and external
representation. Within this loose definition, traditional communities whose history
goes back to the colonial era coexist with those formed through the collectivisation
and co-operative project of Velasco Alvarado’s agrarian reform. Moreover,
communities built around strong Quechua or Aymara indigenous traditions enjoy
the same legal recognition as the free associations of owners of small plots of land
(Castillo Castañeda, 2007).

− 70 −
By 2006, there were 5,818 peasant communities encompassing 4 million people –
15 per cent of the country’s total population – occupying 25 million hectares, more
than 40 per cent of the productive land (Castillo & Urrutia, 2007:12-14). However,
these communities accounted for the poorest section of the population and the soil
on their land was of comparatively low fertility.
After the corporatist period of Velasco Alvarado (1975), the peasant communities
fell on difficult times. Internal disputes within the communities, the violence that
swept the Andean countryside during the 1980s, and the subsequent promotion of
more liberal/individualist policies weakened the organisational capacity and political
role of the Andean peasant communities. Moreover, the emergence of municipal
governments as powerful actors eroded the role of the community as the principal
local grassroots institution. The peasant communities controlled the territories, but
institutional representation, political power and the economic capacity to get things
done were put in the hands of the regional authorities. Thus, some commentators
predicted the communities were doomed to lose their institutional importance.64
In contrast to the diminution of their political role, simultaneous processes helped to
keep alight the lingering embers of a more complex peasant identity. Thus,
although ‘being an Indian’ was still considered a social stigma in the Andes, the
growing international support for the indigenous cause in the 1980s and 1990s
opened up spaces for the reconstruction and exploitation of an indigenous identity
among some social leaders (Yashar, 2005). Additionally, the rondas campesinas 65
crucial role in the fight against the Shining Path in the countryside (Degregori,
1998) also boosted the self-image of Andean peasants as genuine Peruvians who
defended the nation, while the blanquiñosos66 in Lima were doing nothing.67
In the late 1990s, when the mining companies started to expand their activities in
the Andes, seizing mineral deposits to exploit, their presence provoked indigenous-
peasant communities to reinvent themselves in answer to both the external threat
to their control of the land and a rare opportunity to improve their economic 64 Interview with Alejandro Diez (2008-017; Lima 14-04-2008). 65 Traditional rural organisations that were set up to prevent cattle rustling. Later, they started to play an important role in settling disputes among villagers and providing security for the population. 66 White people. 67 This is very much in contrast to the traditional image of the elite limeña, who dismiss the ‘Indians’ as not being real patriots (Mallon, 1995:1-2).

− 71 −
situation (Castillo Castañeda, 2007; Diez 2006:88-97). Indeed, their subsequent
interlocution with mining companies that needed their land and water reinforced
their position, granting them a renewed political role.
Two factors raised the leverage of the communities in their relations with the
companies. First, the law demanded that the companies should reach an
agreement with the owners of the land. Second, beyond this formal requirement,
there was mounting pressure on the mining companies to obtain a ‘social licence to
operate’. This meant that the companies had to get explicit permission from the
local communities to proceed with their activities (World Bank, 2003: 21,50). Failure
to procure this social license to operate led to serious loss of reputation thanks to
the action of global networks that connected local disputes to international forums
(Bebbington et al., 2007).
3.4.2 Regional movements and other local actors
Despite the prophecies of the 1980s that gave prominence to the new urban
populations as catalysts of social change (Matos Mar, 1984), in recent years, the
most significant forces demanding innovation have emerged from the countryside
in regional and local scenarios. The discredit of political parties in conjunction with
the decentralisation of resources to local and regional governments has promoted
the emergence of fresh political leaders at grassroots level. Local politicians no
longer need to follow a traditional party career that implies taking a party line,
loyalty to the party leadership, and internal competition in order to demonstrate
capability. On the contrary, in this new era, local leaders are encouraged to prove
that they are not slaves to party discipline, or indeed to any authority beyond their
own constituency.
Thus, at sub-national level, politics have become the domain of local leaders with
very weak connections to national parties. This generates a partisan dynamic
between the centre and the regions, and between regions and districts, in which
local leaders tend to champion popular claims in order to build their own political
agendas in opposition to those of the regional or national governments. This
dynamic has two consequences: (i) conflicts are sometimes local leaders’ means of
gaining popular support (Revesz & Diez, 2006); and (ii) local leaders take little part

− 72 −
in national politics, and regional perspectives are thus underrepresented at national
level.
The frentes de defensa68 have recently proliferated as local political organisations
in the countryside. These frentes bring together an array of regional groups to
defend local interests and, increasingly, to oppose policies that affect them. They
are usually formed when institutional channels have proved to be inefficient,
consequently, their approach combines popular mobilisation (demonstrations,
marches, public assemblies, and, in some case, regional strikes) with the
advancement of an agenda for negotiation. This kind of organisation is very flexible
in terms of both its membership and thematic focus. Once a frente has
demonstrated its ability to challenge authority on one specific issue, the same
name, organisational structure and strategies are frequently used to address other
problems. Sometimes leaders use their participation in the frentes as a platform to
advance their own political careers, or to contest local and regional elections
(Panfichi, 2010).
As with peasant communities, the growing presence of mining companies in the
countryside has incited the formation of larger number of frentes. Despite their
success, the frentes remain highly localised and until now have not shown
themselves to be either capable of, or interested in forming a more articulate
national social movement (Panfichi, 2009).69 But this could change.
In summary, the emergence of actors who channel local discontent directly to the
authorities has made the persistence of poverty and inequality affecting rural areas
increasingly untenable for the central government. This has increased the instability
of the Peruvian polity. Each of these actors alone lacks the capacity to successfully
challenge the central authority. However, their fragmentation and lack of connection
with national parties, economic power bases or the central government all make it
more difficult than in the past to co-opt or repress them.
68 Defence fronts. 69 The indigenous demonstrations of 2008 and 2009 are a possible exception due to the pre-existence of the National Organization of the Amazon Indigenous People of Peru (AIDESEP) and the Confederation of Amazonian Nationalities of Peru (CONAP), national umbrella organisations that encompass local organisations all over the Peruvian Amazon.

− 73 −
Most ‘developing countries’ face significant problems of governance and political
legitimacy. These have always existed in Peru. They have become really severe in
recent years. The implementation of the NEIS should be examined against this
background of the growing alienation of the rural population from the state, the
accumulation of local grievances aimed at the centralised elite, the discredit of
institutions, the historical experience of mining activities and the emergence of an
increasing number of widely dispersed political actors.

− 74 −
Chapter 4
Perspectives on social conflict in mining areas
This and the two succeeding chapters examine the relationship between social
conflict and the implementation of the New Extractive Industry Strategy (NEIS) in
the mining regions of Peru. The NEIS policies were deliberately designed to reduce
friction between local populations and mining companies. Thus, the claim that the
NEIS has not only failed to reduce social conflict, but, in fact, has multiplied them
puts seriously into question the soundness of the strategy. These three chapters
aim to substantiate this claim through a three step analysis. I start by reviewing, in
this chapter, the conventional wisdom concerning the relationship between mining
and local disturbances. In Chapter 5, I use a dataset of social conflict in Peru to test
quantitatively the factors affecting the variations in the incidence of conflicts across
the Peruvian regions. The results show a clear correlation between the increase in
social conflict and the amount of canon transfers received by the sub-national
governments of the region which in turn, are directly associated with the profits of
the mines in the same region. These results are unexpected because previous
studies did not suggest this ‘money’ factor as a possible cause of disturbances. In
Chapter 6, I present the results of my field research into social conflict in 3 regions.
These support the claim that the level of canon minero transfer is the dominant
driver of conflict.
Thus, I start my analysis by asking what is known about the relationship between
mining and social conflict. First I examine what different Peruvian actors have to
say about the issue. Second, I review the academic literature on the topic. I
conclude with some reflections about how to research the issue.
Neither popular nor academic explanations of mining and social conflict in Peru
take sufficient account of the situation created in the mining areas by the
implementation of the NEIS. The public debate mainly concerns stereotypical
interpretations that overlook the diversity and complexity of social conflicts, while
academic studies focus on a small group of cases where impact on the
environment and uncertainty about livelihoods were the most significant issues.
Although these studies contribute to a better understanding of these disputes, they
have not captured the emergence of new types of social conflict. Thus, the chapter
− 75 −
ends by arguing the case for a broader methodological perspective to the study of
mining-related conflicts in Peru.
4.1 What do different Peruvian actors think about social conflict and mining?
I begin this thesis by telling the stories of Santiago, Isabel and Antonio (Chapter 1),
and their involvement in three different mining-related conflicts. Unfortunately, their
stories are not exceptional. From 2004–2008, there was an upsurge in social
conflict in Peru (Defensoría del Pueblo, 2009). This growing social unrest is also
captured in Peru’s remarkably low score and deteriorating trend in political stability,
as measured in the World Governance Indicators (World Bank, 2009).
Untypically, the Peruvian government, the mining companies, and leaders of social
movements agreed that extractive activities were at the centre of the escalation of
social conflict. However, as was to be expected, they offered an array of divergent
and frequently conflicting explanations.
The national government gave two different types of explanation for the high
incidence of disputes in mining regions. The first centred on the behaviour of
opposition movements, while the second blamed the poor performance of local
government. The government used the first type of explanation for conflicts that
grew into national political issues. The president himself repeatedly declared that
they were the result either of the concerted resistance of ignorant rural inhabitants
to the very modernisation process that would bring prosperity to them, or of an
international communist conspiracy against the country’s most dynamic economic
sector (García Pérez, 2007a). Frequently, the two arguments were combined into a
catch-all explanation of how global forces in collaboration with allegedly left-leaning
international NGOs and their domestic counterparts, the progressive wing of the
church and other supposedly radical groups to manipulate an ignorant population to
create conditions favourable for popular rebellion (El Comercio, 2008b; García
Pérez, 2009).70
Thus, taking the clash in Bagua in which my friend Santiago was wounded, the
official line given by various ministers and President García himself was that
70 This was also the opinion of some company managers in the following personal interviews: 2007-005 (Lima, 11-06-2007); 2008-051 (Pasco, 13-05-2008); 2008-102 (Huaraz, 23-06-2008); 2008-149 (Lima, 06-08-2008).

− 76 −
international forces in collaboration with local radicals had manipulated the
uneducated indigenous population with the intention of impeding the modernisation
of Peru.71 When Santiago heard this presidential statement, he felt that the
government did not understand what had really happened. He explained to me that
the protest was a genuine grassroots movement born out of people’s real fear of
losing control over their territory.
This type of official explanation is not only inadequate, but also dangerous because
it led to the heavy-handed repression of popular movements. García’s statement
after the bloodbath in Bagua illustrates his approach: “the government is
determined not to allow a group of 400,000 indigenous people, who are not first
class citizens, to decide what to do in the country.”72 The government replicated
this repressive stance in other places, as the tragic militarisation of localities around
the Rio Blanco project (Majaz) demonstrates.73
The government sometimes uses a second type of explanation. When confronted
with the fact that protesters frequently did not oppose mining per se, ministers and
high ranking bureaucrats put the blame on the sub-national governments and their
inadequate responses to the needs of their people.74
Mining companies were deeply concerned about the escalation in conflicts, and
perceived them as a real threat to their businesses. At the international level, the
Fraser Institute’s Annual Survey of Mining Companies ranked Peru among the
most attractive countries in terms of the economic potential of its mineral reserves,
but very low in terms of political variables – security, political stability and disputes
over land and indigenous people’s rights (Fraser Institute, 2009).75 A survey among
the top managers of 36 of the most important mining companies operating in Peru
corroborated this view (Apoyo, 2009a). The respondents identified the incidence of
social conflict – in 98 per cent of cases – and political instability – in 90 per cent of
cases – as the two factors most detrimental to mining investment, way above other
71 This discourse is in line with President Garcia’s fixation with ‘the dog in a manger’ fable as a means of explaining Peru’s problems (García Pérez, 2007a). 72 The interview can be seen at http://www.youtube.com/watch?v=JDVgw4pbHEk 73 http://www.larepublica.pe/archive/all/larepublica/20091213/1/01/todos 74 Presentation of the Minister of Trade at the 29th Mining Convention (Arequipa, 16-09-2009). 75 The Fraser Institute sent a questionnaire to approximately 3,000 exploration, development and mining consultation companies around the world. Its Annual Survey of Mining Companies represents responses from 658 of these companies.

− 77 −
typical business concerns such as the tax system – 48 per cent of cases – or credit
availability – 5 per cent of cases.
However, the mining companies were by no means unanimous about the reasons
behind the growing incidence of conflict; and in my interviews with corporation
representatives I came across at least two quite different perspectives. The
Southern Peru Copper Corporation (SPCC)76 and a group of middle-sized
companies with strong connections to the Peruvian political elite tended to endorse
the official explanation for conflicts as the work of ‘troublemakers’.77 Some even
went as far as to put the blame squarely on terrorist elements supposedly linked to
the Shining Path.78
Alternatively, some mining companies – especially the big international concerns
with extensive experience worldwide – recognised that no conspiracy theory was
needed to account for the proliferation of conflict situations, and listed a set of more
prosaic explanations. First, they were well aware of the impact mining has on host
communities. In the words of one manager: “mining activities are closer to the
harmful effects of the tobacco industry than to a bucolic dairy farm in the pristine
countryside”.79 Second, they tended to blame the state for its inability to deliver
services to its population and for its failure to guarantee a business-friendly
environment at local level.80 Finally, in private, some managers conceded that the
inappropriate behaviour of some companies generated problems. Among bad
corporate practices they cited attempts to mislead the population over the real
76 In recent years, SPCC has consistently been ranked among the three largest – in terms of income – and most profitable companies in the country (CONASEV, 2010). Since the early 2000s, it has been part of the Grupo Mexico, which bought it from the previous US owners. The linkages between SPCC and the Peruvian political elite are well established. The career trajectory of one of its most senior managers, Hans Flury, illustrates these connections. He has worked for SPCC for more than 30 years. In 1997 he was elected president of the National Society of Mining Oil and Energy (NSMOE). In 2003, he left SPCC to become Minister of Mining and Energy. After some months in that position, he went straight back to SPCC. In 2009, he once again assumed the presidency of the NSMOE, while maintaining his responsibilities at SPCC. 77 This was the opinion of company managers in the following personal interviews: 2007-005 (Lima, 11-06-2007); 2008-051 (Pasco, 13-05-2008); 2008-102 (Huaraz, 23-06-2008); 2008-149 (Lima, 06-08-2008). 78 Interview 2008-051 (Pasco, 13-05-2008). 79 Interview 2008-084 (10-06-2008). 80 Interview 2008-083 (Lima, 9-06-2008) and a study commissioned by the NSMOE (Apoyo, 2009a).

− 78 −
impact of mining operations, mafia-like strategies to intimidate local opposition, and
disrespect for local authorities.
These private confessions portray a lack of unity in the industry, whereby
international newcomer companies feel uneasy about the way their peers have
managed relations with national and local political actors. In a particularly shocking
statement, a senior manager of one international company said they hoped (SPCC)
would not go ahead with its new Tia María operation, which had met strong
opposition from the peasant population of Islay (Arequipa). According to this
informant, SPCC had “handled things so badly that a green light for this operation
will mean that anything is permitted and, consequently, some companies can
maintain their unscrupulous style of doing things.” He added that, “it would be the
wrong signal for the industry as it would jeopardise the future of mining in the
country”.81
The social movement around mining has also its internal differences. Most groups
tend to think of social conflict simply as concerted popular resistance to global
capitalist forces and environmental destruction, the mining sector being regarded
as the epitome of such exploitation (Bajo la Lupa, 2009; Echave de, Hoetmer, &
Palacios, 2009; Palacín, 2008). However, other civil society groups such as Oxfam,
CooperAccion and Labor82 do not rule out the possibility that under the right
conditions mining could contribute to local development. They suggest conflicts are
mainly caused by lack of institutional arrangements to properly regulate mining
operations, and to the myopic perspective of the companies in forcing local
administrative processes to dance to the tune of maximum short-term company
profits.83
Unfortunately, the two extreme interpretations of conflict – the official conspiracy
theory and the narrative of popular resistance to environmental destruction – are
the most widespread in the media and dominate the political debate. They tend to
oversimplify the situation, ignoring the existence of different types of conflict and
the complex web of interests at stake. The prevalence of these discourses also
results in limited political diagnosis and confrontational attitudes that frequently
81 Interview 2010-201 (Lima, 5-04-2010). 82 CooperAccion and Labor are well respected Peruvian NGOs with a long tradition of work on behalf of populations affected by extractive industries. 83 Interview 2010-006 (08-04-2008).

− 79 −
worsen the situation. Although conflict is sometimes unavoidable – and may even
be productive – the stories of Santiago and the others seriously injured or killed in
Bagua and similar incidents elsewhere, demand a deeper understanding of the
situation so that better and more appropriate institutions and mechanisms are put in
place to deal with conflicts of interest in a less violent and painful fashion.
4.2 What does the academic literature say about the relationship between mining and social conflict?
Over the last decade, research into the links between social conflict and the
intensive exploitation of minerals and oil has generated two different – largely
unrelated – bodies of literature. Economists and political scientists have studied the
influence of natural resources on the outbreak and duration of civil wars.84
Frequently these authors have framed their research within the debate surrounding
the ‘resource curse’ hypothesis (see Section 1.4). Most of these studies rely
primarily on large-N cross-country comparative analyses, although some authors
have also carried out small-N comparisons and national case studies (Holden &
Jacobson, 2007; Ross, 2004a; Weinstein, 2007).
Another body of literature deals with conflicts related to the exploitation of natural
resources that do not conform to the definition of civil war. These studies have
focused on how mines and oil wells – typically owned or managed by large,
powerful, international companies – affect (poor) communities in their localities.85
Such conflicts usually have a local dimension and are the domain of
anthropologists and political geographers who conduct single case studies or small-
N comparative studies.
It is clear that from 2004-2008, there was nothing resembling civil war in Peru. The
most common type of social conflict in Peru comprised middle ground disturbances
in which a group of protesters did at least one of the following: (i) threatened the
84 Civil war is usually defined as a conflict over government or territory that involves a minimum of 1,000 battle-related deaths per year in the case of a full-scale civil war, and 25 for lower-intensity internal armed conflict. 85 Comparatively, mining has received more attention than oil regarding this kind of dispute with local communities. The growing difficulty faced by mining companies in appeasing local populations near their operations might explain this special interest. However, the oil-related Niger Delta case that recently hit world headlines has attracted wide academic interest (Frynas, 2000; Watts, 2004), partly because oil in the Delta has an unusually highly adverse environmental impact.

− 80 −
integrity of life or health; (ii) damaged private or public property; (iii) obstructed
freedom of movement; (iv) impeded the exercise of public authority; and/or (v)
obstructed public service delivery (Defensoría del Pueblo, 2009). This kind of social
conflict is due to the impact of mines and oil wells on local communities rather than
civil war. Having reviewed − in the first chapter − the literature on the relationship
between war and natural resource exploitation, in this section I examine the
literature on these more localised conflicts, first in places other than Peru, and then
recent studies of Peruvian cases.
4.2.1 The comparative literature
Recent studies of social conflict generated around mining have paid special
attention to the Melanesian and Andean regions because of the importance of
mining and the high incidence of disturbances. From this literature, three main
types of explanation for mining-related conflicts emerge: (i) ecological crisis; (ii)
threat to local livelihood; and (iii) dissatisfaction with the distribution of rent. Of
course, these hypothetical causes rarely define clear-cut processes. In most cases,
they are amalgamated into a single local discourse; and, indeed, they are usually
variously and simultaneously said to be at work in each actual situation (Banks,
2005). However, for the sake of analytical clarity, I present them separately and
highlight their differences.
The environmental damage caused by large mines has been the most popular
explanation for the social conflict surrounding the mining industry. Pioneering work
on Melanesian communities pointed to the negative impact of these mining-created
‘ecological crises’ on the lives of indigenous populations as the main factor behind
conflicts in Papua New Guinea (Hyndman, 1995, 2001; Kirsch, 2004). Martínez-
Alier (2002:54-77) also refers to ‘ecological conflicts’ in his historical analysis of
mining impact. However, he introduces a political perspective when he frames
environmental degradation in the context of a broader struggle over the control of
resources.
This environmental focus has been challenged from two different perspectives.
First, Banks (2002) claims that mining conflicts in Melanesia are at least as much
about community development and livelihoods as they are about the environment.
However, he argues that problems are framed as environmental or ecological

− 81 −
issues because this allows the affected populations and their allies to “tap into the
strong international vein of environmental rhetoric to attract support in the
developed world” (p.42).
In the Andean context, a group of scholars also focused on the disruption to local
livelihoods as the main explanation for this kind of conflict (Bebbington & Bury,
2009; Bebbington, Hinojosa et al., 2008; Bury, 2002). According to them, mining
activities generate uncertainty within the local population about their livelihoods and
control over key assets such as water and land. A community that relies mainly on
agriculture cannot afford the risk of depreciation in either the quantity or the quality
of these assets. Thus, although environmental damage might be one outcome of a
mining operation, the main engine of conflict is uncertainty over sustainable
livelihoods.
Second, some authors push the challenge to the traditional environmental
explanation even further, claiming that at least some conflicts must be understood
in terms of competition over resource rents (Filer & Macintyre, 2006). Banks
(2005:190) argues that traditional indigenous institutions in Melanesia were not
designed to handle the distribution of mining revenue, resulting in disputes within
the communities. MacIntyre and Foale (2002) focus on the relationship between the
companies and local population, claiming that beyond real environmental fears,
“the desire for development and wealth dominates discussions and the emphasis is
on the extraction of benefits for local people, financial compensation for loss of land
and resources, and improvements of infrastructure and services” (p.3). These
findings about the relationship between resource rents and conflict at the local level
in Melanesian mining regions suggest that something similar might be happening in
Peru. Thus, I will consider these three explanations in my enquiry into the
relationship between conflict and mining in Peru after the implementation of the
NEIS.
4.2.2 Literature on Peruvian cases
Social conflict has also attracted the attention of scholars in Peru. Most analyses of
conflicts around mining in Peru focus on a handful of emblematic cases, notably

− 82 −
those in Piura – Tambogrande and Rio Blanco – and Cajamarca.86 Local opposition
to new mining operations is the main cause of conflicts in Piura (Paredes, 2008;
Revesz, 2009a, 2009b). The situation in Cajamarca is more complex: the
prominent popular struggle against the expansion of the Yanacocha mine to Quilish
Hill is a rare, although symbolically and politically important, case of collective
opposition to mining. However, as some authors have pointed out, most opposition
to mining in Cajamarca does not involve radical opposition to mining per se, but is
an attempt to obtain satisfactory solutions to concrete, negotiable grievances and
expectations (Bebbington, Hinojosa et al., 2008; Bury, 2002; Lingan, 2008; Tanaka
& Meléndez, 2009).
Salas (2008) and Gil (2009) focus their studies on the initial stages of the Antamina
operation. Through a detailed ethnographic analysis they reveal how
disagreements about compensation packages and resettlement were shaped by a
complex combination of factors. They explain that the clumsy behaviour of the
company interacted with the interests of some leaders to provoke social conflict.
Both authors also point out that demands for financial compensation were already
mixed up with other types of discourse in the conflicts between the company and
the communities.
The core of the research into mining and conflict in Peru presents a coherent
narrative about the effects of mining on livelihoods. Extraction industries’
exploitation of mineral deposits generates local uncertainty about livelihoods and
the control of key assets such as water and land (Bebbington, Humphreys
Bebbington et al., 2008; Bebbington & Bury, 2009: 2-4; Bury, 2002).
Moreover, a series of institutional distortions characterise the interactions between
extraction companies and local populations who remain unconvinced of the
benefits of extraction. The state is generally eager to promote investment and is
86 There have been also studies on Tintaya (Cuzco), Antamina (Ancash), and Las Bambas (Apurimac). Tintaya is frequently portrayed as an example of successful negotiations between the company and the population through the mediation of national and international NGOs (Aroca, 2008; Echave de, Keenan, Romero, & Tapia, 2005). Antamina has attracted attention on account of its enormous scale and the company’s attempts to constructively engage with the local population (ICMM, 2007; Sanborn, Portocarrero, & Camacho, 2007). Finally, Las Bambas – still to commence construction – is expected to be the largest single mining investment in the history of Peru (Cooperacción, 2006; El Comercio, 2009; Gouley & Kuramoto, 2007).

− 83 −
therefore reluctant to enforce regulations that can upset the companies. This
arouses local suspicions of government collusion with company interests
(Bebbington, et al., 2007: 5; de Echave et al., 2009: 389-390). In this context, local
people conclude that open conflict is the only way to challenge the power of a de
facto state–business alliance (Bebbington & Bury, 2009).
Although these studies on different conflicts in Peru provide a solid foundation for
further enquiry into the topic, they collectively suffer three limitations. First, most
deal with the situation before 2006 – the year that mineral prices boomed and
social conflicts increased. Second, they focus on a handful of emblematic cases
without considering the existence of a greater variety of conflicts. Finally, they tend
to define mining conflicts as those involving active local opposition to the actions or
presence of a mining company, thereby missing the extent to which mining also
generates or exacerbates pre-existing conflicts within local society.
4.3 A new analytical framework for the study of the relationship between mining and conflict.
I argue that the implementation of the NEIS has changed the politics surrounding
mining issues and social conflict. In assessing this new situation, I propose an
analytical framework that takes into consideration two key aspects of the
relationship between mining and social conflict: (i) the identification of new mining-
related conflicts; and (ii) the relationship between intentions and legitimising
discourses. Before presenting this analytical framework, I review the main features
of the NEIS that have influenced the transformation of mining-related conflicts.
As stated in Chapter 1, the NEIS is a collection of policies aimed at counteracting
hostility towards extractive industries through the devolution of a portion of the rents
generated to populations living close to mines, and oil and gas wells. However, it is
important to note that the NEIS is not a precise set of policies that are strictly
implemented according to a well-defined ‘Washington Consensus’ type of plan.
Rather, it constitutes a flexible framework that has been applied differently in
different contexts. Generic political principles have been adapted in each country
according to the interests and relative power of the mining companies, national
government, political parties, and sub-national political movements (ICMM, 2006c).

− 84 −
Peru has adopted a radical version of the NEIS. An analysis of the case reveals the
logic behind this set of policies. Since 2002, sub-national governments of regions
and municipalities in which mines are located have received 50 per cent of the
corporation tax paid by mining companies to the national government. Additionally,
since 2006, the mining companies have become increasingly involved in the
promotion of local development through the Mining Programme of Solidarity with
the People (MPSP). Such a radical implementation of the NEIS results from the
confluence of three political factors.
First, the companies needed to respond to popular resistance to the construction of
new mines and the expansion of existing operations, which had threatened the
good prospects of the mining industry in Peru since the early 2000s. Second, the
increase in the percentage of tax distributed to sub-national governments was
considered to be an obvious step on the road to democratisation and
decentralisation impelled by the fall of the Fujimori regime. The weakness of central
government and the national parties vis-à-vis the mining industry and regional
political movements made this massive devolution of revenues politically viable.
Finally, in the middle of a boom in mineral prices, the growing dependence of the
Peruvian economy on its capacity to attract fresh investment in the mining sector
provided the companies with sufficient political leverage to consolidate a favourable
tax regime. In 2006, despite mounting popular pressure for a windfall tax and a
favourable international environment for the introduction of such a measure, Alan
Garcia’s government bowed to the demands of the mining companies and agreed
to set up the MPSP, an alternative voluntary contribution system directly managed
by the mining companies as an alternative to a new tax.
The Peruvian government and the mining companies operating in the country used
the changes in legislation for the distribution of the canon minero and the
introduction of the MPSP as a quick fix to avoid the revision of key aspects of the
mining industry. Popular mobilisations opposing mining expansion in
Tambogrande, Cajamarca and Moquegua in the early 2000s (De Echave et al.,
2009) signified the emergence of a new ethos that proclaimed the people’s right to
have a say in projects directly affecting their lives, and greater transparency in the
relationship between the state and private investors. However, the government and
the mining companies were concerned that allowing the public the power to decide
over future investments could jeopardise the viability of the industry. Then, they

− 85 −
modified the law that regulate the distribution of canon minero thinking that people
would be willing to exchange power for money. In a similar vein, the authorities
promoted the MPSP to block any revision of the mining tax regime.
Lastly, it should be emphasised that the NEIS encompasses two different types of
policy, which affect different actors and influence the polity though diverse
channels. On the one hand, fiscal transfers to sub-national governments are
implemented within the realm of state institutions. They require the active
collaboration of different departments and levels of government, which eventually
exposes problems with both the internal cohesion of the state and the relationship
between the people and the state. On the other hand, corporate social
responsibility (CSR) spending mainly concerns the companies and the populations
living around operations, while public institutions are rarely involved in such
transactions. This distinction between public and private channels and processes is
analytically useful in distinguishing different types of conflict (Chapter 6).
However, it is also apparent that public and private realms frequently merge in the
implementation of the NEIS. Mining companies tend to actively lobby for the
decentralisation of revenue to sub-national governments in order to gain the
support of local populations. In some cases, the companies even get involved in
institutional politics through their support for sub-national government capacity
building programmes. In parallel, CSR spending frequently results from political
negotiation between companies and the government over the granting of mining
rights; tax benefits; the more flexible enforcement of environmental legislation; or
other advantages to the companies. The resultant contracts between the
government and the companies have important political consequences. They tend
to erode the legitimacy of the state and transform CSR projects into compensatory
schemes for which the government become the ultimate guarantor.
4.3.1 The identification of new mining-related conflicts
The NEIS has reduced the incidence of genuine anti-mining social conflict; but it
has increased the total number of clashes in fuelling disputes over the distribution
of rent generated by the mines. Some of these conflicts can be included among the
already documented struggles between local communities, and mining and oil

− 86 −
companies in which the former try to capture a greater share of corporate profits
(Banks, 2005; Filer & Macintyre, 2006).
However, the NEIS has also generated a new type of middle ground conflict,
neither national nor local, that is yet to be studied. The decentralisation of mining
revenue has promoted such conflicts, in which the mining companies are generally
absent. Local communities, urban populations of small towns, regional social
movements, and public authorities at different levels of government are the main
actors. Mismanagement by local authorities; opposition to national government
policy; disputes among mayors, regional presidents and national ministries over
unfulfilled promises; and disputed claims over the delimitation of territories trigger
this type of conflict.
In order to detect the existence of these different types of conflict it is necessary to
challenge the appropriateness of the individual mining operation as the unit of
analysis. The emergence of new political dynamics at regional level; the distribution
of the canon minero to regional and local governments; the concentration of mines
in certain regions; and the proliferation of actors all make it advisable to take the
region itself as the entry point for our investigation. This is not to deny the
importance of local dynamics around particular mining operations but it helps to
place them in a broader perspective. Thus, I use this new unit of analysis to
undertake a comparative examination of the incidence of conflict across Peru’s
regions (Chapter 5) in which I test the capacity of mining rent to explain the
incidence of conflicts vis-à-vis the other competing explanations usually included in
the academic literature.
4.3.2 The relationship between intentions and legitimising discourses
The NEIS has increased the number of conflicts related to the distribution of mining
rent that is either in the hands of the companies or in the coffers of canon-rich sub-
national governments. However, these conflicts frequently appear in the guise of
the more radical anti-mining disputes that the policy is intended to reduce. The use
of a mixture of grounds and discourses on the part of local communities in their
claims against mining and oil companies is not new. Banks (2002, 2005), and
MacIntyre and Foale (2002) analyse the fusion of environmental, livelihood and
rent-seeking arguments in mining-related conflicts in Melanesia. The novelty in the

− 87 −
Peruvian case is that the use of the NEIS to avoid a substantial revision of key
aspects of the mining industry has promoted the blending of discourses in a way
that makes it more difficult for either the government or the companies to determine
the real intentions of the protesters. My analysis of two different types of conflict
illustrates the perverse influence of the NEIS.
Substantial corporate profits tend to foster popular demand for a wider
redistribution of mining rent; there is nothing new about that. However, the
government’s refusal to introduce a windfall tax has reinforced popular suspicion of
state subordination to corporate interest, modifying the way in which the population
conceives of and expresses its demands. In most conflicts between local
communities and companies, the protesters frame their demands not in terms of a
greater share in corporate profits, but as a compensation claim for both the money
that the companies do not pay to the state and the potential environmental damage
that the government is not willing to moderate. Moreover, the people frequently
ratchet up the pressure on the company by arguing that they oppose mining
activities. They resort to this more radical argument because they have not had the
chance to express their opinions on the issue, since the government has repeatedly
refused to guarantee their right to prior and informed consent to activities affecting
their lives. The result is an escalation of conflicts in which the ultimate goals appear
unclear to external observers.
Something similar occurs in a number of conflicts over the control and distribution
of the canon minero by sub-national governments. The populations around the
mines, and the local and regional authorities think of canon minero transfers as
compensation for the exploitation of their natural resources. Accordingly, they
perceive any attempt to modify legislation for the distribution of the canon that
seeks to equalise the transfers that are distributed to each region as an
unacceptable violation of their rights. Thus, they block such attempts by playing the
card of underlying popular opposition to mining that may only be appeased through
such compensation.
This strategy is effective because neither the government nor the industry can
afford to risk the emergence of widespread opposition to the expansion of mining in
the regions that host the main operations. The existence of such prevalent
opposition is not real. Their political significance notwithstanding, there are few

− 88 −
cases of genuine opposition to mining. However, the government paves the way for
the notion of widespread opposition to attain credibility by preventing people from
expressing their opinions through institutional channels.
In Chapter 6, I propose a typology of conflicts that helps to untangle the intricate
web of intentions, perceptions and legitimising discourses behind mining-related
social conflicts in Peru. Our analysis is consequently able to reach beyond the
stereotypical choice between ‘greed’ and ‘grievance’ (P. Collier & Hoeffler, 2004a)
to discover how each type of motive reinforces the other

− 89 −
Chapter 5
More money, more conflict
Between 2005 and 2008, social conflicts became more frequent in Peru.
Observers of Peru already know that and many also suspect or believe that an
increase in conflicts around mining areas was the main cause of the overall
increase. I confirm that suspicion by analysing a data set on social conflict built with
information from the Ombudsman’s office (Section 5.2). In Section 5.3, I build an
index of the incidence of social conflict derived from the same source to determine
the statistical correlates of (i) cross-sectional variations among regions in the
incidence of social conflict and (ii) how those statistical patterns evolved in the
period 2005−2008. It is here that my conclusions begin to diverge substantially from
existing views, both popular and academic. There appears to be a strong statistical
connection between mining and conflict. It is however indirect. It is not that changes
in the levels of mining activity ‘explain’ – in a statistical sense – changes in the
frequency of social conflict. It is rather that changes in the levels of canon minero
transfers to sub-national governments explain changes in levels of conflict. These
transfers are allocated through formulae that concentrate them in municipalities and
regions where mining takes place (see Section 1.3). They are proportional to the
profits of the mining companies that, in turn, are tightly associated with the
international market prices for copper, gold, silver, zinc, lead, tin, etc. When those
prices go up sharply, as they did in 2004−2008, sub-national government revenues
also increase rapidly.
Through the analysis of regional variation in the incidence of conflict over the period
2005-2008, my study reveals that the strong statistical link between mining and
social conflict does not seem to be a direct connection from mining to conflict.
Mining generates rents; central government appropriates a small proportion of
these, leaving the rest to the companies, and returns a high proportion of its ‘take’
to sub-national governments in mining areas. It is the per capita level of these rent
transfers that best explains both cross-section and time series changes in the
incidence of social conflict.

− 90 −
In Section 5.1, I present my data base on social conflict. In Section 5.2, I use it to
demonstrate that it was mainly an increase in mining conflict that accounted for the
overall increase in social conflicts over the period 2005-2008. In Section 5.3, I
show that canon transfers at sub-national level is the variable that explains the
relationship between mining and conflict.
5.1 The dataset
The pioneers in the social science analysis of conflict in Peru compiled datasets on
contentious events from information published in national newspapers (Garay &
Tanaka, 2009; Muñoz, 2006).87 These datasets have made possible some
insightful research; however, they have several limitations. The coverage of
incidents is almost certainly incomplete because reporting reflects the partisan
political biases of the newspapers. And, because different scholars define conflict
differently, or are interested in different phenomena, there are very different
estimates of conflict incidence. For example, for the period 1995–2005, Gray and
Tanaka identify more than 5,000 cases, while Munoz identifies less than 250.
Since 2004, the office of the Peruvian Ombudsman has been publishing monthly
reports on social conflicts (Defensoría del Pueblo, 2009). There are four reasons
that make these reports a very good basic source of data. First, the Ombudsman’s
office has clear criteria for deciding whether an incident is classified as social
conflict. Second, the Ombudsman has offices in every region of the country and a
clear internal procedure for the selection of reported cases to reduce the risk of
bias.88 Third, the offices of the Ombudsman report facts rather than opinions.
87 Garay and Tanaka compiled articles directly from three national newspapers (La República, El Comercio and Expreso) covering the period 1995–2006. Alternatively, Muñoz used a pre-existing collection of articles that had been compiled weekly by the Centre for the Promotion and Study of Development (DESCO, 2009) through a digest of the same three national newspapers over the period 1980–2005. Finally, CLACSO (Latin American Council of Social Sciences, 2009) publishes an alternative anthology of social conflicts in Peru, which has been compiled monthly since 2000, although this collection seems to rely heavily on the weekly DESCO digest. 88 The procedure for the selection of cases involves intervention at regional level; media digests; occasional direct information from actors involved in conflicts; and the final decision of a committee in Lima that guarantees consistency. The authenticity of these procedures was personally cross-checked in interviews with Jairo Rivas (person responsible for the design and direction of the first reports; 2008-003, Lima 05-04-2008); Rolando Luque (director of the Social Conflict Unit of the Ombudsman; 2008-014, Lima 11-04-2008); Raquel Alvarez (representative of the Ombudsman in Pasco; 2008-031, Pasco 24-04-2008); Porfirio Barrenechea (representative of the Ombudsman in Ancash; 2008-09, Huaraz 17-06-2008); and Hernán Cuba Chavez (representative of the Ombudsman in Moquegua; 2008-170, Moquegua 25-08-2008).

− 91 −
Fourth, the office keeps records containing detailed information of individual
clashes. Other researchers have used this data set recently (Caballero, 2009;
Panfichi, 2009). I decided to do the same, but did extensive work on the raw data to
produce more sophisticated and relevant measures of social conflict.
Caballero (2009) and Panfichi (Panfichi, 2009) work with monthly snapshots of the
incidence of conflict in the country, but provide no information about the evolution of
individual conflicts over time nor any overall measures of the duration or intensity of
particular conflicts. Neither do they consistently compare geographical variations in
conflict incidence. Using the data from the Ombusman’s reports, I reviewed all 374
social conflicts reported monthly by the Ombudsman from 2004 to 2008, identifying
where they occurred, when they started, how long they lasted, and how severe they
were according to an objective scale (Table 5.1). I then codified each conflict
according to three different classifications: types of main actor involved (indigenous
groups, rural population, etc.) (see Figure 5.2); the causes and motivations of the
conflict (environment, policies of the national government, etc) (see Figure 5.3);
and whether and how it related to mining or to the extractive industries more
generally (see Appendix V for the definition of categories and criteria). In the next
section I use this information to characterise the conflicts during the research
period and determine to what extent they are directly related to mining activities.
Second, I constructed an ‘annual conflict incidence index’ (ACII) for each of the 25
regions of Peru. First, I counted the number of active and dormant conflicts
reported monthly by the Ombudsperson for each region.89 Subsequently, I used
these data to calculate the index so that the incidence of conflict was comparable
between regions: (i) I assigned a weight of three points to each active conflict and
one point to each dormant one; (II) I calculated the index monthly and aggregated it
to an annual figure; finally; (iii) I normalised the index according to the population of
the region to reflect the incidence of conflict per million people. I calculated the ACII
for each region of Peru for the years 2005, 2006, 2007 and 2008.90 ACII is thus not
89 The report classifies conflicts as either active or dormant depending on their level of activity during the month of the report. A conflict has to be without continuously dormant for a year before it is removed − even if not formally resolved − from the data. 90 2004 data were excluded, as inconsistencies in the methodology of the initial reports were detected. I also excluded Callao region from my analysis, as it has now been absorbed into the metropolis of Lima, thus, there were no individual conflicts reported in Callao itself between 2005-2008. Moreover, the ACII scores are only meaningful in the context of comparison over

− 92 −
a simple calculation of the number of conflicts relative to population, but also
incorporates a measure of the duration of conflicts.
I incorporated the ACII into a comprehensive nationwide dataset including also
welfare, economic, budgetary, and political indicators for the 25 regions of the
country for the period 2001−2008. I use this dataset in Section 5.3 to analyse the
factors influencing the variation in the ACII across the different regions.
5.2 Main features of social conflict in Peru (2004-2008): the growing importance of mining
Despite the core position of social conflict in current Peruvian politics (The
Economist, 2008), there is little systematic understanding of (i) who the actors are;
(ii) their motives; (iii) how long conflicts last; (iv) how intense they are; and, finally,
(v) whether there is any significant link/correlation between all these factors. My
aim in this section is to analyse these features of conflicts in Peru and to determine
how they changed from 2005-2008.
I discovered that, from 2005–2007, the number of new conflicts remained stable
each year but the number of unresolved conflicts increased (Figure 5.1). However,
new conflicts directly related to mining increased threefold and constituted 56 per
cent of all new conflicts in 2007 (Table 5.1). The unusually large number of new
conflicts in 2008 seems to represent the eruption of a more generalised wave of
protests (Tarrow, 1998).
space and time within Peru; they are not expressed in units that could be used to make rational comparisons with other countries.

− 93 −
Figure 5.1 Comparison of the number of new conflicts breaking out year by year with those reported to be in progress in the last month of each year (2004–2008)
Source: (Defensoría del Pueblo, 2009).
Table 5.1 also shows that there was no difference between the intensity of mining
and non-mining conflicts, but that the former tended to last significantly longer.
Thus, two factors lay behind the generalised perception of the growing incidence of
mining-related conflicts: they were more frequent among new conflicts and they last
longer. The stock of unresolved mining-related conflicts is building up.
0
50
100
150
200
250
2004 2005 2006 2007 2008
Number of new conflicts breaking out
Number of conflicts in progress in the last month of each year

Table 5.1 Number, intensity and duration of social conflicts in Peru, by year of outbreak and connections with mining
2004 2005 2006 2007 2008 Total 2004–2008
Mining Other Mining Other Mining Other Mining Other Mining Other Mining Other
Number of conflicts breaking out annually
9 84
9 44
18 37
30 24
48 71
113 261
Average intensitya of conflicts each year*
3.9
(1.4) 2.6
(1.3)
2.7
(0.5) 2.6
(1.1)
2.6
(1.4) 2.8
(1.5)
2.7
(1.2) 2.7
(1.4)
1.6
(1.2) 1.4
(0.7)
2.3
(1.4) 2.3
(1.3)
Average durationb of conflicts breaking out each year (months)*
27.1
(17.2) 10.9
(12.1)
27.6
(14.0) 8.2
(7.7)
12.7 (8.8)
6.8 (6.8)
* Standard deviation in brackets.
a Each conflict is gauged according to its most severe manifestation on a scale ranging from 1 to 5: (1) popular mobilisation that threatens to disrupt public services; (2) disruption of public services, and/or blockade of roads and other basic infrastructure, and/or interruption to local governance, and/or confrontation with the police, without injuries being sustained; (3) destruction of public infrastructure or other material assets, and/or cases of minor injury, and/or occupation of private premises; (4) serious endangerment to life or physical well-being, including hostage-taking; (5) Serious injuries or deaths. b The duration of conflicts breaking out in 2007 and 2008 have not been taken into consideration because a high percentage of them were reported as either still being active or as dormant at the end of 2008.
Source: (Defensoría del Pueblo, 2009).

− 95 −
Most of the active conflicts during 2004–2008 were located in rural areas. The main
actors were indigenous communities and local populations, although local and
regional governments played an increasing role (Figure 5.2). However, the
ruralisation of conflict did not mean localisation. Changes in the motives for conflict
are summarised in Figure 5.3. Strictly local issues relating to the actions of sub-
national governments became less significant. By contrast, issues concerning
central government policy, the environment and the behaviour of mining companies
became more prominent. The accumulation of (longer-lasting) mining conflicts was
one aspect of the overall conflict situation in Peru. Another was the apparent
ruralisation of conflict because of the increasing focus on mining. The third was a
relative shift in focus, from issues about the behaviour of sub-national authorities to
issues concerning national policies, the environment, behaviour of companies, and
territorial boundaries. The main local actors in these rural conflicts became
increasingly disconnected from national political parties (Chapter 3).
Figure 5.2 Conflicts by principal actor 2004−2008 (number of conflicts and percentage of total)
Notes: total number of conflicts indicated in columns. Source: Defensoría del Pueblo; adaptation by the author.
.
38 25 2532
56
38 15 176
21
52
57
13
24
28
17
5 2 21
75 4 3 51 1
0%
10%
20%
30%
40%
50%
60%
70%
80%
90%
100%
2004 2005 2006 2007 2008
Indigenous groups and rural population Urban population
Local and regional political authorities Trade unions and workers' organisations
Business associations Students
Other

− 96 −
Figure 5.3 Conflict by motive 2004−2008 (number of conflicts in each category and percentage of total)
Notes: total number of conflicts indicated in columns. Source: Defensoría del Pueblo; adaptation by the author.
5.3 What factors explain regional and temporal variations in conflict?
Table 5.1 makes a clear distinction between conflicts directly related to mining and
those that were not, by looking at the overt causes of each case. This procedure is
to some degree problematic because it does not take into consideration the
possibility that mining might cause or exacerbate existing conflicts in indirect or
relatively invisible ways. For example, in addition to the conventional claims about
environment damage and changes in livelihoods, mining could increase social
conflict by fostering migration and changes in social relationships, or by promoting
political competition, especially over access to and control of the rents that have
increasingly been re-directed to local governments in mining regions. Conversely, it
is also possible that conflicts that appear to be about mining might also be caused
or exacerbated by non-mining factors.
Another way of examining causation is to see how far variations over time and
space in the incidence of conflict – as measured by my ACII – correlate in a
statistical sense with various direct and indirect measures of mining and its
46 5
9 21
6425
239
27
2
69
1220
43 7
10 26
11
2 5 713 8
8 9 165 4 1 2
0%
10%
20%
30%
40%
50%
60%
70%
80%
90%
100%
2004 2005 2006 2007 2008
National legislation or state policy Sub-national authorities' behaviourBehaviour of companies EnvironmentLabour issues Delimitation of territorries Other

− 97 −
consequences. I do that in this section using panel data for each of Peru’s 24
regions for each of the years 2005−2008.91
The results confirm the relationship between conflict and mining, but they also
show that the volume of canon minero transfers to sub-national governments of the
regions is highly associated with an increase in conflict in the period 2005-2008.
These findings complement the conventional interpretation of the relationship
between mining and conflict, and, significantly for the aim of this thesis, they reveal
that the NEIS not only fails to reduce conflict, but seems to have caused an
increase.
I use multiple linear regression to explain variation of ACII across Peruvian
regions.92 The ACII varied widely among the Peruvian regions: taking the figures for
the years 2005-200 collectively, the average ACII for the whole country was 277,
but this varied from zero in Tumbes region to 1,956 in the mining region of
Moquegua. I then tested hypotheses for the factors that were most likely to be
associated with differences among the regions in terms of the incidence of conflict.
Due to the relatively small number of observations in the dataset I kept the models
as simple as possible by incorporating a reduced set of variables for each model. In
the first set of models I tested the influence of poverty in combination with four
mining-related variables that capture different ways mining may directly or indirectly
cause conflict: 93
(i) Percentage of the regional population below the poverty line in terms of
income measured against a region-specific variable demarcation of poverty.
(ii) Annual canon minero transfers per capita at current values, as a proxy for
mining rent.94 This variable directly accounts for the total amount of canon
91 I excluded Callao from the analysis. 92 I use a Random Effects (RE) panel regression model to analyse the panel data set. This method is the best possible way of dealing with the problems of the serial correlation and heteroskedasticity of the panel. I ruled out the use of the more conventional Panel Corrected Standard Errors (PCSE) models to correct for serial correlation because the number of regions in the panel is very much larger than the number of years (Beck, 2001; Beck & Katz, 1995). In the case of panel with this type of structure (N>T), Wooldridge (2002:490) proposes the use of RE models to solve the problems of serial correlation. Additionally I compute the regression with robust standard errors adjusted for clustering on regions to correct heteroskedasticity. I use the XTREG command in STATA with the option ‘r’ to correct these problems. 93 See appendix VI for a complete description of variables. 94 Year-by-year regional populations have been calculated taking 1993 as the base year and using the population growth rate between 1993 and 2007 for the interpolation.

− 98 −
minero transfers accrued by the local government and municipalities of each
region. However, owing to the formula for distributing the canon, the figures
also strictly correlate with the profits of the mining companies operating in the
region.
(iii) Percentage of mining production in relation to total regional GDP at constant
1994 prices, as a proxy for the level of mining activity. This indicator relates to
factors directly linked to physical activity such as the actual environmental
impact of an operation.
(iv) Percentage of the total area of the region for which companies hold mining
rights, as a proxy for future prospects for mining activity. The process of
granting mining rights to the companies involves a sequence of administrative
events that rarely have an immediate impact on the ground. However, they
generate both expectations and uncertainties when the population in the
affected regions knows that these rights have been granted.
(v) Regional level investment by mining companies in the exploration and
construction of new mines and the expansion of existing operations is the
best available proxy for the physical expansion of mining activities. This
indicator captures the actual expansion of mining activities on the ground and
the related impact on the control of land and water.
To test change over time, I used two different and complementary methods. First, I
introduce year dummies into the models to detect significant variations due to time-
specific factors. Second, I undertook a year-by-year OLS cross-sectional
regression analysis to study the evolution of significant variables and coefficients
over time. To prevent extreme values driving the results, I calculated the log of
annual transfers, mining GDP and the ACII variables.
The figures in Table 5.2 summarise the results of five different models. The first
model explains for 35 per cent of the variance in the ACII. Two variables, the
incidence of poverty and the level of per capita canon minero transfer positively
correlate with the ACII in a statistically significant fashion. Models 2 and 3 continue
controlling for the level of poverty but substitute the per capita canon transfers for
two other mining-related variables that capture ‘mining expansion’: the level of
investment by mining companies in the region, and the percentage of the total area
in the region for which companies hold mining rights. Both variables are also

− 99 −
statistically significant when tested independently, although the level of mining
investment only at the 10 per cent level. Moreover, the explanatory power of these
two models is slightly lower than the first model. These three mining-related
explanatory variables lose statistical significance when they are jointly introduced
into the model. A high degree of collinearity among them is responsible for this
effect.95
Clarification of the relationship between these proxies for ‘mining expansion’ and
the amount of canon transfers is crucial to a better understanding of the underlying
process. In theory, the three variables capture quite different processes. However,
the mechanism for the distribution of the canon minero transfers establishes a link
between the three. Canon minero transfers to local and regional governments are
based on the previous year’s profits for the mining companies operating in the
region.96 Such profits have a twofold influence. On the one hand, they tend to boost
company investment at the site of the mine and in adjacent locations in subsequent
years.97 On the other hand, the existence of large, highly profitable operations in a
particular region is an indicator of mineral richness, which attracts the attention of
other companies and increases the number of mining rights allocated in that region.
Thus, I argue that in the context of the increase of mineral prices, these two
variables – the level of investment by mining companies and the area for which
companies hold mining rights – are themselves a consequence of the increase in
mining profits generated in the region. As the canon transfer variable is a direct
proxy for profits, I decided to keep it within the basic specification to test other
explanatory variables.
95 Pearson correlation coefficients for these variables: Canon minero transfers – mining investment in the region = .83 Canon minero transfers – area under mining rights = .62 Area under mining rights – mining investment in the region = .68 96 Canon minero transfers account for 50 per cent of corporate income tax, which in turn is 30 per cent of a company’s annual profits. 97 Two methodological notes: First, in the mining industry, a flow in the other direction – from more investment to greater profit in subsequent years – does not apply because profit is heavily dependent on mineral prices, which are quite difficult to forecast in the short term. Second, the temporal relationship between profit and investment necessitates a lapse of a year in the investment variable. However, as the canon minero transfer in any given year is based on company profits for the previous year, both variables – transfer and investment – are already contemporaneous.

− 100 −
In contrast to the variables discussed so far, the level of mining activity captured by
that of ‘mining as a percentage of total regional activity’ does not have statistical
significance in any of the three models. This reduces the importance of the mere
increase in mining activity – and its associated negative environmental impacts –
as a determining factor for the escalation of conflicts. This finding is consistent with
more direct evidence: in mining regions such as Cajamarca, Tacna, Moquegua and
Cusco where conflict has increased although the level of mining activity has not
changed significantly in recent years.
To summarise, the first three models (Table 5.2) reveal that in addition to the
incidence of poverty, there are four other factors – all associated with the amount of
mining rent – that may account for variance in conflicts among regions: (i) the
redistribution of rent at regional and municipal level through canon minero
transfers; (ii) company profits in the previous year; (iii) the expansion of mining
operations through the investment of a portion of the profits; and (iv) the
expectation that new mining companies will come into the region. In the next
chapter I discuss the possible mechanisms through which these factors increase
the incidence of social conflict in mining regions.
Model 4 controls for temporal variation through the introduction of time dummies.
This model explains a larger proportion of the variation in the ACII across regions −
49 per cent−, while the two variables previously relevant remain statistically
significant. However, in the case of the 2008 data, the time dummy itself is
statistically significant. This implies that there were other factors associated with
this year that are not incorporated into the model, but which are also important in
explaining the variation in the ACII.
Estimates of model 5 help clarify the underlying dynamics. They reveal the
changing relative importance of the two main explanatory variables over time. In
2005, the level of poverty was the only statistically significant independent variable.
However, in 2006, the levels of poverty and per capita canon minero transfer were
both associated with the incidence of conflict in a statistically significant manner.
The same was true in 2007, but by now – according to the regression coefficients –
the level of canon minero transfers appears to be the more significant driver of
conflict.

Table 5.2 Regression of poverty levels and mining-related variables on the incidence of conflict by region (2005–2008)
Dependent variable: Log of per capita annual conflict incidence index (ACII)
Time frame Panel data 2005–2008
Panel data 2005–2008
Panel data 2005–2008
Panel data 2005–2008
Year by year
2005 2006 2007 2008
Model specification Model 1
Random-effects GLS regressiona
Model 2 Random-effects GLS regressiona
Model 3 Random-effects GLS regressiona
Model 4 Random-effects GLS regressiona
Model 5
OLS (rse) OLS (rse) OLS (rse) OLS (rse)
Constant .745
(.245)*** .896
(.273)*** .689
(.272)** .337
(.241) .241
(.404) .353
(.329) .517
(.331) 1.283
(.438)***
Percentage of poverty .014
(.004)*** .012
(.004)*** .012
(004)*** .018
(.004)*** .026
(.006)*** .018
(.004)*** .014
(.005)*** .010
(0.006)*
Mining as percentage of GDP (constant prices)
-.011 (.009)
-.006 (.010)
-.001 (.008)
-.007 (.008)
Log of canon minero per capita
.311 (.105)***
.228 (.111)**
-.153 (.122)
.248 (.094)**
.328 (.094)***
.236 (.101)**
Log of investment in mining activities
.237 (.126)*
Area under mining rights
.028
(006)***
t2006 .156
(.143)
t2007 .253
(.171)
t2008 .721
(.195)***
R2 .35 .26 .29 .49 .57 .58 .56 .36 N 96 96 96 96 24 24 24 24 a Standard errors are adjusted for clustering in regions; Notes: standard errors in parenthesis; *** significant at 1% level; ** significant at 5% level; * significant at 10% level.

− 102 −
The degree of statistical link between level of canon minero transfer and incidence
of conflict increased markedly over the period 2005–2007, with the level of poverty
playing a steadily diminishing role (Figures 5.4 and 5.5). However, in 2008, as
model 4 reveals, there was a shift in this trend. Although the levels of poverty and
per capita canon minero transfer (i.e. mining rent) remain statistically significant
and explain a notable degree of variation in the ACII, the regression coefficients
and the level of significance show that the two variables lose explanatory power in
comparison with previous years. In the same fashion, the differences in the
intercept coefficients indicate a general rise in the incidence of conflict consistent
with the descriptive statistics in Table 5.1 revealing a general increase in the level
of conflict in the country.
Figure 5.4 Correlation between canon minero transfers per capita and ACII at regional level in the period 2005–2008
01
23
01
23
0 1 2 3 4
0 1 2 3 4 0 1 2 3 4
2005 2006 2007
2008 2005 -2008 Total
Regions 95% Confidence interval Fitted values
Canon minero transfers per capita (log)

− 103 −
Figure 5.5 Correlation between poverty and ACII at regional level in the period 2005–2008
To complement the analysis and to test the robustness of the results I introduced
other variables into the basic model. They are proxies for alternative factors that
might influence the incidence of conflict. I have clustered these variables in three
thematic groups that I tested independently to maintain the simplicity of the models:
(i) Type of region: dummy variables for four different types of region. I modified
the conventional trio of natural Peruvian regions – coast, Andean highlands
and Amazonian lowlands – to include a fourth mixed terrain type comprising
both coastal and mountainous areas.
(ii) Features of the population: (a) dummy for indigenous populations of above 20
percent; (b) percentage of the total population who migrated to the region
between 2003 and 2007; (c) percentage of the economically active population
for whom agriculture is the main occupation; and (d) percentage of the
economically active population with mining-related jobs. These act as proxies
for the degree of social change, economic dynamism, and the social
importance of each economic sector, respectively.
01
23
01
23
20 40 60 80 100
20 40 60 80 100 20 40 60 80 100
2005 2006 2007
2008 2005 - 2008 Total
Regions 95% Confidence Intervale Fitted values
Poverty level

− 104 −
(iii) Political variables: percentage of votes for the winning party in regional
elections, as a proxy for the legitimacy of the regional government. In
addition, I introduced dummies for (a) electoral participation in regional
elections, as a proxy for institutionalised political mobilisation; and (b) support
for a radical candidate in the first round of the presidential elections of 2006,
as a proxy for ideological position.
The figures in Table 5.3 summarise the results of these three complementary
models. As in the previous models, the level of mining activity captured by that of
‘mining as a percentage of total regional activity’ at constant prices does not have a
consistent effect on the variation in the incidence of conflict across regions.
Meanwhile, poverty and canon minero transfers remain strongly significant in all
three models, and their coefficients and standard errors remain reasonably stable,
supporting the robustness of the previous results. However, the rest of the
variables included in these models do not have any statistically significant effect.
Model 6 shows that the estimates for the main variables remain stable when
controlled for regional dummies. This means that independent of the type of region,
the incidence of conflict correlates to poverty levels and the amount of canon
transfers per capita accruing to the sub-national governments of the region. This
reduces the possibility that other underlying structural features of the regions drive
the correlation between the two variables and the incidence of conflicts.
Model 7 does not indicate any positive significance of variables linked to specific
features of the population. The percentages of Indigenous population and the
workforce in agriculture control for some important general features of the regions.
Neither have any effect on the incidence of conflict. The other two variables
included in this model − the level of migration into the region and the percentage of
people working in the mining sector − help to test alternative ways mining might
influence the incidence of conflict. They are proxies for the effect of mining-induced
social change and potential miners’ strikes respectively. These two variables are
not statistically significant either.
Finally, the political variables of model 8 are also unimportant. It is worth noting that
even support for the radical candidate in the 2006 presidential elections has no

− 105 −
statistical significance, throwing a lot of doubt on the government’s claim that
radical ideologies are frequently the driving force behind civil unrest.
Table 5.3 Complementary regression models of canon minero transfers, poverty levels and other variables on the incidence of conflict by region (2005–2008)
Dependent variable: Log of per capita annual conflict incidence index (ACII)
Time frame Panel data 2005–2008
Panel data 2005–2008
Panel data 2005–2008
Model specification Model 6
Random-effects GLS regressiona
Model 7 Random-effects GLS regressiona
Model 8 Random-effects GLS regressiona
Constant .591
(.282)** .594
(.373) .453
(.454)
Mining as percentage of GDP (constant prices)
-.013 (.009)
-.010 (.009)
-.011 (.010)
Log of canon minero per capita .425
(.106)*** .321
(.127)** .302
(.129)**
Percentage of poverty .013
(.006)** .016
(.007)** .017
(.006)***
Region Amazon .009
(.246)
Region Andean .395
(.244)
Region Mix Andean-Coastal -.108 (.269)
Indigenous population above 20% -.063 (.214)
Migration to region in 2003–2007 above 12%
.154
(.234)
Percentage of workforce in agriculture
.030 (.196)
Percentage of workforce in mining -.090 (.194)
Electoral turnout higher than 85% .133
(.167)
Radical vote above 50% -.170 (.240)
Percentage of vote captured by winner in regional elections
.003 (.008)
R2 .37 .36 .37
N 96 96 96 aAll standard errors are adjusted for clustering in regions Notes: standard errors in parenthesis; *** significant at 1% level; ** significant at 5% level; * significant at 10% level

− 106 −
The description of conflicts in Section 5.2 and the multivariate analyses in this
section provide a consistent interpretation of the growing incidence of conflict
undermining the stability of Peruvian polity. At the beginning of the period under
study, conflict correlated with poverty, but the increase in mineral prices and the
associated dramatic increases in rent and canon minero have tended to multiply
the incidences of conflict in mining regions receiving large amounts of transfers.
The quantitative analysis downplays the importance of other possible causes that
appear in the literature. Thus, neither the level of mining activity in the region nor
mining-induced social changes have any statistically significant effect on the
incidence of conflicts. Moreover, although the variables relating to the expansion of
mining activities are statistically significant, I argue that the effect of mining
expansion at regional level is a consequence of the generation of rents in the
region. These results show that the implementation of the NEIS did not reduce the
incidence of conflicts. On the contrary, it seems to have increased them.
These powerful results present a different picture from what the government,
mining companies and social movements currently believe. However, I did not just
rely on the analysis presented in this chapter of data derived from the
Ombudsperson’s reports. I undertook extensive field research in three mining
regions to look in more detail at social conflict. The next chapter presents the
results. The field research confirms the importance of mining rents and canon
minero transfers in stimulating conflict, and reveals the channels and mechanisms
through which this happens.

− 107 −
Chapter 6
How the NEIS multiplied conflicts: a local perspective
On 8th of January 2010, I received a rather unusual e-mail. The public relations
manager of Southern Peru Copper Corporation (SPCC) had included in his
distribution list a personal reflection on Avatar, the recently released James
Cameron movie. He appeared to be incensed that the film would further damage
the already poor reputation of the mining companies. Therefore, he tried to
counteract this perniciousness by pulling to pieces the idea that an idyllic planet like
Pandora, the world of the Na’vi people where all the living creatures are symbiotic,
nurturing a benign and holistic web of life, whose survival is threatened by an evil
mining company trying to exploit a valuable mineral was at all plausible. Thus, he
added Hollywood with its ‘wild imagination’ to the usual enemies of the mining
industry. His arguments sounded both desperate and as naive as Pandora itself.
But his sense of outrage prompted me to immediately see the film.
Although my uncritical side enjoyed the exuberance of the special effects, and I
could not avoid remembering the struggle of my Awajun friends mentioned in
Chapter 1, I had to admit that Avatar was a fantasy and the plot disappointingly
clichéd. However, my dissatisfaction with the film stemmed from a different point of
view from that of the corporate e-mail. When I started working with the Awajun
people in 1991, my friend Santiago told me that portraying the indigenous people
as collectively virtuous and their culture as completely harmonious was one of the
worst forms of racism. Avatar exhibits a similar kind of prejudice, in that the Na’vi
have been depicted as collectively virtuous, but helpless and in need of the
intervention of an external saviour – coming of course, from our own dominant
Western Civilisation – to defend their world.
There are close parallels between some interpretations of conflicts around mining
in Peru and the plot of Avatar: the tendency to view resistance to mining as
spontaneous defence, untarnished by material motivation, politics or strategic
calculation of an indigenous life-style and the natural environment.
During my field research I witnessed tragic cases of environmental disaster and
also genuine popular struggles against the construction of new mines due to the

− 108 −
fear of losing livelihoods and being left worse off (Section 6.2). These conflicts are
highly important because they shape the features of all conflicts that have been
labelled ‘mining-related’. The existing literature gives the impression that most
conflicts around mining in Peru are of this kind. In contrast, I wish to argue that
these Avatar-type conflicts are neither the only type of contentious actions nor are
they now the most numerous. Instead, the implementation of the New Extractive
Industry Strategy (NEIS) has generated more complex disputes over the
distribution of the rent generated by the mines.
As I explained in the introductory chapter, the issue of mining rents is highly
political. Rents are economic surpluses that tend to attract the attention of
(competing) rent-seekers who employ political means to get a share. After the
implementation of the NEIS, peasant communities, municipal and regional
authorities, regional movements, and ‘defence fronts’ in mining areas engaged in
social conflict to gain political leverage in the negotiations over the distribution of
the mining rents. In addition to the ‘Avatar-type’, my field research led me to identify
two other types of conflict directly related to disputes over rents. I have labelled the
first ‘enhancing bargaining power’, whereby peasant communities seek to obtain a
share of mining rents directly by claiming some form of economic compensation for
the adverse impact of mining. The perception that government policies allowed the
companies to retain an unfair share of the profits, the increasingly influential role
the state has granted to the companies in the mining regions, and the companies’
use of Corporate Social Responsibility (CSR) schemes provide the communities
with incentives for making claims against the mining companies (see Section 6.3).
‘Seeking decentralised revenue’, is the second type of ‘distributional’ conflict. It pits
citizens, authorities, and administrative jurisdictions against one another around
access to and use of natural resource revenues transferred from central
government (Section 6.4). These two new types of conflict accounted for the
majority of new mining conflicts during the period 2005−2008.
In the following sections, I first outline the typology of conflict that I developed
(Section 6.1). Second, I review the defining features of ‘anti-mining’ conflicts –
those in which local populations challenge the establishment of new mining
operations or the expansion of old ones. I present the main features of these
conflicts as the benchmark for comparison with the new types of conflict (Section
6.2). Third, I use examples from Ancash, Pasco and Moquegua to illustrate how the

− 109 −
peasant communities closest to the mines use the narratives and protest repertoire
of the anti-mining movement to improve their bargaining power with the mining
companies and increase their access to mining benefits (Section 6.3). Fourth, I
explain how canon minero transfers have increased the incidence of conflict in
mining regions through three different mechanisms: (i) by creating unrealistic
expectations that municipal and regional authorities cannot fulfil; (ii) by pitting
different levels of government against each other in an attempt to divert popular
anger; and (iii) by promoting the confrontations in municipalities and regions that
claim jurisdiction over mineral deposits and sources of water (Section 6.4). Finally, I
draw some conclusions about the relationship between social conflict and mining.
6.1 A typology of mining-related social conflicts
From my field research, I found that three different types of mining conflict
coexisted in the period 2004–2008. First, there were well known conflicts in which
the local population opposed mining on the grounds of its negative impact on the
environment and their livelihoods. Second, there were cases in which local
communities adopted conflict as a tactic to gain bargaining power and negotiate
more generous economic compensation from the mining companies. And third,
conflicts caused by the canon minero transfers. My argument is that the
implementation of the NEIs increased conflicts of the second and third types.
As Table 6.1 illustrates, I have constructed my typology on the basis of claimants’
intentions. Obviously, this kind of representation is a simplification, and some
specific cases cannot easily be allocated to one category or another – a standard
problem in conflict analysis. However, I believe the analytical value of distinguishing
between types of conflict outweighs the limitations of the procedure because it
allows a more detailed analysis of causality through the comparison of the different
types.

− 110 −
Table 6.1 Typology of social conflicts in Peruvian mining regions
Conflict Type Intention Actors
Type 1 Anti-mining movements
Attempts to stop the exploitation of new mines, or the expansion of currently operating ones.
Principal: Mining companies and peasant communities.
Others: National government, ombudsman, national and international NGOs.
Type 2 Enhancing bargaining power
Strategy for the preparation of a negotiation process with the company regarding compensation.
Principal: Mining companies, peasant communities, and population of the municipalities close to the mines.
Others: Regional representative of the ombudsman.
Type 3 Seeking decentralised revenue
Control and use of canon minero transfers.
Principal: Defence fronts, social organisations, and different levels of government.
Others: Rarely present.
In Peru, there is a general perception that in mining conflicts, peasant − and
sometimes indigenous − communities confront mining companies. The
Ombudsman’s report on social conflicts places all of them in a single category
labelled ‘socio-environmental’ conflicts (Defensoría del Pueblo, 2009). I consider
that this classification is not analytically helpful because it includes at least two
different types of conflict: ‘anti-mining’ (Type 1) and those seeking greater
‘bargaining power’ (Type 2). These two types of conflict differ in the intention of the
claimants and the degree of involvement of different actors. Conflicts of the first
type are concerned with companies’ actual or attempted appropriation of local
resources, especially land, water and unpolluted local environments and the
attempts of peasant communities to resist the expansion of mining. Although
communities and companies are the principal actors, a wide array of other actors
participate in the conflict in support of one or other, or in trying to broker
agreements.
Conflicts seeking greater bargaining power (Type 2) are more tactical. Peasant
communities used social conflict as a means to open up negotiations with the
companies regarding increased financial compensation for the use of land and

− 111 −
water, corporate investment in social projects, and employment opportunities in the
mines. They know that beyond the legitimacy and fairness of their claims, their real
bargaining power lies in their capacity to disrupt the work of the mines and to
tarnish the reputation of the companies. The failure to differentiate between these
two types of conflicts leads to erroneous diagnoses of the problems.
The third category of conflicts has generally been overlooked. I argue that in
regions receiving a high volume of canon minero transfers, political disputes over
the control and use of these financial resources have generated a specific type of
conflict that I label ‘seeking decentralised revenue’ (Type 3). This type differs from
the anti-mining conflicts both in terms of the actors involved and the motives for the
protest. First, there is a wider set of actors who initiate and get involved in these
conflicts - local communities, the urban population in small towns, and local and
regional political authorities. Second, their most explicit claims are not directly
related either to the mining activity itself or to the behaviour of the companies.
Frequently, discontent over mismanagement by local authorities, opposition to
national government policies, disputes among mayors and regional presidents over
unfulfilled promises, and claims about the delimitation of territories trigger protests.
As Section 6.4 shows, these conflicts were directly related to the control and
distribution of canon minero.
In the next sections I unpack the features of the three types of conflict. This will
provide a better understanding of why and through which processes the
implementation of the NEIS in combination with a mining boom has created the
conditions ripe for the escalation of conflict in mining regions.
6.2 Anti-mining conflicts: showing the way
The success of the opposition to mining in Tambogrande (Piura) and Quilish Hill
(Cajamarca) captured the interest not only of scholars (see Section 4.2), but also of
people in other parts of the country affected by the extraction industries. In
Tambogrande – a municipality close to the coastal city of Piura – the Canadian
company Manhattan Minerals spent five years (1998–2003) and more than USD 60
million on a project to exploit a rich polymetallic deposit through open cast mining.
The operation demanded the relocation of the whole population of Tambogrande.
Opposition from the inhabitants of the town, in alliance with peasant organisations

− 112 −
and wide sectors the population of Piura, forced the company and the government
to drop the plan (Paredes, 2008).
In Cajamarca region, the Yanacocha Company operates the largest gold mine in
Latin America. Yanacocha began mining in 1993 and claims to be at the forefront of
the ‘new mining’ industry on account of its consideration for indigenous people, its
environmental responsibility and a genuine concern for local development.98
However, the enterprise has been plagued by recurring conflicts, mostly opposition
to the exploitation of Quilish Hill. Peasant communities and the population of
Cajamarca city claimed that the operation would jeopardise the water supply for the
regional capital and impede the development of agriculture, the main economic
activity of the region. After five years of recurring conflict and protracted
negotiations, in November 2004 Yanacocha gave up exploiting the Quilish Hill gold
deposit (Lingan, 2008).99
These two cases are ‘all-or-nothing’ conflicts in which peasants and sectors of the
urban population united to oppose mining activities. Similar examples include the
Rio Blanco project where local opposition has been suppressed and the area
militarised (Bebbington, 2007);100 and to a lesser extent, opposition to the
Condorhuain project near Huaraz.101
These heavily publicised conflicts mark the recent history of mining in Peru. They
have shaped the official reaction that led to the implementation of the Peruvian
version of the NEIS. Moreover, although conflicts of this type are infrequent, they
are important testing grounds for the narratives, strategies and repertoires of
98 Yanacocha is a joint venture between Newmont (USA), which holds 51.35% of shares; Buenaventura (Peru), owning 43.65%; and the International Finance Corporation (IFC), an arm of the World Bank, which holds the remaining 5%. The ownership structure of this joint venture has remained stable since its foundation. 99 However, this renunciation did not resolve the dispute between Yanacocha and the peasant communities living around the operations; on the contrary, the conflicts merely diversified (Lingan, 2008). 100 The Rio Blanco deposit is the main asset of the London-based Monterrico Metals Company. The Chinese Zijing Mining consortium paid USD 185.4 million for the acquisition of Monterrico in April 2007. The new owners are fully committed to developing one of the top 20 largest copper mines in the world (Monterrico Metals, 2009). 101 Barrick, the Canadian gold company, tried to extend its Pierina operation (Ancash) to Condorhuain, a hill close to the city of Huaraz. However, following opposition from the peasant communities downstream to the planed mine, Barrick abandoned the project. Protesters claim that they stopped the expansion, while Barrick says that exploratory tests did not reveal profitable reserves.

− 113 −
contestation that people have subsequently employed elsewhere. Thus,
investigation of this type of conflict provides a way to explore both the continuity
and the innovative aspects that emerged along with the other two types of conflict
during the period 2005–2008. I shall examine the main features of type I anti-
mining conflicts under the following headings: (i) actors and their motives, (ii)
mobilisation structures and alliances, (iii) narratives of conflict, (iv) adaptation of the
repertoire of protest, and (v) influence of the NEIS.
6.2.1 Actors and motives
Company announcements about the discovery of an important mineral deposit or
the publication of its plans to exploit one already identified have usually caused a
shock at the grassroots level. However, actors differ in their perception of its
significance. In the case of Tambogrande, Cajamarca and Majaz, the peasants –
who make up the majority of the population around potential new operations –
deem mining to be a serious threat to their livelihoods. In sharp contrast, the state
and local elite see it as an exceptional opportunity to profit from an increase in tax
revenue and to reinvigorate the regional economy.
The peasants perceived agriculture to be incompatible with mining in these three
locations. In the valleys of Cajamarca and the districts around the Rio Blanco
deposit, the benign climate and fertility of the land fostered a profitable agrarian
economy that constituted the principal means of livelihood for the majority of the
population. In both cases, the mineral deposits were located in valleys where
headwaters were located and the projected massive open pit mines posed a
substantial threat to the water supply necessary for farming. In Tambogrande, the
proposed gold mine would have occupied the centre of a fertile valley hitherto
devoted to export-oriented agriculture (Paredes, 2008:272-275).
Thus, the peasants had good reason to resist the mining ventures and, in addition,
had accumulated sufficient knowledge about the probable impact of the exploitation
around Yanacocha to distrust official promises about the benefits that mining could
bring to agriculture. But the concerns of the peasantry are usually insufficient in
themselves to incite significant mobilisation. Indeed, peasants’ grievances
frequently remain unresolved. Thus, the question arises as to what were the
− 114 −
contributory factors that tipped these grievances into broad-based mobilisations
that were able to challenge the important mining investments.
The history of these examples of anti-mining conflict reveals three crucial factors in
the initiation and sustaining of mobilisation against mining: (i) the existence of a
consistent organisational nucleus and the forging of alliances; (ii) the composition
of an appealing and flexible narrative; and, (iii) the adaptation of the repertoire of
contestation.
6.2.2 Mobilisation structures and alliances
The formation of widely accepted and locally embedded organisational structures
has been critical to the success of mobilisation. In Tambogrande, the Front for the
Defence of Tambogrande made collective action possible in the early stages of the
confrontation by coordinating three peasants communities, and peasant water
management committees and associations (Paredes, 2008). In Cajamarca the
peasant communities and the powerful rondas campesinas (peasant defence
committees) proved invaluable as vehicles for mobilisation (Lingan, 2008).102 These
nuclei provided legitimacy, organisational resources, and clear leadership to
galvanise wider alliances.
This initial power base was still not sufficient to generate mass social mobilisation.
After initial confrontations between the protesters and the companies – and the
state apparatus – claimants realised that they needed to gain wider popular support
for their cause if they were to pursue it in earnest. At local level, coordination with,
and the support of the Catholic Church – or at least sympathetic elements of it –
was an important mechanism to gain social legitimacy and the sympathy of a wider
section of the population in the region. (McAdam et al., 2001:145). At the same
time, coordination with an array of national and international organisations
reinforced the challengers’ position through an increase in technical ability and
negotiation leverage (Bebbington, Humphreys Bebbington et al., 2008; Paredes,
2008). These alliances reinforced local mobilisation capacity and generated
external pressure on both the companies and the national government.
102 Traditional rural organisations originally set up to prevent cattle rustling. Later, they started to play an important role in settling disputes among villagers, providing security to the population and frequently deputising for the ineffectual leadership of peasant communities (Diez 2007). In some areas, they were crucial in the fight against the Shining Path guerrillas.

− 115 −
Moreover, in Tambogrande and Cajamarca, recruitment to the cause of important
sections of regional society – especially citizens of Piura and Cajamarca, the two
regional capitals – cemented the success of the protest. Large numbers of people
from these two sites started to perceive mining operations as either a serious risk to
their own water supply (Cajamarca), or to the safety of the environment (Piura).
6.2.3 The development of an attractive and flexible narrative
Original concern expressed locally about dispossession and loss of livelihood was
rapidly fused with a broader environmental discourse. Initially, this was the result of
a spontaneous synthesis of the various tendencies and concerns that allies brought
to their assessment of the causes they were fighting for. Moreover, three factors
heightened the use of the environmental framework.
First, the work of NGOs raised popular awareness of environmental issues and
their connection to the sustainability of livelihoods. Second, environmental
concerns became an acceptable framework within which to introduce popular
demands in a context where other forms of political expression were repressed or
illegitimate. Third, international institutions and NGOs sympathised with and
supported popular environmental struggles, providing resources and advocacy
networks.
Moreover, the flexibility of the environmental framework made it possible for
different groups to come together under the same banner. However, the process
did not only involve the addition (or substitution) of a new set of issues. This fusion
of discourses transformed the original meaning of the concepts. Thus, the
conventional perception of the environment being linked to the conservation of
nature was broadened to include long-standing social demands such as dignity and
justice, popular control over territory, respect for human rights, and sustainable
development (Arellano-Yanguas, 2008:26).
Not surprisingly, political activists portrayed the Tambogrande and Cajamarca
conflicts almost entirely in environmental terms. However, the reality is more
complex. As Bebbington et al. (2008:10) argue with regard to Cajamarca, “The
mobilizations brought together groups motivated by quite different concerns [...]
These actors, while united by a general sense that Yanacocha has dispossessed
them from something, differ in the specific nature of their concerns.” In
− 116 −
Tambogrande, initial apprehensions also evolved to incorporate the right to decide
the allocation of local resources (Revesz, 2009b).
This fusion of different discourses within a flexible environmental framework is not
new; Banks (2002), and Macintyre and Foale (2002) discuss similar earlier
processes in Melanesia. The capacity of this discourse to attract the attention of a
wider audience and, therefore, to represent a real threat to corporate reputations,
allows people to employ it effectively in different settings, even if their demands
differ significantly from the narrower, technical understandings of what
environmental impact is. I discuss this more extensively in the analysis of the
second type of conflict under enhancing bargaining power.
6.2.4 The adaptation of the repertoire
Protest marches, general strikes and roadblocks are the protesters’ most common
weapons in the early stages of social conflict. The Peruvian government’s response
is suppression. The companies, on the one hand, look to the state for protection
and on the other, try to derail the protest by offering employment, social projects or,
in some cases, bribes to movement leaders. These tactics frequently lead to the
radicalisation of the conflict and an escalation in violence. Violent confrontation with
the police at roadblocks and the destruction of company assets during marches on
its premises signal the peak of the clash. However, this kind of escalation tends to
alienate the more moderate members of alliances − urban people who sympathise
with the protest, some NGOs, religious groups, etc., hindering the protesters’
capacity to achieve their objectives.
Thus, In Tambogrande and Quilish Hill (Cajamarca), the most promising option was
to transform the tactics by radicalising the political rhetoric but reducing the use of
violence. Media campaigns, the publication of alternative assessments of the real
impact of mining and calls for popular consultation are the elements of this modified
strategy. However, this softer approach still retains the radical message: the
population of the mining area is not only determined to safeguard livelihoods, but
also to defend its right to make decisions that affect sovereignty over its territorial
resources (Revesz, 2009b).
In sum, these examples of local resistance to the initiation or expansion of mining –
all-or-nothing conflicts – occur mainly when people perceive that they can do
− 117 −
without the mining operation, that they have alternative, adequate livelihoods. This
was the case with the threat to export-oriented agriculture in Tambogrande and
water scarcity in Cajamarca. In addition, overwhelmingly successful resistance to a
mining operation tends to prevail only where proximity to a city provides alternative
jobs, markets for rural produce and the critical mass of people necessary for a
major confrontation. These conditions are especially unlikely to be found in
sparsely populated regions above about 3,500 MSL in the central and southern
Andean highlands, since non-mining livelihood opportunities in such locations are
scarce.
6.2.5 The influence of the NEIS on emblematic anti-mining conflicts
New anti-mining conflicts were rare in 2004-2008. The Rio Blanco–Majaz case has
been the most prominent (Bebbington, 2007:16-19) and in 2009–2010 two other
disputes erupted that have the features of an anti-mining conflict. The resistance of
my friend Santiago and his Amazonian compatriots to the legislation facilitating the
incursion of extraction industries into their territories is the first. It represents a
determined opposition to mining and oil exploitation on the grounds of
environmental damage and loss of territorial control. Both these motives are
especially important to the indigenous Amazonian people, who rely on the
rainforest for all aspects of daily survival.
The conflict that erupted in Islay – Arequipa – in early 2010, around ‘Tia María’, the
new mining operation of SPCC, is the second case. The population of Islay, a
coastal valley endowed with abundant farmland, opposed the new operation
because its use of underground water would jeopardise commercial agriculture in
the valley. A certain amount of internal division notwithstanding, massive popular
mobilisation stopped – or at least temporarily halted – development of the project
(Rojas & Salas, 2010).103 These two high profile cases are very important because
they generated political debate on the role of extraction and the need to reform the
institutions governing the extraction industries.
I argue that the implementation of the NEIS together with the mining boom has
diminished the frequency of anti-mining conflicts, despite the rise in mining
103 Nevertheless, it is possible that an agreement on the construction of a dam to be used for both mining and agriculture might ease this dispute.

− 118 −
investment. A combination of two factors has led to a lower incidence. First, large
canon minero transfers have changed popular expectations about potential
livelihoods. People in mining regions perceive public sector employment funded by
mining revenue can benefit them – as long as mineral prices remain high – even if
the expansion of operations damages agriculture and other pre-existing sources of
livelihood. Second, the anticipation of a historically high price for minerals is
modifying the behaviour of mining companies. They increase their social spending
in the communities around the new operations to cultivate popular acceptance.
Moreover, when the mineral deposit is large and rich, they also are ready to
increase investment in less harmful technologies.
Quellaveco, the giant Anglo American’s new operation in Moquegua is an example
of this tendency. Anglo American bought the rights to exploit this copper deposit
from the Peruvian government in 1992. The site is located within 15 kilometres of
Cuajone, the third largest mine in the country. However, in 2000, peasant
communities around the site refused to grant Anglo American a social licence to
operate on the basis of an inadequate water management plan.104 In refusing the
licence, the population of the highlands and more prosperous peasants in the
Moquegua Valley recalled their bad experiences with Cuajone.
In contrast to the behaviour of Monterrico Metals in the Rio Blanco project, Anglo
American bided its time, accepted the initial verdict without appealing to the
Peruvian government for the enforcement of its legal rights. In 2008, the company
tabled a fresh plan for public consideration. The new design of the mine
significantly reduced the negative impact of the operation through a substantial
increase in the initial investment, especially with regard to water management.105
Beyond this important technical development, during the most recent escalation in
mineral prices, there has been a change in people’s perception of the benefits
mining could bring. From 2006 to 2008, the coffers of municipal governments in
Moquegua overflowed with canon minero funds (see statistics in Chapter 2 and
Appendix VI).This allowed municipal governments in Moquegua to generate
thousands of relatively well-paid jobs in public works. In 2008, more than 50 per
104 The plan had already been approved by the Ministry of Mining and Energy. 105 Personal participation in Anglo American’s environmental impact assessment workshop (Moquegua, 28-08-2008).

− 119 −
cent of the active population in the Andean districts of Torata, Carumas and San
Cristobal were working in the public sector.106 Impoverished peasants in these
localities gained an important supplementary income and, in some cases, a
completely new means of earning a living. In turn, this substantial increase in
income boosted the retail trade and demand for services, benefiting the urban
population in the regional capital.107
The result was that in September 2008, when Anglo American organised
workshops to present its modified plans, both at regional and municipal level,
opposition to mining had largely dwindled away and the majority of the population
viewed new mining investment with a sense of hope. However, this does not mean
that there was no opposition. A group of peasants from the Moquegua valley and
radical political activists took part in the workshops to make sure that some people
spoke out vociferously against the company’s vaguely worded and rosy proposal,
generating the impression that there was strong opposition to the project. The
company also prepared carefully, renting coaches to bring loyal supporters from
communities in which it had previously financed social projects. Anglo American’s
representatives claimed that the new operation would create more than 4,000 new
jobs – 1,500 direct and 2,500 indirect jobs – and would double the canon minero
transfer to the region.108 Even the most ferocious opponents conceded that they
would be happy if they could finally come to a more beneficial deal with the
company.109
Anglo American has firm plans to invest between USD 2,500 and 3,000 million in
Quellaveco, intending to start copper production in 2014. However, the way in
which Anglo American engaged with the peasant communities to gain the social
license, generated internal divisions, promoted unrealistic expectations, and laid
the foundations for the future proliferation of the second type of conflict.
106 Interviews with mayors and municipal managers in the three municipalities (2008-171, Calacoa 16-08-2008; 2008-177, Carumas, 28-08-2008; 2008-189, Torata, 05-09-2008). 107 Retail prices increased by 23.4 per cent in Moquegua in 2006–2008, in comparison to the 12.7 per cent increase in Lima (Ministerio de Economía y Finanzas - Perú, 2009). 108 Participants in the Anglo American workshop and interview with the manager of community relations at Quellaveco (2008-191, Moquegua 09/09/2008). 109 Interviews with representatives of the National Confederation of Communities Affected by Mining (CONACAMI) (2008-161, Ilo 16-08-2008; 2008-189, Moquegua 08-09-2008).

− 120 −
6.3 Communities enhancing their bargaining power to negotiate the redistribution of mining benefits
In the second type of conflict, confrontation is widely understood to be a prelude to
direct bargaining with the company in order to gain greater compensation.
However, a common strategy is to make these conflicts appear similar to the first
type. Both types of conflict may share the same tactics and – frequently –
narratives, but they differ in their aims.
During my field research, I found this more tactical type of conflict far more
common than the first anti-mining type. It appears that the implementation of the
NEIS in the context of a dramatic increase in the profits of the mining companies
has generated incentives for communities to engage in contentious activities in
order to access what they consider to be a fairer share of the benefits.
Some of my Peruvian colleagues, being active members of social movements,
were not very comfortable with my description of this second type of conflict when I
presented a preliminary version of these findings in 2008.110 They argued that my
proposal shifted responsibility for the eruption of conflicts from unfair company
practices to the supposedly avaricious behaviour of the peasants. My study does
not have that intention, but their criticism encouraged me to proceed with extreme
care when assessing the evidence emerging from my field work. My argument is
that beyond the reprehensible behaviour of some mining companies, the
introduction of short-sighted policies has tended to promote this type of conflict.
The mining companies appear to have shot themselves in the foot when they
agreed with government policies benefiting them in the short-term but eroding the
legitimacy of the state and making companies responsible for service delivery in the
territories around their operations.
I undertook a four-step analysis. First, I introduce the main actors involved in these
conflicts and the context in which they interacted. Second, I identify different
motivating factors. Third, I review some conflicts of this type, and conclude by
summarising the main features of these conflicts.
110 Presentation at the international seminary, The New Paradox of Plenty in the Andes: budget coalitions, sub national governments and social monitoring. Organised in Lima by the Institute of Development Studies (IDS), Revenue Watch Institute and the Instituto de Estudios Peruanos (11-12 November 2008).

− 121 −
6.3.1 Peasant communities and companies interacting in a changing environment
Peasant communities located close to the mines were the main actors in this type
of social conflict in 2005–2008. This is not surprising since, while municipal
governments were occupied spending canon minero transfers, peasant
communities on the ground strived to grasp benefits for themselves from the mining
boom.
The adoption of a local approach to sovereignty over resources has legitimised the
claims of peasant communities. The constitutional sanction of the state’s ownership
of the subterranean riches of the country has little sway over people’s views.
Claims for priority of ownership over natural resources are made according to level
of territorial organisation: the region takes precedence over the state; the
municipality takes precedence over the region; and, at the end of the chain,
peasant communities take precedence over municipal governments that have
frequently alienated them. For example, although regional and municipal
governments in mining regions have received an extraordinary amount of revenue
in recent years, the communities around the operations strongly believe that these
funds do not reach them.111 Therefore, they look directly to the mining companies
as a source of immediate benefit.
In this context, I found that two factors increased the bargaining power of
communities in their relationship with the mining companies. First, legislation
required the companies to reach an agreement with the owner of the land. Second,
beyond this formal requirement, there was mounting pressure on the companies to
obtain a ‘social licence to operate’. This means that they had to get explicit
approval from the communities in the area around the operation to proceed with
their investments (World Bank, 2003:21,50). Failure to procure this social licence
before an operation started, or failure to maintain support at a later stage led to
serious loss of reputation. Gil (2009) argues that the combination of these two
factors increased the leverage of communities around Antamina, which were better
able to negotiate alternative compensation packages in the early stages of the
operation.
111 This opinion was often expressed in my interviews with peasant community organisations.

− 122 −
Mining companies operating in remote areas of the country believed they needed to
convince the local communities of the advantages that mining could bring them.
Under this pressure, companies responded by boosting their presence through a
twofold strategy: (i) scaling up their CSR budgets, and (ii) reaching an agreement
with the government over the controversial Mining Program of Solidarity with the
People (MPSP), which exonerated mining companies from the payment of windfall
taxes in exchange for a commitment to invest a predetermined amount of money in
social development projects (see Chapter 1).
But pursuing this strategy generated new problems. Although mining companies
claim they do not intend to act as a proxy for the state, in fact, they do because
both the state and the communities demand it.112 The people living around the
mines perceive that the government renunciation of a windfall tax means the
companies retain an unfairly large share of the profits. The implementation of the
MPSP is thus an explicit admission that the companies are neglecting their duties,
not a sign of their benevolence. This perception legitimises the claims lodged by
peasant communities against the companies. Moreover, when the companies
demand a greater presence of the state in mining regions (Apoyo, 2009a), the
government reminds them that they have a commitment to improve the lives of
people living around the mines (El Comercio, 2008a). As a result, the strategy has
trapped companies in a web of ever more complex contention and positioned them
at the forefront of popular demands and anger.113
6.3.2 Triggers of ‘distributive’ conflicts
Contextual factors are not enough to explain the actual outbreak of conflict. There
needs to be an immediate cause for people to engage in contention. In my field
research, I identified four different types of trigger in 2005-2008. First, peasant
communities demanded the fulfilment of previous promises and agreements that
they felt had not been honoured. These were mostly related to the implementation
of social programmes and more local jobs, or salary rises for members of the
community already working for subsidiary firms. Second, they felt that land transfer 112 Cheshire (2010) reports a similar process of state substitution in rural mining areas of Australia. 113 Senior managers of some of the largest international companies operating in Peru expressed their dissatisfaction with the current situation. They recognised that payment of the windfall tax would have put them in a better position to hold the government accountable for its performance in mining localities (personal interview at PERUMIN, Arequipa 16-09-2009).

− 123 −
agreements were unfair. Although the price had been agreed 10 or 15 years ago,
the current ratio between payments and the astonishing company profits was
interpreted as a big swindle. Third, some communities demanded a share of the
unprecedented profits on the basis that they had never previously benefited from
the natural wealth they considered rightly belonged to them. Finally, in the context
of historically high mineral prices, companies decided to reinvest the profits in the
expansion of their operations. Thus, they needed to renegotiate with local
populations in order to obtain additional land and water supplies. The communities
in turn recognised this process as an opportunity to realign themselves in relation to
the company.
In the case of the first three triggers, the huge increase in corporate profits
prompted peasant communities to critically reassess their relations with the
companies. People revisited historical grievances that re-emerged with greater
urgency. In contrast, the fourth trigger presupposed the emergence of fresh
opportunities for the empowerment of the communities. Nevertheless, in none of
the four cases did people radically oppose mining activities – they just wanted fairer
compensation for loss of assets, and the assurance of future livelihoods.
There was frequently more than one of the four triggers at work in any given conflict
because different actors within the communities attempted to safeguard different
interests as the conflicts passed through various stages, in which the relationship
between companies and communities also evolved. In the next section I illustrate
the underlying dynamics of this type of conflict through an analysis of conflicts
around Pierina and Antamina (Ancash), and in Pasco.
6.3.3 The case of Pierina
Conflicts around the Pierina area broke out in 2005, when the productive life of the
mine was coming to an end.114 In 2003, official investigations revealed that
Barrick115 had exploited a loophole in the law, allowing it to avoid payment of
corporation tax from 1999 to 2001 to the tune of USD 141 million (Congreso de la
República, 2003). In September 2004, a judicial resolution upheld Barrick’s claim of
non-liability for the tax. The refusal of the Ministry of Economy to appeal against the
114 Initially, the mine was scheduled to close down at the end of 2009. 115 The Canadian parent company that owned Pierina.

− 124 −
court’s decision outraged the regional authorities and communities of Ancash,
triggering opposition and social conflict. In March 2006, the mayors of the region
and some social organisations called for a regional strike, putting forward a
comprehensive platform of demands that the mining companies and central
government should meet. In the case of Barrick itself, they demanded that it
financially support some key regional projects.
The mobilisation of protesters brought Barrick to the negotiation table, but the
protesters were frustrated by the company’s response. According to Lombardo
Mautino, the mayor of Huaraz and leader of the public protest, “the company did
not cooperate and its public image with the local population deteriorated. This
negative reaction paved the way for subsequent conflicts.”116 On 4th May 2006,
without previous warning, peasant communities around Pierina blockaded the two
roads giving access to the mine. They demanded a salary rise for their members
employed by subsidiary companies. After the violent death of one of the peasant
activists, injuries to 19 people – both civilians and police officers – and a series of
tense meetings, the company increased salaries from PEN 20 (USD 6.6) to PEN 30
(USD 10) a day.
An interview with the president of one of the peasant communities involved in the
clash revealed the intricate web of causes behind this conflict. He argued that
essentially, they had no complaints about the presence of the company, but that
they were frustrated by the non-fulfilment of promises to provide jobs. Additionally,
he explained that they had agreed to sell their land at PEN 1,000 per hectare (USD
330) in the hope that they would be employed on permanent contracts. Of course,
no such thing ever happened and the people later regretted selling their land at
such a low price.117 Therefore, in negotiating the resolution of the conflict, the
population tabled a mixture of clear economic demands backed by a list of
environmental grievances aimed at justifying their claims for compensation.
In January 2007, a new conflict arose. Barrick had recently acquired the rights to
prospect Condorhuain Hill, close to the city of Huaraz and to Pierina. The
communities closest to the potential operations supported Barrick in the hope that
the new mine would offer them fresh economic opportunities. However, the 116 Personal interview 2008-104 (Huaraz, 25-06-2008). 117 Personal interview 2008-106 (Jangas, 26-06-2008).

− 125 −
population of Huaraz – which had been let down by Barrick’s refusal to make
reparation for its tax avoidance – opposed the project. Again, the protesters
employed an environmental argument alongside their grievance over Barrick’s
failure to support regional development.118 Finally, the company pulled out of its
attempt to exploit Condorhuain Hill on the grounds that the preliminary survey had
revealed that the deposit was not commercially viable.119
6.3.4 Cases around Antamina
The interests of Antamina, the other large mining operation in Ancash, were also
plagued by this kind of tactical conflict during the period 2005–2008. While the
municipalities around the mine grew rich on canon minero transfers, the peasant
communities of Carhuayoc, Huaripampa, Ayash and Juprog120 engaged in various
disputes with the company in order to get some economic compensation. These
conflicts have complex roots that stretch back to the early days of Antamina’s
presence in the region (Gil, 2009; Salas Carreño, 2008). Although unable to
chronicle that history, I draw attention to some issues that repeatedly came up in
discussions when actors explained the local dynamics.
First, in order to obtain the social licence to operate and to convince the
communities and some private landowners of the advantages of selling their assets
to the company, Antamina promised employment to local people, generating
unrealistically high expectations about the positive impact of the mine (Gil,
2009:119-125). In this favourable context, the communities of Huaripampa and
Carhuayoc sold significant portions of their land to Antamina at USD 450 per
hectare.121
Second, the forced resettlement of those displaced by the mine generated popular
discontent and the first signs of frustration. This dissatisfaction escalated when
people realised that employment opportunities at the mine were scarce owing to
their lack of the technical skills this highly mechanised industry demanded. The
company tried to halt this growing unrest through the blatant cooption of the more 118 Personal interview with local leader of CONACAMI, 2008-103 (Huaraz, 25-06-2008) and with Lombardo Mautino, mayor of Huaraz, 2008-104 (Huaraz, 25-06-2008). 119 Personal interview with Guillermo Fajardo, Barrick’s senior community affairs manager, 2008-102 (Pierina, 23-06-2008). 120 The mine is in their territories 121 Huaripampa sold 2,337 hectares and Carhuayoc 1,129 hectares. (Gil, 2009:115).

− 126 −
confrontational leaders. As one of the critics of Antamina declared, “Setting up a
defence front against Antamina was the best business in town.”122
For example, in 2001 Glicerio Mauricio, a member of one of the most influential
families in San Marcos, was instrumental in the formation of the Front for the
Defence of the Interests of San Marcos. He openly opposed Antamina, claiming
that the company had deceived the population with empty promises.123 He
subsequently gained victory under this confrontational banner in the municipal
elections of 2002. However, once in power, he swiftly reached an agreement with
Antamina over the construction of local infrastructure in exchange for cordial
relations. At the same time, Mauricio did well out of the deal personally: he founded
a transport company that Antamina began to contract regularly, and two of his sons
were employed by the company.124
Antamina resorted to similar tactics in order to quash disputes in the communities.
The setting up of both communal and private firms to which the company promised
contracts was the most frequently used tool for the appeasement of conflict. This
strategy commonly implied the cooption of leaders and the division of communities
into opposing factions. Initially, this ‘divide and conquer’ approach worked well for
Antamina. However, as some company officials confessed, it also created an
incentive for the appropriation of resources and promoted confrontational leaders
that exploited the conflict for personal gain.125
Third, local narratives often emphasised the arrogant behaviour of mine managers
and staff, including the air of detachment and self-importance that people perceived
in the few local people who fulfilled the dream of getting a job at the mine.
Fourth, the immense amount of money Antamina spent on CRS did not help to
improve its relationship with the communities. The Company usually subcontracted
the implementation of its CRS programmes to national and local NGOs, which 122 Personal Interview 2008-123 (San Marcos, 07-07-2008). 123 Apparently, Mauricio was personally aggrieved because he was one of the private landowners who had sold an old underground mine situated on the large copper deposit being exploited by the current operation to Antamina for USD 900,000. A few months later, some relatives who had initially resisted a similar offer sold a comparable mine for USD 11 million. Personal interview 2008-121 (San Marcos, 06-07-2008). 124 Interviews 2008-121 (San Marcos, 06-07-2008); 2008-123 (San Marcos, 07-07-2008); 2008-129 (San Marcos, 09-07-2008). 125 Interview 2008-140 (Antamina, 16-07-2008).

− 127 −
helped to project the image of an open and receptive company. However, the
communities that should have benefited from these initiatives were unanimously
disillusioned with the efforts of Antamina and the performance of the NGOs.
According to a member of one of the communities:
These NGOs got a lot of money from Antamina. They came and started to ask a lot of questions about how we do things and how we think things should be done. Then, after a few weeks, they came back and used the information that we gave them to train us. Later, they disappeared. They do not live here and do not understand us. They are interested in the money, but not in our development. Antamina would do better to give the money directly to us (Interview 2008-131; Carhuayoc, 10-07-2008).
Against this backdrop, the communities around Antamina started various conflicts
in the period 2005–2008. In September 2006, residents of Juprog (4,200 MSL) tried
to bar access to the mine, demanding that Antamina keep its promise of more jobs
for the community. The clash between the claimants and the police resulted in eight
people being injured. The representative of the regional Ombudsman office was
invited to mediate in the negotiations. The original demand for employment was
combined with concerns about the population’s health. In September 2007, after
several failed attempts to reach an agreement, 500 inhabitants of Juprog and
Ayash blocked the road to the mine. At the same time, Antamina published a
proposal for the expansion of its operation towards the territory of Juprog and,
consequently, the acquisition of 1,353 hectares of farmland and relocation of the 82
families living there.126
The company offered USD 600 per hectare and the relocation of the inhabitants to
a coastal region. However, the people of Juprog were deeply offended. Some of
them had previously been relocated from the land that Antamina had acquired in
the 1990s for its original operation and were aware that the offer would not permit
them to start a more comfortable life in another location. Thus, although they did
not reject the relocation proposal out of hand, they were keen to secure better
terms for a potential agreement. Negotiations opened with an asking price of USD
100,000 per hectare, and an additional USD 200,000 for each family on the site
holding a title deed. This last point increased the number of affected families from
the 82 permanent residents to more than 500 families with historical rights to the
126 Information about these conflicts was gathered through attendance at a communal assembly (2008-135; Juprog 12-07-2008). I later cross-checked the details with the Ombudsman’s representative for Ancash and also with Antamina.

− 128 −
land. The communal assembly realised that Antamina would not accept such a
proposal, but the community wanted to demonstrate its determination to the
company and get a fair price this time.
When I visited the community in July 2008, I was shocked by the number of new
houses that seemed to be unoccupied. The neighbours explained that the houses
belonged to descendents of the community living in San Marcos, Huaraz, or Lima.
They had built dwellings in Juprog in an attempt to force Antamina to include them
in the resettlement deal. After some months of fruitless negotiation, the people
living there permanently formed the opinion that including these 500 families on an
equal footing would reduce their compensation package. The situation thus created
tension between the two groups.
Antamina continued to hold meetings with the community at the end of 2008. The
inhabitants had decided it would be preferable to negotiate directly with the
company without bringing in any third party to arbitrate. During the process, the
community used both environmental demands and threats of fresh roadblocks as
bargaining tools. They assumed that Antamina would finally make them a better
offer since it needed to expand its operation.
At the same time, Antamina was involved in similarly intricate disputes with the
communities of Huaripampa, Carhuayoc and Ayash. In Huaripampa and
Carhuayoc, employment at the mine and additional contracts benefiting transport
and construction companies – both communal and private – were the main issues.
However, community representatives used the low price paid by the company for
the initial acquisition of land and demands for environmental damage compensation
to try to force a better deal.
The situation in Ayash was slightly different, but the pursuit of a fairer
compensation package was at its heart. Ayash is a large community situated in the
valley below Antamina’s huge tailings dam and comprises three different
municipalities. When I visited the area in 2008, the company and community were
locked into a protracted dispute over environmental damage, loss of livelihood and
the health of the local population.
It was generally agreed that there were high heavy metal levels in people’s blood.
However, the failure to conduct a baseline survey to determine the health of the

− 129 −
population before the construction of the mine gave Antamina the argument that
the problem was due to the naturally high mineralisation of the valley, which had
contaminated the soil, water and, consequently, the food. In response, the whole
community of Ayash demanded to be relocated to a safer area. However, Antamina
rejected this option on the grounds that it would be tantamount to admitting some
kind of responsibility for the situation. Therefore, demands and negotiations
focused once again on employment and the implementation of social projects.
6.3.5 Cases in Pasco
In Pasco, I studied the dynamics of contention around the mine in Cerro de Pasco,
and another four middle-size operations in the surrounding municipalities. Despite
the severe environmental damage that mining has produced in the region, all the
conflicts reported in recent years have ended in agreement over economic
compensation and employment in subsidiary companies, without demands for the
implementation of effective measures to prevent environmental degradation.127
This is especially relevant in the city of Cerro de Pasco. The situation of the
community of Champamarca − placed less than three hundred metres from the
Cerro de Pasco open pit mine − illustrates the trade-off between health and
employment opportunities. The community lives among piles of rubble and tailings,
and 83 per cent of the children have high levels of lead in their blood (Astete,
2005). Nevertheless, the population has refused to leave the place and move to a
new site because temporary jobs at the mine are the only opportunity for making a
living in the city. Moreover, the president of the community declared that they
hoped that remaining there would help them get jobs with a Canadian company
that was soon arriving to re-exploit the old tailings left behind in the 1980s by the
state-owned company Centromin.128
In a similar vein, though on a larger scale, a significant share of the population of
the city of Cerro de Pasco, including its mayor, resisted Law Nº 1244-2008, which
decreed the relocation of the whole city to a new site 50 kilometres away. Despite
the good intentions of Gloria Ramos, the congresswoman from Pasco who
127 An excellent media report on the environmental problems of the city can be found at http://elcomercio.pe/EdicionOnline/especiales/cerrodepasco/index.html 128 Interview with the president of Champamarca (2008-062; Champamarca, 24-05-2008).

− 130 −
introduced the law in Parliament, people in popular assemblies were unconvinced
of the viability of trying to make a living in a new town that had few employment
prospects.129
The activities of this mine also affected the well-chronicled community of
Rancas.130 Despite being in a comparatively fortunate situation in comparison to
other communities in the area, the population of Rancas came into conflict with
Volcan, the current owner of the mine, in 2008. In 1990, the community had signed
an agreement with Centromin granting the mining company a lease on part of their
territory for a period of 20 years. In exchange, the community received USD 2.5
million, which it invested in setting up a peasant cooperative and a community
company – Communal Multiple Services Company (ECOSERM) – that started
providing services to the mine.
In 2008, the community numbered approximately 300 families, with a balance in
employment between mining and agriculture. About 400 people were regularly
engaged in farming activities, using the land furthest away from the mine.
Meanwhile, another 320 mainly young people worked for ECOSERM, which had
grown into a thriving business through the diversification of its activities and
customers. The vice-president of the community attested that the close relationship
with the mine was one of the main factors behind this success.131
However, this apparently fruitful relationship did not prevent the eruption of new
conflicts. In July 2008, Volcan informed the local authorities of a new plan to
expand its operations. The development necessitated that Rancas be granted a
fresh lease on an additional 1,000 hectares. The demand came at the time when
the community was in the process of renewing the old lease agreement due to
expire in 2010. The discussions about the renovation of the old agreement and the
lease of new land generated tensions among community members. Widely known
for its lack of tact in getting things done, Volcan did not wait for the formal
129 Personal attendance at local assemblies in Cerro de Pasco on 20th and 21st May 2008. 130 A brief reference to the novel Redoble por Rancas (Scorza, 1970)can be found in Section 2.2.1. 131 Interviews 2008-052 (Simón Bolivar, 19-05-2008) and 2008-054 (Simón Bolivar, 20-05-2008).

− 131 −
authorization of the community and occupied the new land taking for granted that
the community would agree.132
The move aroused the anger of a section of the community and put the supporters
of the new deal with the company in a difficult position. During the ensuing
demonstrations, the protesters complained about the invasion of the territory and
the pollution of water and land. They drew a parallel between their protest and the
struggle of their parents and grandparents against the Cerro de Pasco Copper
Corporation in the 1950s. However, they knew that they needed to reach an
agreement with the company, as permanent conflict would jeopardise the viability
of ECOSERM. When I interviewed the community authorities shortly before this
confrontation, they were already of the opinion that a certain level of conflict,
including the existence of different opinions among the locals, might be a good way
of applying pressure on Volcan in order to get a better deal in the imminent
negotiations.133
Similarly, conflicts between the peasant community of Huayllay and the American
Silver company, Yarusyakan, Ticlacayan and San Juan Milpo with the Atacocha
company were settled with economic agreements that did not take the original
environmental claims into account. In all these cases, greater employment
opportunities were the principal demands put forward by the communities during
the negotiations.
The situation at El Brocal, the other important mine in Pasco, is in stark contrast,
illustrating the importance of employment in mining-related conflicts in the region.
El Brocal occupies land belonging to the peasant communities of Smelter and
Huaraucaca. There is no evidence that El Brocal has a better environmental
management policy record than other mining companies in the region. In fact, there
are important environmental liabilities in both communities that El Brocal has not
addressed.134 Moreover, the local population could have easily targeted the
company given that in 2005, a massive landslide from one of its waste piles buried
the community graveyard. However, during the period 2005–2008, there was no
132 Interview with senior managers of mining companies at PERUMIN (Arequipa, 16-09-2009). 133 Interview 2008-054 (Simón Bolivar, 20-05-2008). 134 A smelter facility closed down by previous companies operating in the area had produced the environmental damage.

− 132 −
significant conflict between the company and these two communities. Employment
opportunities appear to be the explanation for this state of affairs.
Huaraucaca consists of 260 families. In 1999, the community sold part of its
territory to the mining company and, following the example of Rancas, decided to
use the proceeds to set up a company that could work for El Brocal. The enterprise
was successful and by 2008, the community owned two separate businesses –
ESGH and ECOSEMH135 – that employed more than 300 people. At the same time,
the community sold additional land to the company and gave up agriculture
completely. As a result, the livelihood of the entire community came to depend on
the mine.136
The community of Smelter run a smaller enterprise, but this still demonstrated
sound business sense to El Brocal. In 2007, the company suggested to the
president of the community that it establish a company through which the mine
could hire some of the inhabitants. By the following year, the new company was
already providing jobs for 50 out of the 300 members of the community.137
Despite its early success, El Brocal’s strategy for ensuring social stability has two
potential weaknesses in the long term. First, as the general manager of the
company recognised, many of locally employed workers are not essential to the
operation. Thus, such a level of employment can only be sustained in the context of
very high international prices and corporate profits.138 Second, the communities
have become highly dependent on the mine, and attempts to enlarge their client
base have not yielded significant results.
In these examples, communities perceived social conflict as the only way to
attempt to negotiate on an equal footing with the company. The asymmetry of
power between the actors, and the widespread suspicion of collusion between
central government and the mining companies excludes the state from acting as an
arbitrator underlines this perception.
135 They operated as an intermediate employment agency providing a qualified labour force and hiring out heavy machinery respectively. In 2007 el Brocal paid USD 3,080,000 for these services (EL Brocal, 2010). 136 Interview with the president of the community (2008-060; Huaraucaca, 22-05-2008). 137 Interview with the president of the community (2008-061; Tinyahuarco, 23-05-2008). 138 Interview with Ysaac Cruz, general manager of El Brocal (2008-199; Lima 19-09-2008).

− 133 −
6.3.6 How do communities and companies engage in social conflict?
Once a community decides conflict is the best strategy to benefit from the rent
generated in its territory, the connections between the root causes, the ways in
which local demands are expressed and the actual outcomes of negotiation
become complex and ambiguous. The communities frame their demands in a
variety of ways, employing discourses from ecology, social justice, and, most
recently, ethnicity.
The use of an ecological discourse in this kind of conflict is not new. In similar
situations in Papua New Guinea, Macintyre and Foale (2002) observe that local
people find ecological discourses especially effective in legitimising claims for
compensation. This does not mean that claims about the adverse environmental
impact of mining are false, or that local people do not genuinely value their local
environment. Rather, they find that it makes sense to align themselves with the
global trend to make the environment an increasingly inclusive concept, which
incorporates considerations of ethnic justice and the obligation to redistribute
mining surpluses locally (Banks, 2002; Bridge, 2004).
In terms of ethnicity, the National Confederation of Communities Affected by Mining
(CONACAMI) has made effective use of an ethnic discourse focused around
indigenity and a common historical Inca legacy (Palacín, 2008). However, most
people directly affected by mining are reluctant to endorse the narrowly defined
indigenous identity that CONACAMI ascribes to them (Paredes, 2006).
Representatives of communities play their cards shrewdly in the tactical
deployment of ethnicity to back their claims: “We are the descendents of the Incas,
we have always been here, this is our home and the company came to dispossess
us of our resources.”139 They know that portraying the conflict as an indigenous
claim provides extra leverage in negotiations (IIED, 2003).
How do peasant communities make the leap from environmental and symbolic
claims and discourse to pragmatic negotiation over material issues? It seems that
claimants have both in mind, but in most of the communities in my study, daily
survival is the paramount issue. Moreover, once a mine is already operating and
139 President of Ticlacayan in a public negotiation with the company Atacocha (Mayo 2008).

− 134 −
changes to the environment are inevitable, the logic of the negotiation requires
them to put forward clear and achievable demands for economic compensation.
The logic behind these conflicts makes agreements for compensation highly
unstable, leading to the recurrence of conflict. The companies are partially
responsible for this because they frequently buy time in order to keep the mine
running instead of looking for real, long-lasting solutions. Although mining
companies have highly qualified anthropologists in their community relations
departments and use the discourse of ‘accompanying the communities at their own
pace’,140 maintaining the activity of the operation is invariably their main goal in the
event of conflict. The opportunity costs of postponing the construction of a new
mine or paralysing its operation once it is running can reach the order of millions of
dollars a day in the present climate of high mineral prices. Co-opting leaders and
creating divisions and rival factions are frequently part of the ‘damage limitations’
strategy of the companies. Not surprisingly, agreements last only until the
emergence of a new leadership that demands to re-negotiate the terms.
In contrast to the anti-mining conflict, national and international actors are
completely absent. In the case of the troubled relations between Juprog and
Antamina over the purchase of community land for the expansion of the mine,
CONACAMI was involved in the initial stages of the conflict but once members of
the community had made up their minds to ask for fair compensation for their land,
they asked CONACAMI to leave them alone141. Although the involvement of this
and other national and international NGOs in the disputes would strengthen the
communities’ position, they prefer to negotiate directly with the companies without
any third-party involvement. They seek flexibility and are afraid to rely on external
actors, often perceived as having their own agendas, like pushing confrontations.
The more tactical nature of these conflicts does not mean they are less violent.
Marches, roadblocks, taking company staff hostage, or threatening to damage
company premises are the usual means of putting forward the community’s
demands. An increase in the number of strategies marks the escalation of social
conflict that has frequently led to serious casualties. When confrontations reach this 140 Personal interview with a senior community relations manager (2008-102, Huaraz 23-06-2008). 141 Personal interviews with members of the community and CONACAMI (2008-135, Juprog 12-07-2008; 2008-153, Lima, 08-08-2008).

− 135 −
point, the regional Ombudsman or the local catholic priest could be called into the
proceedings to broker a deal.
To sum up, in line with the findings of the quantitative analysis in Chapter 5,
increases in mining company profits have stimulated further conflict through which
local populations see as a way to negotiate over the distribution of the revenue. In
this type of conflict, mining expansion – whether in terms of investment or the total
area for which companies hold exploitation rights – has not usually triggered
disputes on account of its negative impact on livelihoods or the environment, but
through the emergence of a new opportunity to negotiate with the company for a
more favourable distribution of mining-generated rent − a bigger slice of the cake.
The next section analyses the last type of conflict triggered by increased canon
minero transfers to sub-national governments.
6.4 Canon minero transfers at local level: pouring oil on the flames
In June 2008, Moquegua hit the headlines when its population paralysed the region
and for ten days, took control of and closed the bridge that linked the rest of the
country with Tacna and Chile. Disruption to trade caused significant loss of
business, damaging the country as a whole. When the government tried to restore
public order, the protesters took the head of police and 60 of his officers hostage,
some of who were injured.142
The distribution of canon minero transfers between Moquegua and Tacna triggered
the protest. SPCC paid taxes on the total profits of its operations which were
located in Tacna (Toquepala) and Moquegua (Cuajone), and the central
government was required by law to distribute the transfers in proportion to the
material processed in each region. However, due to its lower grade ore, in 2007,
Tacna processed 78 per cent of raw material but produced only 22 per cent of the
total refined copper. This meant that in 2008, Tacna received 78 per cent of the
canon transfers that SPCC taxes had generated. This was too much for the people
142 At the height of the demonstration, between 10,000 and 15,000 people occupied the Montalvo Bridge (2008-196, Moquegua 11-08-2008).

− 136 −
of Moquegua, who felt cheated of the proceeds of ‘their’ copper.143 Consequently,
they demanded that the central government amend the regulations immediately.
The incident, popularly known as the Moqueguazo, perplexed a national public that
could not comprehend why the population of one of the wealthiest regions of the
country had mobilised so ferociously. While carrying out field research, I learnt that
this incident was not exceptional but the expression of a new type of mining-related
conflict. I conducted my fieldwork in 2008 at a time when regional and municipal
governments had been receiving abundant canon minero transfers for the previous
four years and conflicts had increased markedly in the mining regions. When I
thoroughly examined my data on political dynamics, I realised that the devolution of
the canon minero rather than reducing the number and intensity of conflicts had, in
fact, generated new disputes over access to and use of these financial transfers. I
subsequently identified three different subtypes within this new form of conflict.
The first subtype comprises conflicts between the population and the regional and
municipal authorities reflecting the inability of the authorities to allocate canon
minero transfers efficiently. They are obliged to follow strict centrally imposed
regulations to the letter, but the lack of administrative capacity within municipal and
regional governments drives such conflicts, which were common in Ancash and
Pasco in 2005-2008. People complained about both the lack of investment projects
and the poor quality of those that were implemented. However, in some places,
such as the Conchucos Valley (Ancash) and the municipalities close to the Cuajone
mine (Moquegua), the sheer size of the transfer allowed the municipal authorities to
mitigate popular pressure – at least temporarily – by expanding their payrolls:
quiescence was exchanged for well-paid jobs in public works.
The second subtype includes conflicts that arise between different levels of
government over the regulations and mechanisms governing the distribution of
canon minero and similar fiscal transfers. In Ancash, Moquegua and Pasco,
municipalities challenged the regional government over the criteria it used to
allocate funds. Moreover, these same regional authorities also resisted attempts by
the central government to modify the legislation for the distribution of canon minero
transfers and related schemes that would directly benefit the mining regions.
143 The national newspapers of the day were full of testimonies employing these arguments.
− 137 −
Politicians had two incentives for initiating and leading these conflicts. First,
because the Peruvian political system is highly fragmented (see Chapter 3), there
was a very small political cost to them in building local support through
confrontation with the higher levels of government. Second, conflict with the higher
levels of government was a pre-emptive strike against public pressure (on
municipal mayors) or from mayors (on regional presidents). Although the law
prohibited them from organising or participating in contentious political events,
including marches and strikes, local politicians did not hesitate to take covert action
if it meant diverting popular anger to other levels of government.
The third subtype relates to the rules governing the geographical distribution of
canon minero transfers. Sub-national governments at the same level of the
administrative hierarchy disputed their territorial boundaries. Boundary variations of
a few hundred metres can make huge differences in terms of the level of canon
transfer received. The control of water resources might therefore provide extra
leverage in future negotiations with mining companies.
An analysis of the events leading to the Moqueguazo, and of parallel political
dynamics in Ancash, reveal how these three subtypes of conflict interacted in
escalating contention.
6.4.1 The Moqueguazo: the curious path from the hills to the bridge
After the conflict in Moquegua, the national government held Zenón Cuevas – the
president of the Front for the Defence of the Interests of the People of Moquegua
(FEDIPM) – and Cristala Constantinidis – the former president of the regional
government – responsible for the demonstration and ensuing violence, linking them
to leftist political movements. Both ironically commented that they would have been
delighted to have such strong political appeal.144 Yet, in truth, they did not have the
capacity to instigate such a massive mobilisation. On previous occasions they had
called for public demonstrations around other issues but with very little success.
Rather, the conflict reflected the presence of a more complex web of underlying
local dynamics linked to the issue of canon minero transfers.
144 Personal interviews in Moquegua (22-08-2008) and Lima (15-09-2008).

− 138 −
For a long time, wealth generated by the mining industry had been concentrated in
the two main cities of the region, Ilo and Moquegua, mainly through economic
activities financed by the spending power of SPCC workers. It was not until 2005
that the rapid increase in canon minero transfers resulted in the municipalities of
the Andean region being incorporated into the mining dynamics. Subsequently, in
2006 and 2007, the region and its municipalities received the highest per capita
transfers in the country (Table 6.2).
Table 6.2 Per capita canon minero transfers (US dollars) in the three Andean municipalities of Mariscal Nieto-Moquegua (2004–2008)
2004 2005 2006 2007 2008
Carumas 70 786 1,428 2,154 1,395
Torata 121 1,799 3,070 4,398 2,721
San Cristobal 73 774 1,404 1,868 1,070
This sudden increase in income was perceived as a unique opportunity to improve
the lives of the people. However, it also generated disputes in these ‘newly rich’
municipalities: disagreements over territory and riparian rights, and conflicts
between the population and the authorities.
First, the public and the authorities realised that the existence of mineral deposits in
their territory was a tangible source of income. Water sources also gained new
strategic importance because they raised the stakes in negotiation with the
companies. Indeed, between 2005 and 2008, the regional government of
Moquegua reported 23 territorial conflicts within its jurisdiction, most relating to
mining issues. Several municipalities in Moquegua region fought amongst
themselves (Gobierno Regional de Moquegua, 2008a). For example, Carumas and
San Cristobal disputed the inclusion of the communities of Aruntaya, Titire and
Jancopujo in their jurisdiction because a new mining operation, Aruntani, had
commenced and they hoped to benefit from future canon minero transfers
generated there.145
However, quarrels with the neighbouring regions of Puno and Tacna over the
control of strategic territories had a greater influence on the outbreak of the 2008 145 Interviews with the mayors of Carumas and San Cristobal (2008-177, Carumas 28-08-2008; 2008-171, San Cristobal, 26-08-2008).

− 139 −
conflict over canon minero. For some years Puno had challenged the jurisdiction of
Moquegua over Pasto Grande village, including Pasto Grande Lake, its associated
water supply system, and the different mineral deposits that had already been
discovered there. Simultaneously, Moquegua claimed jurisdiction over the
community of Huaytire and Suche Lake, from which SPCC supplied the Cuajone
mine then under the jurisdiction of Tacna. In 2007, this conflict in Moquegua
became more serious when the population expressed its anger through street
demonstrations. This mobilisation helped to build up the sense of grievance
necessary to rally the people again in June 2008.
The second factor critical to explaining the scale of the public mobilisation in June
2008 is the increasing intensity of popular pressure on the mayors of the rural
areas. New municipal and regional governments had come into office in January
2007. The new mayors had won the elections on the promise of delivering the full
developmental potential of the canon minero. However, this was easier said than
done and the mayors soon met popular dissatisfaction with their performance. The
mayor of Torata was removed from office in May 2008, and his counterparts in
Carumas and San Cristobal soon faced strong opposition and a popular call for
their dismissal. Faced with mounting hostility, the mayors resorted to generating
public sector jobs to appease the populace. Consequently, by late 2007 to early
2008, the majority of the population in these municipalities was employed in public
works projects financed by canon minero transfers.
As Table 6.2 shows, when canon minero transfers diminished in 2008, this system
of political patronage was jeopardised and, as a result, both the population and the
local authorities had the incentive to mobilise opposition. The mayors pursued a
double strategy: on the one hand, they attempted to acquire more money for their
municipalities, and on the other, sought to divert popular criticism away from their
management shortcomings and direct it towards an external target. Thus, the
mayors were the main driving force behind the protest. Finally, they convinced
those employed in municipal public works that if they did not support the
mobilisation, the municipality would be unable to continue employing them.146
In September 2008, I got stuck at major road -works on my journey to the highlands
of Moquegua (not, this time, a roadblock). During a delay of several hours, I had a 146 Personal interview with participants in the demonstrations.

− 140 −
pleasant and illuminating conversation with the two young women directing the
traffic. One of them was Isabel, whose story I related in the introduction of this
thesis. Accounts of their children’s upbringing, and their long and gruelling day’s
work ended in their proud declaration that they had won the right to work by
participating in the June demonstrations because the mayor had promised them
jobs if they agreed to take part.147 They also confirmed that the mayors had asked
the companies working for the municipality to pay for trucks to take people from
their homes to the city of Moquegua and discreetly provided the provisions
necessary to feed the people during the demonstration.148 Additionally, it seemed
that the mayors had taken a special interest in the participation of former army
conscripts from their municipalities, as these veterans played a crucial role in
confronting the police.
In these cases, the repertoire of tactics is similar to that used in the direct conflicts
between communities and mining companies. Nevertheless, one difference is that
in this case, the companies are able to move out of the political spotlight. The focus
of protest is on a more directly accessible objective: a share of the abundant
revenue channelled to sub-national governments. The companies are thus able to
stand back, thankful that they are no longer the main targets of conflict.
6.4.2 The domino effect in Ancash: from pressuring the mayors to enlisting the
whole region in the battle against national policies
Management of the rapid increase in value of the canon minero transfers put the
mayors who took office in 2007 in municipalities around Antamina (Ancash) under
great pressure. As is usual after elections, the new incumbents seek to staff
municipal administrations with their own people, dismissing most if not all the public
servants who had worked in the previous one. Not surprisingly, they were unable to
increase municipal spending in line with the higher level of transfers received
(Table 6.3).
147 Personal interview with participants in the demonstrations (2008-173, Carumas 26-08-2008). 148 Peruvian law makes it illegal for public institutions to support this type of public mobilisation.

− 141 −
Table 6.3 Percentage of the 2007 capital expenditure budget actually spent and percentage of the vote secured by the winning candidate in the 2006 municipal elections, in the main municipalities around Antamina
Cajay Chavin Huantar Huachis Huari Ponto San
Marcos
% capital investment budget execution 51.3 40.8 74.7 41.5 34.9 3.7
% of vote to the mayor 23.5 38.0 38.4 26.9 41.8 38.5
Source: Ministerio de Economía y Finanzas; Oficina Nacional de Procesos Electorales.
By the beginning of 2008, after just a year in office, the mayors met growing
popular dissatisfaction and hostility. In San Marcos, the district hosting the mine
and therefore receiving the highest canon minero transfer, the population started to
mobilise against the mayor. His opponents formed a new Front for the Defence of
the Interests of San Marcos and spread rumours of corruption and poor municipal
government performance. By May 2008, tensions reached fever pitch when a
majority of town councillors asked the National General Comptroller149 to launch a
formal inquiry into the municipal accounts for the period 2003–2007. Almost
simultaneously, the town clerk publicly denounced the mayor for
mismanagement.150
Facing similarly troubled situations, the mayors of Huari and Chavin de Huantar
crafted a twofold strategy. First, like their colleagues in Moquegua, they increased
their offers of work (a more detailed analysis of this dynamic can be found in
Chapter 8). Second, they targeted the even lower rate of budget spending of the
regional government to deviate popular pressure from their own management.151
The regional president was in no better position. Investment in several key regional
projects was paralysed because the plans lacked the technical rigour demanded by 149 The original Spanish name for the institution is Contraloría General de la República. It is a body appointed by the Parliament to ensure that public institutions operate according to the law. 150 Initially, the national general comptroller did not take the demand very seriously. In fact, his immediate response to the town councillors was that an audit of San Marcos’ accounts was not scheduled for that year. However, the following year, as an ‘urgent’ solution, the comptroller visited San Marcos, Huari and the regional government of Ancash, and found serious irregularities in the management of the three institutions for the year 2008, which, in all three cases, involved breaking the law (Contraloría General de la República, 2010). 151 In 2008, the regional government of Ancash spent only 18 per cent of its total capital investment budget.
− 142 −
the Ministry of Finance and allegations of his involvement in corruption
mushroomed.152 In June 2008, the mayors called for a strike, demanding the
resignation of the regional president and appealing to the different groups of actors
to join them. As was made clear at a regional assembly of regional social
organisations held in Huaraz, the most active groups supported the idea of
throwing out the president but were not happy about endorsing the mayors. 153
Nevertheless, they finally agreed to back the regional strike on 7th July.
The regional president, Cesar Álvarez, demonstrated that his reputation as a skilful
political operator was well deserved. He picked up the proposal to change the
legislation governing the distribution of mining profits to the mineworkers in order to
mobilise the population against the national government and the parliament.
According to Peruvian legal tradition, every year, businesses have to share 8 per
cent of their net profits with their employees. In 1996, Parliament issued a decree
(Nº 892) establishing an upper limit of 1.5 times the basic salary for this annual
premium. Any surplus had partly – up to USD 2.5 million in 2008 – to be allocated
to the Fondoempleo fund, and invested in job creation in the geographical area in
which the profit was made. In January 2005, in line with the aim of the NEIS, a new
law (Nº 28,468) decreed that after payment of bonuses and contributions to the
Fondoempleo, the remainder of the 8 per cent of the profits should be transferred to
the regional government for investment in improvements to local road
infrastructure. According to this law, the regional government of Ancash received
USD 151 million in 2007 (Fondoempleo, 2010).
As could be expected, the National Federation of Miners and Metal Workers of
Peru lobbied for the removal of the cap on the annual bonus payment, finding
support in a group of parliamentarians that introduced a proposal for the
amendment of the existing legislation. Cesar Alvarez swiftly grasped the
importance of this issue for the region and its population. He first put it on the
political agenda, then mobilised his own support so that he might divide the
regional opposition to him. The presence of an external enemy served to neutralise
the internal opposition. The result was that on 8th and 9th July 2008, while there
were significant popular demonstrations, including road blocks, few of the strikers
152 The national comptroller also confirmed the accuracy of these allegations in 2010 (Contraloría General de la República, 2010). 153 Assembly held in the Municipality of Huaraz, 17-06-2008.

− 143 −
persisted in demanding the resignation of the regional president; instead, a
significant number directed their anger against the policies of the central
government.
6.5 Conclusion
The implementation of the NEIS in Peru aimed to reduce the anti-mining
demonstrations that had impeded the development of mining operations in the early
2000s. However, the NEIS has created two new types of conflict. The first is
already known in the wider literature: the rent attached to mining activities tends to
generate conflict, notably between companies and the population of the areas in
which they operate. This is especially likely in polities such as Peru where central
leadership is poorly integrated with sub-national authorities, and is, moreover,
perceived to be captive to mining interests. The national government is thus unable
to play an effective role in resolving such routine political disputes over mining
rents. This type of conflict has escalated as commodity prices and mining profits
have increased in recent years.
The second type of conflict I have documented reflects causal processes that I did
not anticipate finding before I began my field research, and which seem to be much
less widely appreciated. Large fiscal transfers to the sub-national governments of
the mining regions themselves cause or exacerbate social conflict through several
kinds of mechanisms.
From my data, It is not clear how far these two types of conflict tend to reinforce or
substitute for each another, or whether they simply coexist. However, I have found
some evidence to suggest substitution processes are taking place. In certain
localities, in 2007 and 2008 when very high commodity prices and canon minero
transfers provoked disputes among local populations and municipal governments
over public spending issues, the mining companies were temporarily removed from
the line of fire.
At present, the Peruvian government, social movements centred on mining, and
international donors in Peru remain unaware of the diversity of types of conflict
generated by and affecting the extraction industries. Central government tends to
see only conspiracy: anyone promoting or supporting social conflict in a mining
area is denounced as an anti-establishment activist, an enemy of development, or

− 144 −
even a supporter of terrorism.154 This authoritarian attitude has left problems
unresolved and exacerbated antagonism. The inadequate and inconsistent
management of conflict by the state and its use of political repression could trigger
the emergence of more articulate national social movements. On the other hand,
social movements have a propensity to think of mining conflicts simply in terms of
coherent resistance to exploitative capitalist forces and environmental destruction.
Both interpretations are misleading and not very helpful when it comes to
policymaking. The results of my research highlight three aspects that give a better
understanding of the dynamics of the social conflict surrounding mining in
contemporary Peru.
First, the continued emphasis given to anti-mining disputes between local
communities and mining companies is misplaced. These were emblematic, but are
no longer the most numerous. There are other significant causes of conflict located
around mining. Second, the frequency of conflicts in mining areas in large part
reflects the structure of national politics in Peru; notably, the incentive for local
politicians to pursue purely locally focused, short-term strategies, and the inability
of the national government to establish sufficient autonomy from mining capital for it
to act as a legitimate arbiter of the national interests. And finally, mining companies’
adoption of policies of corporate social responsibility cannot eliminate local disputes
in mining areas. In some cases, the misuse of resources helps to reconcile
opposing forces in the short term, but it paves the way for new and more complex
disputes in the long term. Moreover, in the context of a commodity boom, many
conflicts arise independently of company behaviour towards the local population.
The size of the operation and the rent that is generated matters as much as the
company’s behaviour. For best practices to be effective, they have to go beyond
corporate social responsibility tenets to embrace a real transformation of the
relationship between the companies, the communities around the mines, sub-
national governments, and the national polity.
To conclude this chapter, it is important to reflect briefly on the outcomes of these
conflicts. Most analyses of conflicts in Peru assume that they constitute a negative
factor, hindering economic development. Needless to say, government, business
associations and the IFI prioritise stability over all else. In a more dialectic vein, 154 This is the recurrent government message in the media, and was confirmed in an interview with a representative of the Office of the Prime Minister (April 2008).

− 145 −
Bebbington and Bury (2009) argue that conflict around mining in Peru
demonstrates the capacity to offset asymmetries of power and to bring about
institutional change. In this sense, conflict should be taken as a necessary step to a
more inclusive polity.
My research both supports and challenges these views. I find that conflict helps
local communities gain leverage in negotiations with the state and the mining
companies, and that the introduction of the NEIS was the official response to
previous popular demands. Additionally, in this chapter I have shown that the
implementation of the NEIS has given communities more muscle in their
negotiations with the mining companies.
However, the Peruvian case also shows that the institutional change induced by
conflict is neither beneficial nor conducive to further improving policy. To
underscore this point, I have been able to distinguish between three different types
of conflict. Some disputes, such as those of the Awajun and in Piura, still constitute
a genuine opposition to new operations. This kind of conflict retains its potential to
challenge the status quo around mining, demanding substantive institutional
modifications, such as the legal recognition of popular consultation and the
exceptional status of indigenous territories. Yet, while these conflicts are potentially
the most constructive, official responses to them have intensified political
repression, a reflection of the political interest of the companies and central
government and sectors of the national elite who want a quick fix to guarantee a
hugely profitable extraction industry. In light of this only an alliance of local groups
with links to national and international organisations stands any chance of making
protest and opposition successful and, hopefully, less painful.
Conversely, disputes over the control of rent – which were the most widespread
type of conflict between 2005 and 2008 – have more limited potential for generating
positive changes in the management of the extraction industries. In fact, the
implementation of the NEIS has reduced the potential constructiveness of social
conflict. It has increased the number of conflicts whilst, at the same time, creating
an incentive structure that means protestors seek concrete and immediate benefits
rather than any change to regulations or governance. Indeed, the introduction of
important financial benefits for mining jurisdictions has blocked a wider revision of
the extraction agenda in Peru. Furthermore, as the following chapters will illustrate,

− 146 −
these new types of conflict are at least partially responsible for the failure of
municipal and regional authorities to transform the surging flow of canon minero
transfers into tangible developmental outcomes.

− 147 −
Chapter 7
Fiscal transfers and local welfare
I have shown in Chapters 5 and 6 that in Peru the implementation of the New
Extractive Industry Strategy (NEIS) has led to social conflict. Before making any
judgment about the overall impact and desirability of the NEIS generally or of the
canon transfers more specifically, it is necessary to look at other possible impacts
of these policies. If levels of material and social welfare have increased in mining
regions and municipalities (relative to non-mining jurisdictions) as a result of the
implementation of the NEIS, there is at least a question of trade-offs between
different objectives to consider. Conversely, if there is no evidence of local
improvements in material and social welfare in mining areas, then the whole NEIS
is clearly very questionable.
Has the NEIS led to any detectable change in the levels of social and material
welfare in mining areas? That is the question I set out to answer in this chapter.
The answer is a relatively clear no. At the levels where I had adequate data to
undertake a statistical analysis, I could find no clear or consistent evidence that
levels of either (i) mining activity or (ii) canon minero transfers affected material and
social welfare in the mining areas – either negatively or positively. In some ways
this is a slightly encouraging finding. I begin, in Section 7.1, with a review of the
existing evidence from Peru and elsewhere about the effect of mining on social and
material welfare. There are reasons to believe that mining sometimes leads to
deterioration in levels of social and material welfare. The fact that I found little
evidence of adverse impacts is therefore positive. However, my main concern is
with the impact of the implementation of NEIS. I found no evidence of any positive
impacts on levels of material and social welfare to offset the conflict-inducing effect
of NEIS that I have explained in earlier chapters.
It is relatively easy to summarise the overall findings of this chapter. The
explanation of the analytic and statistical procedures I followed to reach these
conclusions is, unfortunately, rather complex. I do not have access to all the data
that I would wish to have. The explanation of how I made the best use of what is
available becomes a little tortuous. The details are in Sections 7.2 and 7.3. I

− 148 −
provide some summary guidance here on how I dealt with the three main
methodological challenges.
First, at which ‘local level’ did I look for impacts? I have only two choices because
of the ways in which the official data are made available: at the municipal and the
regional levels. Both regional and municipal governments receive canon minero
transfers. There are both advantages and disadvantages of using information
relating to one level rather than the other. More data are available at the regional
level, especially on annual variations in welfare indicators and GDP by economic
sectors. But some mining regions such as Ancash, Cajamarca and Cusco are
large. The local impacts of mining might not be evident from data that relate to
whole regions. By contrast, data is scarcer at municipal level, but more likely
accurately to capture the local effects of mining. This is especially true of the per
capita levels of canon minero transfers: these vary more widely between
municipalities than between regions. Further, municipal governments receive a
larger share of total canon transfers than do regional governments (Table 7.1). I
would expect the impacts of canon minero transfers to be more intense and visible
at municipal level. I undertook analyses at both levels, using whatever data sets
were available and appropriate to testing my hypotheses.
Table 7.1 Distribution of actual public capital expenditure according to different levels of government (2001-2008)
Year 2001 2002 2003 2004 2005 2006 2007 2008
Centrala 79% 75% 81% 53% 52% 47% 39% 33%
Regional 14% 17% 16% 22% 20%
Municipalb 21% 25% 19% 33% 32% 37% 39% 47%
Total (PEN millions) 5,297 4,760 7,056 6,185 7,097 10,252 12,189 15,059 a Until 2003, the central government included regionally decentralised structures that in 2004 were incorporated into the regional governments. b The municipal level only included the municipalities with information available for each year that is, numbers 1636, 1611, 1678, 1704, 1735, 1732, 1759 and 1832 of the total 1834 Peruvian municipalities. Source: (Ministerio de Economía y Finanzas, 2010); adapted by the author.
Second, methodological problems arise because regardless of the choice of level
of sub-national government, mining can affect social and material welfare in the
localities where it takes place through several different channels. Even at a high
level of abstraction, three main ones can be distinguished: (i) the direct effects on
the local economy of mining employment and local commercial purchases of other

− 149 −
services and goods; (ii) the slightly less direct effects of the local Corporate Social
Responsibility (CSR) spending of mining companies; and (iii) the indirect effects of
the Peruvian fiscal transfer system, which returns large revenues to the sub-
national governments in the mining areas, especially the municipalities, in the form
of canon minero transfers. Ideally, I should have data on each of those channels
and be able to examine separately their effects on social and material welfare.
According to the way I have defined the concept (Chapter 1), NEIS encompasses
financial transfers through both the last two channels listed: companies’ CSR
spending and canon minero transfers. But I have good data neither on companies’
total CSR expenditure nor for what the funds are actually used for. I can only test
statistically for the effect of canon transfers. The statistical analysis presented
below embodies an assumption that the level of canon transfers to sub-national
governments is a reasonable proxy for the varying amounts of CSR expenditure
made within those same jurisdictions, over space and time. It probably does not
matter if this assumption is incorrect because the total volume of canon transfers is
so large relative to total CSR spending that the former is likely to have the biggest
impact.155 I can only test for the impacts of two channels through which mining
might affect local social and material welfare: (i) the direct impacts of mining
employment and other commercial spending by mining companies and their
suppliers; and (ii) canon minero transfers.
My third challenge was to find a way of assessing the effects on local social and
material welfare of increased canon minero transfers while holding constant the
local commercial effects of mining. I dealt with this as best I could in the regional
level analysis (Section 7.2). In a series of regressions that explore the determinants
of (i) the rate of annual economic growth, (ii) poverty reduction, (iii) changes in the
availability of drinking water and sanitation facilities, and (iv) variation in rates of
school attendance at two different ages, I simultaneously used as independent
variables (i) per capita levels of canon minero transfers to regional and municipal
governments and (ii) two other variables that stand as proxies for the importance of
mining and its annual changes within the regional economy. These results imply
that neither mining activities nor the levels of canon transfers have had a significant
155 In 2007 while total canon transfers amounted to USD 1,617 million, mining companies’ actual spending on social projects did not exceed USD 80 million (Antamina, 2008, 2009; Grupo Propuesta Ciudadana, 2008; Ministerio de Economía y Finanzas, 2010; Ministerio de Energía y Minas, 2010b, 2010c).

− 150 −
impact on these economic and welfare indicators. Unfortunately, no data is
available to allow a similar analysis at municipal level. I find in Section 7.3 that
larger per capita volumes of canon minero transfers over the period 2001-2007 do
not correlate with higher levels of improvement in indicators of social and material
welfare at municipal level. This finding is consistent with the regional results: either
canon transfers did not have positive effects or their beneficial effects could not
compensate for the adverse effects of mining.
The bulk of this chapter comprises detailed presentations of the statistical analyses
I conducted, and the results, first, at regional level (Section 7.2) and then municipal
level (Section 7.3). First, I survey the relevant literature on the impact of mining on
local material and social welfare.
7.1 What does the literature say about development in mining and oil regions?
In the early 2000s, the International Council on Minerals and Metals (ICMM) in
collaboration with the World Bank commissioned the Mining, Minerals and
Sustainable Development (MMSD) research project. The project aimed to offer an
independent assessment of the social impact of mines on their surrounding
communities. Specific papers on the topic (Mate, 2002) and the final report (IIED,
2002: 198-230) highlighted the poor historical record of the mining industry in
promoting local development. Understandably, after these initial findings,
corporate-sponsored research shifted rapidly towards a more policy oriented
perspective. The ICMM launched the Resource Endowment Initiative (REI) (ICMM,
2010b) to have a better understanding of the policies that the mining industry,
governments and development agencies should pursue to increase the positive
impacts of mines. In 2008, a paper summarising the findings of the first four years
of the REI proposed “greater decentralisation accompanied by improvement in
municipal governments’ capacity” and “partnerships between all concerned
stakeholders” as the way forward “to enhance the positive impacts from mining”
(McPhail, 2008:6). The ICMM had already advanced similar recommendations in its
analysis of the Peruvian case (ICMM, 2007). The country case study reaffirmed
that decentralisation, capacity building at regional and municipal level, and a more
proactive role for the mining companies were the key to improving the development
performance of mining. It fully endorsed the NEIS.

− 151 −
In addition to this politically influential corporate-led research, there has been some
relevant academic work on the topic investigating the extent to which mineral-rich
sub-national jurisdictions benefit from extractive activities in terms of economic
growth and improvement in welfare indicators through one or more of the three
channels discussed in the introduction to this chapter: backward and forward
linkages of mining to the wider local economy; the investment of revenue accruing
to sub-national governments; and the implementation of CSR projects. Scholars
have followed different research strategies. Some have undertaken a comparative
analysis across sub-national units in a given country, while others have used
particular case studies to understand some of the mechanisms through which
mining affects economic and social outcomes.
Some scholars have focused on the potential of big mining companies to be the
catalysts of local development through the promotion of local businesses and the
linkages between mining activities and the broader local economy. Wise & Shtylla
(2007) claim that mining could have important positive effects on the local economy
through the promotion of local businesses and propose a set of policies to enhance
companies’ performance in that area. Also, in this more speculative vein, Auty
(2006) proposes that the enclave nature of mining operations can be used to
promote a dual track reform strategy similar to the early economic reform zones
operating in some countries:
Rapid growth of directly productive investment within the mineral region can help build a dynamic market sector that eventually absorbs unproductive labour and capital [...] In addition, it builds a political constituency for reform to take on the rent seeking interests (p. 143).
Most of the scholars that have done empirical research on the actual impact of
mining are less optimistic. They find that the potentially positive spill over effects
from mining to other sectors of the local economy have not materialised because
linkages between modern mining operations and the economy of the host regions
are very weak or/and because mining has negative effects on other economic
sectors (Bridge, 2008; Bury, 2007; Caselli & Michaels, 2009; Nylandsted, Yankson,
& Fold, 2009).
The work of Aragón and Rud (2009) represents an exception to these negative
findings. They claim that the activity of the Yanacocha gold mine in the Peruvian
region of Cajamarca improved welfare indicators in the households surrounding the

− 152 −
mine during the period 1997-2006. This positive impact correlated to household
proximity to the operation and was generated by the mine’s backward linkages to
the local economy, through the activation of the local market for agricultural
products.156
Transfer of mining revenue to sub-national governments is the second channel
through which mining jurisdictions can benefit from extraction activities. Assessing
the impact of these transfers is not straightforward because it is necessary to
analyse two questions. The first is whether mining regions develop more than the
others, and second, whether and how this is affected by the use of public revenues
derived from mining. To my knowledge, only two papers have so far addressed
these related questions through a comparative investigation of the economic and
social performance of mineral-rich and mineral-poor sub-national jurisdictions within
a given country. Goldber and colleagues (2008) using a data set for the U.S. from
1929 to 2002, conclude that resource dependence leads to slower economic
growth and poorer developmental performance. They qualify these conclusions
through case studies of Louisiana and Texas. They find that oil revenue was
responsible for these negatives results. Incumbent politicians in those states used
oil rents to maintain direct taxes low and to purchase clientelistic support. In this
way they raised the likelihood of remaining in power while reducing political
competition and the quality of policies.
In a similar vein, Caselli and Michaels (2009) do not find that oil exploitation had
any positive significant impact on economic growth and social indicators in Brazilian
municipalities. Analysing the different influence of both on-shore and off-shore
oilfields they claim that oil revenue transfers to oil producer municipalities did not
generate positive outcomes. Although the authors do not reach conclusive results
about the causal mechanisms behind this poor performance, they point to
corruption as the likeliest cause. This lack of developmental success in resource-
rich North American states and Brazilian municipalities are consistent with recent
research highlighting how rentier regions within fiscally decentralised countries tend
156 Despite the econometric sophistication of the paper, there are at least two important caveats to their arguments. First, some of the indicators, for example the subjective valuation of house rental prices, do not capture any real improvement in the population’s welfare. Second, the sample households used in the research is not statistically representative of all the households in the concentric circles which the study divided the region around the mine.
− 153 −
to suffer political distortions leading to clientelism and poor quality policies (Desai,
Freinkman, & Goldberg, 2005; Freinkman & Plekhanov, 2009; Gervasoni, 2010).
CSR spending is the third potential mechanism through which the presence of
mining companies might promote local development. Oil and mining companies
have recently repackaged their CSR schemes as ‘local partnerships’. They aim to
transform their conventional charitable practices into more collaborative processes
in which local communities and sub-national governments have a say in deciding
the projects to be implemented (Hamann, 2004). Despite these good intentions,
research into the real impact of CSR does not support an optimistic view of its
developmental record in the oil and mining sector. Frynas (2005) argues that
corporate interests frequently drive the design and implementation of CSR
interventions in the oil sector in Nigeria. He claims that “profit maximising motives
are often incompatible with good development practice” (p. 598). Idemudia (2007)
also analyses the Nigerian case and concludes that corporate partnerships to foster
local development in oil communities are greatly limited because their activities do
not counteract the negative impacts of the operations on the surrounding areas.
Similarly Hamann and Paul (2004) find that CSR schemes do not generate
significant positive changes in the mining sector in Southern Africa and make the
case for greater corporate accountability.
Other authors focus their criticism on the fact that scaling up CSR does not help to
overcome the absence of the state apparatus in the territories where extraction
occurs. Case studies in Papua New Guinea (Filer, Burton, & Banks, 2008) and
Australia (Cheshire, 2010) show that mining companies act frequently as “shadow
states” in the countryside. Discourse about partnerships frequently hinders the
assumption of a state-like role by the mining companies in the vicinity of mining and
oil operations. These authors claim that these arrangements are neither conducive
to local development nor sustainable in the long term.
In the case of Peru, there are two studies comparing welfare indicators in mining
and non-mining areas. However, both are in terms of the aggregate impact of
mining and make no attempt to differentiate between the different channels through
which mining might affect local levels of welfare. De Echave and Torres (2005) find
that mining regions have higher levels of poverty than non-mining regions, but their
methodology does not allow them to test whether mining is the real cause of this
correlation. Zegarra, Orihuela and Paredes, (2007) use Propensity Score Matching

− 154 −
(PSM) to compare welfare and income indicators in households of mining and non-
mining municipalities. Due to limitations in data availability they reduced the scope
of their study and compare only Andean households using data from the National
Household Survey for 2003-2004 – just before the mineral prices boom and its
related increase in canon transfers –. They found different results in rural and urban
settings. Urban households in mining municipalities had higher incomes than those
in non-mining municipalities. This positive ‘income’ effect of mining did not exist in
rural households. However, the proportions of urban households served by piped
drinking water supplies and sanitation facilities were lower in mining municipalities.
My research relates to this literature in three different ways. First my quantitative
analysis of regional and municipal socioeconomic indicators (this chapter) confirms
previous findings about the lack of positive results of mining revenue transfers to
sub-national governments. Second, I complement previous studies by providing
evidence on the dynamics explaining the inefficient use of mining revenues at
municipal level (Chapter 8). In particular, I show that the implementation of the
NEIS has reinforced incentives to use the money for short-term particular
objectives, including corruption, in some cases. Finally, my research highlights the
importance of political factors in determining how resource revenues are used by
sub-national governments. This helps correct the statements of government and
company spokesmen, who talk constantly of an alleged lack of technical capacity
within sub-national governments to handle increased revenues effectively.
7.2 Regional level analysis
The NEIS was shaped during 2002-2008, at the beginning of a six year boom in
global commodity prices. The profits of the mining companies, the taxes they paid
to the central government and the levels of canon minero transfers to sub-national
governments all increased considerably over this period. If either (i) mining activity
in general or (ii) the NEIS were to have beneficial effects on social and material
welfare in mining areas, clear increases in the welfare indicators over this period
should be observable. In this section I examine the extent to which this was true at
the regional level.
The things I am setting out to explain – my dependent variables – are variations in
six indicators of material and social welfare across Peru’s 24 regions during the

− 155 −
period 2002-2008.157 Using multiple regression analysis, I explore whether these
are explained in a statistical sense by variations in one or more of three variables
that indicate either the levels or the profits of mining activity. The dependent
variables are:
(i) The annual rate of GDP growth at regional level excluding mining activities. This
is a proxy for the dynamism of economic sectors other than mining. I calculated
it using the sectorally disaggregated data of regional GDP at constant prices of
1994 provided by the National Institute of Computing and Statistics (NICS)
(INEI, 2009d).158 From 2002 to 2008 this indicator grew annually by an average
of 6 per cent.
(ii) The annual variation in poverty measured as a percentage of the regional
population below the poverty line.159 During the period 2002−2008 the average
poverty level for all the regions dropped from 59.4 per cent to 42.3 per cent. The
figure fell by an average of 2.9 percentage points per year.
(iii) The annual variation in percentage of population with access to drinking water
according to the National Household Survey (INEI, 2009c).160 The average
percentage of people with access to drinking water at regional level dropped
from 61.5 per cent in 2003 to 59.7 per cent in 2008. This represents an average
annual decrease of 0.4 percentage points in coverage.
(iv) The annual variation in percentage of population with sanitation facilities at
home according to the National Household Survey (INEI, 2009c). From 2003 to
2008 the average sanitation coverage rate for the 24 regions of the panel
increased from 36.9 to 42.8 per cent, with an average yearly improvement of
1.2 percentage points.
(v) The annual variation in school attendance rate (percentage) of children between
3 and 5 years according to the National Household Survey (INEI, 2009c). The
average annual attendance rate at regional level increased from 48.5 per cent
157 I excluded Callao from the panel because it can be considered part of the Lima metropolitan area. 158 The NICS used a value-added approach to calculate regional GDP by sectors. 159 The poverty line is defined in terms of income according to a region-specific variable benchmark. In Peru, since 1995, the NICS conducts household surveys that provide very detailed data on a wide range of issues. In 2003 a change in the methodology allowed statistical inferences to be made from the annual compilation of this data with validity at regional level. 160 This indicator comprises people with drinking water at home and those who access to some form of communal service.

− 156 −
in 2003 to 63.1 per cent in 2008, representing an annual improvement of 2.1
percentage points.
(vi) The annual variation in school attendance rate (percentage) of children between
12 and 16 years according to the National Household Survey (INEI, 2009c). The
average annual attendance rates improved from 66 to 72.7 per cent during the
period 2003-2008, with an average annual improvement of 1 percentage point.
All these dependent variables are indicators of annual change. Dealing with this
type of variable, econometricians tend to use average measures for a group of
years to mitigate the ‘noise’ associated with short-term variations. In this case, due
to the short period of study I decided to use year-by-year changes as variables. I
assume that the advantage of keeping a larger number of observations exceeds
the benefits of the aggregation because the information can be used more
effectively.
The first two of my three independent variables are relatively direct measures of
variations in levels of mining activity while the third, the level of canon minero
transfers, reflects the indirect impact of mining through the implementation of the
NEIS. Each indicator captures a distinctively different aspect of the general concept
of the importance of mining in the regional economy:
(i) The variable Mining as a percentage of total regional GDP at constant prices of
1994 is a proxy for the general importance of mining activity within the regional
economy. The actual cost of production per unit of output can vary
considerably between mines. In general, the cost is much lower for large
modern capital-intensive mines than for smaller and artisan mines. Because
this indicator takes no account of cost variations, it is unlikely to be a good
indicator of the relative importance in different regions of mining profits and
rents. Accordingly, it does not significantly correlate with the level of canon
minero transfers to regions.
(ii) The variable Index of annual variation of mining GDP measures something
different again: the change from year to year in the proportion of regional GDP
contributed by mining weighted according to the general importance of mining
to the regional economy (in percentage of GDP). It is a dynamic measure that
captures the economic importance of annual variations in mining activities
(iii) The third independent variable is the logarithm of annual per capita canon
minero transfers at current value going to the regional government and

− 157 −
municipalities in each region.161 More than the previous two variables, it reflects
changes in the levels of rents made available from mining activities, although it
accounts for only a modest proportion of total rents in the period in question:
most went to the mining companies. I also use this variable as a proxy for the
implementation of the NEIS.
I computed the models using Random Effects (RE) panel regression
specifications.162 I tested the robustness of the results by running a simple Ordinary
Least Squared (OLS) regression introducing year dummies to control for year
effects and computing robust standard errors.163 This second specification did not
change either the sign or the statistical significance of the estimates. Appendix VII
contains detailed information of the various model specifications, the control
variables I employed and the statistical results, while Appendix VIII summarises the
data set.
In Appendix VII, I take the dependent variables as the main thread to present the
results of the regressions. In each section of the Appendix I analyse the effect of
the three mining-related independent variables and the other control variables on
each of the six dependent variables in turn. Here I take a different approach in
summarising the results. I take the three independent mining-related variables and
summarise separately their statistical effects on the dependent variables. This
procedure helps to differentiate between the impact of mining per se from the more
specific impact of the canon minero transfers. Table 7.2 summarises the regression
results of the data presented in Appendix VII.
The first two variables are most likely to capture any positive effect of mining on the
local economy through commercial channels: labour, and the local purchase of
other services and supplies. The fact that they have no identifiable effects on the
level of local economic and welfare indicators runs contrary to official and corporate
propaganda. It is, however, no surprise. The literature encourages us to be
sceptical (Section 7.1 above).
161 I have applied logarithms to this variable to avoid extreme values of canon transfers driving the regression. 162 The use of RE with the option ‘r’ in STATA is the best way of dealing with the problems of serial correlation and heteroskedasticity present in the panel. 163 This specification is appropriate because serial autocorrelation causes less severe distortions in the estimates in panels with short temporal series (Wooldridge, 2002:276).

− 158 −
Table 7.2 Summary of panel regressions of mining-related variables on the annual change in economic and welfare indicators in Peruvian regionsa
Mining-related independent variables → Mining as percentage of regional GDPb
Index of annual variation in
mining GDPb
Log of canon minero per
capitac Dependent variables: ↓
Period
1. Annual rate of regional GDP growth excluding mining activities
2002-2008 nss
(no statistical significance)
nss nss
2. Annual variation in poverty rates 2004-2008 nss nss nss
3. Annual variation in drinking water coverage 2004-2008 nss nss nss
4. Annual variation in sanitation facilities at home 2004-2008 nss nss nss
5. Annual variation in rate of school attendance 3-5 years old 2004-2008 nss nss nss
6. Annual variation in rate of school attendance 12-16 years old 2004-2008 nss nss (+++)
a This summary only reports as significant those results that are robust according to alternative specifications (see Appendix VII). b These variable are lagged one year in the models testing the dependent variables nº 3, 4, 5, and 6. c This variable is lagged one year in the models testing the dependent variables nº 2, 3, 4, 5, and 6. (nss) the variable does not have a statistically significant effect on the dependent variable (+++) positively significant at 1% level.
During my field research I learnt that local economies can provide neither a highly
skilled workforce nor the sophisticated technology demanded by the mines. Very
few local people hold the qualifications required to be hired by the mining
companies. Moreover, modern miners tend to keep their families and their homes
in the big cities, away from the mining areas. They typically work for two weeks and
then have a break, and live in the mining areas only when working. Often even the
food supplies for mining staff are sourced from companies in the big cities because
local foodstuffs do not meet the quality standards fixed in labour agreements.164
This means that in most cases the outsourcing of some marginal tasks to small
community enterprises is the only direct linkage to the local economy.165
My statistical analysis unearthed only a single trace of any impact of annual
changes in the mining-related (independent) variables on indicators of material and
social welfare. While correlating with no other welfare indicators, changes in the
164 I confirmed this information for Antamina, Pierina and Cuajone with the managers of the mines. 165 There are some exceptions such as the communities of Rancas and Huaraucaca in Pasco, which have important community enterprises (see Chapter 6).

− 159 −
level of canon minero transfers to sub-national governments did have a positive
effect on the rate of school attendance of children between 12 and 16 years old.166
There are two possible explanations. The first is that increased canon transfers
lead to improved education provision, e.g. through the renovation of school
buildings, the construction of new schools in remote areas, and the provision of
better travelling and lodging services and training for teachers. I am sceptical. Why
do we not see similar positive effects on the school attendance of children aged 3-5
years old? The alternative explanation is that the perceived vibrancy of the mining
sector generated an increased demand for secondary education for young people
hoping for a job in the mining business. A local researcher in Cerro de Pasco called
this phenomenon the ‘dream of the white helmet’ (Ramos, 2005). The government
and the mining companies reinforce these ideas through public campaigns
highlighting the importance of education. My interaction with local people during my
travels in the mining regions leads me to think that both supply and demand side
factors were at work simultaneously.
But, overall, these results indicate mining has had very little positive local impact
Might I be wrong?
Most defenders of the development potential of mining would argue that the impact
of increased activity and of canon transfers is likely to show up in the figures only in
the long term. That is a plausible argument, but one would still expect to see some
positive effects from the big increase in profits over the period I am considering. A
second caveat relates to the fact that I have done the analysis at regional level. Any
positive effects of mining highly concentrated in the immediate vicinity of mines
might be so diluted in regional figures that they would not show up in a statistical
analysis. I shift in Section 7.3 to a more local level and longer term analysis. As I
explain below, this does not significantly change the conclusions.
7.3 Municipal level analysis
Lack of systematic data is the main limitation when undertaking comparative
economic and political analysis at municipal level. Fortunately, my research
coincided with the detailed publication of the national census of 2007, which
contains demographic and social data aggregated at municipal level for the entire
population of the country (INEI, 2008a). The methodology used in this census was 166 According to the Peruvian political constitution of 1993, secondary education is compulsory and free for teenagers between 12 and 16 years of age.

− 160 −
similar to the previous one carried out in 1993. The existence of homogeneous
information for 1993 and 2007 permits a neat comparison of the change in some
welfare indicators over this period. I used this information to analyse differences
between canon-poor and canon-rich municipalities through change in the following
indicators:167 (i) percentage of people between 15 and 24 years old who finished
secondary education;168 (ii) percentage of households with drinking water at home;
(iii) percentage of households with sanitation facilities at home; and (iv) percentage
of households with an electricity supply at home.169
Municipal governments have responsibility for the provision of water supply and
sanitation infrastructure, while they share responsibility with other levels of
government for the provision of education and electricity.170 Assuming that the
increase in canon transfers after 2003 was the most important single factor
influencing the capacity of municipal governments to deliver services to their
citizens, it is reasonable to think that municipalities receiving a high volume of
canon transfers per capita should have improved their welfare indicators more than
the others in the period 1993-2007. Moreover, considering that canon-rich
municipalities are the closest to the mines and the gas and oil wells, they could also
benefit from any positive spill over effects of mining activity.
The results of the comparison show that most of the welfare indicators did not
improve more in municipalities receiving large amount of canon transfers than in
their comparables ‘poor’ municipalities. On the contrary, access to drinking water at
home tended to worsen in canon-rich municipalities in comparison to other
municipalities. In the rest of this section first, I present briefly how I have used
Propensity Score Matching (PSM) methods to undertake the comparison; second, I
discuss the results of the analysis; and third, I check the robustness and some
regional variations in the results.
167 I incorporate into the analysis all types of canon transfers because a few municipalities received substantial transfer relating to the exploitation of oil and gas. The municipalities spend these revenues in the same way as canon minero transfers. 168 I analyse the change in the population between 15 and 24 years old because this indicator has been more sensitive to any improvement in the quality of services in most recent years, minimising the inertia of the indicators when older generations are taking into consideration. 169 Appendix IX presents a summary of the descriptive statistics of all the variables used in the analysis. 170 I discuss more widely the distribution of responsibilities among levels of government in Chapter 8.

− 161 −
7.3.1 The application of propensity score matching methods
Comparing the change in welfare indicators from 1993 to 2007 in canon-rich and
canon-poor municipalities is not a straightforward task. The 1,834 Peruvian
municipalities are highly diverse. The existence of extraction activities is only one of
the multiple features that might generate differences between them, so I need to
compare canon-rich municipalities with those that are similar in all other ways
except the level of canon transfers. Among the available data I chose to match
canon-rich and canon-poor municipalities that have the following similar features:
(i) A similar population size in 1993 because this might correlate with different
economic and institutional factors affecting any improvement or decline in the
indicators.
(ii) Percentage of the rural population in 2007. Usually it is more difficult to
improve the coverage and the quality of public services in rural settings.
(iii) Percentage of literate population in 1993 as a general indicator of education
level at the beginning of the period.
(iv) Percentage of indigenous population in 2007 (i.e. those whose mother tongue
is not Spanish) to control for ethnical bias in the provision of services.
(v) Altitude of the district capital because different authors have hypothesised
altitude has an effect on economic and social development in Peruvian
municipalities (Escobal & Torero, 2003; Santillana, 2006: 54-55).
In addition, I controlled for the initial level of the indicators whose changes I wanted
to evaluate:
(vi) Percentage of people between 15 and 24 years old that had finished
secondary education in 1993.
(vii) Percentage of households with drinking water at home in 1993.
(viii) Percentage of households with sanitation facilities at home in 1993.
(ix) Percentage of households with an electricity supply at home in 1993.
I use PSM to make the comparison. PSM is a relatively new econometric tool that
finds within a large group of ‘non-treated’ individuals those who are similar to the
‘treated’ group in all relevant pre-treatment characteristics (Guo & Fraser, 2010).171
In this case, the treatment is ‘receiving high levels of canon transfers’.
171 Rosenbaum and Rubin pioneered this method in 1983. The basic logic behind the method is to use any standard parametric regression (for example, logit or probit) to calculate the probability of being in the treatment group given that an observation has a determined set of

− 162 −
I undertook the following steps in the analysis. First I compiled a data set for all the
Peruvian municipalities for the four welfare indicators whose changes I wanted to
analyse, and the group of control variables that define the similarity between the
municipalities.172 I also included data on canon transfers to the municipal
governments during the period 2001-2007. I ‘cleaned’ up this data set by deleting
the municipalities that were created after 1993 and those whose boundaries
changed after that year because their results in the two censuses were not
comparable. I also deleted those municipalities that did not have information about
canon transfers for three or more years between 2001-2007, and those that did not
have the same information for two years during the period 2005-2007.173 I also
excluded from the comparison the districts of Lima, and municipalities over 200,000
or below 1,500 inhabitants in 2007. 174 After the clean up, the set contained data for
1,350 municipalities out of the 1,834 in the whole country.
The selection of the ‘treated’ and ‘untreated’ municipalities was the second step in
the analysis. I selected as ‘treated’ municipalities that received canon transfers per
capita above PEN 2,100 between 2001 and 2007. There were 97 municipalities.
Figure 7.1 shows a map with the municipalities included in the analysis according
to the level of canon transfers that they received.
Finally, I compared these 97 municipalities and the other 1,253 using four different
matching algorithms (Becker & Ichino, 2002): (i) the nearest neighbour algorithm
matches each canon-rich municipality to the canon-poor municipality with the
closest propensity score; (ii) the radius method uses a tolerance level of the
maximum propensity score distance (calliper) to match each canon-rich
municipality to all canon-poor municipalities within the calliper, in this case 0.001;
(iii) the Kernel algorithm compares each canon-rich municipality to a weighted
average of all the canon-rich municipalities according to the distance of their
propensity scores; the closer their score, the greater the weight; and, (iv) the
stratification method divides all the propensity scores into a set of strata and
values for the N variables to be controlled for. The parametric regression reduces the covariates of all the control variables to a scalar propensity score valued between 0 and 1. The closer this propensity score is for two observations, the greater their similarity to the set of control variables. 172 All this data comes from the national censuses of 1993 and 2007. 173 These differences are due to the importance of the period 2005-2007 in which canon transfers increased dramatically. 174 I excluded municipalities with less than 1,500 inhabitants because they had very large changes in the indicators over time but these affected relatively few people.

− 163 −
compares canon-rich and canon-poor municipalities belonging to the same strata.
These four methods differ in their trade-offs between quality and quantity of the
matches. None is a priori superior to the others, and the joint consideration of the
four offers a way to assess the robustness of the estimates (Becker & Ichino,
2002:361-362).
Figure 7.1 Map of Peruvian districts according to different levels of total canon transfers per capita during the period 2001-2007
Elaboration: the author
Without reliable data or excluded
Transfers per capita 2001-2007 < PEN 2,100
Transfers per capita 2001-2007 > PEN 2,100

− 164 −
I computed the PSM in STATA using the pscore, attnd, attr, attk and atts
programs.175 For each of the four different algorithms, the software calculates the
average effect on the treated – in this case the average difference in the change in
welfare indicators between canon-rich and canon-poor municipalities –, the
standard error, and the t-statistics.176
I selected the common support region option to restrict the analysis of the
balancing property177 to all the canon-rich municipalities plus the canon-poor ones
in the region of common support.178 In this case, this restriction excluded only 49
canon-poor municipalities.
7.3.2 The results: canon transfers had very little impact
The change between 1993 and 2007 in the percentage of people between 15 and
24 years old who finished secondary education is the first indicator that I used to
test the impact of canon transfers. Focusing on 15 to 24 years captures the
tendency in recent years because it minimises the importance of the historical stock
of uneducated people over 24 more likely to be found in rural areas.
For the whole country, the indicator went up by 9 percentage points, from 75 to 84
per cent. However, differences between municipalities varied widely. The average
change in the 1,350 municipalities under consideration was 20 points, from 53 to 73
per cent, a drop of 19 points and an improvement of 60 percentage points at the
extremes of the spectrum. The comparison of the four PSM algorithms reveals that
this indicator went up only by between 0.5 and 1.7 points in canon-rich
municipalities than in their comparable canon-poor municipalities (Table 7.3). This
minimal change was not statistically significant.179 This result shows that mining
neither directly nor by means of the canon transfers had a significant positive
impact on the percentage of youngsters that completed secondary education.
175 These programs were written by Becker and Ichino, and can be freely downloaded within STATA from http://www.stata-journal.com/software/sj2-4 176 The standard errors are bootstrapped with 100 replications. 177 For a given propensity score, the exposure to treatment is random and therefore treated and control cases should be - on average - similar regarding the variables on which the matching is based (Becker & Ichino, 2002: 359). I have used a significance level of .01 to test the balancing property. 178 The common support region is the range of values of the propensity score where the probability of finding treated and non-treated cases is similar. 179 Given that I am working not with a sample, but with all the Peruvian municipalities fulfilling a set of conditions, the t- statistics is, in fact, a quantifier of the variance of their results and not a sign of the capacity of the results to represent a wider population.

− 165 −
Table 7.3 Estimate of the average effect of high canon transfers to Peruvian municipalities (2001-2007) on the change in the percentage of people between 15 and 24 year old with secondary education over the period 1993-2007
Matching estimation method
Nº of canon-rich municipalities
(Treated)
Nº of canon-poor municipalities
(Controls)
Average effect on the treated
Bootstrapped standard error t statistic
Nearest neighbour 97 85 .520 1.639 .317
Radius (.001) 92 730 1.775 1.165 1.523
Kernel 97 1204 .663 .811 .818
Stratification 97 1204 .527 1.295 .407
The change in the percentage of households with drinking water supply at home is
the second indicator under scrutiny. The provision of water and sanitation facilities
lies more clearly within the remit of the municipal governments in Peru. The correct
functioning of these services requires not only the initial investment to build the
physical infrastructures but the existence of local institutional arrangements that
assume responsibility for the management and maintenance of the systems.
At national level, the indicator improved 12 percentage points, from 43 per cent in
1993 to 55 per cent in 2007. The average of the improvement aggregated at
municipal level for the 1,350 municipalities in the data set was similar, increasing
from 20 to 32 per cent. The range was from a deterioration of 83 points to a
maximum improvement of 90 points. According to the PSM analysis, canon-rich
municipalities tended to improve less in this indicator than their comparable canon-
poor ones (Table 7.4). However, the estimates for the average effects and the
standard errors vary quite widely depending on the method of calculation.
According to the nearest neighbour method, canon-rich municipalities improved
almost 8 points less than their comparable poor group, with relatively high t-
statistics. These results are not robust because the other three methods show
significantly lower effects – between -2 and -4 points – with proportionately larger
standard errors. Nevertheless, the results of the four methods are consistent
regarding the average negative effect of canon transfers on the expansion of water
supply services at municipal level, although it seems that variations between the
municipalities are very important. An examination of the nature of these variations
demands a complementary test of robustness (see next subsection).

− 166 −
Table 7.4 Estimate of the average effect of high canon transfers to Peruvian municipalities (2001-2007) on the change in the percentage of households with drinking water supply at home over the period 1993-2007
Matching estimation method
Nº of canon-rich municipalities
(Treated)
Nº of canon-poor municipalities
(Controls)
Average effect on the treated
Bootstrapped standard error t statistic
Nearest neighbour 97 85 -7.735 4.183 -1.849
Radius (.001) 92 730 -3.906 3.044 -1.283
Kernel 97 1204 -2.826 2.773 -1.019
Stratification 97 1204 -1.9651 2.545 -.772
The percentage of Peruvian households with sanitation facilities at home is the third
indicator. This increased from 36 to 48 per cent between 1993 and 2007. The
change was lower in the 1,350 municipalities considered in this analysis, as the
coverage increased from 10 to 18 per cent. The change in these municipalities
ranged from a deterioration of 31 point to an improvement of 63 points.
The PSM analysis shows that canon-rich municipalities improved their access to
sanitation facilities slightly less than the other municipalities between 1993 and
2007. However, these results are neither important nor statistically significant
(Table 7.5).
Table 7.5 Estimate of the average effect of high canon transfers to Peruvian municipalities (2001-2007) on the change in the percentage of households with sanitation facilities at home over the period 1993-2007
Matching estimation method
Nº of canon-rich municipalities
(Treated)
Nº of canon-poor municipalities
(Controls)
Average effect on the treated
Bootstrapped standard error t statistic
Nearest neighbour 97 85 -1.469 1.980 -.742
Radius (.001) 92 730 -.903 1.217 -.742
Kernel 97 1204 -.425 1.178 -.361
Stratification 97 1204 -.037 1.219 -.030
The change in the percentage of households with an electricity supply is the last of
the indicators under examination. Private companies are usually the providers of
electricity, although sometimes they develop partnership with governments –
national, regional and municipal– to facilitate the extension of the national grid to
rural areas. Once the grid is in place, the electricity supply requires neither high
operational costs nor complex institutions for its management. As the mining
companies are the main consumers of electricity, their mere presence facilitates the

− 167 −
supply to neighbouring municipalities because the grid is already very close to
them. Not surprisingly, electricity supply is the only service that improved
comparatively more in canon-rich municipalities.
In 1993, 53 per cent of Peruvian households enjoyed their own electricity supply.
The figure had increased to 74 per cent by 2007. The average increase in the
1,350 municipalities in my database was slightly more important, from 26 to 53 per
cent. According to the PSM analysis, receiving a large amount of canon transfers
had a positive impact on the expansion of the service (Table 7.6). The average
improvement in canon-rich municipalities is between 3 and 7 points higher than in
the comparable canon-poor municipalities, and at least in three of the methods, the
results are statistically significant or close to being significant.
Table 7.6 Estimate of the average effect of high canon transfers to Peruvian municipalities (2001-2007) on the change in the percentage of households with electricity supply at home over the period 1993-2007
Matching estimation method
Nº of canon-rich municipalities
(Treated)
Nº of canon-poor municipalities
(Controls)
Average effect on the treated
Bootstrapped standard error t statistic
Nearest neighbour 97 85 2.549 3.477 .733
Radius (.001) 92 730 6.964 2.776 2.508
Kernel 97 1204 4.675 1.874 2.495
Stratification 97 1204 4.436 2.768 1.603
Summarising, so far, the analysis reveals that there were no important differences
in the improvement of education and sanitation indicators between canon-rich and
canon-poor municipalities during the period 1993-2007. However, canon-rich
municipalities tended to perform worse in term of drinking water supplies to the
home, and better regarding the expansion of electricity supplies.
These results can be refined. Would the results be different if I chose another
benchmark to decide what a canon-rich municipality is? Do municipalities in all the
regions behave similarly or are there some region-specific differences?
7.3.3 Checking the robustness of the results
I ran two new specifications of the four PSM algorithms to answer these two
questions. In the first new specification I raised the canon transfer benchmark
− 168 −
identifying the canon-rich municipalities to PEN 3,500, thus reducing the number of
canon-rich municipalities from 97 to 53. In the second specification, I excluded from
the analysis the canon-rich municipalities of Ancash to see whether the results of
this important mining region somewhat drive the results of the overall
comparison.180 I kept the other parameters of these new models similar to the
original PSM specification. These new tests show the robustness of the results, but
introduce a twist in the history (see tables with the results of the complementary
PSM analyse in Appendix X).
Raising the threshold for becoming canon-rich municipalities has no important
effect on the results. The sign and the statistical significance of the average effect
of high canon transfers on the change in welfare indicators remain stable. The
intensity of the effect varies slightly in the case of the education and electricity
coverage indicators, whose positive effect is reinforced – although in the case of
change in the percentage of people with secondary education, it is not statistically
significant –. This means that the top 53 canon-rich municipalities behaved more or
less like the wider group of the 97 richest.
The results vary more appreciably when the canon-rich municipalities from Ancash
are excluded from the analysis. There are no differences regarding the change in
the completion of secondary education and the coverage of sanitation facilities but
the performance in the other two indicators worsens notably. The percentage of
households with drinking water at home increased between 8 and 10 percentage
points less in canon-rich municipalities outside Ancash than in their comparable
municipalities in the country as a whole. Moreover, the strong statistical
significance of the result signals a high degree of consistency across the
municipalities. Regarding the extension of the electricity supply, the positive effect
reported by the original PSM analysis disappears when the canon-rich
municipalities of Ancash are not taken into account. This means that the
overachievement of municipalities in Ancash drove the original results for the
change in these two indicators. Once the Ancash effect is discounted, the results
for the whole country can be regarded as clearly negative.
180 I choose Ancash because it has more canon-rich municipalities larger than 1,500 inhabitants – 23– and because some studies report that mining has generated positive social outcomes there (ICMM, 2007; Sanborn et al., 2007).

− 169 −
The main findings of this chapter can be summarised as follows:
(i) At regional level, canon minero transfers did not have any significant
beneficial effect on either economic growth or the improvement of welfare
indicators over the period 2002-2008.
(ii) At local level, municipalities receiving the highest volumes of canon
transfers between 2001 and 2007 failed to improve their welfare indicators
in the period 1993–2007 to any significantly greater degree than their
comparable counterparts. This finding has two corollaries:
a. Considering that these municipalities are the closest to large mines or oil
and gas wells, the notion that proximity to profitable operations
generates positive effects on population welfare can be ruled out.
b. Municipal governments receiving a high volume of canon transfers have
not translated substantial increases in capital investment budgets into
well-being for local people.
How can these puzzling results be explained? Chapter 8 addresses directly this
question. Given the greater concentration of resources at the municipal level (Table
7.1), the analysis focuses on how municipal governments spent canon transfers
revenues.
− 170 −
Chapter 8
Why has the New Extractive Industries Strategy (NEIS) failed?
The results discussed in the last chapter present a puzzle: how is it possible that
regions and municipalities receiving high volumes of canon transfers do not
improve the living standards of their inhabitants more than the rest of the country?
Why, despite the implementation of the NEIS policy, together with government and
company assurances, does the presence of highly profitable mines – and oil and
gas wells – not benefit the people living closest to them?
A lack of capacity at sub-national government level to spend canon revenue wisely
is the prevailing explanation (ICMM, 2007; McPhail, 2008) with the corruption of
municipal authorities often cited as a complementary cause.181 Accordingly,
capacity building programmes and the promotion of transparency at the local level
have become the fashionable response. Mining companies, International Financial
Corporation (IFC) and some bilateral aid agencies have bought into these ideas
and put forward joint proposals (Aguilar, 2008; MIM, 2010). Some private
companies have invested heavily in capacity building. For example, in 2008 alone,
Antamina spent USD 4.6 million on capacity building for five municipal
governments – Huaraz, Huari, Huarmey, San Marcos and Chavin de Huantar –
(Antamina, 2009).
In general, the lack of capacity to spend money wisely is true for most
municipalities in the country. But the relevant question here is whether differences
in the ways in which sub-national governments spend money correlates with
different levels of canon transfers. If differences can be shown to really exist, then it
is important to understand the causal mechanisms behind them.
The results of my research show a clear divergence from the typical ‘lack of
capacity’ narrative. In this chapter, I propose an alternative and, to my mind, more
plausible explanation of the poor use of public money. I shall argue that it is the
181 These were the main arguments employed by central government officials, senior mining company managers, international donor representatives and governance consultants in the following interviews: 2008-004 (Lima, 07-04-2008); 2008-023 (Lima, 16-04-2008); 2008-035 (Pasco, 28-04-2008); 2008-83 (Lima, 09-06-2008); 2008-086 (Lima, 11-06-2008); 2008-152 (Lima, 08-08-2008).

− 171 −
combination of high volume of canon transfers, centrally imposed unhelpful
regulations, pressure for quick spending coming from national government and
mining companies, and new forms of participatory governance that provide
incentives for municipal authorities to pursue short-term spending strategies. The
immediate redistribution of canon transfers among the population through the
generation of employment in public sector jobs has become the main outcome as
well as the main criterion for judging the performance of municipal authorities.
Efficient spending for long-term goals has been relegated to secondary importance.
In my analysis I focus on the municipal level, where the largest amounts of canon
transfers are received. I present the results of my research in four steps. First, I
provide an overview of the official decision-making mechanisms for public capital
investment in sub-national governments. The difficulties in implementing these
centrally imposed regulations at municipal level provide an important background
for understanding the processes leading to short-term spending. Second, I analyse
the effect of canon transfers on actual expenditure patterns across Peruvian
municipalities in the period 2005-2008. This demonstrates that canon transfers
were associated with a lower proportion of expenditure in social sectors and greater
spending on stadiums, monuments, decorative pavements, and street furniture.
These results suggest that the pattern of revenue allocation lies behind the lack of
improvement in welfare indicators in canon-rich municipalities. Third, I report on my
attempt to check the accuracy of the ‘lack-of-technical-capacity’ argument. I used
data collected during my visits to 18 canon-rich municipalities to build a Municipal
Capacity Index (MCI) and then compared the MCI with data of the percentage of
actual budget spending in the same municipalities. I found no correlation between
technical and spending capacity. Finally, in the fourth step I sketch out an
alternative explanation for the lack of positive results in canon-rich municipalities,
drawing on case studies from Ancash and Moquegua to show that canon transfers,
in combination with other local political factors, promoted short-term spending
decisions.
8.1. Decision-making mechanisms for public capital investment in sub-national governments
The manner in which municipal and regional governments spent canon minero
transfers during the period 2003–2008 was strongly influenced by the institutional

− 172 −
framework generated by the decentralisation policy promoted by the Peruvian
state. Following the reform of 2002, Peru has three tiers of democratically elected
government: the national administration, 25 regional and 1,834 municipal
governments.182 The process of decentralisation transferred financial resources
and functional responsibility from the centre to sub-national governments but there
was very little devolution of political power. The centre retained legislative
capacity183 and the national government imposed strict and detailed regulations on
how municipal and regional governments could administer their resources. These
centrally designed regulations conflict with both the highly diverse local contexts
and the central administration’s lack of technical and political capacity to effectively
enforce them. Hence, the theoretically ideal institutions and policies have been
informally adapted to fit the needs, capacity and interests of the sub-national
authorities. In the next subsections, I discuss five areas in which these regulations
were especially influential in determining how sub-national governments spent
canon transfers.
8.1.1 Rules for the utilisation of different types of revenue
Municipal government revenue sources may be grouped into two main categories:
locally collected revenues and transfers from central government.184 Locally
collected revenues comprise municipal taxes (mainly property levies),
administration fees, fines, and profits from the sale of goods and provision of
services. Municipal governments can devote these revenues to both current and
capital spending.
Transfers from the central government consist of the Municipal Compensation Fund
(Foncomun),185 canon transfers, and other minor earmarked transfers.186 Municipal
governments can utilise Foncomun transfers freely to finance both capital and 182 I provide more information on the administrative structure of the Peruvian state in chapter 1. 183 Regional and local councils only have the capacity to regulate their own functional structure and some minor administrative procedures (Consejo Nacional de Descentralización, 2004). 184 Borrowing from commercial banks or international institutions is a third source that is seldom used by most sub-national governments. However, the Law of Fiscal Decentralisation indicates that sub-national governments may access loans to finance the execution of investment projects, but not for current expenditure. 185 The Foncomun is financed from 2/19 of the total Value Added Tax (VAT) revenue and is distributed among all municipal governments according to a predefined formula that incorporates criteria for population size, poverty indicators and percentage of rural population. 186 For example, the Vaso de Leche (Glass of Milk) initiative that municipal governments are expected to implement in order to provide nutritional support to children and senior citizens.

− 173 −
current expenses. In contrast, the last modification of the Canon Law (Law Nº
28,077) stipulated that canon transfers should be entirely devoted to capital
expenditure. From 2006, the central government relaxed the application of the law,
allowing municipal governments to spend up to 20 per cent of their canon transfers
on the maintenance of local infrastructure, and an additional 5 per cent on the
development of capital investment projects.187 Regional governments have a
slightly different revenue structure and do not have the authority to collect taxes.
Most of their revenue is sourced from transfers from the national government,
which are earmarked for financing education and health services.
Municipal and regional governments alike depend heavily on transfers from the
central government. During the period 2004–2008, central government transferred
to regional and municipal governments financial resources in excess of 96 and 90
per cent, respectively (Ministerio de Economía y Finanzas, 2010).188 In the case of
mining jurisdictions, this dependency has an additional challenging twist: they are
forced to administer a disproportionately large budget for capital expenditure
without being able to draw upon additional resources to increase current expenses.
8.1.2 The budgeting schedule
The budgeting schedule also has important implications for the management of
municipal and regional governments. The fiscal year runs from January to
December, and the preparation of the annual budget starts almost a year in
advance. The Ministry of Economy and Finance (MEF) makes forecasts of central
government revenue for the following year and the volume of transfers to be made
to each sub-national government. Municipal and regional governments then use
this information to initiate their own budgetary processes (including participatory
budgeting, which I will explain later in this section). At the end of each fiscal year,
the Opening Institutional Budget (OIB)189 for the following year is approved by the
MEF. It defines how much sub-national governments can spend on each line item
and traditionally has a very conservative estimate of revenue. However, during the
fiscal year, once the corporation tax and VAT revenue figures from the previous
year are officially known, the MEF updates the volume of transfers to be allocated
187 Through the annual budget law. 188 The figure for municipal governments excludes Lima. 189 The original Spanish is presupuesto institucional de apertura (PIA).

− 174 −
to sub-national governments; these are invariably higher than the earlier OIB
calculations. Armed with these revised figures, in June–July, each sub-national
government draws up a Modified Institutional Budget (MIB), which becomes the
final version of the budget.
During the mineral price boom, this system made budget management extremely
difficult for sub-national governments receiving high volumes of canon transfers.
Frequently, the actual transfers amounted to more than double the figures forecast
in the OIB. Thus, in the middle of the fiscal year, these governments had to come
up with new proposals to spend the money. Although sub-national governments
could have decided to reserve this additional funding for the following fiscal year,
both central government and the population would have regarded such a measure
as lack of capacity.
8.1.3 Distribution of functions among levels of government
The failure to clearly distribute functions and expenditure responsibilities between
the three levels of government is a major shortcoming of the current
decentralisation process (Ehtisham Ahmad & Garcia-Escribano, 2006). The
Framework Decentralisation Law of 2002 (Law Nº 27,783) defines three different
types of function: those that are exclusive to each level; those shared between
levels; and those delegated from one level to another through an explicit formal
agreement.190 The decentralisation of exclusive and delegated functions did not
generate any significant problems during the period 2004–2008. However, those
functions that were shared by two or more levels of government, such as the
management of public services, promotion of economic activities, and provision of
basic infrastructure, were made problematic due to a lack of coordination between
the different levels.
Public capital investment in the education and health sectors illustrates this lack of
coordination. All three levels of government are involved in building new facilities
and refurbishing old ones, training personnel, and undertaking investment to
improve the quality of service. In order to coordinate the efforts at the three levels,
the Organic Law of Regional Governments (Law Nº 27,867) specifies that regional 190 Consejo Nacional de Descentralización (2004), and Calderon & Friz (2005) provide good summaries of different functions by level of government according to the legal framework of the Peruvian decentralisation process.

− 175 −
governments should only undertake capital investment projects with a regional
perspective, while the national government should only invest in nationwide
projects. However, the different levels of government interpreted these
prerequisites very loosely during the period 2004–2008.
Two additional factors undermine coordination between government levels. First,
intergovernmental transfers are sent directly from the centre to each sub-national
government’s account. Accordingly, municipal governments in a given region do
not need to coordinate with or report to their corresponding regional government
with regard to the management of their capital investment budget. Second, the lack
of institutional relations between national, regional and municipal planning severs
municipal capital investment projects from the implementation of national policy,
and from the strategies of neighbouring jurisdictions. The result is a patchwork of
juxtaposed strategies that lack any kind of synergy. To make matters worse, the
national ministries implement projects at sub-national level using different criteria
and without any coordination with the sub-national governments. For example, at
national level there are four agencies responsible for (i) investment in rural
electrification, (ii) rural roads, (iii) telecommunications, and (iv) water and sanitation.
Each has its own planning mechanisms, criteria for the distribution of funds among
territories, and even its own definition of what constitutes a rural area (Peltier-
Thiberge, 2006: 294). They operate completely independently from regional and
municipal governments, which, in addition, often invest a significant proportion of
their resources in electrification, roads, and water and sanitation. Some regional
and municipal governments try to overcome these problems by drawing up
collaborative agreements. But these are done on an ad hoc basis and transaction
costs make them unviable.
The negative impact of these factors on the coordination of different government
levels operating in the same territory is more serious in mining jurisdictions than in
the rest of the country. In municipalities without significant canon transfers, mayors
are obliged to negotiate with the regional government or relevant ministries in Lima
for the allocation of funding for specific projects in their municipalities. This
demands a development plan whereby each level of government assumes
responsibility for a specific part. The incentive to negotiate and coordinate does not
exist in mining jurisdictions, where mayors and regional presidents have ample
resources to spend. On the contrary, they face the opposite problem of generating

− 176 −
sufficient feasible projects on which to spend the canon transfers. Municipal and
regional governments often compete to ‘buy’ viable projects from consultants.191
Managers in the regional governments of Pasco and Ancash reported that on
various occasions, they found the consultant had cheated them by selling the same
project twice. Thus when a regional government tried to register its project with the
National Public Investment System (NPIS),192 it was rejected because another
municipal government had got there first.193
8.1.4 Participatory mechanisms for decision-making at sub-national level
The return to democracy after the Fujimori era went hand in hand with the
promotion of participatory citizenship and the adoption of different mechanisms to
increase transparency.194 Participatory planning and budgeting were made
compulsory for all sub-national governments. In addition, municipal and regional
authorities have to incorporate civil society organisations into advisory bodies
known as coordinating councils, and are required by law to give an account of
budgetary spending in open public meetings. Even more radically, citizens can
force authorities to become more responsive to popular demands by setting a recall
election in motion to remove mayors and councillors from office when 25 per cent
of the electorate in the jurisdiction approve the proposal.195 Recent experience
demonstrates that this is easy to do in small rural districts.196
Popular participation in the generation of regional and municipal development plans
was intended to be the keystone for the allocation of resources at sub-national
level. However, as I discovered from many interviews I held with mayors and
municipal managers, this ideal policy of popular involvement in decision making is 191 Most of these consultants are freelance civil engineers and economists specialised in designing investment projects for municipal and regional governments. They tend to work only in one or two regions as their professional success depends on developing good relationships with managers in sub-national governments. In some cases NGOs and small firms also offer this type of service. 192 The NPIS was initiated in 2000 with Law Nº 27,293 and its Spanish name is Sistema Nacional de Inversión Pública. 193 Interviews 2008-039 (Pasco, 24-09-2008) and 2008-097 (Huaraz, 18-06-2008). 194 Remy (2005:23-31) provides an interesting analysis of how divergent ideological groups supported the introduction of participatory mechanisms. 195 According to the Law of Participation and Citizens’ Control (Law Nº 26,300), once this requirement is met, the National Office for Electoral Processes should call a plebiscite in the municipality to confirm or remove the authorities. 196 In 2008, there were recall elections in 242 municipalities, involving 240 mayors and 999 local councillors. Ultimately, 92 mayors and 423 councillors were removed from office (ONPE, 2009).

− 177 −
frequently by-passed. Most mayors consider it to be an annoying process and are
not convinced of its usefulness. Municipal governments resort to hiring external
consultants who, after calling some preliminary public meetings to comply with the
legal formality of ‘participation’, draw up municipal strategic plans themselves.
Suspiciously, these documents are often strikingly similar from municipality to
municipality as consultants habitually recycle the same document for their different
clients.
Some municipalities are fortunate in that mining companies help them to hire
competent professionals to draw up a plan tailored to local needs.197 But
unfortunately, independent of the quality of the product, the practical results are
similar in all the municipalities. Mayors’ lack of interest in plans aimed at regulating
their decisions makes these documents little more than colourful decorations for
mayors’ office walls.
Participatory budgeting is the other key mechanism intended to facilitate the
allocation of resources for investment at sub-national level. In 2002, Parliament
approved a law (Law Nº 27,680) that made participatory budgeting compulsory as a
public practice for all governments at sub-national level. The objectives of this
measure were: (i) to reinforce democracy and good governance by means of civil
society participation, (ii) to promote non-state investment through the involvement
of the private sector in the budgetary process, (iii) to improve the quality of public
spending, (iv) to foster downward accountability and, (v) to encourage the
contribution of the general public in projects that benefit them (Shack, 2006: 69-70).
Each year, the MEF publishes detailed guidelines on how sub-national
governments should carry out participatory budgeting. They introduce small
changes in the procedures, although the main features do not change. First,
potential participants must register to take part in the process. In most
municipalities I visited, all the citizens were invited to take part and in some cases
special status was conferred on civil society organisations and neighbourhood
associations to allow them to present their proposals more extensively and to hold
private meetings with municipal officials. After the governments’ identify the
participants and their training needs, the main exercise is carried out in workshops,
which constitute a crucial stage of the budgeting process. Government officials, 197 This was the case in municipalities around Antamina.

− 178 −
representatives of municipal governments (at the regional budgeting level) and
local communities, members of civil society, and, in a few cases, business-people
review the territory’s challenges and opportunities and fix the criteria for the
prioritisation of projects. Following this process, a technical committee analyses the
economic and practical feasibility of the different proposals. Finally, the president of
the regional government or the mayor of the municipality presents the technical
analysis to the participants who, after deliberation, approve the projects that have
been prioritised. This general procedure has multiple local variations.
After the first few years of compulsory participatory budgeting, Shack (2006:78)
was able to identify some clear shortcomings: (i) a high degree of fragmentation of
investment due to excessive popular expectations, which made it impossible to
focus resources on strategic projects; (ii) lack of technical rigour at the sub-national
level in the implementation of the process; (iii) dislocation between development
strategies and participatory budgeting, and between municipal and regional levels;
(iv) limited representation of participants; and, (v) the absence of effective
mechanisms for monitoring and controlling agreed plans. As I shall show in
subsequent sections, these deficiencies are exacerbated in the case of mining
regions, where increasing resources have flowed.
8.1.5 Quality control of capital expenditure
All public investment projects – including those prioritised through the participatory
budgeting process – must be examined and approved by the NPIS. This body
initially operated within the MEF and was in charge of setting out technical criteria,
methods and procedures aimed at guaranteeing the technical feasibility, and
economic and social profitability of public investment. It was staffed by a body of
civil servants who remained in Lima and were responsible for the evaluation of
projects according to these criteria.
In 2006, the NPIS became a bottleneck in the expansion of public capital
expenditure at sub-national level. Mayors and regional presidents blamed the
system for their failure to meet annual investment targets, raising two separate
objections. First, a centralised system could not cope with the growing number of
projects presented for evaluation and this led to unnecessary delays. Second, the
application of centrally designed criteria meant that local contexts were ignored and

− 179 −
viable or important projects rejected. In 2007, once the escalation of social conflict
was apparent, President Garcia bowed to pressure from the municipal authorities
and ordered the decentralisation of the NPIS. The MEF retained the authority to
define the criteria for the evaluation of projects and had a general monitoring role,
but other functions were delegated to regional and municipal levels to make the
procedure quicker and more flexible. Regional and municipal governments are now
permitted to set up their own Units for Investment Programming, which assume
responsibility for the evaluation of investment projects according to NPIS criteria
and procedures.
The new arrangement introduces greater flexibility into the system, but it also
lowers the technical standards governing project approval. The decentralisation of
the NPIS means that regional presidents and mayors are granted the authority to
hire and fire the personnel responsible for evaluating their proposals. An
independent evaluation of the projects approved at regional and municipal level in
2007 shows that a high percentage did not fulfil the necessary criteria (Ministerio de
Economía y Finanzas, 2009b).
From this one can gauge the influence of institutional mechanisms on the way in
which sub-national governments spend their financial resources, especially those
intended for capital investment, including canon transfers. On this basis, I shall now
examine the extent to which higher canon transfer levels influenced capital
expenditure patterns in Peruvian municipalities during the period 2005-2008.
8.2 Influence of canon transfers on municipal capital expenditure patterns
Does the volume of canon transfers shape in a specific and consistent fashion the
way in which municipalities spend their budgets? To answer this question, I used
regression analysis to test whether higher canon transfer levels led to specific
patterns of spending in Peruvian municipalities in the period 2005-2008. This is a
first approximation to understanding local dynamics in canon-rich municipalities.
8.2.1 Variables and method specification
The first stage of the analysis was to determine how municipalities spent their
money. I therefore compiled a data set containing official information on budget

− 180 −
implementation for all Peruvian municipalities from 2005 to 2008.198 It contained a
very detailed account of capital investment expenditure disaggregated into 48 sub-
programmes by sector. After examining the nature of each sub-programme, I
regrouped them into eleven sectoral categories: (i) education, (ii) water and
sanitation, (iii) health, (iv) electrification, (v) agriculture promotion, (vi) promotion of
other economic activities, (vii) transport infrastructure, (viii) urban infrastructure, (ix)
conspicuous construction, (x) internal functioning, and (xi) other.
The first seven categories are self explanatory as to the sectors they belong to.
They predominantly encompass infrastructure, although in some cases, training
activities are also included. The contents of the following three categories – urban
infrastructure, conspicuous construction, and internal functioning – require further
explanation because this categorisation has methodological consequences. I
included in urban infrastructure only the construction and renovation of streets,
pavements, and public gardens. Conspicuous construction refers to stadiums,
leisure centres, monuments, theatres and community buildings. It is important to
note that I incorporate the construction of simple sports facilities into the ‘education’
category because they often serve the local school. Finally, I put under internal
functioning the construction and refurbishment of town halls, investment in IT
services for the municipal government and any other capital expenditure directly
aimed at improving municipal services. To determine the variable, I calculated the
proportion of capital spending allocated to each expenditure category by
municipality and year.
In the regression analysis, I tested whether the volume of canon transfers received
by each municipality correlated with the percentage of total capital investment
devoted to the different sectors. More specifically, I chose to test the influence of
canon transfers on the top seven sectoral categories, which, on average,
represented more than 90 per cent of total actual capital expenditure in
municipalities with between 3,000 and 200,000 inhabitants located outside the
metropolitan area of Lima (see Table 8.1).
198 Data provided by the MEF.

− 181 −
Table 8.1 Percentage of actual capital expenditure by sector and year in Peruvian municipalities with between 3,000 and 200,000 inhabitants
2005 2006 2007 2008
N = 1,051 N = 1,060 N = 1,072 N = 1,113
Mean Std. Dev. Mean Std. Dev. Mean Std. Dev. Mean Std. Dev.
Education 10.7% 14.0 12.7% 13.3 15.5% 14.1 15.8% 13.9
Water and sanitation 10.0% 14.0 12.7% 14.7 13.7% 15.2 14.2% 16.0
Electrification 5.8% 12.8 7.8% 14.2 5.9% 11.0 4.0% 7.9
Agriculture 4.3% 9.5 6.2% 10.8 8.2% 12.8 9.3% 13.1
Transport 10.2% 15.0 11.6% 14.8 12.2% 15.0 12.2% 14.9
Urban infrastructure 17.4% 21.5 21.1% 21.5 18.5% 19.3 17.3% 18.3
Conspicuous constructions 19.1% 19.5 22.3% 17.9 20.4% 15.8 20.7% 15.7
Source: MEF; adaptation: the author.
In addition to the level of canon transfers that I used in the previous analyses, in
this case, I controlled for other variables that could also influence the allocation of
financial resources to specific sectors:
(i) The ratio of actual capital spending to capital budget. Assuming that municipal
governments aim to spend the whole budget, this variable controls for their
actual capacity to fulfil their plans. This control is important because it is
possible that municipalities lacking the capacity to fulfil their budget allocation
prioritise ‘easy’ sectors in which projects are technically simpler to implement.
(ii) The ratio of current spending to capital spending. This variable controls for the
potential capacity of municipalities in terms of the availability of personnel and
other resources to implement the capital spending plan (Aragón & Casas,
2009).
There are five supplementary variables that might correlate with specific
necessities shaping municipal governments patterns of spending during the period:
(iii) size of the population, (iv) level of poverty in 2007, (v) percentage of the 14–24-
year old population with secondary education in 2007, (vi) percentage of the rural
population in 2007, and (vii) percentage of the indigenous population in 2007. I also
included year dummies to control for year-specific processes affecting all
municipalities. These dummies are especially important because municipal

− 182 −
government budgets increased significantly from 2005 to 2008 and this general
tendency may have influenced their priorities (see Appendix XI for a summary of all
variables).
To compute the multiple regressions, I used OLS analysis with robust standard
errors to correct heteroskedasticity.
8.2.2 Results: less spending on basic services and more on concrete
The analysis shows that the level of canon transfers negatively correlates with the
proportion of the capital spending budget allocated to the provision of basic social
services and transport infrastructure. In contrast, canon transfers positively
correlate with expenditure in agriculture, urban infrastructure, and conspicuous
constructions. In the next paragraphs I discuss separately the results for each one
of these sectors (Table 8.2 summarises the seven regression analyses).
Basic social services
First, canon transfers negatively correlate with the percentage of capital
expenditure allocated to education services, construction of water and sanitation
infrastructure, and electrification. In the case of investment in education and water
and sanitation, this negative correlation is statistically strongly significant – at 1 per
cent. This coincidence notwithstanding, the following discussion clarifies why the
reasons behind these results could be different in each case.
Municipal governments’ capital investment in education is mainly restricted to the
provision, renovation, and maintenance of physical facilities, limiting the amount of
money that canon-rich municipalities can allocate to this sector. Even if canon-rich
municipalities rebuilt all the schools under their jurisdiction – which in fact they
frequently do – the requisite expenditure would consume a relatively small
proportion of the available budget.
Investment in water and sanitation infrastructure is a different case. This basic
service is far from adequate in most canon-rich municipalities, and municipal
governments could well invest more in the expansion of these services. Before
elections and at every annual public hearing, virtually every mayor promised to

− 183 −
deliver in this area.199 Yet a combination of factors - the greater technical
sophistication of this type of project, the longer time needed for implementation and
prevalence of incentives to prioritise short-term, more visible works, contribute to
the neglect of projects in this sector.
Electrification is a relatively minor line item in the municipal government budget, a
situation that has become even more apparent in recent years (see Table 8.1). As
the previous chapter notes, electricity coverage has improved markedly throughout
the whole country, and most dramatically in canon-rich municipalities. Therefore,
given the nature of investment and the current level of coverage, it is logical to
assume that canon-rich municipalities with higher overall budgets expend a lower
proportion on the expansion of this service – because it is there already or
connection to the grid is relatively simple as mines in the area are already
electrified.
Transport infrastructure
Second, spending on transport infrastructure negatively correlates with canon
transfers. This result is difficult to explain because improvement of the rough tracks
connecting rural communities was a constant demand in the participatory budgeting
workshops that I attended in canon-rich municipalities. In some workshops the
municipal officials blamed the strict NPIS regulations for lack of further investment
in the sector. The NPIS did not allow road improvement without clear evidence that
enough cars and trucks were already using them regularly. For the population it
was a chicken and egg situation: they needed more cars circulating to be allowed
to improve the tracks, but they needed better roads to get more cars circulating.
199 The population demanded the fulfilment of these promises in different public meetings I attended: Cerro de Pasco (15-04-2008); Ninacaca (21-05-2008); Huaripampa (5-07-2008); and urban nucleus of San Marcos (6-07-2008).

Table 8.2 Regression of canon minero transfers and other socio-economic variables on the allocation of capital investment in municipalities with more than 3,000 inhabitants, by sector according to annual budget execution (2005–2008)
Time frame Panel data 2005–2008 Model specification OLS regression with robust standard errors and year dummies Dependent variable: percentage of capital investment
Education Water and sanitation Electrification Agriculture Transport
infrastructure Urban
infrastructure Conspicuous constructions
Log of canon transfers per capita -.008
(.003)*** -.016
(.003)*** -.004
(.002)* .021
(.002)*** -.010
(.003)*** .010
(.004)** .022
(.004)***
Ratio of actual capital spending to capital budget -.049
(.011)*** -.045
(.013)*** .008
(.010) -6.7e-4 (.011)
.017 (.012)
.035 (.015)**
.039 (.015)**
Ratio of current spending to capital spending -.001
(2.7e-4)*** -.003 (.002)
-9.3e-4 (3.3e-4)***
.002 (1.9e-4)***
-9.1e-4 (3.7e-4)**
.001 (.002)
-.001 (4.3e-4)***
Log of population -.016
(.005)*** -.010 (.007)
-6.2e-4 (.004)
-.029 (.004)***
-.029 (.006)***
.115 (.009)***
-.045 (.008)***
Poverty (2007) .001
(1.6e-4) -7.0e-4
(1.8e-4)*** -7.7e-5 (1.2e-4)
8.8e-4 (1.2e-4)***
4.5e-4 (1.7e-4)***
-.001 (2.1e-4)***
-2.2e-4 (2.1e-4)***
Percentage of the 15–24-year old population with secondary education in 2007
-.040 (.019)**
.003 (.019)
.026 (.018)
.067 (.016)***
-.134 8.021)***
.086 (.020)***
.050 (.023)**
Percentage of the rural population in 2007 3.6e-4
(1.2e-4)*** -2.3e-4
(1.3e-4)* .001
(9.9e-5)*** 1.5e-4
(8.8e-5)* 9.5e-4
(1.2e-4)*** -.002
(1.4e-4)*** 3.3e-6
(1.5e-4)
Percentage of the indigenous population 2007 4.9e-5
(8.5e-5) 1.1e-5
(8.2e-5) -2.5e-4
(7.0e-5)*** 7.4e-4
(7.3e-5)*** -5.1e-4
(9.4e-5)*** 6.3e-5
(9.4e-5) -7.0e-5
(1.0e-4)***
Year2006 .025
(.006)*** .032
(.006)*** .021
(.006)*** .016
(.005)*** .011
(.006) .030
(.009)*** .025
(.008)***
Year2007 .046
(.006)*** .039
(.007)*** .003
(.005) .032
(.005)*** .023
(.007)*** .008
(.008) .004
(.008)
Year2008 .053
(.006)*** .050
(.007)*** -.016
(.005)*** .041
(.005)*** .020
(.006)*** -.005 (.008)
.003 (.008)
R2 .11 .05 .08 .23 .16 .31 .03 N 4,025 4,025 4,025 4,025 4,025 4,025 4,025
Notes: intercept calculated although not reported; standard errors in parenthesis; *** significant at 1% level; ** significant at 5% level; *significant at 10% level.

− 185 −
Agriculture
Third, in contrast to the previous sectors, investment in the promotion of agriculture
strongly correlates with high volumes of canon transfer. Moreover, both the
regression coefficient and the proportion of variance explained by the model are
higher than in most other sectors. The convergence of two dynamics seems to
account for this correlation. On the one hand, in most rural municipalities there is
very little capital expenditure and local authorities use it almost exclusively for the
provision of basic services. Thus, it is to be expected that the higher the canon
transfers, the more likely the municipality will have outstanding resources to invest
in sectors other than those covering basic services. On the other hand, greater
expenditure in agriculture promotion constitutes a mechanism for the resolution of
tensions between different groups in canon-rich municipalities. In recent years,
peasant communities in the rural areas of mining municipalities have claimed that
they do not benefit from canon transfers. They accuse the mayors of being mainly
responsive to the demands of the population in the urban nucleus of the
municipality. However, given sufficient financial resources, scaling up investment in
irrigation projects or in the acquisition of improved animal breeds to distribute to
farmers is quite a popular way of appeasing the rural population.
Urban infrastructure and conspicuous construction
Fourth, investment in urban infrastructure and conspicuous construction strongly
correlates with the level of canon transfers. This is not surprising, as the capacity to
invest in these sectors is almost unlimited and construction works have the political
advantage of being labour intensive. Thus, disproportionate numbers of stadiums,
monuments, and decorative pavements and street furniture are common in canon-
rich municipalities. In this case, the fact that the variable is a proportion of the total
capital spending budget makes the differences between canon-rich and canon-poor
municipalities even greater in terms of per capita investment in these two sectors.
These results provide an initial though incomplete insight into the pattern of public
spending in canon-rich municipalities. But the analysis has three limitations. First,
the comparison of spending in each category across municipalities only measures
the relative effort of each municipality. In other words, given the huge differences
between municipalities in terms of per capita budget, it is very likely that in per

− 186 −
capita terms, canon-rich municipalities spend more in all sectors than the rest of the
municipalities. Second, some of the models do not explain the observed variation in
spending patterns (see values of R2 in Table 8.2), meaning that they capture only a
part of the history; and third, the results do not clarify the reasons behind the
investment decisions of municipal authorities.
In the previous two chapters I argued that sub-national governments spend canon
transfers inefficiently, at least, in terms of welfare achievement (Chapter 7). This
lack of results is probably due to the allocation of revenue that does not prioritise
improvement in basic services. This preliminary explanation needs to be
substantiated with grassroots evidence. In the following sections, I examine data
collected during my visits to 18 canon-rich municipalities in three Peruvian mining
regions in order to gain a better understanding of local processes accounting for
the lack of social benefits. I undertake the analysis in two steps. First, I examine the
extent to which lack of technical capacity within municipal governments is
responsible for the inefficient use of canon transfers. I discovered that although lack
of capacity is an important issue, it alone cannot explain the use that municipal
governments made of canon transfers (Section 8.3). Second, I present my own
diagnosis of the problem through the analysis of some case studies (Sections 8.4
and 8.5).
8.3 Lack of technical capacity does not explain everything
In Lima, the official discourses on the shortcomings of service delivery in canon-rich
municipalities were unanimous: lack of capacity within municipal government was
to blame. In a context of conflict escalation in mining regions, this was a convenient
explanation as far as both the national government and the companies were
concerned. The explanation diverted popular attention from their own functioning
to the poor performance of local authorities.
What did people mean when they pointed to lack of capacity as the main problem
in municipal government in canon-rich municipalities? Most of my interviewees in
Lima cited the inability of municipal governments to implement a large proportion of
their capital investment budgets as both a major proof of this lack of capacity and
the reason for the only small improvement in social indicators (Aragón & Casas,
2009). They signalled a lack of skilled professionals and poor municipal planning as

− 187 −
the principal factors behind the inability to spend the budget appropriately.200 The
argument was simple:
Lack of results Inability to spend
the capital spending budget
Lack of technical capability and good
professionals
This diagnosis had two practical consequences. First, some of the mining
companies, the IFC, the United States Agency for International Development
(USAID) and the Canadian International Development Agency (CIDA) decided to
spend money on capacity building programmes for canon-rich municipal
governments (Antamina, 2009; Programa Canon, 2010). Second, the national
press constantly monitored the performance of municipal authorities (El Comercio,
2008c; La República, 2008).
To check the accuracy of this lack-of-capacity argument I compare the ‘technical
capacity’ of 18 canon-rich municipalities in three different Peruvian regions with
their ability to spend their budget. If these two variables correlated, the causal link
between lack of capacity and municipal governments’ poor performance would still
be plausible. On the contrary, if these two variables did not correlate then the
causal explanation lay elsewhere.
8.3.1 The technical capacity of municipal government: putting the concept into
action
Measuring the ‘capacity’ of the 18 municipalities was not an easy task. I had to
overcome two interrelated difficulties: the conceptualisation of ‘capacity’ and access
to the relevant information. Regarding conceptualisation, my main task was to
determine which measurable factors accounted for an aggregate indicator of
municipal ‘capacity’. Fortunately some authors have undertaken similar task in
recent years (Fiszbein, 1997; Grindle, 2006, 2007). Their studies provided me with
a sound methodological foundation, but I needed to face a second, very practical,
problem. I had a fixed itinerary for visiting each municipality and from my previous
200 Interviews 2008-023 (Lima, 16-04-2008); 2008-83 (Lima, 09-06-2008); and 2008-086 (Lima, 11/06/2008).

− 188 −
experiences in the field, I knew that I would need to spend a good deal of time
chasing up officials in order to interview them. Moreover, I soon realised that the
authorities in canon-rich municipalities who felt uneasy at being under scrutiny were
not happy at the prospect of a researcher digging deeply into the intricacies of their
operations. Therefore, it was not realistic to think that I could conduct a thorough
and systematic analysis of all the elements that might account for their capacity –
or lack of it.
To solve the problem, I decided to design a Municipal Capacity Index (MCI)201
comprising a basic checklist that municipal officials and authorities would regard as
relatively ‘inoffensive’. The intention was not to capture all possible factors
contributing to the technical capacity of a municipality or provide the most accurate
measure of municipal capacity. I was interested in building an index that captured
the basic set of procedures and policies that a municipal government needs to put
in place to ensure it spends its capital budget efficiently. I selected three factors
that according to the literature, influence both the quality of investment and
efficiency in allocating resources (Fiszbein, 1997:1031-1032): (i) municipal
planning; (ii) management of information; and (iii) personnel policy.
These three factors were equally weighted with scores ranging from zero to ten.
Thus, each municipality could score up to a maximum of 30 points according to the
following criteria:
(i) Municipal planning: Is there a Medium-term Municipal Plan (MMP) that is
actually used as the basis for making decisions about capital investment? The
score for this factor ranges from zero to ten according to the following criteria:
a. The municipality has an MMP: 3 points
b. The MMP reflects municipal realities and needs: up to 2 points
− The MMP has a clear understanding of the issues involved: 1 point
− The MMP identifies specific solutions: 1 point
c. The MMP is actively used for the approval of projects via participatory
budgeting: up to 3 points
− Used marginally: 1 point
201 This type of index was inspired by Grindle’s work on performance indicators for municipal governments (2007:56-61).

− 189 −
− Central to the process: 3 points
d. A mechanism is in place to review the MMP: 2 points
(ii) Management of information: Extent to which the municipal manager is able to
provide documentary proof of management: up to 10 points:
a. The complete MMP: 1 point
b. Statistics for staff employed by the municipality during the previous two
years: 1 point
c. Municipal budget and economic performance reports for the last four
years: up to 4 points (1 point per year)
d. List of investment projects executed in the last four years: up to 4 points
(1 point per year).
(iii) Personnel policy: stability and professionalism of municipal personnel
according to the following criteria:
a. Percentage of civil servants replaced after the most recent election: up to
6 points
− <50 per cent: 5 points; 50–60 per cent: 4 points; 60–70 per cent: 3
points; 70–8 per cent: 2 points; 80–9 per cent: 1 point
− An additional point if there has been no systematic turnover of staff in
the previous two years
b. Recruitment policy prioritises professional capacity over political loyalty:
up to 2 points
− A human resources team is responsible for recruitment according to
clear job descriptions: 2 points
− The mayor take responsibility for recruitment and relevant line
managers are also consulted: 1 point
− Sole responsibility for recruitment rests with the mayor: 0 points
c. Employee training: up to 2 points
− Explicit and independent municipal policy on training: 2 points
− Municipality responds to offers from the national government: 1 point
− Municipality does not consider training to be important: 0 points

− 190 −
The first column in Table 8.3 shows the results of this indicator for the 18
municipalities under study and their average score aggregated by region. The
results reveal that in most municipalities, there was effectively plenty of room for
capacity building. However, they also indicate that capacity varied widely among
the 18 municipalities.
Table 8.3 Municipal capacity index (MCI) for 18 municipalities and comparative proportional execution of the capital investment budget (2007–2008)
Municipality Municipal Capacity Index (MCI)
Percentage of capital investment budget used
(average 2007–2008)
Per capita capital investment budget in PEN
(average 2007–2008)
ANCASH
Regional average 12 51% 9,284
Jangas 12 56% 3,561
Huari 16 53% 6,407
Cajay 14 80% 8,462
Chavin de Huantar 22 41% 8,238
Huachis 3 69% 7,430
Ponto 4 51% 8,422
San Marcos 14 7% 22,471
MOQUEGUA
Regional average 15.8 53% 7,590
Moquegua 15 55% 4,205
Carumas 17 46% 9,212
Samegua 18 51% 3,382
San Cristobal 11 54% 4,779
Torata 18 60% 16,373
PASCO
Regional average 14 39% 3,169
Huachon 19 62% 2,920
Huayllay 15 35% 3.728
Ninacaca 10 29% 3,261
S. Fco de Yarusyakan 15 31% 2,848
Simon Bolivar 21 45% 2,469
Tinyahuarco 4 30% 3,769
Source for columns 2 and 3: MEF; adaptation by the author
The aggregation of the MCI by region reveals some tendencies. Municipalities in
Moquegua had the highest average institutional capacity rating (15.8), while those
in Ancash had the lowest MCI (12); and Pasco was somewhat in the middle (14).202
202 It is important to note that at the time of my field research in Ancash, Antamina was implementing a vast programme of capacity building in Huari, Chavin de Huantar and San

− 191 −
These regional averages are consistent with the wider trends I observed during my
research. Given that municipal governments were not staffed by a stable group of
officers, the institutional capacity of the municipalities was frequently determined by
the regional level presence of a pool of professionals with technical expertise in the
management of sub-national governments. The next brief characterisation of
municipal features at regional level is of help in making sense of the average
scores, and provides a background for the subsequent analysis of local dynamics.
The higher capacity of municipalities in Moquegua was not a chance occurrence. In
the 1980s and 1990s, Moquegua was the cradle of a national policy of municipal
management renovation. The experience of the municipality of Ilo in participatory
governance and excellent record in the provision of services attracted attention and
inspired national legislative reform in the 2000s (Diaz Palacios, 1990; García de
Chu & Piazza, 1998). Ilo and Moquegua − the provincial municipality − were also
promoters of a new generation of public servants. In 2002, the ideological line of
Ilo’s municipal government changed. The new conservative mayor rejected the
political stance of the previous administration and fired most of the public servants
employed. These officials subsequently sought reinstatement in the regional
government and other municipalities, helping to improve the technical capacity of
these institutions.
Pasco was an intermediate case. Canon transfers to the region had increased
substantially, but were still far lower than transfers to Ancash and Moquegua. Most
professionals in the municipalities came from the city of Cerro de Pasco or
Huancayo, the capital town of the neighbouring region. Lower salaries in the region
– in comparison to Ancash and Moquegua – meant that its municipalities were able
to recruit two different types of people as managers. The first group comprised
mature bureaucrats who had worked for different public institutions in the past but
had not enjoyed a sufficiently successful career to secure a permanent job or
migrate to a more attractive area of the country. The second group consisted of
young professionals who considered their appointment to be the door to a
Marcos, the three municipalities that scored the highest in the region. Even if this programme cannot in any way be regarded as a success (see discussion in Section 8.4), it is clear that the external consultants hired by Antamina were instrumental in providing managers with the municipal planning documentation I was asking for. Their scores – and consequently, the regional average – would have been even lower without this last minute superficial fix.

− 192 −
professional career in public administration. For example, the high MCI scores for
Huachon (19) and Simon Bolivar (21) were due to the work of two brilliant recent
graduates of the regional university. The mayors trusted them and the youngsters
were keen to use the opportunity as a springboard to higher profile jobs in Pasco
or, if possible, Lima.203 However, not all managers could afford the level of
professional dedication these two young managers showed. Low public sector
salaries frequently prompted municipal managers to supplement their earnings with
consultancies in the design of investment projects for other municipalities – and
sometimes, even for the one that employed them.
The context was different in Ancash. All the municipalities under study with the
exception of Jangas were in the Conchucos Valley, traditionally one of the most
impoverished territories in Peru. Until the recent boom in canon transfers, the
average municipality had barely two or three employees to carry out all basic
administrative duties. Even when canon transfers did start to flow into the municipal
coffers, mayors were still unable to recruit sufficient professionals locally to manage
the municipalities in this novel situation. Thus, hiring skilful advisors with the
capacity to navigate the welter of regulations governing Peruvian municipal life was
the top priority of all mayors after the 2006 election. However, their most urgent
concern was not to improve the overall capacity of the municipality, but to
accelerate public spending and win popular support.
Not surprisingly, the whiff of money attracted an array of shady characters to
Conchucos. Municipal managers of dubious reputation proliferated, some of them
convicted of mismanagement during previous tenures in other municipalities in the
country. Often, the attraction was not so much the official salary as the opportunity
to strike lucrative deals with contractors and consultants.
8.3.2 The non-correlation between capacity and quick spending
In a second step, I wanted to compare the MCI with the popular narrative that
highlights the inability of municipal governments to spend a larger proportion of
their capital investment budget as the main indicator of lack of capacity. The
second column of Table 8.3 shows the average proportion of the annual capital
203 Personal interviews 2008-052 (Simón Bolivar, 21-05-2008), and 2008-082 (Huachón 4-06-2008).

− 193 −
expenditure budget that was actually used in each municipality in 2007–2008.204
The same table also provides figures for the per capita capital investment budget of
each municipality in order to make the comparison meaningful.
The lack of correlation between the MCI and the percentage of the budget that was
actually spent is immediately apparent. The figures do not correlate either when
they are considered separately for each municipality or when aggregated by region.
Municipalities with very low MCI scores, such as Huachis and Ponto, reached high
degrees of budget implementation, while some municipalities at the top of the MCI
ranking e.g. – Chavin de Huantar and Simon Bolivar – were not so effective in
terms of spending. The aggregation at regional level shows a similar
counterintuitive tendency: the fact that they had low MCI scores notwithstanding,
municipalities in Ancash − except San Marcos − spent a greater percentage of their
budgets than their counterparts in the other two regions.
These puzzling results indicate the need to look for alternative factors in these
canon-rich municipalities not included in the conventional paradigm of capacity, but
which determine the ability of the governments to put in place their investment
budgets more comprehensively. Moreover, the existence of municipalities with
quite different levels of capacity plays down the importance of the lack-of-capacity
argument for explaining the general difficulty canon-rich municipalities have in
translating canon transfers into improved welfare, as indentified in the indicators.
Based on my discussions with local actors in the 18 municipalities of my field
research, and attendance at seven participatory budgeting workshops, in the
following two sections I propose an alternative explanation for the lack of positive
results in canon-rich municipalities and lack of positive correlation between capacity
and ability to spend.
8.4 Political survival, canon transfers, jobs, mafias, and popular participation in Conchucos Valley (Ancash)
Before the 2006 elections, the municipalities of Conchucos Valley in Ancash had
already started to receive a substantial volume of canon transfers generated by
Antamina’s corporate taxes. The use of canon minero revenue subsequently 204 I have taken 2007-2008 to capture the performance of the governments that were elected in 2006 and were in office, when I calculated the MCI.

− 194 −
became a central issue in the electoral campaign. People voted those candidates
who promised public works to improve the infrastructure, job creation being the
salient point. After popular frustration caused by lack of employment opportunities
in the Antamina mine in the early 2000s, this time, people hoped that the revenue
accruing to municipal governments would provide better job prospects. Thus, the
new mayors who took office enjoyed strong popular support, but the onus was on
them to deliver on their promises.205
The mining companies and central government also put pressure on canon-rich
sub-national governments to deliver in a timely fashion. In a context of conflict
escalation in the mining regions, the central government held municipal
governments responsible for popular discontent due to their inability to execute
their budgets promptly (La República, 2008). Both municipal authorities and the
general public felt that such accusations signalled a covert strategy to recentralise
the management of mining revenues (La Primera – Huaraz, 2008). Therefore, they
felt compelled to demonstrate their competence. Simultaneously, mining
companies also demanded quicker implementation of development projects in
order to show that mining could benefit the people living close to their operations.206
Two years later, in 2008, the situation of the municipal governments in Conchucos
was perplexing. In the words of the regional anticorruption prosecutor, “Conchucos
has become a mafia-territory.”207 Disreputable businessmen seeking lucrative
contracts infiltrated town halls; mayors took to carrying guns;208 ‘conspicuous
construction’ and decorative pavements proliferated; and rumours of
mismanagement were widespread. However, the majority of the population turned
a blind eye because they could count on coveted jobs in public works.
To comprehend this situation, I analysed how the abundance of canon transfers
has generated corruption, distorted mechanisms for popular participation and
rendered attempts to generate institutional capacity at municipal level futile.
205 See Table 6.3 for the percentage of votes received by the mayors of these municipalities. 206 Interviews with senior managers of mining companies: 2008-083 (Lima, 9-06-2008), and 2008-084 (Lima 10-06-2008). 207 Interview 2008-092 (Huaraz, 17-06-2008). 208 Interview 2008-133 (Huachis, 11-07-2008).

− 195 −
8.4.1 The tolerance of corruption
The recent history of the Conchucos Valley leaves very little doubt as to the
alarming extent of corruption in municipal government. Leaders of minority
opposition groups frequently recounted stories of dishonesty and mismanagement
during my visits to the various municipalities;209 indeed, corruption had become a
serious problem for them. Yet, the local drivers, peasants, and small traders I met
during my journeys by public transport across the valley were more cynical:
corruption had always existed but it was tolerated if it meant that the authorities
could bring benefits to the people.210
As I went about my fieldwork, it was difficult to assess how accurate these
accusations were. Some people provided me with strong evidence of corruption in
San Marcos, but I did not get similar confirmation from other municipalities.
Ironically, a few months later, clear evidence of dishonesty in these municipal
governments came to light. In June 2009, the Front for the Defence of Cajay
published official reports revealing the existence of irregularities in the municipal
government concerning purchasing processes and bids for construction contracts
(La Primera – Huaraz, 2009). Soon after this, the mayor of the neighbouring
municipality of Huachis was arrested and thrown into jail, accused of contracting
out excessively remunerated public works to his own family (Peru21, 2009).
Furthermore, in 2009, the National General Comptroller launched ‘Operation
Condor’, whose brief was to verify popular accusations, which led to the mayors of
Huari, Chavin de Huantar and San Marcos being charged with various counts of
corruption for offences committed in 2007 and 2008 (Contraloría General de la
República, 2010).
Having personally listened to the mayors’ side of the story, I tend to believe that
plundering the coffers of the municipality had not been uppermost in their minds
when they decided to stand for election. Of course, they aspired to make some
money out of their position, but they also genuinely hoped to improve public
services in their respective municipalities. But soon after taking office, they became
209 Personal Interviews 2008-123 (San Marcos, 7-07-200), and 2008-124 (San Marcos, 8-07-2008). 210 Huber (2008) found similar popular reactions in other Peruvian regions.

− 196 −
entangled in a web of vested interests. How did it all go so wrong? The history of
San Marcos sheds some light on the course of events.
The district of San Marcos has 14,000 inhabitants and hosts the Antamina mine.
Felix Solorzano – nicknamed ‘the Fox’ – won the 2006 municipal election with 38
per cent of the vote (ONPE, 2007), an achievement due to his previous job as a
taxi driver, whereby he enjoyed a good rapport with the rural population. Felix
started his political career at the local branch of the American Popular
Revolutionary Alliance (APRA), teaming up with Glicerio Mauricio, the previous
mayor. However, before the election he split with his former mentor and put forward
a radical platform endorsing popular grievances against the incumbent mayor and
Antamina. The rural population of San Marcos perceived that this was an historic
opportunity to break the traditional domination of two well-off families that had
alternately controlled the municipal government for the previous decade. However,
once in power, Felix was less critical of Antamina, arguing that collaboration with
the company would help improve the lot of the population. His critics claimed that
jobs at the mine for relatives and friends had been the main motivation for his
change of view.
When it came to the use of canon transfers, the new mayor championed the direct
execution of investment projects without contracting the work out to private
companies.211 According to Felix, direct management had two main advantages.
First, it allowed the municipal government to save the fee it would have paid to the
contractor and also the accompanying value added tax related to the hiring of a
workforce by the contractor. Second, and more importantly, it gave the mayor the
power to hire the workforce directly. However, the municipal government did not
have the personnel or the expertise to manage the equivalent of a large
construction business and the venture failed. In 2007, the municipality of San
Marcos only used four per cent of its total capital investment budget (Ministerio de
Economía y Finanzas, 2010). That year, the mayor hired three different general
managers in an attempt to speed up budget implementation. One after the other,
the three failed to hired competent professionals and to set up the structure
211 This direct management involved (i) contracting a consultant to design an investment project that met NPIS criteria; (ii) ensuring all the administrative requirements for the formal approval of a given project were in place; (iii) putting a contract for the acquisition of materials out to tender; (iv) hiring engineers to manage the project; (v) hiring the workforce; and finally (vi) coordinating the jobs of the various actors involved.

− 197 −
necessary to implement directly the large amount of investment projects budgeted
for.
At the end of 2007, under growing popular pressure, the mayor decided to hire a
more experienced general manager. When asked about the job description, the
mayor confessed that he had been looking for “a brainy guy who could help me find
my way around the law”.212 As the candour of this confession implies, the job
specification did not suggest any deliberate intention to commit a crime; he simply
wanted to take advantage of any loopholes in the law and strict regulations in order
to run the municipal government in a more flexible and effective manner.
Hiring experienced managers was in itself a substantial challenge. In a populist
move, President Garcia introduced a governmental decree aiming to regulate – in
fact, reduce – the remuneration of municipal employees.213 Consequently, salaries
were capped in accordance with the size of the municipality’s population,
regardless of the size of the municipal budget. Thus, in 2008, the official monthly
salary of the mayor of San Marcos was PEN 1,700 (USD 575). According to the
decree, no other municipal employee could earn a higher salary than this. This
meant that mayors were faced with the challenge of trying to recruit skilled
municipal managers willing to move to a remote and poor corner of the country in
return for an insubstantial salary. Not surprisingly, this unfortunate combination of
restrictions attracted applicants who looked for other ways to profit from the position
in addition to drawing a salary. In the case of San Marcos, at least two general
managers hired in 2007 and 2008 respectively had previously been indicted for
mismanagement in other municipalities (Primera Página, 2009).
The municipal managers’ ideas of interpreting the law flexibly went too far. They
had a predilection for swelling their basic salaries on the pretext of having been
recruited as consultants to the municipality.214 They took bribes in return for hiring
architects and engineers to design investment projects that were frequently blatant
copies of similar proposals submitted to other municipal governments. And, finally,
212 Interview 2008-111 (Ancash, 02-07-2008). 213 Supreme Decree Nº 025-2007-PCM. 214 The revision of investment projects in the 18 municipalities under study revealed that the heading ‘institutional strengthening’ systematically concealed significant recurrent budget items for the payment of municipal officials’ salaries.

− 198 −
they rigged tendering processes in favour of contractors who, in return, shared part
of their profits with them.
Obviously, these managers paid little heed to institutional capacity building in San
Marcos, being preoccupied with keeping the wheels of their own businesses rolling.
Thus, they gave their cronies jobs in certain key positions in the municipality,
leaving the mayor to hire as many of his supporters as he could cram into the
municipal departments.215 This resulted in a situation in which the bad technical
quality of projects and lack of professionalism in the municipality made it impossible
to improve the rate of budget allocation to projects to any great extent – just ten per
cent in 2008 (Ministerio de Economía y Finanzas, 2010). Surprisingly, almost 45
per cent of this budget went to education projects. But the seemingly high priority
given to the sector was not the result of a well thought out plan, but of short-term
convenience. The construction of new schools in different villages and municipal
suburbs was technically the easiest kind of project to implement because it relied
on standard buildings that could easily be replicated in different neighbourhoods.
In May 2008, the town clerk and one counsellor in the municipality on the mayor’s
electoral list publicly denounced the corrupt practices in the municipality and
accused the mayor and general manager of mismanagement. Assessing the
evidence, a majority of the councillors – three out of five – asked the National
General Comptroller to launch a formal inquiry into the municipal accounts. The
non-appearance of substantial public works together with these accusations
galvanised public discontent. Some local groups called for a demonstration to be
held on the 26th of June demanding the mayor’s resignation.
At the same time, the municipal management team dreamt up a crude but effective
response. Taking advantage of a supreme decree allowing the use of up to 20 per
cent of canon transfers for the maintenance of public infrastructure, the municipality
organised a ‘pilot scheme’ popularly dubbed the ‘messing about scheme’ (el plan
hueveo). The popular nickname of the scheme indicated its lack of substance:
teams of labourers scattered across the district engaged in extremely minor, often
completely unnecessary jobs. Through this policy, the municipality hired between
1,000 and 1,500 unskilled labourers in cycles of 15-day shifts. This meant that
215 In 2008, San Marcos had around 120 management and administrative staff, although the number varied quite widely from month to month owing to a high turnover.

− 199 −
everyone in the municipality had the chance to earn a wage through work offered
by this programme for 15 days every two months. The basic wage was PEN 450
(USD 150) for the two weeks, and the foremen earned PEN 600 (USD 200), which
was quite good pay in the local context.216 Not surprisingly, the majority of the
population welcomed the initiative.
In the days leading up to the demonstration planned for 26th June, municipal
employees spread the rumour that opposition groups intended to stop the ‘pilot
scheme’, and asked those employed on it to demonstrate their loyalty to the mayor.
Consequently, on the 26th, people from the rural areas poured into town to defend
the mayor’s policies. The opposition had to withdraw its protest and appeal to the
police for protection. Thus, in spite of poor local governance and unquestionable
evidence of mismanagement, the mayor whipped up sufficient popular support to
stay in office until his tragic death in a road accident in November 2009.
There were similar situations in the other five municipalities under study around
Antamina – Huari, Chavin de Huantar, Cajay, Huachis and Ponto. Although in a few
municipalities I found some honest and genuinely dedicated officers, it seemed that
most mayors and municipal managers had become entrapped in similar ways to
San Marcos; they were involved in the same corrupt practices and also resorted to
clientelistic strategies in order to hold on to their posts. However, in contrast to San
Marcos, these municipalities were more successful in executing their capital
investment budgets. The mayors did not manage public works directly and
subcontracted them out to private firms. This proved to be a more effective way of
spending the money and, apparently, presented even more opportunities for private
gain. Usually, the mayors would arrange with the company implementing the
project for an unskilled labour force to be hired locally, but the mayors tacitly
reserved the right to propose the job applicants themselves.
In 2008, the majority of the population in these municipalities worked for the
municipality. As in San Marcos, the populace did not show any great interest in
tackling corruption, and most mayors maintained their positions without any
significant opposition.217 As noted in Chapter 6, when the people occasionally
216 Information provided by the mayor and the general manager of the municipality and contrasted with people working in the scheme. 217 Cajay was a relative exception. The mayor won the election with only 23 per cent the vote and faced strong opposition from the candidate that came second. In 2008, the opposition

− 200 −
showed signs of discontent, the mayors were able to direct their grievances
towards the incompetence of the regional government.
Finally, the canon transfers gave municipal authorities the chance to silence the
critics in the local media. The general literature on decentralisation and corruption
emphasises the importance of an independent press able to monitor the activities
of bureaucrats (Lessmann & Markwardt, 2010). Unfortunately, the few radio
stations broadcasting in the Conchucos Valley were quickly ‘bought off’ by the
municipal authorities with the aid of publicity contracts. In some cases, as in San
Marcos, the municipality directly recruited the most outspoken local radio presenter
to the mayor’s team of advisors and provided new equipment for his station. As the
mayor enjoyed good relations with Antamina – the only alternative source of
publicity – none of the other local radio stations could risk criticising the
management of the municipality.
8.4.2 The distortion of participatory mechanisms
It is widely accepted that participatory mechanisms at municipal level tend to
reinforce downward accountability and foster responsiveness to the needs of the
population (Cabrero, 2007; Cheema, 2007). Research on Peruvian
decentralisation has reached similar conclusions (Brinkerhoff, Brinkerhoff, &
McNulty, 2007; Grompone & Glave, 2009; McNulty, 2006). Without denying the
general validity of these findings, my research indicates that in canon-rich
municipalities, the high volume of mining rents combined with widespread distrust
in public institutions has distorted the aims and practice of participation. In the next
paragraphs I review how two mechanisms, the right of citizens to demand a recall
election and participatory budgeting, have been instrumental in shortening the
planning horizon of municipal governments, promoting quick spending irrespective
of the quality of the projects, and loosening the social control over corruption.
The right to demand a recall election has made it more difficult to implement some
of the policies conventionally recommended for the effective use of mining revenue
in canon-rich municipalities. Economists advise that the decentralisation of mining
and oil revenues to sub-national governments should incorporate a mechanism to
collected signatures to organise a recall election, but the mayor was victorious and stayed in office.

− 201 −
operate the expenditure of windfalls, so improving the efficient use of the revenue
(E. Ahmad & Mottu, 2003; Brosio, 2003). In the Peruvian case, the most obvious
way to do this would be to defer part of the canon transfer for use in subsequent
years, a measure which would help improve both the planning process and the
quality of investments.
Three reasons made the introduction of this type of policy politically unfeasible in
canon-rich municipalities during the last mineral price boom. First, people did not
trust public institutions or believe that they would keep the revenue set aside for
future use in a responsible manner. Moreover, they feared that the central
government would eventually appropriate any portion of the canon transfer that the
municipality had not spent within the fiscal year. Second, given that employment in
public works was the population’s top priority, any attempt to slow down the rate of
expenditure would have been highly unpopular. Third, the previous two obstacles
might have been overcome if the mayors had had sufficient time to demonstrate
that better planned expenditure improved the quality of investments. But this was
not the case: the citizens’ right to demand a new election of municipal authorities
was a constant threat that narrowed the planning horizon of municipal
governments. As the mayors of three of the municipalities under study − Cajay,
Carumas and San Cristobal − realised in 2008, winning a municipal election no
longer guaranteed a full four-year term of office; they had to win a recall election to
stay in post (ONPE, 2009). This meant that they needed to deliver results in a
timely fashion in order to appease a population that was not willing to wait until the
end of an incumbent’s official term to evaluate his performance.
The increasing popular pressure to deliver as quickly as possible and the priority
given to the creation of jobs also distorted participatory budgeting in canon-rich
municipalities. Shortly after being made compulsory, Remy (2005: 140-143) pointed
out that the regulation of the budgeting process afforded municipal authorities
substantial discretion in the final decisions about which projects were to be
executed. Popular participation focused on suggesting proposals for projects and
prioritising them. However, people were required to vote before information was
available about the technical constraints or cost of a project. According to municipal
managers, providing this information would have been very costly and held up the
process. Consequently, general ideas about projects that might be implemented
were passed on to municipal bureaucrats who made the final decision about which

− 202 −
initiatives should be implemented. This technical phase of the process became a
‘black box’ that selected from and filtered out popular proposals with no
transparency concerning the criteria employed. When municipal authorities had to
account for their decisions, they usually hid behind statements about their
compliance with national legislation, and the requirements of NPIS and other
regulatory bodies were used to justify decisions made the previous year.
Participatory budgeting in canon-rich municipalities suffered from these general
shortcomings. Yet, as I found out in my fieldwork, there were also other features
that shaped the outcome of the process in these municipalities. First, the
availability of financial resources allowed canon-rich municipalities to hire
consultants and NGOs to design and implement the participatory phase of the
budgeting process. This ‘privatisation’ of the procedure had two main
consequences. On the one hand, municipal authorities and officials were largely
absent from participatory workshops, making accountability for the implementation
of previous years’ agreements impossible. Even when some low-ranking municipal
officials attended, they were invariably unable to answer participants’ questions,
since, due to high staff turnover, they knew nothing about the expenditure in
previous years. On the other hand, these external facilitators tended to increase
the number of participatory workshops held in the different communities and
neighbourhoods of each municipality – according to their own accounts, to
enhance participation; according to sceptical local opinion, to raise their incomes
(they were usually paid according to the number of workshops they organised).218
This multiplication of workshops led to the dissolution of demands and loss of the
wider municipal perspective. Participatory processes tended to wind up in
ridiculously long wish lists, for which each small group of the populace put forward
its own demands. In 2007, the municipality of San Marcos prioritised more than
400 projects by means of this participatory budgeting process.219 Indeed, the
longer the list, the easier it was for municipal authorities to select those projects
that were the most attractive to them. 218 For example, the mayor of Ninaca – with a population of 4,000 – hired an NGO called Munired to organise participatory budgeting in 2008. Munired facilitated 16 decentralised workshops and compiled a ‘bank of ideas for projects’. The municipality finally selected 20 projects, amongst which there was at least one from each workshop (Information from personal participation in workshop; interviews 2008-036 (Ninacaca 29-04-2008); 2008-041 (Ninaca, 04-05-2008). 219 Information given to the general public in a participatory budgeting workshop held in the peasant community of Huaripampa (San Marcos, 05-07-2008).

− 203 −
Second, although the authorities often failed to respond to the population’s most
pressing concerns, people would finally accept second or third best options if the
allocation of resources provided job opportunities. For example, participants in
budgeting workshops in 2007 and 2008 in the rural areas of Huari, San Marcos
and Chavin de Huantar prioritised investment in the expansion of drinking water
coverage and irrigation infrastructure. Those attending workshops in 2008 vented
their frustration because their priorities from the previous year had been ignored
completely. At the beginning of a meeting in Huaripampa – a peasant community
in San Marcos – one of the participants protested, “We are tired of answering the
same questions year after year. We give you our opinion, but you do nothing for
the whole year; then you come back the following year, and all we do is to give you
the same answer as before.”220 After debating the usefulness of the process, they
proceeded with the workshop as usual; and, once again, the participants prioritised
investment in drinking water and irrigation facilities.
After the meeting, one municipal government officer confided that the municipality
had not even begun the administrative procedure for contracting the design of
these types of projects. Apparently, the obstacle was one of complexity, as they
demanded the deployment of engineers to design infrastructure specifically
tailored to the local environment. Then, the alternative was the implementation of
less demanding projects that offered jobs to the population. In the case of
Huaripampa, the implementation of the pilot scheme eased local discontent. In
Cajay, Chavin de Huantar, Huachis, Huari and Ponto, investment in the
refurbishment of schools, the development of urban infrastructure; and the
construction of stadiums, municipal halls, and different kinds of monuments
claimed the lion’s share of the capital investment budget in 2007 and 2008.221
Such initiatives were easier to implement and had the advantage of being labour
intensive.
220 Huaripampa (San Marcos, 05-07-2008). 221 See figures in appendix XII.

− 204 −
8.4.3 The limitations of transparency and capacity building222
The introduction of the Mining Programme of Solidarity with the People (MPSP) in
2007 meant that Antamina had USD 65 million to spend in social development in
the Ancash region, investment that was concentrated, to a great extent, in the
municipalities more directly impacted on by the operation’s activities.
The mine created a separate organisation, Antamina Mining Fund (AMF), to
implement these social activities. AMF decided to spend some of its resources on a
capacity building programme in three municipalities of the Conchucos Valley –
Huari, San Marcos, and Chavin de Huantar. Its idea was to help the municipal
governments to use canon minero transfers effectively. The organisation selected
three different types of initiatives: the development of the Municipal Management
Plan (MMP); the design of investment projects to be implemented by the
municipality; and the strengthening of some municipal departments through the
design of administrative procedures, training and mentoring.
AMF hired two renowned Peruvian consulting firms – Macrogestion and Governa –
to do the job. Macrogestion – a subsidiary of Macroconsult – prepared investment
projects and developed the MMP for the municipalities of Huari and San Marcos.
The objective was to improve the quality of municipal interventions and speed up
their allocation of the budget to projects. Given the challenges, this seemed to be a
clever approach. In the case of San Marcos, AMF proposed a very flexible contract
whereby the municipality could ask Macrogestion to prepare any kind of project free
of charge as AMF covered the expenses. Macrogestion opened an office in San
Marcos with 18 specialists in different fields, hiring additional experts on an ad hoc
basis to work on specific projects.
In 2007, the municipality asked Macrogestion to design 85 out of a total of 400
investment projects managed by the municipal government. The manager of
Macrogestion in San Marcos identified some common features in the 85 projects:
they were complex interventions that demanded an inordinately large volume of
222 The information used in this subsection derives from the following personal interviews: 2008-083 (Lima, 09-06-2008); 2008-086 (Lima, 11-06-2008); 2008-114 (San Marcos, 03-07-2008); 2008-115 (San Marcos, 03-07-2008); 2008-117 (San Marcos, 03-07-2008); 2008-121 (San Marcos, 06-07-2008); 2008-123 (San Marcos, 07-07-2008); 2008-114 (San Marcos, 03-07-2008); 2008-124 (San Marcos, 08-07-2008); 2008-136 (San Marcos, 13-07-2008); 2008-139 (Huari, 15-07-2008); 2008-143 (Lima, 22-07-2008).

− 205 −
work in relation to their total budget.223 As consultants’ fees were usually a
percentage of the total budget, this meant that these projects were not profitable
enough for the consultants who ordinarily worked for the municipality and with
whom the managers habitually colluded.
Surprisingly, once these 85 projects had passed all the technical and administrative
checks, the municipality decided not to implement 35 of them. Apparently, they
were too complex for the municipal government to implement them quickly. In July
2008, AMF started to evaluate the real usefulness of this service. However, it
continued with the programme until May 2009.
The jobs of the three Governa employees posted in San Marcos were less
demanding. They were to identify the organisational needs of the municipality and
provide training and mentoring to improve its capacity. However, their counterparts
in the municipality were not willing to allow Governa to meddle in the way they ran
affairs. Governa concluded that they had too much to hide.224 Thus, municipal
managers were only interested in Governa drafting documents for the 15
administrative procedures that each Peruvian municipality had to have to comply
with MEF requirements. The programme lasted until June 2009.
In the event, neither Macrogestion nor Governa succeeded in improving the rate of
budget use and the public services that the municipal government of San Marcos
provided to its citizens. Antamina showed good will and the consulting firms were
first class, but municipal politics were not open to improvement. In fact, the
behaviour of these two consulting firms promoted a negative reaction in the
population, turning it against external interventions in general. The employees of
these two firms came from Lima, and only worked in San Marcos a few days a
week. The journey between Lima and San Marcos took around 12 hours. These
employees had won a contractual clause allowing them to start working on Monday
afternoon and leave for Lima on Thursday night. This policy set a precedent and
the section of the municipal staff that came from other towns started to enjoy the
same flexible schedule.
223 Interview 2008-115 (San Marcos, 03-07-2008) 224 Interview 2008-117 (San Marcos, 03-07-2008).
− 206 −
The population of San Marcos adopted a cynical view of the work of these
outsiders, considering them to be more interested in money than in the quality of
the services they offered. The Front of Defence of the interest of San Marcos
demanded that Antamina stop funding consulting firms and NGOs, and channel the
money directly into the hands of local people.
Capacity building programmes have frequently gone hand in hand with the
promotion of transparency in an attempt to improve municipal government
accountability. In 2007, the IFC, in collaboration with the United Kingdom
Department for International Development (DFID), USAID and CIDA were
especially active in setting up the Organisations for the Improvement of Municipal
Investment (OIMI). The OIMIs were coalitions of regional civil society organisations
that aimed to analyse and disseminate information about the canon transfers
received by municipalities and the manner in which they were spending the
revenues. These activities were to improve the oversight capacity of local
populations and increase municipal government responsiveness to the demands of
the public. The first OIMI was formed in Cajamarca in 2005, while branches in
Ancash, Moquegua and Tacna were set up in 2007. The OIMI coalition in Ancash
included the regional chamber of commerce, industry and tourism; the professional
association of engineers; the public university; and Caritas, the Catholic NGO.
From the outset, monitoring the performance of the municipality of San Marcos was
part of the OIMI’s brief in Ancash, but its work had no significant impact there. First,
although the population was already aware of the existence of problems in the
municipality, the majority of people tolerated inefficiency and corruption in
exchange for jobs in the public works. Second, the OIMI published official
information about mining revenues, the percentage of actual spending of this
particular budgetary item, and, occasionally, the percentage allocated to different
sectors. However, it did not deal with how decisions about the allocation of these
resources were made. As was the case with the EITI (Extractive Industries
Transparency Initiative) at national level, the focus on revenue details downplayed
the analysis of expenditure as the critical strategy in tackling corruption (Kolstad &
Wiig, 2009). Moreover, the importance that the OIMI accorded to the percentage of
capital budget actually spent reinforced the incentive for municipalities to spend
quickly, independent of the quality of the projects. Finally, OIMI dependence on the
IFC reined in its freedom and the scope of its mission. The IFC actively supports

− 207 −
the mining industry in Peru and was keen to get the financial support of the main
mining companies to finance the functioning of OIMI, which hindered the capacity
of OIMI to publish information that was critical of the political allies of the
companies. In 2008, the OIMI in Moquegua conducted a survey of popular opinion
of the performance of the mayors of Ilo and Moquegua. The mayor of Ilo, a close
ally of the SPCC, was portrayed in a very bad light, and the office of the IFC
responsible for the OIMI in Lima decided not to publish the results.225
The analysis in this section reveals that canon-rich municipal governments of
Ancash had difficulty spending mining revenues on the projects citizens wanted,
like water and sanitation, and that local authorities were frequently involved in
corruption. However, the analysis also shows that these problems were not at the
root of the misuse of mining revenue. The vast amount of canon transfers, in
combination with popular lack of trust in institutions, and the proliferation of
nationally imposed regulations were the reasons for both mining revenue misuse
and the persistence of corruption and limited institutional capacity. External
attempts to overcome such challenges through the provision of technical support
and traditional transparency programmes failed because they did not take into
account the system of incentives at work. Mayors maintained their popularity by
demonstrating efficiency in a very narrow range of specific tasks, mainly quick
spending for the generation of jobs. This strategy contented the local population in
a way that distorted the institutional mechanisms for the efficient allocation of
revenue and reduced the public’s motivation to challenge the corrupt practices of
municipal authorities. Nevertheless, capacity building and transparency
programmes were politically expedient for the mining companies because they
tended to divert popular scrutiny away from corporate practices towards municipal
government performance.
8.5 Variations on the same theme: higher technical capacity and the promotion of clientelism in Moquegua
Municipalities in Pasco and, more evidently, in Moquegua had higher capacity
levels than those in Ancash. However, municipal governments in Moquegua spend
their money in similar ways to those in Ancash. The quick redistribution of canon
225 Personal interview 2008-187 (Moquegua, 05-09-2008).

− 208 −
transfers through the generation of jobs in the public works determined the nature
of the expenditure.
In this section, I discuss some specific features of the allocation of resources in
Moquegua. I do not attempt to make a detailed analysis of the processes but to
point out the similarities and differences with Ancash. The comparison exposes the
potential for high levels of mining rents to promote clientelism and to promote the
pursuit of short-term benefits independent of the technical capacity of the
municipality.
The municipalities of Moquegua and Ancash were similar in terms of the per capita
volume of canon transfer received during recent years (see Appendix XII).
However, municipalities in Moquegua had higher MCI scores. In fact, they were
able to implement a high proportion of their investment projects directly without
resorting to outsourcing. This system required higher levels of institutional capacity
but also had distinct political advantages because it gave mayors direct control over
the recruitment of employees.
From 2007 to 2008, most adults in Carumas, San Cristobal, Samegua and Torata
worked for their respective municipalities. Mayors recruited their closest allies to
staff the municipal bureaucracy, while a high proportion of the remainder of the
population was employed in carrying out public works. In 2007, the municipality of
Torata employed 650 administrative officers and 1,200 labourers, who were
regularly employed in public works financed by canon transfers.226 This
represented more than 90 per cent of the total employable population.227 Similar
employment levels were found in neighbouring municipalities. In most cases,
mayors had a direct say in deciding who should be hired.
Regulations for the use of canon transfers prohibited such revenue financing
recurrent expenditure and, therefore, the hiring of workers not directly employed to
carry out investment projects. Municipal managers in Moquegua were experienced
enough to find a way around the law. They contrived sophisticated mechanisms to
226 According to information provided by the mayor and the general manager of public works in interviews 2008-186 (Torata, 05-09-2008) and 2008-192 (Torata, 10-09-2008). The number of administrative officers was confirmed by the National Registry of Municipalities (INEI, 2009e). 227 According to the census, the total employable population of Torata was 3,493 (INEI, 2008a), but approximately 1,500 of them were employees of Cuajone based at the company’s mining camp (according to figures from the own company).

− 209 −
enhance flexibility in the use of cannon transfers. The incorporation of recurrent
expenditure into capital investment projects implemented by the municipality was
the easiest and most common method. But, they went one step further and crafted
mechanisms to turn canon transfers into autonomously generated revenue that
could be used more flexibly. These mechanisms are built around the purchase and
use of municipal machinery. The municipalities designed capital investment
projects to purchase heavy machinery, arguing that the initial outlay would reduce
the cost of future public works. Once they had acquired the equipment, they
adopted one of two alternative strategies. If the municipality contracted a company
to carry out the public works, the terms stipulated that the company had to hire the
necessary machinery from the municipality. Conversely, municipal governments
that wanted to do the work directly without hiring a company tended to cross-hire
the machinery with a neighbouring municipality: municipal government X hired
municipal government Y’s machinery and vice versa.
Such hiring arrangements were frequently overpriced and, moreover, maintenance
of the machinery was not a priority as it was simpler to buy a new machine than
attempt to budget for proper servicing. The practical result of such subterfuge was
that money was transferred from one line item of the budget – canon revenue – to a
wholly flexible line item through the purchase and accelerated depreciation –
almost depredation – of material assets.
Such creative accountancy lent itself to further opportunities for corrupt practices.
Popular claims of mismanagement by municipal authorities abounded in
Moquegua. Some of them were substantiated. In March 2008, the National
Elections Board dismissed the mayor of Torata.228 He had been accused of
nepotism by two of the municipal counsellors after hiring his own brother. He also
faced charges of mismanagement, and, in 2010, the court imposed a two-year
sentence on him. The other mayors learnt their lesson and, from that moment on,
hired out their relatives to adjacent municipalities – as they did with the machinery –
to avoid the accusation of nepotism. Although local people knew about the
mismanagement of municipal authorities, they did not want to risk losing their jobs.
Thus, similar to the situation in Ancash, widespread clientelism hindered the
implementation of effective social control.
228 Decree N º 076-2008-JNE.

− 210 −
There were some differences between Moquegua and Ancash in terms of the type
of project implemented. In the two predominantly urban municipalities − Moquegua
and Samegua − the authorities together with the general public prioritised
investment in urban infrastructure and ‘conspicuous construction’, while in rural
municipalities, irrigation projects and the construction of roads were the main
concerns (see Appendix XII). This greater spending in productive projects in rural
municipalities seemed to be a clear improvement in comparison to Ancash.
However, according to municipal managers, mayors were more interested in
providing jobs for the people than in the quality of the initiatives. They confessed
that the policy of hiring local people slowed down the construction of projects,
adversely affected their quality, and raised total costs. In contrast to other regions
in Peru, labourers in public works were protected by the Civil Construction
Collective Labour Agreement in Moquegua. Unskilled employees of the municipality
earned a monthly salary close to PEN 1,800 (USD 600),229 the equivalent of
experienced workers in this kind of job. This situation had a paradoxical side effect:
tance of the mere increase in mining activity – and its associated negative
onmental impacts – as a detevour of working for the municipality.
This brief comparison of Moquegua and Ancash throws up a further puzzling
element. Surprisingly, the change in welfare indicators between 1993 and 2007
was smaller in the municipalities of Moquegua than in those of Ancash. In fact,
various indicators reveal a deteriorating situation from 1993 to 2007 in several of
Moquegua’s municipalities (see Appendix XIII). Considering that municipalities in
Moquegua have historically enjoyed higher levels of administrative and technical
capacity than those in Ancash, this comparatively negative performance suggests
the existence of factors related to a variation in behaviour between different mining
companies. Some scholars have highlighted the attempts of Antamina to promote
development (Sanborn et al., 2007) and there is no doubt about the large scale of
its CSR operation. Yet, Southern Peru Copper Corporation (SPCC) has neither
historically enjoyed a reputation as a good neighbour nor has it been the most
generous of benefactors (Balvín, 1995; Bauch, 1985; Boon, Alexaki, & Herrera
Becerra, 2001). Although corporate behaviour might affect changes in welfare
229 Information provided by the human resource manager of Carumas, and confirmed by an official communication of the regional government of Moquegua (Gobierno Regional de Moquegua, 2008b)

− 211 −
indicators, a rigorous examination of such a hypothesis is beyond the scope of this
thesis.
8.6 Conclusion
I started Chapter 7 by asking if the implementation of the NEIS had led to
detectable changes in indicators of social and material welfare in the Peruvian
mining regions. The analysis of Chapters 7 and 8 confirms that the NEIS has failed
to improve the situation of the population living close to the mines. Lack of capacity
and corruption does not fully explain the misuse of mining revenue in canon-rich
municipalities. Municipalities with different levels of capacity present similar
problems in using their budget productively and resort to the same type of short-
term, clientelistic spending that gives precedence to job creation over effective
social investment.
Although I have focused the analysis on the institutional use of canon transfers, the
importance given to job creation begs the question of what families did with the
income earned. If a proportion of the income had been used for individual social
expenditure, as in education, it would have compensated to an extent for the
inefficient spending of public institutions and would reinforce recent arguments for
the direct distribution of mining and oil revenue to the citizens (Moss & Young,
2009; Sandbu, 2006; Segal, 2009). The analysis of how families used these new
incomes would require an extensive research that is beyond the scope of this
thesis. Based on my observations during the field research, I can only provide
some basic information that is far from conclusive.
Peasants’ abandonment of their work in agriculture is the most salient social
feature in canon-rich municipalities. This means that families then use a significant
proportion of their earned income in the new public jobs to buy foodstuff. They
perceive earning money to buy the food that they previously produced has three
advantages: (i) they can widen their diet through more expensive products such as
rice, sugar, pasta, biscuits, etc.; (ii) buying food represents a higher social status
than producing it; and (iii) it renders a surplus that they can use to buy other goods;
for example, it was also very apparent that local shops sold more crockery, pans,
radios, televisions, and other household goods. Undoubtedly, people value the new

− 212 −
possibilities generated by their income. It is less clear to what extent the increase in
options available to them lead to real improvements in their living standards.
The impact of income on education is also unclear and would need further
research. On the one hand families can spend more money on books, school
uniforms, transport, and have more room to delay their children’s need to earn a
living. But on the other hand, the abundance of public jobs has been an important
incentive for teenagers to abandon education.
What the last two chapters reveal is that the NEIS has generated new forms of
deprivation in mining areas. Historically, big mines have deprived local communities
of valuable assets such as water, land and a clean environment, making them more
vulnerable to droughts and other natural events, health problems, and changes in
the market for their products (Bury, 2002, 2007). The NEIS has tried to compensate
for these negative effects by enhancing social spending in mining areas and
providing new economic opportunities outside the agriculture sector. The analysis
shows that social spending has been quite ineffective and that the NEIS has made
local economies increasingly dependent on the canon transfers. Deprivation of
crucial assets for the peasant economy has not been compensated for by the
generation of stable new economic opportunities but with temporary jobs that are
only viable in the context of high mineral prices. As diversification of the family
income is crucial for escaping poverty in the rural communities of the Andean
region (Krishna et al., 2006) increasing dependence on the historically volatile flows
of mining revenue seems to be a risky strategy.
Moreover, this increasing dependence on the income provided by public jobs has
generated political deprivation. Citizens in mining areas perceive that they have the
power to appoint the authorities and to hold them to account, however, municipal
and regional authorities in canon-rich jurisdictions operate with considerable
political autonomy from the citizenship insofar as they provide enough jobs and
have the political ability to satisfy different groups. The implementation of the NEIS
has also given more political power at local level to mining companies. First, the
growing dependence on canon transfers makes local authorities and populations
alike moderate, at least in the short term, their demands concerning environmental
issues and to facilitate the expansion of activities. Second, the direct management
of the MPSP gives companies the opportunity to use these financial resources to

− 213 −
buy compliance with their plans. Finally, high volumes of canon transfers have
attracted the interest of mafia groups that have captured part of the resources in
collusion with the municipal and regional authorities. The incursion of these groups
into local politics is likely to have a long-lasting effect because they now have
incentives to influence the electoral processes by supporting candidates favouring
their interests.

− 214 −
Chapter 9
Conclusion
In this chapter, after summarising the main findings of my analysis of the Peruvian
case study, I set out to complete the thesis by putting forward some conclusions
that those interested in the extractive industries and development elsewhere might
find useful.
9.1 What does this study say about the implementation of the NEIS?
Canon minero transfers to sub-national governments in jurisdictions where mines
are located, and the active involvement of mining companies in local development
constitute what I have labelled the New Extractive Industries Strategy (NEIS).
Companies have different policies in different countries to reduce the incidence of
social unrest and persuade the local people living around their operations of their
beneficial role as promoters of local development.
I argue that Peru is a testing ground for the NEIS. After years of decline in mineral
production, Fujimori’s government reinstated mining as one of the pillars of
economic development. The enactment of the General Mining Law in 1992 was the
first step in promoting foreign investment in the sector. The strategy worked well
and in the late 1990s, international mining companies started to explore mineral
deposits and construct modern mines. However, by the early 2000s, successful
popular opposition to new mines in different regions alarmed both the mining
companies and the Peruvian government.
They reacted by increasing the proportion of mining revenue devolved to mining
jurisdictions (the canon minero) and by concentrating it in the municipalities closest
to the mines. They hoped that increased amounts of transfer would improve living
standards and convince the local people of the advantages of mining. The policy
had the virtue of satisfying the demands of other important actors: (i) it fitted
perfectly into the IFI-promoted good governance agenda for the democratisation of
Peru after the fall of Fujimori’s regime; and (ii) it fulfilled the ambitions of political
leaders and local populations in mining regions that for many years had been
demanding an increase in canon transfers.

− 215 −
The escalation in corporate profits in 2004–2008 provided a new opportunity for the
mining companies to reinforce their presence at local level. After the presidential
elections of 2006, the companies faced the almost certain introduction of a new
windfall tax, a proposal that was supported by all the main candidates during the
campaign. However, the companies stopped this move by coming to an agreement
with President Garcia to set up the Mining Programme of Solidarity with the People
(MPSP), a voluntary financial contribution funded by the mining companies aimed
at promoting local development.
9.1.1 The main argument
In this thesis, I have argued that the implementation of the NEIS has increased the
number of social conflicts while failing to show any improvement in the economic
and social welfare indicators in mining regions. Although large scale anti-mining
increased to a lesser extent than investment in the mining sector in 2004–2008, the
proliferation of disputes over the distribution of mining rents more than
counterbalanced this achievement (Chapter 5).
I identified two different types of the more frequent ‘distribution’ disputes (Chapter
6). In the first type, peasant communities use social conflict to enhance their
bargaining power in negotiations with mining companies over financial
compensation and jobs in the mines. Extraordinary corporate profits; popular belief
that companies pay less tax than they should; the new image of mining companies
as actors with a moral duty to promote local development; and suspicion of
collusion between the government and the mining companies all combine to
stimulate this type of conflict.
In the second type, local populations and sub-national authorities engage in
disputes over the control and use of canon minero transfers. I identified three
different sub-types: (i) the population uses social conflict to encourage swifter
expenditure of transfers; (ii) sub-national authorities use conflict as a means of
diverting pressure about the use of resources to other levels of government, and to
gain control over additional canon transfers; and (iii) municipalities and regions fight
amongst themselves in an attempt to win jurisdiction over territories with mineral
deposits and water sources, as such resources guarantee future mining revenues.

− 216 −
The implementation of the NEIS could still be constructive if the higher frequency of
conflicts were tempered by a lower degree of violence or greater capacity to
generate long-term settlements and positive institutional innovations. Unfortunately,
this is not the case; rather, both types of ‘distributional’ social conflicts frequently
result in several serious and even fatal casualties. Moreover, they tend to have little
impact on the improvement of the regulations and governance of the mining sector
because they focus on immediate local benefits and not on wider policy changes.
Neither has the NEIS made a positive impact in mining jurisdictions on welfare and
economic indicators. I found that regions and municipalities receiving high volumes
of canon transfers did not improve their indicators more than the rest of the country
(Chapter 7). The Peruvian government and the mining companies tend to blame
sub-national governments’ lack of managerial capacity for this striking dearth of
positive outcomes. The importance of managerial capacity notwithstanding, my
research reveals that municipal authorities have strong political incentives to
prioritise short-term quick spending over better planned long-term investment in key
public services (Chapter 8).
An analysis of the political dynamics leading to such short-termism in the
expenditure of canon transfers also calls into question the conventional argument
of the linear relationship between lack of development and conflict. The Peruvian
government and the mining companies assume that lack of development and poor
quality public services cause social conflict in mining areas. Therefore, they think
that increased spending on development projects organised by mining companies
and sub-national governments should reduce the incidence of social unrest.
Although this strategy clearly does not work, they remain convinced, putting the
blame for failure on the inability of sub-national governments to make the best use
of canon transfers.
In my research into canon-rich municipalities, I found that the government’s claim
that there is a relationship between lack of development and conflict is flawed.
Such a relationship doubtless exists, but it is more complex than the promoters of
the NEIS anticipated. The causal link between conflict and development also runs
in the opposite direction: ‘distributional conflicts’ generated by the implementation
of the NEIS have exacerbated the inefficient use of canon transfers by sub-national
governments irrespective of their managerial capacity.

− 217 −
Central government and the mining companies’ response to the escalation of
conflict has been to divert popular attention towards the performance of sub-
national authorities. Mining companies widely advertise the amount of canon
transferred to regional and municipal governments to demonstrate their contribution
to local development through the payment of taxes. They have also been quite
active in promoting local authorities’ accountability to their citizens, using the
percentage of canon transfers actually spent as the main indicator of sub-national
government performance. The national government has also resorted to the same
tactic of highlighting the lack of capacity of sub-national governments in order to
counteract demands for additional resources from mining regions.
Company and national government officials’ comments about the low level of
budgetary expenditure in mining jurisdictions tend to prompt quick public spending
through two different mechanisms. First, such expenditure becomes the benchmark
of political capacity; mayors and regional presidents feeling compelled to
demonstrate that they are able to spend the money. Second, the population
demands quicker spending on account of its apprehension that central government
might otherwise confiscate some of the canon transfers.
The result is that regional and municipal governments are under pressure to spend
their canon transfers quickly. This obligation is especially strong in small
municipalities where it is relatively easy to collect the necessary number of
signatures to demand a new election. Mayors in these localities are well aware that
if they do not satisfy popular demands in a timely fashion they will be removed from
office without the chance to complete their term of office. Therefore, they try to
appease the population by resorting to creating jobs in public works irrespective of
the quality and usefulness of such projects. This widespread clientelism renders
externally imposed capacity building and anti-corruption programmes ineffectual
because neither local authorities nor the population have the incentive to make
them work.
9.1.2 Limitations of the analysis
I have used a combination of methods to enhance the reliability of my analysis. Yet,
the scarcity of data disaggregated at regional and municipal level and the short
time that has passed since the implementation of the NEIS impose some

− 218 −
limitations. They do not challenge the validity of the results, but demand to be
placed in context.
Lack of data at municipal and regional levels is the first limitation. Two examples
illustrate this. First, I found that canon-rich municipalities had not improved their
welfare indicators more than other municipalities; however, it is very likely that the
massive generation of public jobs has increased household income in these same
municipalities, at least in the short-term. This income effect cannot be measured
because there are no available data on household income at municipal level and
the effect disappears when income data is aggregated at regional level.
The second example relates to the impact of different corporate strategies. The
analysis of the change in welfare indicators at municipal level (1993–2007) reveals
that some of these indicators improved significantly more in canon-rich
municipalities in Ancash than in similar municipalities in the rest of the country.
However, analysis of the allocation of resources in Ancash and Moquegua indicate
that the performance of municipal governments fails to explain these differences.
Local authorities in both regions resorted to the same kind of clientelistic strategies,
but municipalities in Ancash improved their welfare indicators more than those in
Moquegua did (Chapter 8). This lack of correlation between the performance of
municipal governments and changes in welfare indicators would appear to signal
the possible existence of a ‘company effect’. The examination of this hypothesis
would require the analysis of detailed information on corporate involvement at local
level, but there is no data available.
The short time frame of the investigation is the second limiting factor. The policies
that constitute the NEIS were first implemented in 2002, when the canon minero
increased from 20 per cent to 50 per cent of corporation tax paid by mining
companies. However, it was not until 2004 that substantial volumes of canon
transfers started to flow to regional and municipal governments. Thus, the
discouraging results of the implementation of the NEIS that I have described in this
thesis apply to a very short period of time. This raises the question of to what extent
these results are valid in the longer term.
There is no clear answer. Some analysts argue that the negative effects I have
identified are time-bound. The introduction of the NEIS coincided with the
− 219 −
unprecedented generation of mining revenues, and neither local authorities nor
their populations could adjust to this new situation quickly enough. They anticipate
that the experience of these early years will help improve the process of allocation
of resources in the future, and the populations of canon-rich regions and
municipalities will eventually realise that they need to focus on the long term.230
I would be happy to see this optimistic scenario materialise, but there are signs that
contradict the existence of such a linear learning process. I present three of them.
First, the political system at local level is not conducive to the assimilation of
historical lessons. The lack of political parties that have longer term policies to
provide some continuity, the lack of a professional body of civil servants and an
extremely low rate of re-election of the incumbents all mean that regional and
municipal governments have to begin again almost from scratch after each
election. Furthermore, electoral preferences are generally shaped by the personal
appeal of the candidates rather than by programme proposals. Candidates and the
electorate alike believe that efficient management depends on the skills and moral
values of the authorities. They do not realise that if a system of perverse incentives
remains in place, newly elected authorities tend to reproduce the short-sighted
policies of their predecessors.
Second, popular participation mechanisms have lost their original political
inspiration as promoters of ‘deliberative’ democracy (Avritzer, 2002). They do not
provide space for the different actors to reflect on the process of decision-making,
the criteria they employ in such a process, or the results of previous decisions.
When popular participation is organised by municipal or regional governments it is
reduced to a managerial technique that has to comply with strict regulations.
Alternatively, the population uses legal provision for the promotion of participation
as a last resort in order to demand accountability or directly remove the authorities.
Unfortunately, neither of these processes commonly leads to reflection or learning.
Finally, the implementation of the NEIS has generated distortions that tend to
replicate themselves. One of the most striking is the way in which mafia-style
groups have infiltrated regional and municipal politics. In Chapter 7, I described the
interaction between these mafia and some municipal governments in Ancash. In
230 Interview 2008-200 (Lima, 29-09-2008).

− 220 −
2010, the scale of the problem became even more evident when, on the 12th of
July, the interim president of the region was murdered; and only a few days later, a
regional councillor was shot and his son-in-law killed.
The reasons behind the assassination of the interim president remain obscure, but
there are some clues to the motivation for the attack on the councillor. Immediately
after the assault, the victim accused Cesar Alvarez – the former regional president,
who had resigned to stand for re-election. The councillor accused Alvarez of
wanting to block his appointment as the new interim president because he feared
revelations of evidence incriminating him in corruption (El Comercio, 2010). In
September 2010, the police concluded that the former general manager of the
region and close ally of Alvarez had hired an assassin to dispatch the councillor (La
República, 2010). This grim tale illustrates the fact that the capture of part of the
canon minero by mafia groups will make it difficult for new incumbents to change
the way in which resources are allocated.
9.2 Lessons from the Peruvian case
In the introduction to this thesis, I argued that the implementation of the NEIS in
Peru is a testing ground for a strategy that the mining industry could adopt where
extraction increases in developing countries. My research reveals that this strategy
has not been successful in Peru.
I have also found that context matters, and that three features of the political
economy of contemporary Peru are crucial to any understanding of the lack of
positive results of the NEIS: (i) the capture of the Peruvian central state by private
business and its limited capacity to represent other interests; (ii) the weak
participation of local political leaders in national political structures, which motivates
them to pursue independent strategies and objectives, and to maximise resource
transfers to their own localities; and (iii) the inability of the weak, ‘captured’ central
state to enforce the law and to control and arbitrate between conflicts of interest
between mining companies and a variety of competing local social and political
groups.
These features are common to several developing countries. Thus, although we
cannot automatically conclude that the same policies will generate the same
problems elsewhere, it is reasonable to assume that the Peruvian experience can

− 221 −
provide some lessons for countries with similar political features trying to make the
most of their mineral endowments.
I summarise these lessons in two basic propositions: (i) the NEIS is no substitute
for a wider revision of key aspects of the mining regime and the political system;
and (ii) if the NEIS is used as a quick fix, it may hinder the long-term viability of the
mining industry.
First, the NEIS was implemented in Peru in order to maintain radical market-friendly
mining policies, without addressing some of the main problems behind the original
anti-mining conflicts. The mining companies and the government wanted to avoid
undertaking a complete revision of the industry that might have included a greater
say for local populations and authorities in the process of granting mining rights,
and the reinforcement of regulatory and monitoring bodies. They assumed that
throwing money at the problem would ease local resistance.
To some extent, the strategy worked and raised the threshold of discontent for the
outbreak of new anti-mining conflicts. In Chapter 6, I discuss the case of
Quellaveco, the new Anglo American mine in Moquegua, in which the inflow of
canon minero transfers to the municipalities there changed people’s perceptions of
the benefits of mining and facilitated popular acquiescence to the operation.231
However, the implementation of the NEIS did not halt anti-mining conflicts. At the
beginning of this thesis, I told the story of the struggle of my friend Santiago and his
Awajun companions against the presence of oil and mining companies in their
territory. Communities around the Rio Blanco project in Piura and peasant
organisations in Islay (Arequipa) also resisted the construction of new mines,
genuinely believing that the industry would destroy their sources of livelihood. In all
these cases, only true recognition of people’s right to prior and informed consent to
activities affecting their lives (Mackay, 2004), and the introduction of ecological
zoning (Bebbington & Bury, 2009) will reduce the incidence of conflict.
The mining companies and the Peruvian government oppose the introduction of
these institutional innovations because they think that such initiatives will give local
231 Yet, it is also clear that Anglo American did not rely exclusively on the implementation of the NEIS but also significantly modified its original proposal in order to incorporate local demands for improved water management.
− 222 −
communities the right to veto mining activities; which they fear will obstruct the
national development of the industry. My investigation into mining regions reveals
that this perspective is not helpful. In a few places only – and generally with good
reason – do people radically oppose the presence of mines. In most cases, people
demand a more open dialogue, assurances about their livelihoods, improvements
to the design of the mines, and job opportunities. Moreover, the introduction of
these institutional innovations can also help reduce – or at least manage more
easily – conflicts over the distribution of mining rents, the most frequent type of
contentious dispute in recent years.
As I illustrate in the analytical framework (Section 4.3) and in my analysis of
different types of conflict (Chapter 6), the popular perception of mining legislation
as being imposed by the government in collusion with the companies fans the
flames for local communities to employ radical anti-mining discourses to gain
political leverage in their claims for material compensation.
For example, in the case of type 2 conflicts – those that I have dubbed ‘enhancing
bargaining power’ – local communities strengthen their negotiating position by
combining claims for material compensation with complaints about the environment
and intimations of growing opposition to mining. Such a mechanism is effective
because the companies cannot risk the emergence of a strong anti-mining
movement and are thus willing to keep at bay the most provocative threats in
exchange for payment. However, this is only a quick-fix solution because the
claimants’ successful outcome provides them with the incentive to pursue new
objectives.
The recognition of people’s right to prior and informed consent to extractive
activities would improve the situation in at least two ways. First, once the population
had accepted the existence or expansion of a mine they would not be able to
employ the threat of an anti-mining movement. Although this would not resolve
social tensions around the distribution of rent, it would clarify the situation and help
to manage it more appropriately. Second, if people’s opinions and interests were
really taken into consideration, they would weigh the practical implications of
serious opposition to mining more carefully. In some mining regions, it is not
unusual to find groups that express opposition to the industry although this is not
the real bone of contention. Confronted with the total shutdown of an operation,
− 223 −
most of them would say that they did not oppose mining per se but the way in
which the companies went about it. However, as they are aware that their
opposition will not bring the industry down since the government unreservedly
supports the companies’ operations, they adopt radical discourses in order to gain
leverage and influence company policy, no matter how marginally.232
Of course, the effective implementation of the right to prior and informed consent
and the introduction of ecological zoning would mean that some corporate projects
could not be developed. There would be cases of genuine opposition to mining in
which people thought that they would be better off without a mine in the
neighbourhood. However, the mining companies and the government should weigh
this theoretical ‘loss’ against the greater political stability they would gain for the
sector as a whole.
Given the government’s compulsion to please the mining companies, the
introduction of these institutional innovations depends on the calculations of the
main operations. The big transnational firms, which are usually more concerned
about political instability and more sensitive to the reputational cost caused by
protracted conflict, are in the best position to play a prominent role in bringing about
these changes.
In addition to the reduction of conflicts, the mining companies and the national
government had other objective. They believed that in returning some of the profits
to producer municipalities and regions, they could bypass the historical inability of
the centralised Peruvian state to reach the rural areas of the country, without
reforming the whole public apparatus. This shortcut has not worked either.
Populations in mining regions feel that although the state might send them money,
it does not really care about their plight: “The government is only interested in the
mine not in the people.”233 The absence of the central state in the provision of
public services; the imposition of centrally designed regulations aimed at tightly
controlling the activities of sub-national governments; and the simultaneous lack of
interest of the judiciary and the central government in stopping cases of blatant
corruption have reinforced popular distrust in the state.
232 Interviews 2008-030 (Pasco, 29-04-2008); 2008-050 (Pasco, 10-05-2008); 2008-189 (Moquegua, 08-09-2008). 233 Public meeting in Cerro de Pasco (2008-005; Cerro de Pasco, 20-05-2008).

− 224 −
The second lesson makes reference to a trade-off between maximising the short-
term profits of the mining companies and generating an appropriate environment
for the future of the sector. The Peruvian government has tried to attract further
investment in mining by bowing to the demands of companies already operating in
the country. Central government decision not to impose a windfall tax, and its
tendency to minimise the importance of the official requirement to obtain a social
licence from the local community before starting exploration activities are examples
of these pro-mining policies.
I argue that these policies are short-sighted. They erode the legitimacy of the state
by portraying the image of a government in collusion with the mining companies;
yet, they also damage the mining companies’ public image, and fuel the more
radical discourses for either the nationalisation of natural resources or the
imposition of severe restrictions to new mining operations.
Something similar occurs in the tendency of mining companies to play a more
state-like role at the local level. The MPSP has reinforced this tendency by
empowering them to run parallel development planning systems. Such power
makes people suspicious of the real intentions of the companies, placing them at
the forefront of popular discontent. Bypassing public institutions through the
implementation of social programmes can yield positive results in the extremely
short term, but it generates more instability in the long term.
In summary, the implementation of the NEIS has not been successful in either
reducing social conflict or promoting development in mining jurisdictions. The
translation of mining into development has been historically problematic and it
seems that the NEIS is not an effective short cut to overcoming these difficulties. If
the Peruvian government really wants to make mining a central pillar of the
country’s development, it needs to undertake the revision of both its policies for the
promotion and management of the mining sector and the way in which the state
responds to rural populations.

− 225 −
REFERENCES
Aguilar, J. (2008). La industria minera y el desarrollo local. Retrieved 23 September, 2009, from http://www.eclac.org/drni/noticias/noticias/3/32703/Sr.Aguilar.pdf
Ahmad, E., & Garcia-Escribano, M. (2006). Fiscal decentralization and public subnational financial management in Peru. IMF Working Paper 06/120. Washington: International Monetary Fund.
Ahmad, E., & Mottu, E. (2003). Oil revenue assignments: country experiences and issues. In J. Davis, R. Ossowski & A. Fedelino (Eds.), Fiscal policy formulation and implementation in oil-producing countries. Washington: International Monetary Fund.
Alcocer Martínez, A. (2006). Conjetura y postura frente al dicho 'el Perú es un mendigo sentado en un banco de oro'. Boletín de la Academia Peruana de la Lengua, 41, 45-48.
Alejos Calderón, W., & Zas Friz Burga, J. (2005). Concertando la descentralización: balance del diseño normativo. Lima: Fondo Editorial del Congreso del Perú.
Antamina. (2008). Responsabilidad social. Retrieved October 23, 2008, from http://www.antamina.com/04_social/index.html
Antamina. (2009). Fondo Minero Antamina. Retrieved 6 July, 2010, from http://www.antamina.com/boletin/zips/reporte-fondo-minero2008.pdf
Apoyo. (2009a). La competitividad del sector minero peruano. Lima. Apoyo. (2009b). Mineria: ¿por qué tanto problema? Visiones de los dos lados.
Lima. Aragón, F., & Casas, C. (2009). Technical capacities and local spending in
Peruvian municipaltities. Perspectivas, 7(1), 89-113. Aragón, F., & Rud, J. P. (2009). The blessing of natural resources: evidences from
a Peruvian Gold mine. Working Paper Nº 2009-015. Lima: Banco Central de Reserva del Perú.
Arellano-Yanguas, J. (2008). A thoroughly modern resource curse? The new natural resource policy agenda and the mining revival in Peru. Brighton: Institute of Development Studies.
Aroca, J. (2008). El caso de Tintaya. In M. Scurrah (Ed.), Defendiendo derechos y promoviendo cambios: el estado, las empresas extractivas y las comunidades locales en el Perú. Lima: Instituto de Estudios Peruanos.
Astete, J. (2005). Informes Técnicos Nº 30. Determinacion de plomo en sangre y factores asociados en niños y mujeres gestantes de las poblaciones de Quiulacocha y Champamarca (Cerro de Pasco). Lima: Instituto Nacional de Salud.
Auty, R. (1993). Sustaining development in mineral economies: the resource curse thesis. London: Routledge.
Auty, R. (2006). Mining enclave to economic catalyst: large mineral projects in developing countries. Brown Journal of World Affairs, 13(1), 135-145.
− 226 −
Auty, R. (2007). Patterns of rent extraction and deployment in developing countries: implications for governance, economic policy and performance. In G. Mavrotas & A. Shorrocks (Eds.), Advancing development: core themes in global economics. Basingstoke: Palgrave Macmillan.
Avritzer, L. (2002). Democracy and the public space in Latin America. Princeton; Oxford: Princeton University Press.
Bajo la Lupa. (2009, November 2009). Minería, petroleo y comunidades. Bajo la Lupa.
Balvín, D. (1995). Agua, minería y contaminación: el caso Southern Perú. Ilo: Labor.
Ballard, C., & Banks, G. (2003). Resource wars: the anthropology of mining. Annual Review Anthropology, 32(-), 287-313.
Banco Central de Reserva del Perú. (2009). Estadísticas. Retrieved 29 March, 2009, from http://www.bcrp.gob.pe/bcr/Cuadros/Cuadros-Anuales-Historicos.html
Banks, G. (2002). Mining and the environment in Melanesia: contemporary debates reviewed. The Contemporary Pacific, 14(1), 39-67.
Banks, G. (2005). Linking resources and conflict the Melanesian way. Pacific Economic Bulletin, 20(1), 185-191.
Basedau, M., & Lay, J. (2009). Resource curse or rentier peace? The ambiguous effects of oil wealth and oil dependence on violent conflict. Journal of Peace Research, 46(6), 757-776.
Bauch, E. (1985). Comunidad, conflicto y cambio social: el caso de la Southern Peru Cooper Corporation. Allpanchis, XXII(26), 9-33.
Bebbington, A. (2007). Mining and development in Peru. London: Peru Support Group.
Bebbington, A., Bury, J., Humphreys Bebbington, D., Lingan, J., Muñoz, J. P., & Scurrah, M. (2007). Movimientos sociales, lazos transnacionales y desarrollo territorial rural en zonas de influencia minera: Cajamarca-Perú y Cotacachi-Ecuador. In A. Bebbington (Ed.), Minería, movimientos sociales y respuestas campesinas: una ecología política de transformaciones territoriales. Lima: Instituto de Estudios Peruanos.
Bebbington, A., & Bury, J. T. (2009). Institutional challenges for mining and sustainability in Peru. Proceedings of the National Academy of Sciences, 106(41), 17296-17301.
Bebbington, A., Hinojosa, L., Humphreys-Bebbington, D., Burneo, M. L., & Warnaars, X. (2008). Contention and ambiguity: mining and the possibilities of development. Development and Change, 39(6), 887-914.
Bebbington, A., Humphreys Bebbington, D., Bury, J., Lingan, J., Muñoz, J. P., & Scurrah, M. (2008). Mining and social movements: struggles over livelihood and rural territorial development in the Andes. World Development, 36(12), 2888-2905.
Beck, N. (2001). Time-series-cross-section data: what have we learned in the past few years? Annual Review Political Science, 4(1), 271-293.
Beck, N., & Katz, J. (1995). What to do (and not to do) with time-series cross-section data. American Political Science Review, 89(3), 634-647.

− 227 −
Becker, S., & Ichino, A. (2002). Estimation of average treatements effects based on propensity scores. The Stata Journal, 2(4), 358-377.
BHP Billinton. (2009). Financial Report 2008. Retrieved 20 April, 2010, from http://www.bhpbilliton.com/bbContentRepository/docs/financialResultsFy08.pdf
Birdsall, N., & Subramanian, A. (2004). Saving Iraq from its oil. Foreign Affairs, 83(4), 77-89.
Boon, R., Alexaki, A., & Herrera Becerra, E. (2001). The Ilo Clean Air Project: a local response to industrial pollution control in Peru. Environment and Urbanization, 13(2), 215-232.
Bosschini, A., Petterson, J., & Roine, J. (2005). Resource curse or not: a question of appropriability. Stockholm: Stockholm School of Economics.
Bourque, S. C., & Palmer, D. S. (1975). Transforming the rural sector: goverment policy and peasant response. In A. Lowentahal (Ed.), The Peruvian experiment: continuity and change under military rule. Princeton: Princeton University Press.
Bridge, G. (2004). Contested terrain: mining and the environment. Annual Review of Environment and Resources, 29(1), 205-259.
Bridge, G. (2008). Global production networks and the extractive sector: governing resource-based development. Journal of Economic Geography, 8(3), 389-419.
Brinkerhoff, D., Brinkerhoff, J., & McNulty, S. (2007). Decentralization and participatory local governance: a decision space analysis and application to Peru. In G. S. Cheema & D. A. Rondinelli (Eds.), Decentralizing Governance: emerging concepts and practices. Cambridge, Mass.: Ash Institute for Democratic Governance and innovation, John F. Kennedy School of Government, Harvard University.
Brosio, G. (2003). Oil revenue and fiscal federalism. In J. Davis, R. Ossowski & A. Fedelino (Eds.), Fiscal policy formulation and implementation in oil-producing countries. Washington: International Monetary Fund.
Brunnschweiler, C. (2008). Cursing the blessings? Natural resource abundance, institutions, and economic growth. World Development, 36(3), 399-419.
Bulte, E. H., Damania, R., & Deacon, R. (2005). Resource intensity, institutions, and development. World Development, 33(7), 1029-1044.
Bury, J. (2002). Livelihoods, mining and peasant protest in the Peruvian Andes. Journal of Latin American Geography, 1(1), 3-19.
Bury, J. (2007). Minería, migración y transformación de los medios de subsistencia en Cajamarca, Perú. In A. Bebbington (Ed.), Minería, movimientos sociales y respuestas campesinas: una ecología política de transformaciones territoriales. Lima: Instituto de Estudios Peruanos.
Caballero, V. (2009). Los conflictos sociales en el Perú 2006-2008. In C. A. d. Juristas (Ed.), Punto de encuentro: creando una cultura de diálogo para la gestión de los conflictos en el Perú. Lima: Comisión Andina de Juristas.
Cabrero, E. (2007). Government decentralization and decentralized governance in Latin America: the silent revolution of the local level? In G. S. Cheema & D. A. Rondinelli (Eds.), Decentralizing Governance: emerging concepts and

− 228 −
practices. Cambridge, Mass.: Ash Institute for Democratic Governance and innovation, John F. Kennedy School of Government, Harvard University.
Caselli, F., & Michaels, G. (2009). Do oil windfalls improve living standards? Evidence from Brazil. Discussion Paper nº 7579. London: Centre for Economic Policy Research.
Castillo Castañeda, P. (2007). Las comunidades campesinas en el siglo XXI: balance jurídico. In Allpa (Ed.), ¿Qué sabemos de las comunidades campesinas. Lima: CEPES.
Castillo, M., & Urrutia, J. (2007). Participación de las comunidades campesinas en el gobierno local: un desafío político. Lima: Grupo propuesta ciudadana.
Collier, D. (1975). Squatter sttlements and policy innovation in Peru. In A. Lowenthal (Ed.), The Peruvian experiment: continuity and change under military rule. Princeton: Princeton University Press.
Collier, D. (1995). Trajectory of a concept: 'corporatism' in the study of latin american poltics. In P. Smith (Ed.), Latin America in comparative perspective: new approaches to methods and analysis. Boulder: Westview Press.
Collier, P., & Hoeffler, A. (1998). On economic causes of civil war. Oxf. Econ. Pap., 50(4), 563-573.
Collier, P., & Hoeffler, A. (2004a). Greed and grievance in civil war. Oxf. Econ. Pap., 56(4), 563-595.
Collier, P., & Hoeffler, A. (2004b). The political economy of secession. In H. Hannum & E. Babbitt (Eds.), Negotiating self-determination. Lanham, MD: Lexington Books.
Collier, P., & Hoeffler, A. (2005). Resource rents, governance, and conflict. Journal of Conflict Resolution, 49(4), 625-633.
CONASEV. (2010). Información de empresas. Retrieved 20 April, 2010, from http://www.conasev.gob.pe/eeff/eeff_x_empresa.asp
Congreso de la República - Perú. (2003a). Diario de los debates de la sesión plenaria de los días 21 y 28 de Agosto. Lima.
Congreso de la República - Perú. (2003b). Dictamen de la Comisión de Energía y MInas sobre proyectos de ley para modificación de la Ley Nº 27506. Lima.
Congreso de la República - Perú. (2004a). Diario de los debates de la sesión plenaria de los días 7 y 15 de Julio Lima.
Congreso de la República - Perú. (2004b). Dictamen de la Comisión de Economía e Inteligencia Financiera sobre proyectos de ley que modifica las leyes Nº 27506 y Nº 28077. Lima.
Congreso de la República. (2003). Informe ampliatorio del caso Pierina. Comisión investigadora encargada de cumplir las conclusiones y recomendaciones a las que arribaron las cinco comisiones investigadoras del periodo legislativo 2001-2002. Lima: Congreso de la República.
Consejo Nacional de Descentralización. (2004). Comprendiendo la descentralización: un enfoque legal. Lima: Agencia Española de Cooperación Internacional.
Contraloría General de la República. (2010). Operación Condor: resumen de casos. Lima.

− 229 −
Cooperacción. (2006). Informe de conflictos mineros: los casos de Majaz, Las Bambas, Tintaya y La Oroya. Lima: Cooperacción.
Cotler, J. (1968). The mechanics of internal domination and social change in Peru. Studies in Comparative International Development, 3(12), 229-246.
Cotler, J., Barrenechea, R., Glave, M., Grompone, R., & Remy, M. I. (2009). Poder y cambio en las regiones. Lima: PNUD - Instituto de Estudios Peruanos.
Crabtree, J. (1992). Peru under Garcia: an opportunity lost. Basingtoke: Macmillan. Crabtree, J. (2000). Populism old and new: the Peruvian case. Bulletin of Latin
American Research, 19(2), 163-176. CVR/Peru. (2004). Comisión de la verdad y reconciliación: Informe final: Perú,
1980-2000. . Lima: Comisión de la Verdad y Reconciliación. Cheema, G. S. (2007). Devolution with accountability: learning from good practices.
In G. S. Cheema & D. A. Rondinelli (Eds.), Decentralizing Governance: emerging concepts and practices. Cambridge, Mass.: Ash Institute for Democratic Governance and Innovation, John F. Kennedy School of Government, Harvard University.
Cheshire, L. (2010). A corporate responsibility? The constitution of fly-in, fly-out mining companies as governance partners in remote, mine-affected localities. Journal of Rural Studies, 26(1), 12-20.
Davis, G. A. (1995). Learning to love the Dutch disease: Evidence from the mineral economies. World Development, 23(10), 1765-1779.
De Echave, J., Diez , A., Huber, L., Revesz, B., Ricard, X., & Tanaka, M. (2009). Minería y conflicto social. Lima: Instituto de Estudios Peruanos.
De Echave, J., & Torres, V. (2005). Hacia una estimación de los efectos de la actividad minera en los índices de pobreza en Perú. Lima: Cooperacción.
De Soto, H. (1989). The other path. New York: Basic Books. De Soysa, I., & Neumayer, E. (2007). Resource wealth and the risk of civil war
onset: result form a new dataset on natural resource rents, 1970-1999. Conflict Management and Peace Science, 24(3), 201-218.
De Wind, A. (1985). De campesinos a mineros: el transfondo de las huelgas en las minas del Perú. Allpanchis, XXII(26), 247-285.
De Wind, A. (1987). Peasants become miners: the evolution of industrial mining systems in Peru 1902-1974. London: Garland Publishing Inc.
Defensoría del Pueblo. (2009). Reporte de conflictos sociales. Retrieved December 19, 2009, from http://www.defensoria.gob.pe/conflictos-sociales-reportes.php
Degregori, C. I. (1998). Harvesting storms: peasant rondas and the defeat of Sendero Luminoso in Ayacucho. In S. Stern (Ed.), Shining and other paths: war and society in Peru, 1980-1995. Durham: Duke University Press.
Desai, R. M., Freinkman, L., & Goldberg, I. (2005). Fiscal federalism in rentier regions: evidence from Russia. Journal of Comparative Economics, 33(4), 814-834.
DESCO. (2009). Resumen Semanal. Retrieved 30 October, 2009, from http://www.desco.org.pe/resumen-semanal.shtml
Diaz Palacios, J. (1990). Municipio: democracia y desarrollo. Lima: IPADEL.

− 230 −
Diez , A. (2006). Organizaciones colectivas, recursos y pueblos indígenas en el Perú. In F. Eguren (Ed.), Reforma agraria y desarrollo rural en la región andina. Lima: CEPES.
Diez , A. (2007). Organización y poder en comunidades, rondas campesinas y municipios. In Allpa (Ed.), ¿Qué sabemos de las comunides campesinas? Lima: CEPES.
Dore, E. (1988). The Peruvian mining industry: Growth, stagnation and crisis. London: Westview Press.
Dunning, T. (2008). Crude democracy. Cambridge: Cambridge University Press. Dunning, T. (2010). Endogenous oil rents. Comparative Political Studies, 43(3),
379-410. Durand, F. (2005). La mano invisible del estado: efectos del neoliberalismo en el
empresariado y la política. Lima: Friedrich Ebert Stiftung. Durand, F. (2007). El Perú fracturado: formalidad, informalidad y economía
delictiva. Lima: Fondo Editorial del Congreso del Perú. ECLAC. (2005). Demographic Bulletin Nº 76: Latin America, urban and rural
population projections. Santiago de Chile: ECLAC. ECLAC. (2010). Bases de datos y publicaciones estadísticas. Retrieved 28 March,
2010, from http://www.eclac.org/estadisticas/bases/ Echave de, J., Hoetmer, R., & Palacios, M. (Eds.). (2009). Minería y territorio en el
Perú: conflictos, resistencias y propuestas en tiempos de globalización. Lima: CooperAcción.
Echave de, J., Keenan, K., Romero, M. K., & Tapia, A. (2005). Los procesos de diálogo y la administración de conflictos en territorios comunales: el caso de la mina Tintaya en el Perú. Lima: Cooperaccion.
Eggert, R. (2001). Mining and economic sustainability: national economies and local communities. London: IIED.
Eguren, F. (2006). Reforma agraria y desarrollo rural en el Perú. In F. Eguren (Ed.), Reforma agraria y desarrollo rural en la región andina. Lima: CEPES.
EITI. (2005). Extractive industries transparency initiative:source book. Retrieved 4 October, 2007, from http://www.eitransparency.org/UserFiles/File/keydocuments/sourcebookmarch05.pdf
EL Brocal. (2010). Responsabilidad social. Retrieved 8 May, 2010, from http://www.elbrocal.com.pe/responsabilidad_social/sociales.php
El Comercio. (2008a, 28 April). Alan García pide a las mineras invertir mejor en aporte voluntario. El Comercio.
El Comercio. (2008b, 11 May). Entrevista exclusiva al presidente de la República: 'Hay un cargamontón urdido para eliminar el orden democrático'. El Comercio, p. a4.
El Comercio. (2008c, 31 January). ¿Es el canon una pesadilla? El Comercio, p. a4. El Comercio. (2008d, 16 June). Un general y cerca de cien efectivos de la Policía
Nacional continúan secuestrados en Moquegua. El Comercio, pp. 1-3. El Comercio. (2009, 19 September). Xstrata Copper invertira US$ 5100 mlls. El
Comercio, p. b1.

− 231 −
El Comercio. (2010, 22 July). Consejero acusa a presidente regional de Ancash de ataque. El Comercio, p. 14.
Escobal, J., & Torero, M. (2003). Adverse geography and differences in welfare in Peru. Geneve: Word Institute for Development Economics Research.
Evans, G., Goodman, J., & Lansbury, N. (Eds.). (2002). Moving mountains: communities confront mining and globalisation. London: Zed Books.
Fearon, J. D. (2005). Primary commodity exports and civil war. Journal of Conflict Resolution, 49(4), 483-507.
Filer, C. (1990). The Bougainville rebellion, the mining industry and the process of social disintegration in Papua New Guinea. Canberra Anthropology, 13(1), 1-39.
Filer, C., Burton, J., & Banks, G. (2008). The fragmentation of responsibilities in the Melanesian mining sector. In C. O'Faircheallaigh & S. Ali (Eds.), Earth matters: indigenous peoples, the extractive industries and corporate social responsibility. Sheffield: Greenleaf Publishing.
Filer, C., & Macintyre, M. (2006). Grass roots and deep holes: community responses to mining in Melanesia. The Contemporary Pacific, 18(2), 215-231.
Fiszbein, A. (1997). The Emergence of local capacity: lessons from Colombia. World Development, 25(7), 1029-1043.
Flores Galindo, A. (1974). Los mineros de Cerro de Pasco (1993 ed.). Lima: Fundación Andina.
Fondoempleo. (2010). Aportantes a Fondoempleo. Retrieved 7 May, 2010, from http://www.fondoempleo.com.pe/aportantes.htm
Fraser Institute. (2009). Annual survey of mining companies 2008/2009. Vancouver: Fraser Institute.
Freinkman, L., & Plekhanov, A. (2009). Fiscal decentralization in rentier regions: evidence from Russia. World Development, 37(2), 503-512.
Frynas, J. G. (2000). Oil in Nigeria: conflict and litigation between oil companies and village communities. Münster: Lit Verlag.
Frynas, J. G. (2005). The false developmental promise of corporate social responsibility: evidence from multinational oil companies. International Affairs, 81(3), 581-598.
Garay, C., & Tanaka, M. (2009). Las protestas en Perú entre 1995 y 2006. In R. Grompone & M. Tanaka (Eds.), Entre el crecimiento económico y la insatisfacción social: las protestas sociales en el Perú actual. LIma: Instituto de Estudios Peruanos.
García de Chu, I., & Piazza, M. d. C. (1998). Sociedad y gobierno local: espacios de concertación y democracia. Lima: DESCO.
García Pérez, A. (2007a, 28 Octubre). El síndrome del perro del hortelano. El Comercio, p. A4.
García Pérez, A. (2007b). Mensaje a la Nación en el día de la independencia. Lima.
García Pérez, A. (2008). Mensaje a la Nación en el día de la independencia. Lima. García Pérez, A. (2009). Mensaje a la Nación en el día de la independencia. Lima.
− 232 −
Gervasoni, C. (2010). A rentier theory of subnational regimes: fiscal federalism, democracy, and authoritarism in the Argentine provinces. World Politics, 62(2), 302-340.
Gil, V. (2009). Aterrizaje minero: cultura, conflicto, negociaciones y lecciones para el desarrollo desde la minería en Ancash, Perú. Lima: Instituto de Estudios Peruano.
Gobierno Regional de Moquegua. (2008a). Problemática limítrofe actual en el departamento de Moquegua. Moquegua: Gobierno Regional de Moquegua.
Gobierno Regional de Moquegua. (2008b). Remuneración de obreros contratados por inversion. Moquegua.
Goderis, B., & Malone, S. (2008). Natural resource booms and inequality: theory and evidence The Centre for the Study of African Economies Working Paper Series Nº 291. Oxford: University of Oxford.
Goldberg, E., Wibbels, E., & Mvukiyehe, E. (2008). Lessons from strange cases: democracy, development, and the resource curse in the U.S. States. Comparative Political Studies, 41(4/5), 477-514.
Gonzales de Olarte, E. (2005). Crecimiento, desigualdad e ingobernabilidad en el Perú de los 2000. In V. Vich (Ed.), El Estado está de vuelta: desigualdad, diversidad y democracia. Lima: Instituto de Estudios Peruanos.
Gouley, C., & Kuramoto, J. (2007). Conflictos mineros, interculturalidad y políticas públicas: el caso de las Bambas, provincias de Cotabambas y Grau, departamento de Apurímac. Economía y Sociedad, 65, 46-54.
Graulau, J. (2008). 'Is mining good for development?': the intellectual history of an unsettled question. Progress in Development Studies, 8(2), 129-162.
Grindle, M. S. (2006). Modernising town hall: capacity building with a political twist. Public Administration and development, 26(1), 55-59.
Grindle, M. S. (2007). Going local: decentralization, democratization, and the promise of good governance. Princeton, N.J.; Woodstock: Princeton University Press.
Grompone, R., & Glave, M. (2009). Building democracy with equality: the participatory experience in the rural province of Anta, Cusco, Peru. IDS Bulletin, 40(6), 22-30.
Grupo Propuesta Ciudadana. (2008). Vigilancia de las industrias extractivas: reporte nacional nº 7. Lima: Grupo Propuesta Ciudadana.
Guo , S., & Fraser, M. (2010). Propensity score analysis: statistical methods and application. Los Angeles: SAGE.
Gylfason, T. (2001). Natural resources, education, and economic development. European Economic Review, 45(4-6), 847-859.
Hamann, R. (2004). Corporate social responsibility, partnerships, and institutional change: the case of mining companies in South Africa. Natural Resources Forum, 28(4), 278-290.
Hamann, R., & Paul, K. (2004). Corporate social responsibility in mining in Southern Africa: fair accountability or just greenwash? Development, 47(3), 85-92.

− 233 −
Harding, C. (1975). Land reform and social conflict in Peru. In A. Lowenthal (Ed.), The Peruvian experiment: continuity and change under military rule. Princeton: Princeton University Press.
Hausmann, R., & Rigobon, R. (2003). An alternative interpretation of the resource curse: theory and policy implications. In J. M. Davis, R. Ossowski & A. Fedelino (Eds.), Fiscal policy formulation and implementation in oil-producing countries. Washington: International Monetary Fund.
Hilson, G. (2002). An overview of land use conflict in mining communities. Land Use Policy, 19, 65-73.
Holden, W. N., & Jacobson, R. D. (2007). Mining amid armed conflict: nonferrous metals mining in the Philippines. Canadian Geographer / Le Géographe canadien, 51(4), 475-500.
Houtzager, P. (2003). From polycentrism to the polity. In P. Houtzager & M. Moore (Eds.), Changing paths: International development and the new politics of inclusion. Ann Arbor: University of Michigan Press.
Huber, L. (2008). Romper la mano: una interpretación cultural de la corrupción. Lima: Instituto de Estudios Peruanos.
Humphreys, M. (2005). Natural resources, conflict, and conflict resolution: uncovering the mechanisms. Journal of Conflict Resolution, 49(4), 508-537.
Humphreys, M., Sachs, J., & Stiglitz, J. E. (2007). Escaping the resource curse. New York: Columbia University Press.
Hyndman, D. (1995). Ancestral rainforest and the mountain of gold: indigenous peoples and mining in New Guinea. Boulder: Westview Press.
Hyndman, D. (2001). Academic responsabilities and representation of the OK Tedi crisis in postcolonial Papua New Guinea. The Contemporary Pacific, 13(1), 33-54.
ICMM. (2006a). The analitycal framework - The challenge of mineral wealth: using resource endowments to foster sustainable development. Retrieved March 11, 2009, from http://www.icmm.com/page/1409/resource-endowment-initiative
ICMM. (2006b). The prize - The challenge of mineral wealth: using resource endowments to foster sustainable development. London: International Council on Mining & Metals.
ICMM. (2006c). Synthesis of four country case studies - The challenge of mineral wealth: using resource endowments to foster sustainable development. London: International Council on Mining&Metals.
ICMM. (2006d). The way forward - The challenge of mineral wealth: using resource endowments to foster sustainable development. Retrieved July 10, 2007, from http://www.icmm.com/publications/1113WaysForward.pdf
ICMM. (2007). Peru country case study. The challenge of mineral wealth: using resource endowments to foster sustainable development. London: International Council on Mining&Metals.
ICMM. (2009). Human rights in the mining and metals industry: handling and resolving local level concerns and grievances. London: International Council on Mining and Metals.

− 234 −
ICMM. (2010a). Mining: partnerships for development. Position stament. London: International Council on Mining & Metals.
ICMM. (2010b). Resource endowment initiative. Retrieved 2 June, 2010, from http://www.icmm.com/resourceendowment
Idemudia, U. (2007). Corporate partnership and community development in the Nigerian oil industry: strengths and limitations. Geneva: UNRISD.
IFC. (2000). Investing in people: sustaining communities through improved business practice. Washington DC: International Financial Corporation.
IIED. (2002). Breaking new ground: mining, minerals, and sustainable development. London: Earthscan.
IIED. (2003). Finding common ground: indigenous peoples and their association with the mining sector. London: IIED.
INEI. (2008a). Censos Nacionales 2007: XI de Población y VI de Vivienda: Instituto Nacional de Estadistica e Informática.
INEI. (2008b). Perú, compendio estadístico 2008. Lima: Instituto Nacional de Estadística e Informática.
INEI. (2009a). Informe técnico: situacion de la pobreza en el 2008. Lima: Instituto Nacional de Estadística e Informática.
INEI. (2009b). Mapa de pobreza provincial y distrital 2007: el enfoque de la pobreza monetaria. Lima: Instituto Nacional de Estadística e Informática.
INEI. (2009c). Perú, compendio estadístico 2009. Lima: Instituto Nacional de Estadística e Informática.
INEI. (2009d). Producto bruto interno por departamentos 2001-2008. Lima: Instituto Nacional de Estadística e Informática.
INEI. (2009e). Registro nacional de municipalidades 2008. Retrieved 29 July, 2010, from http://www1.inei.gob.pe/srienaho/renamu2008.asp
Inter-American Development Bank. (2003). Private sector to play major role in Peruvian decentralization. Retrieved 10 November, 2009, from http://www.iadb.org/news/detail.cfm?language=EN&id=2116
Isham, J., Woolcock, M., Pritchett, L., & Busby, G. (2005). The varieties of resource experience: natural resource export structures and the political economy growth. The World Bank economic review, 19(2), 141-174.
Karl, T. L. (1997). The paradox of plenty: oil booms and petro-states. Berkeley: University of California Press.
Karl, T. L. (2007). Resources and Rights. Lima: GPC. Kay, C. b. (2001). Reflections on rural violence in Latin America. Third World
Quarterly, 22(5), 741 - 775. Khodeli, I. (Ed.). (2009). From curse to blessing? Using natural resources to fuel
sustainable development. Oxford: UNESCO. Kirsch, S. (2004). Changing views of place and time along the Ok Tedi. In J.
Weiner & A. Rumsey (Eds.), Mining and indigenous lifeworlds in Australia and Papua New Guinea. Wantage: Sean Kingston Publishing.
Klarén, P. F. (2000). Society and nationhood in the Andes. New York: Oxford University Press.

− 235 −
Kolstad, I., & Wiig, A. (2009). Is transparency the key to reducing corruption in resource-rich countries? World Development, 37(3), 521-532.
Krishna, A., Kristjanson, P., Kuan, J., Quilca, G., Radeny, M., & Sanchez-Urrelo, A. (2006). Fixing the hole in the bucket: household poverty dynamics in the Peruvian Andes. Development and Change, 37(5), 997-1021.
Kruijt, D., & Vellinga, M. (1979). Labor relations and multinational corporations: the Cerro the Pasco Coorporation in Perú. Amsterdam: Van Gorcum and Comp.
La Primera – Huaraz. (2008, 2 July). Nos quieren dejar si canon, p. 1. La Primera – Huaraz. (2009, 9 July). FEDIP– Cajay denuncia a alcalde por
supuesta corrupción. La República. (2008, 30 August). Sólo gastaron 33% de los US$ 3,500 mlls.
recibidos. La Republica, p. 6. La República. (2010, 29 September). Incriminan a ex-gerente en atentado a
Nolasco. La República, p. 10. Larson, A. M. (2004). Formal decentralisation and the imperative of decentralisation
'from below': a case study of natural resource management in Nicaragua. The European Journal of Development Research, 16(1), 55 - 70.
Latin American Council of Social Sciences. (2009). Observatorio Social de América Latina: cronologías. Retrieved 30 October, 2009, from http://www.clacso.org.ar/sitio/clacso/areas-de-trabajo/area-academica/osal/produccion-academica/cronologias
Latinobarómetro, C. (1995-2008). Informe Latinobarómetro. Santiago de Chile: Corporación Latinobarómetro.
Lederman, D., & Maloney, W. F. (2006). Trade structure and growth. In D. Lederman & W. F. Maloney (Eds.), Natural resources: neither curse nor destiny. Stanford: Stanford University Press.
Lessmann, C., & Markwardt, G. (2010). One size fits all? Decentralization, corruption, and the monitoring of bureaucrats. World Development, 38(4), 631-646.
Lingan, J. (2008). El caso de Cajamarca. In M. Scurrah (Ed.), Defendiendo derechos y promoviendo cambios: el Estado, las empresas extractivas y las comunidades locales en el Perú. Lima: Instituto de Estudios Peruanos.
Long, N., & Roberts, B. (1984). Miners, peasants and entrepeneurs: regional development in the central highlands of Peru. Cambridge: Cambridge University Press.
Lowenthal, A. (1975). The Peruvian experiment:continuity and change under military rule. Princeton: Princeton University Press.
MacIntyre, M., & Foale, S. (2002). Politicised ecology: local responses to mining in Papua New Guinea. Canberra: The Australian National University.
Mackay, F. (2004). Indigenous peoples' rights to free, prior and informed consent and the World Bank's Extractive Industries Review. Sustainable Development Law & Policy, 4(2), 43-65.
Macroconsult. (2008). Impacto económico de la actividad minera en el Perú. Lima: Macroconsult.
Mallon, F. (1995). Peasant and nation: the making of postcolonial Mexico and Peru. Berkeley: University of California Press.

− 236 −
Mallon, F. (1998). Chronicle of a path foretold? Velasco's revolution, vanguardia revolucionaria, and "shining omens" in the indigenous communities of Andahuaylas. In S. Stern (Ed.), Shining and other paths: war and society in Peru, 1980-1995. Durham: Duke University Press.
Manrique, N. (2006). Democracia y nación: la promesa pendiente. In U. N. D. Program. (Ed.), La democracia en Perú (vol. 2): proceso histórico y agenda pendiente. Lima: UNDP.
Mariategui, J. C. (2007). 7 ensayos de interpretación de la realidad peruana. Caracas: Biblioteca Ayacucho.
Martinez-Alier, J. (2002). The environmetalism of the poor. Cheltenham: Edward Elgar Publishing Limited.
Mate, K. (2002). Communities, civil society organisations and the management of the mineral wealth. London: IIED.
Matos Mar, J. (1984). Desborde popular y crisis del Estado: el nuevo rostro del Perú en la década de 1980. Lima: Instituto de Estudios Peruanos.
McAdam, D., Tarrow, S., & Tilly, C. (2001). Dynamics of contention. Cambridge: Cambridge University Press.
McMahon, G., & Remy, F. (2001). Large mines and the community: socioeconomic and environmental effects in Latin America, Canada and Spain. Washington: The World Bank.
McNulty, S. (2006). Empowering civil society? Decentralizing the state and increasing local participation in Peru (Vol. Phd). Washington: The George Washington University.
McPhail, K. (2008). Sustainable development in the mining and minerals sector: the case for partnership at local, national and global levels. London: ICMM.
Mehlum, H., Moene, K., & Torvik, R. (2006). Institutions and the resource curse. The Economic Journal(116), 1-20.
MIM. (2010). Mejorando la Inversión Municipal. Retrieved 3 July, 2010, from http://www.mim.org.pe/
Ministerio de Economía y Finanzas - Perú. (2009). Estadísticas económicas. Retrieved 5 November, 2009, from http://www.mef.gob.pe/OFINE/estadistica_economica.php
Ministerio de Economía y Finanzas - Perú. (2010). Transparencia económica Retrieved March 3, 2010, from http://transparencia-economica.mef.gob.pe/
Ministerio de Economía y Finanzas. (2009a). Estadísticas económicas. Retrieved 5 November, 2009, from http://www.mef.gob.pe/OFINE/estadistica_economica.php
Ministerio de Economía y Finanzas. (2009b). Resultados de la evaluación de las declaratorias de viabilidad otorgadas por los órganos competentes del gobierno nacional, gobiernos regionales y gobiernos locales en el año 2007, en el marco del Sistema Nacional de Inversión Pública. Lima.
Ministerio de Economía y Finanzas. (2010). Transparencia económica Retrieved March 3, 2010, from http://transparencia-economica.mef.gob.pe/
Ministerio de Energía y Minas. (2010a). Cartera de proyectos mineros. Retrieved March 20, 2010, from
− 237 −
http://www.minem.gob.pe/minem/archivos/file/Mineria/INVERSION/CARTERA.pdf
Ministerio de Energía y Minas. (2010b). Datamart of minería. Retrieved June 28, 2010, from http://intranet2.minem.gob.pe/datamart/dac_publico/
Ministerio de Energía y Minas. (2010c). Informes estadísticos. Retrieved 23 August, 2010, from http://www.minem.gob.pe/minem/archivos/file/Mineria/PUBLICACIONES/ANUARIOS/2008/02%20ANUARIO.pdf
Monge, C. (2006). Decentralisation: an opportunity for democratic governance. In J. Crabtree (Ed.), Making institutions work in Peru. London: Institute for the study of the Americas.
Monterrico Metals. (2009). The Rio Blanco project. Retrieved 7 of November, 2009, from http://www.monterrico.co.uk/s/RioBlanco.asp?ReportID=144255
Moody, R. (2007). Rocks and hard places: the globalization of mining. London: Zed Books.
Moore, M. (2004). Revenues, State Formation, and the Quality of Governance in Developing Countries. International Political Science Review, 25(3), 297-319.
Morgandi, M. (2008). Extractive industries revenues distribution at the sub-national level: the experience in seven resource-rich countries. New York: Revenue Watch Institute.
Morón, E., & Sanborn, C. (2006). The pitfalls of policymaking in Peru: actors, institutions and rules of the game. Washington: Inter-American Development Bank.
Moss, T., & Young, L. (2009). Saving Ghana from its oil: the case for direct cash distribution. Working Paper 186. Washington: Center for Global Development.
Muñoz, I. (2006). Collective action and decentralisation. Paper presented at the CRISE Latin American Workshop, Santa Cruz.
Murakami, Y. (2007). Perú en la era del chino: la política no institutcionalizada y el pueblo en busca de un salvador. Lima: Instituto de Estudios Peruanos.
Murshed, S. M., & Tadjoeddin, Z. (2009). Revisiting the greed and grievance explanations for violent internal conflict. Journal of International Development, 21(1), 87-111.
Nylandsted, M., Yankson, P., & Fold, N. (2009). Does FDI create linkages in mining? The case of gold mining in Ghana. In E. Rugraff, D. Sánchez-Ancoechea & A. Sumner (Eds.), Transnational corporations and development policy: critical perspectives. Basingstoke: Palgrave Macmillan.
O`Brien, P. (2009, 9 November). Los petroaudios y la cultura de negocios. Semana Económica.
ODECOFROC. (2009). Perú, crónica de un engaño: los intentos de enajenación del territorio fronterizo Awajún en la Cordillera del Cóndor a favor de la minería. Lima: IWGIA.
Omgba, L. D. (2009). On the duration of political power in africa: the role of oil rents. Comparative Political Studies, 42(3), 416-436.

− 238 −
ONPE. (2007). Resultados elecciones municipales 2006. Retrieved 24 July, 2010, from http://www.web.onpe.gob.pe/modElecciones/elecciones/resultadoserm2006/index.onpe
ONPE. (2009). Consulta popular de revocatoria del mandato de autoridades municipales 2008. Retrieved 8 June, 2010, from http://www.web.onpe.gob.pe/modElecciones/elecciones/revocatoriacpr2008/index.php
Palacín, M. (2008). Respuesta comunitaria a la invasión minera y la crisis política: CONACAMI para el mundo. Lima: CONACAMI.
Panfichi, A. (2009). Conflictos sociales en el Perú 2004-2009: causas, características y posibilidades. Lima Pontificia Universidad Católica del Perú.
Panfichi, A. (2010). La representación contenciosa: fragmentación y conflicto social bajo el segundo gobierno de Alan García. Lima: Universidad Católica del Perú.
Paredes, M. (2006). Discurso indígena y conflicto minero en el Perú. In J. Iguiñiz, J. Escobal & C. I. Degregori (Eds.), Perú, el problema agrario en debate. SEPIA XI. Lima: Seminario Permanente de Investigación Agrícola.
Paredes, M. (2008). El caso de Tambogrande. In M. Scurrah (Ed.), Defendiendo derechos y promoviendo cambios: el Estado, las empresas extractivas y las comunidades locales en el Perú. Lima: Instituto de Estudios Peruanos.
Pease, H. (2006). Por los pasos perdidos: el parlamento peruano entre el 2000 y el 2006. Lima: Fondo Editorial del Congreso del Perú.
Pegg, S. (2006a). Can policy intervention beat the resource curse? Evidence from the Chad-Cameroon pipeline project. African Affaires, 105(418), 1-25.
Pegg, S. (2006b). Mining and poverty reduction: Transforming rhetoric into reality. Journal of Cleaner Production, 14(3-4), 376-387.
Peltier-Thiberge, N. (2006). Rural infraestructure. In M. Giugale, V. Fretes-Cibils & J. Newman (Eds.), An opportunity for a different Peru: prosperous, equitable, and governable. Washington: The World Bank.
Peru21. (2009, 28 November). Encarcelan a un alcalde de Ancash por el mal uso del canon.
Polastri, R., & Rojas, F. (2006). Decentralisation. In M. Giugale, V. Fretes-Cibils & J. Newman (Eds.), An opportunity for a different Peru: prosperus, equitable, and governable. Washington: The Word Bank.
Primera Página. (2009). Gerente de San Marcos fue internado en el penal San Jorge. Retrieved 23 July, 2010, from http://www.primerapaginaperu.com/article/actualidad/poli/2721/
Programa Canon. (2010). Programa Canon. Retrieved 10 September, 2010, from http://www.programacanon.org.pe/
Ramos, G. (2005). El sueño del casco blanco. Lima: San Marcos. Raw Material Group. (2010). Annual survey of global mining investment. Retrieved
March 19, 2010, from http://www.womp-int.com/story/2010vol01/story024.htm

− 239 −
Remy, M. I. (2005). Los múltiples campos de la participación ciudadana en el Perú: Un reconocimiento del terreno y algunas reflexiones. Lima: Instituto de Estudios Peruanos.
Revesz, B. (2009a). Descentralización, la reforma inconclusa. In Desco (Ed.), Perú hoy: del hortelano su perro, sin espacio ni tiempo histórico. Lima: Desco.
Revesz, B. (2009b). Tambogrande: de la defensa del agro a la defensa del derecho a decidir. In J. Echave de, A. Diez , L. Huber, B. Revesz, X. Ricard & M. Tanaka (Eds.), Mineria y conflicto social. Lima: Instituto de Estudios Peruanos.
Revesz, B., & Diez, A. (2006). El triángulo sin cúpula, o los actores desregulados en los conflictos mineros. In E. Toche (Ed.), Perú hoy: nuevos rostros en la escena nacional. Lima: Desco.
Ribot, J. C. (2004). Waiting for democracy: The politics of choice in natural resource decentralization. Washington: World Resources Institute.
Rojas, L., & Salas, M. E. (2010, 21 April ). Suspendieron proyecto minero Tia María. La República, p. 4.
Rosenbaum, P., & Rubin, D. (1983). The central role of the propensity score in observational studies of causal effects. Biometrika, 70(1), 41-55.
Ross, M. (1999). The political economy of the resource curse. World Politics, 51(2), 297-322.
Ross, M. (2001). Does oil hinder democracy? World Politics, 53(3), 325-361. Ross, M. (2004a). How do natural resources influence civil war? Evidence from
thirteen cases. International Organization, 58(01), 35-67. Ross, M. (2004b). Mineral wealth and equitable development. Background report
for the World Development Report 2006. Washington: The World Bank. Ross, M. (2007). How can mineral rich states reduce inequality? In J. Sachs, J. E.
Stiglitz & M. Humphreys (Eds.), Escaping the resource curse. New York: Columbia University Press.
Rosser, A. (2006a). Escaping the Resource Curse. New Political Economy, 11(4), 557 - 570.
Rosser, A. (2006b). The political economy of the resource curse: a literature survey. Brighton: IDS.
Sachs, J., & Warner, A. (1997). Natural resource abundance and economic growth. Cambridge: Harvard Institute for International Development.
Sala-i-Martin, X., & Subramanian, A. (2003). Addressing the natural resource curse: an illustration from Nigeria. Washington: International Monetary Fund.
Salas Carreño, G. (2008). Dinámica social y minería: familias pastoras de puna y la presencia del proyecto Antamina (1997-2002). Lima: Instituto de Estudios Peruanos.
Sanborn, C., Portocarrero, F., & Camacho, L. A. (2007). Aprendiendo sobre la marcha: la compañía minera Antamina. In F. Portocarrero, C. Sanborn & L. A. Camacho (Eds.), Moviendo montañas: empresas, comunidades y ONG en las industrias extractivas. Lima: Universidad del Pacífico.
Sandbu, M. E. (2006). Natural wealth accounts: A proposal for alleviating the natural resource curse. World Development, 34(7), 1153-1170.

− 240 −
Santillana, M. (2006). La importancia de la actividad minera en la economía sociedad peruana. Santiago de Chile: ECLAC.
Scorza, M. (1970). Redoble por Rancas. Lima: Peisa. Schady, N. (1999). Seeking votes: the political economy of expenditures by the
Peruvian social funds (FONCODES), 1991-1995. Washington: The World Bank.
Schuldt, J. (2004). Bonanza macroeconómica y malestar microeconómico: apuntes para el estudio del caso peruano, 1988-2004. Lima: Universidad del Pacífico.
Segal, P. (2009). Resource rents, redistribution, and halving global poverty: the resource dividend. Oxford: Oxford Insitute for Energy Studies.
Shack, N. (2006). Presupuestar en Perú. Santiago de Chile: ECLAC. Shafer, D. M. (1994). Winners and losers: how sectors shape the developmental
prospects of state. Ithaca: Cornell University Press. Sheahan, J. (1999). Searching for a better society : the Peruvian economy from
1950. University Park, Penn.: Pennsylvania State University Press. Snyder, R. (2001). Scaling down: the subnational comparative method. Studies in
Comparative International Development, 36(1), 93-110. Stepan, A. (1978). The state and society: Peru in comparative perspective.
Princeton: Princeton University Press. Stevens, P., & Dietsche, E. (2008). Resource curse: an analysis of causes,
experiences and possible ways forward. Energy Policy, 36(1), 56-65. Stijns, J.-P. (2006). Natural resource abundance and human capital accumulation.
World Development, 34(6), 1060-1083. Sullivan, D. E., Sznopek, J. L., & Wagner, L. A. (2001). 20th Century U.S. mineral
prices decline in constant dollars. Open File Report 00-389. Washington: U.S. Geological Survey.
Szablowski, D. (2007). Transnational law and local struggles: mining communities and the World Bank. Portland: Hart Publishing.
Székely, M., & Montes, A. (2006). Poverty and inequality. In V. Bulmer-Thomas, J. Coastworth & R. Cortés Conde (Eds.), The Cambridge economic history of Latin America. Volume II: the long twentieth century. Cambridge: Cambridge University Press.
Tanaka, M. (2005). Democracia sin partidos: Perú, 2000-2005. Lima: Instituto de Estudios Peruanos.
Tanaka, M., & Meléndez, C. (2009). Yanacocha y los reiterados desencuentros: gran afectación, débiles capacidades de acción colectiva. In J. De Echave, A. Diez , L. Huber, B. Revesz, X. Ricard & M. Tanaka (Eds.), Minería y conflicto Social. Lima: Instituto de Estudios Peruanos.
Tarrow, S. (1998). Power in movement : social movements and contentious politics (2nd ed. ed.). Cambridge: Cambridge University Press.
The Economist. (2008, 6 December). Peru: the politics of non-stop protest, p. 51. The Economist. (2009, 2 May). Pain but no panic, pp. 49-50. The Economist. (2010a, 19 August). BHP Billiton: making the earth move, pp. 50-
52.

− 241 −
The Economist. (2010b, 5 June). Digging in a minefield, p. 77. Thorp, R., & Bertram, G. (1978). Peru 1890-1977: growth and policy in an open
economy. London: The MacMillan Press. Ugarte, M. (2006). Apuntes para apoyar la discusión del proceso de
descentralización. Lima: Fundación Konrad Adenauer. UNCTAD. (2007). World investment report 2007: transnational corporations,
extractive industries and development. Geneva: UNCTAD. UNDP. (2006). Informe sobre desarrollo humano Perú 2006: hacia una
descentralización con ciudadanía. Lima: UNDP. UNDP. (2010). Informe sobre desarrollo humano Perú 2009: por una densidad del
estado al servicio de la gente. Lima: UNDP. Van der Ploeg, F. (2008). Challenges and opportunities for resource rich
economies. OxCarre Research Paper Nº 2008-05. Oxford: University of Oxford.
Watts, M. (2004). Resource curse? governmentality, oil and power in the Niger Delta, Nigeria. Geopolitics, 9(1), 50 - 80.
Weber-Fahr, M. (2002). Treasure or trouble? Mining in developing countries. Washington D.C.: World Bank and Internatinal Finance Corporation.
Weinstein, J. M. (2007). Inside rebellion: the politics of insurgent violence. Cambridge: Cambridge University Press.
Weyland, K. (2009). The rise of Latin America's two lefts: insights from the rentier state theory. Comparative Politics, 41(2), 145-164.
Wise, H., & Shtylla, S. (2007). The role of the extractive sector in expanding economic opportunity. Cambridge: John F. Kennedy School of Government / Harvard University.
Wooldridge, J. (2002). Econometric analysis of cross section and panel data. Cambridge, Massachusetts: MIT Press.
World Bank. (2003). Striking a better balance - the World Bank Group and extractive industries: the final report of the extractive industries review (Vol. 2007). Washington: The World Bank.
World Bank. (2009). Governance matters 2009: worldwide governance indicators 1996-2008. Retrieved 7 August, 2009, from http://info.worldbank.org/governance/wgi/sc_chart.asp
World Bank. (2010). World development indicators. Retrieved 20 March, 2010, from http://publications.worldbank.org/WDI/
World Values Survey. (2009). World values survey. Retrieved 28 April, 2009, from http://www.worldvaluessurvey.org/
Yakovleva, N. (2005). Corporate social responsibility in the mining industries. Aldershot: Ashgate Publishing.
Yashar, D. J. (2005). Contesting citizenship in Latin America: the rise of indigenous movements and the postliberal challenge. Cambridge: Cambridge University Press.
Zas Friz Burga, J. (2005). El actual proceso peruano de descentralización: balance y perspectivas de su diseño normativo e institucional. In W. Alejos Calderón

− 242 −
& J. Zas Friz Burga (Eds.), Concertando la descentralización: balance del diseño normativo. Lima: Fondo Editorial del Congreso del Perú.
Zavalla, C. (2004). Canon minero y distribución de ingresos en el Perú. In Desco (Ed.), Perú hoy: los mil días de Toledo (pp. 151-192). Lima: Desco.
Zegarra, E., Orihuela, J. C., & Paredes, M. (2007). Minería y economía de los hogares de la sierra peruana: impactos y espacios de conflicto. Lima: GRADE.

− 243 −
APPENDIX I: Change in production and international prices for principal Peruvian minerals (2000–2008), taking 2000 as the base year
Source: Ministerio de Energía y Minas; adaptation: the author.
100
200
300
400
2000 2001 2002 2003 2004 2005 2006 2007 2008
Copper production Copper price
100
150
200
250
300
2000 2001 2002 2003 2004 2005 2006 2007 2008
Gold production Gold price
5010
015
020
025
030
0
2000 2001 2002 2003 2004 2005 2006 2007 2008
Zinc production Zinc price
100
150
200
250
300
2000 2001 2002 2003 2004 2005 2006 2007 2008
Silver production Silver price
100
200
300
400
500
600
2000 2001 2002 2003 2004 2005 2006 2007 2008
Lead production Lead price
100
200
300
400
2000 2001 2002 2003 2004 2005 2006 2007 2008
Tin production Tin price

− 244 −
APPENDIX II: Poverty levels and income per capita in different geographical regions of Peru
Table A II.1 Percentage of the population below the poverty line in differentgeographical regions of Peru, 2001–2008
Area 2001 2002 2003 2004 2005 2006 2007 2008
Whole country 54.3 53.8 52.2 51.6 48.7 44.5 39.3 36.2
Lima 31.8 34.2 33.7 36.6 32.6 24.2 18.5 17.7
Rest of the country 63.3 61.8 59.6 57.7 55.2 52.8 47.8 n/a Urban 42.0 41.0 39.5 40.3 36.8 31.2 25.7 23.5 Rural 77.1 77.7 75.7 72.5 70.9 69.3 64.6 59.8 Coastal region 39.0 39.8 37.8 38.4 34.2 28.7 22.6 21.3 Urban* n/a n/a n/a 37.1 32.2 29.9 25.1 23.4
Rural n/a n/a n/a 51.2 50.0 49.0 38.1 34.8 Andean sierra 70.6 70.0 68.6 67.7 65.6 63.4 60.1 56.2 Urban n/a n/a n/a 44.8 44.4 40.2 36.3 33.5
Rural n/a n/a n/a 75.8 77.3 76.5 73.3 68.8 Amazon rainforest 69.8 64.9 64.1 59.5 60.3 56.6 48.4 40.9 Urban n/a n/a n/a 50.4 53.9 49.9 40.3 31.3
Rural n/a n/a n/a 63.8 65.6 62.3 55.3 49.1 Notes: * excluding Lima. Source: INEI.
Table A II.2 Per capita average monthly incomes in different geographical regions of Peru, 2004–2008 (Peruvian Nuevos Soles at 2001 rates)
Area 2004 2006 2008 Variation 2008/2004
Whole country 371.5 396.7 452.2 80.7 Lima 604.3 640.9 703.0 98.7 Urban 479.3 513.8 580.1 100.8 Rural 171.9 178.9 214.7 42.8 Coastal region Urban* 403.1 430.5 481.9 78.8
Rural 266.3 269.5 334.3 68 Andean sierra Urban 387.3 427.6 504.9 117.6
Rural 155.9 156.8 185.2 29.3 Amazon rainforest Urban 298.3 328.0 430.5 132.2 Rural 155.9 179.9 223.8 67.9 Source: INEI.

APPENDIX III: Summary of principal mining companies in the field research regions
REGION Mine Owners Commencement year* Type Minerals Size Expected
lifespan** Employment***
Direct Services
AN
CA
SH
Antamina
BHP Billiton: 33.7%
Xstrata: 33.7%
Teckcominco: 22.5%
Mitsubishi: 10%
2001 Open pit Cu, Zn Very large
Over 25 years
1,700 2,500
Pierina Barrick 1998 Open pit Au Medium Extended to 2013 440 450
MO
QU
EGU
A
Cuajone Grupo Mexico 1976 Open pit Cu Large Over 20 years 1,500 500
Quellaveco Anglo American Expected 2012 Open pit Cu, Mo Large Over 30 years 1,500
PASC
O
Cerro de Pasco Volcan 1903 Underground
Open pit (1956) Zn, Pb, Ag Large Long term**** 1,230 1,990
Brocal El Brocal 1956 Open pit (1993) Zn, Pb, Ag Medium Long term 275 600
Huarón Pan American Silver 1912 Underground Ag, Zn Medium 15 years 812 570
Atacocha Atacocha 1937 Underground Zn, Ag, Pb, Cu Medium 8–10 years 390 ---
Milpo Milpo 1949 Underground Zn, Pb, Cu Medium 8–10 years 300 600
Notes: * in some locations, mining activities commenced before the involvement of the present company; ** according to direct company information or estimated through reserves and production; *** according to company information; **** dependent on current negotiation with population and authorities. Sources: company annual reports and personal interviews with employees.

APPENDIX IV: Main features of municipalities included in the field study
Region Municipality Mine Height (MSL)
Population 2007
Population growth
1993–2007
Canon transfers per capita 2005–2008 in PEN
Indigenous population
2007
Rural population
2007 Poverty level
2007
AN
CA
SH
Jangas Pierina 2,809 4,506 1,017 1,780 71.9% 59.9% 54.6%
Huari Antamina 3,110 10,024 1,008 2,638 66.4% 50.4% 56.5%
Cajay Antamina 3,175 3,107 0.983 3,896 94.2% 78.9% 79.2%
Chavin de Huantar Antamina 3,141 9,355 1,001 3,240 83.3% 76.8% 79.1%
Huachis Antamina 3,243 3,868 0,992 4,012 93.9% 66.0% 80.5%
Ponto Antamina 3,115 3,574 0,996 3,718 93.9% 77.9% 80.3%
San Marcos Antamina 2,956 14,006 1,013 7,663 72.7% 72.5% 64.5%
MO
QU
EGU
A Moquegua Cuajone 1,417 50,424 1,025 1,847 17.0% 5.8% 22.1%
Carumas Cuajone 3,043 4,914 1,023 4,264 33.9% 42.5% 49.7%
Samegua Cuajone 1,558 6,647 1,004 1,699 16.3% 10.1% 22.7%
San Cristobal Cuajone 3,458 3,590 1,019 3,788 53.1% 16.7% 54.8%
Torata Cuajone 2,195 6,725 0,989 8,779 16.7% 49.5% 21.1%
PASC
O
Huachon --- 3,407 4,825 1,014 1,209 7.1% 40.0% 74.1%
Huayllay Huarón 4,348 11,188 1,021 1,416 5.9% 32.7% 56.8%
Ninacaca --- 4,141 4,024 0,998 1,157 11.7% 46.8% 74.2%
San Fco.de Asis Yarusyakan Atacocha & Milpo 3,814 1,1812 0,996 1,145 3.5% 63.7% 84.2%
Simon Bolivar Cerro de Pasco 4,191 1,4416 0,995 1,085 3.9% 11.2% 44.5%
Tinyahuarco Brocal 4,270 6,282 1,016 1,345 2.8% 3.1% 47.3%

− 247 −
APPENDIX V: Criteria for the definition of categories in the three different classifications of conflict
Category Description of relevant features
Classification 1: Relation to mining (extractive industries)
1. Mining
Involves claims against mining companies; the regulatory or legislative power of the state regarding extractive industries; the distribution of mining revenues; or the control of natural resources crucial to the industry.
2. Other Remaining conflicts.
Classification 2: Actors
1. Indigenous groups and rural population
Includes indigenous and peasant communities and their organisations.
2. Urban population Citizens living in urban areas acting in their capacity as inhabitants of such areas, which frequently include small urban centres that are the principal towns of rural districts.
3. Local and regional political authorities
Elected local and regional authorities who promote and lead social mobilisation.
4. Trade unions and workers’ organisations Workers acting in defence of their rights or interests.
5. Business associations Informal groups and formal associations of small entrepreneurs acting in defence of their interests.
6. Students University students.
7. Other Remaining conflicts.
Classification 3: Motives
1. National legislation or state policy Conflicts with national legislation or state policy.
2. Sub-national authorities behaviour Conflicts with local or regional authorities.
3. Behaviour of companies Conflicts that target the behaviour of companies. Includes demands with regard to social expenditure and/or claims for financial compensation.
4. Environment
Conflicts aimed at halting environmental degradation (codified in the previous category if there is a clash over this kind of dispute that ends in agreement on social or financial compensation).
5. Labour issues Conflicts between employers and employees.
6. Delimitation of territories Conflicts in which some actors claim their jurisdiction over disputed territory or riparian rights.
7. Other Remaining conflicts.

APPENDIX VI: Summary of variables used in the regression analysis of conflicts
Variable Variable type Description Source Obs. Mean Std. d. Min. Max.
1. Log of canon minero per capita
Scale Annual data for per capita transfers of canon minero to regional and local governments of the region.
MEF 96 1.357 1.134 0 3.557
2. Territory under mining concession
Scale Annual data for the percentage of the area of the region for which companies hold mining rights.
MEM 96 16.3 11.8 0.07 50.9
3. Log of per capita investment in mining activities
Scale Annual data for the investment of mining companies by region.
MEM 96 1.295 0.869 0 2.919
4. Percentage of poverty Scale Annual index of population below the poverty line.
NICS 96 47.7 20.7 15.1 90.3
5. Mining as a percentage of GDP (constant prices)
Scale Annual mining production as a percentage of total regional GDP calculated at constant 1994 prices; represents material production.
NICS 96 12.4 13.8 0 56.2
6. Indigenous population above 20%
Scale transformed to dummy
Percentage of the population affirming that in 2007 Spanish was not their mother tongue.
National Census
2007 96 22.1 23.1 0.4 71.0
7. Migration to the region in the last five years above 12%
Scale transformed to dummy
Percentage of the population affirming that in 2007 it had lived in the same region for at least five years.
National Census
2007 96 11.3 4.7 4.5 23.1

8. Percentage of workforce in agriculture greater than 60%
Scale transformed to dummy
Percentage of the population affirming that in 2007 agriculture was their primary occupation.
National Census
2007 96 34.6 16.6 3.8 64.8
9. Percentage of workforce in mining greater than 3%
Scale transformed to dummy
Percentage of the population affirming that in 2007 mining was the primary occupation.
National Census
2007 96 2.2 2.6 0 10.4
10. Electoral participation greater than 85%
Scale transformed to dummy
Percentage of electorate voting in regional elections.
ONPE 96 85.6 3.8 75.0 91.2
11. Radical vote greater than 50%
Scale transformed to dummy
Percentage of the electorate supporting the radical candidate in the first round of the 2006 national elections.
ONPE 96 38.2 13.2 15.9 62.7
12. Percentage of the vote captured by the winner in regional elections
Scale Percentage of total vote cast captured by the winning party in regional elections in 2002 and 2006.
ONPE 96 27.5 6.8 15.6 50.9

− 250 −
APPENDIX VII: Quantitative analysis of the impact of mining on economic and welfare indicators in Peruvian regions
In this appendix, I present how far the amount of per capita canon transfers and
other two mining-related variables that control for the weight of mining in the
regional economy and the economic importance of the variation in mining
production correlate with variations in economic growth; poverty reduction; changes
in the coverage of drinking water and sanitation facilities; and school attendance at
two different ages, across Peruvian regions in 2002–2008. A brief description of
these dependent variables follows:
(i) The annual rate of GDP growth at regional level excluding mining activities.
This indicator is a proxy for the dynamism of economic sectors other than
mining. I used the sectorally disaggregated data of regional GDP at constant
prices of 1994 provided by the National Institute of Computing and Statistics
(NICS) 234 to make the calculations.
(ii) The annual variation in poverty measured as a percentage of the regional
population below the poverty line.235
(iii) The annual variation in the percentage of the population with access to drinking
water according to the National Household Survey.236
(iv) The annual variation in the percentage of the population with sanitation
facilities at home, according to the NHS.
(v) The annual variation in the school attendance rate of children between 3 and 5
years old in relation to the total population of that age. Data from the NHS.
(vi) The annual variation in the school attendance rate of children between 12 and
16 years old in relation to the total population of that age. Data from the NHS.
The three independent mining-related variables that I tested are as follow:
(i) Mining as percentage of total regional GDP at constant 1994 prices is a proxy
for the importance of mining in relation to the total regional economy. It is a
broad indicator that helps to assess the general effect of mining activity. 234 The NICS used the value-added approach to calculate regional GDP by sectors. 235 The poverty line is defined in terms of income according to a region-specific variable benchmark. In Peru, since 1995, the NICS has conducted household surveys that provide very detailed data on a wide range of issues. In 2003 a change in the methodology made that the annual compilation of this data meant there was statistical inference with validity at regional level. 236 This indicator comprises people with drinking water at home and those who access some form of collective service.

− 251 −
(ii) Index of annual variation of mining GDP. I built this index by multiplying the
annual variation of mining GDP at constant prices of 1994 by the rate of mining
in relation to the total regional GDP in the previous year. This index captures
the economic importance of the variation in mining activities. It helps to test the
existence of spillover effects. If mining has the capacity to generate positive or
negative spillover effects on the rest of the regional economy, this variable
should explain variations in the rates of economic growth and, probably, on
welfare indicators across regions.
(iii) The logarithm of annual per capita canon minero transfers at current value
going to the regional government and municipalities of each region is a proxy
for the implementation of the NEIS.
The first two help to test the direct influence of mining activities on economic and
welfare indicators, while the third is a proxy for the implementation of the NEIS.
Additionally, in the analyses of each of the six dependent variables, I used different
control variables. I present these variables in the next sections of this appendix,
while appendix VIII summarises all the variables used in the analyses.
I use Random Effects (RE) panel regression specifications as the best possible
way of dealing with the problems of the serial correlation and heteroskedasticity of
the panel. I use the XTREG command in STATA with the option ‘r’ to correct these
problems. I ruled out the use of the more conventional Panel Corrected Standard
Errors (PCSE) models because the number of regions in the panel is larger than
the number of years (see discussion in section 5.3 of the main text for a more
complete explanation).
To ensure the robustness of the estimates, I also calculated an alternative
specification for the models by running pooled OLS regressions with dummies to
control for year effects. I assumed that serial correlation tended to cause less
severe distortions in the case of panels with short temporal series (Wooldridge,
2002:276). The estimate for robust standards errors corrects for the problem of
heteroskedasticity. This new specification did not change either the sign or the
statistical significance of the estimates.

− 252 −
In the following sections, I present the analysis of each of the dependent variables,
introducing the different control variables I used in each case, and briefly discuss
the results.
A.VII.1 Testing the influence of mining on regional economic growth (2002–2008)
I took the annual rate of GDP growth – excluding mining activities – at regional
level as the dependent variable to determine the influence of mining on economic
growth. This indicator is thus a proxy for the dynamism of economic sectors other
than mining. I used sectorally disaggregated regional GDP data at constant 1994
prices provided by the National Institute of Computing and Statistics (NICS) to
calculate it.237 From 2002 to 2008, the year-by-year average growth rate for the 24
regions of the panel was 6.1 per cent, with a minimum value of -4.6 per cent for
Lambayeque (2004), and a maximum value of 20.9 per cent for Ica (2008).238
I introduced into the model the three mining-related explanatory variables that I aim
to test. Additionally, I controlled for the six following variables that might also
influence the rate of economic growth.239
(i) The percentage of the regional population below the poverty line in the
previous year.
(ii) Government services as a percentage of total regional GDP at constant 1994
prices.
(iii) Manufacturing as a percentage of total regional GDP at constant 1994 prices.
(iv) Trade as a percentage of total regional GDP at constant 1994 prices.
(v) Agriculture as a percentage of total regional GDP at constant 1994 prices.
(vi) Construction as a percentage of total regional GDP at constant 1994 prices.
To check the robustness of the estimates, I used year dummies to control for year-
specific factors that could affect economic growth rates across the whole country;
237 The INEI employed a value added technique to calculate regional GDP by sector. 238 The extremely high level for Ica in 2008 is due to massive investment in the reconstruction of the region after an earthquake in August 2007. 239 See the end of this appendix for a complete description of all the dependent and independent variables used in the analysis.

− 253 −
taking 2002 as the base year. Thus, Table A.VII.1 presents the results of the two
different specifications.
The models show that neither the relative importance of mining in relation to the
total regional GDP, variations in mining-related GDP, nor canon minero transfers
accruing to sub-national governments significantly correlate with the variation in
economic growth rates across the regions during in2002–2008. I also tested a
further specification, whose results are not represented in the tables, lagging the
three mining-related variables to capture the probable delay in their effect on the
dynamism of other economic sectors. However, the three lagged mining-related
variables had no statistical significance.
Among the other control variables, the poverty level of the region during the
previous year has a statistically significant negative effect on the rate of economic
growth in all the models. However, the regression coefficients denote that this
influence is quantitatively small. By contrast, the relative size of the agriculture
sector positively relates to the rate of economic growth in a statistically significant
fashion, and its effect is quantitatively more important. The importance of the
construction sector to the regional economy is statistically significant in the random
effects specification, but the effect disappears when year dummies are included.
None of the remaining variables are statistically significant.
These results rule out both the existence of a positive spill over effect of mining into
other economic sectors in the region, and the potential of canon minero transfers to
promote economic development during the period covered by this study.

− 254 −
Table A VII.1 Regression of mining-related and other socio-economic variables on the rate of annual GDP growth in Peruvian regions (2002–2008).
Dependent variable: The annual rate of regional GDP growth excluding mining activities
Time frame Panel data 2002–2008
Panel data 2002–2008
Model specification Model 1
Random-effects GLS regressiona
Model 2
Pooled OLS regression with robust standard errors
Constant .053
(.030)*
.052 (.030)*
Mining as a percentage of total regional GDP
2.38e-4
(3.61e-4)
3.35e-4
(3.44e-4)
Index of annual variation in mining GDP 4.64e-4
(8.40e-4)
4.24e-4
(8.37e-4)
Log of canon minero per capita .001
(.002)
-.004 (003)
Percentage of poverty in previous year -6.71e-4
(1.84e-4)***
-4.93e-4
(1.93-4)**
Government services as a percentage of total regional GDP
-.042
(.117)
-.088 (.118)
Manufacture as a percentage of total regional GDP
.027
(.080)
.056 (.091)
Trade as a percentage of total regional GDP
.025
(.106)
-.002
(.102)
Agriculture as a percentage of total regional GDP
.124
(.040)***
.109 (.039)***
Construction as a percentage of total regional GDP
.286
(.190)*
.287 (.188)
Y2003 -.017
(.007)**
Y2004 -.010
(.010)
Y2005 .009
(.010)
Y2006 .014
(.010)
Y2007 .012
(.0109)
Y2008 .016
(.009)*
R2 .20 .29
N 168 168
Standard errors in parenthesis; a Standard errors are adjusted for clustering in regions; *** significant at 1% level; ** significant at 5% level; * significant at 10% level.

− 255 −
A.VII.2 Testing the influence of mining on changes in the level of poverty (2004–2008)
The annual variation in poverty is the second dependent variable. This indicator
captures the percentage of the population with an income below a region-specific
benchmark of poverty. I used data for a period (2003–2008) when poverty levels
had an average improvement of 2.8 percentage points per year.
I introduced in the model three mining-related indicators as independent variables,
but in this case, I lagged canon minero transfers per capita by a year to reflect the
lapse of time between spending the money and the potential results in terms of an
increase in the population’s income. In addition to these three variables, I also
controlled for a set of socio-economic and political variables that shape the regional
context:
(i) Percentage of the regional population below the poverty line in the previous
year controls for the departure level of the dependent variable.
(ii) Percentage of indigenous population in the region measured in terms of mother
tongue according to data from the 2007 national census.
(iii) Percentage of the vote going to the radical candidate in the first round of the
2006 presidential elections, as a proxy for disagreement with economic
policies.
(iv) Rate of GDP regional growth as a proxy for economic dynamism.
(v) Government services as a percentage of total regional GDP.
Table A.VII.2 presents the results of the analysis. The models explain little variance
in the change in poverty level across Peruvian regions (6 and 16 per cent). In
considering the importance of each variable in the models, the results contradict
the official claims about the positive effects of mining. None of the three mining-
related variables have any statistically significant positive correlation with changes
in the level of poverty.
The percentage of the populations below the poverty line in the previous year and
the number of indigenous people in the regions is statistically significant. Regions
with high levels of poverty tended to improve more than those that were less
afflicted. This result is clearer in model 2, which includes year dummies. By
contrast, regions with a higher proportion of indigenous people advanced less than

− 256 −
the rest. However, this effect disappears in the second model. Indicators of the
rate of economic growth and the importance of government services as part of
regional GDP are not statistically significant.
Table A VII.2 Regression analysis of mining-related and other socio-economic variables on changes in poverty levels in Peruvian regions (2003–2008)
Dependent variable: Annual variation in poverty (percentage of the population below the poverty line)
Time frame Panel data 2003–2008
Panel data 2003–2008
Model specification Model 1
Random-effects GLS regressiona
Model 2 Pooled OLS regression with
robust standard errors
Constant .944
(2.670) 1.296
(2.902)
Mining as percentage of total regional GDP -.051 (.048)
-.035 (.046)
Index of annual variation in mining GDP .182 (211)
.145 (.224)
Log of canon minero per capita in the previous year
.205 (.606)
-.342 (.660)
Percentage of poverty in the previous year .049
(.026)* .050
(.025)**
Percentage of the indigenous population in the region
-.079 (.045)*
-.071 (.045)
Percentage of the vote to the radical candidate in the 2006 election
.047 (.063)
.050 (.065)
Variation in regional GDP -1.575
(13.138) -.526
(13.644)
Government services as a percentage of total regional GDP
-3.682 (14.422)
-.9.728 (14.877)
.427
(1.598
Y2005 -3.407
(1.715)**
Y2006 .355
(1.597)
Y2007 2.417
(1.646)
Y2008 .853
(1.763)
R2 .06 .16
N 144 144
Standard errors in parenthesis; a Standard errors are adjusted for clustering on regions; *** significant at 1% level; ** significant at 5% level; * significant at 10% level.

− 257 −
A.VII.3 Testing the influence of mining on the annual change in levels of drinking water, and sanitation coverage (2004–2008)
In this section, I tested the influence of the three mining-related variables and other
control variables on two dependent variables that measure the annual change in
levels of drinking water and sanitation coverage:
(i) The annual variation in the percentage of the population with access to drinking
water, according to the National Household Survey.240 The average percentage
of people accessing drinking water at regional level dropped from 61.5 per cent
in 2003 to 59.7 per cent in 2008, representing an average annual decrease of
0.4 percentage points in coverage.
(ii) The annual variation in the percentage of the population with sanitation facilities
in the home, according to the National Household Survey. From 2003 to 2008
the average sanitation coverage rate for the 24 regions of the panel increased
from 36.9 to 42.8 per cent, with an average year improvement of 1.2
percentage points.
In this model, I lagged the three mining-related variables because I consider that
any effect on changes in public service coverage involves a delay to allow time for
project implementation. In addition, I controlled for four other variables:
(i) Level of coverage of these public services in the previous year; these variables
control for the departure level of the dependent variable.
(ii) Percentage of the regional population below the poverty line in the previous
year; this variable controls for the general level of poverty.
(iii) Percentage of the indigenous population in the region measured in terms of
mother tongue, according to the 2007 national census.
(iv) Percentage of the rural population in 2007; this variable controls for
characteristics of the regional population that might hinder the implementation
of public services.
Tables A.VII.3 and A.VII.4 present the results of the regression analysis. None of
the mining-related variables have any influence on variance in annual changes in
drinking water or sanitation coverage. The models have very low explanatory
240 This indicator includes people with drinking water at home and those who have access to water in collective facilities outside the house.

− 258 −
powers and only the initial levels of coverage of both drinking water and sanitation
facilities are statistically significant.
Table A VII.3 Regression analysis of mining-related and other socio-economic variables on changes in the level of drinking water coverage in Peruvian regions (2004–2008)
Dependent variable: Changes in levels of drinking water coverage
Time frame Panel data 2004–2008
Panel data 2004–2008
Model specification Model 1
Random-effects GLS regressiona
Model 2 Pooled OLS regression
with robust standard errors
Constant 17.507
(5.830)*** 15-068 (5.804)*
Mining as a percentage of total regional GDP in the previous year
-.046 (.065)
-.058 (.065
Index of annual variation in mining GDP in the previous year
-.032 (.201)
-.066 (.198)
Log of canon minero per capita in the previous year
.1.45 (.918)
1.339 (1.027
Percentage of the population with access to drinking water in the previous year
-.193 (.067)***
-.163 (.063)**
Percentage of poverty in the previous year -.066 (.055)
-.081 (.062)
Percentage of the indigenous population in the region
.011 (.041)
.008 (.036)
Percentage of the rural population -11.087 (6.877)
-7.422 (6.789)
Y2005 1.330
(1.526)
Y2006 1.204
(1.703)
Y2007 -.495
(1.866)
Y2008 -.915 2.246
R2 .09 .11
N 120 120
Standard errors in parenthesis; a Standard errors are adjusted for clustering on regions; *** significant at 1% level; ** significant at 5% level; * significant at 10% level.

− 259 −
Table A VII.4 Regression analysis of mining-related and other socio-economic variables on changes in the percentage of the population with sanitation facilities at home (2004–2008)
Dependent variable: Changes in drinking water coverage
Time frame Panel data
2004–2008
Panel data
2004–2008
Model specification Model 1
Random-effects GLS regressiona
Model 2
Pooled OLS regression with robust standard errors
Constant 5.544
(2.797)**
6.791
(3.113)**
Mining as a percentage of total regional GDP in the previous year
-.034
(.047)
-.040
(.050)
Index of annual variation in mining GDP in the previous year
.107
(.142)
0.105
(.132)
Log of canon minero per capita in the previous year
.670
(.723)
.812
(.834)
Percentage of the population with access to sanitation facilities in the previous year
-.076
(.037)**
-.080
(.038)**
Percentage of poverty in the previous year -.011
(.047)
-.019
(.046)
Percentage of the indigenous population in the region
-.012
(.021)
-.014
(.021)
Percentage of the rural population -2.625
(4.787)
-2.114
(4.631)
Y2005 -1.075
(.834)
Y2006 -1.034
(.940)
Y2007 -1.575
(1.415)
Y2008 -.840
(1.082)
R2 .06 .08
N 120 120
Standard errors in parenthesis; a Standard errors are adjusted for clustering on regions; *** significant at 1% level; ** significant at 5% level; * significant at 10% level.

− 260 −
A.VII.4 Testing the influence of mining on the annual variation in school attendance at ages 3–5 and 12–16 (2003–2008).
This last set of regressions analyses the influence of the three mining-related
variables on the school attendance rate in two different age groups:
(i) Annual variation in the school attendance rate of children between three and
five years in relation to the total population of the age group. The average
annual attendance rate at regional level increased from 48.5 per cent in 2003 to
63.1 per cent in 2008, representing an annual improvement of 2.1 percentage
points.
(ii) Annual variation in the school attendance rate of children aged between 12 and
16 in relation to the total population of that age group. The average annual
attendance rates improved from 66 to 72.7 per cent in 2003-2008, with an
average annual improvement of 1 percentage point.
I used the same combination of independent variables as in the previous models,
but introduced a control for the rate of school attendance in the previous year. The
results are slightly different on this occasion (see Tables A.VII.5 and A.VII.6). As in
previous cases, neither the level of mining activity nor any change in it had any
significant influence on the rate of school attendance during the period. However,
canon minero transfers do have a positive impact. Regarding the variation in the
rate of school attendance of 3 and 5-year-olds, canon minero transfers are
significant at the 10 per cent level. There is a caveat in terms of the robustness of
the result, as the effect disappears in the alternative OLS specification (Table
A.VII.5). The influence of canon minero transfers on the attendance of children
aged between 12 and 16 is significant at a higher level (1%), and remains stable in
the alternative specification.
Two variables have a negative effect on the change in the rates of school
attendance of 3–5 and 12–16 year olds. The school attendance rates for the
previous year have a clear negative impact. This is a logical result because the
higher the starting point, the more difficult it is to improve rates. The percentage of
the rural population living in the region is the second variable that has a negative
effect. This negative correlation is also to be expected, since the displacement of
the population makes it more difficult to improve either coverage or quality of
education provision. Moreover, relocation also raises parents’ cost of sending their
children to school.

− 261 −
In contrast, the percentage of indigenous population in the region has a positive
effect on the rate of school attendance of children between 12-16 years old.
Table A VII.5 Regression analysis of mining-related and other socio-economic variables on changes in the school attendance of children between three and five years old (2003–2008)
Dependent variable: Changes in the school attendance rate for 3–5-year olds
Time frame Panel data
2003–2008
Panel data
2003–2008
Model specification Model 1
Random-effects GLS regressiona
Model 2
Pooled OLS regression with robust standard errors
Constant 30.215
(5.747)***
28.973
(5.795)***
Mining as a percentage of total regional GDP in the previous year
-.013
(.041)
-.001
(.046)
Index of annual variation in mining GDP in the previous year
.016
(.164)
.055
(.161)
Log of canon minero per capita in the previous year
1.399
(.716)*
1.082
(.780)
School attendance rate at 3–5 years in the previous year
-.396
(.074)***
-.381
(.074)***
Percentage of poverty in the previous year -.079
(.058)
-.063
(.066)
Percentage of the indigenous population in the region
.021
(.029)
.022
(.029)
Percentage of the rural population -10.236
(5.346)*
-11.193
(6.152)*
Y2004 .941
(2.053)
Y2005 -2.498
(2.103)
Y2006 -1.251
(2.215)
Y2007 1.906
2.113
Y2008 .926
(2.304)
R2 .20 .23
N 144 144
Standard errors in parenthesis; a Standard errors are adjusted for clustering in regions; *** significant at 1% level; ** significant at 5% level; * significant at 10% level.

− 262 −
Table A VII.6 Regression analysis of mining-related and other socio-economic variables on changes in the school attendance of children between 12 and 16 years old (2004–2008)
Dependent variable: Changes in the school attendance rate in 12–16-year olds
Time frame Panel data
2003–2008
Panel data
2003–2008
Model specification Model 1
Random-effects GLS regressiona
Model 2
Pooled OLS regression with robust standard errors
Constant 30.689
(5.397)***
31.310
(5.464)***
Mining as a percentage of total regional GDP in the previous year
.048
(.042)
.039
(.043)
Index of annual variation in mining GDP in the previous year
-.079
(.113)
-.066
(.126)
Log of canon minero per capita in the previous year
1.181
(.369)***
1.317
(.412)***
School attendance rate at 12–16 years in the previous year
-.374
(.062)***
-.368
(.061)***
Percentage of poverty in the previous year -.048
(.037)
-.064
(.042)
Percentage of the indigenous population in the region
.080
(.022)***
.078
(.022)***
Percentage of the rural population -13.490
(4.347)***
-11.555
(4.669)**
Y2004 -1.588
(1.495)
Y2005 -.505
(1.294)
Y2006 -.584
(1.298)
Y2007 -465
1.294
Y2008 -2.041
(1.314)
R2 .23 .25
N 144 144
Standard errors in parenthesis; a Standard errors are adjusted for clustering in regions; *** significant at 1% level; ** significant at 5% level; * significant at 10% level.

APPENDIX VIII: Variables used in the regression analysis of mining-related variables over changes in economic and welfare indicators at regional level
A.VIII.1 Dependent variables
Variable Type Description Period Source Obs. Mean Std. d. Min. Max.
DEP
END
ENT
VAR
IAB
LES
1. Annual GDP growth rate excluding mining activities Scale
Annual change in sectoral GDP at constant 1994 prices. 2002–2008 NICS 168 6.1% 3.5% -4.6% 20.9%
2. Annual change in poverty Scale Annual change in the index of the population below the poverty line. 2003–2008 NICS 144 2.8 5.2 -11.4 17.6
3. Annual change in the rate of drinking water coverage Scale
Annual change in the rate of people with access to drinking water at home or through community services.
2004–2008 NICS 120 -0.4 5.7 -18.1 10.7
4. Annual change in the rate of sanitation coverage Scale Annual change in the rate of people with
sanitation facilities at home. 2004–2008 NICS 120 1.2 3.4 -15.6 9.3
5. Annual change in the school attendance rate at 3–5-years Scale
Annual change in the school attendance rate of children between 3 and 5 years in relation to the total population of that age.
2003–2008 NICS 144 2.4 7.6 24.1 28.3
6. Annual change in the school attendance rate at12–16 years Scale
Annual change in the school attendance rate of children between 12 and 16 years in relation to the total population of that age.
2003–2008 NICS 144 1.1 4.7 -10.9 13.5

A.VIII.2 Mining-related independent variables
Variable Type Description Period Source Obs. Mean Std. d. Min. Max.
MIN
ING
-REL
ATE
D
IND
EPEN
DEN
T VA
RIA
BLE
S 1. Mining as a percentage of total regional GDP Scale
Mining as a percentage of total regional GDP at constant 1994 prices. 2002–2008 NICS 168 12.4% 14.3% 0% 58.8%
2. Index of annual variation in mining GDP
Scale
Multiplication of the annual variation of mining GDP at constant 1994 prices by the rate of mining in relation to total regional GDP in the previous year.
2002–2008 NICS 168 0.74 2.87 -12.32 17.11
3. Log of canon minero per capita
Scale Logarithm of annual canon minero transfers per capita going to the regional government and municipalities of each region.
2002–2008 MEF 168 1 1 0 3.56
A.VIII.3 Other control independent variables
Variable Type Description Period Source Obs. Mean Std. d. Min. Max.
CO
NTR
OL
IND
EPEN
DEN
T VA
RIA
BLE
S 1. Percentage of poverty in the previous year
Scale Percentage of the regional population below the poverty line in the previous year. 2002–2008 NICS 168 53.9% 19.1% 15.1% 90.3%
2. Government services as a percentage of total regional GDP
Scale Government services as a percentage of total regional GDP at constant 1994 prices.
2002–2008 NICS 168 8.9% 4.1% 3.2% 23.2%
3. Manufacture as a percentage of total regional GDP
Scale Manufacture as a percentage of total regional GDP at constant 1994 prices. 2002–2008 NICS 168 13.2% 6.4% 25.9% 34.5%
4. Trade as a percentage of total regional GDP
Scale Trade as a percentage of total regional GDP at constant 1994 prices. 2002–2008 NICS 168 13% 4.8% 4.3% 27.7%
5. Agriculture as a percentage of total regional GDP
Scale Agriculture as a percentage of total regional GDP at constant 1994 prices. 2002–2008 NICS 168 15.8% 8.6% 3.4% 41.2%

− 265 −
6. Construction as a percentage of total regional GDP
Scale Construction as a percentage of total regional GDP at constant 1994 prices. 2002–2008 NICS 168 5.7% 2.6% 1.2% 15%
7. Percentage of the indigenous population in the region Scale Percentage of the population affirming that in
2007 Spanish was not its mother tongue. 2003–2008 National Census
2007 144 22.1% 23.1% 0.4% 71%
8. Percentage of the vote for the radical candidate in the 2006 election
Scale Percentage of the electorate supporting the radical candidate in the first round of the 2006 national election.
2003–2008 ONPE 144 38.2% 13.2% 15.9% 62.7%
9. Annual regional GDP growth rate Scale Annual change in total regional GDP at
constant 1994 prices. 2003–2008 NICS 144 6.5% 4.3% -7.4% 21.9%
10. Percentage of the population with access to drinking water in the previous year
Scale Percentage of the population with access to drinking water at home or through community services.
2004–2008 NICS 120 60.3% 18.2% 28.2% 94%
11. Percentage of the population with access to sanitation facilities in the previous year
Scale Percentage of the population with sanitation facilities at home. 2004–2008 NICS 120 39.4% 20.2% 7.6% 88.1%
12. Percentage of the rural population Scale
Percentage of the population living outside district capitals in agglomerations of less than 100 houses in 2007.
2003–2008 National census 2007
144 33.1% 18.8% 2% 68.3%
13. Rate of school attendance of 3–5 year olds in the previous year Scale
School attendance rate of children aged3 and 5 in relation to the total population of that age.
2003–2008 NICS 144 56.4% 12.9% 20.2% 87.7%
14. Rate of school attendance of12–16 year olds in the previous year
Scale School attendance rate of children aged 12 016 in relation to the total population of that age.
2003–2008 NICS 144 70.1% 10.9% 45.3% 90.9%
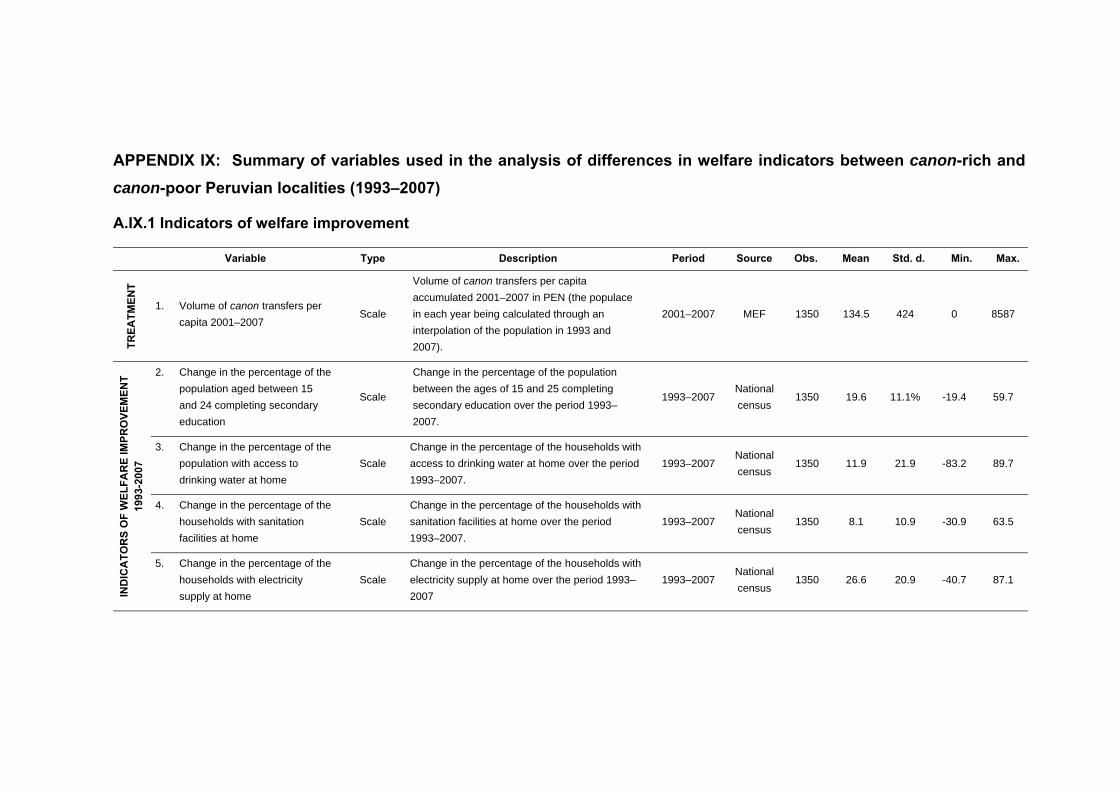
APPENDIX IX: Summary of variables used in the analysis of differences in welfare indicators between canon-rich and canon-poor Peruvian localities (1993–2007)
A.IX.1 Indicators of welfare improvement
Variable Type Description Period Source Obs. Mean Std. d. Min. Max.
TREA
TMEN
T
1. Volume of canon transfers per capita 2001–2007
Scale
Volume of canon transfers per capita accumulated 2001–2007 in PEN (the populace in each year being calculated through an interpolation of the population in 1993 and 2007).
2001–2007 MEF 1350 134.5 424 0 8587
IND
ICA
TOR
S O
F W
ELFA
RE
IMPR
OVE
MEN
T 19
93-2
007
2. Change in the percentage of the population aged between 15 and 24 completing secondary education
Scale
Change in the percentage of the population between the ages of 15 and 25 completing secondary education over the period 1993–2007.
1993–2007 National census
1350 19.6 11.1% -19.4 59.7
3. Change in the percentage of the population with access to drinking water at home
Scale Change in the percentage of the households with access to drinking water at home over the period 1993–2007.
1993–2007 National census
1350 11.9 21.9 -83.2 89.7
4. Change in the percentage of the households with sanitation facilities at home
Scale Change in the percentage of the households with sanitation facilities at home over the period 1993–2007.
1993–2007 National census
1350 8.1 10.9 -30.9 63.5
5. Change in the percentage of the households with electricity supply at home
Scale Change in the percentage of the households with electricity supply at home over the period 1993–2007
1993–2007 National census
1350 26.6 20.9 -40.7 87.1

A.IX. 2 Control variables for propensity score matching
Variable Type Description Period Source Obs. Mean Std. D. Min. Max.
CO
NTR
OL
VAR
IAB
LES
FOR
TH
E EX
CEC
UTI
ON
OF
PR
OPE
NSI
TY S
CO
RE
MA
TCH
ING
7. Population in 1993 Scale Population of the locality in 1993. 1993 National census
1350 9625 13925 438 121894
8. Percentage of the rural population in 2007
Scale Percentage of the rural population in the locality in 2007.
2007 National census
1350 54.8% 29.9% 0% 98.7%
9. Percentage of the indigenous population in 2007
Scale Percentage of the population affirming that in 2007 Spanish was not its mother tongue.
2007 National census
1350 32.6% 36.5% 0% 98.9%
10. Altitude of the locality Scale Altitude of the capital of the district measured in MSL.
--- National census
1350 2224.3 1404 3 4660
11. Percentage of the 15–24 year old population with secondary education in 1993
Scale Percentage of the 15–25-year old population with secondary education in 1993.
1993 National census
1350 53.3% 20.9% 8.3% 96.1%
12. Percentage of the households with access to drinking water at home in 1993
Scale Percentage of the households with access to drinking water at home in 1993.
1993 National census 1350 20.1% 21.5% 0% 96.1%
13. Percentage of households with sanitation facilities at home in 1993
Scale Percentage of the households with sanitation facilities at home in 1993.
1993 National census 1350 9.9% 16.6% 0 93.6%
14. Percentage of the households with electricity at home in 1993
Scale Percentage of the households with electricity at home in 1993.
1993 National census 1350 26.3% 28.1% 0% 99.6%

− 268 −
APPENDIX X: Robustness of PSM results
A.X.1 Analysis of the effect of different canon transfer levels
The following tables represent an estimate of the average effect of high volumes of
canon transfer on changes in welfare indicators in Peruvian localities 1993–2007;
comparing municipalities in receipt of canon transfers amounting to more or less
than PEN 3,500 per capita respectively 2001-2007.
Table A.X.1 Estimate of the average effect of canon transfers above PEN 3,500 per capita (2001–2007) on changes in the percentage of people between 15 and 24 years old with secondary education 1993–2007
Matching estimation method
Nº of canon-rich municipalities
(treated)
Nº of canon-poor municipalities
(controls)
Average effect on treated
Bootstrapped standard
error t statistic
Nearest neighbour 53 49 3.817 2.508 1.522
Radius (.001) 49 494 1.479 1.662 .890
Kernel 53 1,248 1.046 1.140 .917
Stratification 53 1,248 1.702 1.660 1.025
Table A.X.2 Estimate of the average effect of canon transfers above PEN 3,500 per capita (2001–2007) on changes in the percentage of households with a home drinking water supply 1993–2007
Matching estimation method
Nº of canon-rich municipalities
(treated)
Nº of canon-poor municipalities
(controls)
Average effect on treated
Bootstrapped standard
error t statistic
Nearest neighbour 53 49 -5.728 5.721 -1.001
Radius (.001) 49 494 -1.973 5.113 -.386
Kernel 53 1,248 -3.032 3.898 -.778
Stratification 53 1,248 -1.219 4.115 -.296
Table A.X.3 Estimate of the average effect of canon transfers above PEN 3,500 per capita (2001–2007) on changes in the percentage of households with sanitation facilities at home over the period 1993–2007
Matching estimation method
Nº of canon-rich municipalities
(treated)
Nº of canon-poor municipalities
(controls)
Average effect on treated
Bootstrapped standard
error t statistic
Nearest neighbour 53 49 -1.837 2.608 -.704
Radius (.001) 49 494 -.163 2.284 -.071
Kernel 53 1,248 -.460 1.445 -.318
Stratification 53 1,248 -.548 1.788 -.306

− 269 −
Table A.X.4 Estimate of the average effect of canon transfers above PEN 3,500 per capita (2001–2007) on changes in the percentage of households with an electricity supply at home over the period 1993–2007
Matching estimation method
Nº of canon-rich municipalities
(treated)
Nº of canon-poor municipalities
(controls)
Average effect on treated
Bootstrapped standard
error t statistic
Nearest neighbour 53 49 10.544 5.049 2.088
Radius (.001) 49 494 9.474 4.021 2.356
Kernel 53 1,248 6.508 3.049 2.134
Stratification 53 1,248 4.404 4.142 1.063
A,X.2 Analysis of regional effects
Table A.X.5 Estimate of the average effect of canon transfers above PEN 2,100 per capita (2001–2007) in municipalities in all regions except Ancash on changes in the percentage of people between 15 and 24 years old with secondary education over the period 1993–2007
Matching estimation method
Nº of canon-rich municipalities
(treated)
Nº of canon-poor municipalities
(controls)
Average effect on treated
Bootstrapped standard
error t statistic
Nearest neighbour 74 67 1.904 1.902 1.001
Radius (.001) 67 751 0.334 1.519 .220
Kernel 74 1,187 .165 .913 .181
Stratification 74 1,187 .884 1.171 .755
Table A.X.6 Estimate of the average effect of canon transfers above PEN 2,100 per capita (2001–2007) in municipalities of all regions except Ancash on changes in the percentage of households with a drinking water supply at home over the period 1993–2007
Matching estimation method
Nº of canon-rich municipalities
(treated)
Nº of canon-poor municipalities
(controls)
Average effect on treated
Bootstrapped standard
error t statistic
Nearest neighbour 74 67 -9.498 4.437 -2.141
Radius (.001) 67 751 -10.016 3.133 -3.197
Kernel 74 1,187 -8.722 2.583 -3.377
Stratification 74 1,187 -8.157 2.497 -3.267

− 270 −
Table A.X.7 Estimate of the average effect of canon transfers above PEN 2,100 per capita (2001–2007) in municipalities of all regions except Ancash on changes in the percentage of households with sanitation facilities at home over the period 1993–2007
Matching estimation method
Nº of canon-rich municipalities
(treated)
Nº of canon-poor municipalities
(controls)
Average effect on treated
Bootstrapped standard
error t statistic
Nearest neighbour 74 67 -1.584 2.218 -.714
Radius (.001) 67 751 -1.873 1.600 -1.170
Kernel 74 1,187 -1.489 1.341 -1.110
Stratification 74 1,187 -1.209 1.468 -.823
Table A.X.8 Estimate of the average effect of canon transfers above PEN 2,100 per capita (2001–2007) in municipalities of all regions except Ancash on changes in the percentage of households with a home electricity supply 1993–2007
Matching estimation method
Nº of canon-rich municipalities
(treated)
Nº of canon-poor municipalities
(controls)
Average effect on treated
Bootstrapped standard
error t statistic
Nearest neighbour 74 67 4.609 3.821 1.206
Radius (.001) 67 751 -1.064 2.999 -.355
Kernel 74 1,187 -1.693 2.044 -.828
Stratification 74 1,187 -763 2.425 -.315
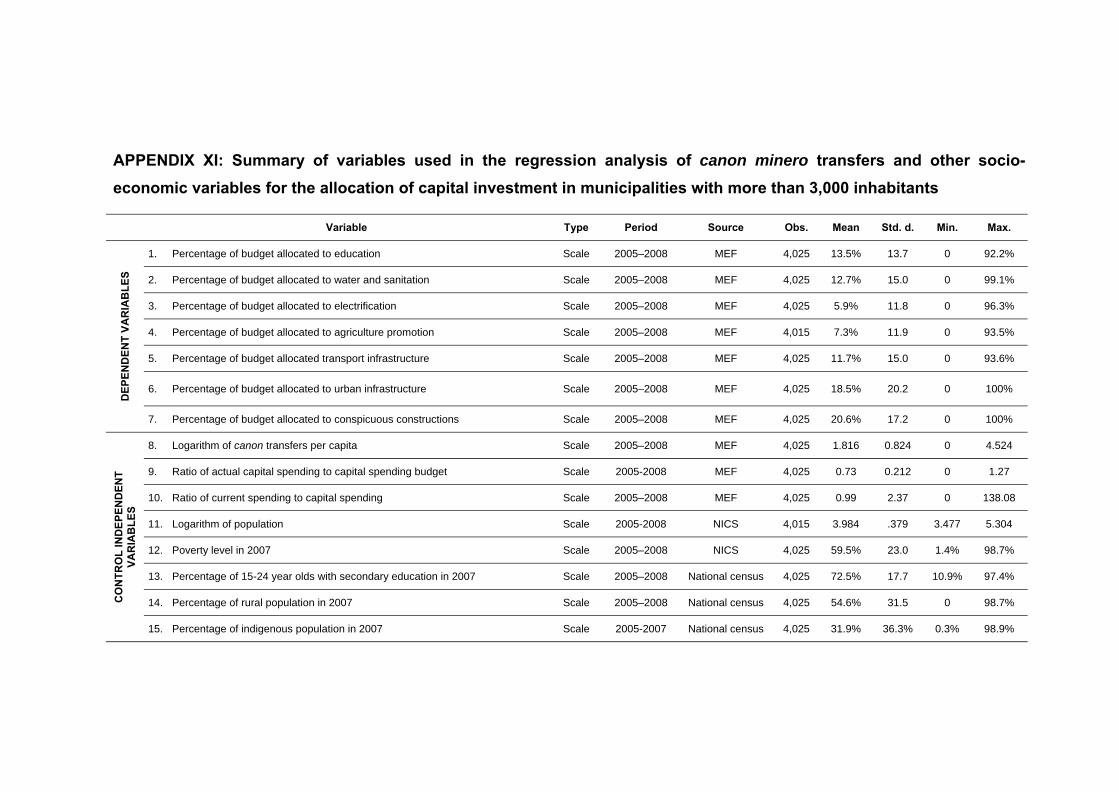
APPENDIX XI: Summary of variables used in the regression analysis of canon minero transfers and other socio-economic variables for the allocation of capital investment in municipalities with more than 3,000 inhabitants
Variable Type Period Source Obs. Mean Std. d. Min. Max.
DEP
END
ENT
VAR
IAB
LES
1. Percentage of budget allocated to education Scale 2005–2008 MEF 4,025 13.5% 13.7 0 92.2%
2. Percentage of budget allocated to water and sanitation Scale 2005–2008 MEF 4,025 12.7% 15.0 0 99.1%
3. Percentage of budget allocated to electrification Scale 2005–2008 MEF 4,025 5.9% 11.8 0 96.3%
4. Percentage of budget allocated to agriculture promotion Scale 2005–2008 MEF 4,015 7.3% 11.9 0 93.5%
5. Percentage of budget allocated transport infrastructure Scale 2005–2008 MEF 4,025 11.7% 15.0 0 93.6%
6. Percentage of budget allocated to urban infrastructure Scale 2005–2008 MEF 4,025 18.5% 20.2 0 100%
7. Percentage of budget allocated to conspicuous constructions Scale 2005–2008 MEF 4,025 20.6% 17.2 0 100%
CO
NTR
OL
IND
EPEN
DEN
T
VAR
IAB
LES
8. Logarithm of canon transfers per capita Scale 2005–2008 MEF 4,025 1.816 0.824 0 4.524
9. Ratio of actual capital spending to capital spending budget Scale 2005-2008 MEF 4,025 0.73 0.212 0 1.27
10. Ratio of current spending to capital spending Scale 2005–2008 MEF 4,025 0.99 2.37 0 138.08
11. Logarithm of population Scale 2005-2008 NICS 4,015 3.984 .379 3.477 5.304
12. Poverty level in 2007 Scale 2005–2008 NICS 4,025 59.5% 23.0 1.4% 98.7%
13. Percentage of 15-24 year olds with secondary education in 2007 Scale 2005–2008 National census 4,025 72.5% 17.7 10.9% 97.4%
14. Percentage of rural population in 2007 Scale 2005–2008 National census 4,025 54.6% 31.5 0 98.7%
15. Percentage of indigenous population in 2007 Scale 2005-2007 National census 4,025 31.9% 36.3% 0.3% 98.9%

APPENDIX XII: Summary of the percentage of the capital investment budget allocated to main sectors in researched municipalities by municipality and year (2005–2008)
Year
Canon transfers per capita (PEN)
Capital investment
budget per capita (PEN)
Percentage of execution of
capital investment budget
Percentage of capital investment budget allocated to main sectors
Education Water & sanitation Agriculture Roads Urban
infrastructureConspicuous constructions
ANCASH
Jangas
Mean 05–08 1.780 2.257 71% 7.4% 11.9% 8.2% 4.2% 26.3% 32.4%
2005 675 710 72% 3.0% 28.9% 5.2% 8.0% 22.2% 24.2%
2006 937 1.194 100% 5.0% 8.5% 16.9% 2.4% 17.3% 31.7%
2007 3.042 3.121 50% 9.6% 6.7% 9.4% 3.4% 25.8% 38.7%
2008 2.465 4.000 62% 5.2% 3.4% 1.4% 3.1% 39.9% 35.0%
Huari
Mean 05–08 2.638 3.532 68% 12.9% 10.8% 9.4% 5.1% 16.2% 35.9%
2005 32 176 80% 3.8% 5.8% 11.7% 0.0% 36.5% 28.9%
2006 919 1.137 85% 10.1% 23.3% 12.9% 0.0% 9.5% 42.9%
2007 5.735 5.930 41% 16.9% 8.4% 8.6% 14.4% 5.2% 30.2%
2008 3.866 6.883 64% 20.9% 5.7% 4.4% 5.9% 13.7% 41.5%
Cajay
Mean 05–08 3.896 4.742 84% 6.8% 8.3% 6.8% 13.5% 25.0% 34.2%
2005 55 125 78% 9.4% 0.4% 9.1% 2.4% 0.9% 77.8%
2006 1.855 1.920 99% 11.4% 24.5% 3.0% 7.4% 43.9% 9.7%
2007 7.798 8.013 51% 5.9% 6.6% 8.6% 31.1% 11.3% 34.9%
2008 5.877 8.910 100% 0.3% 1.8% 6.6% 13.1% 43.9% 14.3%

− 273 −
Year
Canon transfers per capita (PEN)
Capital investment
budget per capita (PEN)
Percentage of execution of
capital investment budget
Percentage of capital investment budget allocated to main sectors
Education Water & sanitation Agriculture Roads Urban
infrastructureConspicuous constructions
Chavin de Huantar
Mean 05–08 3.239 4.478 55% 10.6% 12.2% 13.3% 3.5% 34.1% 21.2%
2005 42 79 81% 3.5% 11.3% 5.8% 2.8% 48.7% 21.6%
2006 1.330 1.358 58% 7.6% 8.9% 22.3% 1.2% 41.3% 16.1%
2007 6.296 7.040 41% 8.9% 14.1% 14.6% 5.6% 26.1% 29.2%
2008 5.290 9.436 42% 22.3% 14.6% 10.6% 4.4% 20.1% 17.9%
Huachis
Mean 05–08 4.012 4.268 69% 19.9% 8.0% 5.3% 17.6% 14.1% 28.9%
2005 47 157 58% 41.6% 9.4% 2.7% 1.2% 0.1% 32.4%
2006 1.905 2.054 81% 4.5% 6.7% 13.0% 44.1% 13.5% 15.9%
2007 7.918 8.056 75% 10.4% 8.9% 4.8% 10.6% 17.9% 43.2%
2008 6.177 6.803 63% 23.1% 7.1% 0.7% 14.5% 24.8% 23.9%
Ponto
Mean 05–08 3.718 4.687 64% 18.0% 10.3% 9.8% 12.5% 16.7% 23.9%
2005 44 111 77% 10.0% 12.0% 12.7% 32.8% 0.6% 16.7%
2006 1.670 1.794 75% 11.0% 13.8% 14.2% 0.6% 15.7% 43.0%
2007 6.986 7.569 35% 24.6% 6.8% 10.8% 8.1% 17.7% 21.5%
2008 6.170 9.277 68% 26.5% 8.7% 1.3% 8.5% 32.8% 14.4%
San Marcos
Mean 05–08 7.663 12.048 20% 33.9% 9.6% 2.3% 7.9% 20.3% 16.8%
2005 42 165 61% 31.4% 5.5% 2.9% 3.9% 6.8% 26.7%
2006 2.981 3.084 7% 14.9% 6.8% 0.3% 0.5% 44.9% 20.9%
2007 15.122 17.541 4% 45.8% 14.0% 0.3% 15.7% 13.3% 9.8%
2008 12.507 27.403 10% 43.5% 12.2% 5.5% 11.6% 16.2% 9.6%

− 274 −
Year
Canon transfers per capita (PEN)
Capital investment
budget per capita (PEN)
Percentage of execution of
capital investment budget
Percentage of capital investment budget allocated to main sectors
Education Water & sanitation Agriculture Roads Urban
infrastructureConspicuous constructions
MOQUEGUA
Moquegua
Mean 05–08 1.847 3.003 48% 2.9% 6.1% 2.7% 9.4% 21.8% 25.2%
2005 991 1.047 32% 0.0% 0.0% 0.0% 0.0% 0.0% 0.0%
2006 1.915 2.554 51% 3.4% 11.4% 5.8% 13.0% 30.6% 26.9%
2007 3.045 4.282 41% 4.6% 8.1% 2.4% 5.1% 37.0% 29.6%
2008 1.437 4.127 70% 3.5% 4.8% 2.6% 19.4% 19.7% 44.1%
Carumas
Mean 05–08 4.264 6.777 42% 7.9% 11.6% 13.0% 26.0% 10.7% 23.4%
2005 2.419 2.682 42% 8.0% 1.2% 22.2% 22.4% 2.8% 34.9%
2006 4.296 6.000 34% 8.9% 3.1% 10.9% 0.3% 38.6% 37.5%
2007 6.333 9.053 28% 4.9% 31.2% 0.1% 39.7% 1.1% 13.2%
2008 4.008 9.371 64% 9.8% 10.8% 19.0% 41.4% 0.2% 7.7%
Samegua
Mean 05–08 1.699 2.559 59% 6.4% 11.9% 0.5% 2.7% 40.6% 33.7%
2005 1.261 1.274 50% 15.6% 8.7% 0.8% 3.0% 23.8% 48.1%
2006 1.628 2.198 83% 5.5% 6.2% 0.2% 0.6% 53.4% 32.3%
2007 2.534 2.512 54% 3.3% 3.5% 0.1% 5.3% 62.3% 23.4%
2008 1.373 4.251 47% 1.2% 29.1% 0.8% 1.9% 22.8% 31.1%

− 275 −
Year
Canon transfers per capita (PEN)
Capital investment
budget per capita (PEN)
Percentage of execution of
capital investment budget
Percentage of capital investment budget allocated to main sectors
Education Water & sanitation Agriculture Roads Urban
infrastructureConspicuous constructions
San Cristobal
Mean 05–08 3.788 4.197 70% 13.8% 16.0% 40.0% 9.4% 0.5% 20.2%
2005 2.364 2.453 79% n/a n/a n/a n/a n/a n/a
2006 4.207 4.775 93% 8.8% 6.3% 30.7% 8.3% 0.4% 45.5%
2007 5.493 4.839 55% 19.1% 22.4% 39.5% 12.7% 0.0% 6.3%
2008 3.087 4.719 53% 13.6% 19.3% 49.7% 7.4% 1.3% 8.8%
Torata
Mean 05–08 8.779 12.694 52% 3.8% 7.7% 35.4% 11.5% 8.7% 19.1
2005 5.170 5.428 34% n/a n/a n/a n/a n/a n/a
2006 8.924 12.603 53% 4.6% 9.6% 31.8% 8.3% 5.8% 28.1%
2007 12.930 16.979 48% 5.4% 7.7% 38.9% 11.0% 9.9% 14.1%
2008 8.092 15.767 71% 1.7% 5.7% 35.6% 15.3% 10.4% 15.1%
PASCO
Huachon
Mean 05–08 1.209 1.674 71% 20.5% 2.2% 4.8% 17.9% 9.5% 42.3%
2005 152 202 82% 37.3% 2.4% 0.0% 13.6% 4.4% 42.3%
2006 461 654 80% 13.2% 4.0% 17.0% 16.9% 28.1% 20.7%
2007 2.317 2.616 46% 14.4% 1.9% 2.1% 17.3% 3.6% 52.8%
2008 1.905 3.224 77% 17.1% 0.6% 0.2% 23.8% 2.0% 53.4%

− 276 −
Year
Canon transfers per capita (PEN)
Capital investment
budget per capita (PEN)
Percentage of execution of
capital investment budget
Percentage of capital investment budget allocated to main sectors
Education Water & sanitation Agriculture Roads Urban
infrastructureConspicuous constructions
Huayllay
Mean 05–08 1.416 2.138 40% 20.0% 18.4% 2.2% 2.7% 18.7% 17.7%
2005 143 203 30% 29.3% 19.9% 0.0% 7.8% 5.9% 17.1%
2006 608 893 60% 15.1% 15.5% 0.1% 0.6% 11.0% 26.7%
2007 2.291 2.905 25% 20.3% 27.7% 7.7% 0.5% 20.0% 8.0%
2008 2.621 4.550 45% 15.3% 10.4% 0.9% 1.9% 37.7% 18.8%
Ninacaca
Mean 05–08 1.157 1.848 37% 16.6% 3.9% 13.2% 3.7% 25.1% 27.4%
2005 117 219 25% 18.6% 0.3% 8.1% 0.0% 19.7% 27.4%
2006 389 651 65% 9.8% 2.6% 5.6% 6.9% 49.7% 21.8%
2007 2.309 2.402 18% 13.9% 5.5% 3.7% 1.3% 26.2% 44.5%
2008 1.814 4.120 39% 24.2% 7.1% 35.4% 6.7% 4.7% 16.1%
San Fc de Asis de Yarusyacan
Mean 05–08 1.145 1.694 42% 7.6% 8.4% 6.8% 21.9% 16.9% 23.6%
2005 245 283 32% 2.5% 8.6% 0.0% 19.6% 49.4% 13.6%
2006 549 796 75% 9.0% 10.8% 10.6% 7.3% 10.2% 28.1%
2007 1.839 2.051 21% 13.0% 3.1% 10.7% 15.1% 3.5% 29.3%
2008 1.947 3.645 42% 5.7% 11.3% 5.8% 45.8% 4.6% 23.2%

− 277 −
Year
Canon transfers per capita (PEN)
Capital investment
budget per capita (PEN)
Percentage of execution of
capital investment budget
Percentage of capital investment budget allocated to main sectors
Education Water & sanitation Agriculture Roads Urban
infrastructureConspicuous constructions
Simon Bolivar
Mean 05–08 1.085 1.463 54% 13.3% 4.7% 0.9% 0.7% 51.1% 23.8%
2005 179 217 31% 22.9% 6.9% 1.2% 0.0% 57.8% 7.5%
2006 512 699 95% 3.7% 2.1% 0.0% 0.0% 54.8% 35.8%
2007 1.829 1.767 32% 17.1% 2.8% 0.0% 2.0% 35.6% 37.3%
2008 1.821 3.170 58% 9.6% 6.9% 2.3% 0.9% 56.1% 14.6%
Tinyahuarco
Mean 05–08 1.345 2.138 33% 20.1% 15.8% 2.4% 0.2% 18.6% 19.4%
2005 182 243 23% 39.9% 34.2% 3.1% 0.0% 10.8% 8.1%
2006 531 772 51% 7.8% 6.2% 0.5% 0.0% 4.9% 20.6%
2007 2.650 3.089 18% 8.6% 10.3% 4.4% 0.7% 21.3% 34.1%
2008 2.016 4.450 42% 24.0% 12.5% 1.8% 0.0% 37.4% 14.9%

APPENDIX XIII Summary of welfare indicators in researched municipalities over the period 1993–2007
Municipality Percentage of
population below poverty
line 2007
1993 percentages Percentage changes over the period 1993–2007
15–24-year-old population
with secondary education
Households with access to drinking water
at home
Households with
sanitation facilities at
home
Households with electricity
supply at home
15–24 year-old population
with secondary education
Households with access to drinking water
at home
Households with
sanitation facilities at
home
Households with electricity
supply at home
ANCASH
Mean 70% 43 % 16% 5% 10% 30 32 13 57
Jangas 55% 41% 30% 4% 14% 31 -3 17 69
Huari 56% 77% 32% 22% 25% 14 37 20 55
Cajay 79% 33% 9% 0% 4% 31 56 10 55
Chavin de Huantar 79% 29% 13% 7% 14% 30 55 15 51
Huachis 80% 39% 5% 0% 1% 30 15 5 60
Ponto 80% 40% 8% 0% 1% 39 7 3 57
San Marcos 64% 45% 15% 5% 10% 35 57 18 55
MOQUEGUA
Mean 34% 77% 53% 39% 50% 15 -13 0 19
Moquegua 22% 91% 74% 68% 79% 5 -6 -3 6
Carumas 50% 64% 43% 9% 14% 24 -39 6 27
Samegua 23% 93% 64% 61% 77% 4 10 11 6
San Cristobal 55% 57% 22% 1% 12% 35 -18 1 60
Torata 21% 83% 62% 56% 67% 8 -11 -12 -5

− 279 −
Municipality Percentage of
population below poverty
line 2007
1993 percentages Percentage changes over the period 1993–2007
15–24-year-old population
with secondary education
Households with access to drinking water
at home
Households with
sanitation facilities at
home
Households with electricity
supply at home
15–24 year-old population
with secondary education
Households with access to drinking water
at home
Households with
sanitation facilities at
home
Households with electricity
supply at home
PASCO
Mean 63% 79% 18% 12% 60% 10 1 7 15
Huachon 74% 72% 15% 5% 39% 4 -14 4 44
Huayllay 57% 77% 6% 7% 32% 16 -3 -2 39
Ninacaca 74% 70% 8% 1% 47% 15 -7 12 15
S. Fco de Yarusyakan 84% 81% 40% 40% 73% 13 -29 -29 0
Simon Bolivar 44% 85% 20% 9% 82% 7 11 20 1
Tinyahuarco 47% 91% 18% 11% 87% 4 48 37 -9