of research. sep 69 162d
TRANSCRIPT
ll.
ED 035 299
AUTHOPTTTLE
INSTTTUTIONSPONS AGENCY
BU EAR NOPUB DATEGRANTNOT
EDRS PPTCEDESCPIPTORS
DOCUMENT RESUME
24 ER 007 666
Girod, Gerald P.The Effectiveness and Efficiency of Two Types ofSimulation as runctions of Level of ElementaryEducation Training. Final Report.Washington State Univ., Pullman.Office of education (DREW), Washington, D.C. Bureauof Research.BP-9-1-055Sep 69OEG-9-570055-0047(057)162D.
EDRS Price ME-50.75 HC-t8.20Educational Eauipment, Educational Experiments,Educational Facilities, Educational Research,Education Majors, *Elementary School Teachers,Learning, *Simulation, *Teacher Education, TeacherEducation Curriculum, *Teaching Methods, TeachingTechniques, Training
ABSTRACTAn experiment was performed to determine the
efficiency of simulation teaching techniques in training elementaryeducation teachers to identify and correct classroom managementproblems. The two Presentation modes compared were film andaudiotape. Twelve hypotheses were tested via analysis of variance todetermine the relative efficiency of these modes for trainingsixty-five sophomore, junior, and senior education students. Measurestaken included resnonse quality, cues discriminated, response errors,stimulus recyclings, elapsed time, and attitude change. results onmost hypotheses were equivocal, and experimental bias was held to bea source of obfuscation in the results. results showed thatsophomores learned less Quickly during the first half of training,but made 1.1D the difference during the second half. Subjects trainedwith films showed similar initial inefficiency, while audiotapesubjects discriminated fewer cues initially. Effects attributable totraining level tended to be nonsignificant measures of effectiveness.A bibliography is include". (BE)
Anre.0111,..1 -
FR1AL REPORT
Project No. 9+055
Grant No. OEG-9-570055-0047(057)
IS. INAITIMII Of MAUI MEAT. & WinnORE Of MANI
11$ WINNE MS IRI INSICED WRY AS RCM NMI MEPill II IIIMEMNI 111111111* IL RIM I VEW II MIPSRAS II Iff SCESIVILY IIPIESIT MEW MEE I BMWPOEM II FOWL
AD
THE EFFECTIVENESS AND EFFICIENCY OF TWO TYPES
OF SIMULATION AS FUNCTIONS OF LEVEL OF
ELEMENTARY EDUCATION TRAINING
September, 1969
U.S. DEPARTMENT OF
HEALTH, EDUCATION, AND WELFARE
Office of Education
Bureau of Research
Final Report
Project No. 9-1-055Grant No. OEG -9- 570055- 0047(057)
THE EFFECTIVENESS AND EFFICIENCY OF TWO TYPESOF SIMULATION AS FUNCTIONS OF LEVEL OF
ELEMENTARY EDUCATION TRAINING
Gerald R. Girod
Washington State University
Pullman, Washington
September, 1969
The research reported herein was performed pursuant to a grant withthe Office of Education, U.S. Department of Health, Education, andWelfare. Contractors undertaking such projects under Governmentsponsorship are encouraged to express freely their professionaljudgment in the conduct of the project. Points of view or opinions
stated do not, therefore, necessarily represent official Office ofEducation position or policy.
U.S. DEPARTMENT OFHEALTH, EDUCATION, AND WELFARE
Office of EducationBureau of Research

ACKNOWLEDGMENTS
The fruition of this study is due in large part to the aid, counsel,and gentle cajolery of Dr. Donald C. Orlich. The efforts of Dr. Orlich aregratefully acknowledged now and will continue to be in the future.
Drs. Frank B. May and James Whipple graciously extended their wisdomto aid, respectively, in the construction of the attitude scale and theanalysis of the data.
Five faculty members from Washington State University Department ofEducation were kind enough to spend many hours, without complaint, judgingthe comparability of the audio-tapes and films used in this study. Thosepatient staff members were: Dr. Robert Grunwald, Dr. Larry Dale, Dr. RobertHarder, Dr. Carole Janson, and Mr. Dennis Myers.
The United States Office of Education was most helpful in itsfinancial aid and consultation in preparing the following report. Timely aidand valuable materials were unhesitatingly extended by Teaching ResearchDivision of the-Oregon State System of Higher Education.
Miss Kathy Tatum deserves a great deal of thanks for her assistancein typing and correcting many very rough drafts. Laudation is extended toMr. Ralph Stredwick for his help in the data collection, preparation, andverification.
To my wife and family there can never be enough gratitude fortheir patience and interest in my efforts.
ii
TABLE OF CONTENTS
Page
ACKNOWLEDGMENTS
LIST OF TABLES . v
LIST OF FIGURES x
SUMMARY xi
ChapterI. INTRODUCTION . .
1
Problems and Objectives 1
Related Literature 3
II. jESIGN OF THE STUDY .
HypothesesDefinition of TermsAssumptionsLimitations .
Stimulus Forms .
Subjects . . . .
19
lc
21
23232425
III. PROCEDURES . . . 23
Preparation of Materials 28Experimenter Training 29Orientation Prior to Training 29Data Collection 30
IV. RESULTS . 36
Analyses Used 36Analyses of Hypotheses 36Analyses of Control Variables 71Summary 72
V. SUMMARY AND CONCLUSIONS 73
Introduction 73Conclusions Directed Toward Hypotheses 73Conclusions Directed Toward the Contr91 Variables 79Effectiveness and Efficiency Conclusions . . . . . 80Summary
iii
83
Page
VI. IMPLICATIONS 85
Introduction 85Research OOOOO 85Teacher Training 87
BIBLIOGRAPHY 90
APPENDIXA. ANALYSIS OF VARIANCE SUMMARY TABLES FOR
SELECTED HYPOTHESES AND CONTROL VARIABLES 95
B. ATTITUDE SCALE MATERIALS . . . . . . . . . . . . . . . . . . . 114
C. AUDIO-TAPE MATERIALS . OOOOO OOOOO 123
D. DATA COLLECTION MATERIALS OOOOO OOOOO 137
E. ORIENTATION MATERIALS OOOOOOOOO 140
F. TRAINING MATERIALS OOOOOOOOO 146
iv

LIST OF TABLES
Table
1. Design of the Study ...
2. Design of the Study: Level by Form
3. Analysis of Variance Summary for First Response--First-halfof Training
4. Analysis of Varianceof Training ...
5. Analysis of VarianceTraining
Summary for First Response--Second-halfOO OOOOOOOOO
Page
26
2G
37
I 33
Summary for First Response--Total
. . . 40
. . 41
. . 42
. 42
. . 43
. 45
. . . 46
. 46
. . . 47
. 47
49
50
6. Analysis of Variance Summary for First Response--Gain Score .
7. Analysis of Variance Summary for Incorrect Responses--Pirst-half of Training
8. Mean Differences for Incorrect Responses for Training Levelfor the First-half of Training
9. Analysis of Variance Summary for Incorrect Responses--Secov4.-half of Trainingw
10. Analysis of Variance Summary for Incorrect Responses--TotalTraining OOOOO OOOOO
11. Mean Differences for Incorrect Responses for Level for TotalTraining . .
12. Analysis of Variance Summary for Incorrect Responses- -Reduction Score
13. Mean Differences for Incorrect Responses for Interaction- -
Reduction Scores
14. Mean Incorrect Response Scores Ranked for Form by Level
15. Analysis of Variance Summary for Cue Discrimination forTrainingFirst-half
16. Analysis of Variance Summary for Cue Discrimination forTraining--Second-half

TablePage
17. Analysis of Variance Summary for Cue Discrimination forTraining--Total OOOOOOO q OOOOOOOO 50
13. Analysis of Variance Summary for Training Sttmulus Rec,r clings . 52
19. Analysis of Variance Summary for Response Prompts--First-half. 53
20. Mean Differences for Response Prompts for Training Level- -First -half OOOOOOOOO OOOOO OOOOO 53
21. Analysis of Variance SummaryFirst-half OOOOO
22. Analysis of Variance SummaryTotal Training OO
for Cue Discrimination Prompts--O OOOOOOOOOO OOOOO 55
for Cue Discrimination Prompts--O OOOOOOOOOOOOOO 57
23. Analysis of Variance Summary for Elapsed Training Time--Second-half OOOOO . OOOOOO
24, Aean Differences for Elapsed
25, Analysis of Variance Summary
26, em Test Response Score for
27. Analysis of Variance Summary
28. Means for Total Response Cha
58
Training Time--Second-half 59
61
Film Episodes--by Cells 63
for Total Test Response Scores . . 65
for Elapsed Testing Time
nge Scores--Testing MinusTraining
69
29. Means for Attitude Scores OOOOOO OOOOO 70
30. Analysis of Variance Summary for Cue Discrimination GainScores
31. Analysis of Variance Summary for Response Prompts--Second-half OOO OO OOOOO OOOOO 96
96
32. Analysis ofTraining
33. Analysis ofScores
Variance Summary for Response Prompts--TotalOOOOOOOOO OOOOO 97
Variance Summary for Response Prompt ReductionOOOO OOOOOOOOOOOOOO 97
34. Analysis of Variance Summary for Cue Discrimination Prompts--Second -half OOOOOOOOOO OOOOOOOOOO 97
35. Analysis of Variance Summary for Cue Discrimination PromptReduction Scores OOOOO OOOOOOOO 98
36. Analysis of Variance Summary for Elapsed Training Time- -First -half OOOOO OOOOOOOOOOOOOO 98
vi

Table
39.
40.
41.
42.
43.
44.
45.
46.
47.
48.
49.
50.
51.
52.
53.
54.
37. Analysis of Variance Summary for Elapsed Training Time--
Page
Total O 000 OOOOOOO 98
38. Analysis of Variance Summary for Elapsed Training Time- -
Reduction Scores OOOOO 99
Analysis of Variance Summary for Elapsed Testing Time- -
Reduction Scores OOOOO 99
Analysis of Variance Summary for TestAudio-tape Episodes
Analysis of Variance Summary for TestFilm Episodes
Am.,ysis of Variance Summary for TestTotal Minus the Placebo Episode . .
Analysis of Variance Summary for TestScores--Audio-tape Episodes
Response Scores--
Response Scores--
Response Scores--
Cue Discrimination
Analysis of Variance Summary for Test CueScores--Film Episodes
Discrimination
99
100
100
100
OOOOO 101
Analysis of Variance Summary for Test Cue DiscriminationScores--Total Minus the Placebo Episode
Analysis of Variance Summary for Test Cue DiscriminationScores--Total
Analysis of Variance Summary for Response Change Scores- -Similar Problem Episodes O
Analysis of Variance Summary for Response Change Scores- -Similar Standard Episodes
Analysis of Variance Summary for Response Change Scores--Total
101
101
102
102
102
Analysis of Variance Summary for Cue Discrimination ChangeScores--Similar Problem Episodes
Analysis of Variance Summary for Cue Discrimination ChangeScores--Total
Analysis of Variance Summary for Attitude Scores .
Analysis of Variance Summary for Test Response Scores- -Total Minus the Placebo Episode (Sophomores Only)
103
103
103
. . 104
Analysis of Variance Summary for Test Response Scores- -Total Minus the Placebo Episode (Juniors Only) 104
vii

Table Page
55. Analysis of Variance Summary for Test Response Scores- -Total Minus the Placebo Episode (Seniors Only) 105
56. Analysis of Variance Summary for Test Response Scores- -Total Minus the Placebo Episode (All Subjects) 105
57. Analysis of Variance Summary for Test Response Scores- -
Total (Sophomores Only) . 106
58. Analysis of Variance Summary for Test Response Scores- -Total (Juniors Only) . . . . 106
59. Analysis of Variance Summary for Test Response Scores- -Total (Seniors Only) . . . 107
60. Analysis of Variance Summary for Test Response Scores- -Total (All Subjects) OOOOO 107
61. Analysis of Variance Summary for Test Cue DiscriminationScores--Total Minus the Placebo Episode (Sophomores Only) 108
62. Analysis of Variance Summary for Test Cue DiscriminationScores--Total Minus the Placebo Episode (Juniors Only) . . 108
63. Analysis of Variance Summary for Test Cue DiscriminationScores--Total Minus the Placebo Episode (Seniors Only) . . 109
64. Analysis of Variance Summary for Test Cue Discrimination
.Scores--Total Minus the Placebo Episode (All Subjects) . 109
65. Analysis of Variance Summary for Test Cue DiscriminationScores--Total (Sophomores Only) . . . . 110
66. Analysis of Variance Summary for Test Cue DiscriminationScores--Total (Juniors Only) . . . 110
67. Analysis of Variance Summary for Test "ue DiscriminationScores--Total (Seniors Only) . . 111
68. Analysis of Variance Summary for Test Cue DiscriminationScores--Total (All Subjects) . . 111
69. Analysis of Variance Summary for Test Response Scores- -Total Minus the Placebo Episode (Level by E) . . 112
70. Analysis of Variance Summary for Test Response Scores- -Total (Level by E) . . . . 112
71. Analysis of Variance Summary for Test Cue DiscriminationScores--Total Minus the Placebo Episode (Level by E) . . . 113
viii
Table
72. Analysis of Variance Summary for Test Cus Discrimination
Pais
ScoresTotal (Level by 2) . 113
73. Item Construction Matrix . . 115
74. Item Matching . 116
75. Items Ranked by S for Each Form . 117
76. Classification of Problem Episodes . . 147
77. Scoring Matrix . # . . . 149
ix
.4
; );
LIST OF FIGURES
Figure Page
1. First Response Learning Curves for Training Levels . 38
2. First Response Learning Curves for Stimulus Form, . 39
3. Incorrect Response Reduction Curves for Stimulus Forms . 44
4. Incorrect Response Reduction Curves for Training Levels .
5. Response Prompt Reduction Curves for Training Levels . . 54
6. Cue Discrimination Prompt Reduction Curves for StimulusForms . 56
7. Elapsed Time Reduction Curves for Training Levels 60
8. Elapsed Time Reduction Curves for Stimulus Forms . 61
9. Simulation Training Format . . 150
.11111110
SUMMARY
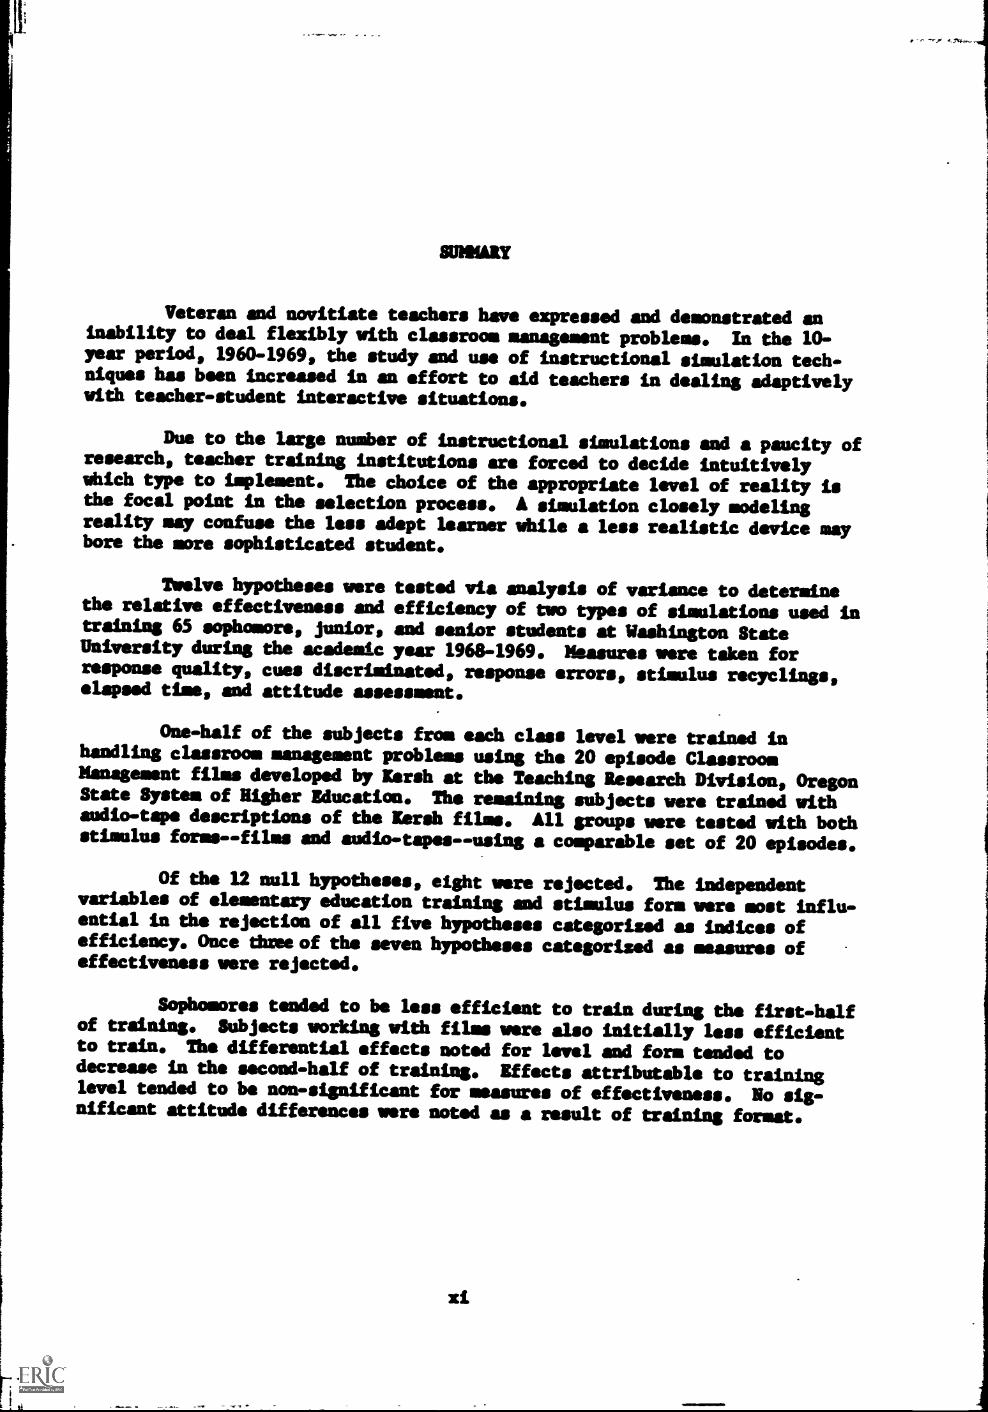
Veteran and novitiate teachers have expressed and demonstrated aninability to deal flexibly with classroom management problems. In the 10-year period, 1960-1969, the study and use of instructional simulation tech-niques has been increased in an effort to aid teachers in dealing adaptivelywith teacher-student interactive situations.
Due to the large number of instructional simulations and a paucity ofresearch, teacher training institutions are forced to decide intuitivelywhich type to implement. The choice of the appropriate level of reality isthe focal point in the selection process. A simulation closely modelingreality may confuse the less adept learner while a less realistic device maybore the more sophisticated student.
Twelve hypotheses were tested via analysis of variance to determinethe relative effectiveness and efficiency of two types of simulations used intraining 65 sophomore, junior, and senior students at Washington StateUniversity during the academic year 1968-1969. Measures were taken forresponse quality, cues discriminated, response errors, stimulus recyclings,elapsed time, and attitude assessment.
One-half of the subjects from each class level were trained inhandling classroom management problems using the 20 episode ClassroomManagement films developed by Iersh at the Teaching Research Division, OregonState System of Higher Education. The remaining subjects were trained withaudio-tape descriptions of the Rauh films. All groups were tested with bothstimulus forms--films and audio-tapes--using a comparable set of 20 episodes.
Of the 12 null hypotheses, eight were rejected. The independentvariables of elementary education training and stimulus forswore most influ-ential in the rejection of all five hypotheses categorised as indices ofefficiency. Once three of the seven hypotheses categorized as measures ofeffectiveness were rejected.
Sophomores tended to be less efficient to train during the first-halfof training. Subjects working with films were also initially less efficientto train. The differential effects noted for level and form tended todecrease in the second-half of training. Effects attributable to traininglevel tended to be non-significant for measures of effectiveness. No sig-nificant attitude differences were noted as a result of training format.
xi

CHAPTER I
INTRODUCTION
Problems and Objectives
In recent years there has been a shift away from efforts which
prepare teachers mainly by instructor verbalization. Many attempts, notably
those at Stanford (Allen and Gross, 1965), the University of Tennessee
(Cruickshank and Broadbent, 1968), and Teaching Research in Oregon (Zersh,
1963), have been directed toward alloying the student trainee (St) to learn
and to practice teaching behaviors under the guidance of a structured
program. Each of these programs assumes that by learning to operate in a
simulated classroom environment, there will be some knowledge gained that
will provide the It with selected transfer skills thus aiding him to become
a successful teacher.
Those preparing the above simulated programs, and others like them,
built their packages on the belief that active rather than passive roles in
the educational process are more effective in student knowledge acquisition.
These programs have attempted to involve the El in the decision-making
process of teaching earlier than usual. Simulation programs which aid in the
instruction of handling classroom management problems (Cruickshank and
Broadbent, 1968; Iersh, 1963; Hellen, 1968) have been designed to remove the
at from a lecture setting (passive learning) to the laboratory (active
learning).
All these simulations are also based on the assumption that there are
specific and predictable ways to handle classroom management problems that
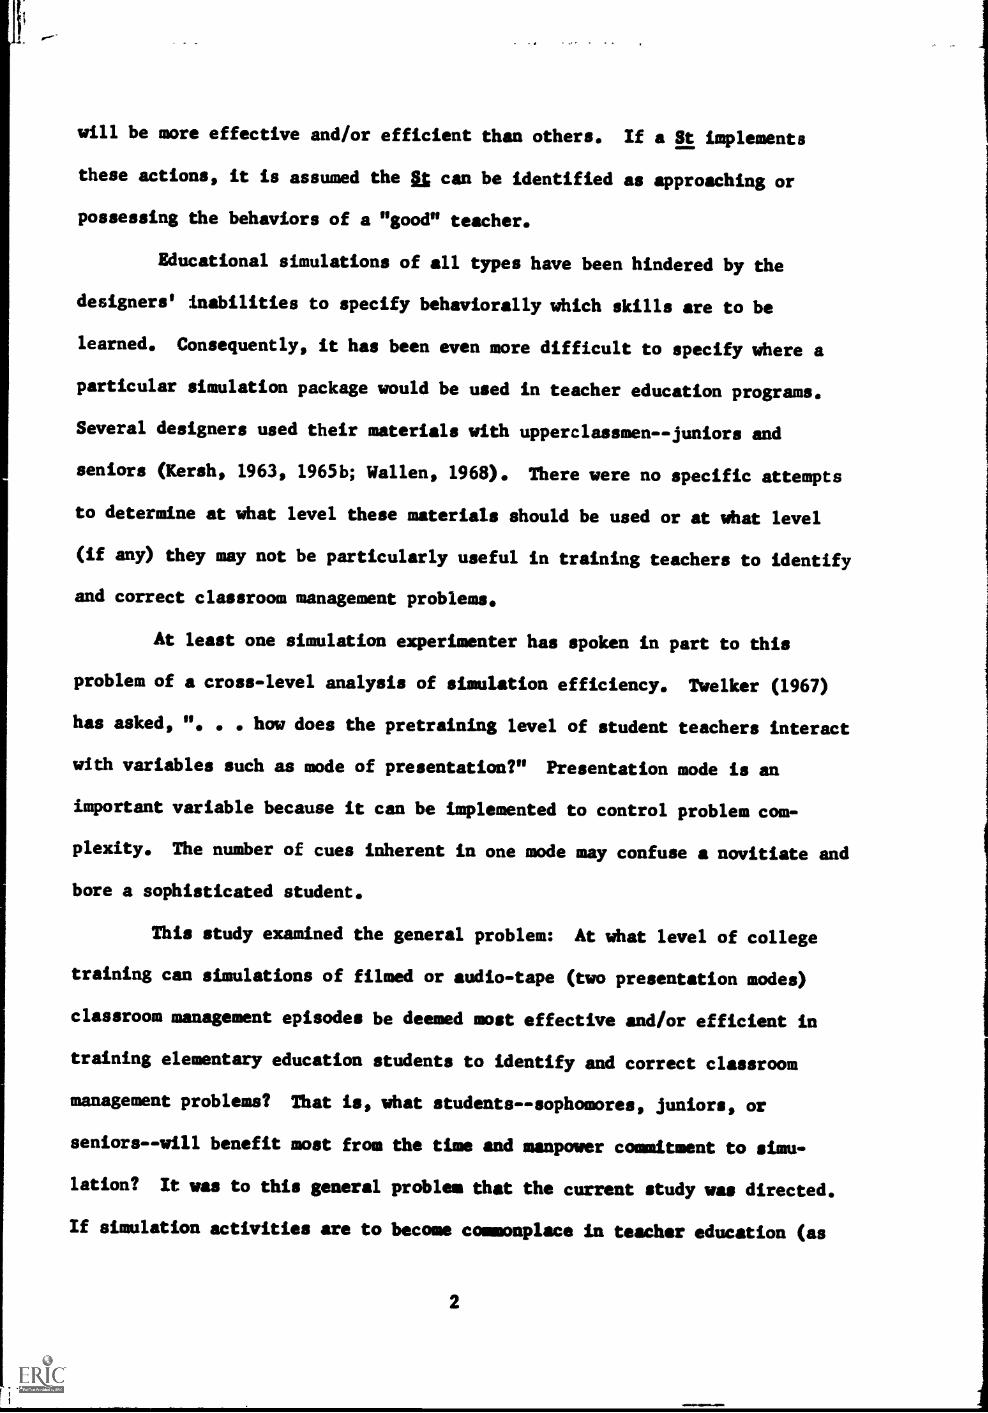
will be more effective and/or efficient than others. If a St implements
these actions, it is assumed the ft can be identified as approaching or
possessing the behaviors of a "good" teacher.
Educational simulations of all types have been hindered by the
designers' inabilities to specify behaviorally which skills are to be
learned. Consequently, it has been even more difficult to specify where a
particular simulation package would be used in teacher education programs.
Several designers used their materials with upperclassmen--juniors and
seniors (Kersh, 1963, 1965b; Wallen, 1968). There were no specific attempts
to determine at what level these materials should be used or at what level
(if any) they may not be particularly useful in training teachers to identify
and correct classroom management problems.
At least one simulation experimenter has spoken in part to this
problem of a cross-level analysis of simulation efficiency. Twelker (1967)
has asked, ". how does the pretraining level of student teachers interact
with variables such as mode of presentation?" Presentation mode is an
important variable because it can be implemented to control problem com-
plexity. The number of cues inherent in one mode may confuse a novitiate and
bore a sophisticated student.
This study examined the general problem: At what level of college
training can simulations of filmed or audio-tape (two presentation modes)
classroom management episodes be deemed most effective and/or efficient in
training elementary education students to identify and correct classroom
management problems? That is, what students--sophomores, juniors, or
seniors--will benefit most from the time and manpower commitment to simu-
lation? It was to this general problem that the current study was directed.
If simulation activities are to become commonplace in teacher education (as
2

there is good reason to believe), then the most efficacious utilization must
be determined empirically rather than intuitively.
Related Literature
Classroom Management
Effectiveness in handling student communication and management situ-
ations has long been suspected as being a major problem of classroom
teachers. Researchers have generally found these suspicions to be correct
(Wey, 1951; Swineford, 1962; D'Amico, 1960). For the beginning teacher this
difficulty is not unexpected. Veteran teachers also concur with this trend
to an overwhelming degree. Kaplan found that Oregon elementary teachers
attributed 84 per cent of their sources of "distress" to the behavior of
children (1952, p. 664).
The National Education Association Research Division (National
Education Association Journal, 1964) polled a national sample of public
school teachers vho had taught five or more years and asked: ". . . do you
believe that maintaining pupil discipline has become more difficult than when
you first started teaching?" Generally, these veteran teachers were about
equally divided in their opinions, with 45 per cent stating it was more
difficult, 20 per cent responding that it was less difficult, and 34 per cent
saying that maintaining pupil discipline was about the same as when they
began teaching. When the results were analyzed in terms of years of
experience, an interesting trend was revealed. For those who had taught
5 to 9 years, 10 to 19 years, and 20 or more years, they stated that
maintaining pupil discipline was more difficult by the percentages of 25,
44, and 62, respectively. Those who stated that it was less difficult
responded at 31, 21, and 12 per cent levels for the corresponding years of
3
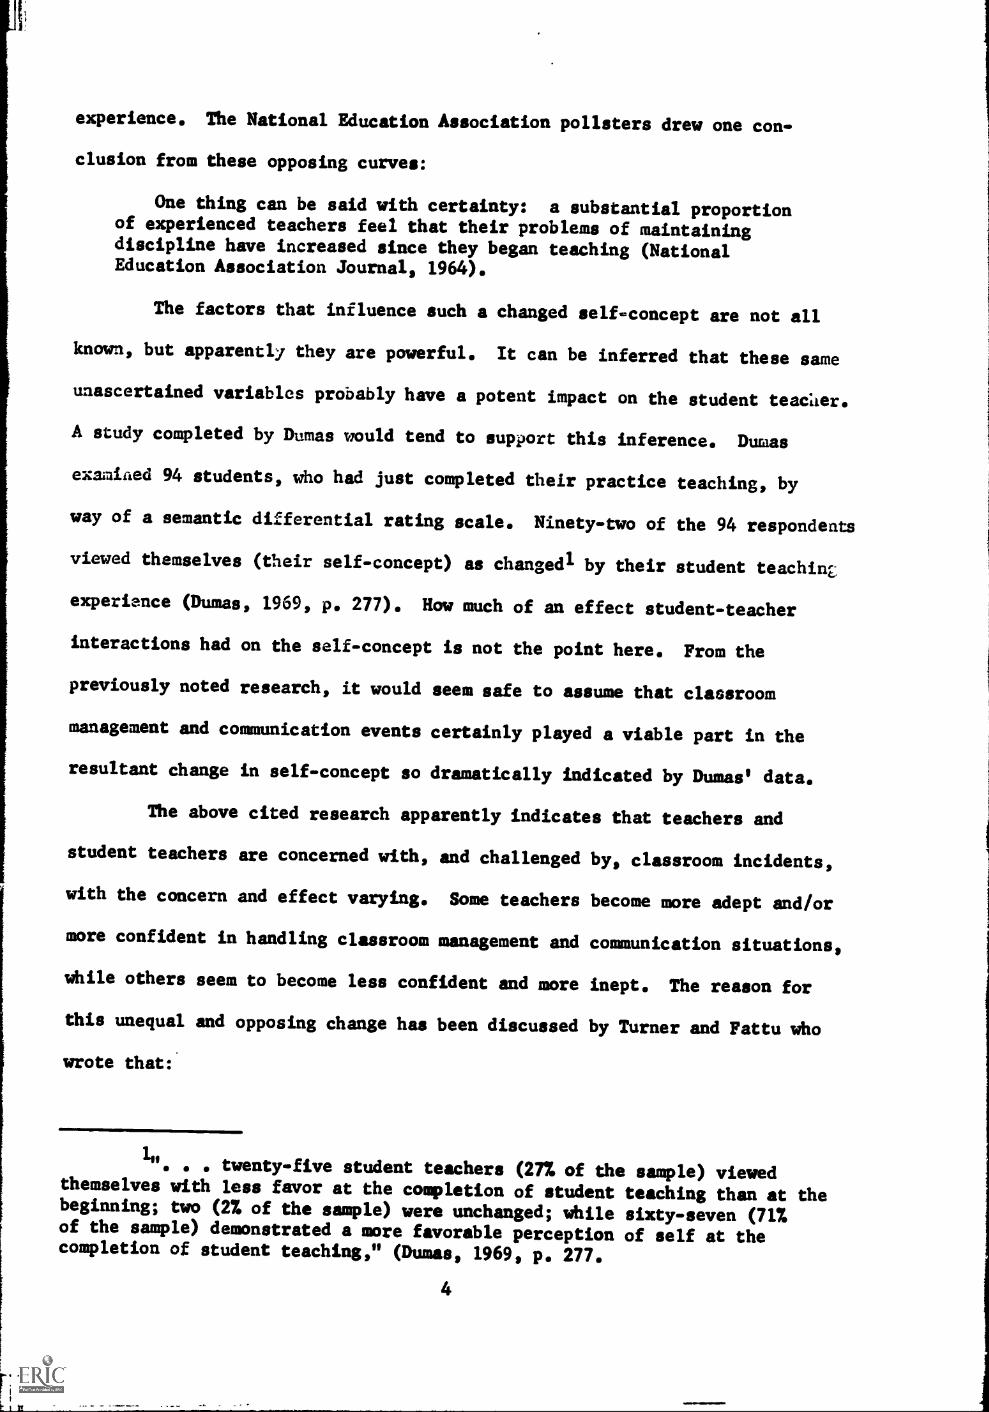
experience. The National Education Association pollsters drew one con-
clusion from these opposing curves:
One thing can be said with certainty: a substantial proportionof experienced teachers feel that their problems of maintainingdiscipline have increased since they began teaching (NationalEducation Association Journal, 1964).
The factors that influence such a changed self-concept are not all
known, but apparently they are powerful. It can be inferred that these same
unascertained variables probably have a potent impact on the student teacher.
A study completed by Dumas mould tend to support this inference. Dumas
examiaed 94 students, who had just completed their practice teaching, by
way of a semantic differential rating scale. Ninety-two of the 94 respondents
viewed themselves (their self-concept) as changed' by their student teaching,
experience (Dumas, 1969, p. 277). How much of an effect student-teacher
interactions had on the self-concept is not the point here. From the
previously noted research, it would seem safe to assume that classroom
management and communication events certainly played a viable part in the
resultant change in self-concept so dramatically indicated by Dumas' data.
The above cited research apparently indicates that teachers and
student teachers are concerned with, and challenged by, classroom incidents,
with the concern and effect varying. Some teachers become more adept and/or
more confident in handling classroom management and communication situations,
while others seem to become less confident and more inept. The reason for
this unequal and opposing change has been discussed by Turner and Fattu who
wrote that:.
1,,twenty-five student teachers (27% of the sample) viewed
themselves with less favor at the completion of student teaching than at thebeginning; two (2% of the sample) were unchanged; while sixty-seven (71%of the sample) demonstrated a more favorable perception of self at thecompletion of student teaching," (Dumas, 1969, p. 277.
4

Teacher behavior is problem-solving behavior of a par-ticular kind To determine why (some) teachers might solve awider scope of problems than other segments of the teaching popu-lation, it is necessary to return to the assumption that teacherbehavior consists largely, but by no means entirely, of instru-mental responding Instrumental responding may be viewed aslearned responses This notion . . . suggests the hypothesisthat the teachers who are the best solvers of teaching problemsare those who have acquired the greatest number of instrumentalresponses and who can best transfer those responses to "new" orvariant situations (1960, pp. 16-17).2
Another set of phrases which would describe the quality to which
Turner and Fattu refer to above would be "flexibility in responding" or "lack
of rigidity in interaction." Whether Turner and Fattu's contention is
correct is impossible to verify, though their argument is logically
attractive.
Empirical evidence does tend to bear out the concept of interactive
rigidity by teachers. Zahorik (1968) tabulated the feedback3 behavior of
15 elementary teachers and found that of 175 feedback behaviors used, only
16 were used with regularity. The conclusion drawn by Zahorik was:
The results concerning general feedback usage suggests thatteacher-verbal feedback during the interactive classroom situ-ation is a rather rigid behavior. Only a few types of feedbackare used with regularity (1968, p. 149).
A study performed by Chabassol (1968) attempted to identify pre-
dictive elements of rigidity in terms of student teacher success. Using a
semantic differential rating scale to measure rigidity of thinking, Chabassol
found that three of the five measures prcdicted the success of 131 female
elementary student teachers to the .01 level. If, as the previous study
would tend to indicate, flexibility can positively effect student teaching
20riginally quoted in Lynch, 1961, p. 7.
3Feedback: --". those oral remarks which reflect on the adequacyor correctness of the pupil's solicited or initiated statements," (Zahorik,1968, p. 147).
5
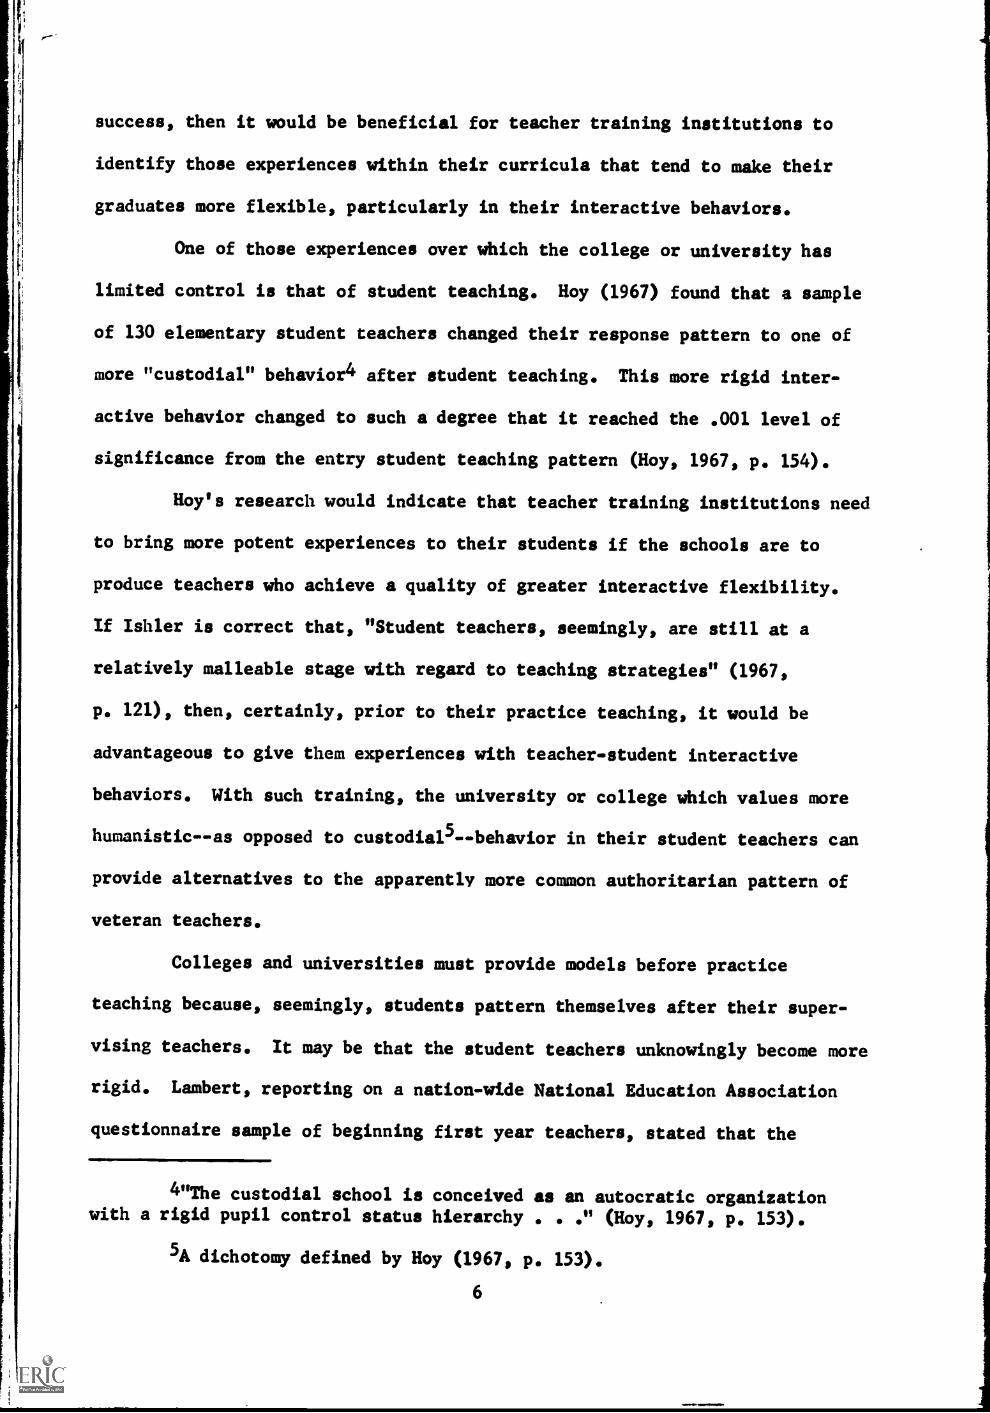
success, then it would be beneficial for teacher training institutions to
identify those experiences within their curricula that tend to make their
graduates more flexible, particularly in their interactive behaviors.
One of those experiences over which the college or university has
limited control is that of student teaching. Hoy (1967) found that a sample
of 130 elementary student teachers changed their response pattern to one of
more "custodial" behavior4 after student teaching. This more rigid inter-
active behavior changed to such a degree that it reached the .001 level of
significance from the entry student teaching pattern (Hoy, 1967, p. 154).
Hoy's research would indicate that teacher training institutions need
to bring more potent experiences to their students if the schools are to
produce teachers who achieve a quality of greater interactive flexibility.
If Ishler is correct that, "Student teachers, seemingly, are still at a
relatively malleable stage with regard to teaching strategies" (1967,
p. 121), then, certainly, prior to their practice teaching, it would be
advantageous to give them experiences with teacher-student interactive
behaviors. With such training, the university or college which values more
humanistic--as opposed to custodial5-- behavior in their student teachers can
provide alternatives to the apparently more common authoritarian pattern of
veteran teachers.
Colleges and universities must provide models before practice
teaching because, seemingly, students pattern themselves after their super-
vising teachers. It may be that the student teachers unknowingly become more
rigid. Lambert, reporting on a nation-wide National Education Association
questionnaire sample of beginning first year teachers, stated that the
4 "The custodial school is conceived as an autocratic organizationwith a rigid pupil control status hierarchy . . ." (Hoy, 1967, p. 153).
5A dichotomy defined by Hoy (1967, p. 153).
6

respondents generally believed that their training institutions needed to
'provide more alternatives in handling discipline problems (1956, p. 349).
This conclusion tends to support Turner and Fattu's belief that the effec-
tiveness of problem-solving behavior of teaching is due to flexibility or
alternatives of strategy.
It is Lynch's contention that the desired effects can be brought
about by "proper" training when he states that:
The nature of teaching experience is such that, with proper pre-
service training, understandings derived from such training will
not only be applicable, but continued experience will at least not
interfere with scientifically based understandings acquired intraining, and, at best, will be reinforced and refined with experience.Most optimistically, it is hoped that, if the originally learnedconcepts of behavior are valid, experience will reinforce and refine
their essential validity (1961, p. 9).
With all the wide range of techniques available, choosing the
"proper" training to provide the needed alternatives in classroom management
and communication behaviors which institutions value is not a simple task.
This study has attempted to examine selected factors which are components of
one technique--laboratory simulations. The purpose of the study was not to
identify which behaviors are most valuable but rather how the chosen set of
behaviors might best and most feasibly be communicated--the decision which
institutions are now forced to make from an intuitive rather than empirical
framework.
Simulation
Simulation is a relatively new technique in teacher education.
Definitions are as multifarious as are the types of simulations. Garvey
(1967, p. 6) offered one of the most encompassing definitions; ". an
artificial situation which reproduces in essential details either a model of
an actual situation or a model which depicts a hypothetical situation."
7

Another is provided by Massialas and Cox: "A simulation model would attempt
to reduce a complex phenomenon to one that is manageable" (1966, p. 318).
Both of these definitions of simulation contain the common component of
modeling reality. Due to the lack of specificity, another definition is
offered to distinguish between such models as a classroom sociodrama, the
enactment of a simulated ICBM flight, or the model of a cell.
Abt (1966) delineated simulations as (1) models, (2) exercises, and
(3) instructional simulations. Models are those simulations that portray in
an inactive manner the characteristics of a concept such as a traffic pattern
model,
Exercises, the second type, are activities designed to allow the
student to interact with someone or a machine, e.g., army maneuvers.
The third type, instructional simulations, are the representations of
real events where the student participant is engaged in learning a behavior
to be measured against some standard. Instructional simulations are designed
to teach knowledge or a skill. Examples of this type are Link Trailers and
the Classroom Simulation Materials developed by Teaching Research (Kersh,
1963).
Instructional simulations, wrote Twelker, perform three functions:
"(1) present information; (2) elicit responses or provide a situation for
practice; and (3) assess performance" (1968, p. 3). The above tasks are
comparable to those of programmed instruction. Beaird and Standish made the
distinction that, "programmed instruction is typically concerned with
'learning what to do' whereas (instructional) simulation training . is
characterized by 'learning by doing,'" (1964, p. 11). The accomplishment of
the three tasks by "doing" have historically found widespread use in various
areas.
8
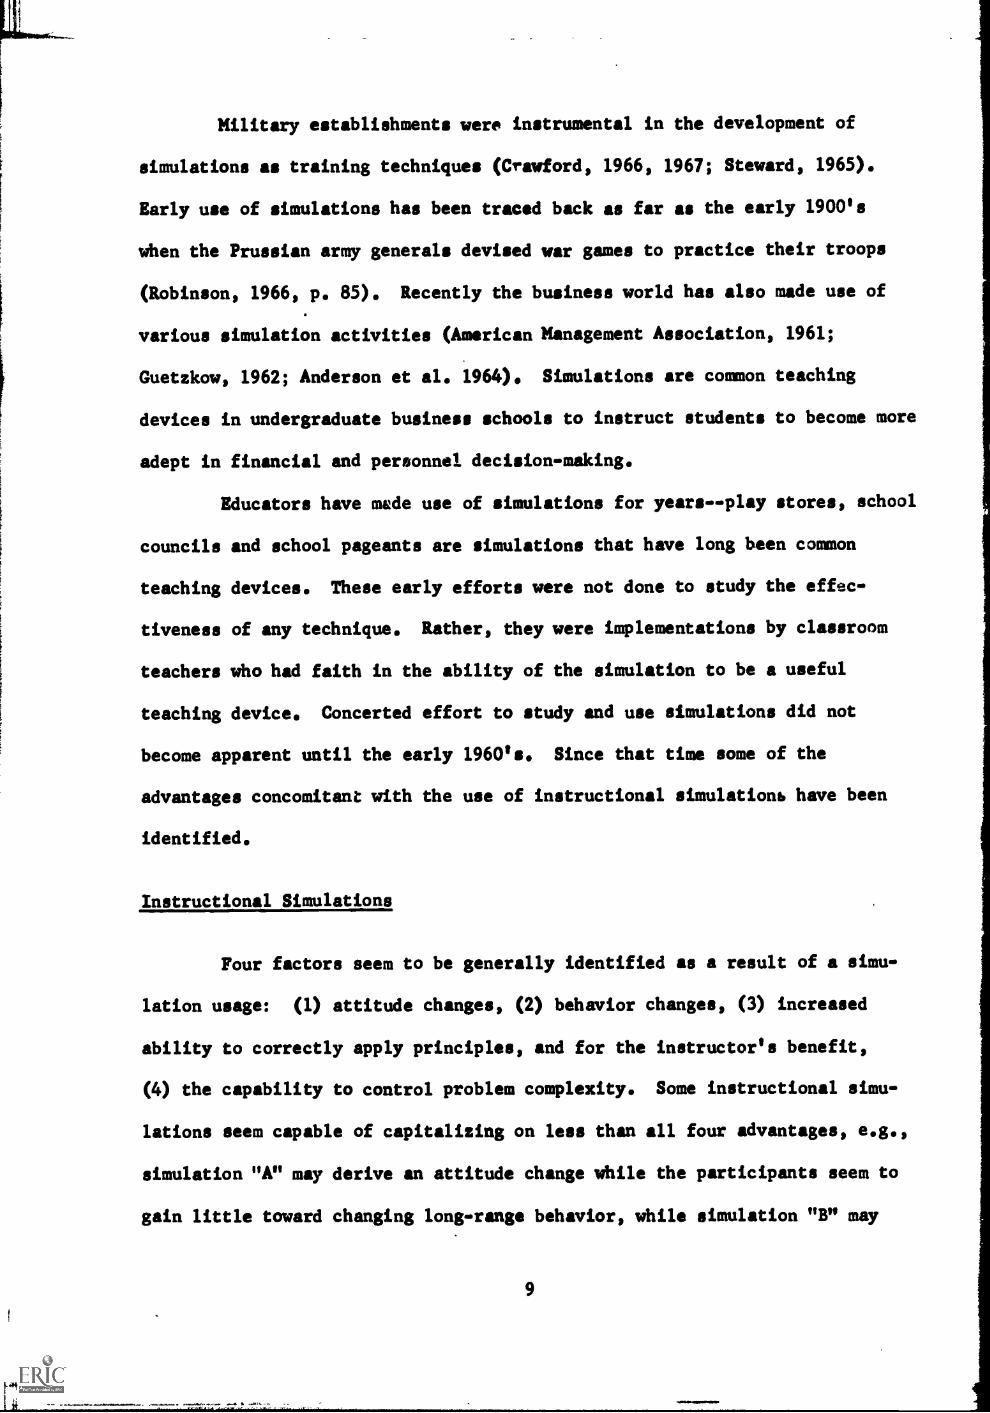
Military establishments were instrumental in the development of
simulations as training techniques (Crawford, 1966, 1967; Steward, 1965).
Early use of simulations has been traced back as far as the early 1900's
when the Prussian army generals devised war games to practice their troops
(Robinson, 1966, p. 85). Recently the business world has also made use of
various simulation activities (American Management Association, 1961;
Guetzkow, 1962; Anderson et al. 1964). Simulations are common teaching
devices in undergraduate business schools to instruct students to become more
adept in financial and personnel decision-making.
Educators have made use of simulations for years--play stores, school
councils and school pageants are simulations that have long been common
teaching devices. These early efforts were not done to study the effec-
tiveness of any technique. Rather, they were implementations by classroom
teachers who had faith in the ability of the simulation to be a useful
teaching device. Concerted effort to study and use simulations did not
become apparent until the early 1960's. Since that time some of the
advantages concomitant with the use of instructional simulationb have been
identified.
Instructional Simulations
Four factors seem to be generally identified as a result of a simu-
lation usage: (1) attitude changes, (2) behavior changes, (3) increased
ability to correctly apply principles, and for the instructor's benefit,
(4) the capability to control problem complexity. Some instructional simu-
lations seem capable of capitalizing on less than all four advantages, e.g.,
simulation "A" may derive an attitude change while the participants seem to
gain little toward changing long-range behavior, while simulation "B" may
9
accrue an opposing result. Each of the above four advantages posited has
some supporting research.
The most supportive writer of the contention that simulations derive
an attitude ,change is Cherryholmes (1966). In an examination of the compiled
results of six studies on simulation, Cherryholmes found that "Students
participating in a simulation will reveal more interest in a simulation
than in more conventional classroom activities," (1966, pp. 5-6). One of the
six studies involved an exposure to a simulation dealing with an international
relations game where the principal investigator, Cherryholmes, inferred that
the student participants experienced an attitude change denoted as moving
toward that of a "realist" (1965, p. 230)t Other writers have noted positive
attitude shifts as a result of simulation training (Cruickshank, 1966; Vlcek,
1965; Bond, 1965).
Weinberger (1965), using a follow-up questionnaire, found that school
administrators felt that their behavior on the job was modified as a result of
simulation training dealing with administrative difficulties. Other
researchers finding a behavior modification include Kersh's examination of
student teacher responsibility patterns (1965b), and Vlcek's study which
indicated that supervising teachers perceived that student teachers trained
in a program using simulation exhibited more self-confidence than did those
students without simulation training (1965).
Several investigators indicated that an increased, ability to ,apply
principles, was an outcome of a simulation experience. Ryan found that an
experimental group using simulations was significantly more capable (sig-
nificant to the .001 level) in learning to apply principles from educational
psychology than was the control group (1968, p. 250). In a study that used
films which simulated a teacher's administration of a reading inventory,
Utsey et al. (1966), found that the materials provided a significant factor
10

in developing the skill of college level juniors and seniors in identifying
reading levels of children.
One negative finding was reported by Robinson (1966) in an exami-
nation of a case-study simulation versus a lecture technique in teaching
principles of political science. Robinson concluded that, "No direct and
unmediated relation exists between simulation and fact mastery or learning of
principles," (1966, p. 116). Another author, Ramey faults the case-study
method as being unrealistic.
The basic shortcoming of the case method is the fact that it is
static. It fails at the point of major importance--the need for thegroup to understand that problem solution must occur in a four-
dimensional setting, not a two-dimensional one, as cases often imply,
(1968, p. 525).
Whether Ramey's analysis of the case-study method may be useful in
identifying the factor of realism as limiting Robinson's simulation is
debatable. The point is that many researchers have concluded as Twelker did
chat, H. . . simulation training provided a powerful vehicle for teaching
principles . . ." (Twelker, 1966a, p. 60). The capability to teach prin-
ciples is posited as a potential of simulation, though, as was pointed out
earlier, may be a concomitant result when coupled with some other variable.6
The fourth advantage, control of problem complexity, has been used
most advantageously by the medical profession in training students. Entwisle
and Entwisle believe their ability to simplify problems for less sophis-
ticated students was a major factor in the success of their computer simu-
lation of a patient requiring diagnosis (1963, p. 810) ". simulations
are useful in education because the real world in all its complexity
6It was also noted earlier that if some advantage does not occur in asimulation others do seem to occur. Robinson, who stated that the experi-mental group learned no more principles, did find that participation "wasoverwhelmingly greater" even when the students disliked the simulationexperience, (Robinson, 1966, p. 111).
11

does not lend itself well to the preliminary instruction of beginning
students" (Entwisle and Huggins, 1967, p. 379).
The four advantages which appear to be generalized outcomes from the
use of simulation techniques have also been noted for those packages devel-
oped for teacher training curricula. Simulations with specific goals of
training students in handling classroom management and communication problems
have been studied with increasing detail in the 1960-1969 decade.
Classroom Management Packages
Twelker (1968) stated that lectures provide opportunities for the
student to listen while others talk about teaching. Classroom experience,
however, helps prepare the student to teach. Simulations can be used to
allow the trainee to combine practice teaching and self-evaluation of his own
teaching efforts. Coleman (1967) pointed out that the immediacy of the
evaluative process tends to focus the student's attention on the learning
experience. The facility to focus the learner's attention on self-evaluation
of his simulated teaching allows simulation to play an intermediate step in
the training process.
As an intermediate step, simulation has several advantages peculiar
to it alone. It allows the student to learn to discriminate problem cues
and, as Twelker states, to "practice decision making without the risk of
censure or embarrassment" (1967, p. 201). Because a feedback mechanism is
present in some form, the student can learn the consequence of his actions
and if need be try out an alternative strategy. Twelker described succinctly
the advantage of instructional simulations as "focusing" devices for pre-
service students:
Through systematic practice in a simulated classroom, a studentlearns how to fill the decision-making role of the teacher in theclassroom by participating in a comparable role in a simulated situation.
12

In brief, instructional simulation forces the student to focus on a
situation and devise different modes of responding. Simulation
offers the student an opportunity:
1. to build and to practice his own strategies of searching for
cues that signal a decision-making process on his part;
2. to test hypotheses he has about how to respond to these
problems; and
3. to change his behavior in view of the feedback he receives,
(1969, p. 9).
Winters (in Of Men and Machines, 1967) also pointed out that the
relationship of theory and theory implementation can be more easily estab-
lished through simulations. Situations relevant to a theory can be por-
trayed immediately. In the lecture setting or in classroom teaching
experiences, the situation usually restricts the description or choice of
appropriate examples for theory implementation. Denemark and Holland believe
such techniques will allow teacher education students to "systematize
practice around a theoretical framework" (1967, p. 242).
Studies into teacher training simulations tend to verify the above
conclusions. Vicek (1965) found that a greater number of alternative
classroom management behaviors were employed by students whose training was
supplemented by simulation. Cruickshank and Broadbent (1968) found that a
filmed simulation experience had a positive influence upon student teaching
behavior. Students who had participated in simulation training were observed
by the experimenters to have fever management problems and they were per-
ceived by themselves and their supervising teachers as having fewer man-
agement problems.
A study conducted by Hershey, Shepard and &unbolts stated that their
undergraduate student participant. had a positive attitude toward a simulated
teaching experience because they perceived the training as giving help in
"attaining more specific skills" (1965, p. 235). Students' attitudes were
13
more positive when simulation was included as part of an educational psychol-
ogy course, reported Bond (1965).7 Vice& also found a greater degree of
self-confidence expressed by an experimental group during their student
teaching experience (1965).
In reference to a behavior differential due to a simulation
experience dealing with classroom management, two investigators have con-
curred in the conclusion that a positive change accrued. Bergh (1965b)
questioned supervising teachers and found that the practice teachers from
the experimental group were ready to assume full responsibility up to three
weeks earlier than their non-experimental counterparts. Hersh was also able
to duplicate Vlcek's finding concerning the utilization of the principles
taught:
findings from both Vlcek's study8 and the present piloteffort indicate that there is transfer of learning from the simu-lated to the actual classroom. Vlcek's observational data indicatethat in the simulated classroom "students" learn principles ofteaching which they employ in practice teaching soon after com-pletion of their simulated experience (1965b, p. 15).
What specific attributes of a simulation function to provide these
benefits appear difficult to define. Several writers have conjectured that
poasibly the closer approach to realism may be the feature that provides the
beneficiality associated with a simulation (Twelker, 1968; Berth, 1963;
Cruickshank, 1966). Though little research is available concerning the
comparative effectiveness of types of simulation, Iersh (1963) tested realism
factors such as screen size, filmed feedbacks and color. Only a negligible
influence on training effectiveness was attributed to any of these variables.
7The latter study would seem to enhance Winters' argument that thebenefit of simulation lies in the effectiveness it has in the immediateportrayal of a situation demanding theoretical implementation.
6V1cek, 1965.
14

Certainly, the literature is replete with studies comparing the results of
differing media instructional settings that show no difference in gain scores
(Campeau, 1967). Yet the question of fidelity remains paramount in program
design for simulations. If a simulation of a complex event is very realistic
the learner may become confused and be unable to distinguish relevant from
irrelevant cues. Conversely, an over-simplification of reality by a simu-
lation may bore the more sophisticated learner. Twelker (1968) pointed out
that the awareness of prerequisite knowledge and experiences must be an
integral part of the design and implementation of simulated training devices.
Twelker also stated, "It is conceivable that its lack of realism causes the
learner to disregard the instructional experience ." (1968, p. 17).
Because, as was pointed out earlier, it is possible to control
problem complexity (a realism factor) it becomes crucial for institutions
training teachers to identify what level of complexity of simulation can be
used most beneficially for the various sophistication and experiential levels
of their students. The interaction effects of training level and simulation
type (complexity) will be examined in this study.
Related Literature Concerning This Study's Design
The training levels for the study were identified by class standing--
sophomore, junior, and senior. If it is assumed that seniors should be more
proficient in dealing with children than sophomores and juniors, and juniors
more sophisticated than sophomores, then this becomes an important dependent
variable. Miller (1967) and Xersh (1965c) found differential effects on
entry-exist gain scores. Students who were below the median on pretest
scores gained more from a simulation experience on posttest measures than did
those who scored above the median. Whether this was a regression effect or
one where the initially more capable students had less to learn is unclear.
15
If it is a result of limited student knowledge which can be rectified by five
to six hours of training9 then institutions may find it to their advantage
(and that Of their students) to know whether level of training (sophis-
tication) or regression effects the differential gain in simulation training.
Beneficiality of any training program is always tempered by cost
factors. Current classroom management packages on the market, such as those
developed by Teaching Research, are films or combinations of media. Complete
packages are somewhat expensive (more than $1,500 would be a necessary
expenditure to implement the Teaching Research Classroom Management materials).
If the faculty of an institution wanted to experiment with the various kinds
of materials now available, whether in comparative studies, utility studies,
or in conjunction with a developmental program of their own, cost in terms of
materials and man-hours may become exorbitant. A less costly approach may
make implementation and/or experimentation feasible.
To examine the variable of simulation form, a costly type to
implement was chosen--films--and a less expensive type vas chosen--audio-
tapes. If the lack of realism inherent in audio-tapes can be shown to be of
a negligible influence then the use of such a medium would not be detrimental
to the education of students of a teacher training institution. The second
dependent variable, then, chosen for manipulation was stimulus form--films
and audio-tapes.
Comparative studies in media research have been soundly criticized
(Lumsdaine, 1963; Campeau, 1967). Lumsdaine, one of the sharpest critics,
listed five criteria that he believes a comparative study should meet for it
to be implemented (1963, pp. 598-599). The criteria and the attributes of
this study which meet those conditions follow.
9The average number of hours spent in training in both the Miller and*arab studies.
16
A large differential in cost and limited differential in effec-
tiveness.--If an audio-tape method can be shown to be nearly as effective in
training students then an enhanced feasibility to additional package devel-
opment and experimentation can be established.
Methods compared are defined analytically.--In the procedures section
analytical definitions of both methods have been provided.
Lack of generality.--Because only two simulation media types are
being compared, it is impossible to generalize to a continuum of reality.
Knowledge of differences or similarities in these two types should be of
value to teacher-training institutions by indicating whether additional
research might be fruitful.
Appropriateness of method of study.--Due to the vast number of
measures pcssible and the possibility for uncontrolled interaction in a
simulation setting, it was deemed necessary to control carefully the stimulus
form and feedback form. The experimental design chosen allows for this
control.
Duplication of research effort.--A search of the literature provided
no indications that previous research had examined the question of the effec-
tiveness and efficiency of differing simulation training for varying levels
of education training. No research was found that indicated that training
level had been examined in any way except in a related field (Entwisle and
Entwisle, 1963) and then only to describe, without supporting data, the con-
clusion that sophistication level does influence the learner's behavior in
the simulation training.
Because the design of this project meets all of the above criteria
enumerated by Lumsdaine, the question of the efficacy of such a comparative
study is assumed to be resolved.
17

I
The independent variables can be categorized as measures of effec-
tiveness and of efficiency of training. To ensure a valid measure of
efficiency, the training mode was selected on the basis of work done by
Twelker (1966e). The training mode which was identified by Twelker's study
as most efficient was adapted for use in this experiment.
Three measures were taken as indices of efficiency--(1) time spent in
training and testing, (2) recycling of stimuli, and (3) the number of
training prompts necessary. An index of effectiveness was determined by
another set of three measures--(1) attitude of subjects toward simulation
training, (2) the sum of cues identified, and (3) the sum of first response
scores. The latter two scores were taken for training and testing measures.
All the measures for effectiveness and efficiency were categorized in
a similar fashion by Twelker, (1968, pp. 30 and 38). The interaction of
these variables with stimulus form and levels of training were designed to
give some indication of the validity of 12 hypotheses which were tested in
this experiment. The hypotheses, operational definitions, and a more
specific discussion of the study design follow in the next chapter.
18

CHAPTER II
DESIGN OF THE STUDY
Hypotheses
This study examined 12 hypotheses. To ensure a comprehensive
analysis of each hypothesis, selected sub-hypotheses were incorporated in the
study design. Each hypothesis and any resultant sub-hypotheses are discussed
below. A statistical significance of .05 or less was the level selected for
rejection of a null hypothesis. The hypotheses follow stated in the null
form:
There will be no significant difference between sub-groups in:
1. The mean first response score for training
a. The mean first response score for the first-half of trainingb. The mean first response score for the second-half of trainingc. The mean first response score for the total trainingd. The mean gain first response score
2. The mean incorrect response score for training
a. The mean number of incorrect responses for the first-half oftraining
b. The mean number of incorrect responses for the second-half oftraining
c. The mean number of incorrect responses for the total trainingd. The mean reduction score for incorrect responses
3. The mean number of initial cues discriminated during training
a. The mean cues discriminated during the first-half of trainingb. The mean cues discriminated during the second-half of trainingc. The mean cues discriminated during the total trainingd. The mean gain for cues discriminated
19
- vq ry
4. The mean number of stimulus recyclings to achieve a type Atresponse
5. The mean number of experimenter (Z) prompts necessary to reachcriterion (a type A response)
a. The mean /prompts for the first-half of trainingb. The mean A prompts for the second-half of trainingc. The mean /prompts for the total trainingd. The mean reduction *core for E prompts
6. The mean number of A prompts necessary to achieve criterion forcue discrimination
a. The mean E prompts for the first-half of trainingb. The mean /prompts for the second-half of trainingc. The mean I prompts for the total trainingd. The mean reduction score for E prompts
7. The mean time for training and testing
a.
b.
c.
d.
e.
f.
The mean time for theThe mean time for theThe mean time for theThe mean reduction inThe mean time for theThe mean reduction in
first-half of trainingsecond-half of trainingtotal trainingtraining timetotal testingtraining time minus testing time
8. The mean response score for testing
a. The mean response score for oral stimulus episodesb. The mean response score for film stimulus episodesc. The mean response score minus the placebo episoded. The mean response score
9. The mean number of cues discriminated for testing
a. The mean cue discrimination score for oral stimulus episodesb. The mean cue discrimination score for film stimulus episodesc. The mean cue discrimination score minus the placebo episoded. The mean cue discrimination score
10. The mean first response change scores (training to testing)
a. The mean response change score for similar problem episodesb. The mean response change score for episodes with similar
standardsc. The mean response change score
'See Appendix F or item 11 in the following section, Definition ofTerms, for an explanation of a type A response.
20
11. The mean change score for cue discrimination (training totesting)
a.
b.
The mean change score forproblem episodesThe mean change score for
12. The mean attitude score
cue discrimination for similar
cue discrimination
Definition of Terms
1. Classroom management problems are those situations that occur withinthe course of a filmed or verbalized sequence that require a responseby the student trainee (11). The problems are divided into two
general types: (1) management problems (disorderly behavior, generaldiscipline) and (2) communication problems (confusion, inattention bya group or individuals). See Appendix F for an enumeration of theepisode types which constitute management and communication probletap.
2. Criterion level is, for a given episode, the at's: (1) response to asimulated classroom problem which matches Kersh's (1963) categori-zation of an adequate response or (2) the at's assessment of therelevant cues which matches the total list, prepared by Kersh (1963),of cues to be discriminated.
3. Cue discrimination is the act of assessing the relevant details in anepisode by the St such that the St makes known to the experimenter(E) that he has observed (heard and/or seen) the problem situation.
4. Feedback is the term used to identify the communication given by theE to the St of the most likely consequence of the is behavior.
5. Filmed stimulus situation is the presentation of the filmed classroommanagement prr,blem to the St by the E.
6. Initial cue discrimination is the act performed by the St of identi-fying problem cues before any E prompts are given.
7. Orientation is the process of providing the St with the necessaryknowledge of the simulation training and testing and of the simulatedstudents to facilitate the St's optimal responding to the trainingand testing situations. A two-step process is required: (1) slide-
tape and film presentation concerning the class and (2) a verbalpresentation by the Lprior to training.
8. Placebo episode is the first episode presented to the St during test-ing. The stimulus form of that episode is the same as that of the
St's training stimulus form.
9. Recycle is the training procedure whereby the E directs the St toview or hear the episode again for (1) cue discrimination or (2) anew response more likely to achieve a positive consequence.
21
10. Response is a verbal and/or physical enactment of the l's behaviorwith the intent to alleviate the perceived problem. A response canalso entail a decision to make no enactment but the At must state tothe E that this was a decision and not just an ad hoc omission.
11. !amponse types are the categorizations of at responses in terms ofthe two standards originally assigned each episode by Zersh (1963).If a it's response incorporated both standards it was classified asa type A response. Responses which iacorporated one standard but notthe other were categorized as type B or C. Type D responses were Stverbalizations which were directed toward the problem but exemplifiedneither standard. A Lt response which was directed to an irrelevantincident (not the problem identified by Earsh, 1963) was denoted as atype Lresponse. Appendik I portrays this procedure via a table.
12. II is the abbreviation for student trainee. The trainee played therole of a student teacher being supervised by the hypothetical "Mr.Land," who is featured in both stimulus forms. All subjects playedthis role.
13. Simulation is the act of constructing, operating, manipulating orrepresenting the model or techniques of a student teacher (rwelker,1968, p. 7). Garvey has provided a more general definition bystating that simulation is "4, the use of role-playing by theactors during the operation of a comparatively complex symbolicmodel of an actual or of a hypothetical social process" (1967,p. 11).
14. Standards are the "rules of procedure applicable to problems ofclassroom management and communication" (Farah, 1965c, p. 34). Thoseprinciples which the St is expected to model or exemplify in hisenacted response to a simulated classroom problem.
15. ARIL= is the post-training procedure to assess the St's ability todiscriminate cues and enact responses to stimulus situations. No Eprompting or Sc redyclinctill occur during this phase. One-half ofthe 20 testing episodes will be presented via fiLms and the otherhalf by audio-tape.
16. ;raining is the act of teaching, via films or audio-tape presentationsand E prompts, the St to reach a predetermined criterion level on twomeasures--(1) cue discrimination and (2) response enactment. Theseindividual sessions constituted work with 20 sequential episodes.
17. Verbal stimulus situation is the playing by the E to the St an audio-tape description of a classroom management problem. The descriptioncontained information concerning the problem scene and the relevantcues to be discriminated.
22
Assumptions,
The work for this study was based on the following assumptions:
1. That the above materials were capable of presenting classroommanagement and communication principles
2. That these principles, when learned by the Sts, were capable of beingtested by valid and reliable measures
3. That the Sts randomly selected to participate were representative ofthe three training levels at Washington State University, i.e.,sophomores, juniors, and seniors
4. That the ability to discriminate cues is a St behavior capable ofbeing improved and therefore transferable to the testing situation
5. That the principles of behavior (standards) learned from trainingwere learned implicitly and that they would transfer to the trainingsituation
6. That the episodes presented by audio-tape were comparable to thefilmed simulations in terms of their capability to elicit type Aresponses and a criterion level for cue discrimination
Limitations
The knowledge gained from this study will be limited by four
restrictions:
1. All the subjects were drawn from a sample of Washington StateUniversity' students who were enrolled as prospective elementaryschool teachers.
2. Though the subjects were randomly selected from a list of volunteers,the small N for each sub-group could have been influenced by one ortwo subjects who were either extremely adept or inept in dealing withsimulated classroom management and/or communication problems.
3. Only one experimenter (E) participated in training. This personhas been reliable when compared with other Es in past studies(Twelker, 1966a). No measures could be taken to ensure reliabilityon cue discrimination and categorization or responses in this studyfor training measures.
4. Only two types of instructional simulation were examined across alltraining levels--(1) audio-tape presentations to individual Sts and(2) filmed presentations to individual fits. Generalizations pertainto these stimulus forms only.
23

Stimulus Forms
Two types of stimulus forms--films and audio-tapes--were chosen for
comparison. The film form was a package of 40 classroom episodes developed
by B. Y.Xersh at the Teaching Research Division2 (Xersh, 1963). The
episodes ranged in length from approximately 15 seconds to two minutes.
These films were two sets of sound-color 16mm motion picture films with each
set containing 20 problem episodes. Each set of episodes constituted one
hypothetical school day. All episodes were serially ordered with each
episode following the previous one in a chronological pattern, thus forcing
the St to become aware of time-oriented instructional problems such as pupil
fatigue. For each of the episodes there were two or three feedback films
available in the Farah package, but no direct value had been found for the
Sts when only a filmed feedback was used (Kersh, 1965c, p. 41), so the
feedback materials were not used in this study. (A more complete description
of these materials is given in Tersh, 1963.)
Each set of 20 episodes was made up of two different problem types.
One-half of the film sequences were posed as problems in classroom management
for the St, with the remaining one-half being classed as communication
problems. (A more detailed description is shown in Appendix:7J
The second stimulus form was an audio-tape description of each of the
filmed episodes. (A more complete description of the production of the
2The Teaching Research Division is a part of the Oregon State Systemof Higher Education. Members of this organisation have performed researchfor various educational levels as well as private industry. TeachingResearch Division, as it will be referred to hereafter, has been best knownfor the research which emanates from its staff on the use of simulationtechniques in teacher preparation.
24

audio-tapes is found in the Procedures chapter of this report.) There were
two sets of tapes, each corresponding to one of the sets of 20 filmed
episodes.
The possible differences in the complexity of either set of episodes
for either stimulus form was controlled for within the experimental design.
In the conduct of the experiment, one of the two sets was used in training
one-half of each training level and the other set for testing. The other
one-half of each training level used the second set of films or audio-tapes
for training and the first set for testing.
Subjects
Three sets of subjects were randomly selected from a group of
volunteers. All volunteers were either sophomores, juniors or seniors
majoring in the elementary education program at Washington State University
during the spring semester of 1969. Only full time undergraduates 25 years
of age or younger who had never taught under contract or who had never
student taught were used.
Twenty-two subjects were needed for each training level set, i.e.,
22 sophomores, 22 juniors, and 22 seniors. Twenty-eight sophomores and
136 juniors volunteered to act as subjects. Because many seniors had student
taught or would student teach before the training was completed, only 25
female seniors and one male senior volunteered. To keep the sex differences
proportionate, only one male per training level could be used.
Due to scheduling conflicts and students who dropped out of school,
it was possible to train 21 seniors rather than the proposed 22. All Its
were randomly assigned to their respective stimulus forms and sets within
their training levels. The number of subjects for each training level for
25
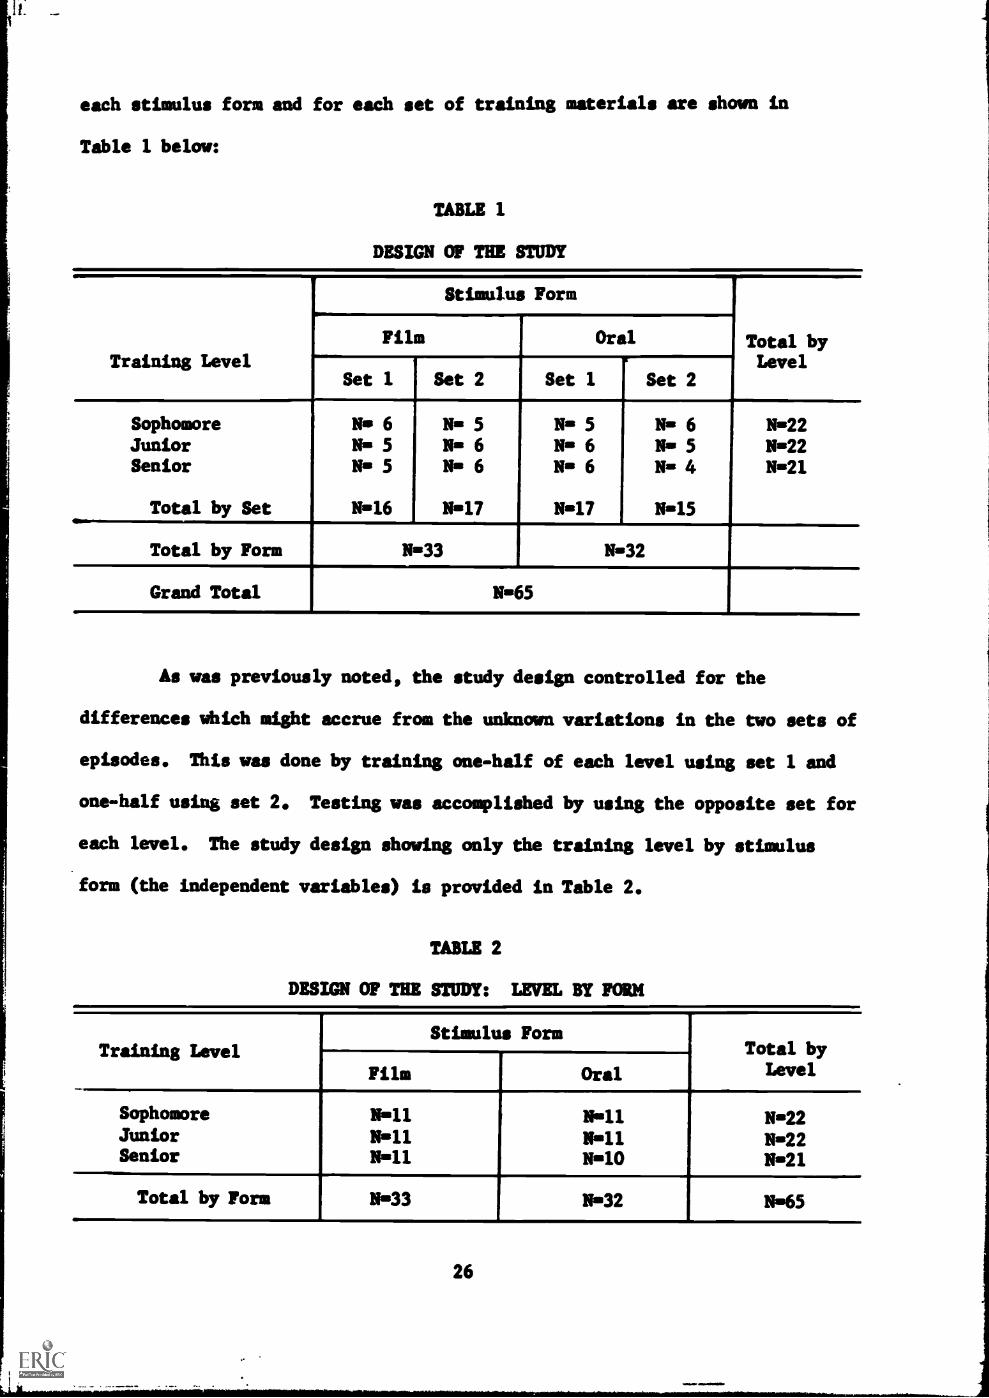
1
each stimulus form and for each set of training materials are shown in
Table 1 below:
TABLE 1
DESIGN OF THE STUDY
Training Level
Stimulus Form
Film Oral Total by
Set 1 Set 2 Set 1 Set 2Level
SophomoreJuniorSenior
Total by Set
Nom 6
N= 5No 5
No16
No 5No 6No 6
No17
No 5No 6No 6
No17
No 6N= 5No 4
No15
Y=22No22No21
Total by Form No33 No32
Grand Total No65
As was previously noted, the study design controlled for the
differences which might accrue from the unknown variations in the two sets of
episodes. This was done by training one-half of each level using set 1 and
one-half using set 2. Testing was accomplished by using the opposite set for
each level. The study design showing only the training level by stimulus
form (the independent variables) is provided in Table 2.
TABLE 2
DESIGN OF THE STUDY: LEVEL BY FORM
Training LevelStimulus Form
Total byLevelFilm Oral
Sophomore
JuniorSenior
NollNoll
No10
No22No22No21
Total by Form No33 N-32 N-65
26
The following chapter contains a complete description of the
preparation of materials for this study. Experimenter training, orientation
procedures, and the collection of the data are also described in Chapter III.
27
!r
CHAPTER III
PROCEDURES
Preparation of Materials
No local production was required for the films as they were purchased
from the Teaching Research Division. Though filmed feedbacks were available,
due to the cost involved and the data which indicated that negligible results
seem to accrue from their use, this portion of the simulation materials was
not implemented.
It had been originally proposed to have the E read a description of
each episode to the St. Five judges, from the Washington State University
Department of Education faculty, found it impossible to assess the scripts.
They believed that audio-tapes should be used to hold the audio stimulus form
constant rather than allow for disparity due to the vagaries of voice
inflection and intonation. A second factor which was incorporated from the
judges' suggestions was to tape the filmed children's voices whenever possible.
After the audio-tapes were made, the judges were asked to evaluate the pro-
duction quality in terms of four categories:
1. (More, Less) explanation of extraneous behaviors required
2. Conveyance of student(s) attitude
3. (More, Less) specific description of relevant student behaviorneeded, and
4. Miscellaneous
These recommendations were noted on a judging form (see Appendix C). The
judges' evaluations were iuzorporated into the production of the revised
28

audio-tapes. See Appendix C for a c-py of the transcriptions for both audio-
tape sets, i.e., training and testing sets. To facilitate the St's per-
ception of the episode setting, several seating charts were prepared to
better describe the classroom arrangement which was the focal point of the
simulation episodes (see Appendix C).
The materials necessary for the orientation of all Sts included a
slide-tape presentation, a description of the school and community, a film
presentation, and a seating chart of the most common arrangement for the
simulated classroom. All of those materials were made available by the
Teaching Research Division.
A Likert-type attitude scale was devised using a technique described
extensively by Edwards (1957). A complete description of the scale's con-
struction and a copy of the instrument are shown in Appendix B.
Experimenter Training
To establish a reliability estimate, an additional E was used during
the-testing phase. Approximately 10 hours of training were provided the
second E. Prior to any testing, both Es participated in four hours of
testing with two St s not involved in the experiment. An inter-rater cor-
relation for response categorization was .88 and cue discrimination
assessment was .85 using Pearson's product-moment formula (Wert et al. 1954,
p. 83).
Orientation Prior to Training
During the first hour of the individualized training, each St com-
pleted a two-phase orientation. In the first phase the Sts were given a
written description of the school and community, a seating chart of the simu-
lated classroom, (see Appendix E), and a slide-tape and film presentation to
29

acquaint them with the simulated students. During the film presentation, all
Sts were asked to role-play an introduction of themselves to the simulated
class. The Sts were then given an opportunity to discuss any of the
students with the E.
During the second phase of the orientation, the St was appraised of
his particular training program. The St was told how to state his responses,
how to state his assessment of the problem cues, and the role that the E
would play in presenting prompts and feedback.
Data Collection
Training Format
Following their orientation to the class and their training program,
the Sts were told to begin reading a short paragraph describing the episode
they were about to observe--visually or aurally. The E jotted down the time
the instruction began for the episode.
The episode description the amid usually contained information
such as the number of children with whom he would deal, the subject matter
being studied, the time of day, and where Mr. Land, the supervising teacher
simulated by the stimulus forms, was located. The St then observed his
respective stimulus situation (filmed or an oral description of the filmed
setting). At whatever time the St chose to respond, he began the enacted
response by speaking and/or initiating some physical response.
First responses (and all subsequent responses) were categorized and
recorded by the E according to the standards (see Definition of Terms)
assigned to that episode by Kersh (1963) during his developmental study. In
some instances it was difficult to ascertain the St's intent; in those cases
the E played the role of a student to force a more decisive response from the
St. Appendix F contains an example of such a dialogue and a scoring matrix.
30

After the first response was given, the E provided the St with a
verbalized feedback concerning the consequence of the St's response. This
feedback reflected consequences suitable to the standards for that episode.
A hypothetical dialogue is shown in Appendix F to exemplify that procedure.
The B was then asked what he saw or heard occuring in the episode
(cue discrimination). As the St explained what he observed, the E compared
his statement to the relevant cues listed in the simulation materials (Kersh,
1963). The E then recorded the number of cues that the St had stated. If
the number given by the St was not consistent with the criterion listed then
the E first asked "Did you notice anything else?" Should the ps still not
reach criterion, the episode was recycled. The St was questioned further
until all relevant cues were acknowledged. The number of recyclings and E
prompts were recorded.
If the first response was a type A, the St proceeded to the next
episode. If not, then the St was recycled back through the response training
segment until an A type response was given. Prompts by E were given to aid
the St in achieving an appropriate response. The prompts were stated in
terms of the behaviors identified by the standards for that episode, i.e.,
"Can you think of a response where you would deal sympathetically and
confidentially with Wendy?" At the end of the episode the time was again
noted by the A.
Fig. 9 is shown in Appendix F portraying the training format.
Training
Determination of the effectiveness and efficiency of the various
formats was accomplished by analyzing the training sheets (see Appendix D)
for the following data:
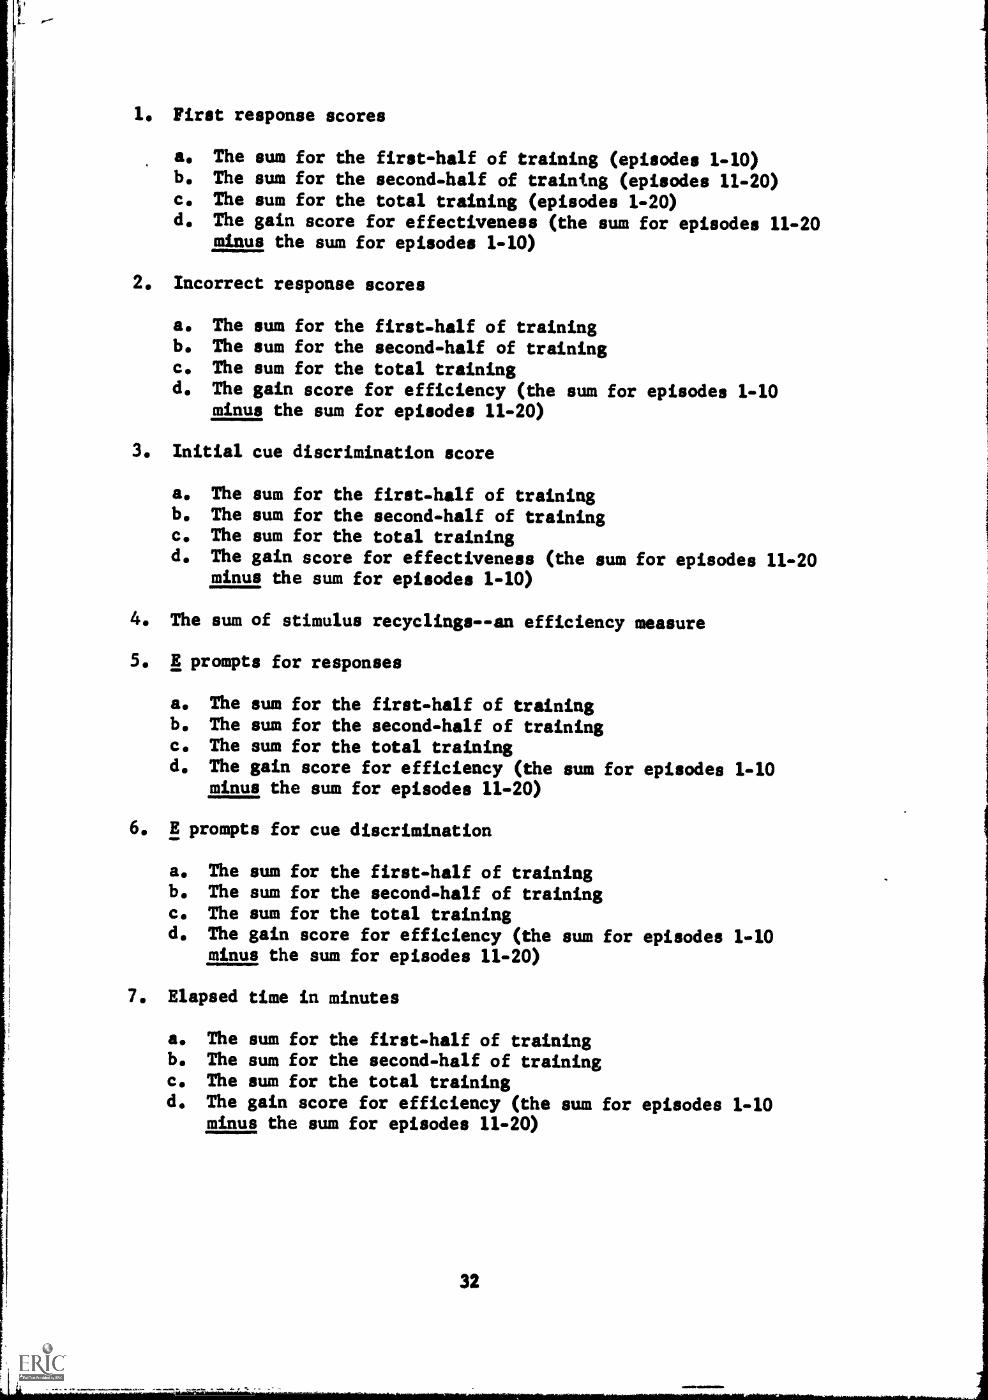
1. First response scores
a. The sum for the first-half of training (episodes 1-10)b. The sum for the second-half of training (episodes 11-20)c. The sum for the total training (episodes 1-20)d. The gain score for effectiveness (the sum for episodes 11-20
minus the sum for episodes 1-10)
2. Incorrect response scores
a. The sum for the first-half of trainingb. The sum for the second-half of trainingc. The sum for the total trainingd. The gain score for efficiency (the sum for episodes 1-10
minus the sum for episodes 11-20)
3. Initial cue discrimination score
a. The sum for the first-half of trainingb. The sum for the second-half of trainingc. The sum for the total trainingd. The gain score for effectiveness (the sum for episodes 11-20
minus the sum for episodes 1-10)
4. The sum of stimulus recyclings--an efficiency measure
5. E prompts for responses
a. The sum for the first-half of trainingb. The sum for the second-half of trainingc. The sum for the total trainingd. The gain score for efficiency (the sum for episodes 1-10
minus the sum for episodes 11-20)
6. E prompts for cue discrimination
a. The sum for the first-half of trainingb. The sum for the second-half of trainingc. The sum for the total trainingd. The gain score for efficiency (the sum for episodes 1-10
minus the sum for episodes 11-20)
7. Elapsed time in minutes
a. The sum for the first-half of trainingb. The sum for the second-half of trainingc. The sum for the total trainingd. The gain score for efficiency (the sum for episodes 1-10
minus the sum for episodes 11-20)
32

Attitude Assessment
To ensure that the Sts attitude toward the training was influenced
by a perception dependent only on a particular stimulus form, a Likert-type
attitude scale was administered immediately following the completion of
training. Because the training and testing situations were individualized
(each St worked in a one-to-one setting with the E) the opportunity for the
Sr to remain anonymous was lost. To achieve a relatively high degree of
validity, each St was assigned a number for his attitude scale. The Sts
were told that, because the training was also an experiment, an honest
statement of their attitude was imperative. When the Sts completed the
scale, they were told to place the scale in a ballot box rather than return
it to the E. The scale (see Appendix B) required approximately 20 minutes
to complete.
Testing
The testing procedure required approximately one hour. To control
for reliability, one of two Es was randomly assigned to an St within a given
cell (see Table 1).
The Sts were told that they would be tested over 20 episodes
and that approximately one-half would be filmed episodes and the other one-
half would be audio-taped episodes. They were told that they would be asked
to respond to each episode as they had in training and that they would then
be asked to assess the cues as they had previously done in training. It was
emphasized that the E would provide no feedback during the testing session.
Because one-half of the total group was trained using films and the
other one-half using audio-tapes, it was decided to begin the testing using
a stimulus form which was the same as the one with which the St had been
33
trained. This first episode became the placebo episode. All subsequent
episodes were randomly chosen for their stimulus form, i.e., episodes 2, 3,
5, 9, 13, 15, 18, 19, and 20 were presented by film to all Sts with all the
other episodes being presented by audio-tape.
As one of two sets of episodes were used for training, the set not
used previous4 with a given St was used for testing that St. Past research
had indicated that these two sets could be considered comparable (Twelker,
1966b; Kersh, 1963). To ensure greater control, though, Sts were randomly
assigned to a specific set for training. Analysis of variance was performed
to determine the validity of the assumption that the two sets were com-
parable. Because of the afore-mentioned research, set difference was not
considered as an independent variable in the study design (see Table 2).
Testing Measures,
Due to the varying stimulus forms, several testing measures were
collected. The first two measures, response score and cue discrimination
score, were considered indices of effectiveness. The testing measures and
their components are enumerated below:
1. Response score
a. The sum for oral stimulus episodesb. The sum for film stimulus episodesc. The sum for episodes 2-20 (total test minus the placebo
episode)d. The sum for the total testing
2. Cue discrimination score
a. The sum for oral stimulus episodesb. The sum for film stimulus episodesc. The sum for episodes 2-20 (total test minus the placebo
episode)d. The sum for total testing
3. Elapsed time in minutes--an efficiency measure
34

Change Scores
Two types of change scores (training to testing) were computed, first
response scores and initial cue discrimination. Both change scores plus
their components are listed below:
1. First response score (the sum of testing minus the sum of training)
a. Total difference for all episodesb. Difference for similar problem episodes'c. Difference for episodes with similar standards2
2. Cue discrimination
a. Total difference for all episodesb. Difference for similar problem episodes
All of the measures identified in this chapter were examined by
either a two or three-way analysis of variance. The results of these
analyses follow in the next section.
'Those episodes classified as management or communication problems.
2Spisodes in one set whose standards matched those of episodes in thesecond set.
35
CHAPTER IV
RESULTS
Analyses Used
The data collected for this study were examined through analysis of
variance. A two-way analysis was applied to 38 measures using Lindquist's
treatment by levels design (1956, pp. 121-141). Twenty other measures were
treated by way of a three-dimensional analysis of variance design described
by Lindquist (1956, pp. 220-230).
Each of the hypotheses and resultant sub-hypotheses are discussed in
the same order as they appear in Chapter II. Following the discussion of the
hypotheses is a reporting of the data collected to analyze any effects
attributable to the experimenter or set differences.
Analyses of Hypotheses
First Response Score for Training
As the St watched and/or heard each of the 20 training episodes for
the first time, his/her resultant response to that situation was categorized
before Amy.; prompts were given. (See Appendix F for a description of the
categorization procedure.) The values assigned to each response category
ranged from three, for those responses that matched the criterion, to zero,
for those times when an chose to make no response. This system made it
possible to compare the mean first response scores of the various treatment
36

groups. The mean first response score, considered a measure of effec-
tiveness, is discussed for each of the following four sub-hypotheses.
First-half of training.- -Mean first response scores were tabulated
for the first 10 of the 20 total episodes. Table 3, below, shows the results
of the analysis of variance. Apparently neither of the independent variables,
stimulus form (audio-tape and film) or elementary education level (sophomore,
junior, and senior), nor the interaction of level by form had any significant
effect on the mean first response score.
TABLE 3
ANALYSIS OF VARIANCE SUMMARY FOR FIRSTRESPONSEFIRST-HALF OF TRAINING
Sources df MS F
Level 2 4.879 0.493Form 1 1.208 0.122Level X Form 2 7.300 0.737Within 59 9.902
Total 64
*p. c.05
aThe first two sources listed refer to the level ofelementary education training (sophomore, junior, andsenior) and the training stimulus form (audio-tape andfilm). The source denoted as level X form is the inter-action of the two independent variables which serve toprovide the six cells shown in Table 2.
Second-half of training.--A near response score for the last 10 of
the 20 episodes was computed. What small amount of variation existed between
levels in the first-half of training (episodes 1-10) became even less pro-
nounced in the second-half (episodes 11-20). Table 4, below, shows a
decreased F-ratio for levels from that presented above in Table 3, indicating
less variation occurred.
37
1
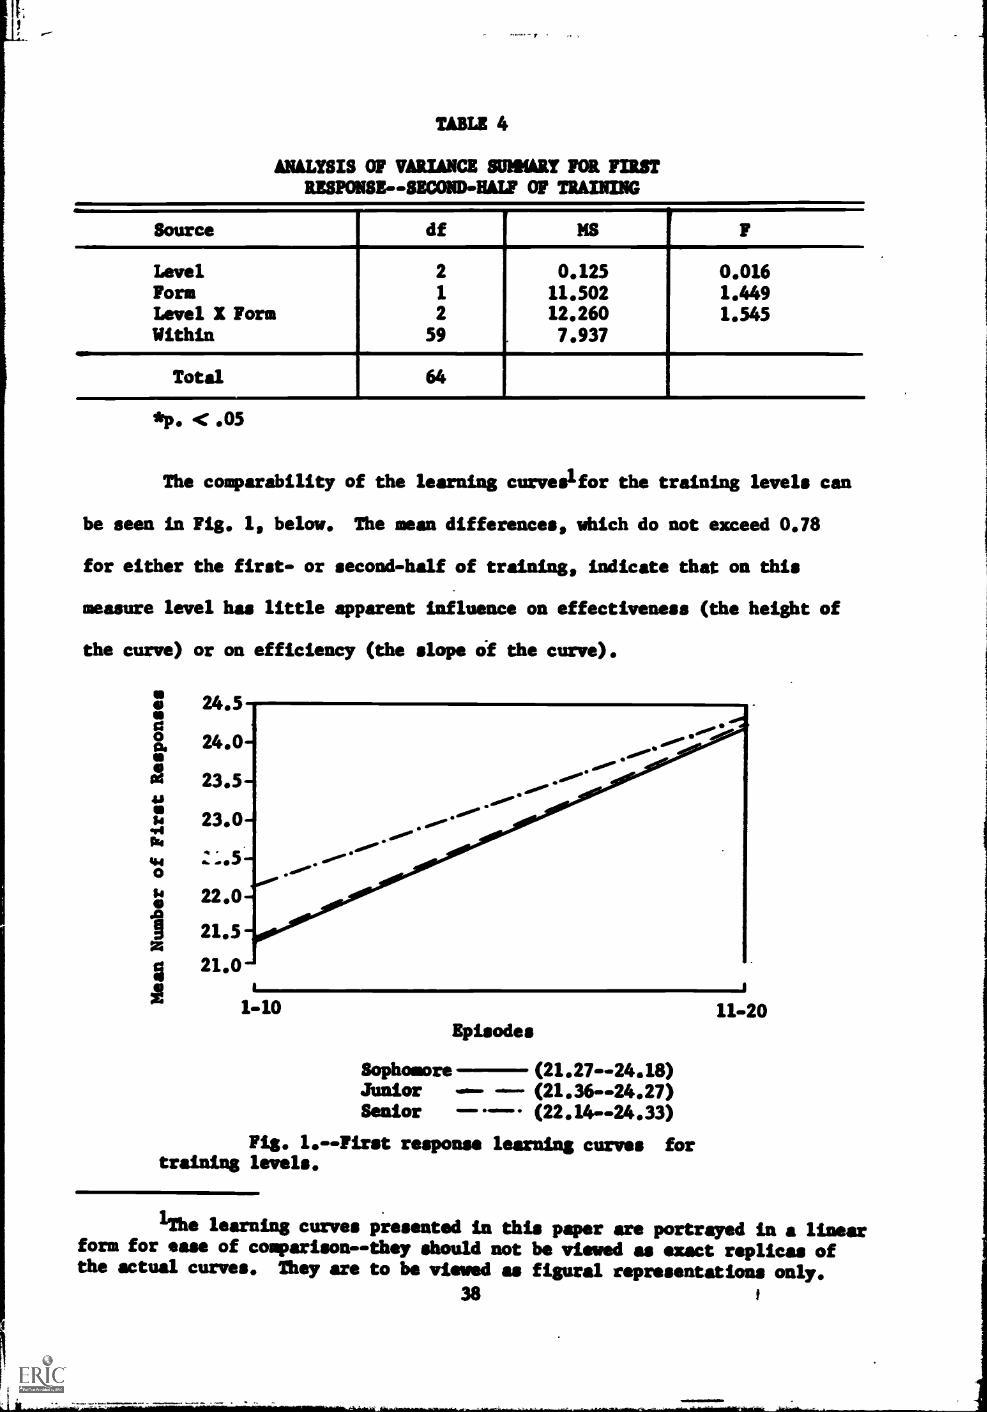
TABLE 4
ANALYSIS OF VARIANCE MLR! FOR FIRSTRESPONSE -- SECOND -HALF OF TRAINING
Source df MS F
Level 2 0.125 0.016Form 1 11.502 1.449Level X: Form 2 12.260 1.545Within 59 . 7.937
Total 64
*p < .05
The comparability of the learning curveslfor the training levels can
be seen in Fig. 1, below. The mean differences, which do not exceed 0.78
for either the first- or second-half of training, indicate that on this
measure level has little apparent influence on effectiveness (the height of
the curve) or on efficiency (the slope of the curve).
O 24.5a0. 24.0
23.5
23.0a.
O
22.0.0
21.5z
821.0
A.
1 -10
Episodes
Sophomore (21.27-- 24.18)Junior --- --- (21.36-24.27)Senior .." (22.14-24.33)
Fig. 1.--First response learning curves fortraining levels.
11-20
1The learning curves presented in this paper are portrayed in a linearform for ease of comparison--they should not be viewed as exact replicas ofthe actual curves. They are to be viewed as figural representations only.
38

The differences in F-ratios in Tables 3 and 4 indicate that some
variation in mean response scores between the first- and second-half of
training may have occurred as a result of stimulus form. Fig. 2, below,
indicates that the students trained via audio-tapes tended to exhibit a
lower first-half mean score but increased their rate of learning when
compared to the group trained by films. The absolute difference in the total
mean first-response scores for the two stimulus form groups is so small
(0.84) that, though this finding is interesting, it can not be considered
statistically significant with the low F-ratios exhibited.
25.5
25.0-
24.5-
24.0-
23.5-
23.0-
22.5-
22.0-
21.5
21.0-
1 1
1-10 11-20Episodes
FilmTape
(21.73-23.85)(21.44-- 24.69)
Fig. 2.- -First response learning curves forstimulus forms.
Total training.- -In view of the preceding data it was anticipated
that the variations in mean first response scores would be non-significant.
A three-way analysis of variance was used to examine level, form, and set as
39

main effects plus their interactions. Set was incorporated into the design
to examine the contention previously stated that the differences in the two
sets of episodes would be negligible. Apparently, none of the main effects
nor their interactions were influential in deriving significant differences
in mean first-response scores for the total training. Table 5, below, shows
the summary for the total training analysis of variance.
TABLE 5
ANALYSIS OF VARIANCE SUMMARY FORFIRST RESPONSE--TOTAL TRAINING
Source df MS F
Level 2 6.339 0.272
Form 1 5.255 0.225
Set 1 5.371 0.230
Level X Form 2 5.409 0.232
Level X Set 2 2.221 0.095
Form X Set 1 5.264 0.226
Level X Form X Set 2 11.990 0.514
Within 53 23.333
Total 64
. < .05
Gain score.--No significant differences were noted when the mean gain
scores for the groups were compared. The gain score was acquired by sub-
tracting the summed score of first responses for episodes 1-10 from those for
episodes 11-20. The p. value associated with the F-ratio for levels was
0.829, indicating that the year, or level in education training, had a very
limited influence on the amount of gain that students made in the second-half
of training. Form and the interaction of level by form had p. values of
0.158 and 0.129, respectively, indicating more influentialoat non-significant,
effects. The results of the two-way analysis of variance for the mean first-
response gain score is shown in Table 6.
40

TABLE 6
ANALYSIS OF VARIANCE SUMMARY FORFIRST RESPONSE--GAIN SCORE
Source df MS F
Level 2 2.775 0.189Form 1 30.065 2.043Level X Form 2 31.173 2.119Within 59 14.714
Total 64
*p. < .05
Number of Incorrect Responses Given During Training
Because this study was also directed at the efficiency of training as
a result of stimulus form and level of elementary education training, the
number of incorrect responses (those not matching the criterion) given before
a correct response was achieved were summed. It was assumed that the least
number of responses (errors) given would indicate which training method could
be judged more efficient. Four sub-hypotheses were examined as a set of
indices concerned with the efficiency of training.
If the St's first response to the stimulus did not meet the estab-
lished criterion, the St was asked to continue giving responses (aided by E
promptS and feedbacks) until a suitable response had been achieved. A sum of
the incorrect responses which the St made was computed for episodes 1-10,
11-20, and a total for episodes 1-20. A gain score was derived by subtracting
the sum for episodes 11-20 from the sum for episodes 1-10. Those analyses
are discussed below.
Incorrect responses for the first-half of training.--A two-way
analysis of variance indicated a significant difference due to the effect of
level of elementary education training (p. <005). Form and the interaction
41

effect of level by form were non-significant with p. values of 0.474 and
0.095, respectively. The summary for this sub-hypothesis is shown in
Table 7.
TABLE 7
ANALYSIS OF VARIANCE SUMMARY FOR INCORRECT RESPONSES--FIRST-HALF OF TRAINING
Source df MS F
Level 2 34.692 5.784*Form 1 3.121 0.520
Level X Form 2 14.712 2.453
Within 59 5.998
Total 64
*p. < .05
To analyze the individual level mean differences, a significant t
value was computed using Lindquist's formula for the "critical difference"
(1953, p. 146). The results of that comparison are summarized below and are
shown in Table 8.
TABLE 8
MEAN DIFFERENCES FOR INCORRECT RESPONSES FOR TRAININGLEVEL FOR THE FIRST-HALF OF TRAINING
Level Sophomores I Juniors I Seniors Mean Rank
Sophomores 2.09* 1.83* 1
Juniors -0.26 3
Seniors 2
*A t value of 1.51 was the required mean differenceto be significant to the .05 level.
The data in Table 8 indicate that the sophomores gave significantly
more incorrect responses during episodes 1-10 than the other two levels.
Juniors gave fewer incorrect responses than seniors though the difference was
statistically non-significant.
42

Incorrect responses for the second-half of training.--The signifi-
cantly greater number of incorrect responses made by sophomores in the first-
half of training was not found in the second-half of training. Form and the
interaction of level by form were, once again, non-significant. Table 9
provides a summary of the analysis of variance for this measure.
TABLE 9
ANALYSIS OF VARIANCE SUMMARY FOR INCORRECTRESPONSES--SECOND-HALF OF TRAINING
.
Source,
df MS F. .
Level 2 6.872 1.501
Form 1 3.802 0.830Level X Form 2 5.128 1.120
Within 59 4.579
Total 64
*p. < .05
The comparability of films and audio-tapes (the F-ratio for form had
a p. value of 0.366) in eliciting incorrect responses during training is
shown graphically in Fig. 3, below. The reduction in the mean number of
incorrect responses is almost a constant ratio. The absolute mean
differences of 0.42 responses for the first-half of training and 0.30 for the
second-half of training are very slight.
The reduction curve which exhibits the steepest slope in Fig. 4,
below, is that portraying the incorrect responses for sophomores. An
absolute reduction of 4.50 incorrect responses was achieved by the sophomores,
though this difference is somewhat tempered by the fact that their mean score
for the first-half of training was significantly higher than that of either
the juniors or seniors. The most interesting feature of Fig. 4 is that all
43
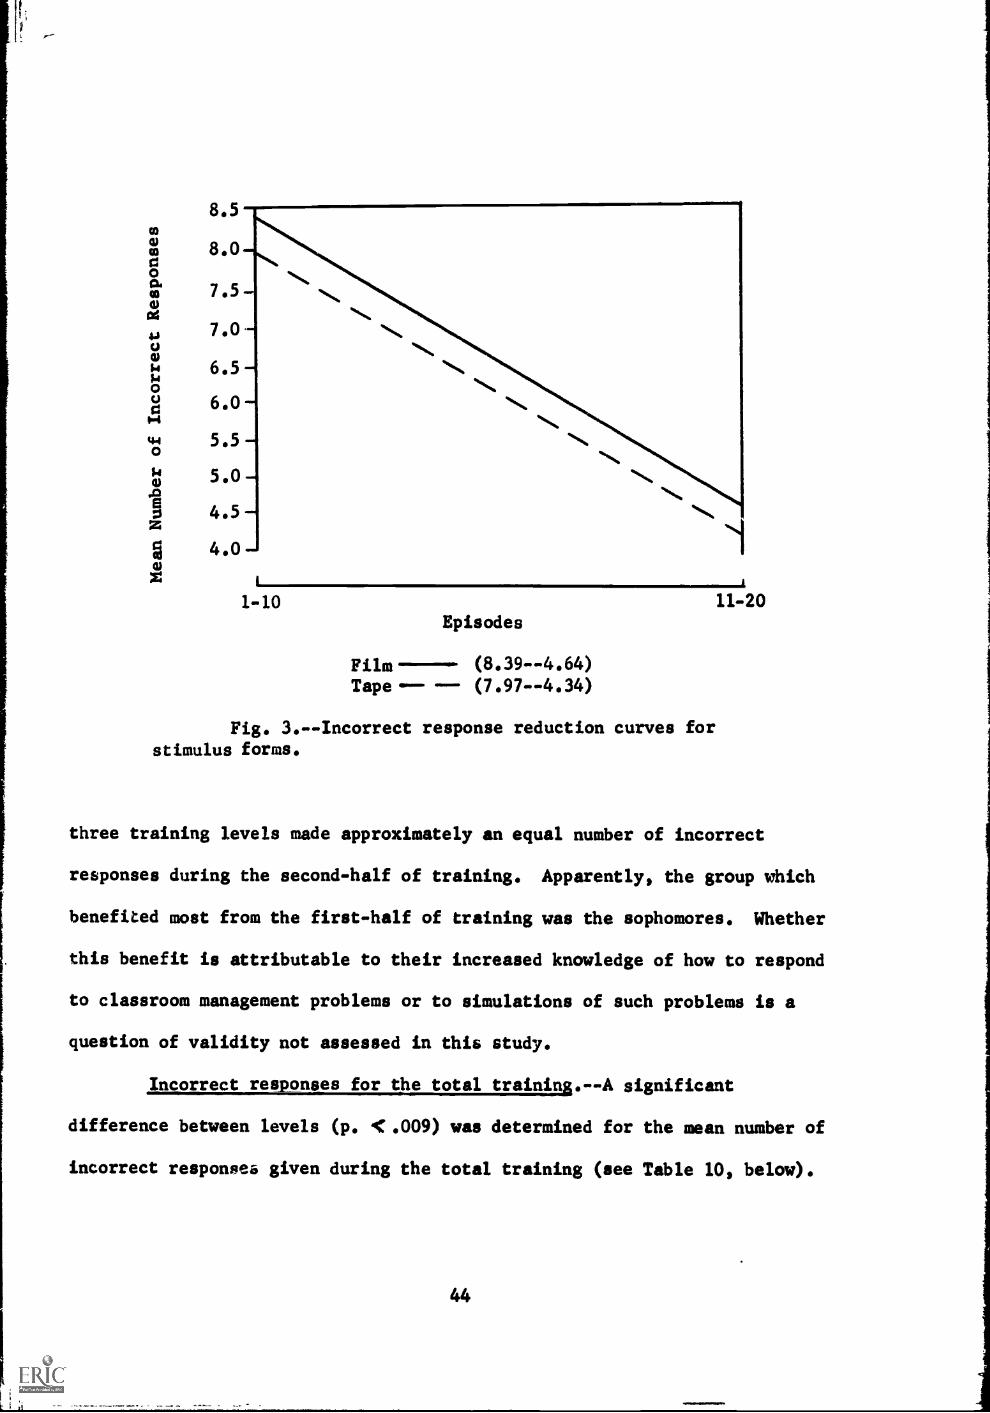
8.5
8.0-
7.5
7.0-
6.5
6.0
5.5
5.0
4.5
4.0
4
1-10 11-20Episodes
Film (8.39- -4.64)
Tape-- (7.97 - -4.34)
Fig. 3.--Incorrect response reduction curves for
stimulus forms.
three training levels made approximately an equal number of incorrect
responses during the second-half of training. Apparently, the group which
benefited most from the first-half of training was the sophomores. Whether
this benefit is attributable to their increased knowledge of how to respond
to classroom management problems or to simulations of such problems is a
question of validity not assessed in this study.
Incorrect responses for the total training.- -A significant
difference between levels (p. 1:.009) was determined for the mean number of
incorrect responses given during the total training (see Table 10, below).
44
Impleall

a 9.75
a0a.
9.00
8.25as
41 7.50
6.75
6.00
0 5.25
.0 4.50
3.75
3.00
1-10
" .14.'1.,,,.
Episodes
Sophomore (9.59--5.09)
Junior (7.18--3.95)
Senior (7.76--4.29)
11-20
Fig. 4.--Incorrect response reduction curves for
training levels.
The p. value for the F-ratios for form and for form by level were non-
significant (p. < 0.326 and 0.528, respectively).
TABLE 10
ANALYSIS OF VARIANCE SUMMARY FOR INCORRECTRESPONSES--TOTAL TRAINING
Source df MS F
Level 2 72.375 5.141*
Form 1 13.812 . 0.981
Level X Form 2 11.143 0.792
Within 59 14.077
Total 64
*p. < .05
45

The differences between the mean scores for the individual levels
are summarised below in Table 11. This analysis confirms the trend
indicating that sophomores made more incorrect responses than did the
upperclassmen (juniors and seniors) while the difference between the means
for the juniors and seniors was quite small.
TABLE 11
MEAN DIFFERENCES FOR INCORRECT RESPONSES FORLEVEL FOR TOTAL TRAINING
Level Sophomores I Juniors I Seniors Mean Rank
SophomoresJuniorsSeniors
3.50* 2.59*-0.91 3
2
*2.32 was the required mean difference significantto the .05 level.
Incorrect response reduction score.--Both main effects were non-
significant for the mean gain score for incorrect responses. As is indicated
in Table 12, below, the interaction effect of form by level was significant
(p. < 0.032).
TABLE 12
ANALYSIS OF VARIANCE SUMMARY FOR INCORRECTRESPONSES--kEDUCTLON SCORE
Source df MS F
Level 2 9.230 1.253
Form 1 0.186 0.025
Level I Form 2 26.917 3.655*
Within 59 7.365,
.
Total 64
*p. < .05
46

I;
A comparison of the mean differences between individual cells for
incorrect response reduction scores is shown in Table 13.
TABLE 13
MAN DIFFERENCES Fat INCORRECT RESPONSES FORINTERACTION-AEDUC17,021 SCORES
LevelForm
So.- 1Film
So.-Tape
Jr. -
FilmJr.- I Sr.-
Tape FilmSr. -
TapeMeanRank
So .-FilmSo.-TapeJr.-FilmJr. -Tape
Sr.-FilmSr.-Tape
1.45 1.54 2.36* 3.00* 0.28
0.09 0.91 1.55 -1.17
0.83 1.46 -1.260.64 -2.08
-2.72**
1
3
45
6
2
*2.32 was the required meansignificant to the .05 level.
**2.42 was the required meansignificant to the .05 level.
difference, for a cell size of 11,
difference, for a cell size of 10,
It appears from the above data that significant mean differences are
attributable to a greater decrease in incorrect responses made by the
sophomores trained by films and the seniors trained by audio-tapes. This
confusing trend may be explained somewhat by examining the first-half mean
scores and the mean reduction scores for the six groups. This comparison is
shown in Table 14.
TABLE 14
MEAN INCORRECT RESPONSE SCORESRANI= FOIL FMK BY LEVEL
Level IForm
Mean First-HalfIncorrect
Response Score
Mean First -HalfIncorrect Response
Score Rank
MeanReduction
Score
MeanReductionScore Rank
So.-Film 10.64 1 5.37 1
So.-Tape 8.55 2 3.73 3
Jr.-Film 7.36 4 2.63 5
Jr.-Tape 7.00 6 2.82 4
Sr.-Film 7.18 5 2.18 6
Sr. -Tape 8.40 3 f 4.90 2
47

The sophomore-film group made the most errors originally.
Consequently, their score may have been the easiest to reduce. Those groups
with the second- and third-highest mean scores fur the first-half of training
decreased their scores the third- and second-most, respectively. The bottom
three groups in the number of incorrect responses made in the first-half of
training were still ranked in the bottom half for reduction scores.
Apparently, the significant interaction effect for this measure is a :asu'it
of a high mean for incorrect responses for the first-half of training. The
sophomore -film group, ranked one for the first-half of training, had a sig-
nificantly different reduction score when compared with junior-tape and
senior-film, ranked five and six, respectively, for the first-half of train-
ing. The senior-tape, ranked three in the first-half of training, was sig-
nificantly different from the mean reduction score for senior-film, ranked
five for the first-half of training.
Initial Cues Discriminated During Training
After the St had given his first response to the stimulus situation,
the Z provided a:verbalised feedback describing the consequence of that
response. The St was then asked to recall what he had heard and/or seen in
that episode. As the St related that information, the I compared the St's
description to a list prepared for that (and every other) episode by Zeroth
(1963). The number of items which the St related, before any j prompting,
which matched those identified by Zersh, became the cue discrimination score.
The mean number of cues discriminated for the first-half, the second-
half, and the total training as well as a gain score were calculated. The
results of the analyses of these measures follows.
48

First-half of training.--A maim analyale of variance revealed no
significant difference for the main effects (p. for level <0.719 and for
form p.< 0.573). The interaction of form by le7e1 was also non-significant
< 0.838). Apparently, the mean scores for cue discriptrAt were
influenced non-significantly by either stimulus form or class level for the
first-half of training. A summation of the analysis for this measure is
shown in Table 15.
TABLE 15
ANALYSIS OF VARIANCE SUMMARY FOR CUE DISCRIMINATIONFOR TRAININGMa-HALF
Source df MS F
Level 2 3.375 0.332Form 1 3.269 0.322Level 3:Form 2 1.796 0.177Within 59 10.159
Total 64
*p. <.05
Second half of training.--No significant differences were found for
the mean number of cues discriminated during the second-half of training.
Table 16 shows the summary for the two-way analysis of variance for that
measure. The F-ratio for form had a p..value of 0.057. The means for the
film and audio-tape training groups were 11.76 and 12.66, respectively.
This indicated that either cues may have been slightly easier to discriminate
using the audio-tape method, or that the Sts trained via films were not as
successful in learning to identify cues.
Total training.--The differences in mean scores for initial cue
discrimination wane analysed by a three-way analysis of variance. Differences
attributable to set were added to the usual main effects of level and form.
49

TABLE 16
ANALYSIS OF VARIANCE SUMMARY FOR CUE DISCRIMINATIONFOR TRAINING--SECOND-HALF
Source df MS F
Level 2 4.633 1.358Form 1 1 12.906 3.784Level X Form 2 0.501 0.147Within 59 3,411
Total 64
The results shown in Table 17 indicate that the effects of form and of set
were significant. A confound:item complicating factor in the differences which
might be associated with set effect is the fact that Kersh (1963) identified
33 cues to be discriminated for set I and 35 cues for set II. The magnitude
of the influence that the unequal number of cues may have had is speculative,
though an important consideration.
TABLE 17
ANALYSIS OF VARIANCE SUMMARY FOR CUEDISCRIMINATION FOR TRAINING--TOTAL
Source df MS F
Level 2 3.828 0.383Form 1 63.909 6.396*Set 1 ' 158.809 15.893*Level X Form 2 0.418 0.042Level X Set 2 9.966 0.997Form X Set 1 10.735 1.074Level X Form X Set 2 2.145 0.215Within 53 9.992
Total 64
*P. < .05
The mean for the film group was 24.88 and the audio-tape group mean
was 26.88. Because one-half of each group was trained using each of the two
50
sets, this difference was not confounded by the unequal number of cues to be
discriminated.
The mean scores for the two sets were 24.36 for set I, the_aet_mith
33 cues, and 27.41 for set II - -35 cues. In light of the confounding effect,
this difference may be misleading though its p. value of 0.001 is certainly
statistically significant. A t value of 1.58 was required for a,significant
difference between those two means. With the difference of two cues to be
discriminated and a mean difference only 3.05, the significance level
exhibited is statistically significant, but may exist as a result of bias
attributable to the number of cues.
Gain score.--The gain score effects for form, level, and form by
level were all non-significant. This is not a surprising result in light of
the fact that set I had three less cues to be discriminated for the second-
half of the episodes and set II had one less. Though this is not an argument
against the lack of significance, it is certainly a more telling argument
against an active support of a null proposition for this sub-hypothesis.2
Stimulus Recycling'
If an St was unable to assess the problem cue(s)3 even with the aid
of prompts, the episode was recycled, i.e., the audio-tape or film was
replayed. Assuming that training was expedited when fewer recyclings were
necessitated, a two-way analysis of variance (e.g., Table 18) aided in the
determination that the audio-tape training was more efficient (p.4C 0.001).
2In those cases where the analysis of variance summary table is not
shown, the table can be found in Appendix A under the same label as the titlefor the section under discussion. Summary tables for hypotheses are providedin the first section of Appendix A.
3For some episodes only one cue was listbd, or an St may haveidentified only one cue correctly in an episode with multiple cues.
51
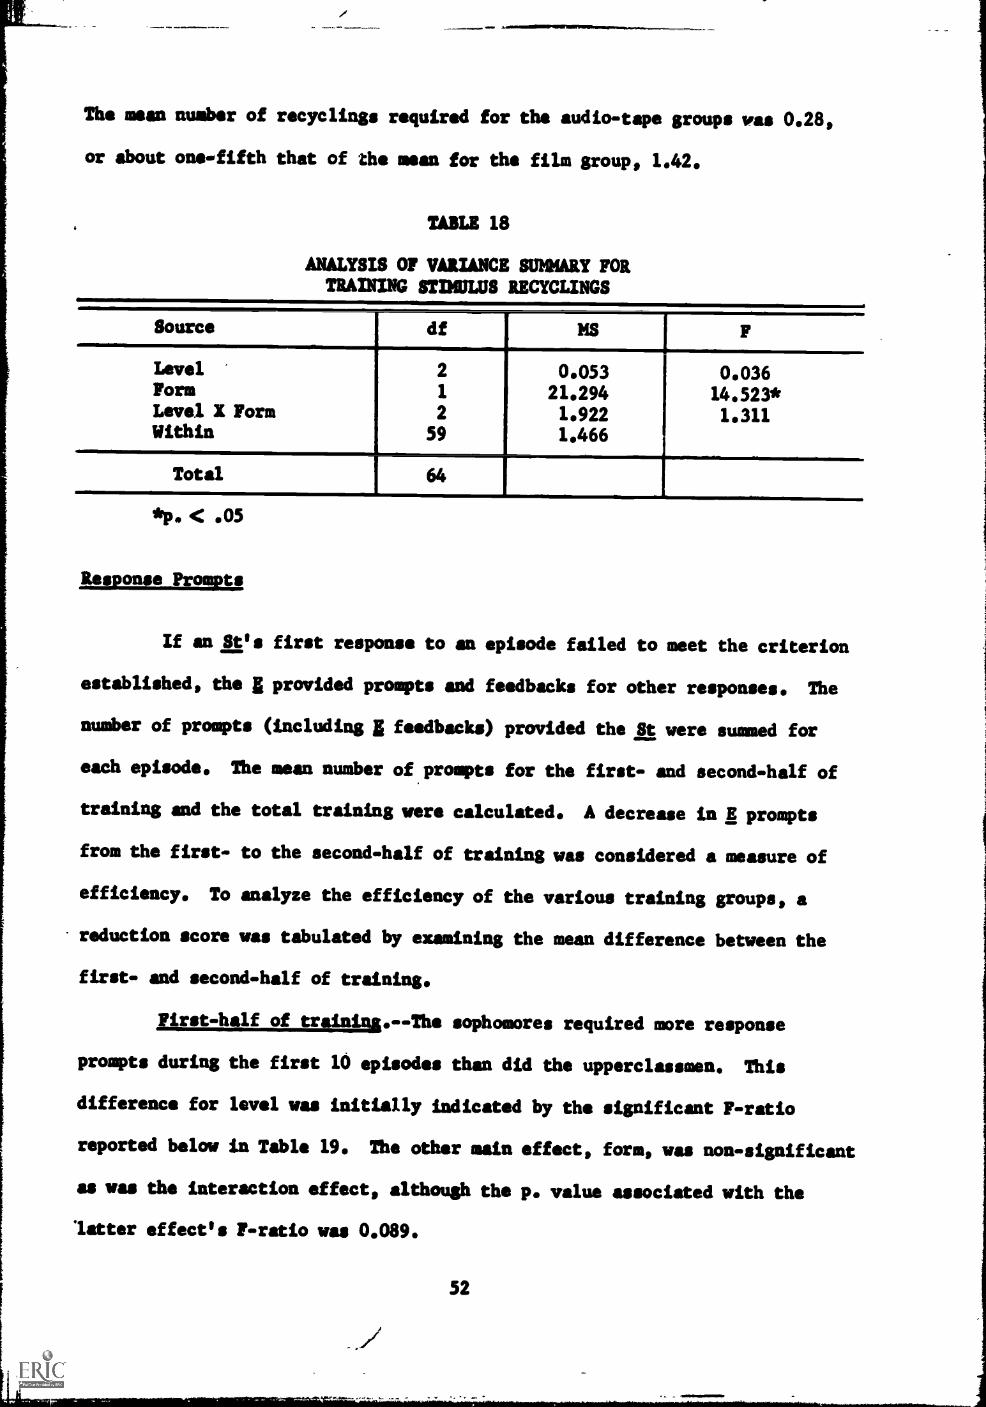
The mean number of recycling. required for the audio-tape groups vas 0.28,
or about one -fifth that of the mean for the film group, 1.42.
TABLE 18
ANALYSIS OF VARIANCE SUMMARY FORTRAINING STIMULUS RECYCLINGS
Source df MSI
F
Level 2 0.053 0.036Form 1 21.294 14.523*Level X Form 2 1.922 1.311Within 59 1.466
TotalI 64 I
*p. < .05
Response Prompts
If an St's first response to an episode failed to meet the criterion
established, the I provided prompts and feedbacks for other responses. The
number of prompts (including feedbacks) provided the St were summed for
each episode. The mean number of prompts for the first- and second-half of
training and the total training were calculated. A decrease in E prompts
from the first- to the second-half of training was considered a measure of
efficiency. To analyze the efficiency of the various training groups, a
reduction score was tabulated by examining the mean difference between the
first- and second-half of training.
First-half of training.--The sophomores required more response
prompts during the first 10 episodes than did the upperclassmen. This
difference for level was initially indicated by the significant F-ratio
reported below in Table 19. The other main effect, form, was non-significant
as was the interaction effect, although the p. value associated with the
litter effect's F-ratio was 0.089.
52

TABLE 19
ANALYSIS OF VARIANCE SUMMARY FORRESPONSE PROMPTSFIRST-HALF
Source df MS F
Level 2 67.808 4.367*Form 1 0.024 0.002
Level X Form 2 39.125 2.520
Within 59 15.528..
Total 64
< .05
An analysis of the means for training levels (see Table 20) revealed
that the differences between sophomores and juniors and seniors for response
prompts were statistically significant. The difference between the means for
the juniors and seniors was quite slight with seniors requiring slightly more
prompts to reach a criterion response during the first-half of training.
TABLE 20
MEAN DIFFERENCES FOR RESPONSE PROMPTSFOR TRAINING LEVEL -- FIRST -HALF
Level Sophomores I Juniors I Seniors Mean Rank
SophomoresJuniorsSeniors
3.09* 3.01*-0.08
132
*2.44 was the required mean difference significant tothe .05 level.
Second-half of training.--Neither of the two main effects nor the
interaction effect was significant for the mean number of E prompts required
during the second-half of t ;ping. The p. value associated with level was
0.577, with form it was 0.665, and with level by form it was 0.421,
indicating more homogeneity in the number of prompts necessary than in the
first-half of training.
53
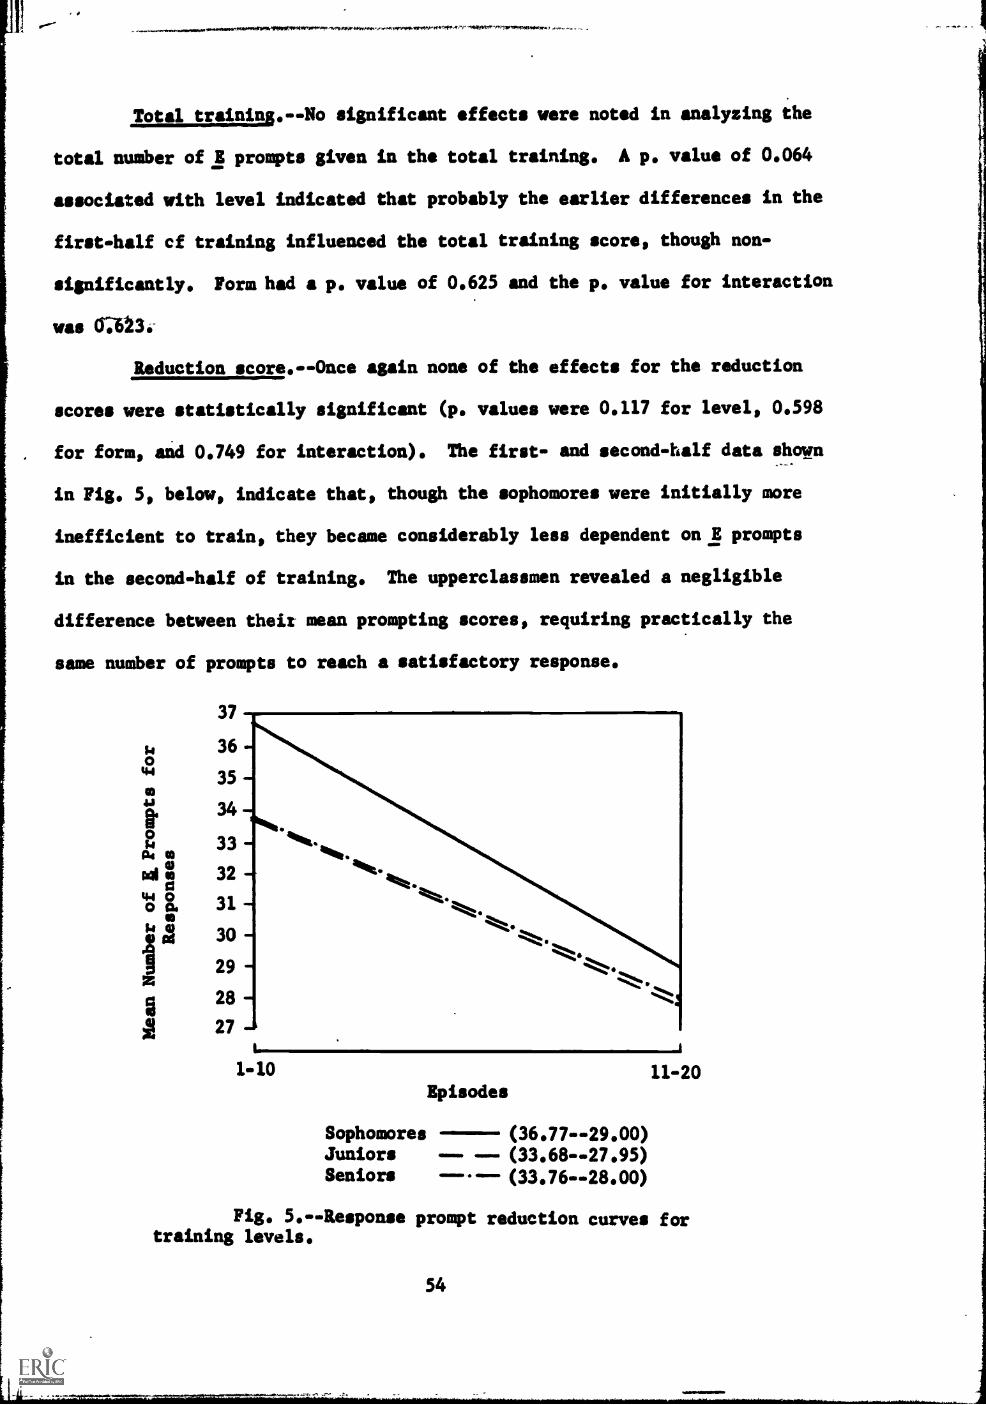
1
Total training.--No significant effects were noted in analyzing the
total number of E prompts given in the total training. A p. value of 0.064
associated with level indicated that probably the earlier differences in the
first-half cf training influenced the total training score, though non-
significantly. Form had a p. value of 0.625 and the p. value for interaction
was 0:613.-
Reduction score.--Once again none of the effects for the reduction
scores were statistically significant (p. values were 0.117 for level, 0.598
for form, and 0.749 for interaction). The first- and second-half data shown- -
in Fig. 5, below, indicate that, though the sophomores were initially more
inefficient to train, they became considerably less dependent on E prompts
in the second-half of training. The upperclassmen revealed a negligible
difference between their mean prompting scores, requiring practically the
same number of prompts to reach a satisfactory response.
37
36 -
35 -
34-
33 -
32
31-
30 -
29
28 -
27--
1-10
Episodes
Sophomores (36.77--29.00)Juniors --- (33.68-- 27.95)Seniors (33.76--28.00)
11-20
Fig. 5.--Response prompt reduction curves fortraining levels.
54
6100....411k

Cue Discrimination Prompts
When the E had finished, providing the St with a feedback to the
initial response for an episode, the St was then asked what occurred in that
problem situation. If the St was unable to identify all the relevant cues
listed by Kersh (1963), the began to provide prompts. (See the section
Training Procedures in Chapter III or Appendix F for a complete description
of the prompting procedure.) The sum of these prompts was tabulated for the
first- and second-half of training and the total training. An efficiency
measure was acquired by subtracting the total number of prompts for the
second-half of training from that of the first-half. Each of those four
measures was examined via a two-way analysis of variance.
First-half of training.--The usual main effects of level and form
were used to analyze the results of the mean number of cue discrimination
prompts. The interaction F-ratio was non-significant (p.ot, 0.389) as was
the ratio for level (p.< 0.643). A p. value of 0.016 was associated with
the treatment effect for form. Those students trained via films required a
mean of 16.52 prompts while the audio-tape group required 14.64 prompts. A
summary of the analysis of variance for the first-half prompts is shown in
Table 21.
TABLE 21
ANALYSIS OF VARIANCE SUMMARY FOR CUEDISCRIMINATION PROMPTS--FIRST-HALF
Source df MS F
Level 2 4.028 0.444Form 1 55.336 6.104*Level X Form 2 8.689 0.959Within 59 9.065
. ,
Total 64
*p. < .05
55
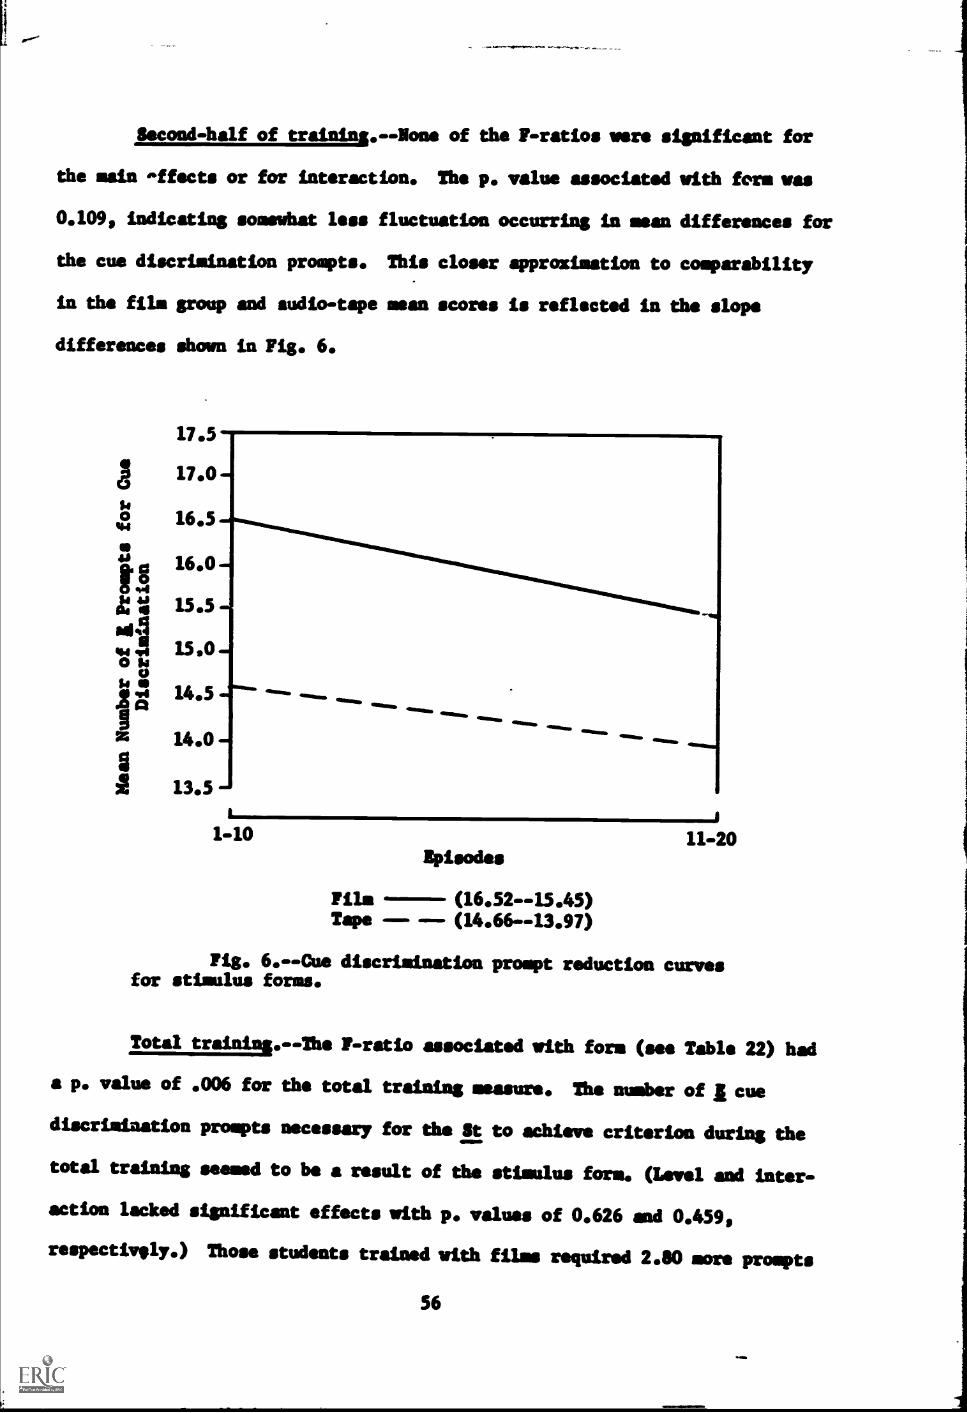
Second-half of training.--None of the F-ratios ware significant for
the main ^ffects or for interaction. The p. value associated with forams
0.109, indicating somewhat less fluctuation occurring in mean differences for
the cue discrimination prompts. This closer approximation to comparability
in the film group and audio-tape mean scores is reflected in the slope
differences shown in Fig. 6.
'44
dfla
gml
0 la0$4
2 '43
3
17.5
17.0
16.5
16.0
15.5
15.0
14.5
14.0
13.5
ft.VONERNs .11 moor 411.11311 .11111
MINIMINo 'maw. MIMEDMINIMINo
I1-10 11-20
Episodes
Film (16.52 - -15.45)
Tape ------ (14.66--13.97)
Fig. 6.- -Cue discrimination prompt reduction curvesfor stimulus forms.
Total training.--The F-ratio associated with form (see Table 22) had
a p. value of .006 for the total training measure. The number of" cue
discrimination prompts necessary for the St to achieve criterion during the
total training seemed to be a result of the stimulus form. (Level and inter-
action lacked significant effects with p. values of 0.626 and 0.459,
respectively.) Those students trained with films required 2.80 more prompts
56
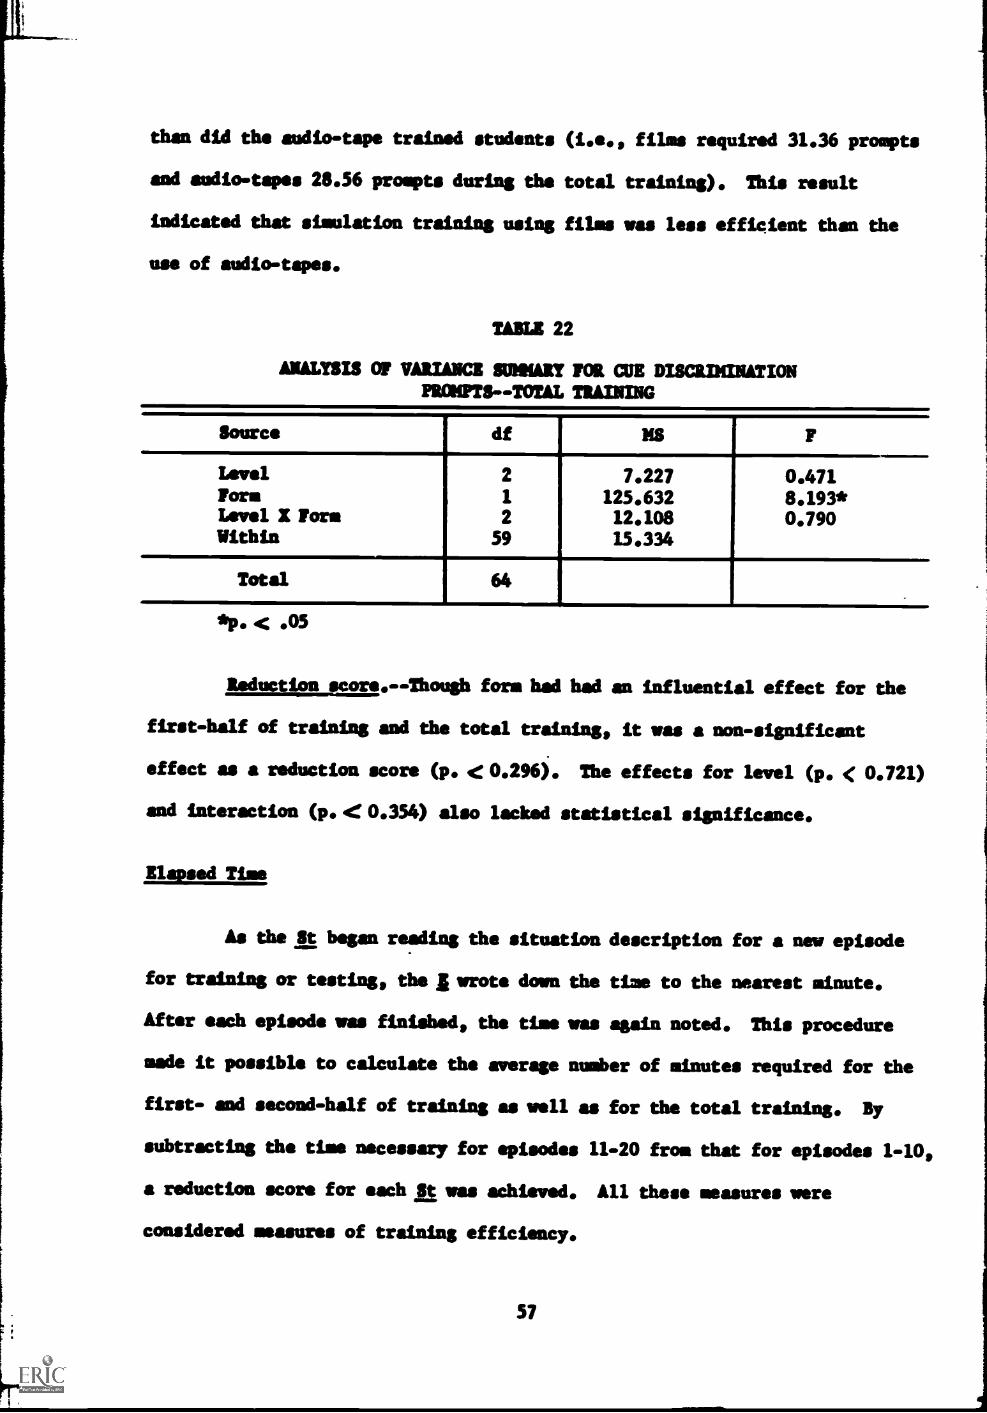
than did the audio-tape trained students (i.e., films required 31.36 prompts
and audio-tapes 28.56 prompts during the total training). This result
indicated that simulation training using films was less efficient than the
use of audio-tapes.
TABLE 22
ANALYSIS OF VARIANCE SUMNAti FOR CUE DISCRIMINATIONPROMPTS--TOTAL TRAINING
Source df-
MS F.,
Level 2 7.227 0.471Form 1 125.632 8.193*Level X: Form 2 12.108 0.790Within 59 15.334
Total 64.
.
*p. < .05
Reduction score.--Though form had had an influential effect for the
first-half of training and the total training, it was a non-significant
effect as a reduction score (p. <0.296). The effects for level (p. < 0.721)
and interaction (p. < 0.354) also lacked statistical significance.
Elapsed Time
As the St began reading the situation description for a new episode
for training or testing, the, wrote down the time to the nearest minute.
After each episode was finished, the time was again noted. This procedure
made it possible to calculate the average number of minutes required for the
first- and second-half of training as well as for the total training. By
subtracting the time necessary for episodes 11-20 from that for episodes 1-10,
a reduction score for each achieved. All these measures were
considered measures of training efficiency.
57

Calculations were also made for the mean time required for testing
as a result of training level or form. reduction score was determined by
subtracting the time required for testing from that for training for each
St.
First-half of training.--The differences in training time required
for episodes 1-10 were non-significant. The p. value associated with level
was 0.339, with form it was 0.569, and with level by form it was 0.181.
Second-half of training. - -Table 23 indicates that effect of inter-
action was significant (p. < 0.014) for the time required for episodes 11-20.
Level had a p. value of 0.404 and that for foram 0.139. An examination
TABLE 23
ANALYSIS OF VARIANCE SUMMARY FOR ELAPSEDTRAINING TINE,--SECOND-HALF
Source df MS F
Level 2 15.567 0.920Form 1 37.979 2.244
Level 31:Form 2 77.135 4.558*Within 59 16.923
Total 64
< .05
of the data in Table 24 presents rather mixed results. The ranking of the
mean times shows that the groups trained with films were ranked 1, 2, and 6
in total time while the audio-tape groups were ranked 3, 4, and 5. Generally,
audio-tape training required less time for the second-half of training (with
the exception of the junior-film group) as evidenced by the lower standing in
the ranking for the three audio-tape groups. This trend is not, though, one
that elicited significant differences Table 23).
58
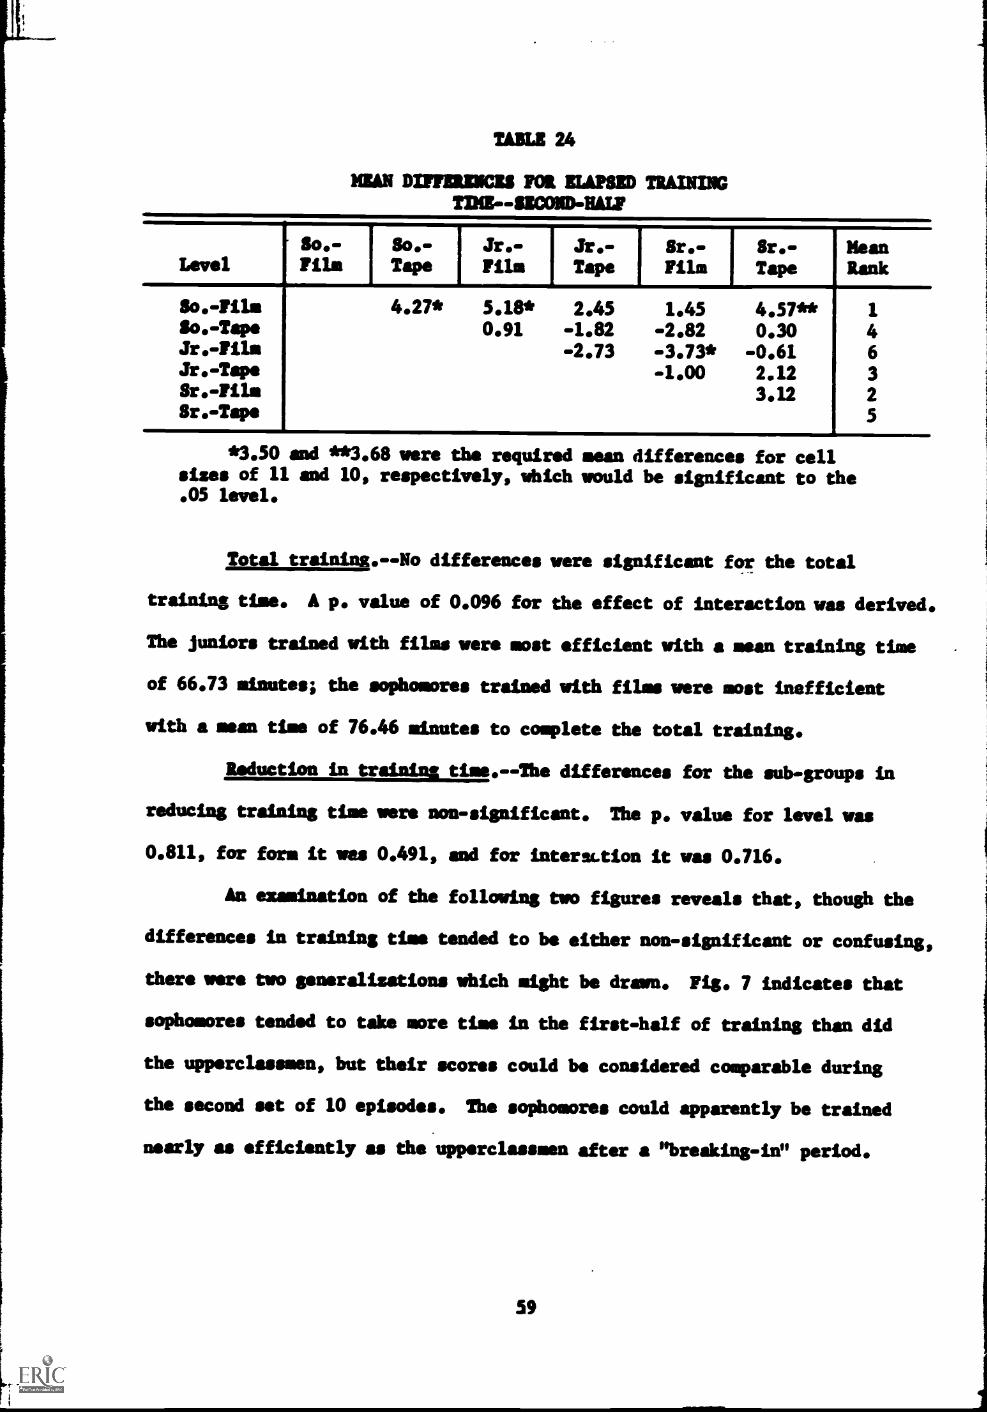
TABLE 24
NUN DIFFERENCES FOR ELAPSED TRAININGTINE--SICOND-HALF
LevelSo.-Film
So. -
TapeJr.-Film
Jr.-Tape
Sr.-Film
Sr..
TapeNewRank
80. -Film
So.-TapeJr.-FilmJr. -Tape
Sr.-FilmSr.-Tape
4.27* 5.18* 2.45 1.45 4.57**0.91 -1.82 -2.82 0.30
-2.73 -3.73* -0.61-1.00 2.12
3.12
1
463
2
5
*3.50 and **3.68 were the required mean differences for cellsizes of 11 and 10, respectively, which would be significant to the.05 level.
Total training.--No differences were significant for the total
training time. A p. value of 0.096 for the effect of interaction was derived.
The juniors trained with films were most efficient with a mean training time
of 66.73 minutes; the sophomores trained with films were most inefficient
with a mean time of 76.46 minutes to complete the total training.
Reduction in training time.--The differences for the sub-groups in
reducing training time were non-significant. The p. value for level was
0.811, for form it was 0.491, and for interstion it was 0.716.
An examination of the following two figures reveals that, though the
differences in training time tended to be either non-significant or confusing,
there were two generalisations which might be drawn. Fig. 7 indicates that
sophomores tended to take more time in the first-half of training than did
the upperclassmen, but their scores could be considered comparable during
the second set of 10 episodes. The sophomores could apparently be trained
nearly as efficiently as the upperclassmen after a "breaking-in" period.
59

48
46-
44
42
40 -
38 - 414%*:ftlami.
36 -:,,"%,.
34 - '4110,04.
32
30-1
28 -
1
1-10 11-20Episodes
Sophomores (42.09-32.14)Juniors (38.64-30.45)---
Seniors ------(39.14-31.33)
Fig. 7.-Elapsed time reduction curves fortraining levels.
Apparently, the audio-tape group required less time to train for
either half of training. Fig. 8 shows that almost three and one-half more
minutes were required to train the Sts using films for the first-half of
training. This difference fell. to approximately one and one-half minutes for
the second-half of training.
These two differences attributable to form and level are interesting
trends about which speculation might occur. Further discussion is hindered,
though, in view of the lack of statistical significance exhibited by the
variables of form and level.
Total testing.--Neither the effect for level (p. < 0.177) or inter-
action (p. <0.501) was significant in analyzing the amount of time spent in
testing. The difference associated with form was significant (see Table 25)
with a corresponding p. value of 0.010. Those Sts trained via films required
60

1
a
E4
44
42.0
40.5
39.0 --
37.5
36.0 -
34.5 -
1
33.0 -
E+31.5 -
30.0
mar4
1-10 11-20
Episodes
Film (40.67 - -32.06)
Tape --- (39.28--30.53)
Fig. 8.--Elapsed time reduction curves forstimulus forms.
41.52 minutes to complete the 20 test episodes while the audio-tape trained
Sts needed only 36.28 minutes to complete the test.
TABLE 25
ANALYSIS OF VARIANCE SIDEARM FORELAPSED TESTING TINE
Source df MS F
Level 2 108.260 1.782Form 1 431.585 , 7.104*Level X Form 2 42.535 0.700Within 59 60.756
Total 64---
*p. < .05
61
Reduction in testing time.--The main effects and the effect for inter-
actica were all non-significant in an examination of the amount of decrease
in the time taken for testing as opposed to that for training. This indicates
that no generalization could be drawn as to which group(s) became most
efficient during testing when compared to training.
Response Score for Testing
During the testing situation the St was told to make only one response
to each episode. No E prompts or feedbacks were given. The response made by
the St was categorized using the same procedure described for training
(e.g., Appendix F).
To test the effects of the two training stimulus forms (films and
audio-tapes) both forms were used in the test. A response score was computed
for the 10 episodes presented by audio-tape and for the nine episodes pre-
sented by film. The first episode was presented in the stimulus form that
matched the St's training form, i.e., if the St was trained with films the
first test episode was presented by film and vice versa. A sum for response
scores was computed for the total testing minus the placebo episode, i.e.,
only episodes 2-20. The above three measures were examined by way of a two-
way analysis of variance.
A fourth measure for total testing was computed by summing the
response score for all 20 episodes (2-20 plus the placebo episode). The
fourth measure of training effectiveness was analyzed via a three-way
analysis of variance.
Audio-tape episodes.--The usual effects of level, form, and their
interaction revealed no significant differences in response scores for
episodes presented aurally. The lowest p. value of 0.108 was associated with
62
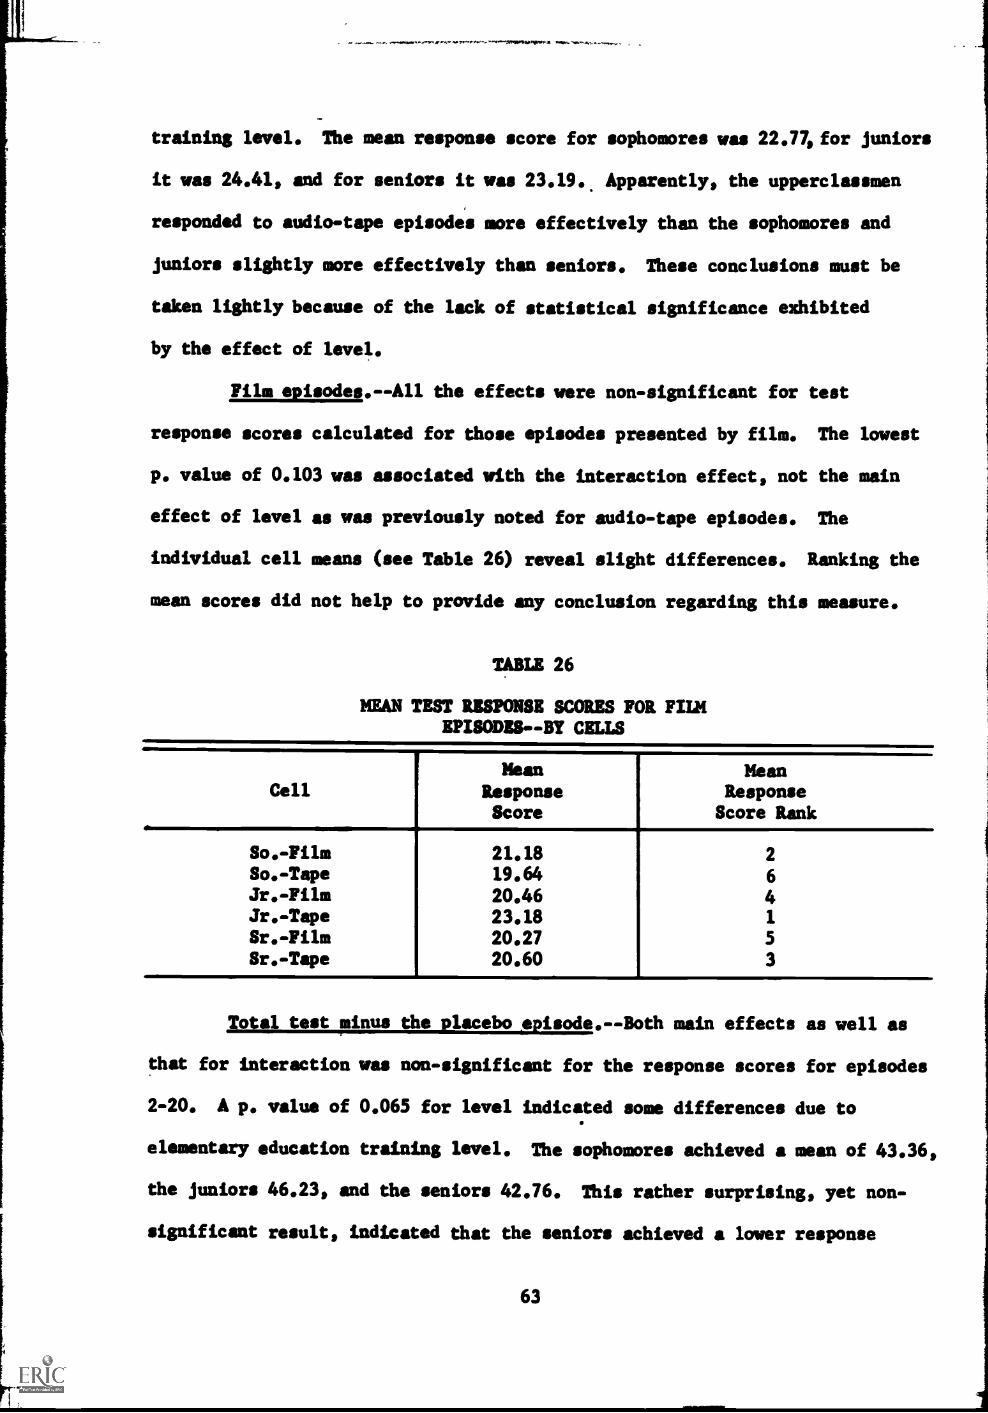
training level. The mean response score for sophomores was 22.77, for juniors
it was 24.41, and for seniors it was 23.19.. Apparently, the upperclassmen
responded to audio-tape episodes more effectively than the sophomores and
juniors slightly more effectively than seniors. These conclusions must be
taken lightly because of the lack of statistical significance exhibited
by the effect of level.
Film episodes.--All the effects were non-significant for test
response scores calculated for those episodes presented by film. The lowest
p. value of 0.103 was associated with the interaction effect, not the main
effect of level as was previously noted for audio-tape episodes. The
individual cell means (see Table 26) reveal slight differences. Ranking the
mean scores did not help to provide any conclusion regarding this measure.
TABLE 26
MEAN TEST RESPONSE SCORES FOR FILMEPISODES - -BY CELLS
CellMean
ResponseScore
MeanResponseScore Rank
So.-Film 21.18 2
So. -Tape 19.64 6Jr.-Film 20.46 4Jr.-Tape 23.18 1
Sr.-Film 20.27 5
Sr.-Tape 20.60 3
Total test minus the placebo nisode.--Both main effects as well as
that for interaction was non-significant for the response scores for episodes
2-20. A p. value of 0.065 for level indicated some differences due to
elementary education training level. The sophomores achieved a mean of 43.36,
the juniors 46.23, and the seniors 42.76. This rather surprising, yet non-
significant result, indicated that the seniors achieved a lower response

score on the last 19 test episodes than did either the sophomores or
seniors.
When the influence of the E effect was examined, which is discussed
in greater detail later in this chapter,4 via a two-way analysis of variance,
the differences attributable to elementary education training level became
significant (p. < 0.042). Four other analyses were performed to examine the
response scores for episodes 2-20 using form, set, and E as the main effects.5
In three of those analyses, form contributed a significant effect. The effect
attributable to E was also significant for one of those analyses. (See
Appendix A, Tables 52, 53, 54, 55, and 68 for the summary of those five
analyses of the response score for the total test minus the placebo episode.)
Total test response scores.--A third main effect, set, was added to
the usual effects of level and form. A three-way analysis of variance
indicated that the main effects of level and set had significant F-ratios
(see Table 27). With a critical difference of 2.76 required for a .05
significance level, the juniors were found to be the group which differed
most in total test responses. The juniors' mean of 48.77 was 3.13 and 5.15
points higher than the sophomores and seniors, respectively. The sophomores
again did somewhat better than the seniors with a mean of 45.64 against that
of 43.62 for the seniors.
The significant effect attributed to set (p. <0.001) was unexpected.
After noting no significant differences attributable to set for the first
training responses (see Table 5), this effect was puzzling. An analysis of
the individual St responses on the test for each episode indicated that some
kinds of problem situations tended to be more difficult in both sets. When
4See p. 72 for a complete analysis of E effect.
5See p. 72.
64
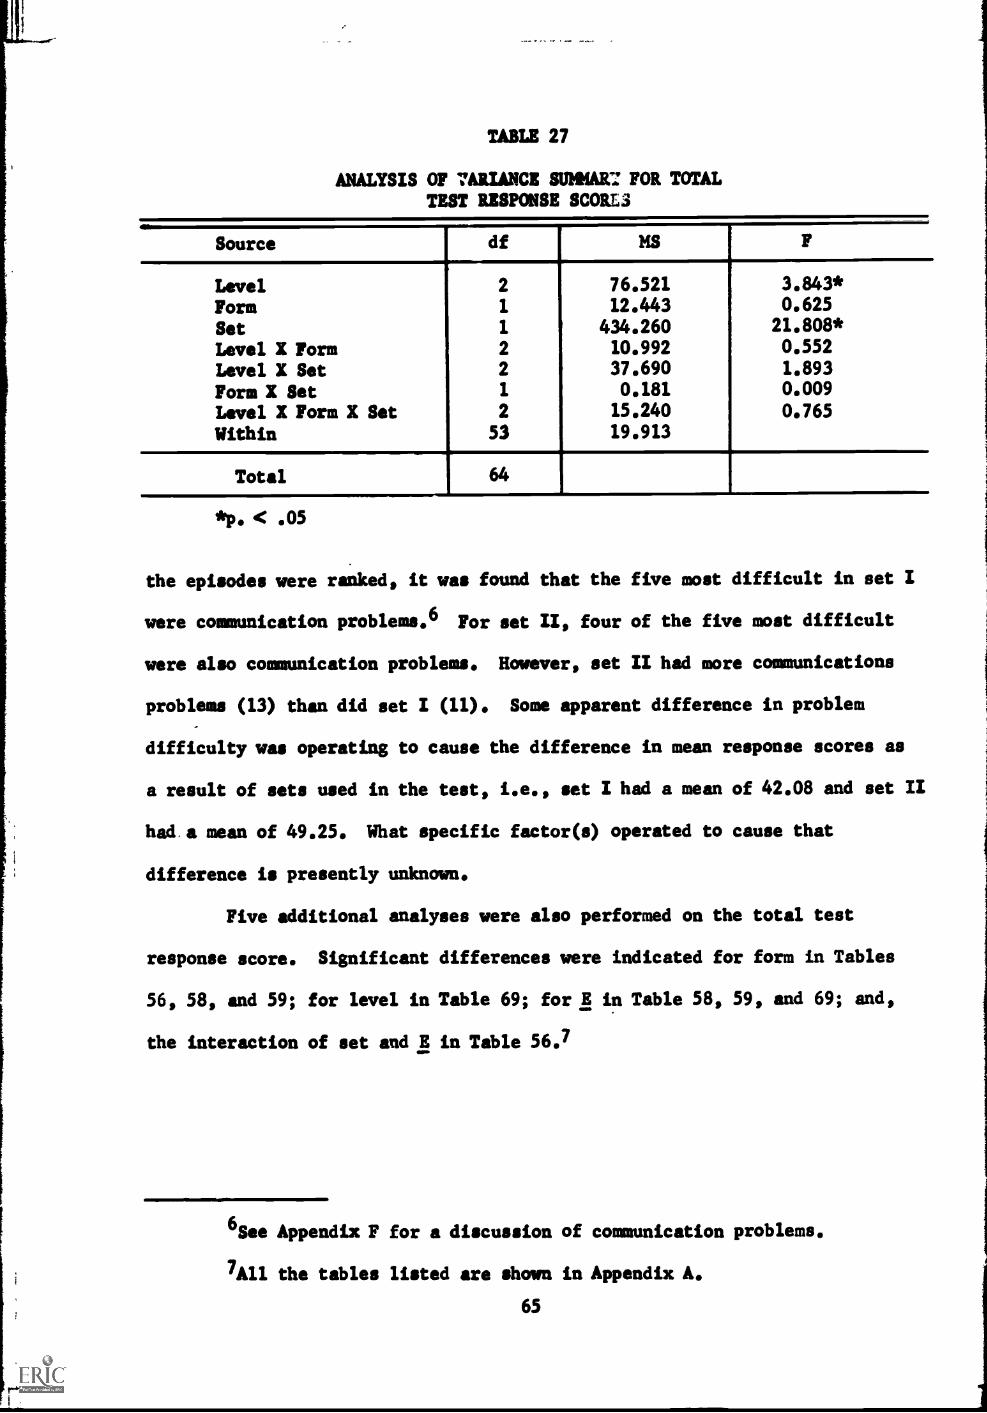
TABLE 27
ANALYSIS OF 7ARIANCE SUWAR FOR TOTALTEST RESPONSE SCORE 3
Source df MS F
Level 2 76.521 3.843*
Form 1 12.443 0.625
Set 1 434.260 21.808*
Level X Form 2 10.992 0.552
Level X Set 2 37.690 1.893
Form X Set 1 0.181 0.009
Level X Form X Set 2 15.240 0.765
Within 53 19.913
Total 64
*p. < .05
the episodes were ranked, it was found that the five most difficult in set I
were communication problems.6 For set II, four of the five most difficult
were also communication problems. However, set II had more communications
problems (13) than did set I (11). Some apparent difference in problem
difficulty was operating to cause the difference in mean response scores as
a result of sets used in the test, i.e., set I had a mean of 42.08 and set II
had. a mean of 49.25. What specific factor(s) operated to cause that
difference is presently unknown.
Five additional analyses were also performed on the total test
response score. Significant differences were indicated for form in Tables
56, 58, and 59; for level in Table 69; for E in Table 58, 59, and 69; and,
the interaction of set and E in Table 56.7
6See Appendix F for a discussion of communication problems.
7All the tables listed are shown in Appendix A.
65

Cue Discrimination Score for Testing
Once the response to a test episode had been given, the E then asked
the St to relate what he had seen and/or heard in that situation. As the St
responded to that question, the E compared the cues discriminated to a list
of cues prepared for each episode by Kersh (1963). A cue discrimination score
was summed for the episodes presented via audio-tape, by film, and for the
total test minus the placebo episode. Each of those measures was analyzed by
a two-way analysis of variance. A measure for the total cues discriminated
(episodes 1-20) was analyzed by a three-way analysis of variance. The results
of these analyses are discussed below.
Audio-tape episodes.--The differences in the cue discrimination
scores which may have resulted from training level or form proved to be
statistically non-significant. The effect due to interaction also lacked
significance.
Film episodes.--No statistically significant differences were
determined for either main effect or the interaction of level by form for
episodes presented visually. The p. values ranged from 0.417 for interaction
to 0.677 for level. This indicated that the mean differences for the cue
discrimination score seemed to be negligibly influenced by training format
when film test episodes were examined.
Total test minus the placebo episode.--Cue discrimination scores for
the last 19 test episodes were not significantly influenced by the various
training treatments. The p. values ranged from 0.490 for level to 0.689 for
form. Five additional analyses were used to examine this measure.8 All five
revealed significant differences attributable to E as a main effect. Summary
8See p. 72.
66

rrrr. xrw rr rarer 4,, v rr,,,k, vvo..r.11r, r
Table 62 indicates that the interaction of form by E was significant when
only the data for the seniors were used. Tables 60, 61, 62, 63, and 70,
shown in Appendix A, all indicate that there were significant differences for
this measure.
Total Test.--A three-way analysis of variance indicated no
statistically significant differences due to the main effects of level, form,
and set or their interactions. When the five additional analyses (see p. 72)
were performed the main effect of E contributed to significant differences
for each analysis. Form, as a main effect, was significant on one measure
(e.g., Table 64) and, as an interaction effect, it was significant once
(e.g., Table 66). The remaining three analyses, shown in Appendix A as
Tables 65, 67, and 71, contained significant effects resulting from E
variation. The results of all these analyses are confounded or complicated,
as were those for training,9 because the two sets of episodes did not have an
equal number of cues to be discriminated. The p. values for this analysis
ranged from 0.284 for set to 0.884 for the interaction of level by set.
Response Change Scores
In an attempt to determine if any significant differences in St
responses would accrue as a result of training format, three change scores
were computed and analyzed.
Similar problem episodes - Two categories were used by Kersh in
grouping the episode types--communication problems and management problems
(see Appendix F). Eight pairs of episodes were found in the two sets that
matched in terms of episode category type and the number of cues to be
9See pp. 50-51 for a discussion of the confounding due to an unequalnumber of cues to be discriminated for the two sets.
67

discriminated. The sum of each St's responses for the episodes 1, 2, 3, 4,
5, 6, 8, and 12 in set I were compared to the sum for episodes 1, 5, 6, 7, 8,
9, 15, and 17 in set II. If the St had been trained using set I, that score
was subtracted from the score for the eight matching episodes in set II.
An opposing procedure was used for Sts trained with set II. The change score
derived from this calculation, defined as a measure of effectiveness, was
examined via a two -way analysis of variance.
The main effects of level and form and their interaction did not
provide any indication of significant differences when comparing similar
problem episodes. Apparently, neither elementary education training level
nor stimulus form had more than negligible effects in light of the high p.
values attrL:outed to each (p. < 0.718 and 0.608, respectively). The inter-
action of level by form had a p. value of 0.662, further verifying the
conclusion that the independent variables were of only a limited influence.
Similar standard episodes.-- Within each set, three pairs of episodes
were found which had the same standards.° One member of etch pair was in
the first-half of training and the other mother was in the second-half of the
training episodes. For the Sts trained with the first set, a swims
computed for the first three episodes (3, 8, and 10) in set I and for the
second three episodes (14, 15, and 16) in that set. Dy subtracting the sum
of the first-half episodes from those of the second-haWmatching episodes,
a measure of effectiveness was acquired for set I. The pairs for set II
(episodes 2, 4, and 5, and 13, 15, and 20) were compared in the same manner
for each St trained by that set.
two-oway analysis of variance for that measure revealed no sig-
nificant differences attributable to level, form, or their interaction.
°See Definition of Terms for a discussion of the episode standards.
68

Total Change scores.--The sue of the first responses for training
were subtracted from the response score for testing. The differences (the
total change score) were examined by two-way analysis of variance to determine
the characteristics of this measure of effectiveness. No significant
differences were attributable to the main effects of level and form or their
....:teraction. Because of the great importance of this measure, the means for
the cells, levels, and forms have been calculated and are shown in Table 28.
TABLE 28
MEANS FOR TOTAL RESPONSE CHANGE SCORES- -TESTING HMS TRAINING
TrainingStimulus Form
Total byLevelLevel
Film Tape
SophomoresJuniorsSeniors
.
0.731.090.00
2.554.27-1.30
1.642.68
-0.62
Total by Form 0.61
,
1.94
The p. value associated with level was 0.132, with form it was 0.560, and with
the interaction effect it was 0.329. The t value required for a significant
mean difference between cells was 5.64 (where the cell N = 10). The
difference between the means for the junior-tape group and the senior-tape
group approached that level with a 5.57 difference.
Cue Discrimination Manse Scores
Two cue discriminationchange scores were computed. The first was
calculated for similar problem episodes. A second was computed for a total
cue discrimination change score. Both calculation procedures were identical
to those described in the previous section concerned with response change
scores.69

Similar problems.--No differences were statistically significant in
comparing the mean differences for episodes with similar problems. The p.
value for level was 0.896; for form, 0.548; and for the interaction it was
0.844, indicating little observable variation as a result of the independent
variables.
Total change scores.--When the differences resulting from the
subtraction of the total cue discrimination score for training from that of
testing were analyzed, no significant differences were noted. The p. values
associated with level, form, and interaction were 0.983, 0.195, and 0.518,
respectively.
Attitude Scores
The scores attributed to the Sts' attitude assessmentll were also
analyzed via a two-way analysis of variance. Though no significant
differences were found, the means for the individual cells, levels, and forms
are shown in Table 29 because of the great importance of this measure. The
p. value corresponding to level was 0.404, to form 0.470, and to interaction
it was 0.478.
TABLE 29
MEANS FOR ATTITUDE SCORES
Stimulus FormTraining Means forLevel
Tape LevelsFilm
SophomoresJuniorsSeniors
71.0075.0078.18
411
75.2779.0975.40
73.2777.0576.57
Means for Forms 74.67 76.63
11See Appendix B for a discussion of the construction of the scale.
70
---
Analyses of Control Variables
The variables of set and test E were posited as control variables,
i.e., both variables were held constant by randomly assigning an equal
number of Sts from each cell of the experimental des4gn (see Table 2) to one
of the two episode sets for training and one of the two Es for testing.
Several analyses were performed to identify the efficacy of the decision not
to include these two factors as independent variables. These analyses are
discussed in the following paragraphs.12
Set
Sixteen three -way analysis of variance problems were calculated using
form, experimenter and set as main effects. Four measures were analyzed; the
total test score minus the placebo episode for (1) responses and (2) cue
discrimination, and the total test score for (3) responses and (4) cue
discrimination. Each of the measures was analyzed four times to provide a
partitioning effect for levels, i.e., using only (1) the sophomores, (2) the
juniors, and (3) the seniors as well as (4) the total sample. In none of
those analyses was the F-ratio significant for the main effect - -set. In the
16 analyses, set was alio an interactive component 48 times. In all those
cases, set was also non-significant.
Four additional analyses were performed using the data for the same
four measures with set, form, and level as main effects. Twice set was a
significant effect--in analyses of means for training cue discrimination
scores and total test response scores. Set was never significant in any of
the 12 interaction results.
12See the last two sections in Appendix A for the summery tables
discussed in the remainder of this section.
71
In 80 analyses of set as either a main effect or as a component in
an interaction effect, significant results were found only twice.
Experimenter
The first 17 analyses discussed above for set were used in analyzing
the effects attributable to the E. In 11 of the 16 analyses the effect
attributable to the E was significant. In two of those 11 measures, plus
one other measure, the interaction effect of either set and/or form with E
was significant. A total of 12 of the 16 analyses performed indicated the E
variable contributed a significant effect to the mean test differences.
The same four measures were again analyzed using only E and level as
main effects. In all cases the effect attributable to E variation surpassed
the .05 significance level.
In 16 of the total of 20 analyses E variation contributed a signifi-
cant effect.
The 11 hypotheses and the two control variables have been discussed
statistically. In the next chapter, the hypotheses will be examined for the
purpose of rejecting or accepting each as a null proposition. The control
variables will be examined in light of the data presented to assess the
efficacy of the decision not to include them as independent variables.
Conclusions regarding the relative effectiveness and efficiency of the
training formats will also be presented.
72
-CHAPTER V
SUMMARY AND CONCLUSIONS
Introduction
In the preceding chapter, the results of the analyses of the data
were presented. The data were compiled to provide a rationale for the
rejection or acceptance of 12 null hypotheses concerned with the effectiveness
and efficiency of simulation as a training technique to be used with
elementary education majors. Additional analyses were performed to determine
the efficacy of the decision to include the factors of episode set and test
E as control rather than experimental variables.
The .05 level of significance was chosen to reject a null hypothesis.
Ten of the 12 hypotheses included sub-hypotheses. If the analysis for any
of the incorporated sub-hypotheses reached a .05 significance level, the
hypothesis was rejected. The rationale for this decision is based on the
assumption that the sub-hypotheses are components of the hypothesis and that
if one of those components cannot be considered in a null form, then the
total hypothesis should be suspect. By rejecting the total hypothesis
attention is drawn to the need for further study to isolate specific factors
which may be influencing the significant difference attributed to that
component of the hypothesis.
Conclusions Directed Toward Hypotheses
The hypotheses and the resultant sub-hypotheses are reiterated below.
Following the enumeration of each hypothesis and any selected sub-hypotheses
73

are the conclusions drawn from the analyses of the data collected for each
hypothesis.
There will be no significant difference between sub-groups in:
The mean first response score for training--accepted
a. The mean first response score for the first-half of training- -accepted
b. The mean first response score for the second-half of training- -accepted
c. The mean first response score for the total training--acceptedd. The mean gain first response score--accepted
Four sub-hypotheses were examined as components of this hypothesis.
The results of all four analyses proved to be non-significant. Though some
variation in mean first response scores did occur, primarily as a result of
stimulus form, the null form of the hypothesis was accepted. No significant
differences in mean first response scores were noted as a result of trairing
level, stimulus form, or their interaction.
There will be no significant difference between sub-groups in:
2. The mean number of incorrect responses given during training- -rejected
a. The mean number of incorrect responses for the first-half oftrainingrejected
b. The mean number of incorrect responses for the second-half oftrainingaccepted
c. The mean number of incorrect responses for the total training- -rejected
d. The mean reductton score for incorrect responsesrejected
The analyses of the sub-hypotheses revealed significant differences
for three of the four components chosen for study. The treatment effect of
level proved to be a significant variable in the analyses for the mean
number of incorrect responses given during the first-half of training and the
total training. The interaction of level by form also revealed significant
differences for the reduction of incorrect responses given in the second-half
of training. Sophomores, particularly those trained with films, tended to
give more incorrect reponses, but they and the seniors trained with
74

audio-tapes reduced their errors in the second-half of training by the
greatest amount. The null hypothesis that there will be no significant
differences in the mean number of incorrect responses given during training
was rejected.
There will be no significant difference between sub-groups in:
3. The mean number of initial cues discriminated during training--relected
a. The mean cues discriminated during the first-half of training- -
acceptedb. The mean cues discriminated during the second-half of training- -
acceptedc. The mean cues discriminated during the total trainingrejectedd. The mean gain for cues discriminated -- accepted
One of the analyses for the four sub-hypotheses indicated a sig-
nificant difference in the mean number of cues initially discriminated during
training. The mean effects of form and set were both significant for the
measure computed for the total training. Subjects trained with audio-tapes
discriminated more otal cues than did their counterparts trained with films.
Set differences were noted, though the cause of this effect may have been
due to a disproportionate number of cues to be discriminated in the two sets
of problem episodes used in the study. Rejection of the null hypothesis,
that there will be no significant differences in the mean initial cue
discrimination score for training, did occur.
There will be no significant difference between sub-groups in:
4. The mean number of atimulus recyclings to achieve a type A response--
rejected
The main effect of form revealed that a training format using films
required a significantly greater number of stimulus recycling.. Though the
absolute number of recycling. for either group was small, the null hypothesis
that there would be no significant differences in stimulus recyclings was
rejected.
75
There will be no significant difference between sub-groups in:
5. The mean number of experimenter (I) prompts for responses--re acted
a. The mean E prompts for the first-half of training-..re ectedb. The mean E prompts for the second-half of training-- acceptedc. The mean E prompts for the total trainingacceptedd. The mean reduction score for E prompts--accepted
Sophomores required a significantly greater number of E prompts to
achieve the response criterion in the first-half of training. Three
additional analyses all revealed statistically non-significant effects
attributable to level, form, or their interaction. The null form of the
hypothesis that there would be no significant differences in E prompts
required to elicit a criterion training response was rejected.
There will be no significant difference between sub-groups in:
6. The mean number of E prompts necessary to achieve criterion for cuediscrimination--re ected
a. The mean E prompts for the first-half of training--re ectedb. The mean E prompts for the second-half of trainingAcceptedc. The mean E prompts for the total training-- rejectedd. The mean reduction score for E promptsaccepted
Two of the four sub-hypotheses concerned with E prompts necessitated
to achieve criterion for cue discrimination exhibited significant differences
attributable to form. Subjects trained with audio-tapes required fewer
prompts than those trained with films for the first-half as well as the total
training. The hypothesis that no significant differences in the mean number
of E prompts necessary to reach criterion for cue discrimination was rejected.
There will be no significant difference between sub-groups in:
7. The mean time for training and testing--re
a. The mean time for theb. The mean time for thec. The mean time for thed. The mean reduction ine. The mean time for thef. The mean reduction in
ected
first-half of training--acceptedsecond-half of training-7relectedtotal trainingmonadtraining timeacceptedtotal test-- rejectedtraining time minus testing timeaccepted
76
Four sub-hypotheses were analyzed to examine the effect of level,
form, or their interaction on the amount of time spent in training. An
additional pair of sub-hypotheses were used to study the effect of training
form on test time requirements. One of the training analyses revealed sig-
nificant differences in elapsed time for training as did one of the test
analyses. During the second-half of training, sophomores and seniors trained
with films were the two most inefficient groups. Subjects trained with films,
regardless of level, tended to be significantly more inefficient to test.
The proposition that no significant differences in elapsed time necessary for
training or testing was rejected.
There will be no significant difference between sub-groups in:
8. The mean response score for testing --rejected
a. The mean response score for oral stimulus episodesAccepted
b. The mean response score for film stimulus episodes -- accepted
c. The mean response score minus the placebo episoderejected
d. The mean response scorerejected
Of the four components of the hypothesis directed toward the mean
response score for testing, two indicated no significant differences. The
last two sub-hypotheses examined the question of the response scores for the
total test. The main effects of level, form, and set contributed significant
influences. Juniors tended to achieve significantly higher response scores
on the test than did the other two levels--sophomores or seniors. The
differences attributed to set which were also noted were troublesome. In
only one of the 19 other analyses, where the effect of set was studied, did
one of the episode sets provide a significant difference. Of the analyses
performed to isolate the effect of the control variables, eight of the 10
produced significant effects attributable to form. Subjects trained with
audio-tapes achieved total test response scores significantly higher than
those trained with films. The hypothesis that differences in mean response
scores for testing would lack significance was rejected.
77
There will be no significant difference between sub-groups in:
9. The mean number of cues discriminated for testing--re ected
a. The mean cue discrimination score for oral stimulus episodes--accepted
b. The mean cue discrimination score for film stimulus episodes--accepted
c. The mean cue discrimination score minus the placebo episode--rejected
d. The mean cue discrimination score-- rejected
When the main effects of level and form were used in the analyses of
the four measures associated with the cue discrimination scores no significant
differences were noted. A three-way analysis of variance using form, set,
and E revealed, however, that form and, particularly, E contributed to sig-
nificant differences for the two total test measures (9c and 9d above). The
differences attributable to form made the decision to reject the null
hypothesis for this measure mandatory.
There will be no significant difference between sub-groups in:
10. The mean first response change scores (training to testing)--accepted
a. The mean response change score for similar problem episodes- -
acceptedb. The mean response change score for episodes with similar
standards--acceptedc. The mean response change score--accepted
Three analyses of the hypothesis that there would be no significant
differences in first-response change scores all exhibited non-significant
effects. Therefore, the null hypothesis was accepted.
There will be no significant difference between sub-groups in:
11. The mean change score for cue discrimination (training to testing)--accepted
a. The mean change score for cue discrimination for similar problemepisodes--accepted
b. The mean change score for cue discrimination--accepted
Apparently, training format contributed to no significant differences
in the two mean cue discrimination change scores. The null hypothesis that
such a non-significance would be found was accepted.
78
There will be no significant difference between stio-groups in:
12. The mean attitude score--accezted
An analysis of the attitude assessment scores provided no differences
which were significant. Slight differences were noted; the upperclassmen
professed better attitudes toward their training than did the sophomores
while those students trained with audio-tapes also exhibited a higher attitude
score than did the subjects trained with films. The group which could be
denoted as possessing the strongest positive attitude towards their simulation
training was the juniors trained with audio-tapes. Due to the lack of
statistical significance, though, the hypothesis that no differences in
attitude would result was accepted in its null form.
Conclusions Directed Toward the Control Variables
Two variables were held constant within each cell of the experimental
design (see Table 2). Differences accruing from the effect of episode set
and test E were assumed to be of negligible influence. To test those two
assumptions, 20 analyses were performed to isolate set effects and an equal
number of analyses were performed to examine E effects. The conclusions
derived from those statistical examinations are discussed below.
Set
Because only two of the 20 analyses concerned with the effect of set
revealed any significant differences (or two out of a possible 80 effects)
the assumption that the two groups of episodes could be considered comparable
was retained. However, in those analyses where cue discrimination measures
were examined, the unequal number of cues to be identified may have con-
founded some of those results. Though the assumption of set comparability is
79
still held to be valid, the decision tends to be based as much on speculation
as empirical evidence.
Experimenter
It became painfully apparent that the decision to not include the
possible effect attributable to the test E as an independent variable was
misguided. Sixteen of the 20 analyses revealed either interactive or main
effects influenced by the E factor. How this result influences the
credibility of the data collected for training (involving only one E) is
speculative.
Effectiveness .-Ad Efficiency Conclusions
All of the measures collected for this study were categorized as
either giving information concerning the relative effectiveness or efficiency
of the various training formats. Both of these qualities are presented and
discussed below in light of the conclusions drawn from each factor's con-
stituent hypotheses.
Effectiveness
Seven hypotheses were concerned with effectiveness. The measures
taken for those hypotheses follow:
1. First response score for training
2. Initial cues discriminated during training
3. Response score. for testing
4. Cues discriminated during testing
80

5. First response change score
6. Cue discrimination change score
7. Attitude
The independent variable, training level, had a significant influence
only on the total and total minus the placebo episode response score for
testing (item 3 above). Juniors achieved a significantly higher response
score for testing than did the sophomores or seniors. If the test response
score is defined as a transfer measure (from training to testing) then the
group that tranalerred its acquired response skills most effectively was the
juniors.
Form, the second independent variable, had a significant effect on
the measures for the test response scores (item 3 above) and cue discrimina-
tion scores for training and testing (items 2 and 4 above). Two generali-
zations were drawn as a result of these findings: (1) the group trained with
audio-tapes achieved a higher test response score than did those subjects
trained with Muse and (2) audio-tapes were either more effective in aiding
students to correctly discriminate the cues or the cues may have been more
easily identified.'
For the other measures - -items 1, 5, 6, and 7--neither of the
independent variables caused a statistically significant effect. Stimulus
form and level of elementary education training could not be demonstrated to
influence those four dependent variables to a sufficient degree to warrant
rejecting the null hypothesis corresponding to each.
'The latter point is, certainly, worthy of consideration. For thetest measure, when stimulus form cues to be discriminated were constant forall subjects, those trained with audio-tapes achieved a mean score of 28.50,while the film-trained subjects achieved a comparable score of 28.06 for testcues correctly assessed.
81
Efficiency
Five measures were examined as indices of efficiency in the imple-
mentation of the technique of simulation in a teacher education program.
The listing of those independent variables follows:
1. Incorrect responses for training
2. Stimulus recyclings
3. E prompts for responses
4. E prompts for cue discrimination
5. Elapsed time
Significant effects for the variables, training level and stimulus
form,were more pervasive when the efficiency measures were analyzed. Level
provided main effect influences on the number of incorrect responses given
during training (item 1 above) and the number of E prompts required for the
St to achieve a criterion response (item 3 above). An interactive effect
with form was also revealed in the elapsed time measure (item 5 above) for
the second-half of training. In all three of the above analyses the sophomore
subjects were involved. Sophomores made a greater number of incorrect
responses during the total training. They required more E prompts for
responses during the total training. Sophomore subjects trained with films
and senior subjects trained with films required more training time than did
the other four groups. If any one group can be identified as being most
efficient to train, apparently, it would be the juniors, with the sophomores
least efficient. However, the learning curves presented in Figures 4 and 5
in Chapter IV portray the sophomores as reaching a comparable level in the
number of incorrect responses required for the second-half of training and
the number of E prompts required for the same episodes. The lack of
82

efficiency corresponding to the training of sophomores can be specifically
attributed to only the first 10 episodes, i.e., the first-half of training.
Significant effects for form were noted for the measures identified
as stimulus recyclings (item 2 above), E prompts for cue discrimination (item
4 above), and elapsed time (item 5 above). Interactions were also determined
to be operating for the variables of incorrect responses for training and time
for the second-half of training. In all but one case, subjects trained with
films were less efficient. Audio-tape trained subjects required less stimulus
recyclings, less E prompts to identify the relevant cues during the first-
half as well as the total training, and less time to complete the test.
As was noted above, sophomores and seniors trained with films required more
time to complete the second-half of training. Sophomores trained with films
and seniors trained with tapes reduced their incorrect response scores to a
significantly greater degree than the other four experimental groups (see
Table 2 in Chapter II). In other words, as the training progressed, both
groups became more efficient than they had been at the beginning.
Sumi
Twelve null hypotheses were considered in this study. They are
enumerated below. There was assumed to be no significant difference between
sub-groups in:
1. The mean first response score for training
2. The mean number of incorrect responses_ given during training
3. The mean number of initial cues discriminated during training
4. The mean number of stimulus recycling. to achieve a type A response
5. The mean number of experimenter () prompts for responses
6. The mean number of E prompts necessary to achieve criterion for cuediscrimination
83

7. The mean time for training and testing
8. The mean response score for testing
9. The mean number of cues discriminated for testing
10. The mean first response change scores (training to testing)
11. The mean change score for cue discrimination (training to testing)
12. The mean attitude score
Eight of the 12 hypotheses selected for study were rejected in the
null form--hypotheses 2, 3, 4, 5, 6, 7, 8, and 9. The remaining four were
accepted as proposed--hypotheses 1, 10, 11, and 12. The assumption that
episode set would not influence the findings of this study to a significant
degree was held to be valid while that concerning the test E was found to be
invalid. The independent variables of level and form influenced only three
measures identified as factors of effectiveness. The effect of those
variables (level and form) was most pervasive on those five measures categor-
ized as efficiency indices, i.e., the five hypotheses all revealed differences
attributable to the independent variables.
Implementing these findings in terms of further research and in terms
of program development for teacher education institutions is discussed in
Chapter VI which follows.
84
CHAPTER VI
IMPLICATIONS
Introduction
Simulation has become an important technique in the training of pre-
service teachers. Yet, there are many questions surrounding the relative
effectiveness and efficiency of various types of simulations. The data
collected for this study have been used to isolate two variables for
examination--the influence of the level of elementary education training
coupled with the use of either a visual or aural stimulus presentation. The
conclusions drawn from the analysis of these independent variables (presented
in Chapter V) have several implications for further research as well as for
the use of simulations in teacher education programs. A discussion of these
inferences is presented in the remainder of this chapter.
Research
Certainly, any further research into the use of simulations, particu-
larly studies using the Classroom Management Materials (Kersh, 1963), must
control for E bias. The findings of this study as well as others (Twelker
et al. 1968, pp. 51-52; Kersh, 1965a, p. 52) have been obfuscated by the
effects attributable to E differences. Though the Es in this study trained
together prior to testing and revealed an adequate reliability level on both
measures--response and cue discrimination categorizations--the differences
between the Es became statistically significant during testing. To ensure
85
greater reliability, future studies will need to include periodic and simul-
taneous retraining exercises to control for this fluctuation. What the
optimum interval might be is unknown though training sessions spaced no
further than a week apart might be appropriate.
A question of response assessment techniques still remains unsolved.
If the E bias hinders the ability to draw generalizations from experimental
data then a more reliable technique of assessing the St's ability to cope
with simulated management problems needs to be devised and implemented.
Apparently, the subjectivity which is operating in Kersh's categorization
system (see Appendix F) is detrimental to the development of inductive
conclusions.
Very little programatic effort has been directed toward the develop-
ment of training packages for secondary education pre-service teachers.
Intuitively, it would seem that the interactive patterns of junior high and
high school teacher trainees would not differ markedly in the problems
encountered. Nevertheless, programs developed for the use of secondary
trainees would require further analysis to determine empirically what
simulations as well as level of subject experience can be deemed to be most
expedient to ensure effective learning of classroom management principles.
This study examined only two forms of simulation--films and audio-
tapes. The results indicate differential effects attributable to stimulus
form. No generalizations can be made to other fidelity levels such as case
studies, slide-tape presentations, or role-playing without further experi-
mentation.
Replicatory study is necessary to ensure that sampling error was not
a fault of this study. A larger sample drawn from more than one institution
is a requisite for the establishment of more definitive generalizations.
86
A type of episode identified by Kersh (1963) as a communication
problem seemed to be the most difficult to which to respond appropriately for
all subjects in this study. Of the 10 most difficult training episodes,
nine were classified as communication problems. Only one management problem,
the other categorization of episode type, was ranked in the top 10 as being
most difficult for Sts to generate a type A response. (See Definition of
Terms in Chapter II for the specification of a type A response.) An exami-
nation of the optimal number of times a subject needs to be presented
particular problems to ensure learning is, then, another question for further
study.
No follow-up of the subjects in this study was performed. Such
efforts are needed to determine whether retention is an important variable
to consider in implementing a simulation type at a specified level of
elementary education training.
Programed instruction and, as an outgrowth of programing, computer
assisted instruction might become important vehicles for the training of
specific classroom management behaviors. Inferences drawn from the data
presented in this study provide no barriers to effectiveness. A question
would arise, though, as to the relative effectiveness and efficiency of either
stimulus form (films or audio-tapes) used with any training level without an
E present in the training situation. This problem can only be resolved
empirically.
,Teacher Training
The ability to use a form of programed instruction to train pre-
service teachers would certainly make the use of simulations a more feasible
decision. The data presented here (considering the sampling limitation)
87
would indicate that audio-tape training is more efficient and of comparable
effectiveness when compared to films designed to accomplish the same
objective. Programing difficulties with films would be more extensive than
with tapes. In terms of monetary and man-power limitations, the use of
audio-tapes for training, particularly for programed instruction, should be
considered as a viable alternative to films.
The major handicap with the use of programed instruction may be the
problem of limited reliability in categorizing St responses. If a set of
Es with a great deal of professional experience encounter difficulties in
reliably assessing the response type which is elicited, the St may experience
;en greater difficulty. On the other hand, the St would be better prepared
to assess the intent of his response than an observer. The use of programed
instruction may require pre-training for the Sts and the program developers.
The St may be required to learn to assess and state the intent of his response
while the program developer learns to categorize the assumed effect of that
response and then write an appropriate program for the St to follow.
In light of the limited differential effects categorized as indices
of effectiveness, the development of pilot packages might well be done with
audio-tapes. Training with one stimulus form seemed to provide little
definitive effect, positively or negatively, in the subject's ability to
respond to test simulations presented by either film or audio-tape. No
limitations in transfer as a result of stimulus form were identified.
A marked differential occurred in the training of the three subject
levels. Sophomores were significantly more inefficient to train early in
the program than were the upperclassmen. Institutions preparing teachers may
find it is to their younger students' advantage to provide them with class-
room management training. If the results of such training are similar to
those in this study, the early inefficiency is traded for increased
88
effectiveness, i.e., the underclassmen would become comparable to the upper-
classmen in and responding to simulated classroom problems with a small
increase in training time expenditure. Sophomores tended, during the first-
half of training, to give less adequate responses, to need more attempts to
"discover" an adequate response, to require more E prompts to achieve an
adequate response, and to require more training time. During the second-half
of training, the sophomores achieved scores comparable to those of the
upperclassmen. In the test situation the sophomores even surpassed the
seniors on some measures, i.e., the three test response scores of total
minus the placebo episode score, total response score, and the change score.
Certainly, these data may mean that teacher training institutions will
need to re-evaluate their choice of level in the implementation of instruc-
tional simulations. If institutional efforts did replicate those in this
study, the expenditure of one or two hours of additional training would
prepare sophomores to be as efficient and effective as upperclassmen in
dealing with simulated classroom problems. Such an expenditure may be even
more practical for large institutions where the cost of the acquisition or
production of the simulation materials can be prorated over a greater number
of students.
This study replicated the finding of many others--students enjoy
simulations. The mean attitude score for this study was 75.66 where 45.00
would be construed as a neutral attitude. The lowest single score given by
a St was 60. Due to the accruement of a positive attitude the mere
implementation of a simulation program may be enough to ensure its initial
success as a teaching device.
89
BIBLIOGRAPHY
Abt, Clark. An address given to the Man- Machine Conference in Portland,Oregon, November 26, 1966.
Allen, Dwight W. and Richard E. Gross. "Microteaching--A New Beginning forBeginners," NEA Journal, Vol. LV, No. 9 (December, 1965), 25-26.
Anderson, Lee F., Margaret G. Hermann, James A. Robinson and Richard C.Snyder. A Com arison of Simulation, Case Studies, and Problem Papers inTeaching Decision-Making, C.R.P., No. 1568. Evanston, Illinois:Northwestern University, 1964.
Beaird, James H. and John T. Standish. Audio Simulation in CounselorTraining, Final report, Title VII, Project No. 1245, NDEA of 1958, GrantNo. 7-47-0000-235, (December, 1964).
Blocher, Donald H. Developmental Counseling. New York: The Ronald PressCompany, 1966.
Bond, Jack H. Using Simulation Techniques to Change Attitudes of EducationMaiors Toward Professional Course Objectives, Final report, Title VII,Project No. 1247, NDEA of 1958, Grant No. OE-7-47-000-239, (July, 1965).
Campeau, Peggie L. "Selective Review of Literature on Audio-Visual Media ofInstruction," Instructional Media. Edited by Leslie J. Briggs, et al.Pittsburgh: American Institutes for Research, 1967, 99-146.
Chabassol, David J. "The Possession of Certain Attitudes as Predictors ofSuccess in Practice Teaching," Journal of Educational Research, Vol. LXI,No. 7 (March, 1968), 304-306.
Cherryholmes, Cleo. "Simulation in Teaching International Relations," PhiDelta Klippen, Vol. XLVI, No. 5 (January, 1965), 227-231.
Cherryholmes, Cleo. "Some Current Research on Effectiveness of EducationalSimulations: Implications for Alternative Strategies," The AmericanBehavioral Scientist, (October, 1966), 4-7.
Coleman, James S. "Learning Through Games," NEA Journal, Vol. LXI, (January,1967), 69-70.
Crawford, Meredith P. Dimensions of Simulation, Professional paper 5-66.Alexandria, Virginia: The George Washington University, Human ResourcesResearch Office, October, 1966.
90
Cruickshank, Donald R. "Simulation: New Direction in Teacher Preparation,"Phi Delta Kaman, Vol. XLVIII, No. 1 (September, 1966), 23-24,
Cruickshank, Donald Rt and Prank W. Broadbent. An Investigation to DetermineEffects of Simulation Training on Student Teaching Behavior. Bureau ofEducational Research and Service, College of Education, University ofTennessee, Knoxville, Tennessee, 1968,
D'Amico, Louis A. ."Characteristics of ITTP Teachers and Some Pupil BehaviorProblems They Encountered Their First Year of Teaching," EducationalAdministration and Suglailian, Vol. LXVI, No. 1 (January, 1960
Denemark, George W. and James B. MacDonald. "Preservice and In-ServiceEducation of Teachers," Review of Educational Research, Vol. XXXVIII,No. 3 (June, 1967), 233-247,
Dumas, Wayne. "Factors Associated with Self-Concept Change in StudentTeachers," The Journal of Educational Research, Vol. LXII, No. 6(February, 1969), 275-278.
Edwards, Allen L. Techniques of Attitude Scale Construction. New York:Appleton-Century-Crofts, Inc., 1957,
Entwisle, Doris R. and W. H. Huggins. "Simulated Environments in HigherEducation," School Review, Vol. LXXV, No. 4 (Winter, 1967), 378-391.
Entwisle, G. and Doris R. Entwisle. "The Use of a Digital Computer as aTeaching Machine," Journal of Medical Education, Vol. XXXVIII, 1963,803-812.
Garvey, Dale M. "Simulation, Roleplaying and Sociodrama in the SocialStudies," The Emporia State Research Studies, No. 16 (December, 1967).
Guetzkow, Harold. Simulation in Social Science: Readings. EnglewoodCliffs, New Jersey: Prentice Hall, Inc., 1962,
Hershey, Gerald L., Loraine V. Shepherd and John D. Krumboltz. "Effective-ness of Classroom Observation and Simulated Teaching in an IntroductoryEducational Psychology Course," Journal of Educational Research, Vol.LVIII, No. 5 (January, 1965), 233-236,
Hoy, Wayne K. "Organizational Socialization: The Student Teacher and PupilControl Ideology," Journal of Educational Research, Vol. LXI, No. 4(December, 1967), 153-155.
Ishler, Richard Eves. "An Experimental Study Using Withall's Social-Emotional Climate Index to Determine the Effectiveness of Feedback as aMeans of Changing Student Teachers' Verbal Behavior," Journal ofEducational Research, Vol. LXI, No. 3 (November, 1967), 121-123.
Kaplan, Louis. "The Annoyances of Elementary School Teachers," Journal ofEducational Research, Vol. XLV, No. 9 (May, 1952), 649 -665.
91

Kersh, Bert Y. Appendices to Final Reports: Classroom Simulation: FurtherStudies on Dimensions of Realism, Final report, Title VII, Project No.5-0848, NDEA of 1958, (December, 1965a).
Kersh, Bert Y. Classroom Simulation: A New Dimension in Teacher Education,Teaching Research Division, Title VII, NDEA, Project No. 886, 1963.
Kersh, Bert Y. Classroom Simulation: A New Dimension in Teacher Education,Teaching Research Division, Oregon State System of Higher Education,Title VII, NDEA, Project No. 886, 1965b.
Kersh, Bert Y. Classroom Simulation: Further Studies on Dimensions ofRealism, Final report, Title 'III, Project No. 5-0848, NDEA of 1958,Grant No. 747-0000-228, (December, 1965c).
Lambert, Sam M. "Beginning Teachers and Their Education," The Journal of.0-Teacher Education, Vol. VII, No. 4 (December, 1956), 347-351.
Lindquist, E. F. Design and Analysis of Experiments in Education andPsychology. New York: Houghton Miffling Company, 1953.
Lumsdaine, A. A. "Instruments and Media of Instruction," Handbook ofResearch on Teaching. Edited by N. L. Gage, AERA. Chicago: Rand McNallyand Company, 1963, 583-682.
Lynch, William W., Jr. "Person Perception: Its Role in Teaching," IndianaUniversity School of Education Bulletin, Vol. XXXVII, No. 6 (November,1961), 1-47.
Massialas, Byron G. and Benjamin C. Cox. Inquiry in Social Studies. NewYork: McGrav-Hill Book Company, 1966.
Miller, Gerald W. An Attempt to Determine Certain Effects of Laboratory,Classroom Simulation Training on Selected Dimensions of Teacher Behavior,(Unpublished doctoral dissertation, University of Oregon, August, 1967).
Ramey, James W. "Using Video Tape Simulation To Make a Workshop Work," PhiDelta Kappan, Vol. XLIX, No. 9 (May, 1968), 525-527.
Robinson, James A. "Simulation and Games," The Nes/Media and Education.Edited by Peter H. Rossi and Bruce J. Biddle. Chicago: AldinePublishing Co., 1966, 85-123.
Ryan, Antoinette J. "Use of Simulation to Increase Transfer," School Review,Vol. WWI, No. 2 (June, 1968), 246-252.
"Simulation and Gaming: A Symposium," AMA Report, No. 55. New York:American Management Association, Inc., 1961.
Steward, Edward C. Simulation Exercises in Area Training, Professional paper39-37. Alexandria, Virginia: The George Washington University, HumanResources Research Office, (September, 1967).
92

Swineford, Edwin J. "Discipline: A Basic Problem of the Beginning Teacher,"The Clearing House, Vol. XXXVI, No. 6 (February, 1962), 350-352.
"Teacher Opinion Poll," NEA Journal, Vol. LIII, No. 6 (September, 1964), 25.
Turner, Richard L. and Nicholas A. Fattu. "Skill in Teaching,A Reappraisalof the Concepts and Strategies in Teacher Effectiveness Research,"Bulletin of the School of Education, Vol. XXXVI, No. 3, Bloomington,Indiana, Indiana University, (May, 1960).
Twelker, Paul A. "Classroom Simulation," Instructional Simulation Newsletter,Vol. II, No. 2 (June, 1969), 7-12.
Twelker, Paul A. "Classroom Simulation and Teacher Preparation," The SchoolReview, Vol. LXXV, No. 2 (Summer, 1967), 197-204.
Twelker, Paul A. Prompting as an Instructional Variable in Classroom Sim-ulation, Final report, Title VII, Project No. 5-0950, NDEA of 1958,Grant No. 7-47-9015-276, (April, 1966a).
Twelker, Paul A. "Simulation Applications in Teacher Education," Paperpresented at the American Educational Research Association as part of thesymposium, Laboratory Simulation: New Developments in Instruction andResearch, Chicago, February, 1966b. (Mimeographed)
Twelker, Paul A. "Simulation: What is it? Why is it?," Paper presented atthe conference, Simulation: Stimulation for Learning, sponsored by theCommission on Educational Media of the Association for Supervision andCurriculum Development, NEA, San Diego, April, 1968.
Twelker, Paul A., Jack Crawford and Karl J. Wallen, eds. Of Men and Machines:A Supplementary Guide. Teaching Research, Oregon State System of HigherEducation, (November, 1967).
Twelker, Paul A., Bert Y. Kersh and John R. Pyper. Successive vs. Simul-taneous Attainment of Instructional Objectives in Classroom Simulation,Final report, Title VII, Project No. 5-0774, NDEA of 1958, Grant No.0E-7-47-9015-283, (December, 1968).
Utsey, Jordan, Carl Wallen, and H. O. Beldin. "Simulation: A Breakthrough
in the Education of Reading Teachers," Phi Delta Kappan, Vol. XLVII,
(June, 1966), 572-574.
Vlcek, Charles W. Assessing the Effect and Transfer Value of a ClassroomSimulator Technique, Michigan State University. Title VII, NDEA, GrantNo. 7-32-0410-264. (Ed. D. Dissertation project, 1965.)
Wallen, Karl J. Low Cost Instructional Simulation Materials for TeacherEducation, Interim report, Title VII, Project No. 5-0916, NDEA of 1958,Contract No. 0E-6-10-277, (January, 1968).
Weinberger, Morris J. "The Use of Simulation in the Teaching of SchoolAdministration," (Unpublished doctoral dissertation, Teachers College,Columbia University, 1965.)
93
Wert, James E., Charles O. Neidt, and J. Stanley ahmann. Statistical Methodsin Educational and Psychological Research. New York: Appleton-Century-Crofts, Inc., 1954.
Vey, Herbert W. "Why Do Beginning Teachers Fail?," National Association ofSecondary School Principals Bulletin, Vol. XXIV, No. 180 (October, 1951),55-62.
Zahorik, John A. "Classroom Feedback Behaviors of Teachers," Journal ofEducational Research, Vol. LXII, No. 4 (December, 1968), 147-150.
94
APPENDIX A
ANALYSIS OF VARIANCE SUMMARY TABLESFOR SELECTED HYPOTHESES AND
CONTROL VARIABLES
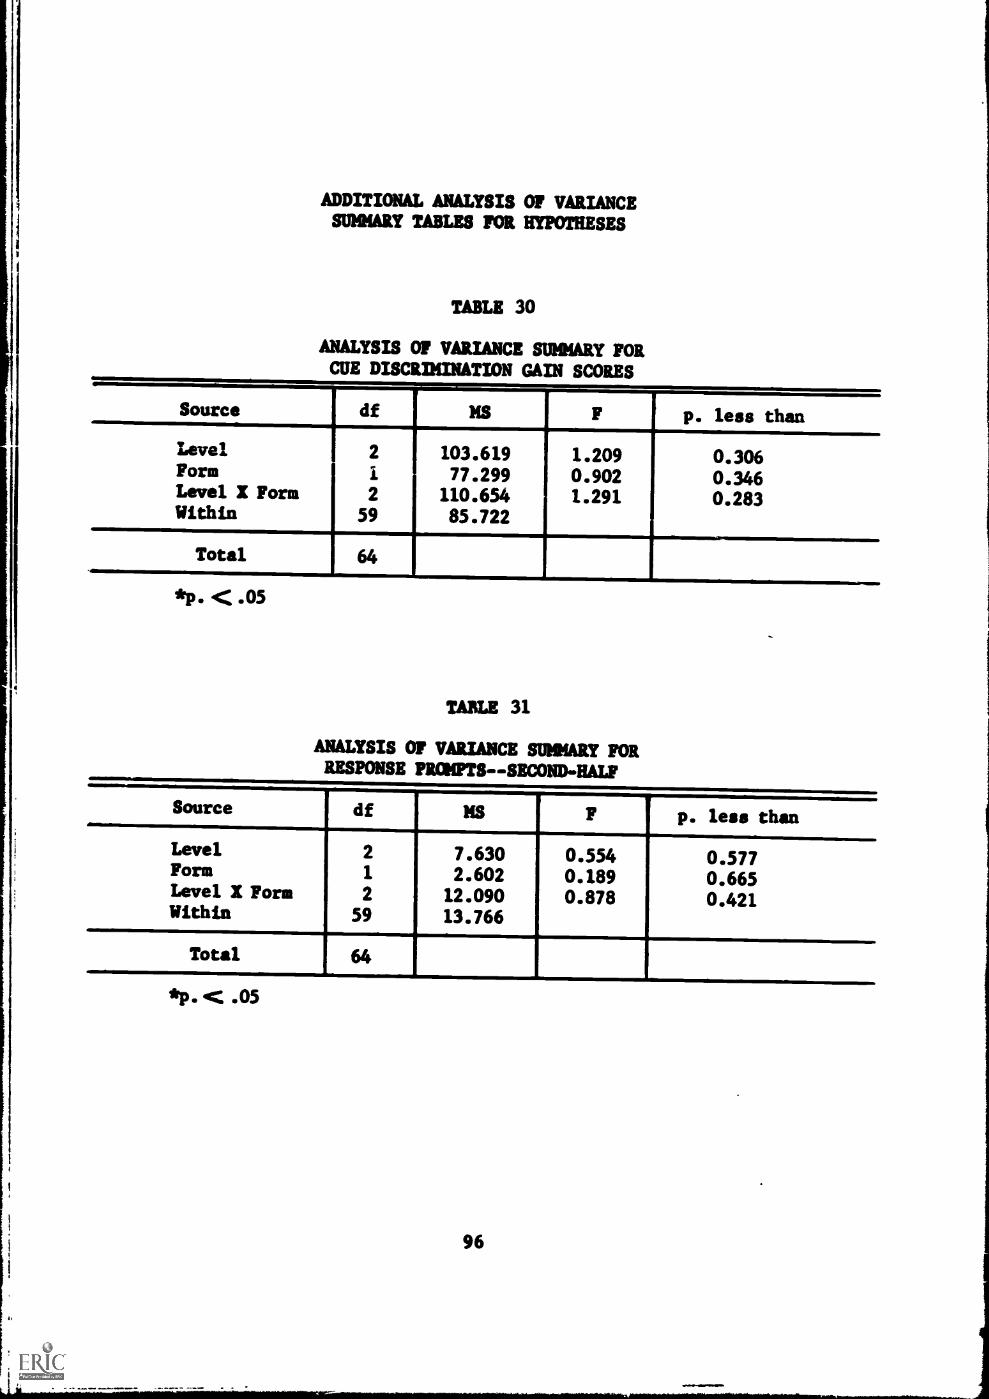
ADDITIONAL ANALYSIS OF VARIANCESUMMARY TABLES FOR HYPOTHESES
TABLE 30
ANALYSIS OF VARIANCE SUMMARY FORCUE DISCRIMINATION GAIN SCORES
Source df MS F p. leas thanLevel 2 103.619 1.209 0.306Form 1 77.299 0.902 0.346Level X Form 2 110.654 1.291 0.283Within 59 85.722
Total 64
*p. < .05
TABLE 31
ANALYSIS OF VARIANCE SUMMARY FORRESPONSE PROMPTSSECOND-HALF
Source df MS F p. leaf thanLevel 2 7.630 0.554 0.577Form 1 2.602 0.189 0.665Level X Form 2 12.090 0.878 0.421Within 59 13.766
,.
Total 64
*p. C .05
96

TABLE 32
ANALYSIS OF VARIANCE SUMMARY FORRESPONSE PROMPTS--TOTAL TRAINING
Source df MS F p. less than
Level 2 108.023 2.875 0.064Form 1 9.045 0.241 0.625Level X Form 2 17.950 0.478 0.623Within 59 37.568
Total 64
*p. < .05
TABLE 33
ANALYSIS OF VARIANCE SUMMARY FORRESPONSE PROMPT REDUCTION SCORES
Source df MS F p. less than, .
Level 2 118.039 2.225 0.117Form 1 14.886 0.281 0.598Level X Form 2 15.375 0.290 0.749Within 59 53.039
Total 64
*p. < .05
TABLE 34
ANALYSIS OF VARIANCE SUMMARY FOR CUEDISCRIMINATION PROMPTS--SECOND-HALF
Source df MS F p. less than
Level 2 1.052 0.225 0.799Form 1 12.401 2.648 0.109Level X Form 2 3.476 0.742 0.480Within 59 4.684
Total 64
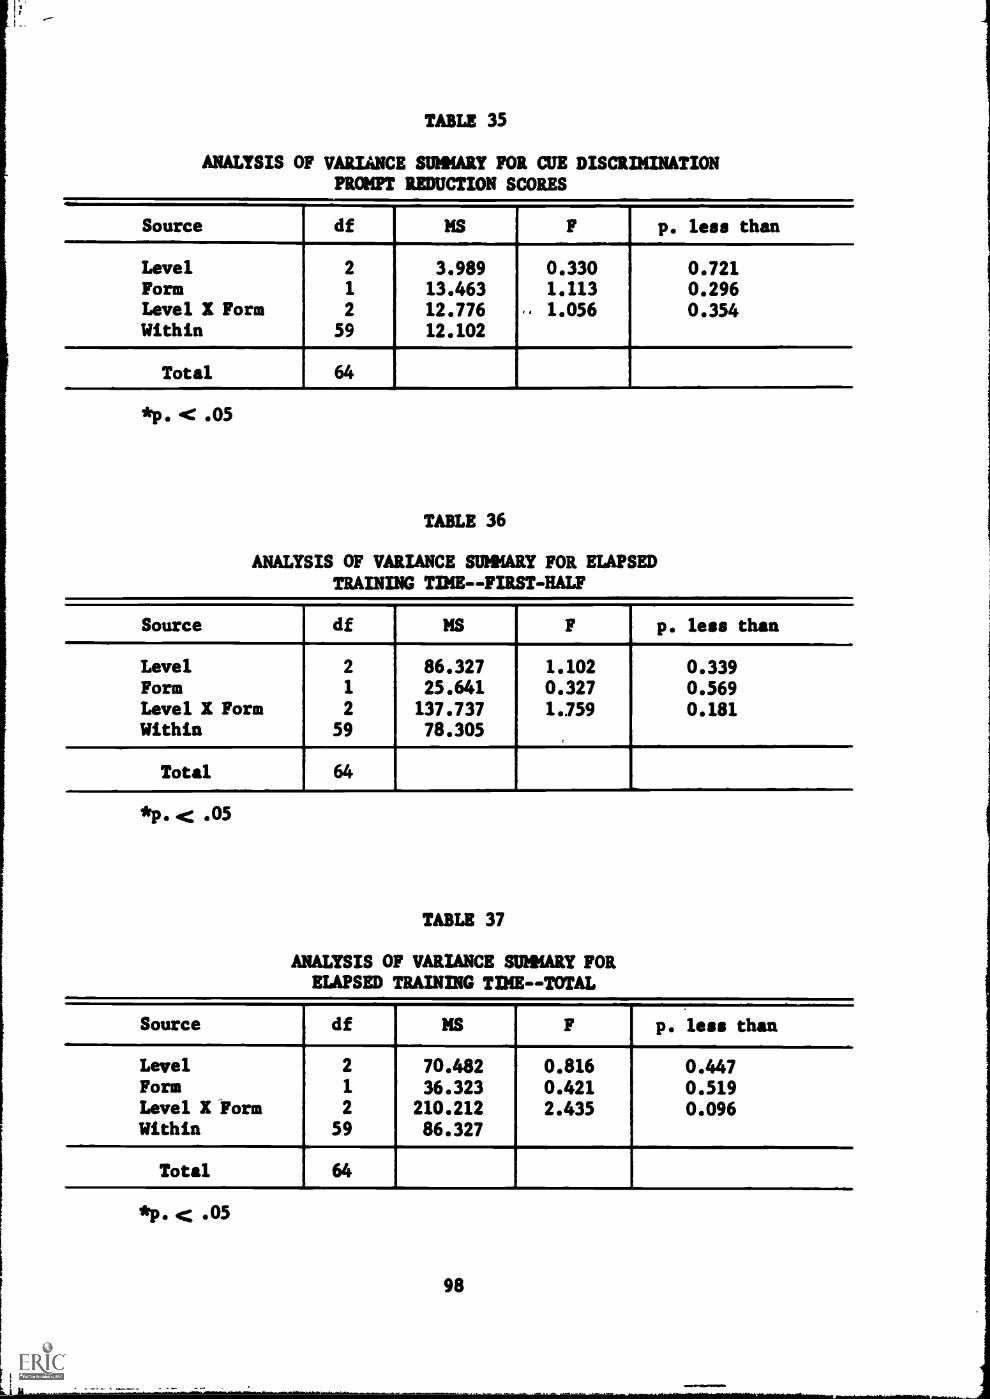
TABLE 35
ANALYSIS OF VARIANCE SUMMARY FOR CUE DISCRIMINATIONPROMPT REDUCTION SCORES
Source df MS F p. less than
Level 2 3.989 0.330 0.721Form 1 13.463 1.113 0.296Level X Form 2 12.776 - 1.056 0.354Within 59 12.102
. ,
Total 64
*p. < .05
TABLE 36
ANALYSIS OF VARIANCE SUMMARY FOR ELAPSEDTRAINING TIMEFIRST-HALF
Source df MS F p. less than
Level 2 86.327 1.102 0.339Form 1 25.641 0.327 0.569Level X Form 2 137.737 1.759 0.181Within 59 78.305
Total 64
*p. < .05
TABLE 37
ANALYSIS OF VARIANCE SUMMARY FORELAPSED TRAINING TIME- -TOTAL
Source df MS F p. less than, .
Level 2 70.482 0.816 0.447Form 1 36.323 0.421 0.519Level X Form 2 210.212 2.435 0.096Within 59 86.327
Total 64
98
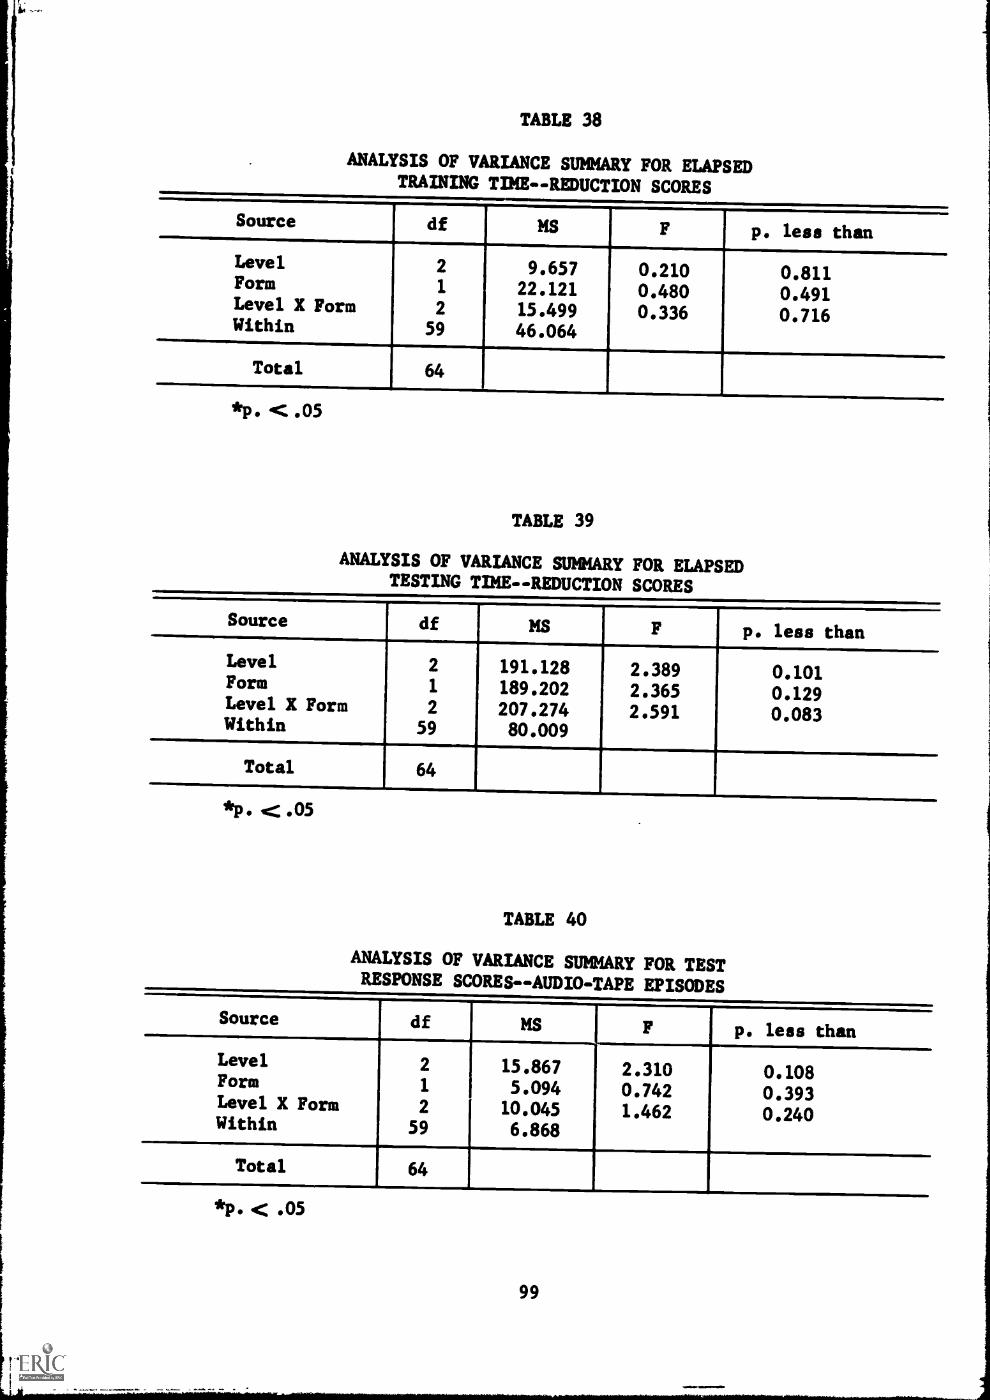
TABLE 38
ANALYSIS OF VARIANCE SUMMARY FOR ELAPSEDTRAINING TIME-- REDUCTION SCORES
Source df MS F p. less than
Level 2 9.657 0.210 0.811Form 1 22.121 0.480 0.491Level X Form 2 15.499 0.336 0.716Within 59 46.064
Total 64
*p. < .05
TABLE 39
ANALYSIS OF VARIANCE SUMMARY FOR ELAPSEDTESTING TIME-- REDUCTION SCORES
Source df MS F p. less than
Level 2 191.128 2.389 0.101Form 1 189.202 2.365 0.129Level X Form 2 207.274 2.591 0.083Within 59 80.009
Total 64
*p. <.05
TABLE 40
ANALYSIS OF VARIANCE SUMMARY FOR TESTRESPONSE SCORES- -AUDIO -TAPE EPISODES
Source df MS F p. less than
Level 2 15.867 2.310 0.108Form 1 5.094 0.742 0.393Level X Form 2 10.045 1.462 0.240Within 59 6.868
Total 641
*p. < .05
99
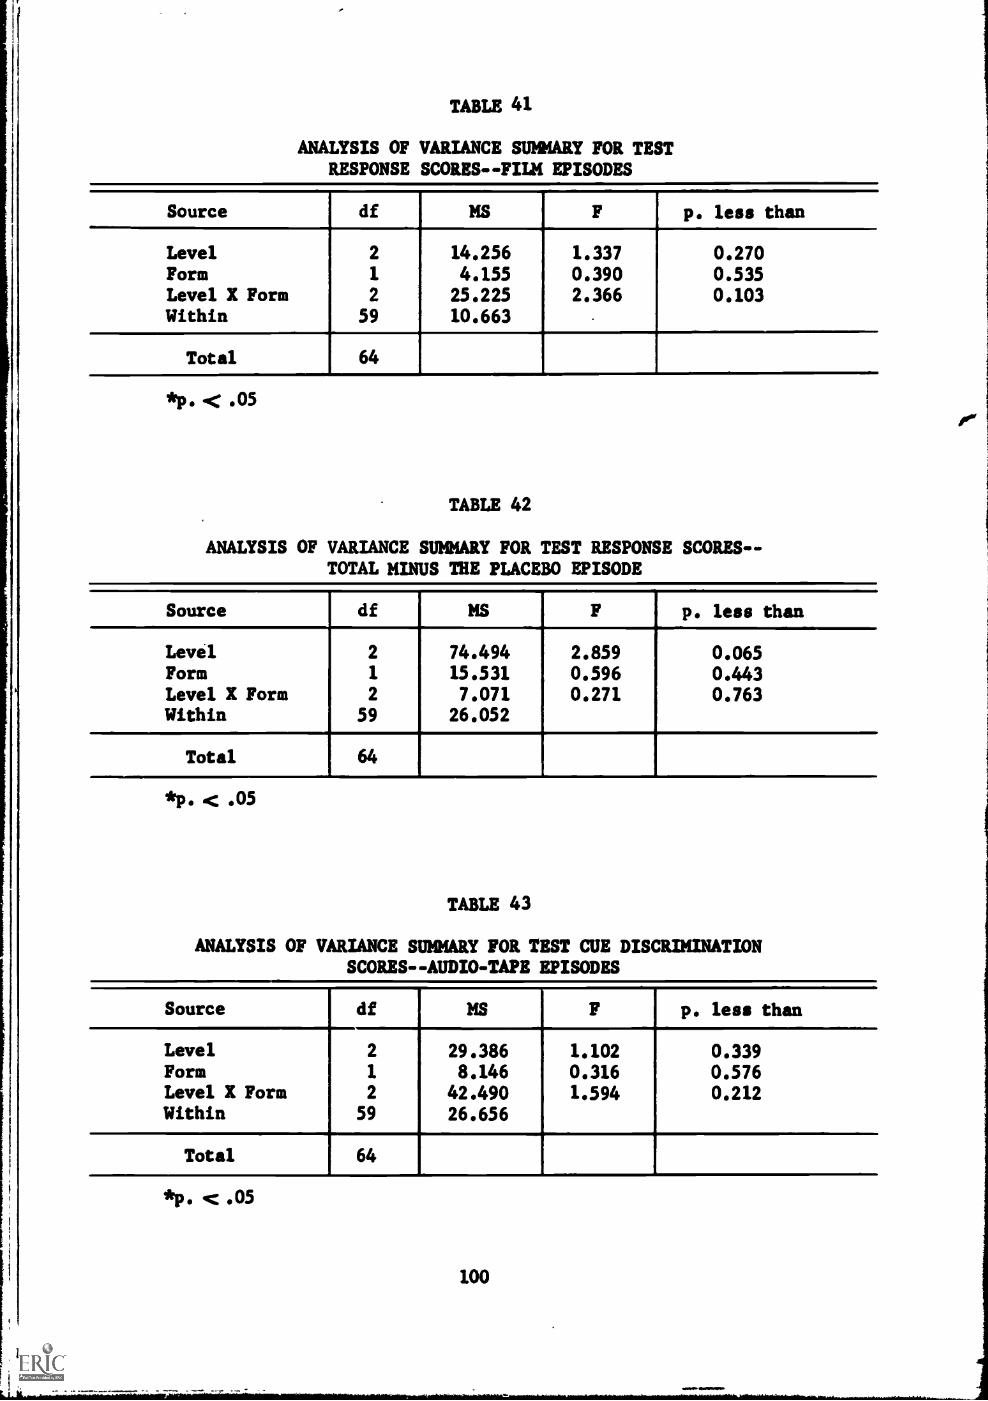
TABLE 41
ANALYSIS OF VARIANCE SUMMARY FOR TESTRESPONSE SCORES--FILM EPISODES
Source df MS F p. less than. ,
Level 2 14.256 1.337 0.270Form 1 4.155 0.390 0.535Level X Form 2 25.225 2.366 0.103Within 59 10.663
Total 64
*p. < .05
TABLE 42
ANALYSIS OF VARIANCE SUMMARY FOR TEST RESPONSE SCORES- -TOTAL MINUS THE PLACEBO EPISODE
Source df MS F p. less than
Level 2 74.494 2.859 0.065Form 1 15.531 0.596 0.443Level X Form 2 7.071 0.271 0.763Within 59 26.052
Total 64
*p. < .05
TABLE 43
ANALYSIS OF VARIANCE SUMMARY FOR TEST CUE DISCRIMINATIONSCORES--AUDIO-TAPE EPISODES
Source df MS F p. less than
Level 2 29.386 1.102 0.339Form 1 8.146 0.316 0.576Level X Form 2 42.490 1.594 0.212Within 59 26.656
Total 64
*p. < .05
100
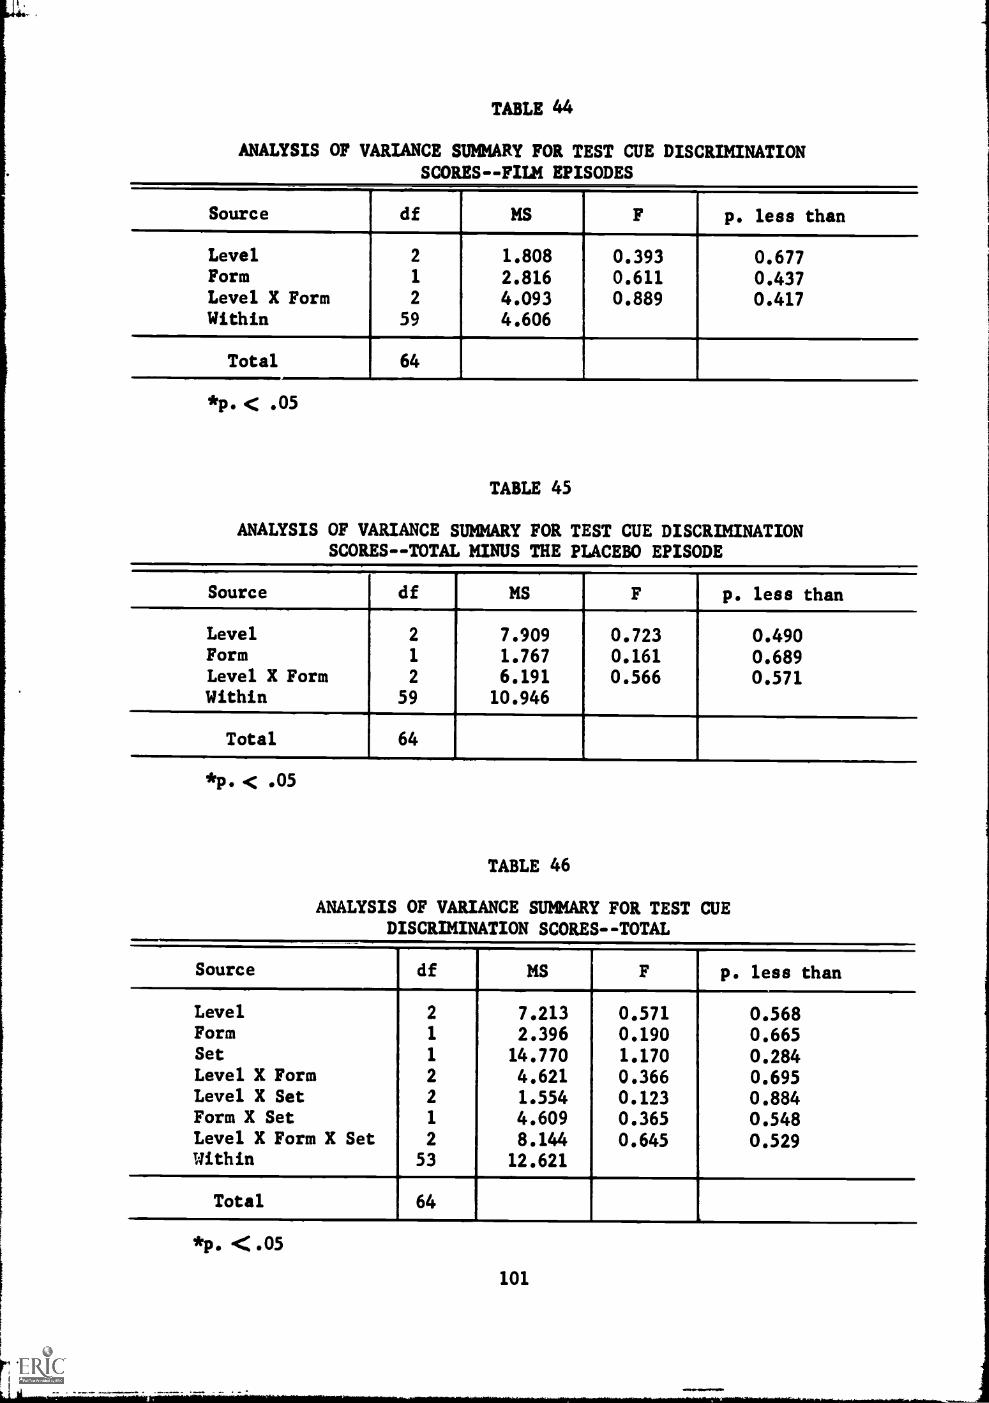
TABLE 44
ANALYSIS OF VARIANCE SUMMARY FOR TEST CUE DISCRIMINATIONSCORES-FILM EPISODES
Source df MS F p. less than
Level 2 1.808 0.393 0.677Form 1 2.816 0.611 0.437Level X Form 2 4.093 0.889 0.417Within 59 4.606
Total 64
*p. < .05
TABLE 45
ANALYSIS OF VARIANCE SUMMARY FOR TEST CUE DISCRIMINATIONSCORES--TOTAL MINUS THE PLACEBO EPISODE
Source df MS F p. less than
Level 2 7.909 0.723 0.490Form 1 1.767 0.161 0.689Level X Form 2 6.191 0.566 0.571Within 59 10.946
-.
Total 64
*P < .05
TABLE 46
ANALYSIS OF VARIANCE SUMMARY FOR TEST CUEDISCRIMINATION SCORES--TOTAL
Source df MS F p. less than
Level 2 7.213 0.571 0.568Form 1 2.396 0.190 0.665Set 1 14.770 1.170 0.284Level X Form 2 4.621 0.366 0.695Level X Set 2 1.554 0.123 0.884Form X Set 1 4.609 0.365 0.548Level X Form X Set 2 8.144 0.645 0.529Within 53 12.621
Total
-
64
*p. <.05101

TABLE 47
ANALYSIS OF VARIANCE SUMMARY FOR RESPONSE CHANGESCORES -- SIMILAR PROBLEM EPISODES
Source df MS F p. less than
Level 2 3.283 0.333 0.718Form 1 2.621 0.266 0.608Level X Form 2 4.093 0.416 0.662Within 59 9.845
Total 64
*p. < .05
TABLE 48
ANALYSIS OF VARIANCE SUMMARY FOR RESPONSE CHANGE SCORES--SIMILAR STANDARD EPISODES
Source df MS F p. less than
Level 2 3.502 0.695 0.503Form 1 4.702 0.933 0.338Level X Form 2 6.036 1.198 0.309Within 59 5.038
Total 64
*p. < .05
TABLE 49
ANALYSIS OF VARIANCE SUMMARY FOR RESPONSECHANGE SCORES--TOTAL
Source df MS F p. less than
Level 2 83.505 2.094 0.132Form 1 13.725 0.344 0.560Level X Form 2 45.155 1.133 0.329Within 59 39.871
Total 64
*p. < .05
102

TABLE 50
ANALYSIS OF VARIANCE SUMMARY FOR CUE DISCRIMINATION CHANGESCORESSIMILAR PROBLEM EPISODES
Source df MS F p. less than
Level 2 0.376 0.110 0.896
Form 1 1.247 0.365 0.548
Level X Form 2 0.581 0.170 0.844
Within 59 3.414
Total 64
*p. < .05
TABLE 51
ANALYSIS OF VARIANCE SUMMARY FOR CUE DISCRIMINATIONCHANGE SCORES--TOTAL
Source.
df MS F p. less than
Level
,
2 0.393 0.018
.
0.983
Form 1 38.416 1.721 0.195
Level X Form 2 14.859 0.666 0.518
Within 59 22.320
Total 64
*p. < .05
TABLE 52
ANALYSIS OF VARIANCE SUMMARYFOR ATTITUDE SCORES
Source df MS F p. less than
Level 2 106.219 0.921 0.404
Form 1 60.829 0.528 0.470
Level X Form 2 86.079 0.747 0.478
Within 59 115.273
Total 64
*p. < .05
103
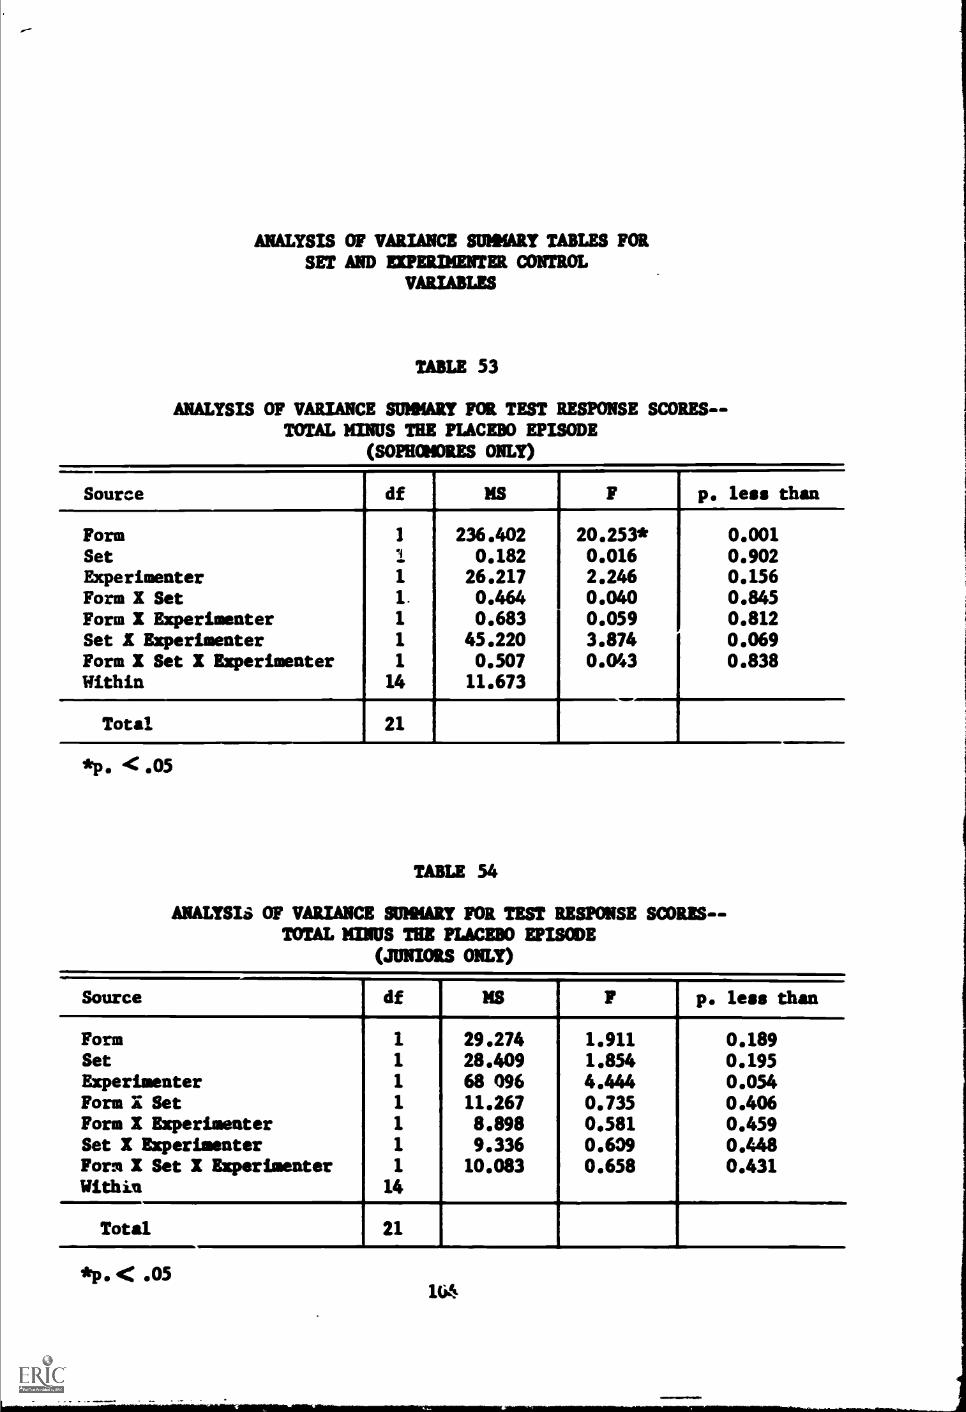
ANALYSIS OF VARIANCE SUMMARY TABLES FORSET AND EXPERIMENTER CONTROL
VARIABLES
TABLE 53
ANALYSIS OF VARIANCE SUMMARY FOR TEST RESPONSE SCORES- -TOTAL MINUS THE PLACEBO EPISODE
(SOPHOMORES ONLY)
Source df MS F p, less than
Form 1 236.402 20.253* 0.001Set 1 0.182 0.016 0.902Experimenter 1 26.217 2.246 0.156Form X Set 1. 0.464 0.040 0.845Form X Experimenter 1 0.683 0.059 0.812Set X Experimenter 1 45.220 3.874 0.069Form X Set X Experimenter 1 0.507 0.043 0.838Within 14 11.673
Total 21
*p. < .05
TABLE 54
ANALYSIS OF VARIANCE SUMMARY FOR TEST RESPONSE SCORES- -TOTAL MINUS THE PLACEBO EPISODE
(JUNIORS ONLY)
Source df MS F p. less than. ,
Form 1 29.274 1.911 0.189Set 1 28.409 1.854 0.195Experimenter 1 68 096 4.444 0.054Form X Set 1 11.267 0.735 0.406Form X Experimenter 1 8.898 0.581 0.459Set X Experimenter 1 9.336 0.609 0.448Form X Set X Experimenter 1 10.083 0.658 0.431Within 14
Total 21
*p. < .0516

TABLE 55
ANALYSIS OF VARIANCE SUMMARY FOR TEST RESPONSE SCORES- -TOTAL MINUS THE PLACEBO EPISODE
(SENIORS ONLY)-
Source df
,
MS F p. less than-
Form 1 248.950 10.839* 0.006Set 1 1.082 0.047 0.832Experimenter 1 90.730 3.950 0.068Form X Set 1 3.463 0.151 0.704Form X Experimenter 1 40.749 1.774 0.206Set X Experimenter 1 17.536 0.764 0.398Form X Set X Experimenter 1 12.715 0.554 0.470Within 13 22.968
Total 20
*p. < .05
TABLE 56
ANALYSIS OF VARIANCE SUMMARY FOR TEST RESPONSE SCORES--TOTAL MINUS THE PLACEBO EPISODE
(ALL SUBJECTS)
Source df MS F p. less than
Form 1 438.764 25.308* 0.001Set 1 16.899 0.975 0.328Experimenter 1 206.154 11.891* 0.001Form X Set 1 0.121 0.007 0.934Form X Experimenter 1 13.813 0.797 0.376Set X Experimenter 1 50.907 2.936 0.092Form X Set X Experimenter 1 0.900 0.052 0.821Within 57 17,337
Total 64
*p. < .05
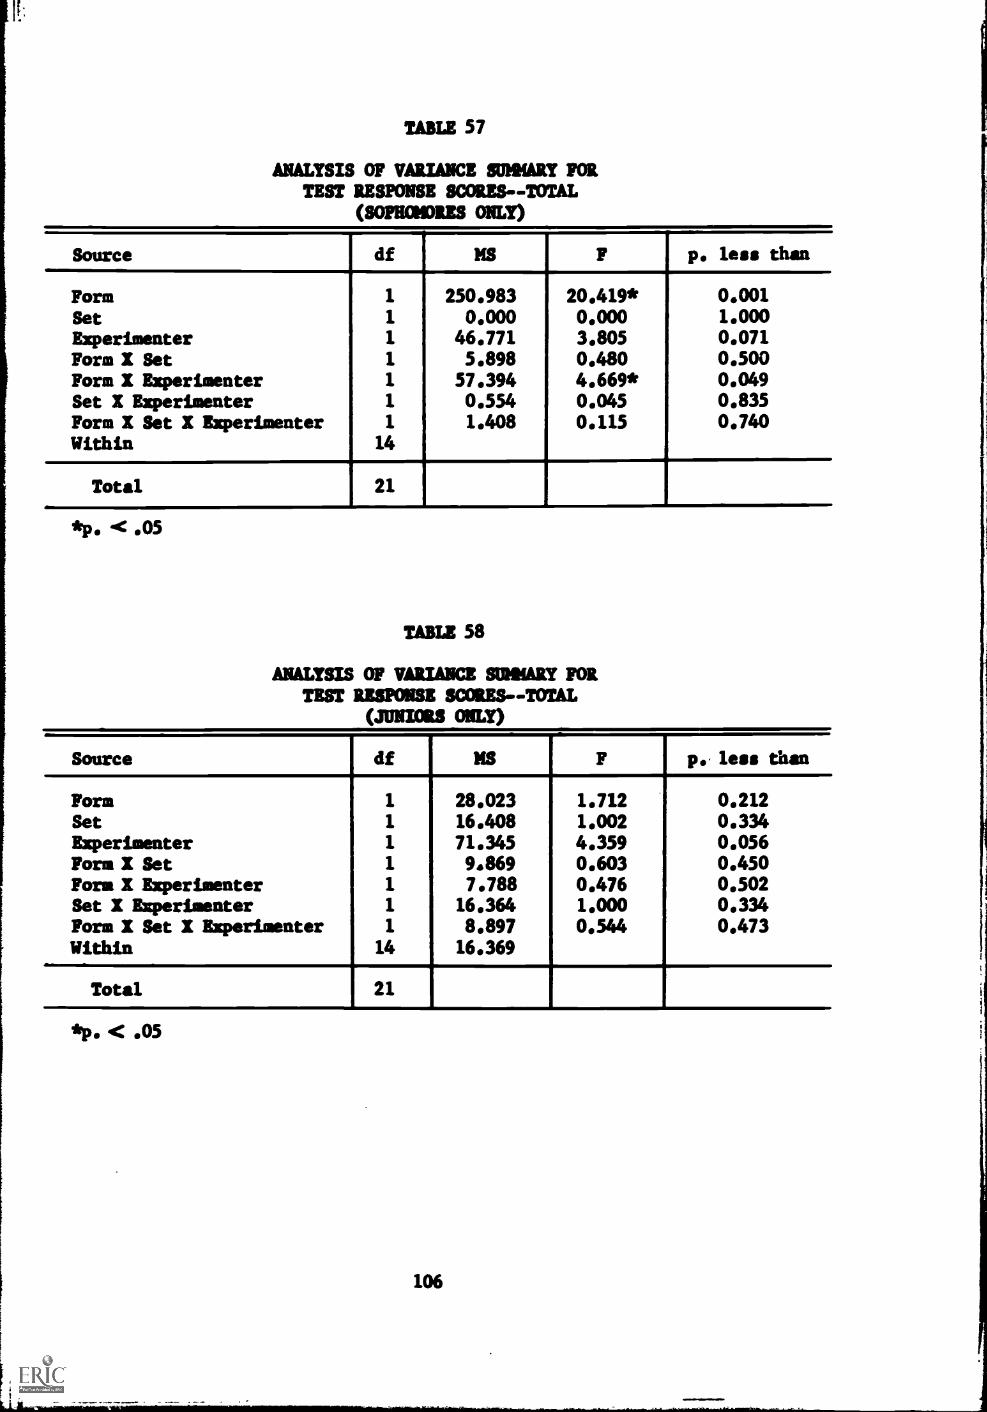
TABLE 57
ANALYSIS OF VARIANCE SUMMARY FORTEST RESPONSE SCORES--TOTAL
(SOPHOMORES ONLY).
Source df MS F p. less than
Form 1 250.983 20.419* 0.001
Set 1 0.000 0.000 1.000Experimenter 1 46.771 3.805 0.071
Form X Set 1 5.898 0.480 0.500Form X Experimenter 1 57.394 4.669* 0.049Set X Experimenter 1 0.554 0.045 0.835Form X Set X Experimenter 1 1.408 0.115 0.740Within 14
Total 21
*p. < .05
TABLE 58
ANALYSIS OF VARIANCE SUMMARY FORTEST RESPONSE SCORES--TOTAL
(JUNIORS ONLY)
Source df MS F p., less than
Form 1 28.023 1.712 0.212Set 1 16.408 1.002 0.334Experimenter 1 71.345 4.359 0.056Fora X Set 1 9.869 0.603 0.450Form X Experimenter 1 7.788 0.476 0.502Set X Experimenter 1 16.364 1.000 0.334Form X Set X Experimenter 1 8.897 0.544 0.473Within
,14 16.369
Total
.
21
*p. < .05
106

TABLE 59
ANALYSIS OF VARIANCE SUMMARY FORTEST RESPONSE SCORES - -TOTAL
(SENIORS ONLY)
Source df MS F p. less than
Form 1 244.408 11.375* 0.005
Set 1 4.243 0.197 0.664
Experimenter 1 115.744 5.387* 0.037
Form X Set 1 4.286 0.199 0.662
Form X Experimenter 1 35.725 1.663 0.220
Set X Experimenter 1 11.609 0.540 0.475
Form X Set X Experimenter 1 11.791 0.549 0.472
Within 13 21.487. ,
Total 20
*p. .05
TABLE 60
ANALYSIS OF VARIANCE SUMMARY FORTEST RESPONSE SCORES - -TOTAL
(ALL SUBJECTS)
Source df MS F p. less than
Form 1
-
440.480 25.359* 0.001
Set 1 13.510 0.778 0.382
Experimenter 1 262.352 15.104* 0.001
Form X Set 1 3.069 0.177 0.676
Form X Experimenter 1 12.752 0.734 0.395
Set X Experimenter 1 59.547 3.428 0.069
Form X Set X Experimenter 1 1.342 0.077 0.782
Within 57 17.370
Total 64
*p. < .05
107
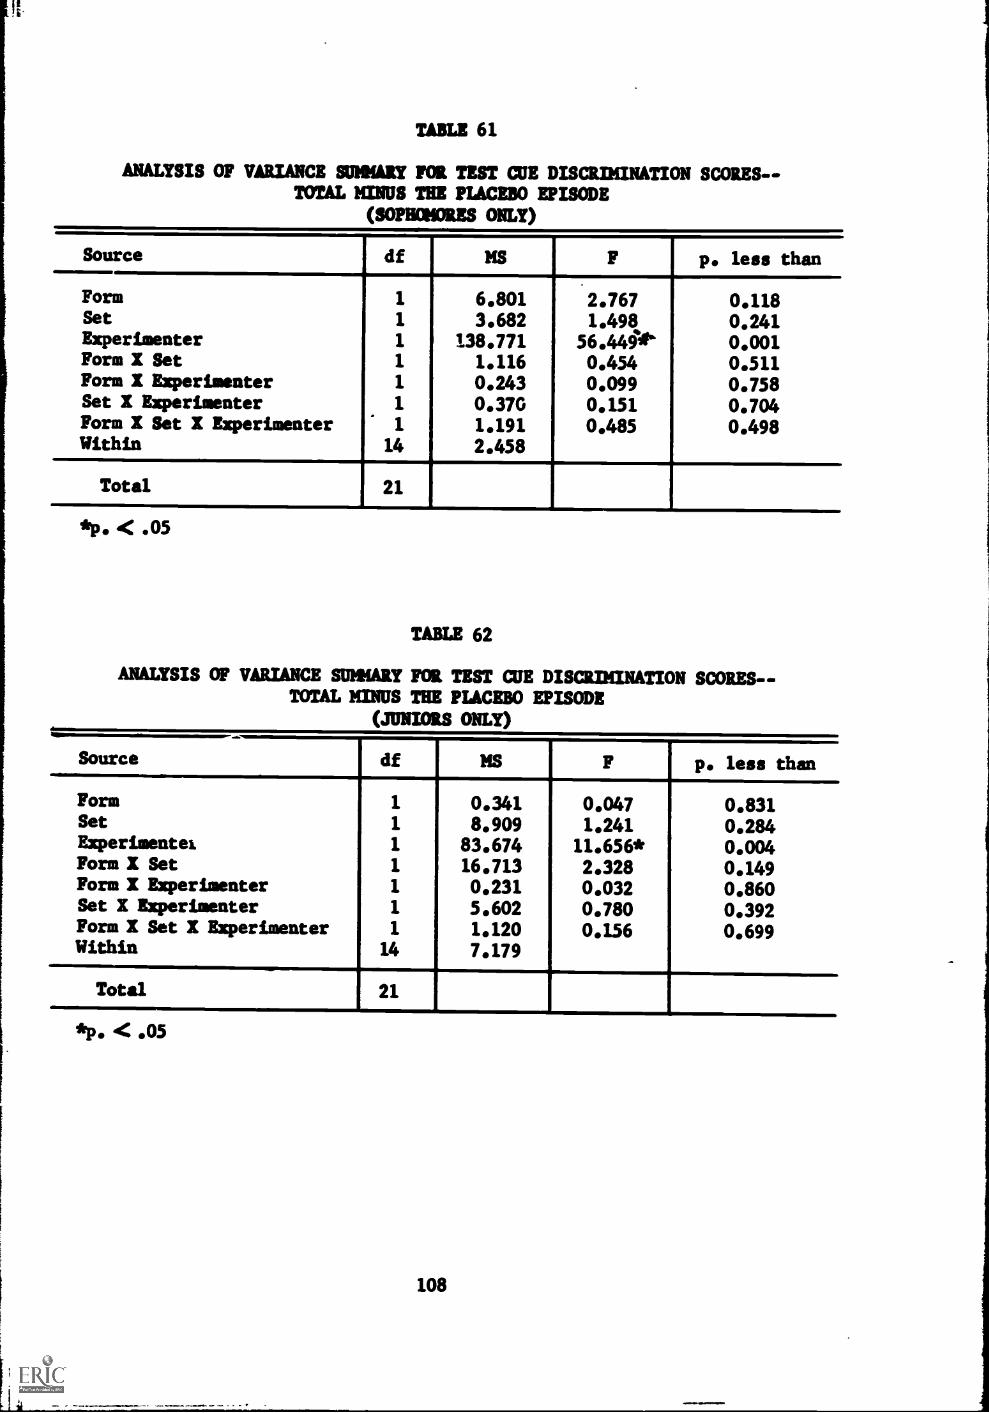
1
TABLE 61
ANALYSIS OF VARIANCE SUMMARY FOR TEST CUE DISCRIMINATION SCORES--TOTAL MINUS THE PLACEBO EPISODE
(SOPHOMORES ONLY)
Source df MS F p. lees than.
Form 1 6.801 2.767 0.118Set 1 3.682 1.498 0.241Experimenter 1 138.771 56.4401' 0.001Form X Set 1 1.116 0.454 0.511Form X Experimenter 1 0.243 0.099 0.758Set X Experimenter 1 0.370 0.151 0.704Form X Set X Experimenter 1 1.191 0.485 0.498Within 14 2.458
,
Total 21
*p. < .05
TABLE 62
ANALYSIS OF VARIANCE SUMMARY FOR TEST CUE DISCRIMINATION SCORES--TOTAL MINUS THE PLACEBO EPISODE
(JUNIORS ONLY)
Source df MS F p. leas than
Form 1 0.341 0.047 0.831Set 1 8.909 1.241 0.284Experimentek 1 83.674 11.656* 0.004Form X Set 1 16.713 2.328 0.149Form X Experimenter 1 0.231 0.032 0.860Set X Experimenter 1 5.602 0.780 0.392Form X Set X Experimenter 1 1.120 0.156 0.699Within 14 7.179
Total 21
< .05
108

TABLE 63
ANALYSIS OF VARIANCE SUMMARY FOR TEST CUE DISCRIMINATION SCORES- -TOTAL MINUS THE PLACEBO EPISODE
(SENIORS ONLY)
Source df MS F p. less than
Form 1 0.582 0.085 0.775Set 1 1.559 0.228 0.641!aperimenter 1 111.956 16.399* 0.001Form X Set 1 0.325 0.048 0.831Form X Experimenter 1 44.227 6.478* 0.024Set X Experimenter 1 3.444 0.505 0.490Form X Set X Experimenter 1 5.444 0.797 0.388Within 13 6.827
Total 20
*p. < .05
TABLE 64
.ANALYSIS OF VARIANCE SUMMARY FOR TEST CUE DISCRIMINATION SCORES--TOTAL MINUS THE PLACEBO EPISODE
(ALL SUBJECTS)
Source df MS F p. less than
Fora 1 6.203 1.143 0.290Set 1 2.005 0.369 0.546Experimenter 1 332.811 61.305* 0.001Form X Set 1 5.593 1.030 0.314Porn X Experimenter 1 10.053 1.852 0.179Set X Experimenter 1 1.021 0.188 0.666Porn X Set X Experimenter 1 8.659 1.595 0.212Within
.
57 5.429
Total
.
64
*p. <' .05
109
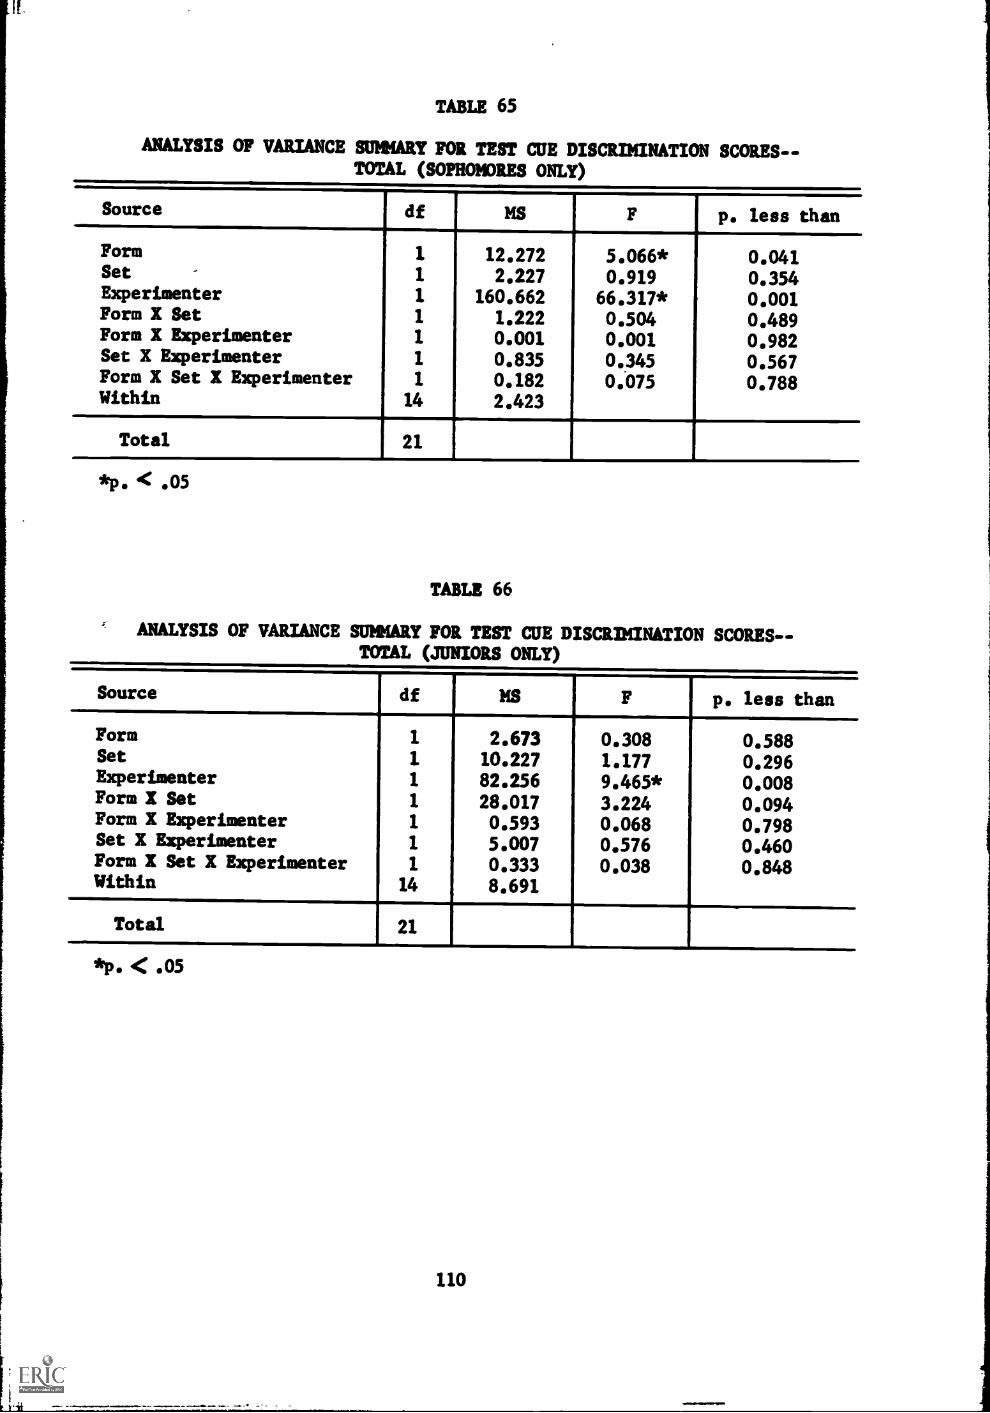
it
TABLE 65
ANALYSIS OF VARIANCE SUMMARY FOR TEST CUE DISCRIMINATION SCORES- -
TOTAL (SOPHOMORES ONLY)
Source df MS F p. less than
Form 1 12.272 5.066* 0.041Set 1 2.227 0.919 0.354Experimenter 1 160.662 66.317* 0.001Form X Set 1 1.222 0.504 0.489Form X Experimenter 1 0.001 0.001 0.982Set X Experimenter 1 0.835 0.345 0.567Form X Set X Experimenter 1 0.182 0..075 0.788Within 14 2.423
.
Total 21
-
*p. < .05
TABLE 66
ANALYSIS OF VARIANCE SUMMARY FOR TEST CUE DISCRIMINATION SCORES--TOTAL (JUNIORS ONLY)
Source df MS F p. less than
Form 1 2.673 0.308 0.588Set 1 10.227 1.177 0.296Experimenter 1 82.256 9.465* 0.008Form X Set 1 28.017 3.224 0.094Form X Experimenter 1 0.593 0.068 0.798Set X Experimenter 1 5.007 0.576 0.460Form X Set X Experimenter 1 0.333 0.038 0.848Within 14 8.691
Total 21
*p. s: .05
110
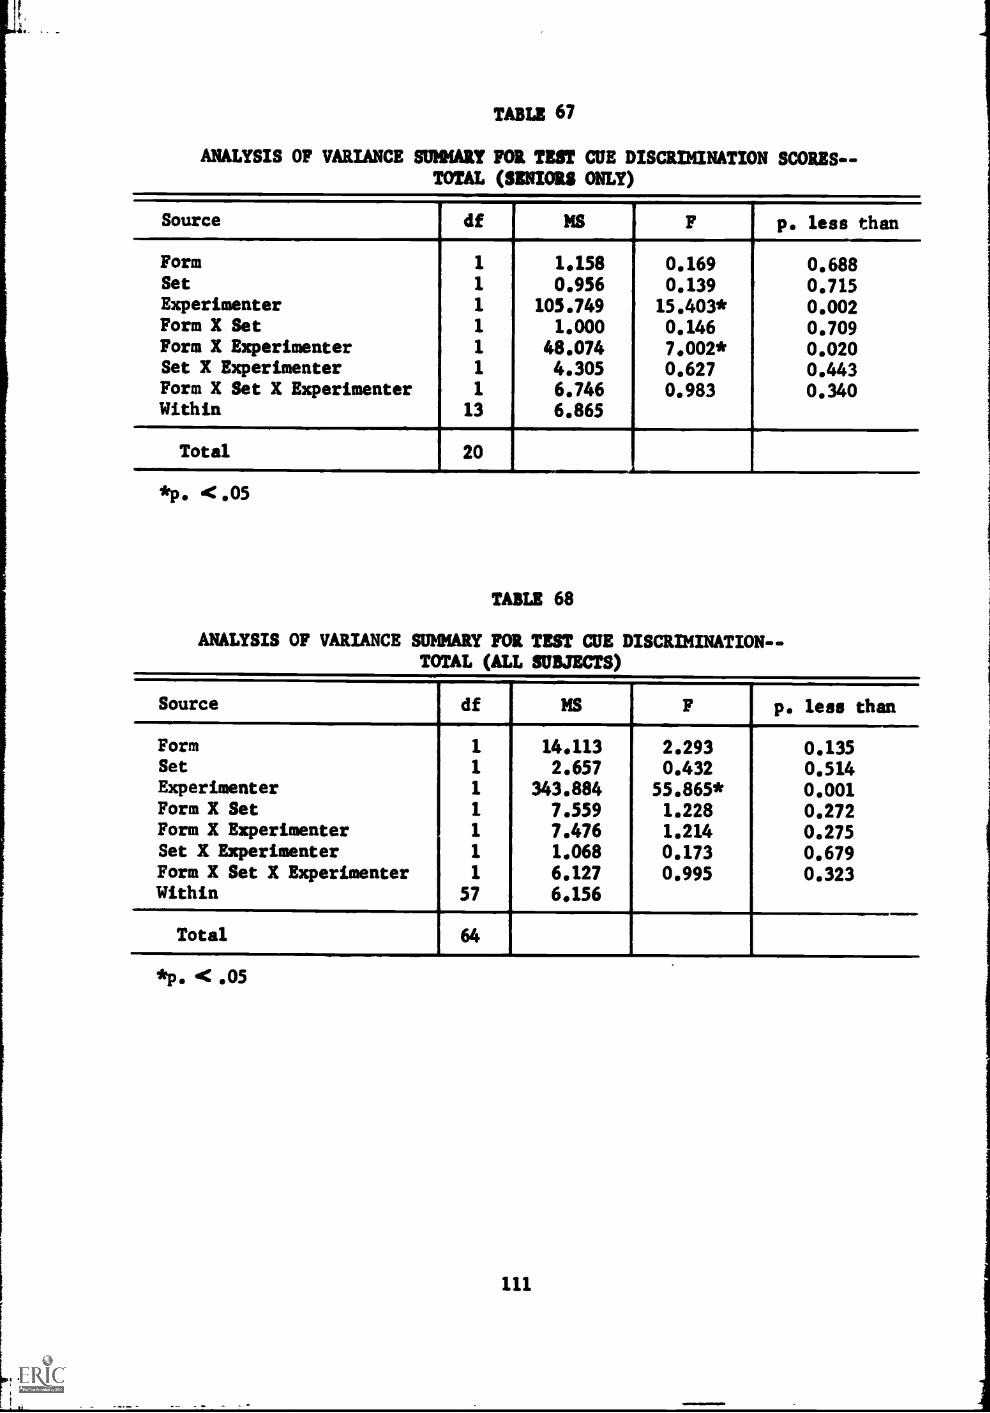
TABLE 67
ANALYSIS OF VARIANCE SUMMARY FOR TEST CUE DISCRIMINATION SCORES--TOTAL (SENIORS ONLY)
Source df MS F p. less than
Form 1 1.158 0.169 0.688Set 1 0.956 0.139 0.715Experimenter 1 105.749 15.403* 0.002Form X Set 1 1.000 0.146 0.709Form X Experimenter 1 48.074 7.002* 0.020Set X Experimenter 1 4.305 0.627 0.443Form X Set X Experimenter 1 6.746 0.983 0.340Within 13 6.865
Total 204
*p. <.05
TABLE 68
ANALYSIS OF VARIANCE SUMMARY FOR TEST CUE DISCRIMINATION- -
TOTAL (ALL SUBJECTS)
Source df MS F p. less than
Form 1 14.113 2.293 0.135Set 1 2.657 0.432 0.514Experimenter 1 343.884 55.865* 0.001Form X Set 1 7.559 1.228 0.272Form X Experimenter 1 7.476 1.214 0.275Set X Experimenter 1 1.068 0.173 0.679Form X Set X Experimenter 1 6.127 0.995 0.323Within 57 6.156
Total 64
*p. <.05
111

ANALYSIS OF VARIANCE SUMMARY TABLES FOREXPERIMENTER CONTROL VARIABLE
TABLE 69
ANALYSIS OF VARIANCE SUMMARY FOR TEST RESPONSE SCORES--TOTAL MINUS THE PLACEBO EPISODE (LEVEL BY ID
Source df MS F 1 p. less than
Level 2 74.495 3.344* 0.042Experimenter 1 234.315 10.517* 0.002Level X Experimenter 2 8.972 0.403 0.670Within 59 22.280
Total
_
64
*p. < .05
TABLE 70
ANALYSIS OF VARIANCE SUMMARY FOR TEST RESPONSE SCORES--TOTAL (LEVEL BY Z)
Source df MS F p. less than
Level 2 150.396 3.196* 0.048Experimenter 1 459.589 9.766* 0.003Level X Experimenter 2 56.079 1.192 0.311Within 59 47.058
Total 64
*p. < .05
112

TABLE 71
ANALYSIS OF VARIANCE SUMMARY FOR TEST CUE DISCRIMINATIONSCORES--TOTAL MINUS THE PLACEBO EPISODE (LEVEL BY 2)
Source df MS- -
F p. less than- . -
Level 2 7.909 1.370 0.262Experimenter 1 317.003 54.916* 0.001Level X Experimenter 2 1.193 0.207 0.814Within 59 5.772
-
Total 64
*p.< .05
TABLE 72
ANALYSIS OF VARIANCE SUMMARY FOR TEST CUEDISCRIMINATION SCORES- -TOTAL (LEVEL BY E)
Source df MS F p. less than
Level 2 7.212 1.094 0.342Experimenter 1 325.593 49.374* 0.001Level X Experimenter 2 2.333 0.354 0.703Within 59 6.594
Total 64
*p. < .05

APPENDIX B
ATTITUDE SCALE MATERIALS
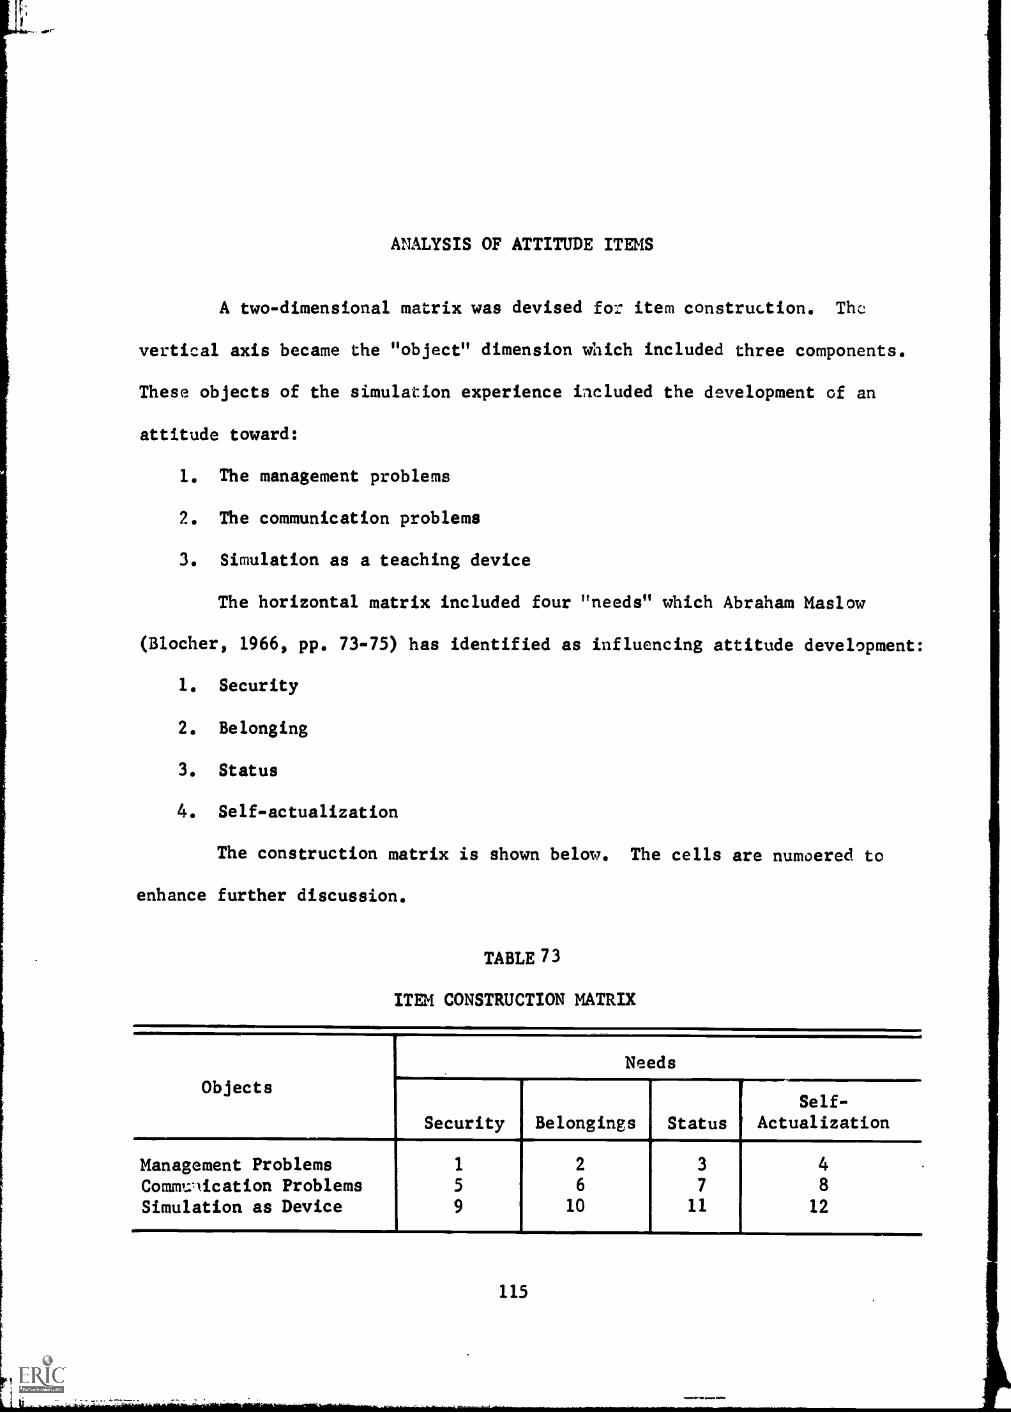
ANALYSIS OF ATTITUDE ITEMS
A two-dimensional matrix was devised for item construction. The
vertical axis became the "object" dimension which included three components.
These objects of the simulation experience included the development of an
attitude toward:
1. The management problems
2. The communication problems
3. Simulation as a teaching device
The horizontal matrix included four "needs" which Abraham Maslow
(Blocher, 1966, pp. 73-75) has identified as influencing attitude development:
1. Security
2. Belonging
3. Status
4. Self-actualization
The construction matrix is shown below. The cells are numoered to
enhance further discussion.
TABLE 73
ITEM CONSTRUCTION MATRIX
Objects
Needs
Security Belongings Status
Self-
Actualization
Management Problems 1 2 3 4
Communication Problems 5 6 7 8
Simulation as Device 9 10 11 12
115

Only those items with phi coefficient values (0) greater than .50
were selected for inclusion in the final attitude assessment. Twenty items
were then matched for S values and cell placement to provide two forms suit-
able for analysis by split-half reliability. That corresponding information
is shown below.
TAILS 74
ITIN HATCHING
Foie Item No. Cell t S 0
I 34 1 6.0 .56
II 26 1 2.9 .61
I 13 2 2.4 .54
II 3 2 5.9 .56
I 5 3 5.4 .52
II 30 3 1.6 .58
It 4II* 4
I 28 5 2.8 .64
II 10 5 5.8 .66
I 19 6 6.0 .65
II 31 6 2.2 .52
I 40 7 2.1 .67
II 35 7 6.4 .61
I 24 8 6.7 .67
II 32 11** 1.4 .64
I 2 9 6.0 .57
II 33 9 2.4 .58
I 14 2** 1.6 .58
II 4 10 5.9 .64
I* 11
II* 11
I 38 12 1.0 .54
II 39 12 6.9 .50=1, .!115
3
*Less than two items had 0 values equal to or greater than .50.**TO equalise 0 and $ values, items from other cells had to be used.
116

A ranking by S values for each form is shown below:
TABLE 75
ITEMS RANKED BY S FOR EACH FORK
Item Form I Form II Item
24 6.7 6.9 392 6.0 6.4 35
19 6.0 5.9 3
34 6.0 5,9 45 5.4 5.6 10
28 2.8 2.9 2613 2.4 2.4 3340 2.1 2.2 31
14 1.6 1.6 3038 1.0 1.4 32
A Pearson product-moment analysis provided a correlation of .71 for a
split-half reliability estimate when adjusted by a Spearman-Brown prophecy
formula (Wert et al. 1954, p. 332).
117

Numbel:
Student Attitude Toward Simulation as an Undergraduate
Elementary Education Training Technic'''.
Directions:
Circle SA if you strongly agree with a statement, A if you agree, MA if you
mild].) agree, MD if you mildly disagree, D if you disagree, and SD if yt..
strongly disagree.
Please do not spend more than 10 to 15 seconds on each item. The entire
inventory should take no more than 10 minutes.
Please do not omit any items.
Strongly Mildly Mildly Strongly
Agree Agree Agree Disagree Disagree Disagree
1. Simulation trainingis one of the mostvaluable experiencesin the teachereducation program. SA A MA MD D SD
*2. Simulation makesstudents feel moreconfident of theirteaching capability. SA A MA MD D SD
**3. Students who have gonethrough simulation willmake better disciplinedecisions as studentteacLers. SA A MA MD D SD
**4. Simulation helps onefeel more like a memberof the teachingprofession. SA A MA MD D SD
*5. If a student success-fully deals with theepisodes on note-passingshe will probably dowell with those kindsof situations as astudent teacher. SA A MA MD D SD
*Form I item**Form II item
118

6. New teacheri would have moreself-confidence in disciplinesituations if they had gonethrough simulation training.
7. Simulation episodes that dealtwith the ineffectiveness of agroup were very beneficial.
8. The note-passing episodes do nothingto make a student a more successfulstudent teacher.
9. Situations that dealt with home-school interest conflicts won'thelp many people to be betterstudent teachers.
**10. Being able to solve problems deal-ing with student inattention givesone a feeling of self-confidence.
11. Situations that deal with episodeswhere the student teacher neededto move toward the problem makestudent's a better judge ofteacher behavior.
12. Students who have gone throughsimulation will be able toestablish a greater rapport withtheir children.
*13. Successfully handling a simulationproblem dealing with disorderlybehavior doesn't make a personfeel needed.
*14. Students trained in simulationwon't make discipline decisionsbetter geared to the individualchild than anyone else.
15. Episodes where the class waspassing notes were beneficial inhelping one derive possiblesolutions.
SA strongly agreeA agreeMA mildly agreeMD mildly disagreeD disagreeSD strongly disagree
119
SA A MA MD D SD
SA A MD D SD
SA A MA MD D SD
SA A MA MD D SD
SA A MA MD D SD
SA A MA MD D SD
SA A MA MD D SD
SA A MA MD D SD
SA A MA MD D SD
SA A MA MD D SD

16. The simulation episodes that dealtwith home-school interest conflictsare irrelevant to a student'sneeds.
17. Successfully handling simulationproblems concerning a disruptivestudent makes a person feel needed.
18. New teachers would feel moresecure communicating to children ifthey had gone through simulationtraining as students.
*19. Successfully dealing with tiredchildren in a simulated problemmakes a student feel needed.
20. The problems that dealt withstudent fatigue won't bringto a student's attention a newproblem.
21. Episodes dealing with disruptivestudents gave little informationuseful for future situations.
22. Being asked to respond to aquestion like, "Can I stay infrom recess?" certainly forcesone to think.
23. Being unsuccessful in interestingthe simulated children in anassignment makes one apprehensiveabout student teaching.
*24. A person's chances of being agood student teacher are greatlyimproved after participating insimulation.
25. The probability of a person beingsuccessful as a student teachercan probably be measured by hersuccess in handling simulatedcommunication problems.
SA strongly agreeA agreeMk mildly agreeMD mildly disagreeD disagreeSD strongly disagree
120
SA A MA MD D SD
SA A MA MD D SD
SA A MA MD D SD
SA A MA MD D SD
SA A MA MD D SD
SA A MA MD D SD
SA A 14A MD D SD
SA A MA MD D SD
SA A MA MD D SD
SA A MA MD D SD
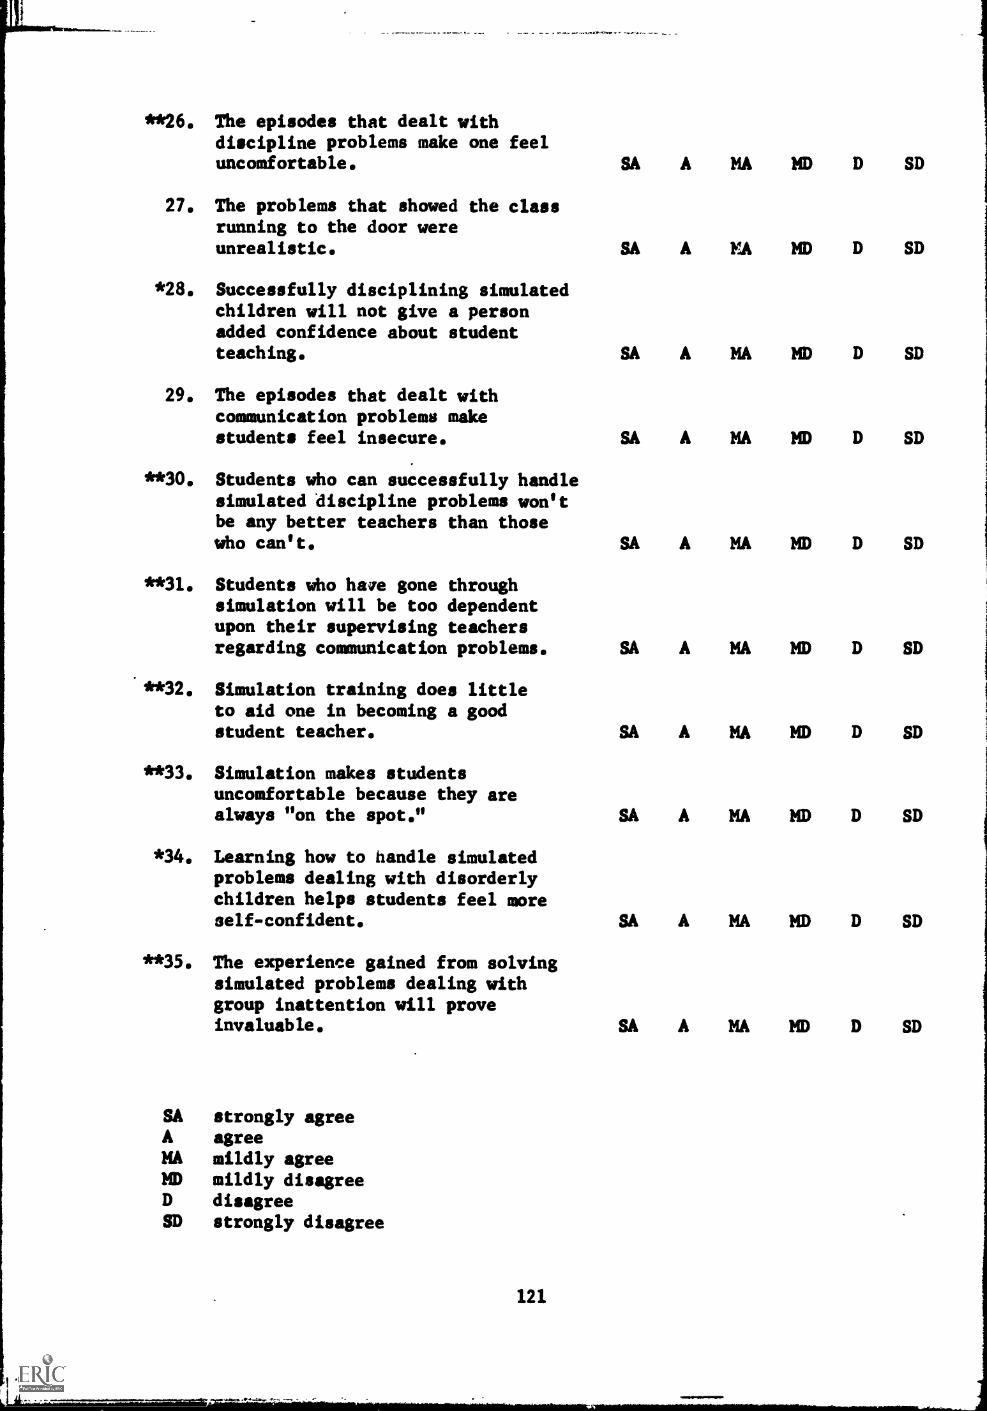
**26. The episodes that dealt withdiscipline problems make one feeluncomfortable.
27. The problems that showed the classrunning to the door wereunrealistic.
*28. Successfully disciplining simulatedchildren will not give a personadded confidence about studentteaching.
29. The episodes that dealt withcommunication problems makestudents feel insecure.
**30. Students who can successfully handlesimulated discipline problems won'tbe any better teachers than thosewho can't.
**31. Students who have gone throughsimulation will be too dependentupon their supervising teachersregarding communication problems.
**32. Simulation training does littleto aid one in becoming a goodstudent teacher.
**33. Simulation makes studentsuncomfortable because they arealways "on the spot."
*34. Learning how to handle simulatedproblems dealing with disorderlychildren helps students feel moreself-confident.
**35. The experience gained from solvingsimulated problems dealing withgroup inattention will proveinvaluable.
SA strongly agreeA agreeMA mildly agreeMD mildly disagreeD disagreeSD strongly disagree
121
SA A MA MD D SD
SA A MA MD D SD
SA A MA MD D SD
SA A MA MD D SD
SA A MA MD D SD
SA A MA MD D SD
SA A MA MD D SD
SA A MA MD D SD
SA A MA MD D SD
SA A MA MD D SD
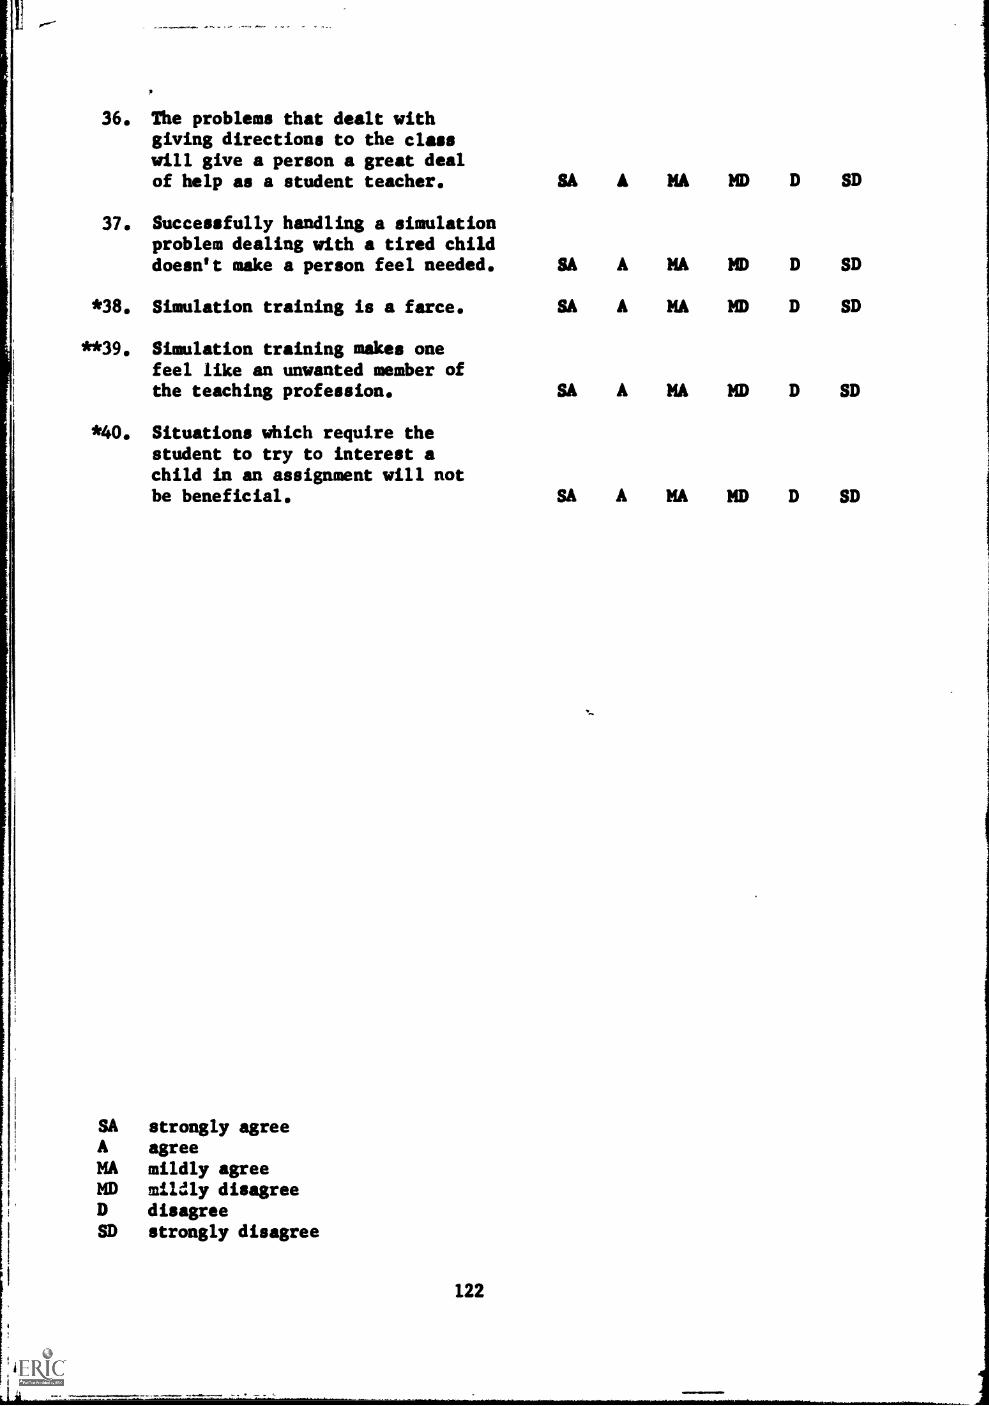
.4-
36. The problems that dealt withgiving directions to the classwill give a person a great dealof help as a student teacher.
37. Successfully handling a simulationproblem dealing with a tired childdoesn't make a person feel needed.
*38. Simulation training is a farce.
**39. Simulation training makes onefeel like an unwanted member ofthe teaching profession.
*40. Situations which require thestudent to try to interest achild in an assignment will notbe beneficial.
SA strongly agreeA agreeMA mildly agreeMD mildly disagreeD disagreeSD strongly disagree
122
SA A MA MD D SD
SA A MA MD D SD
SA A MA MD D SD
SA A MA MD D SD

APPENDIX C
AUDIO-TAPE MATERIALS

Judge:
Your task is to evaluate the content of the taped oral presentation
(called Episode Descriptions) that will be given to students going through
simulation training. The criterion to be used is deciding whether the oral
presentation describes as well as possible the filmed presentation. The
oral presentations or Episode Descriptions are also printed for you.*
Evaluate the taped Episode Descriptions using the Judging Forms.
The students who hear the oral presentation must have a similar
opportunity to discriminate cues that will lead them to identify the same
problem as those students who see the film.
Directions to Judges:
1. Set up the motion picture projector.
2. Put film Series II on the projector.
3. There are twenty problems or episodes on each film series. Betweenepisodes there is a section of black leader which will signal you thatthe end of an episode has been reached.
4. Before viewing or listening to epiecdc 1 on Series II read theSituation Description. (This segment is not to be judged--it is merelyfor your information.)
5. Listen to the taped Episode Description for episode 1, Series II.
6. View the film. Stop it when you see the black leader.
7. Replay the Episode Description for that episode.
8. Evaluate the Episode Description using the criteria on the Judging Form.
9. When you have completed the judging process for episode 1 move on toepisode 2. Start with step 4 above.
10. When you have completed all twenty episodes for Series II, rewind thefilm and put on Series III. Start with step 3 above.
*The typed Episode Description also identifies the end of the filmedsequence that a subject would see; i.e., see the last line of the typedEpisode Description for Series II, episode #2.
124
11. When you have completed episode 20 for Series III leave the materialswhere they are. I'll clean it up for you.
125
11711111MMEMO

AUDIO-WE TRANSCRIPTIONS
Set I
1. As the episode begins you'll see the two girls on the far right side ofthe room. The remainder of the children seem to be busy. Wendy willbegin speaking to you, (voice dub) "You know, my daddy let as stay uplate last night to watch a movie on TV and I don't know whether I canmake it through the day or not. It was called The Diary of Anne Frankand my daddy told me to watch it. I'm sure glad I did."
2. You are still standing on the far right side of the room. You'll seeShirley and Wendy as you did in the previous episode. The children inthe back of the room will be moving around quietly. Shirley will beginspeaking to you, (voice dub) "I didn't get to sleep till late lastnight either because I had so much homework to do. Daddy says youshouldn't give us so much homework." (Ind of episode--rest is afeedback.)
3. As the scene opens you will see only the far right side of the room fromthe aisle over. The children in this section are working quietly attheir desks. The group at the back of the room working on the bulletinboard is made up of four girls. One little girl looks out the door,points out the door, then turns and talks to her neighbors. The girlsbecome noticeably excited. Linda turns, moves toward you about 10 feetand says, (voice dub) "Hey, there's a fight out there!" The classmembers who are working at their seats look up at you briefly. ThenRandy shoves his chair away from his desk and begins quickly to movetoward the door. Suzanne stands up as if to move toward the door.(Episode ends at "blip"--rest is a feedback.)
4. You are standing at the front of the room. You'll see the children allgathered around the door at the back of the room. Most of them areshouting, pointing, shoving and laughing. The children begin jumpingup and down in order to see more clearly. The exuberance of the groupcontinues as the children begin to jump and laugh to an even greaterdegree. The children will continue this activity.
5. In response to your question, Linda raises her hand and says, (voice dub)"Well, the water evaporates and then it comes down from the clouds." AsLinda gives this response, the children turn slightly to look at her.Donna next raises her hand and says, (voice dub) "Only black clouds giTierain." The children turn to see Donna. Ron is the next child to make acomment. He says, (voice dub) "My grandfather said that when he was aboy it rained frogs for two days." The class is immediately interestedin this comment. The remaining members of the class turn to Ron andvarious comments can be heard, (voice dub) "That's funny!" The childrenseem disbelieving of Ron's comment and turn toward you expectantly. (Endof episode - -Bon's next comment is a feedback.)
126
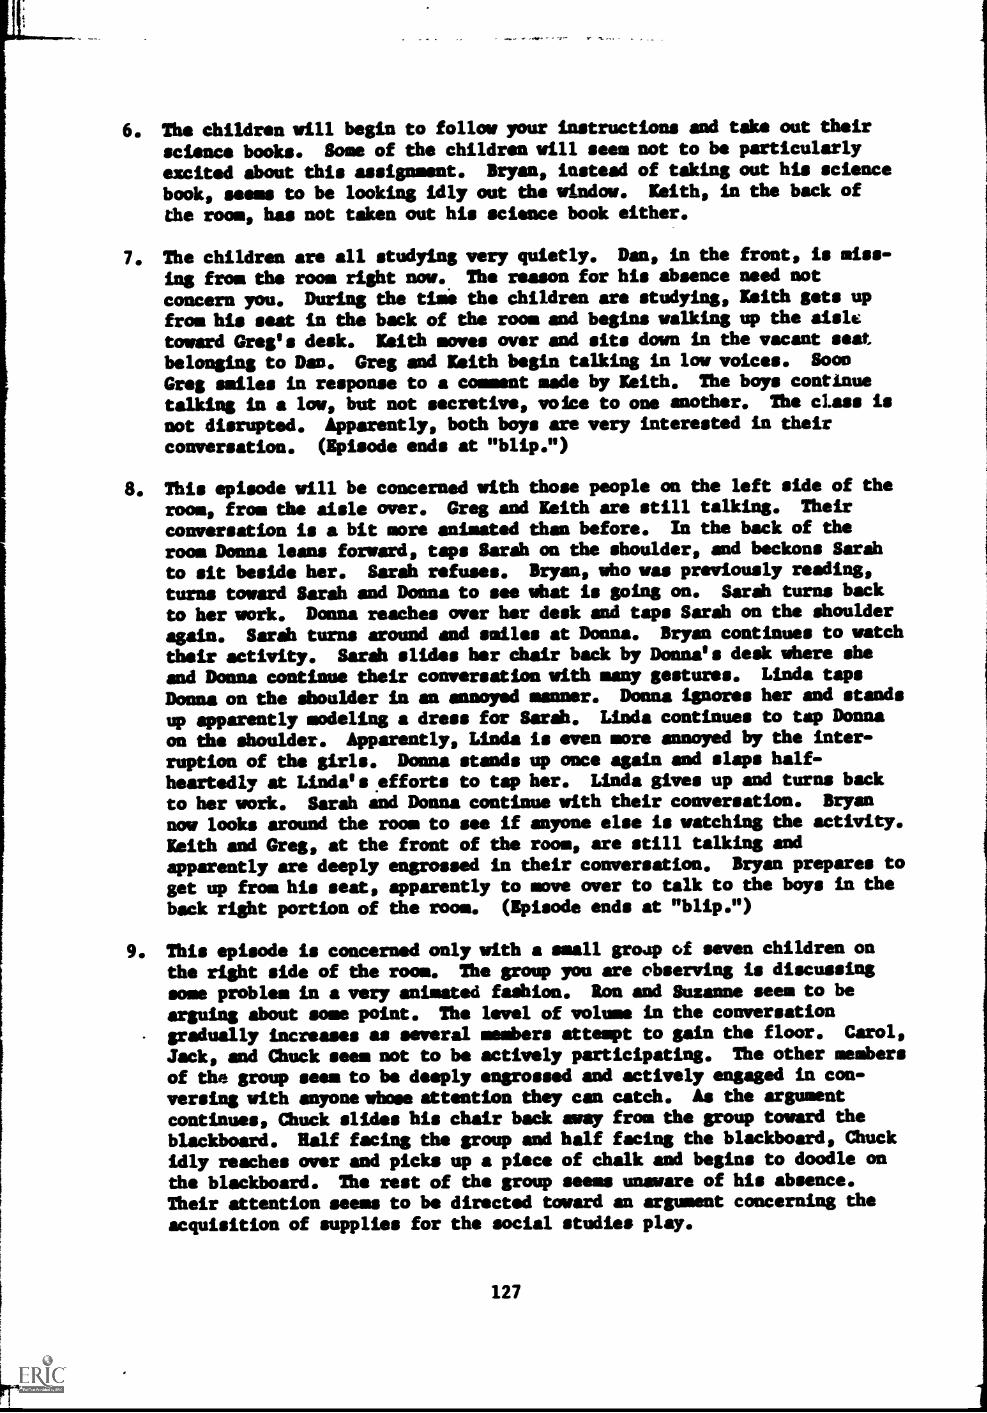
6. The children will begin to follow your instructions and take out their
science books. Some of the children will seem not to be particularly
excited about this assignment. Bryan, instead of taking out his science
book, seems to be looking idly out the window. Keith, in the back of
the room, has not taken out his science book either.
7. The children are all studying very quietly. Dan, in the front, is miss-
ing from the room right now. The reason for his absence need not
concern you. During the time the children are studying, Keith gets upfrom his seat in the back of the room and begins walking up the aisle
toward Greg's desk. Keith moves over and sits down in the vacant seat
belonging to Dan. Greg and Keith begin talking in low voices. Soon
Greg smiles in response to a comment made by Keith. The boys continue
talking in a low, but not secretive, voice to one another. The class is
not disrupted. Apparently, both boys are very interested in their
conversation. (Episode ends at "blip.")
8. This episode will be concerned with those people on the left side of the
room, from the aisle over. Greg and Keith are still talking. Their
conversation is a bit more animated than before. In the back of the
room Donna leans forward, taps Sarah on the shoulder, and beckons Sarah
to sit beside her. Sarah refuses. Bryan, who was previously reading,
turns toward Sarah and Donna to see what is going on. Sarah turns back
to her work. Donna reaches over her desk and taps Sarah on the shoulder
again. Sarah turns around and smiles at Donna. Bryan continues to watch
their activity. Sarah slides her chair back by Donna's desk where sheand Donna continue their conversation with many gestures. Linda taps
Donna on the shoulder in an annoyed manner. Donna ignores her and stands
up apparently modeling a dress for Sarah. Linda continues to tap Donna
on the shoulder. Apparently, Linda is even more annoyed by the inter-
ruption of the girls. Donna stands up once again and slaps half-heartedly at Linda's efforts to tap her. Linda gives up and turns back
to her work. Sarah and Donna continue with their conversation. Bryan
now looks around the room to see if anyone else is watching the activity.
Keith and Greg, at the front of the room, are still talking andapparently are deeply engrossed in their conversation. Bryan prepares to
get up from his seat, apparently to move over to talk to the boys in the
back right portion of the room. (Episode ends at "blip.")
9. This episode is concerned only with a small grodp of seven children onthe right side of the room. The group you are observing is discussing
some problem in a very animated fashion. Ron and Susanne seem to be
arguing about some point. The level of volume in the conversationgradually increases as several members attempt to gain the floor. Carol,
Jack, and Chuck seem not to be actively participating. The other members
of the group seem to be deeply engrossed and actively engaged in con-versing with anyone whose attention they can catch. As the argumentcontinues, Chuck slides his chair back away from the group toward the
blackboard. Ralf facing the group and half facing the blackboard, Chuckidly reaches over and picks up a piece of chalk and begins to doodle on
the blackboard. The rest of the group seems unaware of his absence.Their attention seems to be directed toward an argument concerning theacquisition of supplies for the social studies play.
127
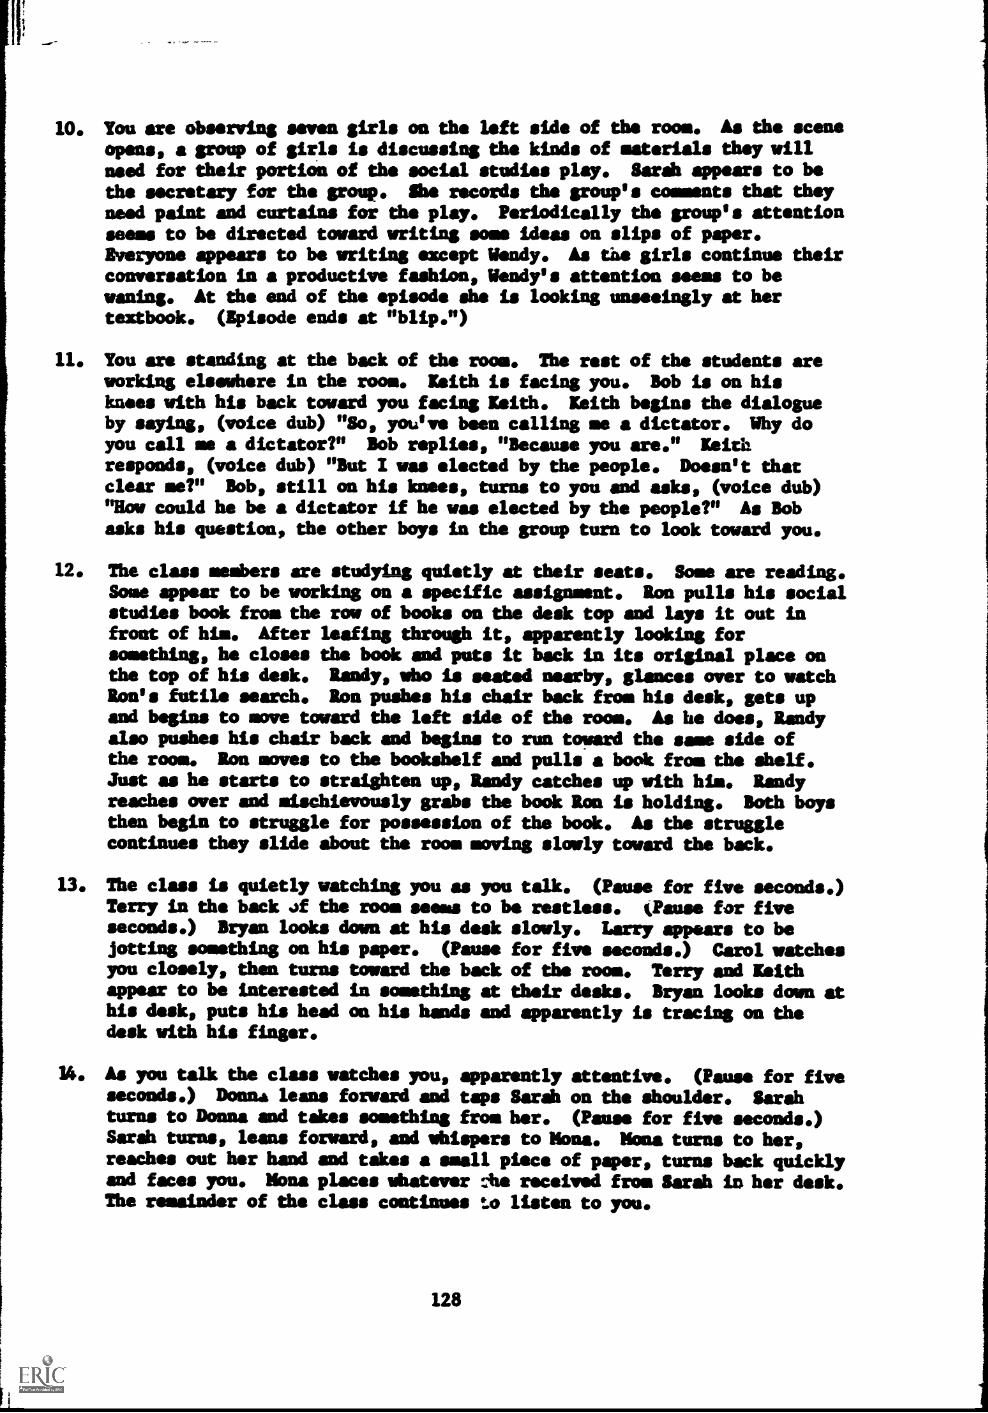
10. You are observing seven girls on the left side of the room. As the sceneopens, a group of girls is discussing the kinds of materials they willneed for their portion of the social studies play. Sarah appears to bethe secretary for the group. She records the group's comments that theyneed paint and curtains for the play. Periodically the group's attentionseems to be directed toward writing some ideas on slips of paper.Everyone appears to be writing except Wendy. As the girls continue theirconversation in a productive fashion, Wendy's attention seems to bewaning. At the end of the episode she is looking unseeingly at hertextbook. (Episode ends at "blip.")
11. You are standing at the back of the room. The rest of the students areworking elsewhere in the room. Leith is facing you. Bob is on hisknees with his back toward you facing Keith. Keith begins the dialogueby saying, (voice dub) "So, you've been calling me a dictator. Why doyou call me a dictator?" Bob replies, "Because you are." Keithresponds, (voice dub) "But I was elected by the people. Doesn't thatclear me?" Bob, still on his knees, turns to you and asks, (voice dub)"How could he be a dictator if he was elected by the people?" As Bobasks his question, the other boys in the group turn to look toward you.
12. The class members are studying quietly at their seats. Some are reading.Some appear to be working on a specific assignment. Ron pulls his socialstudies book from the row of books on the desk top and lays it out infront of him. After leafing through it, apparently looking forsomething, he closes the book and puts it back in its original place onthe top of his desk. Randy, who is seated nearby, glances over to watchRon's futile search. Ron pushes his chair back from his desk, gets upand begins to move toward the left side of the room. As he does, Randyalso pushes his chair back and begins to run toward the same side ofthe room. Ron moves to the bookshelf and pulls a book from the shelf.Just as he starts to straighten up, Randy catches up with him. Randyreaches over and mischievously grabs the book Ron is holding. Both boysthen begin to struggle for possession of the book. As the strugglecontinues they slide about the room moving slowly toward the back.
13. The class is quietly watching you as you talk. (Pause for five seconds.)Terry in the back of the room seems to be restless. tPause for fiveseconds.) Bryan looks down at his desk slowly. Larry appears to bejotting something on his paper. (Pause for five seconds.) Carol watchesyou closely, then turns toward the back of the room. Terry and Keithappear to be interested in something at their desks. Bryan looks down athis desk, puts his head on his hands and apparently is tracing on thedesk with his finger.
14. As you talk the class watches you, apparently attentive. (Pause for fiveseconds.) Donna leans forward and taps Sarah on the shoulder. Sarahturns to Donna and takes something from her. (Pause for five seconds.)Sarah turns, leans forward, and whispers to Mona. Mona turns to her,reaches out her hand and takes a small piece of paper, turns back quicklyand faces you. Mona places whatever :he received from Sarah in her desk.The remainder of the class continues to listen to you.

15. The class is still listening to you apparently interested in what you
are saying. Mona takes the note from her desk and unfolds it and begins
to read it. Dan looks over and notices the note that Mona is holding
below the desk top. Dan smiles slightly then reaches over and quickly
grabs the note from Mona. He then turns toward Greg and places the note
between himself and Greg and they quickly begin to read the note.
Mona tries unsuccessfully to grab the note back from the boys but Dan
blocks her way. The boys continue to read the note eagerly. As the
boys finish reading the note, Greg takes the note across the aisle to
show to Bob and Ron. All three boys laugh and smile as they read the
note.
16. The class members are working quietly at their seats. Some are reading
and some are apparently working on some specific assignment of their
own. Everyone seems involved in their own work. Shirley, on the right
front side of the room, rests her head on her hands as she stares
straight ahead. As you continue watching her she seems troubled or deep
in her own thoughts.
17. In response to your question, Shirley responds with, (voice dub)se I don't see how we'll look all right." The remainder of the
class appears to be undistrubed by your conversation with Shirley.
18. Most of the class members are in small groups. There is one group
writing and drawing on the blackboard, a second group in the back
talking quietly amongst themselves, a third group on the left side
gathered around Larry apparently watching him as he writes something on
a piece of paper. Another group of students, at the front left of the
room, are working individually at their seats on some task of their own.
The children at the board are apparently playing some type of game,
the boys at the back right continue to talk amongst themselves.
Most of the conversations are fairly quiet as there is nothing to be
heard to indicate the content of the various discussions. (Episode ends
at the beginning of the second pan to the right.)
19. As the episode begins Suzanne will open the door and move into the room
followed by several of the other claim members. One of the comments
that can be heard coming from the group is, "The projector would break
down:" As the remainder of the children file into the room it becomes
obvious that they are very disappointed at the loss of the opportunity
to view the film. Additional comments are made indicating that they
are disgusted and disappointed. The children all file into the room and
sit down at their desks. Some stare at the desktops and some look
toward you.
20. As you give the assignment the class listens only half-heartedly. Some
of the children seem obviously tired, others appear bored. After you
have finished giving the assignment, the children will pull their books
out and place them disgustedly, some noisily, on their desks. The
children begin leafing through their books looking for the page number
you have assigned. Their commitment to the assignment is not impressive.
129
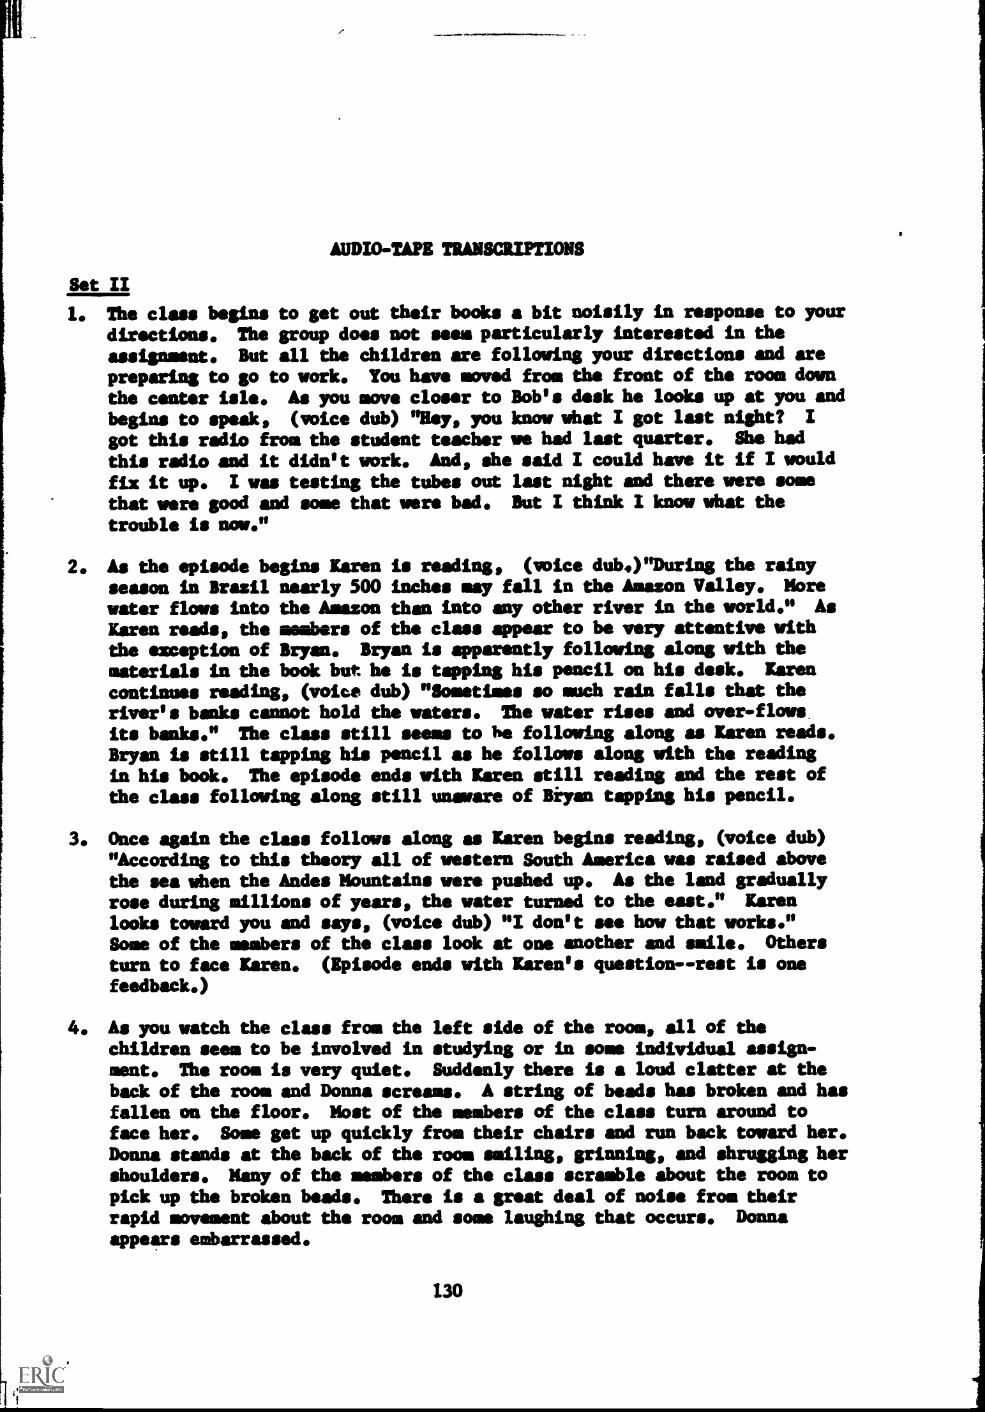
AUDIO-TAPE TRANSCRIPTIONS
Set II
1. The class begins to get out their books a bit noisily in response to yourdirections. The group does not seem particularly interested in the
assignment. But all the children are following your directions and arepreparing to go to work. You have moved from the front of the room down
the center isle. As you move closer to Bob's desk he looks up at you and
begins to speak, (voice dub) "Hey, you know what I got last night? I
got this radio from the student teacher we had last quarter. She had
this radio and it didn't work. And, she said I could have it if I would
fix it up. I was testing the tubes out last night and there were somethat were good and some that were bad. But I think I know what the
trouble is now."
2. As the episode begins Karen is reading, (voice dub.)"During the rainyseason in Brazil nearly 500 inches may fall in the Amazon Valley. Morewater flows into the Amazon than into any other river in the world." AsKaren reads, the members of the class appear to be very attentive withthe exception of Bryan. Bryan is apparently following along with thematerials in the book but he is tapping his pencil on his desk. Karencontinues reading, (voice dub) "Sometimes so much rain falls that theriver's banks cannot hold the waters. The water rises and over-flowsits banks." The class still seems to he following along as Karen reads.Bryan is still tapping his pencil as he follows along with the readingin his book. The episode ends with Karen still reading and the rest ofthe class following along still unaware of Biyan tapping his pencil.
3. Once again the class follows along as Karen begins reading, (voice dub)"According to this theory all of western South America was raised abovethe sea when the Andes Mountains were pushed up. As the land graduallyrose during millions of years, the water turned to the east." Karenlooks toward you and says, (voice dub) "I don't see how that works."Some of the members of the class look at one another and smile. Othersturn to face Karen. (Episode ends with Karen's question--rest is onefeedback.)
4. As you watch the class from the left side of the room, all of thechildren seem to be involved in studying or in some individual assign-ment. The room is very quiet. Suddenly there is a loud clatter at theback of the room and Donna screams. A string of beads has broken and hasfallen on the floor. Most of the members of the class turn around toface her. Some get up quickly from their chairs and run back toward her.Donna stands at the back of the room smiling, grinning, and shrugging hershoulders. Many of the members of the class scramble about the room topick up the broken beads. There is a great deal of noise from theirrapid movement about the room and some laughing that occurs. Donnaappears embarrassed.
130
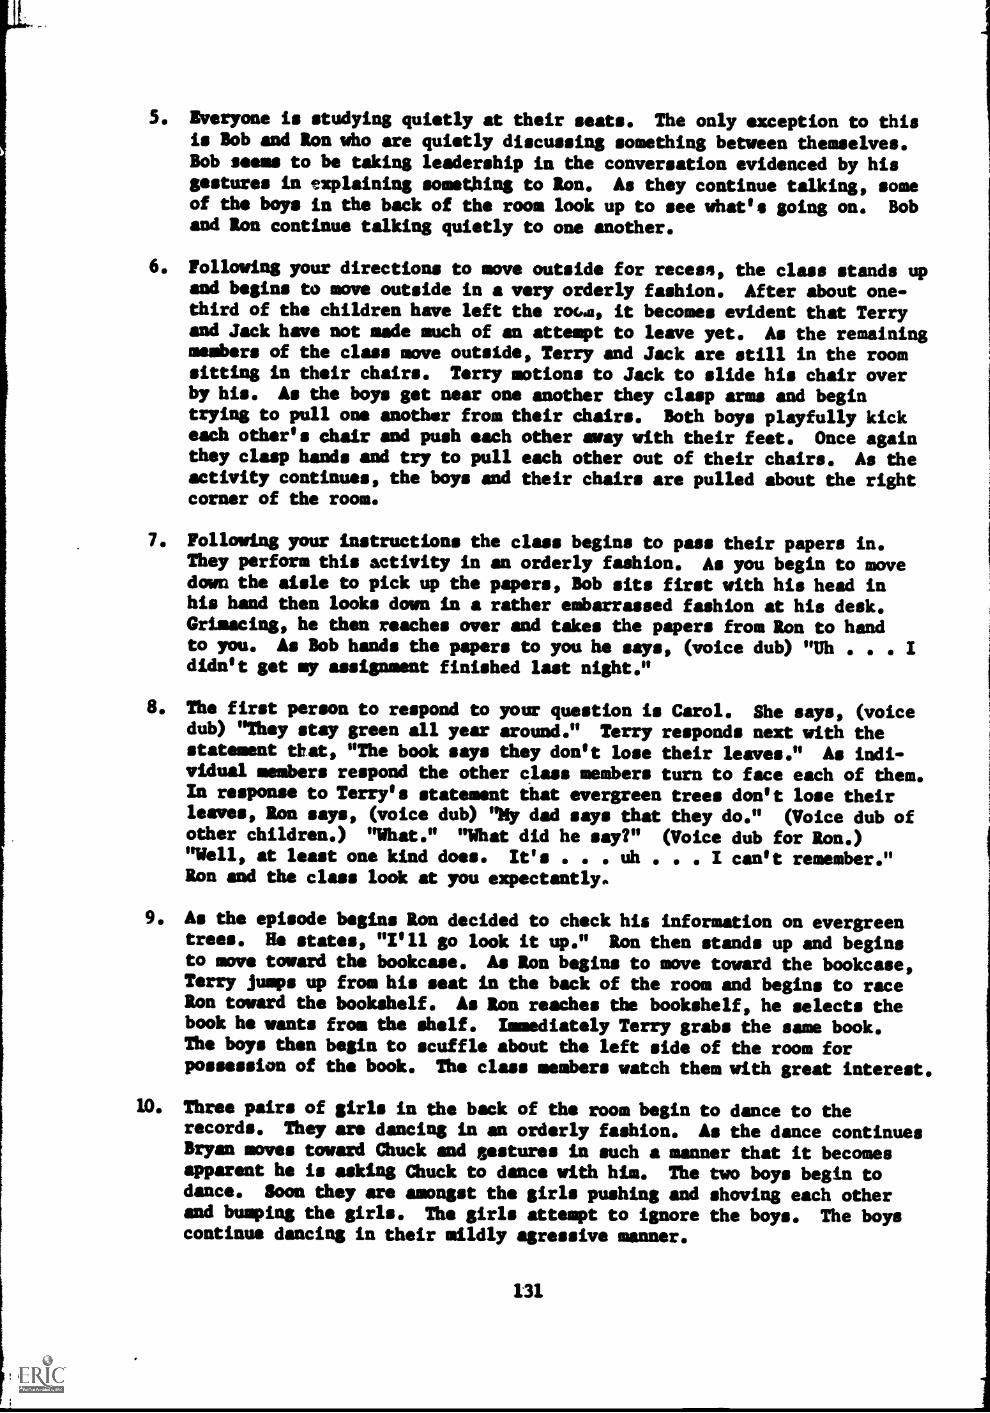
5. Everyone is studying quietly at their seats. The only exception to thisis Bob and Ron who are quietly discussing something between themselves.
Bob seems to be taking leadership in the conversation evidenced by hisgestures in explaining something to Ron. As they continue talking, someof the boys in the back of the room look up to see what's going on. Boband Ron continue talking quietly to one another.
6. Following your directions to move outside for recess, the class stands upand begins to move outside in a very orderly fashion. After about one-third of the children have left the rota, it becomes evident that Terryand Jack have not made much of an attempt to leave yet. As the remainingmembers of the class move outside, Terry and Jack are still in the roomsitting in their chairs. Terry motions to Jack to slide his chair overby his. As the boys get near one another they clasp arms and begintrying to pull one another from their chairs. Both boys playfully kickeach other's chair and push each other away with their feet. Once againthey clasp hands and try to pull each other out of their chairs. As theactivity continues, the boys and their chairs are pulled about the rightcorner of the room.
7. Following your instructions the class begins to pass their papers in.They perform this activity in an orderly fashion. As you begin to movedown the aisle to pick up the papers, Bob sits first with his head inhis hand then looks down in a rather embarrassed fashion at his desk.Grimacing, he then reaches over and takes the papers from Ron to handto you. As Bob hands the papers to you he says, (voice dub) "Uh Ididn't get my assignment finished last night."
8. The first person to respond to your question is Carol. She says, (voicedub) "They stay green all year around." Terry responds next with thestatement eat, "The book says they don't lose their leaves." As indi-vidual members respond the other class members turn to face each of them.In response to Terry's statement that evergreen trees don't lose theirleaves, Ron says, (voice dub) "My dad says that they do." (Voice dub ofother children.) "What." "What did he say?" (Voice dub for Ron.)"Well, at least one kind does. It's . uh . I can't remember."Ron and the class look at you expectantly.
9. As the episode begins Ron decided to check his information on evergreentrees. He states, "I'll go look it up." Ron then stands up and beginsto move toward the bookcase. As Ron begins to move toward the bookcase,Terry jumps up from his seat in the back of the room and begins to raceRon toward the bookshelf. As Ron reaches the bookshelf, he selects thebook he wants from the shelf. Immediately Terry grabs the same book.The boys then begin to scuffle about the left side of the room forpossession of the book. The class members watch them with great interest.
10. Three pairs of girls in the back of the room begin to dance to therecords. They are dancing in an orderly fashion. As the dance continuesBryan moves toward Chuck and gestures in such a manner that it becomesapparent he is asking Chuck to dance with him. The two boys begin todance. Soon they are amongst the girls pushing and shoving each otherand bumping the girls. The girls attempt to ignore the boys. The boyscontinue dancing in their mildly agressive manner.
131
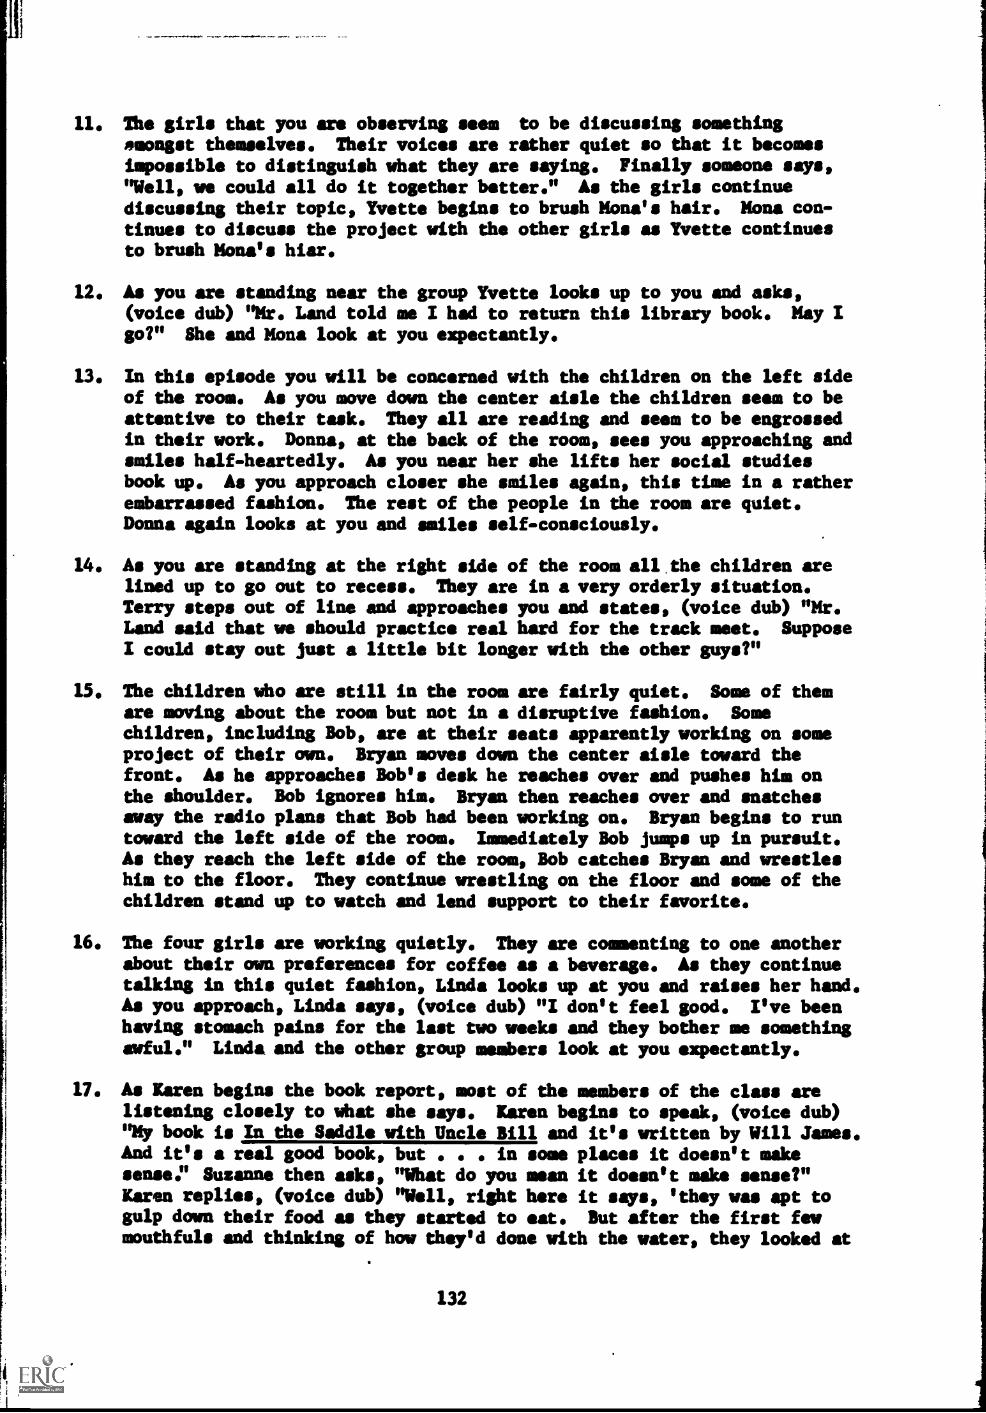
11. The girls that you are observing seem to be discussing somethingsmongst themselves. Their voices are rather quiet so that it becomesimpossible to distinguish what they are saying. Finally someone says,"Well, we could all do it together better." As the girls continuediscussing their topic, Yvette begins to brush Mona's hair. Mona con-tinues to discuss the project with the other girls as Yvette continuesto brush Mona's hiar.
12. As you are standing near the group Yvette looks up to you and asks,(voice dub) "Mr. Land told me I had to return this library book. May Igo?" She and Mona look at you expectantly.
13. In this episode you will be concerned with the children on the left sideof the room. As you move down the center aisle the children seem to beattentive to their task. They all are reading and seem to be engrossedin their work. Donna, at the back of the room, sees you approaching andsmiles half-heartedly. As you near her she lifts her social studiesbook up. As you approach closer she smiles again, this time in a ratherembarrassed fashion. The rest of the people in the room are quiet.Donna again looks at you and smiles self-consciously.
14. As you are standing at the right side of the room all the children arelined up to go out to recess. They are in a very orderly situation.Terry steps out of line and approaches you and states, (voice dub) "Mr.Land said that we should practice real hard for the track meet. SupposeI could stay out just a little bit longer with the other guys?"
15. The children who are still in the room are fairly quiet. Some of themare moving about the room but not in a disruptive fashion. Somechildren, including Bob, are at their seats apparently working on someproject of their own. Bryan moves down the center aisle toward thefront. As he approaches Bob's desk he reaches over and pushes him onthe shoulder. Bob ignores him. Bryan then reaches over and snatchesaway the radio plans that Bob had been working on. Bryan begins to runtoward the left side of the room. Immediately Bob jumps up in pursuit.As they reach the left side of the room, Bob catches Bryan and wrestleshim to the floor. They continue wrestling on the floor and some of thechildren stand up to watch and lend support to their favorite.
16. The four girls are working quietly. They are commenting to one anotherabout their own preferences for coffee as a beverage. As they continuetalking in this quiet fashion, Linda looks up at you and raises her hand.As you approach, Linda says, (voice dub) "I don't feel good. I've beenhaving stomach pains for the last two weeks and they bother me somethingawful." Linda and the other group members look at you expectantly.
17. As Karen begins the book report, most of the members of the class arelistening closely to what she says. Karen begins to speak, (voice dub)"My book is In the Saddle with Uncle Bill and it's written by Will James.And it's a real good book, but in some places it doesn't makesenseP Suzanne then asks, "What do you mean it doesn't make sense?"Karen replies, (voice dub) "Well, right here it says, 'they was apt togulp down their food as they started to eat. But after the first fewmouthfuls and thinking of how they'd done with the water, they looked at
132
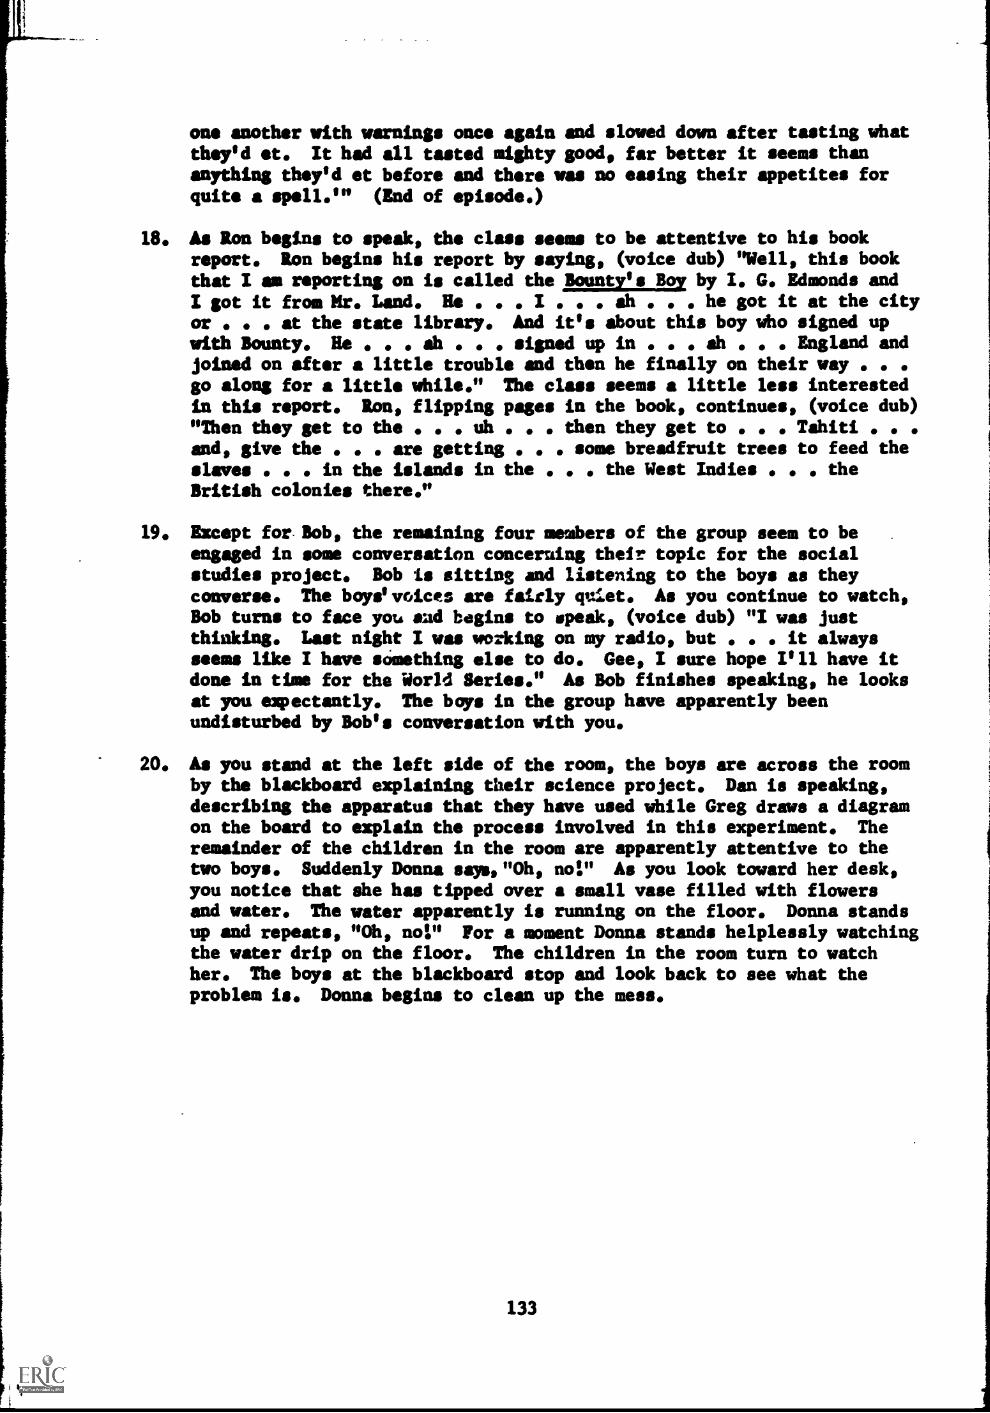
one another with warnings once again and slowed down after tasting whatthey'd et. It had all tasted mighty good, far better it seems thananything they'd et before and there was no easing their appetites forquite a spell.'" (End of episode.)
18. As Ron begins to speak, the class seems to be attentive to his bookreport. Ron begins his report by saying, (voice dub) "Well, this bookthat I am reporting on is called the Bounty's Boy by I. G. Edmonds andI got it from thir. Land. He I ah he got it at the cityor at the state library. And it's about this boy who signed upwith Bounty. He . ah . signed up in . . . ah . . . England andjoined on after a little trouble and then he finally on their waygo along for a little while." The class seems a little less interestedin this report. Ron, flipping pages in the book, continues, (voice dub)"Then they get to the uh . then they get to . . . Tahiti . . .
and, give the are getting . . some breadfruit trees to feed theslaves in the islands in the the West Indies the
British colonies there."
19. Except for.Bob, the remaining four members of the group seem to be .
engaged in some conversation concerning their topic for the socialstudies project. Bob is sitting and listening to the boys as theyconverse. The boys'voices are fairly quiet. As you continue to watch,Bob turns to face you sad begins to speak, (voice dub) "I was justthinking. Last night I was working on my radio, but it alwaysseems like I have something else to do. Gee, I sure hope I'll have itdone in time for the World Series." As Bob finishes speaking, he looksat you expectantly. The boys in the group have apparently beenundisturbed by Bob's conversation with you.
20. As you stand at the left side of the room, the boys are across the roomby the blackboard explaining their science project. Dan is speaking,describing the apparatus that they have used while Greg draws a diagramon the board to explain the process involved in this experiment. Theremainder of the children in the room are apparently attentive to thetwo boys. Suddenly Donna says, "Oh, nor As you look toward her desk,you notice that she has tipped over a small vase filled with flowersand water. The water apparently is running on the floor. Donna standsup and repeats, "Oh, nor For a moment Donna stands helplessly watchingthe water drip on the floor. The children in the room turn to watchher. The boys at the blackboard stop and look back to see what theproblem is. Donna begins to clean up the mess.
133

3 0 90 0 ..4 M
Back
i I+ $ co 0 V 14 4
Donna
Linda
1 I 1 1 I
mi.
maw
....m
.I- 1 1 1 i
Yvette Mona
Dan
Greg
Bulletin Board
Randy Keith
A 0 ca c 0 ed
Jackie
Carol
iSuzanne
Shirley Wendy
Chuck
Door
Set I
Episode: 12
Front
SEATING CHART FOR "MR. LAND'S" CLASSROOM
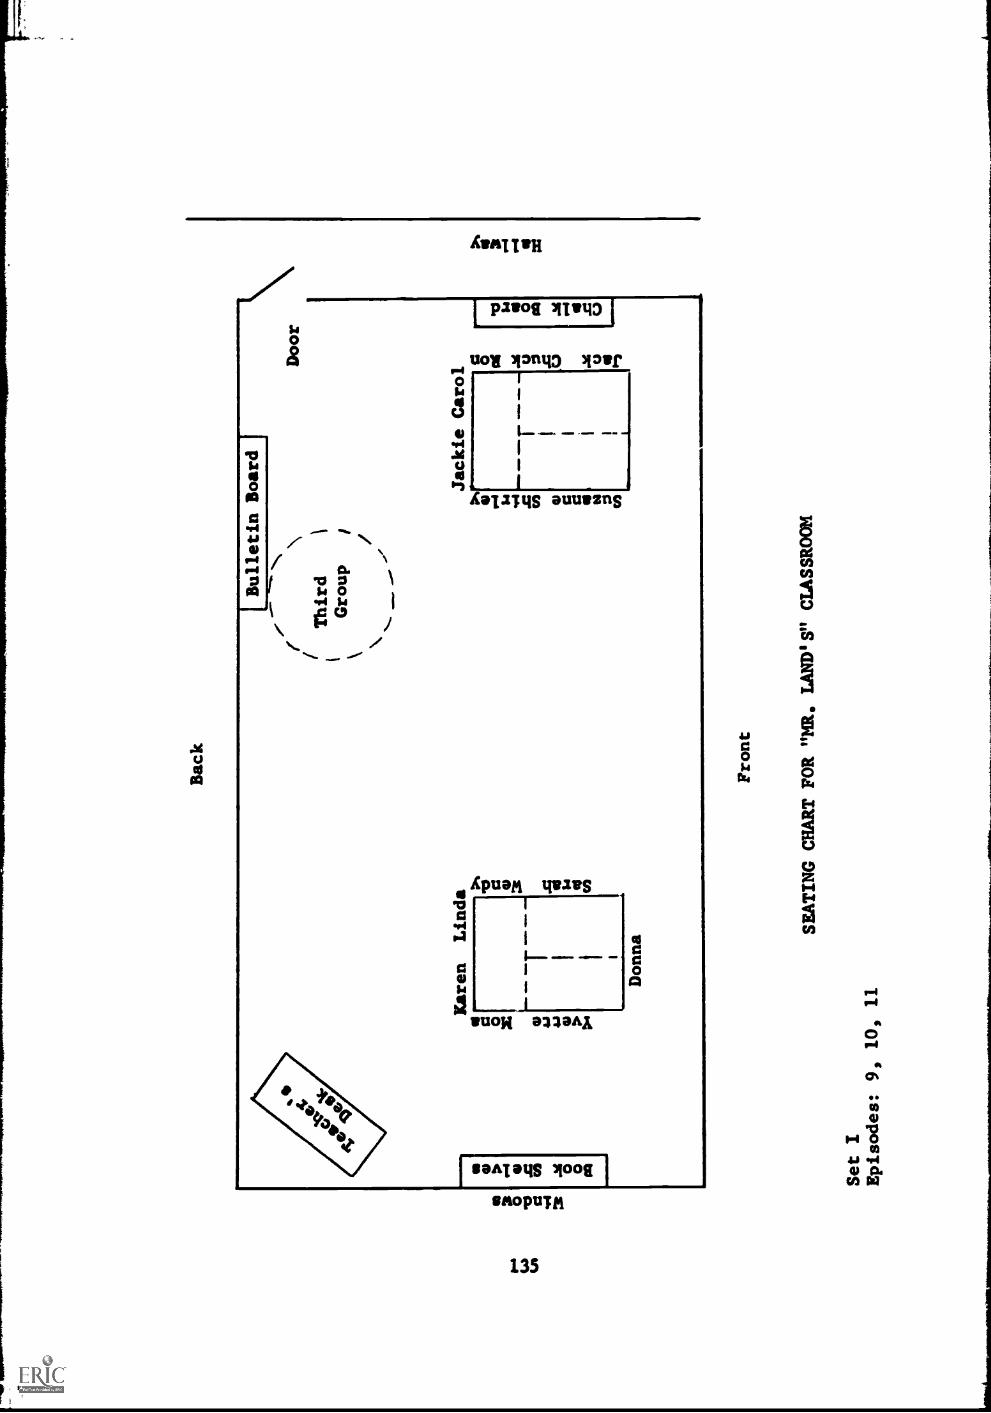
SET
Windows
I Book Shelves
I
Yvette Mona 0 ai
I o m
...mar. =raw ..1 I
t-1 I ph
I o.
Sarah Wendy o
Suzanne Shirley ao
ram Mr =MD
1
1
I
=NW 1 I
1
LI 0 a $0
ph A
P P1
Jack Chuck Ron
r-Chalk Board
1
0 14
Hallway
0 0 PI a.
r 0 PI
Z-b
to 0 o ar

Back
IBulletin Board
Door
40,
44D
Terry
Keith
Randy
Jack
i
0 X iii
0 c. 4 C.4 0 0 Is CB
Bryan
Larry
Greg
Dan
Bob
Ron
Karen
Suzanne
Sarah
Carol
Chuck
0 0 re
a.
Front
SEATING CHART FOR "MR. LAND'S" CLASSROOM
Set II
Episodes:
11, 12, 16
APPENDIX D
DATA COLLECTION MATERIALS

SIMULATION TOSTIIST DATA
NueSeries
Rp. Time Dc R Ep. Time Dc R
1 11
2 12
3 13.....4 14
5 15
6 16
7 17......8 ...... ........ 18 .........
9 19
10 .. 20....
138
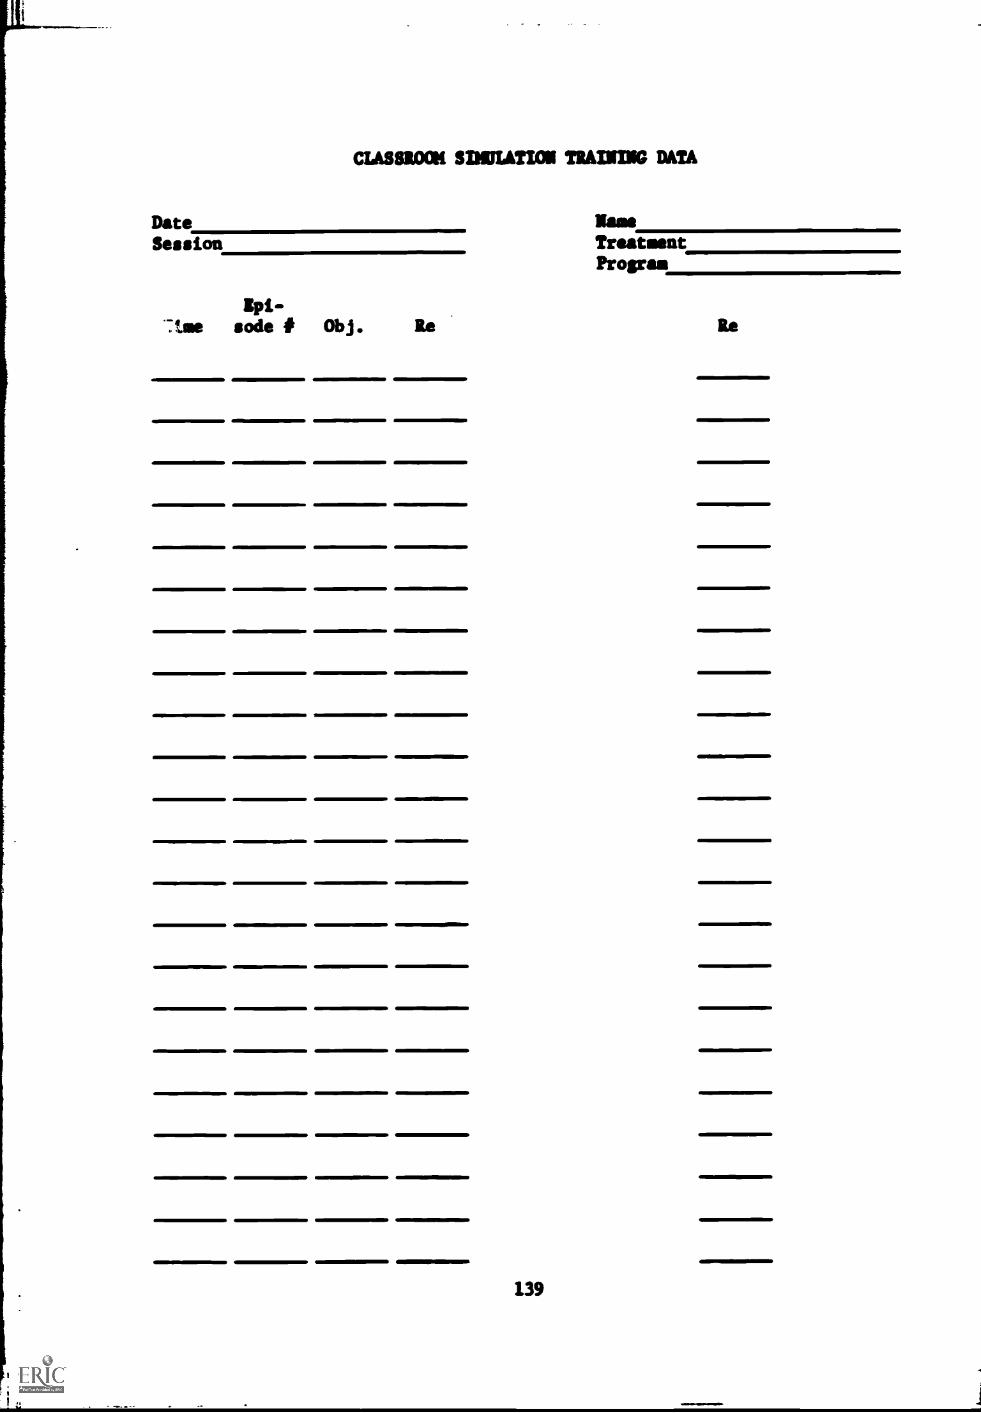
CLASSROOM SIMULATION TRAINING DATA
Date lame
Session TreatmentProgram
Epi-:toe sole # Obj. Re Re
139

APPENDIX E

Description of School and CommunitT1
Mr. Land's sixth grade is one of two sixth-grade classes in a small
elementary school of approximately 300 students in the Pacific Northwest.
The school, College Grove Elementary, serves a small community and the
surrounding rural area. It is also used extensively by the state college
nearby in connection with the teacher education program of that institution.
Most of the elementary school staff also hold appointments with the college
as supervising teachers. The youngsters in the school are used to visitors
and a constant turnover of student teachers. The sixth-graders have been
exposed to television equipment as part of special demonstrations, have been
selected out individually for special testing and observation by college
students, and have even been used as subjects in research experiments with
teaching machines, educational films, and team teaching.
All told, the morale of the College Grove Elementary School staff is
high. The rapidly growing college is having a very evident impact on the
community. New houses are being built at an increasing rate. The city
council has been awarded a planning grant for an urban renewal project and
the homeowners in the blighted areas of the community have been cleaning up
their neighborhoods, painting and rebuilding rundown dwellings.
There are six grades in the College Grove Elementary school, plus a
kindergarten which is supported, primarily, by the college. There are no
state-supported kindergartens. The school population is relatively stable,
so most of the youngsters in Mr. Land's sixth grade have been in residence
since the first grade. In the last two years Mr. Land has had this
harsh, 1965a
141
particular class, so he knows the youngsters and their parents very well by
now. He is a very warm and supporting teacher, so he has won the love and
respect of this class. They confide in him and seek his counsel and advice
on almost any matter of personal concern.
Mr. Land is not a strict disciplinarian. The class members are
given a great deal of freedom and responsibility for their own behavior.
However, there is one principle which is strictly enforced; any behavior
which interferes with the efforts of others to learn is not tolerated.
Mr. Land feels that learning can take place in any situation, and at any
time. He encourages individuals and groups to engage in projects of self
study and often will allow youngsters to pursue a line of personal interest,
even when it interferes with the regular program of instruction. He does
not advocate any particular learning theory or philosophy of education, but
evidently feels strongly that his primary role as teacher is to remove all
obstacles to learning and to foster a social environment in the classroom
which will open lines of communication between student and teacher.
The Principal of College Grove Elementary School allows the instruc-
tional staff a great deal of freedom in the conduct of their respective
classes. He is proud of his staff and lets them know frequently, in public,
that he considers them to be master teachers capable of supervising student
teachers, conducting demonstrations, and generally assisting him in the
functions he is responsible for as Principal. At the same time, the
Principal has the difficult task of attempting to offer the kind of program
that the state college requires and at the same time to operate within the
budgetary limits and somewhat restricting policies of the school board.
The school has a part-time nurse, a very adequate curriculum library,
and has access to the Educational Media Center and library resources of the
142
state college. It also has access to the physical education facilities of
the college, making use of the pool, gym, and other facilities.
The Community
The town of College Grove has a population of approximately 7,000
people and is the home of Pacific State College. No one is quite sure how
many of the 3,500 college students are included in the town's census. If it
were not for the influence of the state college, College Grove would not be
considered very prosperous. It has no industrial support, and a large por-
tion of the population are people over the age of 50. Despite its obvious
dependence on the college, the townspeople have net identified closely with
the college until recently. Consequently, the merchAnts and city fathers
are oriented primarily to the needs of the farmers and workers in the lumber
industry in the surrounding area.
College Grove is not isolated, by any means. Just two miles away is
the town of Milton which is just slightly smaller in population. Milton,
however, is the center of business activity for the two communities. The
city planners feel that the two communities are rapidly growing together.
Already the two communities have integrated their schools and built the new
high school exactly half way between the two city centers. A new supermarket
was built two years ago and is also located across the highway from the high
school. People in the surrounding area are prone to speak of the two
communities as the "College Grove- Milton" area.
Milton is built along the banks of a large river so the local lumber
industry is concentrated in that community as well. In fact, Milton has a
small operating lumber mill.
143

Generally speaking, the two communities of College Grove and Milton
constitute a single, loosely knit community of approximately 12,000 persons
in the midst of several other larger communities. Ten miles to the north is
another community of approximately 6,000. To the south 20 miles is a
community of 25,000 people and to the east 18 miles is the state capitol,
population 65,000. Eventually College Grove and Milton may become the
suburbs of the capital city.
144

Suzanne Shirley Wendy
Chuck
Back
Donna
Linda
Karen
Sarah
Larry
Bryan
Yvette
Mona
Dan
Greg
Bulletin Board
Door
Terry
Keith
Randy
Jack
Bob
Ron
Jackie
Carol
Front
SEATING CHART FOR "MR, LAND'S" CLASSROOM
Orientation
APPENDIX F
TRAINING MATERIALS
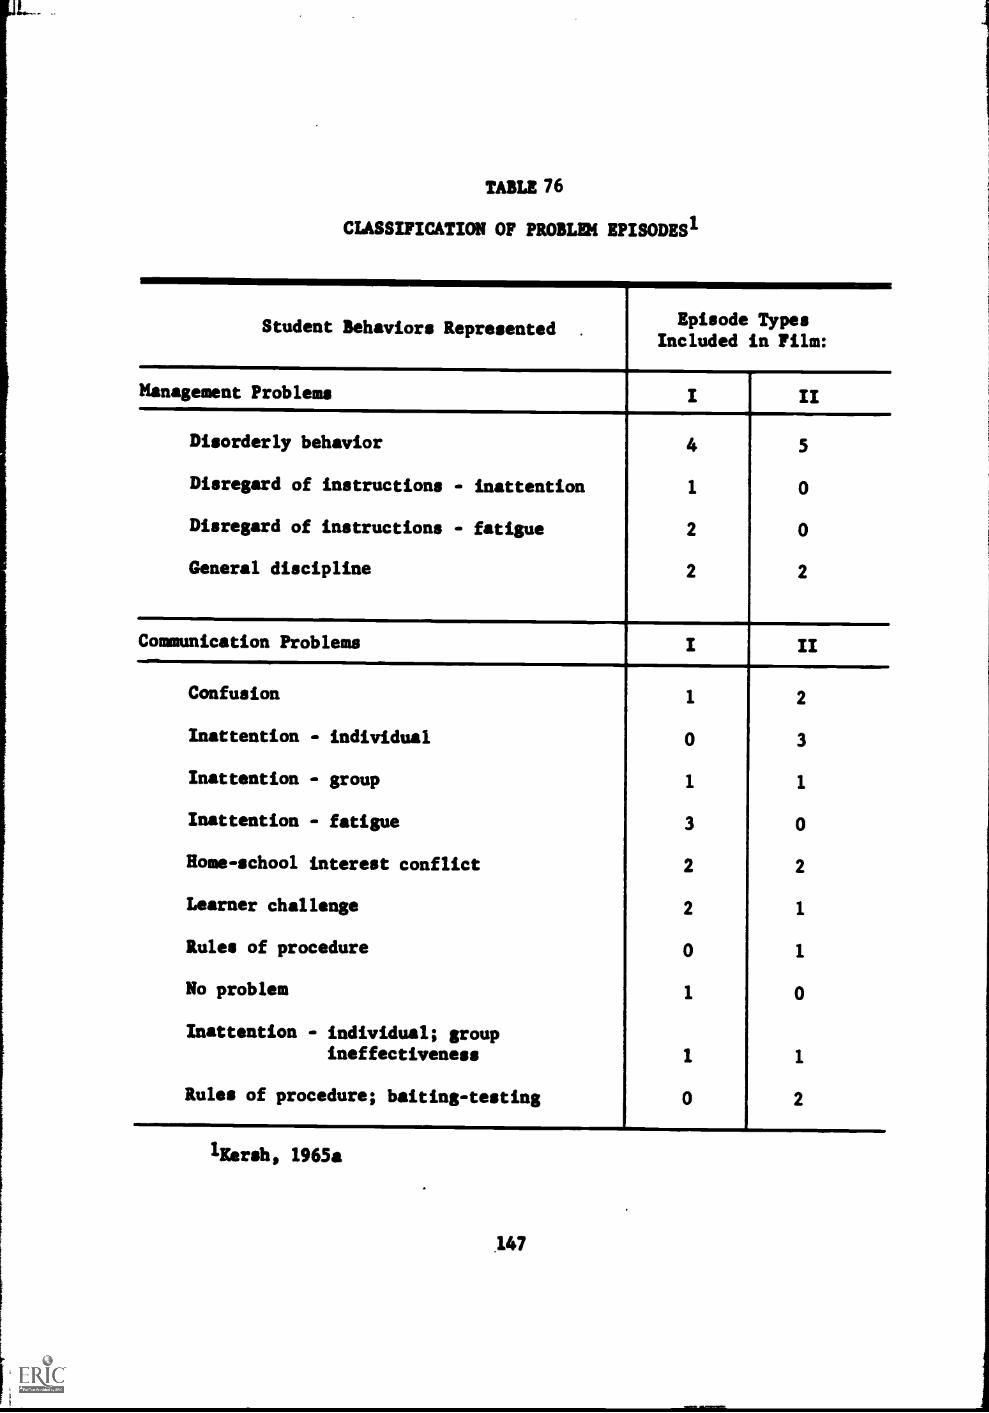
TABLE 76
CLASSIFICATION OF PROBLEM EPISODES'
,
Student Behaviors Represented.
.
Episode TypesIncluded in Film:
Management Problems I II
Disorderly behavior 4 5
Disregard of instructions - inattention 1 0
Disregard of instructions - fatigue 2 0
General discipline 2 2
Communication Problems I II
Confusion 1 2
Inattention - individual 0 3
Inattention - group 1 1
Inattention - fatigue 3 0
Rome-school interest conflict 2 2
Learner challenge 2 1
Rules of procedure 0 1
No problem 1 0
Inattention - individual; groupineffectiveness 1 1
Rules of procedure; baiting-testing 0 2
lEarsh, 1965a
.147

Principles of Behaviorla
1. In situations involving rules of procedure when the student teacher isnot informed of the rules, defer to authority vs establish own rules.
2. Be attentive to the entire class as well as the individual vs beattentive either to the individual or to the class only.
3. When learners appear bored or inattentive in a situation that does notfulfill the instructional objectives, deal with the group vs deal withthe individual(s).
4. When confronted with conflicting home-school interests, maintain aneutral position vs take sides.
5. When learners exhibit behavior which deviates from instructionalobjectives, deal with the individual(s) directly with minimal disrup-tion of instructional continuity vs disrupt instruction.
6. Encourage student initiative to learn vs discourage student initiativeto learn.
7. When direct action is required to control a disruptive group orindividual, communicate at close range vs communicate from a distance.
8. When direct action is required to control a disruptive group orindividual, act quickly vs delay.
9. Show supporting manner vs show nonsupporting manner.
10. When learners appear disinterested or confused, stimulate a more'active, interested response vs make no effort to change the learner'sresponse.
11. Discourage undesirable behavior vs encourage undesirable behavior.
1Kersh, 1965a
2These standards have been written with the positive action first.The segment following the versus (vs) indicates a "mirrored" or negativeaction that the St might implement unsuccessfully. The experimenter usesthe standards as criteria by which he may categorize a St's response, i.e.,for standard 1 the St may defer to authority be telling a student to "AskMr. Land" or he may establish his own rules by saying "Yes, you may go now."
148
H

Categorization of St Responses: An Example
A hypothetical dialogue is shown below to exemplify the categorization of IIresponses. The example shown is based on an episode whose assigned standardsare: (1) in situations involving rules of procedure when the student teacheris not informed of the rules, defer to authority vs establish own riles, and,(2) show supporting manner vs show nonsupporting manner.
Filmed problem scene: Scene opens on class about half empty. Jack approachesthe jit and says that he has been sick the previous day and should not beallowed to play during recess.
St: "How do you feel now, Jack?"E feedback: "Jack would say, 'I still don't feel well.'"St: "Well then, why don't you go back and rest."E feedback: "Jack would nod and return to his seat."
In the example given above the E first attempted to force the St to make adecision about Jack by merely reiterating Jack's dilemma. The second"feedback was a description of one of the filmed feedbacks originally preparedby Kersh. The E's description of the feedback is intended to be non-evaluative of the St's response.
The St's response would be categorized as a type B (see bottom) or as beingsupportive but not instituting standard (I) by establishing the "rule" thatJack might rest rather than participate in the recess.
TABLE 77
SCORING MATRIX
Used Standard I Did Not Use Standard I
Used Standard II Response Type A--
3 points
Response Type B --
2 points
Did Not Use Standard Response Type C--
2 points
Response Type D --
1 point
No Response Given to theStimulus Situation Response Type E
0 points
149

"explains the training procedure. Verbal mode its I
(group I) will receive one explanation: filmed modeSts (group II) another
E begins timing episode
4
1
St reads the episode description
E presents stimulus to it: group I will hear taped 1
presentation; group II will view a film of the sameepisode.
al responds
41
,categorizes response and records response type 1
4
I
;K1l'sverbalized feedback appropriate to s
response typeI
r! &asks SL what cues he observed
IIs this first response?
Yes1 Mu
....
; It gives all relevant cuesi rat does not give all relevant cues
OP ....M..... . . .
£ records cues discriminated, f, records number of cues discriminated
, questions and/or recycles at (repeatstaped stimulus for group I; reshowsfilm for group II) until all relevantcues are acknowledged. E records prompts
. and recyclings.
4-
Was the last response a type A?!
Yes Not
Z.
[-Lrecords elapsed episode trainini time!
Move to next episode
Finish episode 20
Fig. 9.--Simaction training format.
131