of ontario’s public - ministry of finance · thank you for inviting me to chair the commission on...
TRANSCRIPT

COMMISSIONO N T H E
REFORMO F
ONTARIO’SPUBLICSERVICES
2012
Public ServiceS for ontarianS: A PATH TO SUSTAINABILITY AND EXCELLENCE


COMMISSIONO N T H E
REFORMO F
ONTARIO’SPUBLICSERVICES
2012
Public ServiceS for ontarianS: A PATH TO SUSTAINABILITY AND EXCELLENCE

For electronic copies of this document, visit our website atwww.fin.gov.on.ca/en/reformcommission/
© Queen’s Printer for Ontario, 2012ISBN 978-1-4435-8896-6 (Print)ISBN 978-1-4435-8897-3 (HTML)ISBN 978-1-4435-8898-0 (PDF)
Ce document est disponible en français sous le titre :Commission de réforme des services publics de l’Ontario

Table of Contents
i
Table of Contents
Message from the Chair...................................................................................................................................... vii
Commission Member Biographies.............................................................................................................. xi
Executive Summary................................................................................................................................................. 1
Chapter 1: The Need for Strong Fiscal Action
The Outlook: Three Scenarios ..................................................................................................................................70
Debt and Deficits.......................................................................................................................................................78
The Economy: How Did We Get Here?.....................................................................................................................81
The Economy: What Lies Ahead?.............................................................................................................................86
Revenue Implications................................................................................................................................................91
Spending Outlook......................................................................................................................................................96
Conclusion ..............................................................................................................................................................107
Chapter 2: The Fiscal Challenge in Context
The 1990s ...............................................................................................................................................................109
Ontario: A Closer Look............................................................................................................................................113
Revenues and Expenditures: How Ontario Compares............................................................................................116
The Challenge.........................................................................................................................................................121
Chapter 3: Our Mandate and Approach
The Commission’s Mandate....................................................................................................................................123
Broad Guidelines for Actions Aimed at Balancing the Budget.................................................................................124
Ambitious for Excellence: A Larger Vision ..............................................................................................................130
What Does Being the Best at Public Policy and Services Look Like?.....................................................................130

ii
Chapter 4: Making Transformation Work: Process and Structures
Budget Planning...................................................................................................................................................... 136
Chapter 5: Health
Background............................................................................................................................................................. 145
The Cost: Now and Ahead ...................................................................................................................................... 147
Is the Health Care System Sustainable? ................................................................................................................ 149
Hard Truths, Measures and Comparisons .............................................................................................................. 152
What Is the Opportunity? ........................................................................................................................................ 167
Recommendations to Turn Problems into Realized Opportunities.......................................................................... 174
Fiscal Issues ........................................................................................................................................................... 176
Integrating the Silos into a Health Care System...................................................................................................... 176
LHINs 2.0 ................................................................................................................................................................ 178
Governance and Structures .................................................................................................................................... 184
Evidence-based Policy............................................................................................................................................ 185
Hospitals ................................................................................................................................................................. 187
Physicians............................................................................................................................................................... 188
Community Care, Home Care and Long-Term Care............................................................................................... 192
Health Promotion and Prevention ........................................................................................................................... 193
Medical Schools/Training ........................................................................................................................................ 195
Pharmaceuticals ..................................................................................................................................................... 195
Cost Efficiencies ..................................................................................................................................................... 199
Scope of Public Sector............................................................................................................................................ 200
Reform Process ...................................................................................................................................................... 200
Conclusion .............................................................................................................................................................. 202
Chapter 6: Elementary and Secondary Education
Historical Context and Recent Trends .................................................................................................................... 203
The Current Challenge............................................................................................................................................ 205
Commission’s Principles and Goals........................................................................................................................ 207
Investments for the Future in First Nations Education ............................................................................................ 209
Affordability of the Full-Day Kindergarten Program................................................................................................. 213
Table of Contents
iii
Class Sizes .............................................................................................................................................................215
Non-Teaching Staff .................................................................................................................................................218
Limits to Funded Secondary School Credits ...........................................................................................................219
Encouraging Efficient Student Transportation.........................................................................................................220
A Comprehensive Resource Plan to Live Within One Per Cent Per Year in Education ..........................................222
Promoting Evidence-Based Solutions in Special Education....................................................................................225
Reform of Provincial Schools ..................................................................................................................................227
Appropriate Incentives for Teachers .......................................................................................................................228
Delivering Services More Efficiently ........................................................................................................................230
Containing Costs of Retirement Benefits ................................................................................................................234
Promoting an Efficient Labour Market for Teachers ................................................................................................236
Chapter 7: Post-Secondary Education
Challenges Ahead...................................................................................................................................................240
Need for Clear Objectives .......................................................................................................................................241
Status Quo Is Unsustainable...................................................................................................................................242
Thrust of Our Recommendations ............................................................................................................................244
Conclusion ..............................................................................................................................................................258
Chapter 8: Social Programs
The Challenge.........................................................................................................................................................261
Transforming Ontario’s Benefit Programs ...............................................................................................................261
Child Welfare...........................................................................................................................................................270
Ontario Child Benefit ...............................................................................................................................................270
Other Social Programs............................................................................................................................................271
Contributions of the Non-Profit Sector.....................................................................................................................273
Social Impact Bonds ...............................................................................................................................................274

iv
Chapter 9: Employment and Training Services
Why Provide Employment and Training Services? ................................................................................................. 277
Ontario Labour-Market Challenges ......................................................................................................................... 278
Employment and Training Services Provided by Ontario Ministries........................................................................ 279
Strengthening Labour-Market Information and Evidence-Based Policy .................................................................. 283
Leveraging Workforce Planning Boards.................................................................................................................. 284
Improving the Link between Training and Economic Development ........................................................................ 285
Ontario’s Apprenticeship System ............................................................................................................................ 286
Chapter 10: Immigration
The Economic Importance of Immigration .............................................................................................................. 287
Recent Trends in Immigration ................................................................................................................................. 288
Immigrant Integration .............................................................................................................................................. 291
Chapter 11: Business Support
Economic Vision ..................................................................................................................................................... 299
Poised for Growth ................................................................................................................................................... 302
Types of Business Support ..................................................................................................................................... 305
Our View on Business Subsidies ............................................................................................................................ 308
Chapter 12: Infrastructure, Real Estate and Electricity
Infrastructure........................................................................................................................................................... 321
Real Estate ............................................................................................................................................................. 326
Electricity................................................................................................................................................................. 327
Chapter 13: Environment and Natural Resources
Need for Transformation ......................................................................................................................................... 335

Table of Contents
v
Chapter 14: Justice Sector
Historical Context ....................................................................................................................................................347
Commission Principles and Goals for the Justice Sector ........................................................................................351
Efficiencies ..............................................................................................................................................................357
Capital Infrastructure...............................................................................................................................................359
Federal Government ...............................................................................................................................................360
Chapter 15: Labour Relations and Compensation
Size of Broader Public-Sector Labour Force and Degree of Unionization ..............................................................363
Trends in Ontario Labour Relations and Employment.............................................................................................364
Total Compensation ................................................................................................................................................364
The Challenge.........................................................................................................................................................366
Principles.................................................................................................................................................................368
A Balanced, Effective and Transparent System......................................................................................................369
Chapter 16: Operating and Back-Office Expenditures
Context....................................................................................................................................................................383
The Challenge.........................................................................................................................................................386
ServiceOntario Transformation ...............................................................................................................................387
Review Existing Agency Mandates .........................................................................................................................390
Expand the Use of Delegated Administrative Authorities to Deliver Regulatory Services.......................................391
Use Alternative Service Delivery Options for Information and Information Technology Functions..........................394
Balance the Requirements of Accountability and Efficiency for Government Operations .......................................395
Expanding Shared Services to the Broader Public Sector ......................................................................................396
Create Efficiencies in the Administration of Transfer Payment and Grant Programs..............................................400
Chapter 17: Government Business Enterprises
Ontario’s Government Business Enterprises ..........................................................................................................403
Creating Additional Value from Ontario’s GBEs......................................................................................................406
vi
Chapter 18: Revenue Integrity
Increasing Compliance............................................................................................................................................ 411
Non-Tax Revenue................................................................................................................................................... 417
Tax Revenue........................................................................................................................................................... 419
Chapter 19: Liability Management
Introduction ............................................................................................................................................................. 429
Upcoming Liability Risks ......................................................................................................................................... 431
Environmental Risks ............................................................................................................................................... 440
Risks to Ontario Posed by the Federal Government............................................................................................... 441
Risks to Ontario Posed by the Municipal Sector ..................................................................................................... 443
Unknown Risks ....................................................................................................................................................... 446
Taxpayer Protection Act.......................................................................................................................................... 447
Chapter 20: Intergovernmental Relations
Federal-Provincial Relations ................................................................................................................................... 450
Introduction: Federal-Provincial Context ................................................................................................................. 450
Potential Federal Impacts on Ontario’s Fiscal Position ........................................................................................... 457
Areas for Potential Reform...................................................................................................................................... 462
Working Together to Rationalize Public Services ................................................................................................... 469
Provincial-Municipal Relations ................................................................................................................................ 476
The Fiscal Relationship........................................................................................................................................... 476
Recent Historical Provincial Support to Ontario’s Municipalities ............................................................................. 477
Looking Forward — Provincial Support to Municipalities ........................................................................................ 480
The Province and Municipalities Share the Property Tax Base .............................................................................. 484
Enhancing Efficiency in the Service Delivery Relationship ..................................................................................... 485
Appendix 1: Commission Recommendations .............................................................................487
Appendix 2: List of Acronyms..................................................................................................................537

Message from the Chair
vii
Message from the Chair
Dear Premier McGuinty and Minister Duncan:
Thank you for inviting me to chair the Commission on the Reform of Ontario’s Public Services.
This can be an important turning point in the province’s history and I welcome this opportunity
to present the ideas contained in this report.
I especially appreciate the extraordinarily wide mandate you gave the Commission, which
makes it much more than a simple exercise in cost-cutting. It has allowed us to delve into
almost every corner of the government’s activities and to think long and hard about how
government can work better for the benefit of everyone in the province. It recognizes that the
people of Ontario deserve the finest public services at a cost that is affordable.
Let me first thank the other three commissioners. Dominic Giroux, Susan Pigott and
Carol Stephenson brought to this work long and varied experience and keen minds that added
enormously to the quality of our thinking. The Commission’s work has benefited from the views
and work of many people, both inside and outside the government, who took time to share
their views with us. We had excellent support from the Secretariat under the leadership of
Scott Thompson. Members of the Ministry of Finance were particularly helpful, but we also
benefited from the wise counsel of many people in the Ontario government, who gave us
generous access to their ideas and data.
With such a broad mandate to be carried out over a limited period, we were not able to
conduct comprehensive consultations. But every group we asked to meet us not only accepted
our invitation, but offered great ideas for reforms in their domains. We thank them all.
Ontario faces two serious fiscal challenges. The first is to get out of the current large
deficit. This will take many years, but the task does not end there. It goes almost without
saying that every effort must be made to bolster future economic growth rates, and much has
been done in that regard, such as reinvesting in education and reforming the tax system. But
with a looming slowdown in the expansion of the labour force that is almost upon us and with
the province’s weak productivity growth of late, Ontario cannot count on a resumption of its
historical strong growth rates. This means that the sharp degree of fiscal restraint needed over
the next few years to eliminate the deficit may see a point of some reprieve, but not much.
Spending simply cannot return to recent trends.

viii
This context lifts the task ahead well beyond that of merely cutting or restraining costs.
We must be students of history and history shows that simple cost-cutting by governments too
often generates fiscal improvements that peter out after a few years as pressures build.
In the end, spending surges again and the result is more of the same, but at a higher cost.
The only way to get out of deficits and stay out, in a period of limited economic growth, is to
reform government programs and the manner in which they are delivered.
This should be viewed as an opportunity, not a problem. Ontario can and should have the best
public services in the world; this is an opportunity to reach for that goal. To get there, we
should study promising practices around the world by others who have faced similar issues.
But to be the best, we must go beyond that. Ontario should become the first government to
relentlessly pursue quality and efficiency in public services. It is often argued that governments
cannot do this because they lack the discipline imposed by a bottom-line profit imperative and
shareholders to hold them to it. But the Ontario government has over 13 million shareholders
who do not want their government to run deficits and believe they already pay enough
taxes. That should be incentive enough.
What we need is to drive those incentives into every corner of government and the broader
public sector. Programs need clear objectives. Metrics must be created to track whether
programs meet those objectives. If not, the programs must be changed.
The government must constantly benchmark its effectiveness and efficiency against the
private sector and against the best public services in the world. It must be prepared to shed
old priorities (and offend their advocates) and set new priorities (which often have no
advocates) as they arise.
It must make tough decisions on which services are best delivered by the public service and
which can be better done by others, in the private sector.
The calling of public service must be restored to a position of honour and respect, so it can
draw the province’s best and brightest. Their performance should be adequately compensated
and rewarded –– not for effort, but for results. There is huge value in a public service that can
think deeply and wisely about public policy and deliver effective programs in an
efficient manner.

Message from the Chair
ix
Ontario must be the leader in shifting public services from a reactive to a proactive
mode. Whether it is health care, social services, education, training, economic development
or almost anything else, governments typically patch up things once something has gone
wrong. Ontario must shift to foreseeing problems and cutting them off before they develop.
This in turn requires a government with a serious research capacity, both internally and
through what it can draw from the outside.
The Commission has made hundreds of recommendations for improving the effectiveness and
efficiency with which public services can be delivered.
None of these choices will be easy and many of our proposals will draw vigorous criticism.
But it must be kept in mind that our recommendations can deliver the needed degree of
spending restraint to balance the budget by 2017–18 only if all are implemented. This imposes
a discipline of its own. We expect that many of our recommendations will be rejected. We
accept that, but each rejected recommendation must be replaced not by a vacuum, but by a
better idea –– one that delivers a similar fiscal benefit.
Our recommendations are daunting in depth and scope. Indeed, they may seem
overwhelming, even to the point that the government may fear that they exceed its political
and bureaucratic capacity to carry them out. But there is benefit to moving quickly on many
fronts at once. Targeting certain programs or sectors for reform and restraint can generate a
sense of unfairness. A wide-ranging reform effort will reinforce the notion that we are all in this
together, that all Ontarians can support the reforms because they will benefit in the end from
these changes. And none of this will work if there is no public support.
Although we have not made a formal recommendation on this point, I urge you to consider
holding broader consultations on the economic and fiscal challenges facing this province.
Ontarians have not yet grasped the extent to which the slow decline of this province’s
manufacturing base has undermined both its historic economic advantage relative to the rest
of Canada and the provincial government’s long-term ability to finance the public services they
treasure. You should go beyond a legislative body to review our report and consult as well with
the wider public through town hall gatherings and meetings of stakeholders. An informed
public is essential to the success of the reforms.

x
Action must begin very soon. The deficit is expected to be $16 billion this year. By 2017–18, it
will almost double –– and the debt will climb to more than half of gross domestic product –– if
the status quo is left in place. Decisive, firm and early action is required to get off this slippery,
and ultimately destructive, slope. At a time when the news is full of stories of countries around
the world that have failed the fiscal test and slid into the ditch, to the enormous detriment of
their citizens, Ontario must be different. It must be the best.
Don Drummond
Chair
Commission on the Reform of Ontario’s Public Services
Acknowledgments
A special thanks to the Secretariat to the Commission on the
Reform of Ontario’s Public Services:
Barb Brownlee, Stephen Donnelly, Craig Fowler, Caspar Hall, Art Komarov,
Jenna LeBlanc, Kaleb Ruch and Jonathan Tekle.

Commission Member Biographies
xi
Commission Member Biographies
Don Drummond, Chair
Don Drummond is currently Matthews Fellow in Global Public
Policy, Queen's University. Mr. Drummond was born and raised
in Victoria, British Columbia, where he graduated from the
University of Victoria. He subsequently received his M.A. in
Economics from Queen's University. He also holds an honorary
doctorate from Queen's University.
Mr. Drummond joined the federal Department of Finance upon
completing his studies at Queen's. During almost 23 years at
Finance, Mr. Drummond held a series of progressively more
senior positions in the areas of economic analysis and
forecasting, fiscal policy and tax policy. His last three positions
were, respectively, Assistant Deputy Minister of Fiscal Policy
and Economic Analysis, Assistant Deputy Minister of Tax
Policy and Legislation and, most recently, Associate Deputy
Minister. In this latter position Mr. Drummond was responsible
for economic analysis, fiscal policy, tax policy, social policy and
federal-provincial relations. In particular, Mr. Drummond
co-ordinated the planning of the annual federal budgets.
From 2000 to 2010, Mr. Drummond served as Senior Vice
President and Chief Economist, TD Bank. Mr. Drummond led
TD Economics' work in analyzing and forecasting economic
performance in Canada and abroad. TD Economics also
analyzes the key policies that influence economic performance,
including monetary and fiscal policies.

xii
Dominic Giroux, Commission member
Dominic Giroux is the President and Vice-Chancellor of
Laurentian University.
Prior to his appointment at Laurentian, Mr. Giroux was
Assistant Deputy Minister with the Ontario Ministry of Education
and the Ministry of Training, Colleges and Universities, after
having served as CFO of two French-language school boards
in southern and eastern Ontario.
Mr. Giroux started in education as a school board trustee at
age 19 and was elected board chair at 21 in Ottawa. In 2011,
he received one of Canada's "Top 40 Under 40" Awards.
Mr. Giroux serves as chair of the board of directors of the
Northern Ontario School of Medicine, national co-chair of the
Consortium national de formation en santé (CNFS), co-chair of
the Ontario Council on Articulation and Transfer (ONCAT), and
board member of the Centre for Excellence in Mining
Innovation (CEMI), the Greater Sudbury Development
Corporation (GSDC) and the Greater Sudbury Food Bank.
He also served as co-special advisor on the implementation of
the Northern Policy Institute and was appointed to the
province’s Ring of Fire Advisory Council.
A member of the Ontario College of Teachers, Mr. Giroux holds
bachelor's degrees in social sciences and education from the
University of Ottawa, and an MBA from the École des Hautes
Études Commerciales (HEC) in Montreal.

Commission Member Biographies
xiii
Susan Pigott, Commission member
Susan Pigott is the Vice President, Communications and
Community Engagement at the Centre for Addiction and Mental
Health (CAMH) in Toronto.
She trained as a nurse at the Wellesley Hospital School of
Nursing in Toronto and then worked as a registered nurse for
10 years in Toronto and in Australia and Papua New Guinea.
In 1978, Ms. Pigott earned a master's degree in social work at
the University of Toronto. Since then, she has worked in the
non-profit human services field for over 25 years. Prior to
CAMH, she was Chief Executive Officer of St. Christopher
House, a community-based, multi-service agency that operates
in the west end of Toronto. Prior to that, she spent seven years
at the United Way of Greater Toronto, first as Allocations
Director and then as Vice President of Fundraising.
In 2006–07, she took a leave of absence from St. Christopher
House to serve as the Executive Lead for Citizen Engagement,
supporting the Ontario Citizens’ Assembly on Electoral Reform.
An active volunteer, Ms. Pigott has served on several boards
including the Community Social Planning Council, the Hospital
for Sick Children and Soulpepper Theatre Company. Currently,
she is a board member of the Greater Toronto CivicAction
Alliance, the Change Foundation and Workman Arts.

xiv
Carol Stephenson, O.C., Commission member
Carol Stephenson is the Dean of the Richard Ivey School of
Business at The University of Western Ontario, as well as the
Lawrence G. Tapp Chair in Leadership.
Since joining Ivey in 2003, Carol Stephenson has led the drive
to reshape the teaching of business education. As a widely
respected CEO, she brings more than 30 years of progressive
experience in marketing, operations, strategic planning,
technology development, and financial management to
Canada's premier business school.
Ms. Stephenson currently serves on several boards for top
Canadian companies and on important government
committees. She is a Director of Intact Financial Services
Corporation (formerly ING Canada) and Manitoba Telecom
Services Inc. Carol served as a board of directors member for
GM Canada, until she was appointed by the governments of
Canada and Ontario to serve as a board member for General
Motors Company. Ms. Stephenson is Chair of the Ontario
Research Fund Advisory Board, and Chair of the federal
government’s Advisory Committee on Senior Level Retention
and Compensation. In November 2006, she was appointed by
the federal government to serve on the board of directors of the
Vancouver Olympic Games Organizing Committee (VANOC).
She has earned significant recognition for her community work
and industry involvement. Notably, in December 2009,
Ms. Stephenson was appointed Officer of the Order of Canada.
Photo Credit: Jovan Matic

Executive Summary
1
Executive Summary
Ontarians want excellent public services from their government. The Commission on the
Reform of Ontario’s Public Services understands and supports this desire. We see no reason
why Ontario cannot have the best public services in the world — with the proviso that they
must come at a cost Ontarians can afford. With such a goal, we face three overarching tasks.
First, we must understand Ontario’s economic challenges and address them directly. Second,
we must firmly establish a balanced fiscal position that can be sustained over the long term.
And third, we must sharpen the efficiency of literally everything the government does so
Ontarians get the greatest value for money from the taxes they pay. This report addresses
these issues and offers a road map to a day when Ontarians can count on public services
that are both excellent and affordable — the public services Ontarians want and deserve.
The Need for Strong Fiscal Action
Ontario faces more severe economic and fiscal challenges than most Ontarians realize.
We can no longer assume a resumption of Ontario’s traditional strong economic growth
and the continued prosperity on which the province has built its public services. Nor can
we count on steady, dependable revenue growth to finance government programs. Unless
policy-makers act swiftly and boldly to prevent such an outcome, Ontario faces a series of
deficits that would undermine the province’s economic and social future. Much of this task
can be accomplished through reforms to the delivery of public services that not only contribute
to deficit elimination, but are also desirable in their own right. Affordability and excellence are
not incompatible; they can be reconciled by greater efficiency, which serves both the fiscal
imperative and Ontarians’ desire for better-run programs. Balancing the budget, however,
will also require tough decisions that will entail reduced benefits for some. Given that many
of these benefit programs are not sustainable in their current form, the government will need
to decide how best to target benefits to those who need them most. The treatment may be
difficult, but it is worth the effort.
Ontario’s $14 billion deficit in 2010–11 was equivalent to 2.3 per cent of gross domestic
product (GDP), the largest deficit relative to GDP of any province. Net debt came to
$214.5 billion, 35 per cent of GDP. The 2011 Ontario Budget set 2017–18 as the target year
to balance the books — at least three years behind any other province. The government
asked this Commission to help meet and, if possible, accelerate the deficit-elimination plan.

2
First, we assessed the 2011 Budget Scenario for the next seven years; while the government
maintained that it was committed to balancing the budget by 2017–18, we concluded, as did
the Auditor General, that the 2011 Budget measures alone would not likely lead to balance.
If there are now plans under development within government to secure all of the fiscal
restraint, they have not been provided to the Commission.
Next, we developed a Status Quo Scenario, our own view of how Ontario’s finances would
unfold if no changes were made to government policies, programs or practices. We used
assumptions for both economic and revenue growth that were more cautious than those in
the 2011 Budget, largely because the economic outlook had deteriorated since March 2011.
We also assumed that the growth of programs would continue to be driven by inflation,
population growth, aging, school enrolments and so on.
The resulting projection indicated that the deficit would more than double to $30.2 billion in
2017–18 and net public debt would reach $411.4 billion, equivalent to just under 51 per cent
of the province’s GDP. To avoid that outcome, we devised a Preferred Scenario for the
budget path that would balance the budget in 2017–18. It incorporates a revenue projection
that is substantially lower than that of the 2011 Budget and a much reduced track for
program spending.
Meeting the target will be difficult, but we believe our recommendations will accomplish the
job. Although our mandate expressly forbids us from proposing new or increased taxes, there
are ways the government can raise some additional revenues. Still, most of the burden of
eliminating the $30.2 billion shortfall in 2017–18 must fall on spending. To balance the budget,
the province must target a spending level in 2017–18 that is 17 per cent lower than the sum
found in the Status Quo Scenario — a wrenching reduction from the path that spending is now
on. It is, however, necessary if Ontario is to escape its recent history of rising public debt that
forces the government to spend more than it should in interest payments — money that could
otherwise be used to finance programs. Our Preferred Scenario would hold down the growth
of net public debt, leaving it at 37 per cent of GDP in 2017–18.
Slowing, and eventually halting, further growth of the debt burden is critical. In the past two
decades, Ontario’s fiscal record has been one of large deficits that were only partially offset by
sporadic episodes of small surpluses. Since the late 1980s, Ontario’s debt ratio has more than
doubled to 35 per cent from 14 per cent as recessions quickly created more debt, but good
economic times only reduced it slowly. Debt is costly, since interest must be paid on the
province’s outstanding bonds and other obligations. Unusually low interest rates in recent
years have allowed Ontario to borrow cheaply, but as interest rates rise to more normal levels,
so will the cost of servicing the growing debt, and that will divert dollars away from
public programs.

Executive Summary
3
Until recently, Ontario’s debt record was similar to that of other Canadian provinces.
In the past decade, however, a commodities boom has allowed provinces such as Alberta,
British Columbia, Newfoundland and Labrador, and Saskatchewan to reduce their debt
burden, leaving Ontario in the company of the three Maritime provinces, with their roughly
35 per cent debt ratios. Canada’s highest provincial debt ratio, at about 50 per cent, belongs
to Quebec; that is where Ontario is headed in our Status Quo Scenario.
By current international standards, Ontario’s debt is still relatively small. We are a very long
way from the dreadful fiscal condition of countries that have dominated the news in the past
two years. So, however, were many of the headline countries at one time — in some cases,
surprisingly recently. Still, among bond investors, Ontario is seen as a well-governed province
in a well-governed country. We do not mean to be alarmist, only to point out that government
debt can rise quickly if not headed off early. Should the global economy turn nasty once again,
any deterioration in investor confidence could be remarkably swift. The recent decision by
Moody’s Investors Service to revise its outlook on Ontario’s bonds from stable to negative is
a danger sign. With the global recession hitting Ontario particularly hard, Ontario’s recent
deficit record is poor; relative to GDP, it ran the biggest provincial deficits in the country for
three consecutive years beginning in 2008–09; the current 2011–12 fiscal year is likely to
add a fourth.
Our message will strike many as profoundly gloomy. It is one that Ontarians have not heard,
certainly not in the recent election campaign, but one this Commission believes it must deliver.
If Ontarians and their government are going to come to grips with the fiscal challenges that lie
ahead, they must understand the depth of the problem and its causes. Ontario must act soon
to put its finances on a sustainable path and must be prepared for tough action — not just for
a few years, but at least until 2018. We believe Ontarians can make — and implement —
the kind of thoughtful decisions needed to resolve the province’s fiscal dilemma while
protecting, to the greatest degree possible, the public programs on which Ontarians rely,
many of which are a source of justifiable pride.
The rewards of such action will be considerable and tangible. High-debt governments are
always vulnerable to the whims and demands of the financial markets from which they have
borrowed; governments in this position can be forced to take draconian measures to keep
their lenders happy (Greece and Italy are recent vivid examples). Low-debt governments
have much more flexibility to set their own priorities — ones that meet the needs of their
citizens and the good of their jurisdictions as a whole.

4
How did we get to this point? For most of the past decade, Ontario’s economic growth has
lagged that of the rest of Canada, as changing economic conditions hit Ontario harder than
other provinces. A strong dollar made Ontario’s exports more expensive for foreigners to buy
while making imports cheaper; as a result, foreign trade, once a net contributor to GDP
growth, is now a net drag. In the recent recession, Ontario lost 5.0 per cent of its GDP from
peak to trough, while the rest of the country lost only 3.7 per cent. The human cost of this
lacklustre performance is apparent in jobs and incomes: Ontario’s unemployment rate has
been above the national rate for over five years now; average personal income in Ontario,
more than 20 per cent higher than the average in the rest of Canada in the second half of
the 1980s, was 0.5 per cent lower than this average in the third quarter of 2011.
Ontario’s future growth will almost certainly be slower than it was in the past. Not only will
the global recovery be slower than normal, but Ontario also faces further structural changes.
As in most of the developed world, manufacturing has been dwindling as a share of the
province’s output and employment base. This trend will continue. Moreover, the growth in
Ontario’s working-age population and labour force will come mostly from immigration, but
the incomes of recent immigrants have been well below those of workers who were born
in Canada or arrived earlier.
In short, we cannot count on robust economic growth to resolve our fiscal challenge. Out to
2014, we accept the projection in the government’s 2011 Ontario Economic Outlook and
Fiscal Review that real GDP will grow by an average of 2.2 per cent per year. Beyond that,
we take a cautious approach, based on our view that labour-force growth will slow and
productivity growth will remain modest. From 2015 through 2018, we expect average real
GDP growth of only two per cent per year. Growth in nominal GDP, which includes the impact
of inflation, is even more critical for fiscal planning because it constitutes the tax base —
the economic activity on which the provincial government levies its taxes on income, sales
and corporate profits. We assume nominal GDP growth of 4.2 per cent to 2014 and
3.9 per cent from 2015 through 2018.
Our growth assumption directly affects our projections of the government’s revenue growth.
We continue to be more cautious on the revenue projections to 2013–14 than those
contained in the 2011 Ontario Economic Outlook and Fiscal Review. We see some room
for additional revenue growth without raising taxes (these would involve contraband tobacco,
the underground economy, collections issues, tax expenditures and additional revenues from
Crown agencies), but our projections for 2017–18 point to total revenues of $134.7 billion,
$7.5 billion less than the Budget Scenario’s $142.2 billion. While we can hope for better, we
cannot make firm budget plans on the basis of hope. Our caution also leads us to build in a
larger reserve in case revenues fall short of the forecast.

Executive Summary
5
The 2011 Budget set out a track to 2017–18 for spending on programs (everything, that is,
except interest on the debt) that involved growth of 1.0 per cent annually from 2010–11 to
2013–14 and 1.7 per cent per year from then until 2017–18. But if we assume that government
programs continue as they are now delivered, then spending is actually on course to grow
much faster — 3.5 per cent per year on average over the seven-year period. This is about half
the pace of the past decade, so significant action has been taken. Our Status Quo Scenario
for program spending incorporates increases that are likely to occur if current programs retain
their present form, if no new programs are introduced and if nothing further is done to restrain
spending. It is based on drivers of spending growth such as inflation, population growth, aging,
new drugs, enrolment growth and welfare caseloads.
Yet spending is neither out of control nor wildly excessive. Ontario runs one of the lowest-cost
provincial governments in Canada relative to its GDP and has done so for decades. And we
must recognize that some important steps have been taken in the past few years to help
manage costs, improve our prospects for future economic growth and enhance services to
the public.
To prevent the $30.2 billion deficit that we project in our Status Quo Scenario for 2017–18,
the government can raise taxes, cut the rate of spending growth, or do some of both. While
our mandate precludes us from recommending new or increased taxes, we believe that the
revenue measures mentioned earlier could raise almost $2 billion by then; the government
should proceed with these measures. Steadily reducing the deficit to zero in 2017–18 would
save $4.3 billion in interest costs. To balance the budget, we need to shave about $23.9 billion
off our projection for program spending in that year.
Such an outcome allows for an increase in total spending on programs of only 5.6 per cent
over seven years, or 0.8 per cent per year. If we factor in both population growth and inflation,
we find that real program spending for every man, woman and child in Ontario must fall by
16.2 per cent, an average annual decline of 2.5 per cent from 2010–11 through 2017–18,
a drop that is almost certainly unprecedented.

6
TABLE 1. Three Views of the Outlook for 2017–18 2010–11 2017–18 2010–11 to 2017–18 2010–11 2017–18 2010–11 to 2017–18 2010–11 2017–18 2010–11 to 2017–18 Billions
($) Billions
($) Per Cent Change
CAGR* (Per
Cent)
Per Capita in
current dollars
Per Capita in
current dollars
Per Cent Change
CAGR* (Per
Cent)
Per Capita in
2010 dollars
***
Per Capita in
2010 dollars
***
Per Cent Change
CAGR** (Per
Cent)
Budget Scenario*
Revenue 106.2 142.2 33.9 4.3 8,027 9,898 23.3 3.0 8,027 8,527 6.2 0.9 Expense Program Spending
113.3 124.9 10.2 1.4 8,569 8,697 1.5 0.2 8,569 7,492 (12.6) (1.9)
Interest on Debt
9.5 16.3 70.7 7.9 720 1,132 57.2 6.7 720 975 35.4 4.4
Total Expense
122.9 141.2 14.9 2.0 9,289 9,829 5.8 0.8 9,289 8,467 (8.8) (1.3)
Contingency Reserve
– 1.0 – – – 70 – – – 60 – –
Surplus/ (Deficit)
(16.7) – – – (1,261) – – – (1,261) – – –
Net Debt 217.3 322.5 48.4 5.8 16,431 22,450 36.6 4.6 16,431 19,340 17.7 2.4 Net Debt/ GDP
35.5% 39.7% – – – – – – – – – –
Status Quo*
Revenue 106.7 132.7 24.5 3.2 8,063 9,241 14.6 2.0 8,063 7,960 (1.3) (0.2) Expense Program Spending
111.2 141.4 27.2 3.5 8,406 9,842 17.1 2.3 8,406 8,479 0.9 0.1
Interest on Debt
9.5 19.7 107.5 11.0 717 1,369 91.1 9.7 717 1,180 64.6 7.4
Total Expense
120.7 161.1 33.5 4.2 9,122 11,212 22.9% 3.0% 9,122 9,658 5.9 0.8
Contingency Reserve
– 1.9 – – – 132 – – – 114 – –
Surplus/ (Deficit)
(14.0) (30.2) – – (1,059) (2,103) – – (1,059) (1,812) – –
Net Debt 214.5 411.4 91.8 9.8 16,216 28,641 76.6 8.5 16,216 24,672 52.1 6.2 Net Debt/ GDP
35.0% 50.7% – – – – – – – – – –
Preferred Scenario*
Revenue 106.7 134.7 26.3 3.4 8,063 9,377 16.3 2.2 8,063 8,077 0.2 0.0 Expense Program Spending
111.2 117.5 5.6 0.8 8,406 8,176 (2.7) (0.4) 8,406 7,043 (16.2) (2.5)
Interest on Debt
9.5 15.3 61.8 7.1 717 1,068 49.0 5.9 717 920 28.4 3.6
Total Expense
120.7 132.8 10.0 1.4 9,122 9,244 1.3 0.2 9,122 7,963 (12.7) (1.9)
Contingency Reserve
– 1.9 – – – 132 – – – 114 – –
Surplus/ (Deficit)
(14.0) 0.0 – – (1,059) 0.0 – – (1,059) 0.0 – –
Net Debt 214.5 300.1 39.9 4.9 16,216 20,888 28.8 3.7 16,216 17,994 11.0 1.5 Net Debt/ GDP
35.0% 37.0% – – – – – – – – – –
* Certain figures may not add due to rounding. ** CAGR = Compound Annual Growth Rate. *** Deflated by the CPI.

Executive Summary
7
Not every program should grow at the 0.8 per cent rate that is our limit. But if some programs
grow faster, other programs will have to grow more slowly or even shrink. For example, if
health care continues to grow by 6.3 per cent per year — its track record over the previous five
years — then all programs other than health would have to contract by 4.1 per cent annually to
meet our target. Health care would run roughshod over every other priority; it would gut every
other government service that Ontarians rely on for their education, social welfare, justice
system, infrastructure needs and a host of other programs that matter to the people of this
province. This cannot be our future.
Another choice Ontarians must face in the months ahead involves labour compensation.
Since the total bill for wages, salaries and benefits accounts for about half of all Ontario
government program spending, it is difficult to believe that program spending can be held
to annual growth of 0.8 per cent if labour costs rise appreciably.
Having developed a number of scenarios for program spending, we have opted to recommend
one that counts on very restrained growth in health care outlays to leave room for spending
growth in some other programs. We believe there is ample scope in the health care system for
efficiencies that will allow health care providers to deliver the services Ontarians need without
getting annual increases of the kind seen in recent years.
Accordingly, we recommend the following annual changes in program spending out to
2017–18:
Health care — plus 2.5 per cent;
Education — plus 1.0 per cent;
Post-secondary education (excluding training) — plus 1.5 per cent;
Social programs — plus 0.5 per cent; and
All other programs — minus 2.4 per cent.

8
This permits post-secondary education grants to almost keep pace with enrolment and
provides a realistic path for non-health, non-education, non-social services spending. For the
latter programs, it represents a very significant degree of restraint: a cumulative decline in the
level of spending of 15.6 per cent over seven years. But a significant portion of this “everything
else” category is either fully committed by historical arrangements such as amortization and
pension contributions, or simply unwise to cut, such as existing shared-cost agreements,
where the province would be giving up federal dollars. For everything other than these fixed
items, the cumulative decline would come to about 27 per cent. If we attach dollar signs to
these changes, we find that in 2017–18, total program spending will be up $6.3 billion from
2010–11. Health will have $8.4 billion more; education (elementary and secondary),
$1.6 billion more; post-secondary education, $0.7 billion more; and social services, $0.5 billion
more. All other programs will have $4.0 billion less, while changes to reserves and year-end
savings will make up the difference.
Ontario’s finances do not yet constitute a crisis, and with early strong action a crisis can be
averted. Crises almost inevitably bring forth bad public policy decisions born of desperation.
The lessons of history and of what is happening elsewhere today are clear: the government
must take daring fiscal action early, before today’s challenges are transformed into tomorrow’s
crisis. Unlike a crisis, a challenge can be met with well-considered, firm, steady and even
imaginative action that deals with the problems methodically and phases in the needed
changes over a period of years, giving people a chance to adjust. The government's decision
to create the Commission and give it a broad mandate to address near- and long-term fiscal
issues signals its intent to address these challenges and head off any crisis. Our goal in this
report is to set out the kind of measures that will meet the task.
The Fiscal Challenge
Closing the budget gap by 2017–18 will not be easy. However, many Canadian governments
have successfully faced deep fiscal problems in the past two decades and in the process have
strengthened their capacity to deal with fresh challenges as they came along. Most of those
episodes occurred in the 1990s, when a sharp recession was followed by a recovery that was
halting at first before gathering enough momentum to generate a solid expansion. Economic
growth helped governments back to fiscal health, but many restrained spending significantly
and some raised taxes. This time, economic growth may not even be strong enough to lend
much of a hand.

Executive Summary
9
The federal government’s elimination of the deficit between 1995 and 1998 is the best-known
example. Departmental operating budgets, as well as grants and contributions, were reduced
by 15 per cent to 25 per cent, while transfers to the provinces were cut by more than
21 per cent over two years. Seven of every eight dollars needed to eliminate the deficit came
from spending restraint rather than revenue-generating measures. Program spending fell by
almost 10 per cent in the first two years of the restraint period and remained below the
pre-restraint peak for five years.
Four provinces that carried out vigorous and successful deficit-cutting exercises — Alberta,
Saskatchewan, New Brunswick and Ontario — all relied on spending restraint or outright cuts
to a much greater extent than tax increases. In Alberta, total spending on programs fell by
almost 22 per cent in three years and remained below its peak for six years. Saskatchewan,
which had come close to defaulting on its debt, used a mix of spending cuts and tax increases.
Program spending was cut by 10 per cent from the peak, but the restraint period lasted a full
seven years. New Brunswick’s two episodes of restraint in the 1980s and 1990s produced a
mixed record. The first relied mainly on revenue increases. The second was tackled with a
combination of tight expenditure curbs and revenue-raising measures, but government
spending fell in only one of the restraint years.
In Ontario, a deep recession and five years of deficits raised the debt ratio from 12.7 per cent
in 1989–90 to 29.2 per cent in 1994–95. After the 1995 election, the Harris government
substantially reined in spending, with the exception of health care; the two most dramatic
moves were a 22 per cent cut in social assistance rates and a downloading of program
responsibilities to municipal governments, with a partial fiscal offset from other changes
in Ontario–municipal relations and the induced reductions in overall welfare expenditures.
Strong economic and revenue growth after 1995 helped the province balance its budget
by 1999–2000, by which time spending had begun to rise again.
Despite the lasting reputation of the Harris government, program spending fell by only
3.9 per cent from its 1995–96 peak and stayed below the peak for only three years, a
period of restraint that was both milder and much shorter in comparison with Alberta and
Saskatchewan. Even Quebec cut program spending by more than Ontario during this
period — 4.6 per cent over two years.

10
How does our scenario for the period from 2010–11 through 2017–18 compare with the
1990s?1 Our Preferred Scenario projects that revenue will grow by 3.4 per cent annually from
2010–11 to 2017–18. Between 1993–94 and 1999–2000, the recovery period from deficit in
the 1990s, revenue grew by a robust 4.7 per cent per year, even though taxes were cut after
1995. The 2011 Budget clearly signalled the government’s intention to restrain spending in
the seven years to 2017–18. Remarkably, the implications of the spending goal went almost
entirely unremarked by the public in the months since the Budget was released. In setting
out a target for program spending in 2017–18, the government’s Budget Scenario was pointing
to a steady decline in real program spending per capita, averaging 1.9 per cent per year.
Startlingly, this compares with a real per capita decline in program spending averaging
2.0 per cent per year between 1993–94 and 1999–2000. Ontarians did not notice that the
2011 Budget was projecting seven years of real per capita spending cuts that looked very
much like the 1990s.
Unfortunately, the Commission believes that will not be enough. Given our greater caution in
projecting revenue growth, our Preferred Scenario suggested that program spending — again
on a real per capita basis — will have to fall by 2.5 per cent per year.
The 1990s cuts probably appear smaller than the figures many Ontarians remember. But in
1999–2000, as the budget approached balance, program spending increased by 3.0 per cent
as the government loosened the purse strings to deal with the pressures that had
accumulated; health spending alone increased by 11.4 per cent.
The lesson here is that governments can hold the lid on spending for a while by taking
extraordinary measures to contain compensation costs, postpone capital projects and scrimp
on infrastructure maintenance. But unless fundamental spending reforms are implemented,
the old pressures reassert themselves and governments with newly balanced budgets have
a hard time resisting them.
Ontario is neither a high-tax nor high-spend province. It does not enjoy the easy pickings of
natural resource revenue, nor is it a major recipient of federal transfers in comparison with the
rest of Canada. To meet its own goal of a balanced budget in seven years, the government will
have to cut program spending more deeply on a real per capita basis, and over a much longer
period of time, than the Harris government did in the 1990s. Moreover, it does not have the
option of an immediate deep cut in social assistance rates, which have not greatly recovered
from a 22 per cent cut in 1995. It will have to maintain restraint for as long as Alberta’s Klein
government and Saskatchewan’s Romanow government in the 1990s, recognizing that Alberta
also made deep cuts to social assistance payments, while Saskatchewan raised taxes to help
meet its goal.
1 Accounting changes have forced us to use a six-year period in the 1990s.

Executive Summary
11
The ultimate challenge in the years ahead will be to find ways to make government work
better and preserve as much as possible the programs Ontarians cherish most.
Mandate and Approach
There are five parts to our mandate:
1. Advise on how to balance the budget earlier than 2017–18.
Given the deterioration in the economic outlook since the 2011 Budget, we believe an earlier
target for balance is neither practical nor desirable.
2. Once the budget is balanced, ensure a sustainable fiscal environment.
Our proposals aim to keep the budget roughly in balance after 2017–18. We attach great
importance to this goal.
3. Ensure that the government is getting value for money in all its activities.
We see this as a requirement to recommend ways of ensuring that all programs and services
achieve the best possible outcomes within available resources.
4. Do not recommend privatization of health care or education.
We interpret this to mean that health care must be kept within the public payer model. We do
not interpret it as denying opportunities for private-sector delivery of services, if that is more
efficient. We interpret our education mandate to mean that we will not advocate any shift to
educational institutions that are predominantly financed from private revenue.
5. Do not recommend tax increases.
Although our mandate precludes us from recommending higher taxes, we do recommend
ways to raise more revenue without adjusting tax rates.
We have developed a number of broad guidelines for our recommended actions. Government
ministries and agencies should always strive for efficiency gains, not only when driven by
overall budget restraint or in response to problems unearthed by the Auditor General or
exposed by a spending scandal. We have also drawn lessons from both public- and private-
sector restructurings, a series of “dos and don’ts” that we will set out in reverse order.

12
The “don’ts” are proposals that sound useful, but are often harmful:
Do not simply cut costs. The imperative to restrain spending should instead be an
opportunity to reform programs and service delivery;
Avoid across-the-board cuts. They represent an abdication of the government’s
responsibility to make real, and often difficult, decisions;
Avoid setting targets for the size of the civil service. A leaner civil service will be an
inevitable result of lower-cost programs and achieving greater value for money;
Do not rely unduly on hiring freezes and attrition to reduce the size of the civil service;
Do not hang onto public assets or public service delivery when better options exist; and
Do not resort to traditional short-term fixes.
The “dos” apply across the entire public sector:
The government should issue a road map setting out its vision. Such a document would
both inform the public about the changes that lie ahead and also serve as a script for all
bureaucrats;
Higher priority should be given to programs and activities that invest in the future rather
than serve the status quo;
Policy development should be more evidence-based — with clear objectives set
based on sound research and evidence — and relevant data collected and used to
evaluate programs;
Governments must minimize the cost of operations, but they also need rules to ensure
that taxpayers’ money is not abused. The pendulum has now swung too far towards
excessive rules, with too many layers of watchers at the expense of people who actually
get things done. The Ontario government must find a new middle ground;
Within their operations, public-sector service providers should assign people to jobs where
they are most effective, efficient and affordable;
Seek common themes across the reforms to achieve economies of scale and to simplify
communications; and
Reform must be pervasive and speedy. Broader action favours a public perception that the
reforms are fair, as opposed to a view that a few programs were unfairly targeted. Change
is disruptive, but the medicine does not go down more easily if it is dragged out over a
long period.

Executive Summary
13
We can perhaps shoot for a grander goal — a province that provides the best public services,
delivered in the most efficient manner, in the world. If this sounds impossibly ambitious, put the
question another way: Why not? We goad our business sector to win new customers globally
in the face of stiff competition. Why not apply the same standards to our government? Why not
give our public servants an objective that can turn the task of transformation — which will at
times be a very tough slog — into a project that becomes a source of real pride?
What does being the best at public policy and services look like?
Public service would be an honourable calling that would draw the province’s best and
brightest people into government. The best public service would set clear objectives, use
proper metrics to measure progress and provide clear accountability for those expected to
meet the objectives. It would benchmark itself against the best in the world. It would constantly
evaluate priorities; if a new priority is identified, others would move down a spot and some,
now outdated, would be discarded. It would drive relentlessly towards effectiveness and
efficiency. It would focus on outcomes, not inputs, and give managers the flexibility to do
the job best within their budget. It would approach risk from a scientific basis.
The task ahead need not be dreary. Many will scoff that the very idea of creating an
organization that delivers the world’s best public services is hopelessly naive, and that we
should not even think of such lofty goals. But high ambition should never be sneered at.
Such an objective could instil in our politicians, our public servants and all Ontarians a sense
of purpose that would help see us all through this monumental mission.
Why not?
Making Transformation Work: Process and Structures
Ontarians are not prepared for the severity of the restraint needed to balance the budget
by 2017–18. Raising public awareness of the challenge must be done early, clearly and
consistently. The 2012 Budget should set out as much detail of the restraint as feasible.
In any organization, a major transformation can succeed only if it is clearly led from the top.
Once the Budget is crafted, the task of ensuring that the spending targets turn into firm action
falls to the Premier’s Office and the Cabinet Office. It must be clear to all that the Premier’s
Office is giving full moral and organizational support to the effort.
The budget process itself needs some reforms. The annual budget can be a powerful
educational tool both for Ontarians in general and for public-sector officials. Transparency,
clarity, the use of reserves and a long-term perspective are all virtues in budget-making;
there is now too little of all four.

14
Several measures would strengthen the fiscal planning process. For example, the 2012
Budget should contain a “clean status quo” fiscal projection out to 2017–18 that reflects only
decisions and actions already taken. From this base, any savings from firm new actions should
be shown. Without tax increases, it will be difficult for Ontario to return to a balanced budget
earlier than 2017–18, so this date should remain the target. In the full report, we set out
12 steps that would increase the probability of securing the 2017–18 target, including the use
of prudent economic growth forecasts, an adequate contingency reserve that grows over time
and spending limits for the seven years to 2017–18 for each ministry and agency.
There are three critical ingredients to successful reforms:
1. The objectives and means of the reform must be explained clearly and transparently;
2. The substance of the reforms must be sound and make sense to citizens, officials
and politicians; and
3. There must be appropriate internal processes to deliver the desired outcomes.
Ministers and their officials should be given a great deal of discretion in deciding how to
implement reforms. However, there are several government-wide issues that many ministries
will face in common. These include labour issues; duplication of programs and services; the
possibility that services can be delivered in more efficient ways; and managing the province’s
considerable assets, where a common approach is desirable. Ministers and officials can learn
from each other by coming together on such questions.
Latitude for discretionary action notwithstanding, a vigilant watch must be maintained on how
the individual reforms are coming together. A Steering Committee, with representation from
the Premier’s Office, Cabinet Office and Ministry of Finance, should be the focal point for the
work necessary to implement all reforms and monitor the reform exercise.
Prior to formal Cabinet consideration, proposals should be vetted by a Premier’s results table
on strategic reform, which would be the main forum for both championing and contesting
reform proposals. The results table would be chaired by the Premier and comprise senior
Cabinet ministers and independent experts with relevant experience in cost-cutting and
transformational change. This group would be supported by the steering committee, ensuring
the involvement of senior staff from the Premier’s Office and Cabinet Office, and senior
officials from the Ministry of Finance.
This structure should stay in place for at least several years and some parts of it should
become permanent to deal with issues such as overlap and duplication.

Executive Summary
15
Health
Health care is at once the biggest item in the Ontario government’s budget, the issue of most
concern to Ontarians, the source of the most intense and emotional public policy debate, and
the centre of the most complex delivery system of any set of programs financed by the
provincial government. For at least two decades now, Ontarians — along with other
Canadians — have worried about the quality and accessibility of their health care. As health
has consumed a rising share of the provincial budget, the debate has increasingly focused on
the very sustainability of the health care system in a form that gives Ontarians what they want.
There are only hard answers and difficult solutions. We must reform the health care system to
make it operate more efficiently and give us greater value for the money we now spend on it.
This is not easy. The public debate has been poisoned in recent decades by a widespread
failure to comprehend the trade-offs that must be made; by knee-jerk reactions to worthy but
complex ideas for change; by politicians (and media outlets) who have been too willing to
pander to fear-mongering; by stakeholders in the health care system who, wishing to cling to
the status quo, resist change; and generally by a lack of open-minded acceptance of the
reality that change is needed now and that money alone will solve nothing.
The parts should work better together, so that the whole is greater than — or at the very least
equal to — the sum of the parts. Such change is already underway in bits and pieces. Health
care providers in every corner of the system recognize far better than the politicians or the
public what needs to be done and — perhaps more importantly — what no longer needs to be
done. They are moving the system incrementally towards the greater integration that is utterly
necessary. What they need is more encouragement from government plus financial incentives
that will change behaviour in ways that will produce a health care system that better serves
us all.
The vital first step is a long-term view. The government must set out a 20-year plan with a
vision that all Ontarians can understand and accept as both necessary and desirable — a plan
that will, though it involves tough decisions in the short term, deliver a superior health care
system down the road.
Reform must shift the system from one built mainly for acute care to one built mainly for
chronic care. Quality of care and efficiency are essential. Better care delivered smoothly and
briskly will benefit patients and providers alike; it will also save money. Quality and efficiency
go hand in hand. Too often, treatment delayed is treatment diminished.
We will recommend a number of ways in which this can be done. Before we get to those
proposals, however, we will sketch out what we regard as the most salient facts about health
care and the perspectives we bring to the issue.

16
Health care is the Ontario government’s single biggest spending program. In 2010–11,
the province spent $44.8 billion on health — 40.3 per cent of its total spending on programs.
The cost of health care is driven by inflation, population growth, aging, new technology and
the increasing use of new procedures. Rising costs have been a subject of intense public
attention and discussion for at least two decades. The trajectory of ever-more-costly health
care will moderate only modestly if left to operate as it does now.
In 2010–11, operation of hospitals accounted for about 35 per cent of provincial health care
spending, and doctors and practitioners, about 27 per cent; almost eight per cent each went
to prescription drugs and long-term care, and another six per cent to community care. The
remaining 17 per cent financed everything else.
In our Status Quo Scenario, the one that relies heavily on existing drivers to project the overall
cost of government programs, Ontario’s health care budget rises to $62.5 billion by 2017–18,
for an average annual increase of 4.9 per cent from 2010–11. In our Preferred Scenario, we
have set out a much more modest path for health care spending: an increase of 2.5 per cent
per year.
Polls reveal large gaps between how we run health care in Canada and what Canadians say
they want. Most Canadians, for example, want medicare to cover home care, long-term care,
mental health care and drug benefits. Ontarians are wedded to the single, public payer model
of health care and will not tolerate any deterioration in access and quality of care. There also
seems to be less concern that all services be delivered under public administration, as long
as the bill can be paid with an OHIP card. Ontarians want their health care system not only
sustained, but also improved.
It is easy to be smug when we compare ourselves with the United States, which spends far
more than Canada relative to both its population and its GDP, yet in 2010 left over 16 per cent
of its population uncovered by health insurance. If we compare ourselves to countries other
than the United States, however, we often come up short. We need to do more and we need
to do better; and we need to do both on a tight budget.
Some context — a series of hard truths, measures and comparisons about health care in
Ontario — will help frame the discussion.

Executive Summary
17
The health care system is not really a system: What we have is a series of disjointed
services in many silos. Ontario needs to integrate these silos and reduce administrative red
tape that impedes efficient and effective service.
The health care system is costly: Canada has one of the costliest health care systems
in the world, which may surprise people who are too accustomed to comparing our record
only to that of the United States. But among 34 countries in the Organization for Economic
Co-operation and Development (OECD), Canada had the sixth most expensive system in
2009 and was not far behind the second most expensive one.
The system is not as public as most people think: The public component of health care
accounted for over 70 per cent of all health care spending in 2009. Of 27 OECD countries
reporting such data for that year, Canada ranked 19th. Medicare does not cover out-of-
hospital drugs, nursing, psychology and other counselling, community mental health services,
nutrition advice, ambulance services, addiction treatment, long-term care, eye care or
dental care.
The health care system is only part of the picture: Only 25 per cent of the population’s
health outcomes can be attributed to the health care system. Yet amazingly, the three-quarters
of environmental factors that account for health outcomes, such as education and income,
barely register in the health care debate.
The system does not produce superior results: Despite its high cost, our system does not
produce superior results on a value-for-money basis relative to other countries.
We have fewer physicians than other jurisdictions: At 19 physicians per 10,000 people,
Canada is well below continental European G7 countries, where most are well into the 30s.
Canada falls short on many measures: One study ranked Canada 17th in the percentage
of total life expectancy that will be lived in full health, 24th in infant mortality and second in the
incidence of mortality from colon cancer.
But Ontario’s is the best system within Canada: There is some evidence that, on important
matters, Ontario has one of the best or even the best system within Canada.
Drug costs are growing faster than other health spending: Pharmaceuticals have been
the fastest-growing component of health care costs in recent decades. The OECD reports that
Canadian generic drug prices are the highest among member countries.

18
There are inefficiencies in the health care system: The use of some surgical procedures far
exceeds clinical guidelines. Too many hospital patients could get better-quality care at a lower
overall cost elsewhere in the system. Researchers at OECD estimated that if Canada became
as efficient as the best-performing countries, efficiency gains could amount to almost 30 per
cent of public-sector spending.
Complex cases drive costs: About one per cent of Ontario’s population accounts for
34 per cent of health care costs, and 10 per cent of the population accounts for 79 per cent,
according to a 2011 study. The people in the one per cent group are frequently in and out
of our health care system, constantly being admitted and readmitted into hospitals.
Mental health and addiction issues are also cost drivers: The economic costs of mental
health and addiction have been estimated at $39 billion annually, three-quarters of those
from productivity losses. Ripple effects are felt in the justice, educational and social
services sectors.
Our health system developed to deal with acute care and largely remains in that mode. Today,
the key health issues are increasingly shifting to chronic care questions, in good part because
the population is aging, but also because some lifestyle problems such as obesity are creating
particular health conditions. The OECD projects that the total public and private cost of long-
term care will more than double from an estimated 1.4 per cent of GDP in 2006 to 3.3 per cent
by 2050.
The ideal health system would emphasize the prevention of poor health. It would be patient-
centric and would feature co-ordination along the complete continuum of care that a patient
might need. Primary care would be the main point of contact, but there would be much less
emphasis on treating patients in hospitals. All professionals would exercise the full scope
of their skills in their work; nurses, for example, would administer vaccines, and nurse
practitioners would manage chronic illnesses such as diabetes and high blood pressure.
Payment schemes and information gathering would support the patient-centric notion.
Compensation for hospitals and physicians would be tied to outcomes of health rather
than to the inputs or services.

Executive Summary
19
The old system and an ideal reformed system are laid out in the accompanying charts.
General Approach
Intervention after a problem occurs Acute care Hospital-centric Silos Resource-intensive minority of patients in regular
system Accept socio-economic weaknesses Extraordinary interventions at end of life
Health promotion Chronic care Patient-centric Co-ordination across a continuum of care Dedicated channels for the resource-intensive
minority Address socio-economic weaknesses Pre-agreements on end-of-life care
Hospitals
Draw patients to hospitals Historical cost plus inflation financing Managed through central government Homogeneous, all trying to offer all services
Keep patients out of hospitals Blend of base funding and pay-by-activity Regional management Differentiation and specialization along with
specialized clinics
Long-Term Care, Community Care and Home Care
Not integrated, underfunded and weight on long-term care
Integrated with weight on home care
Physicians and Other Professionals
Not integrated with hospitals and other sectors Work alone or in groups Mostly fee-for-service funding Few standards for medical approaches/conduct of
practice Unclear objectives and weak accountability Inefficient allocation of responsibilities
Integrated with primary care being the hub for most patients
Work in clinics Blend of salary/capitation and fee-for-outcomes Evidence-based guidelines (through quality
councils) Objectives from regional health authorities and
accountability buttressed by electronic records Allocation in accordance with respective skills and
costs; and where feasible shifting services to lower-cost care-providers
Pharmaceuticals
Little cost discipline from governments Cost of plans to private employers driven in good
part by employees
Cost discipline through purchasing power, guidelines for conduct of practice
Greater control exercised by employers
Transforming to Reformed System Current System

20
Service Delivery
Mostly public sector Blend of public and private sector (within public payer model)
Information Technology
Little used by physicians and especially across the system
Information conveyed in doctors’ offices
Extensive use that is key to co-ordination across system and accountability
Information more easily available and conveyed through multiple sources (phone, Internet, etc.)
Medical Schools
No attention to system (cost) issues Little attention to labour supply issues
Course(s) on system issues Role in directing physicians to areas of demand
(by area of medicine and geographically)
Coverage of Public Payer Model
Hybrid with almost 100 per cent primary, less than half of drugs and limited mental health
Broader coverage widely recommended but not at all clear this will be acted upon
Here is a summary of the kind of changes we seek: a shift towards health promotion rather
than after-the-problem treatment; a system centred on patients rather than hospitals; more
attention to chronic care; co-ordination across a broad continuum of care rather than
independent silos that allow too many people to fall between the cracks; and new ways of
dealing with the small minority of patients who require intensive care.
Rather than draw patients to hospitals, we should direct them to the most appropriate care
setting for their problem — whether it is a doctor’s office, family care centre or clinic,
rehabilitation centre, long-term care centre or back home. Physicians and other professionals
tend to work alone or in small groups where they are not integrated with other sectors of the
health care system. Family Health Teams (FHTs) go some way to meeting this goal, but tend
to be too small, with too few physicians, and cover too narrow a range of services.
Regional health authorities should establish what expectations professionals should meet
and accountability should be strengthened by electronic records.
Medical schools should add at least one course introducing their students to the broader
system in which they will spend their careers, and where physicians fit. The government
should do more to direct physicians to areas of need.
Transforming to Reformed System Current System

Executive Summary
21
The government should exercise greater cost control over pharmaceuticals; the recent move
to reduce the cost of generic drugs was a fine first step. Private-sector employers should also
exercise greater control over the cost of drug plans they offer their employees.
Long-term care, community care and home care are underfunded, with too much emphasis on
long-term care facilities and too little integration of services.
As long as government pays for all covered services, it should allow both the public and
private sectors to play a role in service delivery. Most family physicians are private-sector
operators paid by OHIP, and private companies now provide publicly funded laboratory work.
Information technology (IT) is used too little across the system in a way that allows the
integration of different activities. Extensive use of IT is key to pushing the health care system
to operate in a co-ordinated fashion. Better to build from the bottom up.
The public payer model covers most primary care but less than half of drugs and relatively
few mental health services. Extending medicare to more services would be controversial,
but an open dialogue will at some point become necessary; the government should at least
launch such a dialogue.
We must stress two things. First, the health care landscape is not nearly as black and white
as the previous chart implies. Many segments of the old system are already moving towards
the reformed system. Second, none of what we have said will surprise anyone who manages
part of the health care system today. Many are already pushing the system towards needed
reforms.
These ideas are in no way radical; but too many of them have been stifled in public debate
by politicians, interest groups and stakeholders who regard even the most sensible reform
proposals as threats to medicare rather than solutions to medicare’s problems. No one who
manages a part of the system argues that more money alone is the solution to the problems
of the health care system. Some argue that too much money would simply impede needed
reforms. To date, more money has not bought change; only more of the same, at higher cost.
Ontario created 14 Local Health Integration Networks (LHINs) to co-ordinate care on a
regional basis. In theory, the LHINs have the authority to allocate budgets across the various
components of care; in practice, they do not.
There is an abundance of opportunities for reform that will create a system that can deliver
better-quality care more efficiently. The challenge is to realize those opportunities.
Our recommendations are intended to further strengthen the existing system, in part by
pushing ahead with the original plans for integrated regional health delivery.

22
Our first recommendation is that the government should develop and publish a comprehensive
plan to address health care challenges over the next 20 years. The plan should set out clear
principles and deal plainly with the issues we raise and our proposals for reform.
All patients not requiring acute care should be diverted from hospitals to more appropriate care
that will be less expensive, improve the patient experience and reduce the patient’s exposure
to new health risks. Upon presentation of a health card, the government will pay for the
services rendered. Home-based care should be used more extensively.
All health services in a region must be integrated, including primary care physicians, acute
care hospitals, long-term care, Community Care Access Centres (CCACs), home care, public
health, walk-in clinics, FHTs, Community Health Centres (CHCs) and Nurse Practitioner-Led
Clinics (NPLCs). Exceptions to the regional system are specialized health facilities that have
provincewide responsibilities, such as the Hospital for Sick Children, the Princess Margaret
Hospital and the Centre for Addiction and Mental Health.
The government’s health budget should be capped at 2.5 per cent or less annual growth
through 2017–18. After that, annual health cost increases must be restrained to no more than
five per cent. Some areas — including community health care and mental health — will need
to grow more rapidly than the average, and the province should address the historic gap in
funding and services for mental health and addiction.
The government should set the overall principles, but deliver health care on a regional basis.
A regional health authority should integrate services and institutions across the full continuum
of care for a geographic area. The co-ordinating entity must have the authority,
accountabilities and resources necessary to oversee health within the region; it must further
have the power to allocate budgets, hold stakeholders accountable and set incentive systems.
We considered four possible coordinators: The regional offices of the Ministry of Health
and Long-Term Care (MOHLTC), a reversion to the old system; the CCACs; the large, mostly
academic, hospitals; and reconstituted LHINs. We favour LHINs, which will need to execute
three key roles: planning and integrating the system, funding and case management.
Planning and Integrating the System: Reconstituted LHINs first need to work with
other stakeholders to streamline the more than 2,500 funded health agencies in Ontario.
This would involve further amalgamating hospitals and reducing the number of boards,
consolidating health service agencies where appropriate and establishing advisory panels with
representation of stakeholders. Second, LHINs should integrate care by sharing information
on patients among health care providers, co-ordinating decisions and allocating funds to best
reflect regional needs. Information from funding models such as the Health-Based Allocation
Model (HBAM) should be used to identify service gaps and evaluate progress in managing
high-use populations.

Executive Summary
23
The LHINs should optimize human resources capacity by shifting services to lower-cost
caregivers where feasible and encouraging full scope of practice — a net shift in
responsibilities from physicians to nurses and others in health teams, including physician
assistants. The LHINs should use funding as a lever to ensure that nurses, nurse practitioners,
personal support workers and other staff members can apply their full range of skills.
Out-of-hospital services — for outpatients as an example — should fall to others, such as
the CCACs and private health care operators, which have demonstrated that they can do this
sort of work for much less than hospitals. The LHINs should also resist the temptation to build
many more long-term care facilities until the government can assess if more can be done
for an aging population by further emphasizing the use of home-based care, supported by
community services. Home-based care is less expensive and should generate greater
population satisfaction.
Funding: The government should give LHINs the authority, accountabilities and resources
necessary to oversee health within their regions, including allocating budgets, holding
stakeholders accountable and setting incentive systems. The LHINs should deal with all
aspects of the health system’s performance, including primary care (physicians), acute care
(hospitals), community care and long-term care. This would include setting budgets and
compensation for all players. Compensation for senior executives should be tied to health
outcomes, not the number of interventions performed.
Case Management: There is a lack of smooth and consistent patient case management.
“Clerical system navigators” who co-ordinate appointments and help patients with forms and
paperwork, a role developed in some parts of Ontario, should be used across the entire
system. “Quarterbacks” can help FHTs and specialized clinics track patients as they move
through the integrated health system. Complex care patients should be managed through
interprofessional, team-based approaches to maximize co-ordination with FHTs and other
community care providers. Chronic issues should be handled by community and home-based
care to the fullest extent possible.
Revamped LHINs would need solid governance and structures. A key element of governance,
if they are to co-ordinate the system, is appropriate representation. Their need for more
resources would entail a significant transfer of employees from the MOHLTC. Government
needs to stand by the LHINs’ decisions, even if they close a facility.
Decisions regarding medical procedures covered under OHIP are now part of the
compensation package negotiated by the government and the Ontario Medical Association
(OMA). Doctors should be consulted, but no more.

24
Evidence should drive policy. Medicine is ever-changing and it is difficult for doctors to keep
up with the latest research and best practices. They need research-based clinical guidelines
to help them stay current. In Ontario, these can come from the Institute for Clinical Evaluative
Sciences (ICES) and Health Quality Ontario (HQO). These agencies could also help the
government decide which procedures might be removed from public coverage. Health Quality
Ontario should become a regulatory body that would enforce evidence-based directives to
guide treatment decisions and OHIP coverage.
Hospitals are paid on the basis of average costs across the province so there is no incentive
to increase efficiency. The MOHLTC and LHINs should use HBAM data to set hospital
compensation for procedures. A blend of activity-based funding (i.e., funding related to
interventions or outcomes) and base funding would work best. Hospitals should be
encouraged to specialize. Hospitals should also make greater use of hospitalists — physicians
who co-ordinate inpatient care from admission to discharge. This role is crucial when dealing
with patients with complex cases where multiple specialists may be involved in their care.
Primary care, the domain of physicians, should be a focal point in a new, integrated health
model. Physicians’ primary goal should be prevention and keeping people out of hospitals.
The system should move away from the sole proprietorship nature of many doctors’ offices
and encourage more interdisciplinary integration. Physicians should be compensated through
a blend of salary/capitation and fee-for-service; the right balance is probably in the area of
70 per cent for the former and 30 per cent for the latter.
The government should firmly negotiate its next agreement with the OMA. Ontario’s doctors
are the best paid in the country, so it is reasonable to set a goal of allowing no increase in the
total compensation envelope. The negotiations must also address the integration of physicians
into the rest of the health care system.
Family Health Teams should become the norm for primary care. They need to be big enough
to support a wide range of care providers and the number of other staff needed to track people
through the system. They should offer better after-hours care and add more specialists to their
teams. The FHTs should also initiate discussions with their middle-aged patients about end-of-
life health care and “living wills,” so that patients and their families do not have to make such
critical decisions under duress. The MOHLTC should seek input from seniors’ advocacy
organizations to engage the public in an open dialogue on end-of-life care.
The government should remove perverse incentives that undermine care: physicians are
penalized when one of their patients goes to another walk-in clinic but not when the patient
goes to the emergency department of a hospital.

Executive Summary
25
The aging of Ontario’s population underlines the need for reforms to community care, home
care and long-term care. We need to match seniors to the services they need from the earliest
available care provider, reduce the number of days people spend in hospitals when another
form of care is more appropriate, and improve the management of referrals for long-term care,
home care and community services. The government should implement the recommendations
made by Dr. David Walker, in his 2011 report, “Caring for Our Aging Population and
Addressing Alternate Level of Care.” There is also a need for more — and more varied —
palliative care.
The province should do more in the area of disease prevention and health promotion. Much
public health work is done outside the primary health care sector. Funding for public health is
strongly linked to municipal budgets. Municipalities now put up 25 cents of every public health
dollar; many are now considering spending cuts that put public health units at risk of losing
provincial support. The province should consider fully uploading public health to the provincial
level. Better co-ordination of the public health system is needed to include hospitals,
community care providers and primary care physicians. Ontario should copy British
Columbia’s Act Now initiative, which has been cited as a best-practice example for health
promotion and chronic disease prevention. Doctors could do their part by addressing diet and
exercise before reaching for the prescription pad. Patients should heed their doctor’s advice
and make lifestyle changes when requested. The province should do more to reverse the
trend in childhood obesity and explore regulatory options for the food industry.
Medical schools should educate students on “system issues” so that they better understand
where physicians fit in the whole health care system. The schools should also flag current or
potential shortages and carry out the task of labour supply planning.
Pharmaceuticals are a major issue. Ontario needs an open, honest discussion of whether
there should be more public coverage of pharmaceutical costs. At the same time, we should
ask if payments under the Ontario Drug Benefit (ODB) program, which covers almost all of the
cost of prescription drugs for seniors and recipients of social assistance, should be linked
more directly to income. One option is to make the portion of pharmaceutical costs paid for by
seniors rise more sharply as income increases. A better option is to link the benefit not to age,
but to income only. This option would greatly strengthen the equity of the program and remove
a large brick in the “welfare wall” by covering low-income non-seniors who do not receive
social assistance. Savings would obviously be greater under the first option. The Commission
regrets that there was no modelling of these options that would have clarified the net fiscal
impact; it should be done. In 2003, British Columbia changed its age-dependent program into
one that links solely to income.

26
One potential way to reduce overall drug costs is to pursue with other provinces the possibility
of setting a common price for pharmaceuticals. Provinces could also reduce overlapping
regulations that add costs and present barriers to new drugs entering the market efficiently.
The ICES and HQO should also conduct drug comparisons to determine which is the most
efficient at treating a given ailment; current tests by Health Canada do not do this. The
government should ensure that all new drugs add value that exceeds their cost. As mentioned
elsewhere, Ontario should work with the federal government to ensure that Ontario’s interests
in expanding use of generic drugs are not undermined by a Canada–EU Free Trade
Agreement. The province should also use pharmacists to their full scope of practice, allowing
them to substitute a less expensive alternative to the physician’s prescription. They should
also be allowed to administer injectables and inhalant medications and prescribe for minor
ailments, as is done in Saskatchewan.
A number of other cost efficiencies are possible for the health care system:
Centralize all back-office functions such as IT, human resources, finance and procurement;
A central mechanism could oversee a “spot market” for goods and discretionary services,
such as diagnostics, infusions and specialist consultation services;
A wider array of specialist services could be put to tender based on price and quality, while
remaining under the single payer model;
More service delivery could also be put to tender, with the criteria for selection based on
quality-adjusted metrics, not just price;
Accelerate the adoption of electronic records, working from the bottom up. Begin with
doctors, clinics and hospitals and ensure that they use compatible systems. Then build
bridges within a region, then across regions;
Adopt the Nova Scotia model in which emergency medical technicians provide home care
when not on emergency calls; and
Provide better information to individuals and families to facilitate self-care for people with
conditions such as diabetes.
Above all, the government should involve all stakeholders in a mature conversation on the
future of health care and the 20-year plan. Anything done in the health field can be politically
dangerous, especially if cost restraint is involved. It will be critical to explain the objectives
carefully and stress that this is not just another round of cost restraint.
The stars are aligning for just such a discussion. The stakeholders themselves are reaching
out with proposals for reform, many of which are consistent with our recommendations here.
All stakeholders must speak out — ordinary citizens and health care providers of all stripes,
drug companies whose products are one of the fastest-growing costs, employers who cover
their employees’ drug and other health costs, and academics who study these issues.

Executive Summary
27
The scale of reform we propose is vast, dealing with organizational, clinical and business
issues. In the late 1990s, the Health Services Restructuring Commission was given power to
expedite hospital restructuring and advise the Minister of Health. Given that the scale of reform
being proposed in this report extends well beyond hospitals, a new commission should be
established to guide the reforms, drawing from a broad range of stakeholder communities,
including providers and citizens/patients.
We believe these recommendations can guide the health care system over the period to
2017–18 in a way that meets our target of a 2.5 per cent annual increase in health care
funding by the province. This is a tough goal; it implies that real inflation-adjusted spending
per person on health care will have to fall by a total of 5.7 per cent in the seven years from
2010–11, or 0.8 per cent per year. But we can reform the system to bring better care to more
people at less cost.
It is the reforms that matter most. Major spending cuts solve little, as we saw in the 1990s.
The health budget was cut for several years, but because thorough reforms were not
undertaken, pressures built and spending took off again, beginning in 1999.
Beyond 2017–18, spending will probably accelerate as a consequence of population aging.
This is why our recommendation for a 20-year plan and full public debate is crucial. The
government should describe the challenges ahead, highlight the potential for more efficiency,
discuss financial issues squarely and present the fundamental choices clearly. If we do not
seize the opportunity now to begin creating a system that delivers more value for the money
we spend, Ontarians a decade or two hence will face options far less attractive than the ones
we face today. Unless we act now, they will be confronted with steadily escalating costs that
force them to choose either to forgo many other government services that they treasure, pay
higher taxes to cover a relentlessly growing health care bill, or privatize parts of the health
care system, something that is anathema to most Ontarians.
We can and should avoid such an outcome by making the right decisions today, however
tough they appear at the moment. Our decisions will not be perfect, but almost certainly,
they will ensure that we bequeath a more equitable, more cost-efficient and higher-quality
system to future generations.

28
Elementary and Secondary Education
A strong education system is critical to Ontario’s prosperity and global competitiveness.
We believe that this era of restraint presents an opportunity to deliver education as efficiently
and effectively as possible.
The province funds nearly 98 per cent of education sector expenses. Over the past decade,
provincial spending on elementary and secondary education has grown significantly despite
declining student enrolment; one result has been a 56 per cent increase in per-pupil funding.
This is not sustainable. The Commission believes the sector growth rate must be constrained
to one per cent per year.
The government’s challenge is to restrain education spending while protecting the scholastic
progress achieved. The education sector should stay the course on its agenda of three key
goals: improving student achievement; closing student achievement gaps; and increasing
confidence in the publicly funded education system.
Because sound and transparent fiscal planning will enhance co-operation and stability, the
province should set funding allocations to school boards out to 2017–18. Not only will this
give boards time to find efficiencies, but also full knowledge of the budgetary future will support
constructive collective bargaining later this year when the sector’s collective agreements will
be renegotiated.
First Nations Education: On-reserve First Nations education urgently needs improvement.
Although this is a federal responsibility, the province is affected because most Aboriginal
students are educated in provincially funded schools. Most on-reserve secondary students
are educated off-reserve and the underfunding of on-reserve elementary schools often means
that students arrive at the secondary level with acute remedial needs. Federal funding per
student falls well short of parity with provincial education spending. The province should put
strong pressure on the federal government to adequately fund on-reserve education at least
at parity with per-student provincial funding. Failing an agreement with the federal government,
the Commission recommends that the province provide the required funding. Agreements
would include the facilitation of forming education entities among participating First Nations
with powers similar to provincially funded district school boards, and negotiation of
multi-year targets for the proportion of supervisory officers, principals and teachers who
will be deemed qualified by the Ontario College of Teachers.
Executive Summary
29
Full-Day Kindergarten (FDK): In 2010, FDK began in nearly 600 schools; another 200
schools were added in 2011 and some 900 more announced for the 2012–13 school year.
There is substantial evidence that investments in early childhood education produce significant
long-term socio-economic benefits. But costs associated with new staff, classroom supplies,
transportation, other school operations, capital and stabilization for the child care sector will
eventually amount to over $1.5 billion per year. In the current fiscal climate, the Commission is
concerned that the timing is inappropriate. The Commission is aware that the costs of FDK
were incorporated into the March 2011 Budget and 2011 Ontario Economic Outlook and Fiscal
Review in November. However, not enough offsetting restraint was secured in other spending
to ensure that these fiscal plans would achieve the overall deficit objective.
We recommend cancellation of the FDK program with appropriate phase-out provisions. If the
government decides to continue implementation, it should do two things. First, it should delay
full implementation from 2014–15 to 2017–18 and reduce FDK program costs by adopting a
more affordable staffing model of one teacher for about 20 students, rather than a teacher and
an early childhood educator for 26 students. Second, before confirming full implementation of
FDK, it should get assurances from school boards, teacher federations and support staff
unions that negotiated annual wage increases by 2017–18 will be no higher than current
trends in the broader public sector (BPS), and that class-size increases and reductions in
non-teaching staff contemplated by the Commission by 2017–18 will be achieved.
Class Sizes: One of Ontario’s fundamental strategies to improve student achievement
has been to reduce class sizes in primary schools (junior kindergarten to Grade 3).
Some 90 per cent of classes now have 20 students or fewer, and none has more than 23.
The government has committed significant resources to class-size reductions at the primary
and other levels. While the government has emphasized that smaller classes promote better
education outcomes, empirical evidence presents a more complicated picture. Ontario’s recent
improvements on provincial assessments and quality indicators have coincided with reduced
class sizes, but there is no evidence of causality. Even if smaller classes had some impact on
outcomes, the evidence suggests that investments in smaller classes do not offer the most
efficient means for improving results. Given this lack of convincing empirical support,
the Commission believes that scarce resources should not be applied to reducing class sizes.
We recommend increasing the class-size cap for primary schools from 20 to 23, and
increasing the class-size averages in junior/intermediate schools from 24.5 to 26 and in
secondary schools from 22 to 24. The Commission supports continued emphasis on programs
that have proven critical to increasing graduation rates. Class sizes should be increased in a
manner that does not jeopardize programs that have helped increase graduation rates and
benefited Ontario students.

30
Non-Teaching Staff: Since 2002–03, staffing has increased by more than 13,800 for
non-teaching positions. To meet our target growth rate in education spending of one per cent
per year to 2017–18, the Commission projects that about 70 per cent of these positions will
need to be phased out by that year. Boards will have to minimize the impact of this reduction
on school operations.
Limits to Funded Secondary School Credits: To get a secondary school diploma, Ontario
students must complete 30 secondary school credits. Many students, however, are completing
more than 30 credits; 14 per cent of Grade 12 students return for a fifth year. This is costly.
The Commission recommends that public funding be capped at 32 successful credits per
student. School boards should be allowed to charge a fee for additional credits.
Encouraging Efficient Student Transportation: Transporting students to school poses a
challenge to school boards, with costs difficult to contain. The Ministry of Education recently
placed a moratorium on new competitive procurement. This should immediately be lifted,
since it delays getting efficient, effective student transportation service through competitive
bidding. Users may have to bear a portion of the cost through a student transportation fee,
with provisions to ensure that lower-income, special needs and rural students are not
restricted in their access to learning.
A Comprehensive Plan to Live With One Per Cent Annual Growth: Our one per cent limit
on annual growth in the education budget means the sector will have $1.6 billion more to
spend in 2017–18 than in 2010–11. In our Status Quo Scenario, existing cost pressures point
to increases that will add $4.4 billion to the bill, leaving a shortfall of $2.8 billion. We believe
the recommendations already set out will eliminate this shortfall.
We assume that school boards would seek further efficiencies or other revenues to offset cost
pressures such as benefits, utilities, fuel and so on. The following recommendations, while not
costed explicitly, have been developed in that spirit.
Promoting Evidence-Based Solutions in Special Education: Special education grants
account for a significant portion of education spending at $2.5 billion in 2011–12, a 55 per cent
increase since 2002–03 despite declining enrolment. The link between increased funding and
outcomes for students is not obvious. The Commission commends the province’s focus on
supporting students with special needs, but we must direct every dollar to where it will have
the most impact. We recommend a full review of the province’s special education programs
and the results achieved, including programs for students in care, custody or treatment, and
hospital boards, with a view to ensuring that funding is being used effectively to improve
student outcomes. For clarity, we do not believe there is a “problem” with the overall special
education funding envelope. Our concern is the lack of measurable outcomes for the
significant investments made since 2002–03.

Executive Summary
31
Reform of Provincial Schools: The ministry directly manages a number of schools for the
deaf, demonstration schools for students with learning disabilities and schools for the blind and
deaf blind, serving about 800 students in eight schools. School staff members are provincial
employees; this is not the best governance arrangement. The government should close the
demonstration schools and use the savings to expand alternative secondary school programs
in school boards. The Schools for the Deaf should be consolidated into one site to achieve a
greater critical mass of students from junior kindergarten to Grade 12. Savings from this
consolidation should be reinvested in the School for the Deaf and in enhanced opportunities
for deaf learners in school boards, colleges and universities.
Appropriate Incentives for Teachers: Because public education promotes child
development and future prosperity, Ontario needs the best possible teachers. Research
supports the link between quality teachers and student achievement. Ontario teachers are
provided salary increases as incentives to engage in continued learning and development
through the Qualification and Experience (Q&E) grant. It recognizes the experience they gain
and allows them to move to the high end of salary ranges relatively early in their careers. Such
compensation systems help school boards retain excellent teachers. However, the Q&E grant
should reward teachers who are most likely to help their students achieve better results.
Training programs leading to Additional Qualifications (AQ) should be reviewed and Q&E
grants should be administered by a body independent from teacher federations or school
boards. Many teachers take AQ courses for duties they have no intention of fulfilling and their
absence disrupts classroom continuity. The province should require a minimum number of
years of full-time teaching experience before a teacher can try for AQ, and such courses
should be more rigorous and evidence-based. Other areas of school staff compensation must
strike a better balance between fair conditions of work and fiscal responsibility. For example,
the total provincial liability for retirement gratuities is nearly $1.7 billion; the province should
remove school boards’ power to offer such gratuities.

32
Delivering Services More Efficiently: The Ministry of Education should be a leader in
promoting efficiency and reducing duplication. School board facilities and information
technology may offer effective platforms for co-operation with other ministries, especially those
supporting children. Boards should also continue to seek out opportunities to foster
procurement efficiencies through their expanded buying power. Important steps have already
been taken through the Ontario Education Collaborative Marketplace (OECM), a not-for-profit
procurement organization. Boards can work together to consolidate back-office functions.
The government should work with school boards, teacher federations and support staff unions
towards shared ownership and administration of benefit programs. Efficiency can also be
found by maximizing the value of school board capital assets. Where schools have been
closed or consolidated because of declining enrolment, school boards have surplus properties.
The minister should have the power to order the sale of unused properties, especially when
such dispositions could meet other needs in the BPS. An increasingly widespread solution to
the problem of underutilized schools is the consolidation of Grades 7 through 12 in one
secondary school. The province should encourage such consolidations by eliminating top-up
funding to underutilized secondary schools if they can instead accommodate Grade 7 and 8
students in their catchment areas.
Containing Costs of Retirement Benefits: The province and Ontario Teachers’ Federation
co-sponsor the Ontario Teachers’ Pension Plan; the province matches members’ contributions
even though teachers are employed by school boards, not the province directly. In 2005, the
plan revealed its first shortfall since 1990, and contributions have increased since 2007. In
2011, the contribution rate was raised and some future indexation benefits reduced. The
province should reject further employer rate increases and instead aim to reduce benefits. The
province should also consider raising the retirement age; the typical teacher retires at 59,
having worked for 26 years, and then collects a pension for 30 years. A higher average
retirement age would reduce the need for lower benefits in the future.
Promoting an Efficient Labour Market for Teachers: In the late 1990s, fears of a looming
teacher shortage prompted the government and universities to increase teacher education.
The province funded more spaces in faculties of education, and new programs were
accredited at several Ontario universities, as well as universities in the United States and
Australia. Since then, the number of certified teachers in Ontario has increased, but the
retirement rate has declined. The number of new teachers now exceeds the number of new
retirees by 7,600 a year. The proposal to convert B.Ed. programs to two years from one, with
enrolment in each cohort halved, will help to reduce the oversupply. Still, the government
should discuss the overproduction of teachers with Ontario’s 13 universities offering
teacher education.

Executive Summary
33
Post-Secondary Education
Post-secondary education (PSE) must meet five critical objectives: it must educate a
growing share of the population; help equalize economic and social outcomes; provide an
important component of lifelong learning; be an engine of innovation; and deliver quality
education efficiently.
Enrolment is expected to grow by an average of 1.7 per cent per year through 2017–18.
Already, such rapid expansion, combined with the lowest funding levels in Canada, has
undermined quality — more sessional instructors, larger classes and less contact with
professors. Ontario provides the lowest per-student provincial operating grant funding in
Canada to its universities and colleges, and it is falling at a time when the cost of continuing
to do the same thing has been rising by three to five per cent annually.
Clear objectives are needed. Post-secondary enrolment in universities and colleges has grown
dramatically in recent years, but there is no coherent plan that addresses the whole system.
Higher enrolment is inevitable when the government’s funding formula ties grants to enrolment
growth, as it does now. A better formula would encourage PSE institutions to improve quality,
with varying mandates — a research focus for some; excellent undergraduate teaching for
others; and regional economic development for still others.
We must first address two very topical PSE issues — whether tuition freezes are in students’
best interests and the balance between research and teaching excellence.
The fact that tuition fees are rising faster than inflation is troubling. Tuition revenue should
represent a good investment for students, which puts a premium on efficiency, and
financial barriers should not impair access. But tuition freezes are not in students’ interests.
The likely result is further deterioration of the student experience — larger classes and
less opportunity to debate and develop critical thinking skills; and
As federal support for research tripled between 1997 and 2003, universities pursued
federal and provincial research dollars, all in the name of becoming “world-class research
centres.” Few of Ontario’s research centres will become the best in Canada, never mind
the world. Many, however, have gone so far in this quest as to cross-subsidize research,
effectively supporting it with money from undergraduate tuition revenues. Increasingly,
universities are letting professors sacrifice teaching commitments to conduct more
research. There must be a better balance; excellent research should not trump
excellent teaching.

34
Simply maintaining the status quo requires annual cost increases of three to five per cent at
PSE institutions, so greater efficiency is clearly needed. The current system is unsustainable
from both a financial and a quality perspective.
The Commission recommends the following:
Contain government funding and institutional expenses;
Use differentiation to improve PSE quality and achieve financial sustainability;
Encourage and reward quality;
Revise research funding structures;
Maintain the current overall cap on tuition-fee increases, but simplify the framework;
Re-evaluate student financial assistance; and
Generate cost efficiencies by, for example, integrating administrative and
back-office functions.
Contain Government Funding and Institutional Expenses: We recommend that
government funding be constrained to increases of 1.5 per cent per year to 2017–18.
This will not keep pace with projected enrolment growth of 1.7 per cent, nor with the
general rate of inflation, never mind the institutions’ historical internal rates of inflation,
so Ontario’s PSE institutions will need to find efficiencies to preserve, if not enhance,
quality. The government should work with the institutions to align bargained compensation
increases with more recent settlement trends in the BPS.
Increase Differentiation through Establishing Mandate Agreements: Ontario’s public
university and college system was largely established by the late 1960s. Since then, the
colleges’ mandate has evolved to include some degree-granting powers, blurring the original
rationale for the college system. The government should, by 2012–13, establish mandate
agreements with universities and colleges that provide more differentiation and minimize
duplication; these should be implemented beginning in 2013–14. By minimizing duplication of
programs, differentiation can reduce inefficiencies and realize cost savings. The government
should seek advice from either a blue-ribbon panel or the Higher Education Quality Council
of Ontario to help choose the highest-quality programs for expansion.

Executive Summary
35
The division of roles between the college and university systems should include the
following features:
After two years of study, college students who meet specific academic achievement criteria
should be able to transfer into the university system;
Colleges should not be granted any new degree programs, but existing programs should
be grandfathered;
The government should approve no new PSE programs until existing programs are
rationalized and mandate agreements completed;
No new professional and specialized programs should be approved without a compelling
business case; and
The Colleges of Applied Arts and Technology should work with the College of Trades to
optimize the delivery of apprentice training in non-degree programs.
Encourage and Reward Quality: Students are dissatisfied with large class sizes and
inadequate library facilities, among other things. Five specific areas should be addressed:
Resources and rewards should be refocused towards teaching: Post-secondary
education institutions should devote more resources to experience-based learning such
as internships, allow for more independent study, develop problem-based learning and
increase study abroad. Universities should be encouraged to include in their collective
agreements flexible provisions with faculty regarding teaching and research workloads.
Top-performing teachers and researchers should be recognized with the appropriate
workloads and rewards. Eleven Ontario universities already have such flexibility; others
should follow. Institutions should redesign incentive systems to reward excellent teachers,
as they do now for researchers.
Refocus provincial funding to reward teaching excellence: Provincial funding
allocations should be linked to quality objectives, and the funding model should reward
degrees awarded rather than just enrolment levels. Government and PSE institutions
should work to ensure that the capacity to integrate ideas and create innovative solutions
to problems is at the heart of the higher education experience. This will be critical to the
economic and social success of Ontario, in an economy where graduates will be working
over their career in ways that cannot even be imagined now.

36
Mandate agreements should include certain quality indicators: Progress has been
made in establishing common indicators, such as the use of the credit transfer system,
participation rates of under-represented communities, space utilization and class size.
Outcome indicators such as student satisfaction, graduation rates and post-graduation
employment are also used. However, the underlying measures used to indicate the quality
of the learning environment should be enhanced for both universities and colleges.
The government should also work with private career colleges to collect and publish the
same performance indicators as public colleges and universities. Funding should be tied
to indicators of learning outcomes.
Revise research funding structures: The government should evaluate the research
funding system of PSE institutions and research hospitals as a whole. The federal
government, which to its credit prompted the surge in university-based research, does not
cover all associated research costs, so universities cross-subsidize research from other
sources. There should also be an analysis of commercialization outcomes of research and
development investments, which is very weak. The Commission sees great value in the
Early Researcher Awards and Ontario Research Fund — Research Infrastructure program.
Maintain current tuition fee increases but simplify the framework: Keep the
five per cent ceiling on overall tuition increases, but let institutions adjust tuition fees
for individual programs, within the ceiling.
Re-evaluate Student Financial Assistance: An enhanced system of student loans must
accompany the current tuition framework. However, all forms of federal and provincial
assistance — student loans, loan remissions, grants and bursaries, tax credits, savings
incentives and summer employment subsidies — provide little more for students from the
lowest-income families than those from the best-off. They should be better targeted to low-
income students. Further, there is ample evidence that family income is not the most serious
access problem; the lack of a family history of college or university is the most significant
obstacle. Addressing the most acute access issues then becomes very much an issue for the
elementary and secondary school system, in conjunction with post-secondary institutions,
community organizations and businesses. The province should maintain the Ontario Student
Access Guarantee, under which a portion of tuition revenue is set aside to fund bursaries
and other student assistance programs. We also suggest that provincial tuition and education
tax credits be phased out and replaced with upfront grants. We also make several
recommendations to reduce costly defaults under the Ontario Student Assistance Program.

Executive Summary
37
Generate Cost Efficiencies by Integrating Administrative and Back-Office Functions:
We make a variety of recommendations that we think could save money for PSE institutions.
One involves co-ordinated purchasing. Another deals with pensions. Ontario hospitals,
colleges, municipalities and teachers have multiple employers, but only one pension plan
each. But there are 29 pension plans for 23 universities, a very fragmented arrangement;
they should be consolidated. Other recommendations involve the use of space.
Taken together, these reforms present a holistic approach for the PSE sector. If these
measures are not enough to allow the ministry to live within our cap of 1.5 per cent annual
growth, the government should eliminate the 30% Off Ontario Tuition grant. The government’s
highest priority should be to fully fund the operating grants for colleges and universities,
followed by current capital commitments. This will allow PSE institutions to focus on delivering
quality education, which will benefit students.
Social Programs
Social programs help the province’s most vulnerable citizens. From 2000 to 2010, social
spending grew by an average of 6.0 per cent per year, mainly because of increases in the two
main programs of social assistance — Ontario Disability Support Program (ODSP) and
Ontario Works (OW). To return the budget to balance by 2017–18, we recommend limiting
social programs to growth of 0.5 per cent per year. Bold policy prescriptions, new partnerships
and a continuing commitment to transformation will be needed to meet this challenge.
There are two types of social programs. Two-thirds of social spending in 2010–11 was carried
out through mandated and entitlement-based programs, in which benefits or service levels are
set by law. These include social assistance and the Ontario Child Benefit. Other programs are
discretionary, so clients are not guaranteed to receive them right away. These include support
for mental health programs for children and youth, developmental services, child care
subsidies and childhood development programs. When caseloads increase for social
assistance, an entitlement-based program, so too does funding; clients are entitled to benefits.
When demand outstrips supply for discretionary programs, the result is a waiting list.
More programs should be integrated across different ministries and different levels of
government, with the client’s perspective put first. Vulnerable people and their families do not
care which level of government or which ministry is responsible for providing support; they just
want help.

38
Benefit programs are delivered through various service providers under different funding
arrangements. Social assistance is delivered by the province, municipalities and First Nations,
but mainly funded by the province. And the Ontario Child Benefit (OCB) is funded by the
province, but administered by the Canada Revenue Agency. A lack of co-ordination has
created gaps, duplication and higher delivery costs, so those in need must navigate a complex
array of access points. Program eligibility criteria also vary. Many programs are income-tested;
others are universal; still others determine eligibility based on a client’s specific needs.
This can create unintended inequities and barriers to employment.
There is scope to do better: income testing can be centralized and income verification can
be automated; processing applications, eligibility assessment and payment can also be
automated; and eligibility criteria can be standardized across similar programs to reduce
barriers to employment.
Some positive steps have been taken to simplify access to income-tested programs.
The Ontario Benefits Directory now provides one-stop information on over 40 programs and
tax credits. Similarly, there is a new single-window access to developmental services and
supports. These must be just the beginning.
More effective programs and lower costs can flow from a fully integrated system that improves
both delivery and administration; this should ensure strong support for clients most in need.
Pursuing such a model means that data collection (with full protection of personal information
and privacy) must improve. Measuring client outcomes is needed to evaluate program
effectiveness and to understand how programs interact.
Social Assistance: We approached social assistance differently than other programs
because the Commission for the Review of Social Assistance (SAR Commission) under
Frances Lankin and Munir Sheikh is already studying these programs. The SAR Commission
will report later this year, well after our work is done. Yet because social assistance affects
the province’s finances, we too must propose recommendations. We have focused on
applying the themes that run through our report, such as achieving administrative efficiency,
rationalizing jurisdictional oversight and shifting from measuring inputs to outcomes. By no
means do our recommendations address all aspects of social assistance that warrant reform;
on that, we defer to our colleagues on the SAR Commission.
Social assistance consists of the provincially delivered ODSP and the locally delivered OW.
Maintaining two separate programs delivered by two levels of government is less efficient than
a single program and it perpetuates the antiquated idea that individuals who are eligible for
disability supports are unemployable. We urge the SAR Commission to examine alternatives,
including a consolidated model of a single, provincially funded social assistance program
delivered at the local level.

Executive Summary
39
Employment and Training: Our workforce focus means that the employment and training
component of social assistance becomes even more crucial. Chapter 9, Employment and
Training Services, highlights recent efforts to integrate these services through Employment
Ontario (EO). Further integration of OW and ODSP’s employment services with EO would
address program overlap and likely produce other benefits — better client service and
outcomes and perhaps even lower-cost employment services and reduced demand for
social assistance.
Many people with disabilities can and want to work. Yet we are only now beginning to
understand how to accommodate people with physical disabilities in the workplace; we are
even further away from doing so for those with mental disabilities. The government should
work to help employers and employees alike to understand and accommodate the specific
needs of these individuals in the workplace.
Among those with severe disabilities, many are unemployable; they would be better served
by a national basic income program instead of social assistance. The province should
advocate for such a program with the federal government and other provinces.
The federal Employment Insurance (EI) program does not meet the needs of the modern
labour market. Unemployed Ontarians do not receive equitable income support and
appropriate training opportunities to help them return to the workforce. Also, the increasing
proportion of people who are either new workers (often new immigrants) or young people in
non-standard employment (such as part-time or temporary employment) do not quality for EI.
The recommendations of the Mowat Centre EI Task Force, if implemented, would be a
considerable improvement.
Should social spending growth fall below the 0.5 per cent target, any savings should be
used to remove barriers to moving back to the workplace. Three areas command attention.
First, potential social assistance recipients must divest all liquid assets above a threshold —
$1,645 for a single parent of one child receiving OW. This deprives social assistance
recipients of the most basic means of climbing the “welfare wall” and is counterproductive.
Second, anyone getting social assistance is covered by the ODB program, but loses coverage
on finding a job. This is a strong disincentive to work. Third, in the unlikely event that funds do
remain after doing the first two, the basic needs and shelter amounts of social assistance
should be raised to fill any gap.

40
Child Welfare: In this case, as with social assistance, we deferred to the ongoing work of
another commission, the Commission to Promote Sustainable Child Welfare, now two years
into its three-year mandate. Its reports to date are consistent with our themes, but dealing with
our 0.5 per cent growth cap per year will nonetheless be difficult. The government should
continue to implement reforms proposed by the Commission to Promote Sustainable Child
Welfare.
Ontario Child Benefit: The OCB provides up to $1,100 annually per child; about one million
children in almost 530,000 families benefit from it. The OCB is a non-taxable, income-tested
monthly benefit. The OCB has transformed children’s benefits by providing support to all
low- to moderate-income families with children under 18, making it easier for parents to move
from social assistance to employment. This is commendable in terms of helping to remove the
“welfare wall,” but we note that the 2011 Ontario Budget committed the government to raising
the maximum OCB to $1,310, at a cost of $245 million per year. This runs counter to our
recommendation that any savings from reducing spending below the 0.5 per cent growth rate,
if achieved, should be directed to specific social assistance measures; the current OCB
maximum should be retained.
Other Social Programs: Discretionary social programs are overseen by many ministries and
BPS partners with varying levels of capacity. There are common trends: the province funds
most services; the province has recently taken on more funding responsibility from
municipalities (e.g., social assistance) and the federal government (e.g., stepping in when
child care funding was cancelled); co-operation across sectors is improving, but much more
needs to be done; and wait-lists still exist for most services in most programs. Since the
province provides most of the funding, it must lead change in these programs.
Children’s Mental Health Services: The legislature’s Select Committee on Mental Health
and Addictions has noted that services are delivered across several ministries and offered in
many care settings. The government has taken steps to reduce this fragmentation. It should
further integrate child and youth mental health services.
Children’s Services Integration: Greater integration of services for children and youth should
be expanded beyond mental health. As with the alignment of other services, co-operation
across ministries and with other levels of government (particularly at the municipal level)
will be key.

Executive Summary
41
Developmental Services: Recent legislation recognizes both that individuals with a
developmental disability can, with appropriate supports, live independently and that they and
their families want more choice and flexibility in choosing those supports. Shifting funding to
clients could promote a more competitive approach to providing supports based on individual
demand. The government should consolidate its funding for community-based support
programs into a single direct funding program.
Youth Justice: Where excess capacity in youth justice facilities can be demonstrated and a
more efficient option exists, strategic closures should occur.
Contributions of the Non-Profit Sector: The non-profit sector accounts for 2.5 per cent
of GDP, employs 600,000 people and has over five million volunteers. Most Ontario non-profit
organizations are run entirely by volunteers. These organizations should continue to get
funding, but the system should be more flexible and work to reduce administrative costs
by measuring outcomes rather than inputs. The government should also become more
responsive to the non-profit sector; a single window through which non-profits could engage all
government ministries would help.
Social Impact Bonds (SIBs): The government should use pilot projects to assess the
usefulness of SIBs, which help reduce fiscal pressures on government. While SIBs have
challenges, they also offer opportunities for better and more cost-effective social outcomes.
Employment and Training Services
Employment and training programs can be an important tool to help equip workers with the
skills they need for the available jobs. Some groups in particular struggle in the job market —
youth, recent immigrants, Aboriginals, laid-off older workers, single mothers with young
children and persons with disabilities. Existing programs need significant improvement to
maximize the participation of all working-age Ontarians.
Ontario offers a range of employment and training services. The Ministry of Training, Colleges
and Universities (MTCU) administers most of these through EO, which serves employers,
laid-off workers, apprentices, older workers, newcomers and youth. The Ministry of Community
and Social Services (MCSS) supports social assistance clients through the ODSP and OW.
The Ministry of Citizenship and Immigration (MCI) offers employment programs to immigrants.
There is also indirect support for training through tax credits.

42
With so many services provided by so many ministries, clear opportunities exist to improve
efficiency and quality. The new Employment Service (ES), a “one-stop shop” offering a full
range of employment support services, is a step in this direction. The EO should further
streamline its services for clients who need little intervention, so it can focus on the more
intensive interventions needed by others. Other ministries also offer employment and
training services that should be integrated with EO.
The federal government provides significant annual funding to Ontario through federal-
provincial labour-market agreements, each with its own requirements for client eligibility,
program design, reporting and accountability. The patchwork of such agreements leads
to fragmented and distorted policy-making. There are also federally funded and delivered
employment and training programs for youth, persons with disabilities and Aboriginals that
are not part of existing bilateral agreements. This creates administrative inefficiencies and
confusion for potential clients. Since many of these agreements are about to expire, the
opportunity is ripe for a single new arrangement that should devolve all remaining training
responsibility, specifically for youth and persons with disabilities, to the province. This would
provide Ontario with sufficient flexibility to fully integrate these services under the EO banner,
respond to its fluid labour-market needs and innovate using small-scale pilot projects.
Despite the many programs, there is no coherent strategy based on clear targets and
performance measures linked to outcomes. Labour-market information needs improvement.
Rather than just count the clients it serves, the government should track outcomes —
did clients get jobs, and for how long and at what wages? Also, the province needs better
data so it can better target labour-market programs.
In 1994, 25 Workforce Planning Boards were established to improve labour-market conditions
at the community level, but control remained at the MTCU head office. Their oversight is now
being transferred to regional offices — a positive first step that will promote stronger local
links. The boards should encourage employers in their regions to invest more in workplace-
based training, an area in which most now fall short compared to international competitors.
Various ministries run economic development programs that include a training component.
These programs largely function separately from EO, which renders them less effective.
Stronger links are needed, especially for such initiatives as the Ring of Fire.
Ontario’s apprenticeship system offers programs for more than 150 trades and occupations.
In 2010, Ontario established the College of Trades to modernize the apprenticeship and skilled
trades system. The government should shift responsibility for all apprenticeship administration to
other players in the sector. Functions related to the administration of apprenticeship classroom
training should be given to colleges and union training centres. All other administrative
responsibilities for apprenticeships should be transferred to the College of Trades.

Executive Summary
43
Immigration
Because Ontario’s population is aging and fertility rates are low, immigrants account for a
rising proportion of population growth; within this decade, all net growth in the working-age
population will come from immigration. This matters because successful immigrants can
contribute substantially towards strong labour-force growth, which in turn enhances Ontario’s
potential economic growth rate. If immigrants cannot use their skills and education, however,
their contribution to the economy cannot be fully tapped. This is happening; economic
outcomes for recent immigrants have deteriorated over the past two decades.
Any profile of immigrants to Ontario presents negatives and positives. Recent immigrants have
fared less well than earlier cohorts in the labour market. Immigrants are better educated than
people born in Canada, but recent immigrants’ earnings are well below those of Canadian-
born citizens and the earnings gap has been growing. Recent immigrants are also more likely
to live in poverty. The number of visible minority immigrants in Ontario is growing and they are
more likely to live in poverty for longer than one year.
A key problem for policy is that many of the critical levers of immigration lie with the federal
government, whose recent policies have worked to Ontario’s disadvantage. It is true that faster
economic growth in other provinces has played a role in luring more immigrants to other parts
of Canada, but changes to federal immigration policy have also reduced the number of
Economic Class immigrants, especially those in the Federal Skilled Worker (FSW) group.
Historically, Ontario has relied on such highly educated immigrants with solid language skills,
who tend to be the most successful, but federal policy has encouraged a shift in Ontario’s mix
towards a higher proportion of Family Class and Refugee immigrants.
It is vital that the provincial government develop — and present to the federal government —
a stronger position based on the province’s best economic and social interests, which would
include a greater provincial say in immigrant selection. Ontario should persist in its efforts to
increase the number of FSW immigrants, as their earnings grow faster than those entering
under the Provincial Nominee Program (PNP). Barring progress on this front, Ontario should
advocate for expansion of its PNP.
Refugees require special attention. They experience much higher rates of unemployment,
part-time employment and temporary employment than do people born here. Refugees and
refugee claimants have complex needs and many need social assistance, a sizable cost for
society and the provincial treasury. Ontario should press the federal government to
compensate the province for these costs.

44
Over the past decade, the Ontario government has made significant investments in programs
and services across Ontario to help newcomers settle, get language training, and become
job-ready and licensed in their field. These should be integrated with complementary services
already offered through EO, and carried out carefully, to ensure no drop in service quality
during the transition.
The first federal–Ontario immigration agreement in 2005 provided new funds to help
newcomers settle and improve their language skills. But the federal government has not kept
its commitment to spend all the funding allocated to Ontario; to date, the federal government
has underspent its commitment by over $220 million. Ontario should push for greater policy
control and full funding support for immigrant settlement and integration through the next
Canada–Ontario Immigration Agreement. Ontario should build a business case for devolving
federal immigrant settlement and training programs to the province with an appropriate funding
mechanism, similar to those established in British Columbia, Manitoba and Quebec.
Business Supports
The government should rethink and reset its business support programs. At a time when
the economy faces significant challenges, Ontario has two critically important assets that
support economic growth: one of the most highly skilled workforces in the world and an
internationally competitive tax regime. Recent tax reforms alone have saved business more
than $8 billion in annual taxes.
Ontario has myriad programs to support business investment. In the latest year, the
government spent just over $1.3 billion directly to help businesses through 44 programs
across nine ministries and provided another $2.3 billion of indirect support through tax
expenditures, including tax credits that were introduced when corporate income tax (CIT) rates
were high, but retained even after CIT rates fell significantly. Empirical evidence suggests that
business subsidies have done little to raise living standards and can distort business decisions
to the point where they are no longer based on sound economic criteria or require a
reasonable degree of private risk.
Ontario’s hodgepodge of direct and indirect programs is fragmented and lacks clear and
coherent objectives. As data on outcomes are often poor and inconsistent, it is unclear
whether the programs are achieving any economic benefits for Ontario. If we were to design
business support programs from scratch, they would not look like what we have now.
We can either restructure the existing programs or start over. The second option is the
better way forward.
Executive Summary
45
A new business support framework should be built on five policy pillars:
A refocused mandate: The focus of business support programs should shift from job
creation to productivity growth.
Consolidated funding: Ministries should manage a pooled envelope of direct and
indirect business support, financed by ending all direct business support programs by
Mar. 31, 2013. We believe the current level of direct business support could be reduced by
at least one-third.
Revised tax expenditures: Tax expenditures — such as refundable and non-refundable
corporate income tax credits and tax deductions or exemptions — are a form of spending
through the tax system. The government should sunset all refundable tax credits as of
Mar. 31, 2013, and then revive the useful ones through the single envelope for business
support programs. The Ontario Small Business Deduction (SBD) should be limited to
small businesses, as is the practice federally and in all other provinces.
Integrated delivery: A more user-friendly “one-window” portal would make it easier for
firms, communities and individuals to access information about all provincial economic
development programs, policies and services.
Strengthened accountability and transparency: Business support programs must be
subject to rigorous evaluation that links public expenditures to new, incremental activities
by business. A four-year sunset rule should be applied to all future business support
programs, and programs should be extended only if they have demonstrated their worth.
Greater transparency is also essential. A simple inventory of direct business support
programs seemed to be difficult for the Ontario Public Service (OPS) to produce.
Such changes should result in stronger, more productive firms producing higher-value
products and services, while creating more higher-paying, skilled jobs for Ontarians.
Infrastructure, Real Estate and Electricity
Public infrastructure, while costly, creates assets that can improve productivity (through
schools, for example) and either create returns (through greater tax revenue) or offset future
costs (such as traffic congestion). A recent study suggests that every dollar invested in
Ontario’s public infrastructure generates $1.11 in economic output. Ontario’s fiscal problems
mean that it will become harder to finance new infrastructure investment, so a civilized
dialogue on alternative methods to finance infrastructure is needed.
More should be done to keep infrastructure in good condition. The equivalent of about half
of the $72 billion of municipally owned water and wastewater infrastructure needs renewal.
Full-cost pricing would encourage both stable investment — which is more efficient and
fairer on an intergenerational basis — and conservation.

46
Urban transportation is a particular concern. Over the next 25 years, the Greater Toronto and
Hamilton Area (GTHA) is expected to grow from six million people to nine million, equivalent
to adding the population of Greater Montreal to the GTHA. Much of the region’s public
infrastructure is nearing full capacity and gridlock is already a problem. Public transit, surely
part of any solution, will be costly. There has been little discussion of either the action needed
to meet this challenge or the consequences of failing to act. We cannot review long-term
public transit funding, but there are more immediate opportunities; for example, GO Transit
should charge patrons for parking, which is more costly than many realize.
We need honest discussions on other revenue solutions. The province should pursue a
national transit strategy with the federal government, other provinces and municipalities.
General tax revenues will surely be part of any revenue solution — whether federal or
provincial — but there are alternatives such as congestion charges, comprehensive road tolls,
high-occupancy/toll (HOT) lanes, regional gas taxes and parking surcharges.
Real Estate Is Another Issue: The government of Ontario is the largest owner of realty in the
province, with a portfolio worth about $14 billion, much of it in office buildings, jails, courts and
hospitals. Most buildings are old and expensive to maintain. Yet ministries are charged less
than market rates for their use of government buildings; they would probably use less space
if they had to pay market prices, as they should. The government should also consolidate its
real estate and accommodation functions in the Ministry of Infrastructure. In reducing its realty
footprint the government will increase its potential to monetize its real estate portfolio; it should
develop a strategic plan to do so.
The performance of Ontario’s electricity sector has considerable implications for the province.
The government owns Ontario Power Generation (OPG) and Hydro One; its programs
include the Ontario Clean Energy Benefit (OCEB); electricity prices influence industrial
competitiveness; the feed-in tariff (FIT) policy is designed to attract investment; and electricity
policies directly affect the environment. Significant private-sector investment has been driven
by Ontario Power Authority (OPA) contracts, necessary because wholesale electricity prices
were too low to cover the private generators’ costs. In addition, the government’s job-creation
and environmental policy objectives have resulted in the replacement of coal-fired generation
with cleaner power sources, domestic-content requirements under the FIT program, and
increased conservation efforts. These policies, along with the cost of replacing and
maintaining aging infrastructure, have raised electricity rates for consumers.
There are several areas in which the electricity sector and Ontario’s fiscal position interact.

Executive Summary
47
Direct Program and Tax Expenditures: The OCEB provides a 10 per cent rebate on
electricity bills for residential, farm and small business customers, even though the
government acknowledges that electricity prices will continue to rise. This program distorts the
true cost of electricity and discourages conservation. As troubling as this is, the Commission
foresees that the scheduled demise of this generous incentive in 2015 will create a large price
shock for ratepayers. We worry that an extension of the OCEB would risk Ontario’s ability to
return to a balanced budget in 2017–18. Also, removal of the Debt Retirement Charge (DRC)
may be delayed until 2018. Ending the DRC and the offsetting OCEB at the same time would
provide a “soft landing” for ratepayers, but this would evaporate if such a delay occurred.
Finally, because the Commission strongly believes the OCEB’s $1.1 billion could be used
more effectively, the OCEB should be eliminated as quickly as possible. All other electricity
subsidies should be reviewed as well.
Electricity Stranded Debt: When the electricity system was restructured in 1999, only part of
Ontario Hydro’s debt was supported by the assets of its successor companies. The result was
$20.9 billion in stranded debt. The Ontario Electricity Financial Corporation (OEFC) was set up
to manage this debt and certain revenue streams were dedicated to pay it down. Also, the
DRC levied on consumers was part of this solution. The fiscal impact of the OEFC revenue
streams is significant; OEFC revenues, expenses and debt are part of the province’s budget.
The financial performance of OPG and Hydro One matters because their payments in lieu of
taxes and some of their combined net income go to service the OEFC debt. It is imperative
that OPG and Hydro One be run efficiently to maximize their contribution to deal with this
legacy of the old Ontario Hydro.
Options to Reduce Long-Term Electricity Costs: This report’s principles, set out in
Chapter 3, Our Mandate and Approach, can be transferred to the electricity rate base. In the
face of electricity prices that are projected to rise by 46 per cent between 2010 and 2015, the
province should seek efficiencies in the sector that would help slow electricity rate increases.
At the same time, the Commission recognizes that after so much change since 1999, a period
of normalcy may be helpful. Consequently, the Commission’s recommendations are meant to
balance the need for stability with the need to curb costs. The government should produce a
detailed, 20-year blueprint for the energy sector. It should also consolidate Ontario’s 80 Local
Distribution Companies (LDCs) along regional lines to create economies of scale; this would
result in direct savings on the delivery portion of the electricity bill. Further, the government
should mitigate the impact of the FIT program on electricity prices, first by reducing the initial
prices offered in FIT contracts and reducing the tariff over time, and second by making better
use of “off-ramps” built into existing contracts. Among other measures, the government should
seek administrative efficiencies in various electricity sector agencies and restructure the
wholesale electricity market so consumers located closer to generation stations can benefit
from lower electricity prices.

48
Environment and Natural Resources
Responsibility for protecting the province’s environmental and natural heritage falls to the
Ministries of the Environment (MOE) and of Natural Resources (MNR). At a time when fiscal
restraint will further restrict their supply of funds, it seems certain that demand for oversight
of environmental approvals, compliance and natural resource stewardship will rise.
Our recommendations are aimed at more effective and efficient operations.
Full Cost Recovery and User Pay: Full cost recovery is not in effect for all of the
government’s environmental programs, and existing fees do not keep pace with the rising
costs of program delivery; where possible, the costs of those services should be shifted
to the beneficiary. The Water Charges initiative should be expanded beyond high users to
medium- and low-consumption industries and put on a full user-pay basis. The Renewable
Energy Approval, which consolidates the range of approvals needed for renewable energy
projects while recovering about 90 per cent of its direct operating costs, is a good example
of a modern approval. The Drive Clean program fully recovers its costs.
Jurisdictional Crowding: Federal, provincial and municipal governments all set
environmental rules, with some overlap. Even within the Ontario government, regulations are
set by several ministries. This results in inefficient use of government resources and creates
uncertainty and confusion for industry, developers and citizens. The government should work
to rationalize roles and responsibilities that are shared by different governments.
The Approvals Process: Growth in natural resource extraction and energy will put pressure
on provincial environmental approvals and compliance systems. The MOE recently launched a
significant transformation of the environmental approvals process; it enhances environmental
protection with a greater focus on risk, responds to the needs of business, takes advantage
of current technology and addresses the increasing complexity of current approvals. Further
work should be done, especially in natural resource extraction.
The Environmental Assessment (EA) Process: Many projects require both provincial
and federal EA requirements. The 2004 Canada–Ontario Agreement on Environmental
Assessment Co-operation is under review, but removing duplication may require new
legislation and both governments are reluctant to give up decision-making authority.
Some projects need environmental and land use approvals in addition to an EA, though
proponents are often unaware of this when an EA process begins. The government
should further streamline the process.

Executive Summary
49
Prevention and Polluter Pay: The Environmental Protection Act gives the province the
“right to compensation” for loss or damage incurred as a direct result of a spill, and for all
reasonable costs and expenses incurred for a cleanup. This is a problem when the owner of
a contaminated site cannot be found or cannot pay for the cleanup. The province should put
more emphasis on prevention and should use the principle of “polluter pay” for contaminated
sites; the use of appropriate financial tools, such as financial assurance, should be part of this.
Ontario Clean Water Agency (OCWA): The OCWA, which operates drinking water and
wastewater systems for over 170 clients, is the only agency that competes in the marketplace
for its business and receives no funding from government. Its current business model is not
sustainable or competitive. It cannot offer its skilled operators appropriate compensation, so
many are leaving. And it cannot act quickly enough to pursue lucrative business opportunities.
It would work better as a for-profit, wholly owned government entity.
Land Use Planning and Resource Management: The many agencies doing this work in
southern Ontario should be rationalized and consolidated.
Ring of Fire: This development of major mineral deposits in northern Ontario offers the
prospect of substantial socio-economic opportunities for all northern residents, particularly
Aboriginal Peoples. The government should collaborate with Aboriginals, industry and the
federal government to maximize these opportunities.
Justice
The government’s justice ministries — the Attorney General (MAG) and Community Safety
and Correctional Services (MCSCS) — provide policing, correctional services, legal aid
funding, administration of the court systems and victim services. Three levels of government
are involved in the entire justice system: the federal government has jurisdiction over criminal
law; the province runs the courts and police services; and municipalities handle municipal
policing and prosecutions under the Provincial Offences Act. This means changes by one
government often drive program changes and costs for other governments.
The justice sector faces numerous fiscal challenges:
Compensation costs account for about 70 per cent of spending. The current contract for
the Ontario Provincial Police features a wage freeze in 2012 and 2013, and an 8.5 per cent
increase in 2014; the correctional officers’ current collective agreement expires at the end
of 2012;
Costs are rising for custody remand — people held in custody while awaiting trial. There
are now twice as many people on remand as there are sentenced offenders;
50
Aging infrastructure is deteriorating; 117 courthouses and facilities need renewal
or replacement;
The federal government’s omnibus crime bill provides for tougher sentences and
mandatory jail time. This will cost Ontario at least $22 million per year, probably
much more; and
The public expects more of the justice system than it previously did. Investigations into
organized crime, gangs and Internet crime are increasingly complex and require significant
resources. The family court workload has also become heavier as a result of increased
child protection initiatives. Moreover, catastrophic events such as the 9–11 terrorist attacks
in 2001 have generated greater public focus on emergency management.
The justice sector will need to transform its service delivery and find efficiencies while ensuring
public confidence. Our recommendations are designed to help.
Evidence-based decision-making is a persistent theme of the Commission. The justice sector
should improve its collection of data to evaluate whether policies and programs are meeting
their intended objectives, and how efficiently. The Justice on Target (JOT) program is an
example of how to use data to achieve better outcomes. Our full report identifies a number
of areas in which better data collection would assist the evaluation and analysis of policy.
Custody remand in Ontario is increasing and so are the costs. The two ministries should work
to reverse this trend. The JOT program, which has begun to reduce the time needed to
complete a criminal case, can also reduce the number of inmates on remand.
Family breakdown often results in multiple civil legal problems for low-income people; this puts
greater demands on both the justice system and social welfare services such as housing, legal
aid, social assistance, and physical and mental health programs. The MAG should use JOT
principles to develop an early intervention program that would divert less contentious family
disputes to non-court alternatives such as mediation. The government should also expand
diversion programs for low-risk, non-violent offenders with mental illness rather than send
them to jail.
Policing is one of the fastest-growing areas of public expenditures in Canada. After reviewing
and defining the core responsibilities for policing, which would include an examination of
alternative models of service delivery, the government should eliminate the use of police
officers for non-core policing duties, replacing them with special constables or private security
services. Similar measures could reduce costs in correctional facilities. Examples of non-core
services include inmate transportation and community escorts; inmate health care, food
services and laundry services.

Executive Summary
51
In 2010, the government strengthened efficiency and oversight by creating two new agency
clusters of adjudicative tribunals — Environment and Land Tribunals Ontario (which includes
the Assessment Review Board, Ontario Municipal Board and Environmental Review Board)
and Social Justice Tribunals Ontario (which includes the Landlord and Tenant Board, Human
Rights Tribunal of Ontario and Social Benefits Tribunal). Tribunals within each cluster share
common administrative functions, so each can focus on case management. Environment and
Land Tribunals Ontario now occupies a single building, where hearing and mediation rooms
can be shared. Procedural improvements are expected as these cluster organizations evolve.
Other ministries should follow this example; clustering has the potential to achieve cost
efficiencies in health, community and consumer safety, agriculture, commerce and labour
adjudicative tribunals.
The government should also examine opportunities to consolidate training in policing,
fire services and correctional services; these are now delivered individually through their
respective colleges.
To deal with aging infrastructure, the justice sector should continue to work with Infrastructure
Ontario to use alternative financing and procurement for capital projects. Completed projects
should be evaluated to learn if they did indeed deliver value for money as intended.
More federal-provincial co-ordination would be desirable in areas such as policy and
legislation, law enforcement and correctional services. Special attention should be paid to the
impact of federal legislation. Accommodating recent federal crime legislation will place further
demands on Ontario’s court and corrections systems, adding to the province’s fiscal burden
since the federal government has not yet addressed the cost issue. Ontario’s prisons are
now filled to 95 per cent of capacity; the new federal legislation could raise this to over
100 per cent, with rates as high as 150 per cent in some institutions. In the worst-case
scenario, the province would need a new 1,000-bed facility, costing $900 million to build
and $60 million per year to run.
Currently, offenders sentenced to less than two years go to provincial prisons while offenders
sentenced to two years or more serve in federal penitentiaries. Since effective rehabilitation
programs can be provided for inmates serving longer than six months, we recommend
uploading to the federal government the responsibility for inmates serving six months and
more. This would better align fiscal incentives for corrections and would give inmates access
to federal rehabilitation services.

52
Labour Relations and Compensation
There are over one million BPS employees in Ontario, about 70 per cent of whom are
unionized, compared with about 15 per cent in the private sector. This makes effective union-
management relationships important. Any government wanting to change the delivery of
services must work with the people who deliver those services and with the unions that
represent those people.
Labour costs account for about half of all Ontario government program spending. As such, the
target of 0.8 per cent program spending growth cannot be attained without moderation in the
growth of public-sector total compensation, whether through base wages; premium payments
such as overtime, shift premiums, merit pay or movement through “grids”; or pension costs.
Public-sector wage growth has moderated since the government introduced a restraint policy
in March 2010. However, many major agreements, including those covering Ontario’s almost
25,000 physicians and over 200,000 teachers, have not been renegotiated since then.
Labour compensation is but one consideration of labour relations. Ultimately, the goal is
to have a highly competent public service working at a high level of productivity, delivering
excellent public services. Tactics geared towards short-term fiscal gains such as wage freezes
and limits on the number of civil servants should be avoided. Wage freezes damage labour
relations and are often followed by wage catch-ups. A focus on program outcomes and
budgets will naturally and more efficiently result in a smaller civil service than arbitrary rules.
There should be no ideological or other bias towards or away from public- or private-sector
delivery of services, only a consideration of practical logic: what produces the best result for
the people of Ontario at an affordable cost?
The principles below are intended to support the transformation in labour relations that will
best allow management and labour to work together to deliver excellent public services.
The labour relations system in Ontario should be balanced, effective and transparent.
It should respect the interests of both employers and employees, provide value to citizens
and be seen to do both;
Collective bargaining agreements that are negotiated between the parties are preferred
to settlements or outcomes that are either legislated or arbitrated;

Executive Summary
53
Accountability for labour relations and service delivery should be appropriately distributed.
Governments, BPS employers and bargaining agents should bear responsibility for
bargaining outcomes. All BPS management and employees should bear responsibility
for delivering high-quality public services and value for public money; and
Broader system changes should be part of a larger vision, in which labour relations plays a
part, but is not an end in and of itself.
These principles should be applied to a number of key issues that recur in labour-management
relations in the public sector.
The goal of balance means the government should settle the issue of essential services and
change the interest arbitration system. An independent working group should determine which
services are essential and how disputes should be resolved. The interest arbitration system
has come under increasing scrutiny and attack. We do not find the system to be broken,
though it can be improved. Arbitrators are likely to follow the lead of public-sector employers
adopting tough, but fair, stances in negotiations. Among changes that would help:
an independent tribunal or commission should manage a panel or roster of independent
arbitrators, set time limits for each arbitration and require arbitrators to provide clear
reasons for their decisions.
Ensuring that public services are delivered more effectively and efficiently is primarily a
management problem. Most BPS workers are well educated, highly competent and dedicated,
but the system does not measure productivity well, nor does it encourage active steps to
improve it. This can and must change. The government should provide a zero budget increase
for wage costs; ministries and agencies will then have to drive out inefficiencies to absorb any
wage increase. Bumping provisions unduly impede the move towards a progressive and
efficient public service; these should be modified. Concerns about successor rights should not
stop privatizations or amalgamations; inherited agreements do not live forever. The Ontario
Labour Relations Board should be given expanded authority to encourage bargaining
structures that support the delivery of quality and effective public services. The government
should also encourage further rationalization of BPS bargaining. The province should move to
a smaller number of bargaining units and more centralized bargaining. The government should
set up a labour relations information bureau to collect data relevant to employers and unions,
especially measures of productivity.
54
Leaders in the OPS and BPS should be held to account, adequately compensated and offered
incentives to excel. The Ontario government needs highly competent employees, including
managers. Those who exceed their job requirements should receive bonuses. To help
managers, job descriptions and collective agreements should be flexible enough to put the
best people in the right places. The government needs greater flexibility both to move people
around and to address underperforming individuals and areas that are no longer priorities or
where the service could be better provided by another entity.
Many public-sector workers have recently agreed to, or had imposed on them, more
moderate compensation increases. Large employee groups in health and education that
are now entering into bargaining rounds should do their part. The government must work
collaboratively with BPS employers and bargaining agents to reach compromises that
recognize the fiscal reality. Employers may have to take and maintain hard positions in
the face of disagreement and disruption, but all parties should share a focus on results.
The government and its BPS partners must realize that moderation in compensation will be
difficult to maintain over the long term. A broad vision for labour relations must recognize this
and plan for the future. Transformation and productivity gains will ultimately allow the
government to provide sustainable services.
Operating and Back-Office Expenditures
The government’s operating and back-office expenditures include employee compensation,
IT, human resource management, financial services, procurement, communications and
other services. In many cases, these can be made more efficient without compromising
service delivery — in most cases, these changes will improve it. Many such reforms should
be extended to the BPS — schools, hospitals, agencies, boards and commissions.
The mandate of ServiceOntario should be expanded. ServiceOntario is the province’s public-
facing delivery organization with responsibility to deliver information and high-volume routine
transactions to individuals and businesses. A broader mandate for ServiceOntario would
reduce costs, increase productivity and improve service delivery to the public. The one-stop
approach — which can work across the Ontario government and in conjunction with the
federal and municipal governments — is better for clients and government alike. It should
further expand its service-delivery methods to new or alternate platforms, all the way to
partnerships with the private sector. ServiceOntario’s capital budget is now $2 million per year,
which limits its ability to secure efficiency gains; to carry out a broader mandate, it will need
more money, especially for updated IT.

Executive Summary
55
Private-sector partnerships should be used to move ServiceOntario further towards a full-cost
recovery model. Such partnerships can provide better value for taxpayer money, as long
as they meet the standards expected of public service delivery; Teranet is an example of a
public-private partnership that works.
“Agencies” is the generic term for a wide variety of entities to which the government makes at
least one appointment. They have diverse and complex mandates and perform a variety of
roles. The agencies’ governance framework and accountability mechanisms were reviewed in
2010. But a broader review is needed to determine if their mandates continue to be relevant
and if efficiencies could be achieved.
Delegated Administrative Authorities (DAA) have delivered regulatory services since the
mid-1990s; DAAs are private, not-for-profit corporations that administer legislation on behalf
of the government under accountability and governance agreements with the government.
Delegated Administrative Authorities have been found to reduce costs to taxpayers, improve
regulatory outcomes and efficiency, retain government oversight and increase industry
engagement. At a time of fiscal restraint, there is a risk of service erosion as regulatory
ministries seek to reduce costs. The government should set up more DAAs.
In the late 1990s, the government combined a hodgepodge of information and information
technology (I&IT) solutions into clusters. I&IT is the technological backbone of government
operations. Further efficiency and better value for money will be found by eliminating
redundant services and centralizing common functions. The government now uses both
in-house and external service delivery; in a constrained fiscal environment, outsourced
contracts may make the difference between the continuation and the end of some services.
Accountability is essential, but we often treat that goal as an absolute good. Taxpayers
expect excellent management and transparent procurement, but an exclusive focus on
rigorous financial reporting and compliance requires a significant investment of time, energy
and resources that is subject to diminishing returns. The added cost to government, to the
general public, and to the private and non-profit sectors in ensuring compliance should be
balanced against the risk of waste or fraud. The Auditor General should be asked to help
find a new and appropriate balance. At a minimum, the government should switch from
individually tracked expenses to a per diem system for civil servants and consultants.

56
In a number of areas, efficiencies already introduced in the OPS should be extended to
the BPS. Among these:
Shared services for back-office functions (e.g., payroll, financial transactions, procurement,
collections and insurance) and common administrative services (e.g., printing, mail,
translations and asset management) can save money;
The consolidation of I&IT services in the OPS saved $100 million per year; savings would
be greater if this were pushed out to the BPS;
A standardized framework would enable the BPS to leverage its immense purchasing
power through collaborative purchasing, standardization of products and processes,
and back-office consolidation; and
Centralized maintenance practices already established in the OPS should be extended
to the BPS.
Transfer payment and grant programs in the OPS are ripe to deliver centralized efficiencies.
Because many organizations are funded by several ministries, the government has trouble
assessing the overall picture and recipient organizations are frustrated at dealing with multiple
requirements. A new enterprise grants management system, developed by two ministries to
overcome these problems, is set to launch shortly; expanding it to the entire OPS would
spread its costs across more ministries.
Government Business Enterprises
The government of Ontario owns four government business enterprises (GBEs): the Liquor
Control Board of Ontario (LCBO), Ontario Lottery and Gaming Corporation (OLG), Ontario
Power Generation (OPG) and Hydro One. They contribute substantial sums to the provincial
treasury — $4.6 billion in 2010–11 alone. Together, their net assets amounted to $17.6 billion
at the end of last fiscal year.
We looked at two distinct approaches to generating further value from them: the government
could sell all or part of each business; or it could improve business efficiencies while retaining
full government ownership.

Executive Summary
57
Sales of GBEs: Because these assets contribute substantial ongoing and growing revenues
to the province, a full divestiture of any or all of the GBEs would result in a lump-sum payment
to the province at the expense of future revenue streams. If sale proceeds were directed to
pay down provincial debt, Ontario could save on interest costs of up to four per cent, based on
recent bond yields. By comparison, GBEs provide a return on assets (ROA) of at least eight
per cent. Any full divestiture would have to overcome this spread to provide a fiscal benefit to
Ontario. Current circumstances do not appear to offer a convincing value proposition for the
province. Even so, Ontario should not close the door on new approaches that generate better
value out of the GBEs. Action, however, must not be driven by ideology. Any sale must rest on
overwhelming evidence that Ontario would benefit in the long run.
Improving GBE Operations: The GBEs may not be achieving their full potential because of
operational inefficiencies and because they are sometimes ordered to act counter to their
direct commercial interest.
There may be opportunities to improve LCBO returns through increased efficiencies and new
business opportunities. The Auditor General noted in his 2011 Annual Report that the LCBO
could more effectively use its purchasing power and improve the current mark-up structure
used to determine retail prices. The LCBO also has obligations that reduce profitability, such
as promoting Ontario producers. The policy merits of these measures should be balanced
against any reduced profitability. The LCBO may also be able to increase profits by opening
more stores.
The OLG provides significant net income to the province while maintaining social responsibility,
but efficiencies and other measures could improve the company’s margins. The OLG currently
operates two head offices in separate locations; it should close one. It operates two casinos
in the Niagara area; it should close one. Slot machines are directed to racetracks, where
subsidies are provided to the horse racing and breeding industry and municipalities, rather than
locations that would be more convenient and profitable; OLG would make much more money
if slots were permitted elsewhere, as they should be. The OLG gives lottery terminals to
merchants who sell tickets, an implicit subsidy. This practice too should cease.
The OPG and Hydro One occasionally endure government intervention that lacks a clear and
legitimate policy objective, to the potential fiscal detriment of the province. They should both
be encouraged to seek operational efficiencies in line with their industry’s best practices. In an
effort to reduce costs to consumers, the government occasionally intervenes in regulatory rate
filings for both OPG and Hydro One. As a result, electricity rates may become decoupled from
costs, providing a de facto subsidy to electricity consumers, and reducing both companies’ net
income and their contribution to provincial revenues.

58
Revenue Integrity
Across a range of revenue issues, better administration and enforcement could improve the
integrity of the tax system and build Ontario's fiscal capacity.
The business tax base needs strengthening. Globalization has offered companies more
opportunities to reduce the provincial corporate income tax they pay. Ontario should work
closely with the federal government and other provinces to reduce aggressive tax avoidance.
Such steps could generate over $200 million per year in revenue.
The underground economy creates an unfair tax burden for taxpayers and makes it hard for
legitimate businesses to stay competitive with those that evade many business taxes. More
should be done. Quebec has made progress through tougher penalties for non-compliance,
intensified tax audits and a tighter focus on high-risk industries and products, along with
other initiatives. Ontario should take similar steps and work with the federal government to
co-ordinate and strengthen compliance. These and other measures could yield the province
over $500 million per year.
Fines valued at $1 billion under the Provincial Offences Act (POA) remain uncollected.
The province should take more aggressive action to collect this money; for example, it could
suspend licences and registrations, add POA fines to the offender’s property tax bill and
offset tax refunds against unpaid POA fines.
The Auditor General has highlighted the government’s collections activities for accounts
receivable and overdue accounts. The 2011 Budget proposed a more centralized system
to be lodged in the Ministry of Finance that would reduce costs, improve the monitoring
of overdue accounts and reduce accounts receivable. Other jurisdictions have already
moved in this direction. Early estimates indicate that this would eventually generate over
$250 million per year.
The Ministry of Finance has developed a sophisticated, automated audit assessment tool to
identify areas of greatest financial risk, which helps auditors and inspectors determine where
they should focus their attention. By co-ordinating government-wide audits of companies,
a valuable resource for ministries, the Ministry of Finance will be better able to recover funds
on behalf of the province. The revenue potential here is over $50 million annually.

Executive Summary
59
The government receives about $1.8 billion every year from over 400 types of user fees (e.g.,
driver’s licences). Most are set at a specific rate, but there is no regular process for reviewing
these fees so, over time, they do not reflect the rising costs of providing the related service.
Many of these have seen little change since 2003. The government could set fees to recover
all costs associated with the service provided, as recommended by the Auditor General in
2009; this would raise over $500 million per year in additional revenue. Or it could index all
user fees each year by the rate of inflation. The government should update its user fees
using a blend of full cost recovery and indexation, with the change phased in over the next
two years.
The Commission has no mandate to recommend tax increases. However, we have noted
throughout the report that revenues tend to grow more slowly than nominal GDP. As such,
our Status Quo Scenario features a decline in the tax burden, defined as the revenue-to-GDP
ratio. Allowing the overall tax burden to decline magnifies the severity of program spending
restraint required if we are to return to a balanced budget. This severity could be alleviated
somewhat if the taxes that do not keep pace with economic activity were reformed to do so.
Consistent with our mandate, we have not incorporated any such revenue increases into our
Preferred Scenario. We simply note the reforms that could prevent a decline in the overall
tax burden.
The main source of this downward bias in the tax burden is education property taxes, including
business education taxes (BETs), and a number of excise taxes that are levied on the volumes
rather than the values of the products.
Since 2000, property assessments have more than doubled, but municipal property taxes
have increased by only 70 per cent and education tax revenues, by only one per cent per
year. This is because the provincial government fully offsets the impact of reassessment
when resetting education tax rates. This reduces revenues available to support education
and requires increased transfers to school boards. The province should stop fully offsetting
reassessments so that revenues increase with inflation.
An additional concern is the wide range of BET rates across the province. Under a 2007 plan
to address these distortions and inequities, high BET rates are being reduced to a target rate
by 2014, eventually saving businesses $540 million annually. Since the plan was introduced,
high BET rates have decreased and the variance among BET rates has narrowed, but a
considerable gap remains. The province should continue to implement the BET reduction
plan while considering options to avoid revenue losses; raising low BET rates would help to
offset reductions in high BET rates. This would make the business tax system more equitable,
while providing a significant increase in revenues for education — up to just over $1 billion
by 2017–18.

60
Contraband tobacco is another issue. In recent years, tobacco consumption has flatlined
after more than a decade of decline in smoking rates, partly because cheap illegal tobacco —
which reduces provincial revenues — is available. Better enforcement has generated results.
The government has taken steps to deter illegal tobacco but needs to go further. Measures
we recommend could result in increased annual revenue of up to $225 million.
Excise taxes — on beer, wine, tobacco and gasoline, for example — are levied on the volume
sold, not the value (that is, they are specific, not ad valorem, taxes). So if prices rise, but not
volumes, revenue from the taxes does not respond. The government should switch to ad
valorem taxes, or otherwise capture changes in values, so revenue will reflect inflation.
Liability Management
No fiscal projection is static; once released, it is subject to risks that can have a positive or
negative impact on the province’s actual fiscal results. Ontario’s fiscal plan includes a reserve
to protect against adverse changes in the revenue and expense outlook, but it is too inflexible.
General risks should be handled through the contingency reserve, which should be set higher
than in recent budgets and grow over time. Modest internal risks should be addressed through
an operating reserve.
There are risks the government cannot predict — like SARS, H1N1 or support of the auto
sector. Other risks — like the need for forest firefighting — are known in advance, but the
scope of the need is not. Finally, there are risks that are unknown both in their probability and
their cost. The government should have an explicit strategy for dealing with risk. We have
identified a number of liability risks for which the province should develop management plans.
These are known risks that are subject to mitigation strategies. More will undoubtedly surface,
so the liability management strategy must be very fluid.
Pension Benefits Guarantee Fund (PBGF): Created in 1980, the PBGF was designed to
assist pensioners and plan members when occupational pension plans are wound up with too
few funds to cover promised benefits and the employer cannot make the required payments.
It is administered by the Superintendent of Financial Services and generally covers single-
employer defined benefit pension plans in the private sector and BPS. Ontario is the only
sub-national jurisdiction in the world to provide such coverage. A 2010 study concluded that
the PBGF was not sustainable in its current form. As such, it presents a large fiscal risk for
the province in the event of another economic downturn. The province should either
terminate the fund or see if it can be transferred to a private insurer.

Executive Summary
61
Liability from Pension Funds in the BPS: Ontario’s public-sector pension plans — to which
the province provides direct and indirect funding — include some of the largest in the country.
More transparency and strategic planning would help manage this risk. The government
should develop plans to contain fiscal risks. Five plans are consolidated in the province’s
financial statements. The province is wholly or partly responsible for any shortfalls in three of
those: the Public Service Pension Plan (PSPP); OPSEU Pension Plan (OPSEUPP); and
Ontario Teachers’ Pension Plan (TPP). The employers bear this joint responsibility for the
Healthcare of Ontario Pension Plan (HOOPP) and Colleges of Applied Arts and Technology
(CAAT) Pension Plan. The Commission encountered considerable confusion on the question
of who bears the ultimate financial responsibility for funding deficits. The government should
clarify who ultimately holds financial liability.
The three pension plans sponsored or co-sponsored by the province now have funding
shortfalls; HOOPP was fully funded as of its latest valuation, while CAAT had a small surplus.
Many of these have increased employer and employee contribution rates and some have
reduced or eliminated the guarantee of inflation protection. A sensitivity analysis of the health
of these plans would be useful since views differ on how their liabilities should be valued.
The government has few levers to make significant short-term adjustments to its pension
costs, but long-term savings are possible.
When faced with future shortfalls, pension plan sponsors should reduce prospective benefits
to limit the need for further contribution rate increases. For its part, the government should
make benefit cost containment part of its compensation negotiating strategy for the BPS.
The government should seek opportunities to save money and obtain better investment
returns by consolidating administrative functions and pooling the investments of pension plans
across the BPS. Transparency is also important. The cost of the public-sector pension plans
should be made much clearer in the Public Accounts and the Budget.
The Taxpayer Protection Act fetters the government’s capacity to make decisions regarding
revenues due to its restrictions on increasing tax rates or introducing a new tax. Ultimately, the
government is accountable to taxpayers if it decides to modify tax rates or introduce a new tax.
Modifying or eliminating this act will allow spending and taxes to be used as required to
address the threats of fiscal sustainability.
Environmental Risks: To better protect the province from the costs of environmental
cleanup, the legislation should be changed to put more focus on the principle of “polluter
pays.” Other options include a program like Superfund in the United States, which has the
authority to clean up hazardous waste sites.

62
Risks Posed by the Federal Government: Ontario is always subject to the risk of federal
government policy changes, which can disrupt the province’s fiscal planning and public
services. Among the known risks:
The outcome of current negotiations for a comprehensive free trade agreement with the
European Union could significantly raise the cost of prescription drugs in Ontario because
the proposed harmonization of patent rules would keep generic drugs off the market for
longer. This could cost Ontario up to $1.2 billion per year, more than wiping out the savings
from the provincial government’s recent drug reforms;
Ontario and the federal government share a common personal income tax base and
Ontario generally parallels any federal changes. Federal proposals to expand income
splitting and double the contribution limit on Tax-Free Savings Accounts could reduce
Ontario revenue by $1.3 billion annually;
Changes in the Canada Health Transfer (CHT) will cost Ontario almost $231 million
per year based on current forecasts, but could reach almost $421 million if GDP growth
falls to three per cent; these reductions will grow over time. Tying the CHT to GDP growth
will almost inevitably reduce the federal contribution to health spending;
Recent crime legislation will place further demands on the provincial court and corrections
systems. The federal government has not yet recognized or addressed the additional cost.
The lowest cost estimate of the impact of the federal crime bill is $22 million per year;
it will probably be much higher; and
A three-year social housing agreement with the federal government signed last year will
provide $480 million, split 50–50, to build or repair 6,000 affordable housing units. There is
currently no federal funding commitment beyond the end of the current agreement.
Risks Posed by the Municipal Sector: There are potential risks for the province in the event
of default by a municipality. The province should work with municipalities to ensure that
commitments are met. Known risks include potential overruns in municipal infrastructure and
the Pan Am Games. Although municipalities are responsible for maintaining their
infrastructure, there are continual calls on senior governments to finance new projects. What is
needed is a comprehensive plan that points the province, municipalities and the federal
government in the same direction. This is an opportune time to take stock of the current
approach to municipal infrastructure. Toronto and the Golden Horseshoe region will host the
2015 Pan Am Games. The province is contributing $500 million and is responsible for any
spending beyond the approved $1.4 billion budget. As the deficit guarantor, the province must
be vigilant in ensuring that the parties involved do not allow any overrun in expenditures.
Unknown Risks: Risks that we cannot foresee are inevitable. The fiscal plan must also be
prepared for the unexpected and provide for unknown risks as well.

Executive Summary
63
Intergovernmental Relations
Federal, provincial and municipal governments all deliver services to Ontarians, often with
inconsistent objectives and unco-ordinated activities. Better co-ordination would help in some
areas, but in others, a whole new delineation of responsibilities is needed. The province’s
relations with the federal government and with Ontario municipalities have major
consequences for the provincial budget. We will deal with each in order.
Federal-provincial relations
In 2009–10, Ontario’s 39 per cent of Canada’s population contributed about 39 per cent of
federal revenues, but benefited from only 34 per cent of federal spending — a gap worth about
$12.3 billion or 2.1 per cent of Ontario’s 2009 GDP. The spending gap is a clear demonstration
of the perverse structure of Canadian fiscal federalism.
Under the Constitution, the provincial and federal governments explicitly share some
responsibilities, while issues unknown in the 19th century have forced governments to work
together. This collaboration has resulted in accomplishments such as medicare, social
services and tax reform, but federal actions can sometimes disrupt provincial fiscal planning
and public services. Ontario needs federal co-operation to address the fiscal, economic and
demographic challenges it faces, as do other provinces. More than ever, all governments must
work together to reform public services. The time for a new federal-provincial paradigm is now.
The Ontario government should establish an understanding with the federal government that
federal actions pose fiscal risks to Ontario. There are now four major risks:
Changes to the common tax base: Common personal and corporate income tax
bases simplify tax filing. Proposed federal changes on income splitting and Tax-Free
Savings Accounts could cost Ontario $1.3 billion in lost revenue, since the province would
likely mirror these changes. And because Ontario parallels some federal tax provisions for
business, federal changes to the Scientific Research and Experimental Development tax
credit should only be done in consultation with the province.
Changes to Canada’s Criminal Code: Changes to the Criminal Code will impose new
demands on the provincial court and corrections system, adding to the fiscal burden.
The new “tough on crime” legislation is expected to result in substantially higher costs
for Ontario. (See Chapter 14, Justice Sector, for full recommendations.)
Reducing support for immigration settlement services: In 2005, the federal and
Ontario governments agreed to increase funds for immigration settlement services in
the province. The federal government has underspent by more than $220 million under
the agreement, reducing potential services to help newcomers settle, integrate, receive
language training and find work.

64
Long-term health costs outstripping federal funding: The CHT and the Wait Times
Reduction Fund are set to expire in 2014. The federal government plans to increase the
CHT by its current six per cent per year until 2017, but then tie the growth rate to Canada’s
nominal GDP, with a three per cent floor. While we recommend capping the growth of
Ontario health spending below that level to balance the budget by 2017–18, the long-run
cost of health care will almost certainly grow faster than nominal GDP. Moving to a
GDP-based growth rate would cost Ontario about $239 million in 2017–18, but could
reach nearly $421 million if GDP growth is below three per cent. These gaps will grow.
Constraining CHT transfers in this fashion will reduce even further the federal
government’s minority share of health care funding.
Aside from the major transfers (CHT, Canada Social Transfer [CST] and Equalization),
the federal government has made no commitment to renewing other expiring transfers.
Ontario needs a reliable and predictable federal partner.
Some federal programs that directly serve Ontarians or fiscal arrangements that support
provincial services should be modernized and reformed. The province should advocate
strongly to change federal programs that do not work effectively in Ontario’s interests.
(Full recommendations on these points can be found in the individual chapters.)
Equalization: A ceiling on Equalization limits the size of the program to the nominal growth
rate of national GDP despite rising disparities among the provinces. The program fails to fully
capture and share the wealth generated by high commodity prices in other parts of Canada.
Nor does the program account for Ontario’s higher cost pressures, which affect the cost of
public services. Equalization should fully capture resource revenues and accommodate
differing price levels among provinces.
Canada Social Transfer: The federal government generates revenues from Ontario on a
nearly equal per capita basis; the CST then returns money to the province on an equal per
capita basis. This unnecessary step is inefficient and reduces accountability and transparency.
The CST should be transferred to the provinces in the form of tax points; in other words,
the federal government should reduce its taxes so provinces could increase theirs by an
equivalent, revenue-neutral amount.
Employment Insurance: Employment Insurance does not meet the needs of the modern
labour market. In 2010, Ontarians contributed about 40 per cent of EI premiums, yet received
only 32 per cent of benefits. And despite having an unemployment rate above the national
average, only 32 per cent of unemployed Ontarians get EI, which also restricts their eligibility
for training. The changes recommended by the Mowat Centre for Policy Innovation would
improve outcomes for Ontario workers and employers.

Executive Summary
65
Income assistance for persons with disabilities: Individuals with severe disabilities
face significant barriers to gaining employment and earning a decent wage. These vulnerable
individuals are now served by a “tangled safety net” of federal and provincial programs.
They would be better served by a national income support program.
Immigration policy: Immigration will increasingly be a source of Ontario’s population and
economic growth. We noted above that the federal government has underinvested in Ontario
and plans further cuts in immigration settlement spending. Moreover, Ontario is allowed to
nominate only 1,000 individuals through its PNP, compared to 5,000 for Alberta. The province
should have more influence in determining immigration policy. The federal government should
also devolve immigration services, with funding, to Ontario.
Education for First Nations on-reserve: Better education on reserves is crucial to improving
the social and economic outcomes of First Nations peoples, but federal funding per student
falls short of the provincial average. The province should put strong pressure on the federal
government for adequate funding. Failing such action, which is clearly justified
and desperately needed, the province should plug this gap.
Green energy: The federal government has provided little support for Ontario’s green energy
initiatives, but $1.4 billion in annual subsidies to the oil and gas sectors. Ontario needs fair and
equitable support for its clean energy initiatives.
Working together to rationalize public services: The provincial and federal governments
should reduce overlap and duplication of services. This discussion could start by examining
inefficiencies in overlapping employment and labour-market training services; the
effectiveness of federal immigration settlement programs; the potential gains from each
government specializing in corrections or parole services; collaboration in direct citizen
transactional services; the benefit of a national transit strategy; and rationalization of
environmental protection activities and regulations.
Employment and training services: The fragmented nature of various federal-Ontario
labour-market agreements limits the province’s ability to benefit from fully integrated services.
Several of these agreements expire after 2013–14, so there is an opportunity for reform.
Greater flexibility for Ontario would allow the province to adapt the full suite of labour-market
programs to meet changing labour-force needs.

66
Immigration settlement and integration services: Both the federal and Ontario
governments provide immigration settlement services, with significant overlap that creates
inefficiencies and reduces co-ordination. Responsibility for integrating newcomers should lie
with local authorities, which can respond to regional needs. Settlement programs have been
devolved to provincial governments in British Columbia, Manitoba and Quebec, but the federal
government has not agreed to do the same for Ontario. The federal government should
devolve these services to Ontario with funding.
Corrections services: Effective rehabilitation keeps communities safe and controls
correctional expenses, but the current arrangement prevents the maximization of these
benefits. Offenders sentenced to less than two years go to provincial prisons, while the rest
serve their time in federal penitentiaries. There are too few inmates serving sentences of
between six months and two years for the province to provide rehabilitation services.
The government should explore uploading the responsibility for inmates serving six months
and more to the federal government; this would give these inmates access to federal
rehabilitation services.
Citizen transactional services: ServiceOntario, which integrates the services delivered
by various ministries into one easy-to-access location, has reduced wait times, improved
accessibility and achieved efficiencies. The federal, provincial and municipal governments
should continue to explore other opportunities to collaborate.
National transit strategy: Traffic congestion is a systemic issue from coast to coast,
justifying a national approach. Canada is the sole nation in the OECD that lacks a national
transit strategy.
Environmental protection and regulation: Environmental management is shared by
the provincial and federal governments. Although the two co-operate on environmental
assessments, more remains to be done. The federal government is reviewing its legislation
in this area and has shown interest in removing duplication between approvals processes.
The two governments should continue to pursue the creation of a “one project–one
environmental assessment” solution.
Provincial–Municipal Relations
Municipalities provide many services — such as social housing, social assistance, drinking
water quality, public transportation, land use planning and waste management — that are
governed by provincial legislation and standards. Most municipal revenue comes from local
sources, mainly property taxes. Yet provincial transfers account for nearly one-fifth of their
revenue, including contributions to cost-shared programs and unconditional funding
through the Ontario Municipal Partnership Fund (OMPF).

Executive Summary
67
Provincial support to municipalities has increased substantially since 2003, mainly to reverse
the downloading of responsibilities of the previous decade. After the 2008 Provincial-Municipal
Fiscal and Service Delivery Review, the province agreed to upload various municipal costs
over a 10-year period. The province also funds municipal infrastructure. Recommendations
on provincial-municipal issues are found in many chapters of this report.
Support to municipalities is on track to rise by an average of 5.2 per cent per year to 2018.
Much of the growth comes from the remaining $500 million of uploading. Excluding that,
transfers would still grow significantly faster than the 0.8 per cent annual pace we recommend
for overall program spending growth. The Commission supports the upload and we realize that
any change in the upload merely shifts, not solves, the fiscal problem. Most municipalities also
struggle with their budgets. Still, we believe that overall spending restraint means that total
transfers should not increase as rapidly. We recommend first that the upload period be
extended by two years to 2020 and second that the OMPF should decline to the planned
$500 million by 2016.
The province and municipalities should also track how municipalities invest the benefits
realized from the uploads. This accountability framework should focus on new municipal
capital spending.
The province and municipalities share the property tax base — a stable revenue source that
funds local services and a portion of elementary and secondary education. However, the
practice of cutting education tax rates to offset reassessment increases has reduced revenues
for education, which is supported by property taxes. The province should maintain stable
education tax revenues in real terms. (There is more on this in Chapter 18, Revenue Integrity.)
Different levels of government must work together to find the most efficient ways to service
those most in need. To maintain service levels while limiting spending growth to 0.8 per cent
per year, all players, including municipalities, must commit to greater efficiency and
transformation.

68

Chapter 1: The Need for Strong Fiscal Action
69
Chapter 1: The Need for Strong Fiscal Action
Ontarians want excellent public services from their government. The Commission understands
and supports this desire. We see no reason why Ontario cannot have the best public services
in the world — with the proviso that they must come at a cost Ontarians can afford. With such
a goal, we face three overarching tasks. First, we must understand Ontario’s economic
challenges and address them directly. Second, we must firmly establish a balanced fiscal
position that can be sustained over the long term. And third, we must sharpen the efficiency
of literally everything the government does so Ontarians get the greatest value for money from
the taxes they pay. This report addresses these issues and offers a road map to a day when
Ontarians can count on public services that are both excellent and affordable — the public
services Ontarians want and deserve.
Ontario faces more severe economic and fiscal challenges than most Ontarians realize.
We are in the midst of a period of deep and widespread uncertainty over the course of the
world economy and its financial system — a period unprecedented in the lifetimes of almost
all of us. But even after the world once more finds its footing, Ontarians can no longer simply
assume the strong economic growth and prosperity to which they have become accustomed
and on which the province has built its public services. Government programs can be
sustained in the long term only if the government enjoys the steady and dependable revenue
growth needed to finance them. An expanding economy is the foundation for rising revenues.
If the economy fails to grow quickly enough, Ontario’s revenues will fall short of the sums
needed to support government programs.
Improving Ontario’s economic prospects relative both to the past and to Canada’s resource-
rich provinces should always be a priority for policy-makers. But they should act immediately
to address the province’s fiscal position, which is entirely within their control. Endless deficits,
which would undermine the province’s economic and social future, are not inevitable. The goal
of eliminating the deficit can be met in large part through reforms to the delivery of public
services that are desirable in their own right, not just because they are less costly. Affordability
and excellence are not incompatible; they can be reconciled by greater efficiency, which
serves both the fiscal imperative and Ontarians’ desire for better-run programs. Balancing the
budget, however, will also require tough decisions that will entail reduced benefits for some.
Given that many of these programs are not sustainable in their current form, the government
will need to decide how best to target benefits to those who need them most. The treatment
may be difficult, but it is worth the effort.

70
The Outlook: Three Scenarios
The public is familiar with the fiscal scenario laid out in the 2011 Ontario Budget. It was
debated in the legislature at the time, formed the basis for the government’s Pre-Election
Report on Ontario’s Finances and for the Auditor General’s review of that report. The “Budget
Scenario,” updated to use the final numbers for the 2010–11 fiscal year, was the starting point
for the work of the Commission on the Reform of Ontario’s Public Services. We began by
constructing what we called our “Status Quo Scenario,” based on different assumptions than
those used for the 2011 Budget. We were more cautious in our projections of both economic
growth and revenue, largely because the economic outlook has deteriorated since March
2011; we assumed that spending on programs would be driven by the factors that usually
push spending higher, such as inflation, population growth, aging, school enrolments and so
on. Finally, we developed what we regard as the “Preferred Scenario,” a projection that
combines our more cautious view of economic and revenue growth — along the lines of the
Status Quo Scenario — with the spending target that would fulfil our mandate to eliminate the
deficit by 2017–18.
A fiscal scenario is just that — a projection of the future based on specific assumptions about
how quickly the economy, revenues and spending will grow and about the levels of interest
rates that help determine how much the government will spend in interest costs on the public
debt. A scenario is not a prediction (as in, this is what will happen); it is a projection (as in, this
is what will happen if all our assumptions hold true). As it unfolds, the future always turns out
differently than even the most carefully considered assumptions, so, in that sense, all three
scenarios will turn out to be wrong. Nevertheless, scenario-building is the foundation of good
fiscal planning. Without a view of the future, governments cannot assess what resources they
will have available and cannot set priorities among competing programs.
In short, governments need a fiscal strategy. There is a wide range of possible outcomes
for both the economy and the budget — a range that widens the further out we look.
The government is confronted with a large debt and, in good part due to the aftershocks of a
global recession that sideswiped the Ontario economy, a large deficit and the prospect of a
long path back to a balanced budget. It needs to lay out a clear plan to eliminate the deficit
by 2017–18 — its own target — with bold actions taken early and advanced steadily. Basing
such initiatives on cautious assumptions will help to avoid the frustration of returning again and
again for further rounds of restraint when events prove that the initial steps were too meek.
Several European countries are today learning that lesson.

Chapter 1: The Need for Strong Fiscal Action
71
The Budget Scenario
Ontario’s revenues now do not cover its spending. In 2010–11, the latest full fiscal year, the
government ran a deficit of $14.0 billion — equivalent to $1,059 for every Ontarian and
2.3 per cent of the province’s gross domestic product (GDP), the largest deficit relative to GDP
of any province. This is not because spending is particularly high; relative to GDP, Ontario’s
spending is one of the lowest among the provinces. Net debt amounted to $214.5 billion,
which is $16,216 per capita and 35.0 per cent of GDP. Relative to the government’s budget a
year earlier, which had projected a deficit of $19.7 billion, the outcome was much better
than expected.
The most recent Budget, in March 2011, set out a recovery plan that would return the
province’s finances to balance — with the sum of total spending and the $1 billion contingency
reserve equal to revenue — by the 2017–18 fiscal year. The choice of 2017–18 as the target
year for a balanced budget put Ontario on a schedule at least three years behind that of any
other province. It was three years behind the original federal target of 2014–15 for a return to
a balanced budget, but is now two years behind after the revised target set out in the federal
government’s fall fiscal update. To achieve its goal, the government presented a scenario
of revenue projections and spending estimates that would meet its target date for balance.
This path towards a balanced budget was reiterated (though only as far as 2013–14) in
Finance Minister Dwight Duncan’s Pre-Election Report on Ontario’s Finances, in which the
minister also expressed the hope that this Commission “would help accelerate the plan to
eliminate the deficit while still protecting the gains made in health care and education.”
Since our job as a Commission is to make recommendations to meet — or even better —
this target, we must assess the Budget Scenario and then develop, first, our own view of how
we believe the seven years from 2010–11 to 2017–18 will unfold in the absence of any change
in government policies, programs or practices. This, in other words, is our Status Quo outlook.
If it fails to meet the target, we must devise a Preferred Scenario for the budget that does.

72
There are three key forecasts in any budget outlook — revenue, spending on government
programs and spending to cover interest on the public debt. In the 2011 Budget, the
government based its revenue projection to 2017–18 on forecasts of, and assumptions about,1
Ontario’s economic growth because revenues largely depend on the growth of nominal GDP.
The Budget drew on an average of private-sector forecasters but, as a cautionary step,
adjusted the average for GDP growth down slightly, which had the effect of increasing the size
of the deficit. This is standard practice, and we do not fault the government for following this
procedure. However, we believe the average private-sector forecast was not sufficiently
cautious in light of the large uncertainties that even then hung over the global economy and
thus the Ontario economy as well, a point to which we will return. Having produced this
revenue outlook, the Budget then set out a similarly based projection for public debt interest
costs over the seven years. In 2017–18, total revenue would amount to $142.2 billion and the
cost of interest payments would be $16.3 billion. What remained was a gap of $125.9 billion,
from which the government set aside $1 billion as a contingency reserve, leaving $124.9 billion
to spend on all programs.
This projection for program spending was simply the residual that would bring the Budget
to balance in 2017–18. It was not a spending forecast that depicted how spending would grow
if current programs were maintained and continued to expand as usual; such a projection
would involve higher levels of spending on programs. Implicit in this projection, then, were
money-saving plans that had not yet been developed, let alone announced in the Budget.
However, the 2011 Budget did not present a status quo scenario to identify the differences
between its target track for program spending and the status quo spending outlook, so one
could not get from the Budget a sense of the magnitude of the future cost savings needed to
meet the target.
The government’s Pre-Election Report was required to present only the medium-term outlook
to 2013–14, and did not address the extended outlook to 2017–18. However, the province’s
Auditor General, Jim McCarter, in his review of the Pre-Election Report, cast doubt even on
the government’s expense projections out to 2013–14, which were identical to those in the
2011 Budget.
1 Growth was forecast to 2013–14; out to 2017–18, the government used long-run average growth rates during periods of growth.

Chapter 1: The Need for Strong Fiscal Action
73
The Auditor General, as stipulated by the Fiscal Transparency and Accountability Act,
subjected the Budget forecast to the act’s stated principle that the government base its fiscal
policy on “cautious and prudent assumptions.” He concluded that while the government’s
estimates of revenues and interest on the public debt met that test, “many of the assumptions
underlying its estimates for program expenses (that is, expenses excluding interest on the
public debt and reserves) were optimistic and aggressive rather than cautious.”
Spending has been skewed in recent years by the government’s one-time support for the auto
sector and record infrastructure stimulus expenditures after the global financial crisis that
began in 2007. But after excluding those large one-time outlays from his comparisons, the
Auditor General concluded that the government’s forecast assumed that there would be a very
sharp drop in the growth rate of spending on programs — from an average of 6.9 per cent in
the past eight years to 1.8 per cent in the three years from 2010–11 to 2013–14. He singled
out the cost of compensation (salaries, wages and benefits comprise half of all program
spending) and health care costs (which amounted to 40 per cent of spending in 2010–11,
with considerable overlap with the compensation costs) as areas where spending pressures
are the major contributors to what he called “a heightened risk that actual expenses will be
higher than estimated.”
In effect, he found — not surprisingly — that the Budget featured a spending track lower than
the one that would unfold under current program designs and savings plans. The Auditor
General surmised — and we have confirmed — that there were no fully developed plans
at the time of the Budget to secure all of the depicted restraint. If there are now plans under
development within government to secure all of the fiscal restraint, they have not been
provided to the Commission. When the Auditor General’s report was released, the minister
acknowledged that his plan was aggressive, but maintained that the government was
committed to balancing the budget by 2017–18. “There are enormously difficult choices
ahead,” Minister Duncan said. “This will give Ontarians greater insight and clarity as to the
challenges coming at us.” Implicitly, then, the minister was promising to develop and
implement over time the details of what would be an aggressive restraint plan. Indeed,
the government acknowledged in its Pre-Election Report that “certain assumptions are
based on anticipated actions, strategies and programs of the government that are consistent
with the fiscal plan.” This, of course, is the main reason why the government created
this Commission — to provide advice on what a restraint plan might look like.

74
The Status Quo Scenario
Our mandate requires us to look even further ahead than the Auditor General — to 2017–18.
We found both the Budget and the Auditor General’s report a difficult basis from which to
begin our thinking. In particular, we could neither estimate nor fully comprehend the degree
to which further restraint would be necessary because neither document offers a status
quo outlook.
When we began this work in July 2011, we first created our own Status Quo Scenario that we
believe offers a clearer perspective — certainly one based on updated and more cautious
assumptions — of the seven fiscal years from 2010–11 through 2017–18, in the absence of
new aggressive government action.
We took the same approach as the government in assessing future revenues and public debt
costs, but came up with very different revenue numbers because we expected economic
growth to be slower than the government did in the Budget and slower than private-sector
economists were projecting at that time. We were not simply engaging here in an excess of
prudence. In the short term, the outlook for the world, Canadian and Ontario economies had
already dimmed substantially in the months after the Budget was presented. And beyond
2013, the immediate purview of most forecasters, we believe Ontario’s long-term economic
growth potential will shrink as the labour force grows more slowly and productivity growth
remains moderate.
We took a very different approach from that of the Budget on spending. We built our Status
Quo spending line by projecting program expenditures in accordance with two key factors
that affect the cost of government programs. First, we used the pressures that drive spending
on programs as they are currently designed and delivered. Second, we allowed for current
cost-saving measures that are already in place and likely to produce results in the years
ahead. If a particular restraint measure has been proposed, but not yet fully developed and
implemented, we did not count it.
The results of this exercise can be summarized easily. In our Status Quo Scenario, revenue
growth will be lower and spending growth higher than assumed in the 2011 Budget. Our more
cautious set of assumptions leads not to a balanced budget in 2017–18, but to a deficit in the
order of $30.2 billion, more than double the 2010–11 deficit, and a net public debt of
$411.4 billion, equivalent to just under 51 per cent of the province’s GDP, compared with
35 per cent today.

Chapter 1: The Need for Strong Fiscal Action
75
Briefly, the numbers look like this. The 2011 Budget projected revenues of $142.2 billion for
2017–18. In our Status Quo Scenario, they will be closer to $132.7 billion, or $9.4 billion less,2
in part because we believe economic growth will be slower than the government implied.
The Budget also projected about $124.9 billion in spending on programs (plus a $1.0 billion
contingency reserve) for that year and interest payments of $16.3 billion, for a total of
$142.2 billion in spending (also including the reserve) — a sum equal to revenues; this would
mean the Budget would be in balance in 2017–18. We believe instead that if programs retain
their current designs and if restraint measures now in the works are fully implemented, the
status quo trajectory implies $141.4 billion in program spending in 2017–18, plus a larger
contingency reserve of $1.9 billion that we deem prudent. In addition, the growing debt would
require interest payments of $19.7 billion. Total outlays would be $163.0 billion — $30.2 billion
more than our projected revenues.
This Status Quo Scenario is, we believe, the manner in which the future will likely unfold if
corrective action is not taken. It will shock many because it means that if Ontario is to attain
its target of a balanced budget by 2017–18, the provincial government must take much
tougher fiscal measures over a protracted period than anyone has yet discussed publicly.
Postponing needed infrastructure projects until after that date, a technique governments often
use to balance their books in the short term, is no solution; the province would simply slip back
into deficit later on as it tried to correct an infrastructure deficit. Indeed, any such short-term
measures would simply make more likely a resumption of deficit budgets after 2017–18,
rather than put the province on a path to balanced budgets over the long haul. To pull total
spending down onto a track that will match our more modest assessment of future revenue
growth means that we must find total savings of $30.2 billion per year by 2017–18. Just as
importantly, the government must be able to sustain these savings beyond that year.
2 This does not add due to rounding.

76
The Preferred Scenario
We developed our Status Quo Scenario because we wanted to identify clearly the extent of
any new spending restraint that will be needed to balance the budget by 2017–18; that is,
the difference between the Status Quo spending outlook and the spending needed to eliminate
the deficit by that date. The task then became one of creating a Preferred Scenario — one that
will lead to a balanced budget in 2017–18. The government actually asked us to advise on
how to attain balance before that year. However, we prefer to adopt a strategy of sticking to
the official target and recommending ways to solidify the province’s chances of hitting it.
One element of this strategy is the use of a contingency reserve much larger than that used
in the Budget. Another element is our use of more cautious economic assumptions, exercising
a degree of prudence that we believe is justified by the current economic outlook. We will also
recommend other strategies for mitigating the risk of potential liabilities that are not explicitly
recognized in the Budget or our own fiscal track. This approach leaves room to reach balance
earlier if the future turns out more favourable than we have assumed.
Our bottom line will end up in the same place as the 2011 Budget; that is, with no deficit in the
final year. But in light of our revenue trajectory being lower than that of the Budget, our track
for program spending will have to be 0.8 per cent growth per year to 2017–18, substantially
lower than the 1.4 per cent annual growth set out in the Budget to reach the goal of a
balanced budget.
This is a very tall order, but we are optimistic it can be done. Throughout this report,
we prescribe a realistic and feasible (albeit tough) way out of the fiscal predicament we have
described. We offer 362 recommendations, sector by sector, that will allow the government
to constrain spending enough to balance the budget without tax increases. Many of our
recommendations are based on using public resources more efficiently; in many cases, better-
quality services will also be an outcome. This will not make some of the recommended reforms
painless for all involved, at least not in the short term, but, over the long haul, we believe they
will give Ontarians much better value for the taxes they pay to support public services.

Chapter 1: The Need for Strong Fiscal Action
77
Since our mandate expressly forbids us from proposing new or increased taxes, most of the
burden of eliminating the $30.2 billion shortfall revealed by the Status Quo Scenario must fall
on spending. As we veer from the Status Quo outlook (with its persistent deficits) by aiming
for a balanced budget in 2017–18, we would run ever-declining deficits along the way, which
would reduce interest costs on the debt below those seen in the Status Quo outlook. This
would save about $4.3 billion3 in 2017–18, but the province would still need to spend about
$23.9 billion less on programs than the $141.4 billion that we see as the current Status Quo
projection — a difference of 17 per cent. That implies, to put it mildly, a wrenching reduction
from the path that spending is now on. It is, however, necessary if Ontario is to escape its
recent history of rising public debt that forces the government to spend more than it should on
interest payments — money that could otherwise be used to finance programs.
These are bold assertions, very clearly at odds with the recent public debate over Ontario’s
fiscal outlook. During the recent election, all political parties pledged to balance the budget by
2017–18, but none presented a credible plan to accomplish this outcome. Our assertions
therefore demand explanation and substantiation. We will spell out the details of the Preferred
Scenario later in this chapter. Here, we will simply note that we lay out a plan designed to
secure a budget balance in 2017–18 through spending restraint. And to foreshadow the rest of
the report, we make recommendations throughout for reforming programs and service delivery
to achieve the overall degree of spending restraint required. But before describing the
Preferred Scenario in detail, we will briefly review Ontario’s fiscal record (Do we really have
a debt problem?) and then set out the recent performance of the Ontario economy and its
prospects for the future. This economic outlook is critical because it establishes the context
in which budget policy must be set over the next several years.
3 This does not add due to rounding.

78
Debt and Deficits
Over the past two decades, Ontario’s fiscal record has been one of large deficits that have
been only partially offset by sporadic episodes of small surpluses. Before that, from 1986–87
through 1989–90, the government’s debt averaged 14.1 per cent of GDP, a modest burden
that was easily carried by a province as wealthy as Ontario. The recession of the early 1990s
resulted in large deficits that were reduced only slowly as the decade wore on through
spending restraint in all areas; by 1998–99, the debt-to-GDP ratio had doubled to 30 per cent.
Small surpluses in seven of the next nine years allowed the debt ratio to ease to just under
27 per cent in 2007–08 before the substantial deficits associated with the most recent
recession — and the stimulus programs of infrastructure spending deployed to alleviate it —
rapidly pushed the debt higher yet again, this time to 35 per cent of GDP in 2010–11.
The record is one in which recessions quickly create and magnify a deficit, thus pushing
the debt higher in a hurry, but good economic times produce only small improvements in
the province’s debt.
Carrying debt requires spending in the form of interest payments on the province’s outstanding
bonds and other obligations. Interest rates have been low in recent years across most of the
globe and, with a sound record in debt management, Ontario has been able to borrow
cheaply. The province’s interest payments have been treading at around their lowest levels in
the past 20 years, both in relation to GDP and to the province’s total spending. In 2010–11,
interest amounted to 7.9 per cent of total spending (well below the 20-year average of
11.3 per cent) and 1.5 per cent of GDP (compared with the 20-year average of 2.0 per cent).
The danger here is obvious. As interest rates rise to more normal levels, so will the cost of
servicing the growing debt, diverting dollars away from public programs.

Chapter 1: The Need for Strong Fiscal Action
79
Until recently, Ontario’s debt record over the past quarter century was similar to that of other
Canadian provinces. In the late 1980s, Ontario’s 14.1 per cent debt ratio was slightly below
the average for all provinces. In the 1990s, the average debt of all provinces climbed to about
30 per cent of GDP, just like Ontario. The past decade has broken the historical pattern.
A boom in commodities — notably oil — allowed provinces like Alberta, Saskatchewan,
British Columbia, and Newfoundland and Labrador to run surpluses and reduce their debt.
Alberta, the richest Canadian province, now has net assets, rather than debt, which renders
the all-province average less meaningful. But while Ontario and Manitoba carried similar debt
loads between 2000 and 2005, Manitoba’s debt has since fallen to about 25 per cent of GDP
while Ontario’s has risen. Ontario’s 2010–11 debt ratio of 35 per cent is roughly the same as
that of Nova Scotia, New Brunswick and Prince Edward Island. Quebec is the outlier among
the provinces, with a net debt in 2010–11 of about 50 per cent of GDP. Another contributing
factor to Ontario’s rising debt is the historic capital investments in infrastructure in recent
years. When the financial requirements for these projects are included, Ontario’s borrowing
has increased in every year since the early 1990s, with only one exception.
By current international standards, Ontario’s debt is relatively small. We are a very long way
from the dreadful fiscal condition of countries that have dominated the news over the past two
years. So, however, were many of the headline countries at one time and, in some cases,
surprisingly recently. Spain’s net debt doubled to 56 per cent of GDP between 2007 and 2011,
while Portugal’s debt has almost doubled to 102 per cent only since 2003. Among the headline
nations whose net debt was once similar to Ontario’s current 35 per cent of GDP are Britain
(2004), the United States (2001), Japan (1997) and France (1993). Even Greece, the poster
child for rampant debt, carried an Ontario-style debt load as recently as 1984. Today, debt
burdens have reached 73 per cent in Britain and the United States, 131 per cent in Japan,
81 per cent in France and 153 per cent in Greece.
There are, of course, huge differences between Ontario and each of those jurisdictions,
so we cannot push comparisons too far. Ontario is one of the world’s largest non-sovereign
borrowers and widely regarded as one of the most sophisticated. Ontario bonds are attractive
to investors because they are highly rated, carry good returns and are very liquid, meaning
they are easy to trade, which is always a plus for people who buy bonds. Ontario is viewed as
a well-governed province in a well-governed country. We do not mean to be alarmist in noting
the province’s debt picture, only to point out that government debt burdens can rise quickly if
they are not headed off early with appropriate action.

80
Should the global economy turn nasty once again, any deterioration in investor confidence
could be remarkably swift. In a world already awash with government debt, Ontarians should
not assume that investors will always stand ready to buy the provincial bonds needed to
finance new debt without asking for higher interest rates to compensate them for the
accompanying risks.
This very question was thrown into sharp relief on Dec. 15, 2011, when Moody’s Investors
Service revised its outlook on Ontario’s bonds from stable to negative. The revision affected
some $190 billion in bonds that are rated Aa1, the agency’s second-highest rating.
Moody’s said in its statement that the change in its outlook “reflects Moody’s assessment
of risks surrounding the province’s ability to meet its medium term fiscal targets given the
recent slowdown in provincial economic growth and the resulting risks to the province’s
ability to stabilize the recent accumulation of debt.” Moody’s lead analyst for Ontario, assistant
vice-president Jennifer Wong, said, “The negative outlook on the province reflects the
softening economic outlook, Ontario’s growing debt burden, and the extended timeframe of
achieving a balance budget.”
Ontario borrows money every year to finance needed long-term capital projects, a common
practice with all governments. But annual deficits, which represent current spending that
exceeds revenue, also add to the stock of debt. On that score, Ontario’s recent record is poor.
Relative to GDP, it ran the biggest deficits in the country in the three fiscal years from
2008–09 through 2010–11. In the current fiscal year, which ends Mar. 31, 2012, Ontario’s
deficit is again likely to be the largest in Canada.
This will strike many as a profoundly gloomy message. It is one that Ontarians have not heard,
certainly not in the recent election campaign, but it is one this Commission believes it must
deliver. If Ontarians and their government are going to come to grips with the fiscal challenges
that lie ahead, they must understand the depth of the problem and its causes. Ontario must act
soon to put its finances on a sustainable path and be prepared for tough action — not just for a
few years but over an extended period, at least as far out as 2018.
We believe all Ontarians, and especially those in the broader public sector (BPS) who will be
most affected by the government’s fiscal decisions, have the wit and creativity to make — and
implement — the kind of thoughtful decisions needed to resolve the province’s fiscal dilemma
while protecting to the greatest degree possible the public programs on which Ontarians rely,
many of which are a source of justifiable pride.

Chapter 1: The Need for Strong Fiscal Action
81
We further believe that the province can do so in a manner that makes fiscal balance over the
business cycle a permanent feature of Ontario’s finances. The rewards of such action will be
considerable and tangible. High-debt governments are always vulnerable to the whims and
demands of the financial markets from which they have borrowed; governments in this position
can be forced to take draconian measures to keep their lenders happy. Low-debt governments
have much more flexibility to set their own priorities — ones that meet the needs of their
citizens and the good of their jurisdiction as a whole.
The Economy: How Did We Get Here?
The roots of Ontario’s current fix lie in both the economy and in the province’s record of failing
to keep growth in government spending in line with revenue growth. Ontarians have long been
accustomed to their economy growing faster than the rest of the country. This was once true:
in 15 of the 21 years from 1982 to 2002, Ontario grew faster than the national economy.
But changing economic conditions have hit Ontario harder than other provinces over the past
decade; in all nine years from 2003 to 2011, Ontario’s real economic growth was below that of
the rest of the country.
The reasons are simple. Beginning in 2003, the Canadian dollar began a strong ascent that
lifted it from the persistent lows of the previous decade (around 70 US cents) to the recent
highs (around parity with the U.S. dollar) during the past four years, with only a brief dip in late
2008 and early 2009. This surge in the currency made Ontario’s exports more expensive for
foreigners to buy and rendered the province’s exporters less competitive, while also making
imports cheaper.
The impact on Ontario’s nominal GDP was huge. The contribution of trade to the economy is
measured by net exports, the difference between what the province sells outside its
boundaries and what it buys from other countries and provinces. Ontario’s net exports to other
provinces, where there was no currency effect, remained relatively stable. But the contribution
to GDP of net exports to other countries first vanished entirely and then began to detract from
Ontario’s growth. The financial crisis and resulting U.S. recession, during which auto sales fell
by about one-third, aggravated this trend. The province’s international trade surplus, which
accounted for 4.3 per cent of GDP in the 1998–2002 period, disappeared by the middle of
2006 and was replaced by a trade deficit, which in the first three quarters of 2011 diminished
nominal GDP by 7.5 per cent.

82
Note: 2011 figures reflect data available for the first three quarters.Source: Bank of Canada, Provincial Economic Accounts.
CHART 1.1 Ontario’s Foreign Trade Balance and the Dollar
(8)
(6)
(4)
(2)
0
2
4
6
1997 1998 1999 2000 2001 2002 2003 2004 2005 2006 2007 2008 2009 2010 2011
40
50
60
70
80
90
100
110
Canadian $ in US cents (Right scale)
Ontario’s international trade balance as per cent of GDP (Left scale)
US CentsPer Cent of GDP
Ontario’s overall GDP per head relative to the rest of the country reflects the turnaround in
trade. In 1998–2002, Ontario’s GDP per person was 14.1 per cent higher than the average
for the other nine provinces and three territories; in the first three quarters of 2011, it was
6.5 per cent lower. Since 2006, Ontario’s GDP per person has been below the average for
the rest of Canada.
Another way to look at the data is to track the growth of total GDP in current dollars,
because that is the province’s tax base. Since 2002, the year before the dollar began its
ascent, nominal GDP has grown by less than 33 per cent in Ontario, compared with almost
59 per cent in the rest of the country.

Chapter 1: The Need for Strong Fiscal Action
83
0
20
40
60
80
2002 2003 2004 2005 2006 2007 2008 2009 2010 2011
Rest of Canada
Ontario
CHART 1.2 Slow Growth in the Tax Base: Per Cent Change in Nominal GDP since 2000
Note: 2011 figures reflect data available for the first three quarters.Source: National Accounts, Ontario Economic Accounts.
Per Cent
The recent recession was tougher on Ontario than on the rest of Canada. The province’s
growth faltered in 2007, slowing while the rest of the country continued a brisk expansion.
In 2008, Ontario’s real GDP fell during the winter (the first quarter) and, aside from a small
uptick that spring, continued to shrink until growth resumed in the summer of 2009 (the third
quarter) — five quarters of contraction over a period of six quarters. Elsewhere in Canada,
the recession did not begin until the final quarter of 2008 and then lasted only three quarters
in total. From peak to trough, Ontario lost 5.0 per cent of its GDP; the rest of the country lost
only 3.7 per cent. Since the low point in the second quarter of 2009, the Canadian economy
as a whole has recorded respectable real growth. But in the two years through the third
quarter of 2011, Ontario lagged the rest of the country, with 5.8 per cent growth compared
with 7.4 per cent elsewhere.

84
The human cost of this lacklustre performance shows up in the employment picture, where the
old verities of a labour market in which Ontario always outshone the rest of Canada have been
replaced by new patterns:
Ontario’s unemployment rate, once reliably lower than the national average, has been
above the national rate for over five years now and was generally higher than the jobless
rate in Quebec from the beginning of 2009 through the third quarter of 2011. In 2009 and
2010, the Ontario unemployment rate was 0.7 percentage point higher than the national
rate; the gap narrowed in 2011, when the Ontario rate was 7.8 per cent, while the
Canadian rate was 7.5 per cent.
The employment rate, perhaps the best measure of the health of the labour market, could
once be counted on to be at least three percentage points higher than the national
average. But since 2008, it has been lower than the national rate. In 2011, 61.6 per cent of
working-age Ontarians had a job, compared with 61.8 per cent nationally. The Ontario rate
is down 2.1 percentage points from the most recent peak in 2003 and 2004. Such a
difference translates into about 229,000 jobs.
The decline of factory employment — traditionally a source of well-paid jobs — as a share
of total employment accelerated in the past decade. Such jobs have been growing
steadily less important in all developed countries, a consequence of strong productivity
gains relative to other sectors of the economy and of outsourcing manufacturing activity
to lower-wage Asian countries. In 1976, manufacturing accounted for 23.2 per cent of all
Ontario jobs; this fell to 18.2 per cent in 2002 after recovering from an even lower reading
during the recession of the early 1990s. Through the rest of the latest decade, as the
dollar climbed and the auto industry faded, manufacturing’s share of employment has
slid rapidly — to 11.8 per cent in 2010 and 2011.

Chapter 1: The Need for Strong Fiscal Action
85
Not surprisingly, incomes have also been affected. In the 1980s, real personal income per
capita — that is, average personal income per person adjusted for increases in the implicit
price index for all consumer spending — grew by an average of 1.9 per cent annually in
Ontario, compared with 1.4 per cent in the rest of the country and 1.6 per cent nationally.
Those were the days when Ontario was substantially richer than other parts of Canada. In the
second half of the 1980s, when the Ontario economy was booming and other provinces were
struggling with low prices for oil and other resources, Ontario’s average personal income was
more than 20 per cent higher than the average in the rest of Canada. This changed
dramatically after 1990. In both the 1990s and in the period from 2000 to 2010, Ontario’s real
personal income per capita grew at only about half the rate that it did in the rest of Canada.
In the period from 1990 to 2000, the average annual growth rates were 0.4 per cent and
0.8 per cent respectively; between 2000 and 2011,4 they were 1.0 per cent and 2.0 per cent.
By the third quarter of 2011, this extended period of slow growth relative to other regions had
left the average Ontario income, in current dollars, 0.5 per cent lower than incomes in the rest
of Canada.
4 Based on the first three quarters of 2011.

86
The Economy: What Lies Ahead?
Can we expect better in the future? Barring another major global financial or economic crisis,
a caveat that on some days feels shaky, Ontario and Canada will continue to recover from the
recession and embark on a new expansion. But for Ontario, future growth will almost certainly
be slower than it has been in the past. This has not been a normal business cycle for the world
economy, one in which recession is usually followed by a rapid return to full capacity and
further growth beyond that. It has been one set in motion by a financial crisis. As Bank of
Canada Governor Mark Carney noted recently, “… history teaches that recessions involving
financial crises tend to be more severe and have recoveries that take twice as long.”
Ontario also faces further structural changes. Manufacturing, once the vibrant heart of the
Ontario economy, has for years been dwindling as a share of the province’s output and
employment base. This is true in most of the developed world as factory work continues to
migrate to low-cost Asia. In addition, the higher dollar continues to make it harder for Ontario
to compete in world markets, especially in the United States, the province’s main external
market. The U.S. is choking on public and private debt and faces years of slow growth as
governments and individuals work off their excess borrowing. At the same time, U.S. auto
sales, though up from their low point, will take many years to fully recover from a precipitous
decline between 2007 and 2009. Ontario’s auto industry has also bounced back from its even
steeper drop in production during those years, but it remains much diminished, perhaps
permanently. Ontario industry, which has benefited for decades from plentiful electricity at
subsidized rates, faces much higher power prices, made necessary by the imperative to
replace essential infrastructure after years of neglect.
There is another barrier to income growth: almost all the growth in Ontario’s working-age
population and labour force will come from immigration, but the incomes of recent immigrants
have been well below those of workers who were born in Canada or arrived earlier. The
average wage of recent immigrants (those who have been here for five years or less) was only
about 76 per cent that of Canadian-born workers in 2010, while immigrants who have been
here for 5 to 10 years had an average wage that was 85 per cent that of Canadian-born
workers. Those with over 10 years in Canada had wages comparable to Canadian-born
workers. Since more than two-thirds of future jobs will require some form of post-secondary
education, it is particularly distressing that immigrants with university degrees are having such
a difficult time integrating into the workforce. In 2005, recent immigrants with a university
degree had median earnings of only $24,636, less than half the $51,656 earned by those with
degrees who were born in Canada. The $27,020 gap was wider than it had been in 1995.5
5 Don Drummond and Francis Fong, “The Changing Canadian Workplace,” Mar. 8, 2010, TD Economics, downloaded from
http: //www.td.com/document/PDF/economics/special/td-economics-special-ff0310-canlab.pdf.

Chapter 1: The Need for Strong Fiscal Action
87
In short, we cannot count on robust economic growth alone to resolve our difficult
fiscal challenges.
Ontario’s three per cent increase in real GDP in 2010 reflected its recovery from the recession.
At the time of the 2011 Budget, private-sector forecasters were predicting an average of only
2.7 per cent real annual growth in the four years from 2011 to 2014; the government scaled
this back to 2.6 per cent for planning purposes. By November, the private-sector forecast
average for this period had fallen to 2.3 per cent and the government, in its 2011 Ontario
Economic Outlook and Fiscal Review, reduced this to 2.2 per cent for planning purposes.
Few forecasters have looked out to 2018, the period covered in the Commission’s mandate.
We accept the government’s planning assumptions for economic growth out to 2014 from
the 2011 Ontario Economic Outlook and Fiscal Review, but beyond that, we take a cautious
approach — one dictated by our view of Ontario’s economic capacity and its ability to grow.
No matter how much demand exists for Ontario’s goods and services, there is a limit to the
level and growth rate of its potential output, both to what the province can produce and how
fast its economy can grow without causing rising inflation. If an economy is already running at
full capacity (or potential), there are limits to the speed at which it can continue to expand in
the long term. A recession reduces actual output below potential, and, during the recovery
period, the economy can exceed the speed limit and grow rapidly until its actual output returns
to full capacity. After that, the growth rate must fall back to the slower pace that keeps inflation
in check.
There is no firm measure of Ontario’s potential long-term real growth rate, but most estimates
centre around two per cent annually, recognizing that the actual figure could be half a
percentage point larger or smaller. Such variations can quickly accumulate to large
differences. An economy growing at 1.5 per cent annually expands by 6.1 per cent over
four years; at 2.5 per cent annual growth, the four-year expansion is 10.4 per cent.

88
As for the level issue, Ontario’s actual output is now below its potential, a consequence of the
global recession, but there is little agreement on the size of the output gap. If there is plenty of
slack in both the capital and labour markets, the economy can grow faster than potential for
several years before creating inflationary pressures. The Bank of Canada estimates that the
output gap for the country is about one per cent and, though it does not provide provincial
estimates, the Ontario gap is unlikely to be much larger than that. Others see a bigger gap
nationally and thus believe that the economy will grow briskly in the short term as it closes the
gap. We lean towards the Bank of Canada view. If there were plenty of slack, we would more
likely see a drop in wages and a falling inflation rate. Neither of those things has happened;
inflation has remained quite firm.
A brutal characteristic of recessions is that they not only reduce actual output below potential,
but they also destroy some of the potential of both capital and labour to produce. Unused
machinery and equipment are rendered less productive or are superseded by more state-of-
the-art machinery and equipment that competitors have put into use. Unemployed workers see
their skills atrophy as they are unable to keep on top of the latest trends in their fields; some
retire, while others lose confidence in their abilities. Even if unemployed workers from the
diminished manufacturing sector can find other work, they are unlikely to be working at their
previous levels of productivity; there are few alternative sources of employment that will pay a
skilled auto worker $70 per hour including benefits. Tragically, we believe the recession has
destroyed some of Ontario’s capacity in both its capital and labour markets. Ontario’s ability to
supply goods and services has been diminished by the recession.
Supply is, of course, only half the picture; the other half is demand. Rapid growth in world
demand helped Ontario (and Canada) to shuck off the recession of the 1990s. These days,
prospects for a quick return to full potential have been dimmed by the worsening position of
both the United States and Europe, where the economic outlook has taken a grim turn in the
months since the Budget. Both markets appear likely to grow more slowly than predicted at the
time of the Budget. Unfortunately, the demand and supply sides of the economy are
intertwined. The longer it takes for demand to absorb unused capacity, the more that
productive capacity withers and the less of it will be productively available.

Chapter 1: The Need for Strong Fiscal Action
89
The private-sector forecasters who, at the time of the Budget in March 2011, were predicting
growth of 2.6 per cent in 2011 and 2.8 per cent in 2012 had, by the time of the Ontario
Economic Outlook and Fiscal Review in November 2011, taken account of the gloomier
picture abroad and reduced their predictions to 2.0 per cent for 2011 and 1.9 per cent for
2012. They project somewhat stronger growth of 2.6 per cent in 2013 and 2.7 per cent in 2014
as the economy returns to full potential by the end of 2015. Once that occurs, the most
prudent assumption about Ontario’s economic growth to 2018 is the province’s long-term
potential rate of growth. That is the one we have adopted — that real GDP will expand by
about 2.0 per cent per year from 2016 through 2018.
There are two components to potential growth — the labour force and productivity. The labour
force is the number of people working or looking for work; productivity is the output produced
by every employee. In effect, potential growth is a function of people and the goods and
services they can produce. A rapidly growing workforce with steadily rising productivity will
generate rising prosperity.
Like the rest of Canada, Ontario faces a slowdown in the growth of the labour force.
The long-anticipated retirement of baby boomers from the workforce has begun. Over the
past two decades, the labour force has grown by an average of 1.3 per cent per year. By the
second half of this decade, it is reasonable to expect growth of only 0.8 per cent annually.
At the same time, productivity is likely to expand by about 1.2 per cent per year. Even this
figure may be slightly optimistic since productivity growth has been substantially lower
than that over the past decade. Between 2001 and 2010, productivity grew by a meagre
0.2 per cent per year on average; in 2008 and 2009, productivity actually fell. However, this
should improve as a result of recent increases in public and private capital — in part because
companies have used the increased purchasing power of the higher Canadian dollar to buy
more imported machinery and equipment, which usually enhances productivity — along with
policy moves such as lower corporate taxes and the introduction of the harmonized sales tax
(HST).
Any assumption about productivity growth is imprecise at best, but we have chosen
1.2 per cent, a figure that is slightly lower than what appears to be implicitly embedded
in the private-sector consensus forecast. This is the source of our 2.0 per cent assumption for
annual potential real growth — 0.8 per cent more workers, with each producing 1.2 per cent
more each year on average.

90
Important as real GDP growth is for fiscal planning, the growth of nominal GDP, which
includes the impact of inflation, is even more critical. To our real growth of 2.0 per cent per
year, we can add another 1.9 per cent worth of rising prices to produce a projection of
3.9 per cent annual growth in nominal GDP. We arrive at the inflation estimate by assuming
that the Bank of Canada will continue to meet its target of keeping consumer price inflation at
2.0 per cent. Historically, that suggests that inflation across the whole economy, not just at the
consumer level, will be only 1.9 per cent annually.
Nominal GDP is crucial because it constitutes the provincial government’s tax base —
the economic activity on which it levies its taxes on income, sales and corporate profits.
Fully 80 per cent of the Ontario government’s revenue comes from its own sources.
Transfers from the federal government account for the remaining 20 per cent. Only Alberta
and British Columbia rely less than Ontario on federal transfers. Although the 2011 Budget did
not make a forecast of nominal GDP growth for the 2015–18 period, it appears that the Budget
assumed growth of 4.5 per cent annually. Our assumption of 3.9 per cent annual growth has
profound implications for Ontario’s fiscal outlook.
Before exploring those implications, we must acknowledge the basic problem with all forecasts
and projections. There is a cone of uncertainty that broadens the further out into the future we
look. There will always be errors, and the further out those forecasts and projections look, the
larger the errors will be. We could choose the mid-point in the range of forecasts and possible
outcomes as the basis for budget planning, but that would leave a 50–50 chance of getting a
result that is worse than the one we want. In this case, that would mean getting a deficit that is
larger, year by year, than the one needed to meet the 2017–18 target for balance.
Strategically, it is better to plan on the basis of the less favourable economic outcomes;
pleasant surprises are much better than nasty ones.

Chapter 1: The Need for Strong Fiscal Action
91
Revenue Implications
Our caution over the outlook for provincial revenues reflects a number of factors and applies
both to the short term — out to 2013–14 — and the longer-term period from then until
2017–18. This caution has been with us from the beginning of our work in July 2011, by which
time it was already evident that the economic growth prospects for Ontario — and the rest of
the world — had soured considerably since the Budget in March. Subsequently, all forecasts
of Ontario economic growth have been further marked down, which has obvious implications
for revenue growth. We also found the Budget’s implicit relationship between revenue and
economic growth unduly optimistic for two reasons. First, revenues were projected to grow
faster than nominal GDP even though a number of revenue sources do not grow at the same
pace as nominal GDP. Second, some tax reductions are still being phased in — a lower
corporate tax rate, the phase-in of input tax credits under the HST, some personal income tax
cuts related to introduction of the HST and some changes by the federal government to the
Tax-Free Savings Account program, which spill over into Ontario’s tax collections.
With the release in November of the 2011 Ontario Economic Outlook and Fiscal Review
(also known as the “fall update”), we had the opportunity to re-benchmark our analysis and
projections onto the fall update rather than relying on the 2011 Budget. We agree with the
economic growth projections in the fall update, which is hardly surprising, since the
government largely adopted the advice that we had given internally on what we believed
were the most appropriate economic assumptions — ones that reflected the global economic
situation, current data and need for prudence.
We continue to be more cautious on government revenues. While the fall update scaled
back the projections for economic growth, its revenue projections out to 2013–14 did not fully
reflect the deterioration in the economy.

92
In making our revenue projections, the upshot is this:
We have adopted the short-term economic assumptions found in the fall update;
To these, we have appended our prudent medium-term economic assumptions out
to 2017–18;
We substantially weakened the revenue numbers in the fall update through 2013–14 to
fully reflect the deteriorated economic outlook and the very current actual data, such that
our revenue forecast for 2013–14 is $0.8 billion lower than that in the fall update despite
being based on the same economic assumptions; and
We have appended what we view as more appropriate revenue growth numbers
beyond 2013–14.
Compared with the 2011 Budget, we see a weaker short-term economic outlook, weaker
medium-term economic growth rates, weaker short-term revenue growth and weaker medium-
term revenue growth numbers. Accordingly, our revenue numbers are significantly below the
Budget track in each year. And for three of those four reasons (the first no longer applies),
our revenue numbers are substantially below the fall update in every year.
For the period from 2013–14 to 2017–18, the Budget assumed annual revenue growth of
5.0 per cent, a pace exceeding the apparent 4.5 per cent projection of annual growth in
nominal GDP. Instead, we have projected revenue growth of about 3.7 per cent annually,
below our 4.1 per cent expectation for annual growth in nominal GDP. That is why our Status
Quo Scenario sees total revenues of only $132.7 billion in 2017–18, $9.5 billion less than the
Budget Scenario’s of $142.2 billion.
We do see some room for a small amount of additional revenue growth without raising taxes.
A variety of modest revenue measures could yield almost $2 billion in annual revenue by
2017–18. These would involve a variety of measures: new strategies on contraband tobacco
and the underground economy; better compliance with existing tax rules; better targeting of or
eliminating some tax expenditures; and additional revenues from Crown agencies. Such
initiatives, which we have incorporated in our Preferred Scenario, could bring total revenues
in 2017–18 to $134.7 billion.

Chapter 1: The Need for Strong Fiscal Action
93
We can — and do — hope for better. But we cannot count on the kind of revenue growth the
government expects and, more importantly, we must not make firm budget plans on the basis
of that hope. Rather, we must adopt the “cautious assumptions” for fiscal policy — the first
principle set out in the Fiscal Transparency and Accountability Act. We must apply that
principle to our projections for provincial revenues and then work to fit our spending plans to
match the revenue projections. This is not strictly a case of hoping for the best and planning
for the worst, as the old adage goes; we are planning not for the worst, but for an outcome
we think more likely. We can hope too that another adage will apply: underpromise and
overdeliver. If the economy and revenues exceed our assumptions, future governments
will be left with the pleasant task of deciding what to do with the resulting surpluses.
Related to the revenue outlook is the usual contingency reserve that budgets include for
reasons of prudence — in case revenues fall short of the budget forecast. The 2011 Budget
set the contingency reserve at $700 million per year in 2011–12 and $1.0 billion in all
subsequent years. Such a static approach, however, might not cover the impact of long-term
trends that give rise to forecast errors. Projections are not only subject to short-term
uncertainty emanating, for example, from the fragile global recovery. There is great uncertainty
over longer-term trends such as productivity growth as well, which affects our assumed rate of
economic growth and therefore our assumed revenue growth. We assume productivity growth
of 1.2 per cent annually, but it could just as easily come in at only 1.0 per cent. A persistent
shortfall in productivity growth would then have a compound effect on our projected revenue
growth. Accordingly, we have set the contingency reserve to cover the possibility of
overestimating the growth rate in revenue by roughly 0.2 per cent per year. From 0.2 per cent
of revenue in the first year of this exercise (2011–12), our reserve rises by 0.2 percentage
point per year to 1.4 per cent in the target year (2017–18), when the cushion would amount
to $1.9 billion.

94
As an aside, we would like to make one other point. Our mandate precludes us from
recommending increases in tax rates, though we have made some recommendations for
bringing in more revenues through better compliance, acting on some tax expenditures and
generating larger returns from Crown agencies. By 2017–18, the actions we recommend could
raise revenues by almost $2 billion. However, we would be remiss if we failed to point out that
even with these non-tax-rate revenue measures, the overall tax burden, as measured crudely
by the ratio of the government’s revenues from its own sources to GDP, will actually fall as a
share of GDP over the projection period. There are two reasons for this. First, revenues are
reduced by over $4 billion per year by 2017–18 as a result of policy decisions already taken.
These include planned reductions to the corporate income tax rate, the phasing in of input tax
credits under the HST, revenue losses from the increased use of Tax-Free Savings Accounts
and the policy of reducing property education tax rates every time the base rises. Second,
some revenue sources do not tend to grow apace with nominal GDP. For example, gasoline
and beer taxes are specific in that they are applied to the volume of sales, so revenues do not
rise with inflation. Also, many user fees are set as fixed levies and do not automatically rise as
the economy grows or with inflation. We estimate that for every one per cent rise in nominal
GDP, Ontario’s revenues from its own sources rise only about 0.96 per cent. A switch to ad
valorem taxes and adopting either full cost recovery on user fees or indexing user fees to
inflation would increase this revenue yield.
A striking fact in our Status Quo Scenario is that own-source revenue falls from 13.65 per cent
of GDP in 2010–11 to 13.09 per cent in 2017–18. In other words, the tax burden will fall; the
government will be taking less from the economy, relative to annual output, at the end of the
period than the beginning. We have suggested a number of measures, worth almost $2 billion
in 2017–18, that the government could take to increase revenues without raising taxes; these
would bring the revenue ratio back up to 13.33 per cent. In line with our mandate, the
Commission is not recommending tax rate increases. However, we note that if the ratio of
own-source revenue to GDP were kept constant at 13.65 per cent of GDP over the projection
period, the additional 0.32 per cent of GDP would generate almost $2.6 billion in additional
revenues in 2017–18. This would allow the government to balance the budget with program
spending that is $2.6 billion higher than in our scenario. The growth rate of program spending
could be 1.1 per cent rather than 0.8 per cent. Clearly, such a revenue scenario does not in
any meaningful way negate the need for bold spending reforms. It does, however, ease the
burden of spending restraint somewhat.

Chapter 1: The Need for Strong Fiscal Action
95
Inevitably, some people will balk at the severity of program spending restraint to balance the
budget by 2017–18 without any increases in tax rates; naturally, some will suggest that higher
taxes be part of the solution to Ontario’s budget problem. This is, of course, not an option for
the Commission; our mandate precludes any such recommendations or even much discussion
of the issue.
Nonetheless, we do wish to register some thoughts.
Most of the reforms we recommend should go ahead regardless of the particular spending
growth rate target. Many programs and services are not being delivered efficiently. Whether or
not the savings are needed to meet some particular spending target, there is no valid reason
not to address this question. It is just plain good sense for taxpayers to want everything to run
as efficiently as possible and for the government to ensure that this occurs. So any reprieve
that might be taken from the spending austerity we recommend should not be applied across
the board. Given the number of our recommendations, it should come as no surprise that
some would have been avoided if not for the spending limits imposed by the 2017–18 target
date for balancing the budget.
A critical sequencing is involved here. We are adamant that the government’s first priority must
be to implement a process that ensures greater efficiency in spending. Nothing that might be
done on the tax side should ever distract from this. Push the tax button too quickly and that
discipline might be lost. Ministries should be given seven-year spending targets, for example,
regardless of the degree of overall spending restraint. And again, most of our reforms should
be done just for the sake of delivering better value for taxpayers’ money.
Finally, it should be understood that it takes a lot of tax rate effort to get much relief from the
spending restraint. Suppose that instead of our recommended 0.8 per cent growth rate for
program spending, the government preferred a target of 2.0 per cent. That would raise the
level of program spending by around $10 billion in 2017–18 relative to our Preferred Scenario.
But if the budget were still to be balanced, revenues would also have to be $10 billion higher.
That amounts to almost a 10 per cent increase in every provincial source of tax and non-tax
revenue. The personal income tax rate, corporate income tax rate, HST rate, gasoline tax,
user fees and so on would all have to rise by the equivalent of 10 per cent, or the government
would have to find some combination (i.e., less of one, more of another) that produces the
same result. The most economically neutral way of doing this would be to raise the money
through a broad-based consumption tax, such as the HST. If that were the only source of
higher taxes, then to raise an extra $10 billion, the provincial portion of the HST would have to
rise from 8 per cent to 11 per cent, which would lift the whole HST from its current 13 per cent
to 16 per cent.

96
So whether you like our recommendations or not, there is no escaping the need to pay
attention to the ones for spending restraint and the processes required to deliver them.
The revenue outlook is only the first building block in our Status Quo Scenario. We now turn
to spending.
Spending Outlook
The 2011 Budget set out a profile for spending on programs (everything, that is, except
interest on the debt) that was, as the Auditor General put it, “optimistic and aggressive rather
than cautious.” In plainer language, the Budget assumed spending growth that would be
slower than the Auditor General believed likely. Our work has confirmed the Auditor General’s
assessment.
Combined with its revenue projection, the government’s 2011 Budget scenario contained a
projection for program spending that would bring the overall budget into balance by 2017–18,
when total revenue and total spending would each come to $142.2 billion. The Budget
Scenario was based on an assumption that program spending would grow by 1.0 per cent
annually from 2010–11 to 2013–14; after that, it would grow by only 1.7 per cent per year.
(If the effects of one-time stimulus spending are excluded, the growth rate for program
spending would be 1.8 per cent for 2010–11 to 2013–14.) This projection for the period after
2013–14, as we explained earlier, was really just a residual — the amounts left over after the
2011 Budget had projected revenues and interest costs. Each year’s estimate for program
spending constituted a target the government would have to hit to keep its projected year-by-
year reductions in the deficit on track.
However, if we assume that government programs continue as they are now delivered, then
the money spent on all goods and services is actually on track to grow by more than double
that pace — 3.5 per cent per year on average over the seven-year period. Still, it is noteworthy
that this is around half the pace of the past decade, so significant action has been taken.

Chapter 1: The Need for Strong Fiscal Action
97
This trajectory is our Status Quo outlook for program spending: it incorporates the increases
that are likely to take place if current programs are retained in their current form, if no new
programs are introduced, and if nothing further is done to restrain spending. This Status
Quo outlook is not just a mechanistic extension into the future of past trends in total program
spending. Rather, it is based on what are called the drivers of spending growth — the forces
that determine how much the government would have to spend in the future to maintain
current services. Two of those drivers — inflation and population growth — are common to
many programs, but most programs have their own additional unique pressures that drive
up costs.
Four blocks of spending accounted for over 77 per cent of all program expenses in 2010–11:
health; education (kindergarten through Grade 12); children’s and social services; and post-
secondary education. Left on their own, they would approach 83 per cent of program spending
in 2017–18. These programs will command ever-growing shares, squeezing out spending on
the government’s other programs — justice, transportation, economic development, tourism,
agriculture, natural resources and others.
Here is how some of the cost drivers work in those four major areas of government spending.
Health care expenses accounted for 40.3 per cent of program spending in 2010–11 —
$44.8 billion out of $111.2 billion spent on programs. A continuation of current practices would
require the province to increase spending on health care by an average of 4.7 per cent
annually through 2013–14 and 5.0 per cent annually from then until 2017–18, when it would
reach $62.5 billion. A look at the drivers in the three biggest components of health care
funding shows why.
The cost of running hospitals, the single biggest item in the overall health care budget at
$15.5 billion in 2010–11, is driven primarily by three factors — inflation, population growth
and aging (older people need hospitals more than younger people). Population growth will
add 1.2 per cent to costs each year through the whole period to 2017–18 and aging another
1 per cent. Inflation, the rising cost of buying the goods and services needed to operate
hospitals, is expected to add 3.0 per cent to costs this year and about another 2.0 per cent in
the next four years. Most of what hospitals buy are the services of their employees, so the
inflation driver is primarily the cost of compensation — wages, salaries and benefits. Whether
hospitals can hold this 2.0 per cent line on inflation over such a long period is open to
question. Note, however, that population aging — which in much of the public debate has
become the major “source” of future cost pressures — accounts for less than a quarter of the
cost drivers for hospital spending. All told, hospital spending in our Status Quo Scenario would
rise by an average of 4.1 per cent annually over seven years to $20.5 billion in 2017–18.

98
The Ontario Health Insurance Plan (OHIP) is the next biggest item in health spending —
$11.9 billion in 2010–11. It is subject to the same population and inflation drivers as hospitals;
in this case, the inflation driver is the cost of paying doctors. An additional driver, which we
might call “utilization above population growth,” is expected to add 3.0 per cent annually to
costs. This reflects the fact that, over time, there has been an increase in the use of health
care. New technology permits more interventions (hip and knee replacements, for example)
and more tests become possible. Such developments improve the population’s well-being, but
they also add new costs to the system. (Health care may be the only area in which
technological advances increase costs, rather than reduce them.) So any projection of future
costs must go beyond estimating how much today’s practices will cost in the future. There will
doubtless be an expanding array of health care services that become feasible and that
physicians and patients will want to use. The Status Quo Scenario for OHIP sees an average
of 6.4 per cent growth per year that would lift spending to $18.4 billion in 2017–18.
The cost of the ministry’s drug benefit programs would rise by 4.3 per cent per year in the
Status Quo Scenario from $3.5 billion in 2010–11 to $4.6 billion in 2017–18. One cost driver,
the growing population of those aged 65 or older, will raise costs by 3.5 per cent per year; the
other driver, new drugs and technology, will add 1.5 per cent annually. These are simply
examples of how cost drivers work in the biggest programs that make up the health care
budget. Every program in the health care budget has its own drivers that may be stronger
or weaker than the average.
Education spending, at $21.9 billion, accounted for almost 20 per cent of program spending in
2010–11, a sum that would grow to $29.1 billion in 2017–18 if the Status Quo is maintained.
This is based on average annual increases of 5.3 per cent to 2013–14 and further 3.3 per cent
average annual increases to 2017–18. Almost all of that goes to funding elementary and
secondary schools. Collective bargaining agreements for the province’s teachers expire in
August 2012, and the cost drivers reflect that. The current arrangements show up prominently
in the higher short-term growth. The five years from 2013–14 through 2017–18 inclusive are
not covered by existing collective agreements. For the purposes of this report, inflationary
growth is the key cost driver for the five years. The education budget also features the
implementation of full-day kindergarten, which in the Status Quo Scenario will rapidly drive
costs higher as it is rolled out between now and September 2014, when it is scheduled to be
fully in place.
Chapter 1: The Need for Strong Fiscal Action
99
Post-secondary education cost $6.1 billion in 2010–11, or 5.5 per cent of program spending,
and is on track to grow to $7.9 billion in 2017–18. The biggest chunk of this consists of
operating grants to universities and colleges: $4.7 billion in 2010–11, growing to $6.1 billion in
2017–18. Here, the cost drivers are inflation and enrolment growth.
The cost of children’s and social services programs was $13 billion in 2010–11, or 11.7 per
cent of program spending. In a Status Quo Scenario, that sum grows to $17.6 billion in
2017–18. The drivers are population growth among the relevant age groups — children in
some instances, adults in others — and inflation, mainly in the form of compensation.
Growing caseloads constitute another cost driver for social assistance programs like the
Ontario Child Benefit, Ontario Disability Support Program and Ontario Works — and for
Ontario Works, the uploading of programs from municipalities to the provincial government
will also push up costs.
No one should get the impression from all this that spending is out of control or wildly
excessive. Indeed, Ontario runs one of the lowest-cost provincial governments in Canada
relative to its GDP and has done so for decades. We must also recognize that important steps
have been taken in recent years to help manage costs, improve prospects for future economic
growth and enhance services to the public. There are many positive examples. Improvements
to the health care system that begin to reflect more of a patient-centric approach and apply
evidence-based policy decisions have been introduced through the Excellent Care for All Act.
While the cost of prescription drugs is still a huge burden for government, the recent move to
reduce the cost of generic drugs has already created dividends to the province of hundreds
of millions of dollars annually. Our elementary and secondary education systems have set a
very high standard with dramatic improvements in test scores and graduation rates, and the
64 per cent higher education attainment rate is the highest of the 34 Organization for
Economic Co-operation and Development (OECD) countries. ServiceOntario is a one-stop
delivery network for a range of government services that recently increased its overall
customer satisfaction rating to 92 per cent. And the HST has given Ontario a competitiveness
edge that helped vault Canada to number one in Forbes magazine’s ranking of best countries
in which to do business. Regrettably, staying the course on these critical improvements is not
enough. There is an undeniable need to accelerate progress in these areas and implement
new reforms in many other areas to create a sustainable climate for public services in the
province. And we must do so at a time when the need to eliminate a still-substantial deficit
is compelling.

100
Comparison of the Scenarios
Across all programs, the Status Quo spending scenario — adjusted for cases where the
government has already implemented firm plans to restrain spending — points to spending in
2017–18 that is $17.4 billion higher than the sums contained in the 2011 Budget scenario for a
balanced budget in that year. (This includes our $900 million increase in the contingency
reserve, explained earlier.) Tack on interest payments that are $3.4 billion higher than found in
the Budget (a consequence of higher deficits on the way to 2017–18) and the result is total
expenditures that are about $20.8 billion higher than the Budget projection. Since we assume
that total revenue in 2017–18 will fall $9.4 billion short of the Budget’s assumption, the result in
our scenario is a $30.2 billion gap compared with the Budget Scenario.
All scenarios are projections based on assumptions, of course, but we believe the dynamics of
revenue and spending growth point almost inescapably to this Status Quo outcome if no action
is taken — a provincial government with a debt of $411.4 billion, equivalent to 50.7 per cent of
annual GDP, not the more benign $322.5 billion (39.7 per cent of GDP) implied in the
2011 Budget.
To prevent that outcome, the government can raise taxes or cut the rate of growth of
spending, or both. We need to find $30.2 billion to close the 2017–18 gap between revenue
and spending. Since our mandate precludes us from recommending new or increased taxes,
we are forced to examine government spending as the primary source of a solution. However,
we have already suggested that a set of revenue measures that do not constitute tax
increases — these involve contraband tobacco, the underground economy, collections issues,
tax expenditures and Crown agencies — could raise almost $2 billion and we recommend that
the government proceed with these measures. Steadily reducing the deficit to zero by
2017–18 would save $4.3 billion in interest costs in that year. This means we need to shave
about $23.9 billion off our projection for program spending seven years from now to fully close
the gap and balance the budget.
The arithmetic is simple: in 2017–18, we expect revenues of $132.7 billion from the existing
tax structure and federal transfers. The revenue collection measures mentioned above would
bring total revenue in 2017–18 to about $134.7 billion, so a balanced budget requires total
spending of the same amount. Interest on the debt would cost $15.3 billion; though we, too,
like the 2011 Budget, are setting a course to eliminate the deficit in seven years, this interest
cost is lower than the budget figure primarily because forecasters now anticipate lower interest
rates than they did at budget time. This leaves a residual — after we have set aside a
$1.9 billion contingency reserve for unforeseen events — of only $117.5 billion to be spent on
programs in 2017–18, up somewhat from the $111.2 billion spent on programs in 2010–11,
but below the $124.9 billion foreseen in the 2011 Budget for that year.
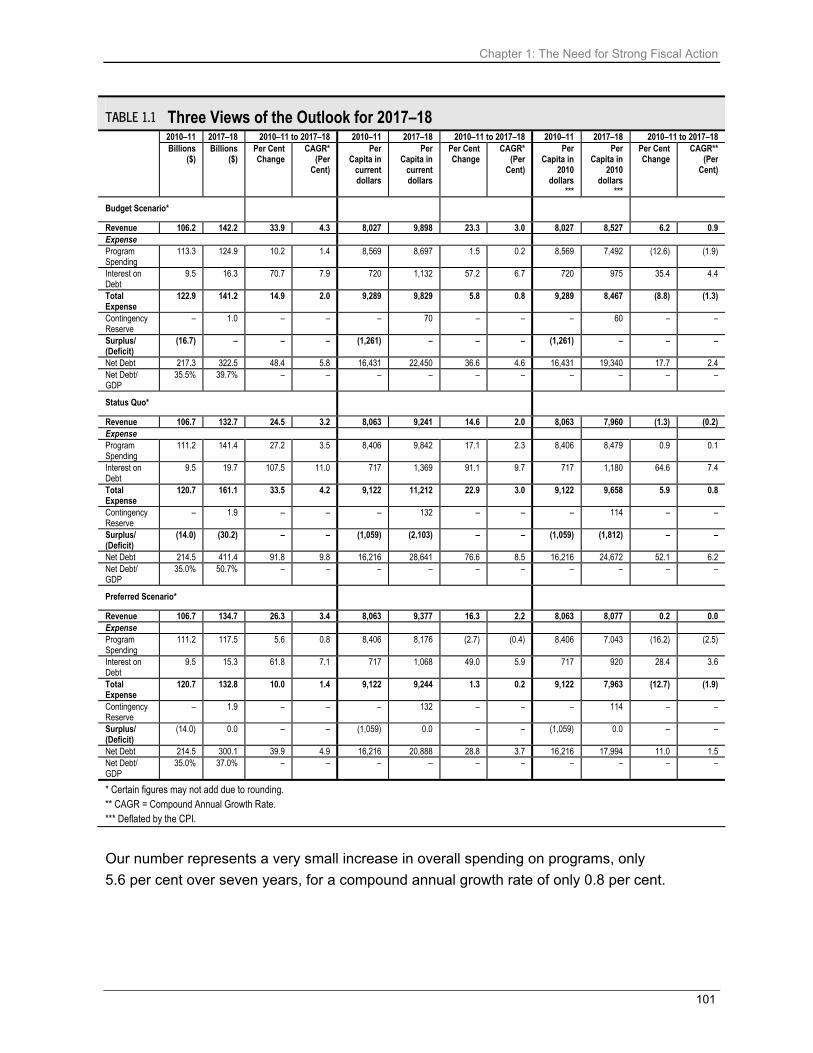
Chapter 1: The Need for Strong Fiscal Action
101
TABLE 1.1 Three Views of the Outlook for 2017–18 2010–11 2017–18 2010–11 to 2017–18 2010–11 2017–18 2010–11 to 2017–18 2010–11 2017–18 2010–11 to 2017–18 Billions
($) Billions
($) Per Cent Change
CAGR* (Per
Cent)
Per Capita in
current dollars
Per Capita in
current dollars
Per Cent Change
CAGR* (Per
Cent)
Per Capita in
2010 dollars
***
Per Capita in
2010 dollars
***
Per Cent Change
CAGR** (Per
Cent)
Budget Scenario*
Revenue 106.2 142.2 33.9 4.3 8,027 9,898 23.3 3.0 8,027 8,527 6.2 0.9 Expense Program Spending
113.3 124.9 10.2 1.4 8,569 8,697 1.5 0.2 8,569 7,492 (12.6) (1.9)
Interest on Debt
9.5 16.3 70.7 7.9 720 1,132 57.2 6.7 720 975 35.4 4.4
Total Expense
122.9 141.2 14.9 2.0 9,289 9,829 5.8 0.8 9,289 8,467 (8.8) (1.3)
Contingency Reserve
– 1.0 – – – 70 – – – 60 – –
Surplus/ (Deficit)
(16.7) – – – (1,261) – – – (1,261) – – –
Net Debt 217.3 322.5 48.4 5.8 16,431 22,450 36.6 4.6 16,431 19,340 17.7 2.4 Net Debt/ GDP
35.5% 39.7% – – – – – – – – – –
Status Quo*
Revenue 106.7 132.7 24.5 3.2 8,063 9,241 14.6 2.0 8,063 7,960 (1.3) (0.2) Expense Program Spending
111.2 141.4 27.2 3.5 8,406 9,842 17.1 2.3 8,406 8,479 0.9 0.1
Interest on Debt
9.5 19.7 107.5 11.0 717 1,369 91.1 9.7 717 1,180 64.6 7.4
Total Expense
120.7 161.1 33.5 4.2 9,122 11,212 22.9 3.0 9,122 9,658 5.9 0.8
Contingency Reserve
– 1.9 – – – 132 – – – 114 – –
Surplus/ (Deficit)
(14.0) (30.2) – – (1,059) (2,103) – – (1,059) (1,812) – –
Net Debt 214.5 411.4 91.8 9.8 16,216 28,641 76.6 8.5 16,216 24,672 52.1 6.2 Net Debt/ GDP
35.0% 50.7% – – – – – – – – – –
Preferred Scenario*
Revenue 106.7 134.7 26.3 3.4 8,063 9,377 16.3 2.2 8,063 8,077 0.2 0.0 Expense Program Spending
111.2 117.5 5.6 0.8 8,406 8,176 (2.7) (0.4) 8,406 7,043 (16.2) (2.5)
Interest on Debt
9.5 15.3 61.8 7.1 717 1,068 49.0 5.9 717 920 28.4 3.6
Total Expense
120.7 132.8 10.0 1.4 9,122 9,244 1.3 0.2 9,122 7,963 (12.7) (1.9)
Contingency Reserve
– 1.9 – – – 132 – – – 114 – –
Surplus/ (Deficit)
(14.0) 0.0 – – (1,059) 0.0 – – (1,059) 0.0 – –
Net Debt 214.5 300.1 39.9 4.9 16,216 20,888 28.8 3.7 16,216 17,994 11.0 1.5 Net Debt/ GDP
35.0% 37.0% – – – – – – – – – –
* Certain figures may not add due to rounding. ** CAGR = Compound Annual Growth Rate. *** Deflated by the CPI.
Our number represents a very small increase in overall spending on programs, only
5.6 per cent over seven years, for a compound annual growth rate of only 0.8 per cent.

102
That does not take into account either population growth or inflation. Meeting the target of a
balanced budget means that program spending for every man, woman and child living in
Ontario would have to fall by 2.7 per cent over the next seven years, or 0.4 per cent annually.
In real terms, with inflationary increases removed, the cut in programs per person would
amount to 16.2 per cent, making for steady 2.5 per cent declines on average in every year
from 2010–11 through 2017–18. For Ontario, indeed for any province, this represents a
decline in government spending that is almost certainly unprecedented.
The big picture then is this: Ontario must keep the growth in total program spending to a
meagre 0.8 per cent per year for seven years if it is to reach the official target of balancing the
budget by 2017–18. (Given that it is by now too late to reduce the growth in program expenses
to that level in the current 2011–12 fiscal year, the actual rate for the subsequent six years
would have to be even lower.)
We can express these numbers another way — in actual dollars. The 3.5 per cent annual
growth in projected program spending under the Status Quo Scenario would lead to outlays in
2017–18 that are $30.2 billion higher than they were in 2010–11. The 0.8 per cent growth rate
in our Preferred Scenario leads to an increase of only $6.3 billion.6
Our mandate was to provide advice on how to balance the books before 2017–18. Our
projections indicate that even getting to balance as late as 2017–18 requires a degree of
government spending restraint that is perhaps unprecedented in Canadian history.
The restraint must be so tight that many people will inevitably suggest that we go in the other
direction and let the target date for fiscal balance slip still further into the future. We examined
this option, but found that it offers little relief from the need for severe spending curbs. If we
delay the target for balance by one year to 2018–19, we could allow program spending to grow
by 1.0 per cent annually instead of 0.8 per cent. But the Commission does not recommend
such slippage. The minor additional flexibility on spending does not outweigh the risk of
slipping out of fiscal control.
6 For perspective, here are the changes in the key numbers between 2010–11 and 2017–18. In the Status Quo Scenario: revenue,
up $26.1 billion; program spending, up $30.2 billion; interest on debt, up $10.2 billion; total spending, up $40.4 billion; the reserve, up $1.9 billion; the deficit, up $16.2 billion; net debt, up $196.9 billion. In the Preferred Scenario: revenue, up $28.0 billion, program spending, up $6.3 billion; interest on debt, up $5.9 billion; total spending, up $12.1 billion; the reserve, up $1.9 billion; the deficit, down $14.0 billion; net debt, up $85.5 billion.
Chapter 1: The Need for Strong Fiscal Action
103
Not every program should grow at the 0.8 per cent rate, however. Ontarians and their
government attach different priorities to different programs, and some offer more opportunities
for efficiency gains than others.
Anyone with even a smattering of arithmetic will realize that if some programs grow faster than
0.8 per cent annually, other programs will have to grow more slowly. Health care is always the
highest priority of Ontarians and it is difficult to know how far down its growth rate can be
driven without compromising the services delivered. The system needs fundamental reform in
its organization, as we will argue later in more detail, but it is worth noting here that health care
is unique in that new technology increases costs rather than reduces them. Few countries
have succeeded in achieving a sustainable growth rate in health spending of less than
four per cent in real terms; that is, before accounting for inflation.
Our basic problem is simple: the faster health spending grows, the more other programs will
be squeezed. If, over the period from 2010–11 to 2017–18, health spending continues to grow
by 6.3 per cent per year — its track record in the five years from 2005–06 to 2010–11 —
then all programs other than health would have to contract by 4.1 per cent annually to meet
our target of 0.8 per cent growth in total program spending. Over the whole period, total health
spending would rise by 53.4 per cent; all other program spending would fall by 25.2 per cent.
By 2017–18, health would account for 58.5 per cent of Ontario’s program spending, compared
with 40.3 per cent in 2010–11.
This cannot be our future. Important as it is, health care must not be allowed to run roughshod
over every other priority. It must not be allowed to gut every other government service that
Ontarians rely on for their education, social welfare, justice system, infrastructure needs and
a host of other programs that matter to the people of this province.
While total program spending growth must come to an average of 0.8 per cent annually,
there is an almost infinite set of possibilities for allocating spending across the government’s
many programs.
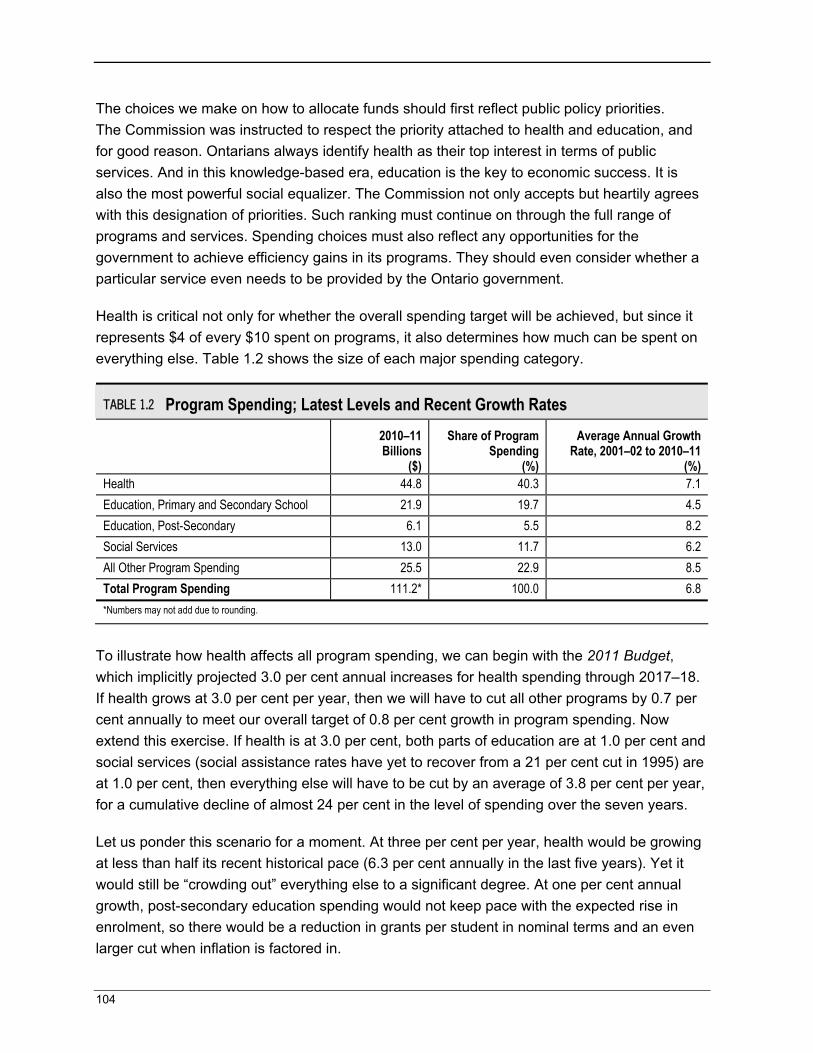
104
The choices we make on how to allocate funds should first reflect public policy priorities.
The Commission was instructed to respect the priority attached to health and education, and
for good reason. Ontarians always identify health as their top interest in terms of public
services. And in this knowledge-based era, education is the key to economic success. It is
also the most powerful social equalizer. The Commission not only accepts but heartily agrees
with this designation of priorities. Such ranking must continue on through the full range of
programs and services. Spending choices must also reflect any opportunities for the
government to achieve efficiency gains in its programs. They should even consider whether a
particular service even needs to be provided by the Ontario government.
Health is critical not only for whether the overall spending target will be achieved, but since it
represents $4 of every $10 spent on programs, it also determines how much can be spent on
everything else. Table 1.2 shows the size of each major spending category.
TABLE 1.2 Program Spending; Latest Levels and Recent Growth Rates
2010–11 Billions
($)
Share of Program Spending
(%)
Average Annual Growth Rate, 2001–02 to 2010–11
(%) Health 44.8 40.3 7.1
Education, Primary and Secondary School 21.9 19.7 4.5
Education, Post-Secondary 6.1 5.5 8.2
Social Services 13.0 11.7 6.2
All Other Program Spending 25.5 22.9 8.5
Total Program Spending 111.2* 100.0 6.8
*Numbers may not add due to rounding.
To illustrate how health affects all program spending, we can begin with the 2011 Budget,
which implicitly projected 3.0 per cent annual increases for health spending through 2017–18.
If health grows at 3.0 per cent per year, then we will have to cut all other programs by 0.7 per
cent annually to meet our overall target of 0.8 per cent growth in program spending. Now
extend this exercise. If health is at 3.0 per cent, both parts of education are at 1.0 per cent and
social services (social assistance rates have yet to recover from a 21 per cent cut in 1995) are
at 1.0 per cent, then everything else will have to be cut by an average of 3.8 per cent per year,
for a cumulative decline of almost 24 per cent in the level of spending over the seven years.
Let us ponder this scenario for a moment. At three per cent per year, health would be growing
at less than half its recent historical pace (6.3 per cent annually in the last five years). Yet it
would still be “crowding out” everything else to a significant degree. At one per cent annual
growth, post-secondary education spending would not keep pace with the expected rise in
enrolment, so there would be a reduction in grants per student in nominal terms and an even
larger cut when inflation is factored in.

Chapter 1: The Need for Strong Fiscal Action
105
The 3.8 per cent annual cut to “everything else” would be almost impossible to manage.
The prospect of squeezing more each year would force ministries to simply chop an activity
altogether or impose the 24 per cent cut all at once and then sort out the future with a budget
fixed at the new lower level. In some cases, such cuts would border on the technically
infeasible or require decisions that could be counterproductive. For example, a substantial
portion of the “everything else” category consists of the cost of amortizing existing capital
(mainly infrastructure projects), the government’s contributions to existing pension
arrangements with public-sector employees and the cost of electricity contracts. These items,
which in 2017–18 will account for over 31 per cent of the “everything else” spending, cannot
be cut. This implies that the cut to everything other than those fixed items would be in the
order of 6.4 per cent annually, for a cumulative decline of more than 37 per cent over
seven years.
Also included here are cost-sharing programs with the federal government, so if the province
cut $100 million from programs in which the federal–provincial cost split is 60–40, then
Ottawa’s contribution would fall by $150 million and total spending in the province would be cut
by $250 million. Accordingly, the burden of restraint will fall even more heavily on other
programs.
This is a simple illustration of the kind of choices Ontarians must face in the months ahead.
Another choice involves labour compensation. Since the total bill for wages, salaries and
benefits accounts for about half of all program spending, it is difficult to believe that program
spending can be held to annual growth of 0.8 per cent if labour costs rise by much more
than that.
Having developed a number of scenarios for program spending, we have opted to recommend
one that seeks even greater savings from health care to leave room for additional growth in
spending on other programs. As we will spell out in detail in Chapter 5, Health, we believe
there is ample scope in the health care system for efficiencies that will allow health care
providers to deliver the services Ontarians need without getting annual increases of the kind
seen in recent years.

106
Recommendation 1-1: We recommend the following annual changes in program spending
out to 2017–18:
Health care — plus 2.5 per cent;
Education (primary and secondary) — plus 1.0 per cent;
Post-secondary education (excluding training) — plus 1.5 per cent;
Social services — plus 0.5 per cent; and
All other programs — minus 2.4 per cent. As in the example cited, this would imply an
even bigger cut for everything except the fixed items referred to earlier; in this case, the cut
would be in the order of 4.5 per cent.
This permits post-secondary education grants to almost keep pace with enrolment and
provides a more realistic path for non-health, non-education, non-social services spending.
For the latter programs, it still represents a very significant degree of restraint — a cumulative
decline in the level of spending of about 15.6 per cent over seven years — even though a
significant portion of this “everything else” category is either fully committed by historical
arrangements such as amortization and pension contributions or simply unwise to cut,
such as existing shared-cost agreements, where the province would be giving up federal
dollars. For everything other than the fixed items, the cumulative decline would come to
about 27 per cent over seven years.
As mentioned earlier, program spending would rise by $6.3 billion between 2010–11 and
2017–18. Our recommendation implies the following changes for the major program
categories: health, up $8.4 billion; education (primary and secondary), up $1.6 billion;
post-secondary education, up $0.7 billion; social services, up $0.5 billion; all other programs,
down $4.0 billion.7
7 These items add to $7.2 billion. An operating reserve would be up $0.3 billion, but year-end savings, a standard feature of Ontario’s
budgeting, would subtract $1.2 billion, leaving the $6.3 billion total increase in program spending.

Chapter 1: The Need for Strong Fiscal Action
107
Conclusion
Ontario’s finances do not yet constitute a crisis and with early, strong action, a crisis can be
averted. Crises always spur action, but almost inevitably, they also bring forth bad public policy
decisions. Faced with the need to make huge corrections in very short order, governments
grasp at what look like fast and easy solutions, but too often meet the demands of the present
by pushing off expenses for future generations to pay. The current actions of many U.S. states
as they cope with the recession and a terribly weak recovery should serve as a warning.
Almost all are bound by constitutional requirements to balance their budgets and many are
responding to sudden revenue drops with spending cuts that are utterly inappropriate — like
savage cuts to education budgets that will undermine the lives of their children for decades.
The lessons of history and of what is happening elsewhere today are clear: The government
must take daring fiscal action early, before today’s challenges are transformed into tomorrow’s
crises. A challenge, unlike a crisis, can be met with well-considered, firm, steady and even
imaginative action that deals with the problems methodically and phases in the needed
changes over a period of years, giving people a chance to adjust. The government’s decision
to create the Commission and give it a broad mandate to address near- and long-term fiscal
issues signals its intent to address these challenges and head off any crisis. Our goal in this
report is to set out the kind of measures that will meet the task.

108
TABLE 1.3 Economic Assumptions Actual Forecast Compound Annual
Growth Rate 2010 2011 2012 2013 2014 2015 2016 2017 2018 2010–15 2015–18
Real GDP ($ Millions)
MOF* 2011 Ontario Budget 527,813 540,481 555,073 570,060 584,882 N/A N/A N/A N/A N/A N/A
MOF 2011 Fall Economic Statement 527,813 537,314 546,985 560,660 575,237 N/A N/A N/A N/A N/A N/A
Private-Sector November Average 527,813 538,369 548,598 562,862 578,059 591,933 607,323 621,291 634,960 2.3% 2.4%
Commission Assumptions 527,813 537,314 546,985 560,660 575,237 589,043 600,824 612,840 625,097 2.2% 2.0%
Real GDP Growth: Annual Per Cent
MOF* 2011 Ontario Budget 3.0 2.4 2.7 2.7 2.6 N/A N/A N/A N/A
MOF 2011 Fall Economic Statement 3.0 1.8 1.8 2.5 2.6 N/A N/A N/A N/A
Private-Sector November Average 3.0 2.0 1.9 2.6 2.7 2.4 2.6 2.3 2.2
Commission Assumptions 3.0 1.8 1.8 2.5 2.6 2.4 2.0 2.0 2.0
GDP Deflator
MOF* 2011 Ontario Budget 116.0 118.5 121.3 123.8 126.2 N/A N/A N/A N/A N/A N/A
MOF 2011 Fall Economic Statement 116.0 118.6 120.8 123.0 125.3 N/A N/A N/A N/A N/A N/A
Private-Sector November Average 116.0 119.0 121.3 123.6 125.8 128.0 130.2 132.4 134.6 2.0% 1.7%
Commission Assumptions 116.0 118.6 120.8 123.0 125.3 127.6 130.0 132.4 134.9 1.9% 1.9%
Nominal GDP ($ Millions)
MOF* 2011 Ontario Budget 612,494 640,669 673,343 705,663 738,134 N/A N/A N/A N/A N/A N/A
MOF 2011 Fall Economic Statement 612,494 636,996 660,563 689,627 720,661 N/A N/A N/A N/A N/A N/A
Private-Sector November Average 612,494 640,669 665,655 695,609 726,912 757,442 790,769 822,400 854,474 4.3% 4.1%
Commission Assumptions 612,494 636,996 660,563 689,627 720,661 751,649 780,963 811,421 843,066 4.2% 3.9%
Nominal GDP Growth: Annual Per Cent
MOF* 2011 Ontario Budget 5.3 4.6 5.1 4.8 4.6 N/A N/A N/A N/A
MOF 2011 Fall Economic Statement 5.3 4.0 3.7 4.4 4.5 N/A N/A N/A N/A
Private-Sector November Average 5.3 4.6 3.9 4.5 4.5 4.2 4.4 4.0 3.9
Commission Assumptions 5.3 4.0 3.7 4.4 4.5 4.3 3.9 3.9 3.9
Three-Month Treasury Bill Rate* (Per Cent)
MOF* 2011 Ontario Budget 0.6 1.4 2.6 2.7 2.5 N/A N/A N/A N/A
MOF 2011 Fall Economic Statement 0.6 0.9 1.2 2.3 2.5 N/A N/A N/A N/A
Private-Sector November Average 0.6 0.9 1.1 1.8 2.9 3.6 4.2 4.5 4.6
Commission Assumptions N/A 0.9 1.0 1.8 3.0 3.6 4.0 4.0 4.0
10-year Government Bond Rate* (Per Cent)
MOF* 2011 Ontario Budget 3.2 3.4 4.0 4.3 4.3 N/A N/A N/A N/A
MOF 2011 Fall Economic Statement 3.2 2.8 2.7 4.0 4.3 N/A N/A N/A N/A
Private-Sector November Average 3.2 2.8 2.5 3.3 4.1 4.6 4.8 5.1 5.1
Commission Assumptions 3.2 2.8 2.5 3.3 4.2 4.8 5.0 5.0 5.0
* Government of Canada interest rates. Interest rate assumptions reflect private-sector estimates. N/A = data not available. MOF=Ministry of Finance. To make the projections comparable, 2010 GDP levels are benchmarked to the latest Provincial Economic Accounts, which results in discrepancy from published Budget levels.

Chapter 2: The Fiscal Challenge in Context
109
Chapter 2: The Fiscal Challenge in Context
Closing the budget gap by 2017–18 will not be easy. However, many Canadian governments
have successfully faced deep fiscal problems in the past two decades and in the process have
strengthened their capacity to deal with fresh challenges as they arose. Most of those
episodes occurred in the 1990s, when a sharp recession was followed by a recovery that
was halting at first before gathering enough momentum to generate a solid expansion.
Economic growth helped governments back to fiscal health, but many restrained spending —
in some cases, significantly — and some even raised taxes to balance their budgets. Lessons
can be learned from these periods of restraint, but the underlying message –– that the task is
doable — must be tempered this time around by the expectation that economic growth alone
will not be strong enough to skate us onside. Indeed, it may not even be strong enough, as it
was in the 1990s, to lend much of a hand.
The 1990s
Nationally, the best-known example of deficit elimination was that of the federal government
between 1995, when the Chretien government began to take serious action,1 and 1998, when
the deficit disappeared. Four provinces that also engaged in vigorous deficit-cutting exercises
are of special interest to us –– Alberta, Saskatchewan, New Brunswick and (of greatest
relevance) Ontario. “In spite of their different situations as well as approaches, all of these
governments were successful in their efforts,” one study concluded.2 A thread common to all of
these was their reliance on spending restraint or outright cuts to a much greater extent than
tax increases.
Deficit-cutting was a feature of the 1990s in Canada following a severe recession that reduced
government revenues and increased government debt. After a generation in which Canadians
tolerated growing deficits, the public mood turned in the direction of greater fiscal
responsibility, most obviously at the federal level, but also in many provinces, especially those
whose debt had risen quickly.
1 The Chretien government applied some restraint in 1994, its first year in office, but its efforts were widely regarded, especially in financial
markets, as too tepid. 2 This section relies heavily on work done by Don Drummond and Sonya Gulati of TD Economics and published under the title “New
Brunswick Faces Tough Fiscal Choices Ahead,” Nov. 29, 2010. The figures used are all drawn from the Fiscal Reference Tables (FRT) published annually by Finance Canada, which make some adjustments to standardize the data for accounting differences across jurisdictions. As a result, some of the FRT data differ from those published by the Ontario Ministry of Finance. Interprovincial comparisons using FRT data must be made with caution because the accounting systems of the provinces differ.

110
The federal government’s debt reached two-thirds of annual GDP in fiscal 1993–94, the year
in which the new government of Jean Chretien was elected promising to reduce the deficit ––
5.6 per cent of GDP in the previous fiscal year –– to 3.0 per cent of GDP over three years.
Severe volatility in the financial markets, where investors did not believe that Canada was
committed to deficit reduction, persuaded the government to go even further in 1995. The
result was a round of significant cuts both to the operating budgets of departments and to their
grants and contributions –– many in the range of 15 per cent to 25 per cent, and some even
higher. Transfers to the provinces were also cut sharply –– by more than 21 per cent over a
two-year period.
In the end, seven of every eight dollars needed to eliminate the deficit came from spending
restraint rather than revenue-generating measures. By 1997–98, the federal budget was back
in balance. Subsequently, taxes were cut several times and spending resumed at a rapid clip,
but the federal government continued to balance its budget –– and even run surpluses in
many years –– for more than a decade. The quick decline in the deficit during the three years
while the deficit was being wiped out calmed the financial markets, giving the Bank of Canada
room to reduce interest rates, while robust economic growth generated strong revenue
increases. Total program spending, which had peaked in 1994–95, fell by almost 10 per cent
in the first two years of the restraint period and remained below the pre-restraint peak for
five years.
Worth remembering is the fact that declining interest rates and robust economic growth ––
not just in Canada, but worldwide and especially in the United States –– greatly helped not
only the federal government, but also the provinces, successfully attack their fiscal problems.
Canada enjoyed a strong gain in its terms of trade and was fortunate that it was one of the few
countries applying any kind of fiscal restraint. The economic environment is far different today,
as world growth falters, partly because so many governments are working simultaneously to
repair their fiscal regimes and reduce debt.

Chapter 2: The Fiscal Challenge in Context
111
Alberta’s drive to eliminate its deficit began in the 1992–93 fiscal year, when the new
Progressive Conservative Premier, Ralph Klein, inherited a deficit equal to 4.4 per cent of
GDP and a debt equal to 15.8 per cent of GDP, a condition almost unimaginable in a province
that had been debt-free only six years earlier. Klein promised to balance the budget within
three years and get rid of the debt in 10 years. He beat both targets, returning the budget to a
surplus in only two years (in 1994–95) and paying off the debt in eight (in 2000–01). He did
this entirely through cuts to spending and services. Spending was cut substantially in all
ministries, including health and education, while social assistance rates were reduced by
nearly 20 per cent over three years. Almost 10,000 public service jobs were eliminated, while
the remaining civil servants faced wage cuts and many social services were contracted out to
non-governmental agencies. Notably, total spending on programs fell by almost 22 per cent in
the three years from 1992–93 to 1995–96 and remained below its 1992–93 peak for six years,
through 1998–99.
Saskatchewan’s initial position was even more perilous. When elected in 1991,
New Democratic Party Premier Roy Romanow took over a province that was close to
defaulting on its $6 billion debt. At 28 per cent of GDP in 1991–92, the debt had climbed by
more than 10 percentage points in only one year from 17.4 per cent in 1990–91.
Saskatchewan’s plight was so serious that “the federal government had to step in with
emergency financial assistance and contingency plans were drawn up in the event the
province found itself in a position where it could not raise money in the foreign bond markets.”3
The Romanow government’s solution involved a mix of spending cuts and tax increases,
which it called “The Saskatchewan Way.” The plan, like Alberta’s, included an extended period
in which program spending was held below the 1990–91 peak, though in Saskatchewan’s
case, the peak-to-trough decline amounted to only 10 per cent. Still, it lasted a year longer
than Alberta’s restraint, for a full seven years to 1997–98. Departmental spending was cut, civil
servants’ wages were frozen and the government, more generally, downsized. Welfare
reforms encouraged people receiving social assistance to become more independent through
earned income supplements and training initiatives. In the end, it took Saskatchewan only
three years to get its budget back to balance.
3 Drummond and Gulati, p. 10.

112
New Brunswick, which went through two episodes of restraint under Liberal Premier Frank
McKenna, has a mixed record. The first began after the province recorded a deficit in 1986–87
amounting to 3.5 per cent of GDP, which raised the debt-to-GDP ratio to 24.7 per cent.
By 1989–90, the deficit had shrunk to $24 million from $368 million three years earlier.
Revenue increases accounted for most of this progress; the growth of program spending
slowed, but never fell. However, the return to an almost balanced budget was short-lived.
By 1991–92, the recession had pushed the deficit back up to 2.6 per cent of GDP while the
debt ratio, which had fallen to 23 per cent during the restraint years, was back up to
26.4 per cent. This time, a combination of expenditure curbs –– which held the growth of
spending to an average of only 0.7 per cent annually –– and revenue-raising measures
brought the budget to surplus in four years. This was not a major, or even prolonged, attack on
government spending, which actually fell in only one of those years and remained below its
pre-restraint peak for two.
Ontario’s experience in the 1990s is, of course, more familiar to Ontarians. A negligible surplus
in 1989–90, when the debt was only 12.7 per cent of GDP, had marked the last hurrah of the
1980s economic boom. It was followed by a deep recession and five years of deficits from
1990–91 through 1994–95 that raised the debt to 29.2 per cent of GDP. In the 1995 election,
the Progressive Conservatives under Mike Harris won power after running on a platform called
the “Common Sense Revolution” (CSR). The platform set out four key objectives: tax
reduction, balancing the budget, reducing the size of government, and greater emphasis on
individual economic responsibility. The new government substantially implemented its
platform. With the exception of health care, spending was reined in; the two most dramatic
moves were a 22 per cent cut in social assistance rates and a downloading of program
responsibilities to municipal governments, with a partial fiscal offset from other changes in
Ontario-municipal relations and the induced reductions in social assistance expenditures.
Personal taxes were cut by almost 30 per cent over a period of several years, while a new
health tax on high income earners was levied to help pay for rising health care costs.
Corporate taxes were cut as well.
Strong economic and revenue growth after 1995 helped the province balance its budget by
1999–2000, by which time spending had begun to rise again. Although the Harris government
retains its reputation as one that made deep and lasting spending cuts, the reality is rather
different. From its 1995–96 peak, program spending fell by only 4.1 per cent and stayed below
the peak for only three years. By comparison with Alberta and Saskatchewan, Ontario’s
restraint was both milder and much shorter. Even Quebec cut program spending by more than
Ontario during this period –– 4.6 per cent in the two years from 1994–95 to 1996–97.

Chapter 2: The Fiscal Challenge in Context
113
Holding program spending in check is never easy, especially not when governments face
constant pressure to increase spending. Inflation, population growth, compensation demands
and sheer need all push governments in the direction of higher spending, as do vocal interest
groups that advance any number of causes, many of them worthy. Since the current
government faces some of the same issues as the Harris government, Ontario’s experience in
the 1990s merits closer examination.
Ontario: A Closer Look
Chapter 1, The Need for Strong Fiscal Action, included our scenario for the seven years from
2010–11 through 2017–18. Now we want to compare, using broad strokes, the path we have
laid out with a comparable period in the 1990s, the last time the province grappled with a
substantial deficit. Specifically, we have chosen the six-year span from 1993–94, when the
deficit was $11.2 billion, through 1999–2000, when the government reported a surplus of
$1.0 billion.4
We will deal first with revenues. Our Preferred Scenario projects that revenue will grow by
3.4 per cent annually from 2010–11 to 2017–18. This is a much more modest increase than
the one that occurred during the recovery period from deficit in the 1990s. Between 1993–94
and 1999–2000, revenue grew by a robust 4.7 per cent annually, even though taxes were cut
during the period after 1995. The late 1990s were a period of robust economic growth that
generated a strong flow of revenues to the provincial government. The timing of the economic
expansion was fortuitous, since federal transfer payments fell as the federal government
worked to eliminate its own deficit. However, Ontario’s revenue from its own sources
grew substantially.
4 We would have preferred to begin our 1990s comparison with 1992–93 for two reasons. First, the reported deficit peaked in that year and,
second, it would have given us a seven-year span in the 1990s to compare with the seven years to 2017–18 that we are now working with. However, the government switched from cash accounting to accrual accounting in 1993–94, so the 1992–93 figures are no longer comparable. The reported surplus of $0.7 billion in 1999–2000 has been adjusted to eliminate another accounting change that arose from the restructuring of the Ontario electricity industry.

114
Revenue from personal income taxes grew by only 26.2 per cent between 1993–94 and
1999–2000, an extremely weak showing given the 39.4 per cent rise in the underlying nominal
GDP during that period, but there was a reason for this. Tax revenues tend to be highly elastic
during a period of strong economic growth following a recession; that is, tax revenues typically
grow faster than GDP if tax rates are left unchanged. But over the 1995 to 1999 period,
personal income tax rates were reduced sharply. However, retail sales tax revenue increased
by 55.3 per cent and takings from corporate income taxes more than doubled. Two other
revenue sources displayed strong growth. Revenue from government enterprises rose briskly,
primarily because of the expanding lottery and gaming businesses; so did other forms of
revenue, largely as a result of increased revenues to the province from municipalities.
The government of the day transferred a number of programs to municipalities, but during a
transition period, the municipalities reimbursed the province for services it was still providing
on their behalf.
Relative to the size of the provincial economy, own-source revenues in 1999–2000 were
15.9 per cent of GDP. In 2010–11, the own-source revenue share was even lower ––
13.65 per cent. Since the Commission’s Status Quo Scenario for the next seven years
assumes that revenues will grow more slowly than the economy as a whole, this share will
decline further, to only 13.09 per cent of GDP, in the absence of any measures to increase
revenue. In Chapter 1, The Need for Strong Fiscal Action, we recommended a series of
revenue measures worth almost $2 billion by 2017–18; these steps, involving contraband
tobacco, the underground economy, collections issues, tax expenditures and additional
revenues from Crown agencies, would raise the share to 13.33 per cent by that year. Federal
transfers related to the recent economic stimulus package and transition to the HST will fall off
over the next few years; all told, transfers are expected to amount to 3.3 per cent of GDP by
2017–18, down from 3.8 per cent in 2010–11.
Matching spending to revenues by 2017–18 –– the target set out in the 2011 Budget –– was
never going to be easy. Even so, the Budget clearly signalled the need for the provincial
government to restrain spending in the seven years to 2017–18. Its scenario for the target year
put program spending at $124.9 billion; with its projection of $142.2 billion in revenue,
$16.3 billion in interest costs and a $1 billion reserve, the budget would be in balance.

Chapter 2: The Fiscal Challenge in Context
115
Remarkably, the implications of this spending goal went almost entirely unremarked by the
public in the months since the Budget was released. The target of $124.9 billion in programs
represented an increase of 10.2 per cent from what the Budget estimated was the
$113.3 billion spent in 2010–11, an increase of 1.4 per cent per year.5 But if you adjust for
population growth of 1.2 per cent annually and for inflation of 2.2 per cent annually, the
government’s Budget Scenario points to a steady decline in real program spending per capita
that would average 1.9 per cent per year. It is startling to compare this with the 1993–94 to
1999–2000 period. During that time, real per capita program spending fell at an annual rate of
2.0 per cent. Ontarians may not have noticed it, but the 2011 Budget was projecting seven
years in which program spending on a real per capita basis would fall at almost the same rate
as it did in the 1990s.
Unfortunately, the Commission believes that these measures will not be enough, as noted in
Chapter 1, The Need for Strong Fiscal Action. Given our greater caution in projecting revenue
growth, our scenario suggested that program spending –– again on a real per capita basis ––
will have to fall by 2.5 per cent annually.
If the cuts of the 1990s appear smaller than the figures that loom in the memories of many
Ontarians, bear in mind that in 1999–2000, the final year of the period we are using, total
program spending increased by 3.0 per cent. The government of the day was heading for a
balanced budget and loosened the purse strings that year, mainly to deal with the pressures
that had accumulated during the previous six years of restraint. This was especially evident in
health spending, which increased by 11.4 per cent that year. It is also worth recalling that a
22 per cent reduction in social assistance rates was a key element of the Harris years; since
these rates have for the most part not increased since then, that avenue is not open now so
restraint in other areas will have to be much tougher.
There is a lesson here from exercises in restraint. Governments can hold the lid on spending
for a while by taking extraordinary measures to contain compensation costs, postponing
capital projects and scrimping on infrastructure maintenance. Unless more fundamental
reforms to spending programs are implemented, however, old pressures reassert themselves
and governments with newly balanced budgets have a harder time resisting them. The Ontario
experience of the 1990s is particularly instructive in this regard because reforms were applied
in several areas including hospitals, schools and municipal relations, and still the fiscal
pressures grew.
5 Program spending eventually came in at $111.2 billion as a result of larger-than-expected year-end savings.

116
Revenues and Expenditures: How Ontario Compares
It is always instructive –– and sometimes surprising –– to compare ourselves with
other provinces.
Ontario’s provincial government, for example, takes relatively less from its economy than
almost all other provinces. From 1981 through 2006, for example, Ontario’s total revenues
were the lowest in Canada, ranging in a narrow band between 14.5 per cent and 16.6 per cent
of GDP; from 2007 to 2009, Alberta fell below Ontario, with an average take of 14.3 per cent,
while Ontario was second lowest with an average of 16.3 per cent.6 Quebec, Manitoba and the
four Atlantic provinces, in the most recent data, have generated the largest revenues ––
between 23 per cent and 33 per cent of GDP.
In broad terms, there are two sources of revenue for a provincial government: transfers from
the federal government and the revenues it can raise on its own, mainly by taxing people,
companies and retail sales. For the poorer provinces, transfers from the federal government
have historically been an important source of revenue, averaging about 36 per cent to 43 per
cent of revenue in the Atlantic provinces in the latest decade for which there are data (2000
through 2009). In Ontario, transfers accounted for 14.8 per cent of revenues during this period,
though the recent trend is rising. Traditionally, Alberta’s reliance on federal transfers has been
the lowest of any province, with Ontario and British Columbia jostling for the second-lowest
spot. In 2009, however, Ontario received 18.7 per cent of its revenues from Ottawa,7 which
put it third from the bottom; below it were Alberta (13.8 per cent) and British Columbia
(17.6 per cent).
6 These figures are based on the Provincial Economic Accounts compiled by Statistics Canada. The latest data for governments are
from 2009. 7 The figure of 20 per cent cited in Chapter 1, The Need for Strong Fiscal Action, was based on the Ontario public accounts measure.

Chapter 2: The Fiscal Challenge in Context
117
The rest of Ontario’s revenues come from its own sources. From 1981 through 2003, the
Ontario government’s own-source revenues relative to GDP –– which represents the
government’s tax burden on the province –– were the lowest in the country, averaging
13.3 per cent through this period. It lost that distinction in 2004, when Newfoundland and
Labrador and, subsequently, Alberta, moved below Ontario. In 2009, however, Ontario’s tax
load, at 13.2 per cent of GDP, was the second lowest in Canada; only Alberta’s, at
11.6 per cent, was lower. The average for all provinces in that year was 14.6 per cent.
Quebec’s own-source revenue amounted to 19.9 per cent of GDP in 2009, making it by a wide
margin the heaviest-taxed province in Canada.8
Every province has its own mix of revenue sources and their power to fill the government
coffers varies according to the rates of taxation they levy and the ability of each tax base to
yield revenues. Direct taxes on persons, a category in the Provincial Economic Accounts that
consists mainly of personal income taxes, will generate more revenue for governments in a
province with high average personal incomes than in one with low average personal incomes.
Natural resource wealth is a major point of difference among the provinces. In the 10 years
from 2000 through 2009, just over 38 per cent of the Alberta government’s revenue came from
what Statistics Canada classifies as investment income, which consists of returns from
government-owned businesses and natural resource royalties. In Alberta’s case, this means
royalties on oil and natural gas production. As a revenue source, royalties can be very volatile,
tending to rise and fall with the price of the commodity; in the last decade of data, Alberta’s
revenue share from investment income has ranged from 26.5 per cent (in 2009) to 43.9 per
cent (in 2006). Ontario has no such luxury of easy money from resource wealth. Only about
four per cent of its revenues have come from investment income (mostly as returns from
Crown corporations) in recent years and the share is declining. Only Prince Edward Island
relies less than Ontario on investment income.
8 To make the data fully comparable, the average own-source ratios for all provinces and for Quebec have been adjusted from the original
data to reflect the Quebec abatement. In the 1960s, the federal government offered provinces opting-out arrangements for some federal–provincial programs, such as hospital care and social assistance; only Quebec chose to use this mechanism. Under the arrangements, the federal government reduced, or “abated,” personal income tax by 13.5 percentage points while Quebec increased its personal income taxes by an equivalent amount. Quebec continues to receive the value of these extra tax points through its own income tax system, in lieu of cash, while other provinces receive the corresponding amounts in cash. Transfers to Quebec for the Canada Health Transfer and the Canada Social Transfer and Equalization are shown in the federal budget on the same basis as transfers to other provinces. But since part of the Quebec transfer is made through lower federal taxes, this amount is netted out of transfer program spending.

118
Indirect taxes, the kind people pay as a consequence of some other activity, constitute the
most important source of revenues for Ontario. In addition to the provincial sales tax (or more
precisely, the provincial portion of the HST), this category includes gasoline taxes, payroll
taxes, gaming profits and motor vehicle licence fees. Collectively, these accounted for about
38 per cent of the Ontario government’s total revenues in the latest decade, compared with a
national average of 32 per cent. Ontario relies more on indirect taxes than any other province;
next in line are British Columbia and Quebec, at just over 35 per cent. Alberta, with no
provincial sales tax, relied least on indirect taxes –– less than 18 per cent of its total revenues.
Direct taxes on persons are the next biggest revenue source; in the latest decade, they
accounted for 28 per cent of the Ontario government’s total revenues, compared with a
national average of 24.5 per cent.
Direct taxes on corporations9 are another significant income source for Ontario, accounting for
8.5 per cent of total revenues on average during the last decade, second only to Alberta’s 8.6
per cent. Depending on the price of oil and gas, which in high-price years naturally makes
Alberta-based energy companies more profitable, Ontario and Alberta take turns as the
province with the greatest reliance on direct business taxes. These two are well ahead of other
provinces in this category, primarily because they have more head offices than the others.
Social insurance taxes (workers’ compensation levies are the biggest example) have
accounted for another 3.7 per cent of Ontario’s revenue in the latest decade. Ontario and
Quebec are the leaders in this category.
When it comes to spending, Ontario is very much on the low end of the scale. In the latest 10
years for which there are data, Ontario spent an average of only 14.7 per cent of GDP on
government programs. Only Alberta, at 13.1 per cent, spent less. Averages do not tell the
whole story, however. As a share of GDP, program spending by the Ontario government
peaked at 18 per cent in 1992, fell to 12.8 per cent in 2000 and since then has been rising
steadily –– to 17.7 per cent in 2009, close to the national average of 19.3 per cent.
9 This category includes government business enterprises and provincial taxes on mining and forestry.

Chapter 2: The Fiscal Challenge in Context
119
The biggest broad expense category is spending on goods and services, which includes
compensation for the public service. That amounted to an average of 8.7 per cent of GDP over
the latest 10-year period (compared with 10.3 per cent for all provinces) and 10.7 per cent in
2009 (12.0 per cent for all provinces). Transfers to local governments were the next biggest
expense, coming in at 3.3 per cent in the latest decade (3.1 per cent for all provinces) and
3.9 per cent in 2009 (3.5 per cent for all provinces). Transfers to persons, that is, social
services, amounted to 2.3 per cent in the latest decade (below the 2.6 per cent for all
provinces) and 2.7 per cent in 2009 (again below the 2.9 per cent for all provinces).
A separate Statistics Canada database10 offers even more detail on provincial government
spending. In 2008–09, the latest year available in Financial Management System data, the
Ontario government’s total spending amounted to 17.8 per cent of GDP, the third lowest of all
provinces; the average for all provinces was 19.6 per cent. In the latest decade, from
1998–99 to 2008–09, spending grew by an average of 4.8 per cent annually, fourth lowest in
Canada and below the all-province average of 5.3 per cent.
This pattern is reflected in spending on the major provincial budget items, in comparisons that
are only possible from this source:
Health spending was 6.9 per cent of GDP in Ontario, above the all-province average of
6.6 per cent. Ontario ranked sixth among the provinces for health spending;
Spending on all education — primary, secondary, post-secondary and training — was
3.5 per cent of GDP, below the 3.9 per cent Canada-wide average. Ontario ranked sixth;
Social services cost the government the equivalent of 2.9 per cent of GDP, less than the
3.3 per cent average. Ontario ranked sixth; and
All other spending came to 4.5 per cent, compared with 5.8 per cent for all provinces.
Ontario ranked ninth.
10 The Financial Management System database is the most detailed source of comparable data for government finance. Statistics Canada
dismantles every government budget — federal, provincial and municipal — and reconstructs its revenue and spending on a common grid, regardless of the accounting system used by each government. The result is a data set that is fully comparable, a huge advantage, given that most governments use different accounting systems. The disadvantage is that the numbers come only with a lag; the latest data go up to 2008–09.

120
Ontario’s role as a laggard in public spending was highlighted in a 2011 report11 from the
Ontario Chamber of Commerce that included the following comparisons:
Ontario had 633 nurses per 100,000 of population, the second lowest in Canada,
and well below the national average of 789;
Ontario had 930 residential care beds for seniors per 100,000 of population, the third
lowest in Canada, though just above the national average of 916;
Ontario undergraduate university students paid $5,643 in tuition, the second highest
in the country, and significantly above the national average of $4,634; and
Only 19.6 per cent of Ontario children had access to regulated daycare spaces,
compared with 20.3 per cent nationally. Ontario ranked sixth in Canada.
These are narrow measures and, unlike the Financial Management System data, do not take
in the breadth of all spending on health, education and social services. But in each of these
cases, the provinces offering their citizens a better, or cheaper, service are among the
traditionally “have-not” provinces that receive substantial federal transfers.
Although Ontario is now receiving Equalization payments, the fact remains that the federal
government takes a larger share of its revenues from Ontario than Ontario’s population share
and devotes a smaller share of its spending to Ontario than Ontario’s population share.
(See Chapter 20, Intergovernmental Relations.) As a rule, whenever the federal government’s
budget is balanced or in surplus, it takes more from Ontario in taxes than it provides in the way
of federal services to the province and in transfers both to Ontarians and to their provincial
government. From 1997 through 2007 inclusive, the years in which the federal government ran
a surplus (on a national accounts basis), Ontario’s net contribution averaged 4.6 per cent of
GDP, a figure exceeded only by Alberta’s 5.6 per cent.
11 David MacKinnon, “Dollars and Sense, A Case for Modernizing Canada’s Transfer Agreements,” a report prepared for the Ontario
Chamber of Commerce, February 2011.

Chapter 2: The Fiscal Challenge in Context
121
The Challenge
Despite its relatively modest expenses relative to the size of its economy and population,
Ontario must now close a large gap between that spending and its revenues. The $14 billion
deficit in 2010–11 is a significant improvement from the $19.3 billion shortfall a year earlier.
But Ontario has a long and tough spell ahead if it wants to eliminate the deficit entirely by
2017–18. It is neither a high-tax nor a high-spend province; it does not enjoy the easy pickings
of natural resource revenue nor is it a major recipient of federal transfers by comparison with
the rest of Canada.
But just to meet the government’s goal of a balanced budget seven years hence, the
government will have to cut even more deeply from its spending on a real per-capita basis,
and over a much longer period than the Harris government did in the 1990s, without the option
of an immediate deep cut in social assistance rates. It will have to maintain restraint for as long
as Alberta’s Klein government and Saskatchewan’s Romanow government did in the 1990s,
recognizing that Klein also made deep cuts to social assistance payments, while Romanow
raised taxes to help meet his goal. Indeed, Ontario faces the prospect that such restraint may
not end with a renewed burst of spending as it did in the late 1990s, but persist in a world of
slower economic growth that reins in the possibilities of what government can do.
The ultimate challenge in the years ahead will be to find ways to make government work
better; to find more efficient ways of delivering the services Ontarians need and want; to get
better value for money from the tax revenues the government raises; and ultimately to
preserve as much as possible the programs Ontarians cherish most.

122

Chapter 3: Our Mandate and Approach
123
Chapter 3: Our Mandate and Approach
We have referred briefly to some elements of the Commission’s mandate from the government
and some of our thinking as we approached this task. Before moving on to our detailed
analysis of government programs and recommendations for change, however, we want to
elaborate on both our mandate, parts of which were open to interpretation, and our thinking on
several issues that cut across all ministries and agencies of the government.
The Commission’s Mandate
There are five parts to our mandate:
1. Advise on how to balance the budget earlier than the 2017–18 fiscal year.
Given the deterioration in the economic outlook since the 2011 Budget, we believe it is neither
practical nor desirable to set an earlier official target for balance. Rather, we recommend an
approach that will solidify the prospect of balancing in 2017–18 through cautious economic
assumptions and the use of appropriate reserves. If we have been too cautious, and events
prove more favourable than our assumptions, the government should use any upside — that
is, higher-than-assumed revenues or lower-than-assumed spending — to balance the
budget earlier.
2. Once the budget is balanced, ensure a sustainable fiscal environment.
Our proposals are aimed at keeping the budget roughly in balance on a sustainable basis after
2017–18. We attach great importance to this goal, which would significantly alter the
government’s approach to budget balancing in comparison with some previous exercises.
We are unimpressed with the track record of such common techniques as deferring
expenditures to some undefined future day; the usual outcome is that spending pressures
fester and grow until they can no longer be resisted, regardless of their affordability. At the
same time, we place more value on reforming programs rather than simply cutting costs
because cuts without reform may be unsustainable.
3. Ensure that the government is getting value for money in all its activities.
This extends our mandate beyond a straightforward fiscal one. The Commission interprets this
as a requirement to recommend ways of ensuring that all programs and services are achieving
the best possible outcomes within available resources.

124
4. Do not recommend privatization of health care or education.
We interpret this to mean that health care must be kept within the public payer model. We do
not interpret it as denying opportunities for private-sector delivery of services, if that is more
efficient. Education is somewhat different, since tuition fees account for 40 per cent of
university revenues. So in the case of education, we interpret our mandate to mean that we
will not advocate any shift to educational institutions that are predominantly financed from
private revenue.
5. Do not recommend tax increases.
We interpret this to mean that we cannot recommend tax rate increases or an expansion of the
core tax bases. However, we examine whether more revenue could be generated from
existing tax structures without adjusting tax rates. We also examine some tax preferences that
for all intents and purposes operate as substitutes for spending programs. Nevertheless, most
of the actions we recommend to achieve budget balance fall on the program spending side.
Of course, the government can always pursue tax options, but the Commission does not
address this avenue, in line with our mandate.
Broad Guidelines for Actions Aimed at Balancing the Budget
Generally, the government should work to change a culture in which broad-based efforts to
improve efficiency occur mainly as part of a major budget restraint exercise and are either
discarded or forgotten when stronger revenue growth returns. Since we do not believe that the
customary rates of revenue growth will return any time soon, this cycle of restraint and laxity
must end. Simply put, government ministries and agencies should strive for efficiency gains at
all times. This goal should apply not just to the Ontario Public Service, the core of the
provincial government, but also to the broader public sector, which includes municipalities,
universities, colleges, school boards, hospitals, long-term care facilities, community care
access centres and Children’s Aid Societies. Aside from episodes of overall budget restraint,
inefficiencies appear to be tackled only when unearthed by the Auditor General or exposed by
a spending scandal. Unfortunately, the resulting Opposition party attacks and intense media
attention too often provoke an overkill response that in the end impairs efficiency.
All governments have faced this problem and many have tried unsuccessfully to implement
systems that encourage continuous efficiency improvements, so this goal may be impossibly
idealistic. Even so, the norm surely should be that ministers and officials and their ministries
and agencies are always careful with the public’s money, always seeking ways of doing things
more effectively and efficiently, and always looking for programs or tax expenditures that are
outdated (and should therefore be scrapped) or not working as well as they should.
Government organizations should be able to exercise such discipline not just in hard times, but
also in normal and good times.

Chapter 3: Our Mandate and Approach
125
Canada’s recent history offers plenty of episodes in which governments have tried to eliminate
their deficits and keep their budgets in balance once the deficit was gone. From that
experience, we can draw several lessons from what has worked and what has not. We have
also drawn upon lessons learned from private-sector restructurings that have worked.
We have turned these into guidelines that have helped us in framing our more detailed
recommendations. We believe the government should adopt them as it decides how to
proceed on all fronts. For those whose job it becomes to implement specific reforms,
we suggest that, when in doubt, test a proposal against these ground rules.
These maxims fall naturally into a series of “dos and don’ts,” which we will set out in
reverse order.
Our list of “don’ts” consists of proposals that are commonly heard and sound easy. They are
neither easy nor productive; more often, they are actually harmful. As American journalist and
social critic H.L. Mencken once said: “There is always a well-known solution to every human
problem — neat, plausible and wrong.”
Recommendation 3-1: Do not simply cut costs. The imperative to restrain spending should
instead be an opportunity to reform programs and service delivery. Simple cost-cutting can be
effective in hitting near-term deficit reduction targets, but it does not encourage longer-run
fiscal stability or allow for reforms that will generate more value for money spent.
Recommendation 3-2: Avoid across-the-board cuts. Such a blunt tool treats equally a
valuable, efficiently run program and one that is outdated and sloppily managed. This is dumb.
Spending should be aligned with government priorities so that high-priority initiatives are
adequately funded while lower-priority programs are either cut substantially or eliminated
outright. Across-the-board cuts represent an abdication of the government’s responsibility to
make real, and often difficult, decisions.
Recommendation 3-3: Avoid setting targets for the size of the civil service; instead, set
targets for outputs, not inputs. Focus on the cost of programs and services and on value for
money. A smaller and leaner civil service will be an inevitable result of reducing the cost of
programs and achieving greater value for money.

126
Recommendation 3-4: The government should not rely unduly on hiring freezes and attrition
to reduce the size of the civil service as a result of any spending restraint. Such approaches
typically weaken the quality of the civil service for years — even decades — to come.
Lower-priority and less efficient programs and services must be targeted for reduction; the
result will be fewer employees working in these areas. More generally, the focus must be on
retaining good employees while letting go of those who are not performing well. All employee
appraisal and bonus schemes must be aligned to these objectives; for example, the
government should continue to offer performance bonuses to those who exceed
job requirements.
Recommendation 3-5: Do not hang onto public assets or public service delivery when better
options exist. Consider privatizing assets and moving to the private delivery of services
wherever feasible. We suggest pursuing this course only where the public can get better
value for money spent without compromising access to services, not for ideological reasons.
In budget planning, do not count chickens before they are hatched. If assets are to be sold,
never incorporate any revenue from such planned sales into a budget before the fact; there is
always uncertainty over the timing, accounting treatment and ultimate market value of any
sale. Instead, simply record any sale in the appropriate manner if and when it is completed.
Recommendation 3-6: The length of time it will take to return to balance in a sustainable
fashion significantly changes the nature of the approach. Traditional “short-term fixes” will not
be adequate or even, in many cases, appropriate. Examples include asset sales solely for the
purpose of a one-time cash injection; freezes to wages or managers’ bonuses; and deferrals of
capital investments and other necessary spending. Kicking the can down the road is no
solution. Spending restraint must be thoroughly and consistently tied to permanent reforms in
how government operates so the results of the restraint exercise can be sustained over a
long period.
Our list of “dos” begins with several themes that have emerged from our consultations and
from our own experiences and observations. These apply across the entire public sector.

Chapter 3: Our Mandate and Approach
127
Recommendation 3-7: Once it has decided how to respond to this report, the government
should begin with a good road map –– a formal document of its vision and the path to the goal.
There are precedents for such a tool. In 1984, the Mulroney government published its Agenda
for Economic Renewal, an extensive paper that laid out in one place all the government’s
plans. The Chretien government did the same in 1994 with two documents recalled more for
their colour — the Purple Book and the Grey Book — than their titles. Each of these
documents not only informed the public about the changes that lay ahead, but also became a
script for all bureaucrats, who saw how their own programs and activities fit into the
broader picture.
Recommendation 3-8: Higher priority should be assigned to programs and activities that
invest in the future as opposed to those that serve the current status quo. This is never easy:
the status quo has plenty of advocates; the future does not. It is up to government to fill this
breach. As Massachusetts Institute of Technology economist Lester Thurow once suggested,
“The proper role of government in capitalist societies is to represent the future to the present.”
Recommendation 3-9: Policy development and the public service in general should be more
evidence-based. This requires setting clear objectives based on sound research and evidence.
The government should collect data and use it to evaluate whether objectives are being met
and how efficiently. Managers should be accountable for achieving these objectives. Where
objectives are not being met, programs and services should be adjusted. Reporting should be
transparent and audits conducted. The evidence-based model should be applied to the
success of individuals and departments in meeting objectives. At the same time, ministries,
as well as agencies and entities accountable to the government, should be given some latitude
to conduct their affairs in an efficient manner.
Recommendation 3-10: This raises a tricky issue that faces all governments. On the one
hand, they need to minimize the cost of operations; on the other, they need rules and reporting
to ensure that taxpayers’ money is not being abused. All governments must strike a balance
between these competing obligations. We believe the pendulum has now swung too far
towards excessive rules. Government operations have trouble responding quickly and
consistently, often because it takes so much time, for example, to process minor requests for
proposals (RFPs) or to get consistent supplies when everything is broken into discrete RFPs.
When there are too many rules, as there are now, government employees and private
suppliers are forced to divert people — or even add new staff — to ensure that compliance
and reporting requirements are met. This is the case even though the information reported is
often not used at the other end to influence changes in policy or service delivery. Although it is
impossible to get a full accounting of the costs of monitoring compliance relative to the benefits
gained, we believe there are simply too many layers of watchers at the expense of people who
actually get things done. The government must find a new middle ground.

128
Recommendation 3-11: Boundaries between public- and private-sector activities should be
shifted and, in many cases, removed. For the most part, policy development needs to remain
in the realm of the government, though various stakeholders and community groups could and
should be more involved. External groups should even be involved in advising the most senior
government decision-making bodies, including the Cabinet.
Ministries, and in some cases particular programs, should be informed by external advice.
Advisory panels of executives who have led reform/restraint exercises in their own
organization, both public and private, could share their experience. Ministries should also
seek expert input at a more technical level to help assess options for making their
operations more efficient.
Service delivery should be moved as close and convenient as possible to the clients.
It need not always be solely in the public domain. Services can often be delivered more
efficiently by the private sector, or through a separate agency of government (such as
ServiceOntario), but clear objectives and accountability mechanisms are needed. In many
cases, public-private partnerships could deliver services, as is done with alternative
financing for infrastructure. This could be extended to operations requiring capital for
information technology; private-sector entities could provide some of the capital and
assume some of the risks in return for which they would get a stake in the revenue or
savings flows. For example, the private sector could be asked to participate in the
management of difficult files, such as the heavy concentration of health costs in a small
portion of the population, in return for a share of any cost savings. In all cases, the choice
between public- and private-sector delivery should be driven not by ideology but by
considerations of quality-adjusted cost.
Recommendation 3-12: Within their operations, public-sector service providers should
assign people to jobs where they are most effective, efficient and affordable. Physicians
should not perform tasks that could be done more efficiently and at a lower cost by physician
assistants, registered nurses, nurse practitioners or pharmacists. Case workers need not deal
with all aspects of social assistance, employment or training matters when some clients are
willing and able to receive services by telephone or through the Internet. In the policing sector,
non-core services such as data entry could be done by clerical staff rather than officers whose
time and training are better deployed elsewhere.
Chapter 3: Our Mandate and Approach
129
Recommendation 3-13: Seek common themes across the reforms to achieve economies of
scale in action and simplify communications. Common themes would include a shift towards
evidence-based policy development and service delivery; more efficient service delivery
models for all areas interacting with the public; the efficient use of and appropriate rates of
return on Crown assets; and consolidation of such backroom operations as information
technology and human resources.
Recommendation 3-14: Reform must be pervasive and speedy. There is an understandable
tendency to approach any set of reforms piecemeal and over an extended period. This
tendency must be resisted, in part because the record is not kind to such an approach and
more importantly, because it runs contrary to our fiscal mandate to balance the budget by
2017–18. First, the government will need to implement all the reforms we recommend — or at
least some reasonable facsimile in fiscal terms — to restrain the growth of program spending
enough to achieve balance by 2017–18. This is not a smorgasbord from which the government
can choose only the tastiest morsels and ignore the less palatable. Second, the restraint
process will succeed only if the public believes the reforms are fair. Broader action favours
such a perception as opposed to a view that a handful of programs were unfairly targeted.
Third, we can all agree that change is disruptive, but the medicine does not go down more
easily if it is dragged out over a long period. Indeed, such delay merely discourages people —
public servants and those receiving government services — and postpones the day when a
new system is operating efficiently. Although there may be limits to the capacity of the public
service to instigate, execute and monitor change, once the financial parameters are set, first
for ministries and then for programs, many of the reforms will be handled by people further
down the chain.

130
Ambitious for Excellence: A Larger Vision
These are all practical suggestions for using the current fiscal challenge as an opportunity to
transform the way the Ontario government delivers public services. Perhaps, though, we can
shoot for a grander goal — a province that provides the best public services, delivered in the
most efficient manner, in the world.
This sounds impossibly ambitious — an aspiration that borders on fantasy. But put the
question another way: why not? We are forever goading our business sector to take on the
world by developing new products and using imaginative marketing to win new customers
worldwide even in the face of stiff global competition. Why not apply the same goals to our
government? Why not give our public servants an objective that can turn the task of
transformation — which will at times be a very tough slog — into a project that becomes a
source of real pride? Is such a goal even possible? Let us be blunt: the competition is not all
that stiff and this province has plenty going for it. Ontario has the best-educated population in
the world. It has a history of stable, democratic government. It has a terrific reputation for good
public-sector management among one of the toughest audiences in the world — the bond
buyers who lend us money at relatively low interest rates. No jurisdiction in the world has any
advantage over Ontario when it comes to delivering public policy and services.
What Does Being the Best at Public Policy and Services Look Like?
Public service would be an honourable calling that would draw the province’s best and
brightest people into the government and its agencies, where they would be offered
appropriate incentives and rewarded with compensation tied to performance, outcomes and
productivity.
The best public service would set clear objectives, use proper metrics to measure
progress and provide clear accountability for those expected to meet those objectives.
In many areas, we recommend that the government develop long-term plans for key
programs.
The best public service would benchmark itself against the best in the world — both in the
private sector and in the public sectors of other jurisdictions.

Chapter 3: Our Mandate and Approach
131
The best public service would constantly evaluate priorities. If a new priority is identified,
then by definition existing priorities would move down a place. Some at the bottom of the
heap, once useful but now outmoded, would be discarded. New priorities cannot just be
stacked on top of existing ones; otherwise, the array of government programs begins to look
like a junk pile. In other words, there would be continuous “program review.”
The best public service would drive relentlessly towards effectiveness and efficiency,
goals that complement each other. Objectives, metrics, accountability and benchmarking
would drive effectiveness. Governments typically struggle with achieving efficiency.
The common explanation is that unlike the private sector, government organizations lack the
discipline imposed by a bottom-line profit motive and by shareholders who hold their feet to the
fire. We cannot help but observe that in recent years we have seen enough dreadful
performances in the private sector that we cannot blindly put the business model on such a
high pedestal. Besides, does the public sector really have no external sources of discipline?
The Ontario government has more than 13 million stakeholders — Ontario’s residents, most of
whom pay taxes. Those taxpayers have made it very clear that they do not want to pay more
taxes and do not want their government to run persistent large deficits. Pressures for efficiency
are not totally lacking in the public sector. Yet this report is full of recommendations for where
we think efficiency could be dramatically improved, where programs wastefully overlap, where
backroom operations could and should be consolidated. These opportunities for public-sector
improvement are not unique to Ontario. Nothing we have found suggests that Ontario’s public
sector is less efficient than public sectors elsewhere. More needs to be done and more should
be expected from the best.
As an example of how the best public service would operate, take an employment service
whose task is to help an unemployed man, who is perhaps receiving social assistance, find a
job that will stick. That is the objective. It would be clear who will help him and in what manner,
so he is not left to navigate alone a mystifying jumble of programs offered by three levels of
government. The success and cost of providing the service would be tracked. Did he find
work? What resources did the government devote to helping him? In effect, what was the
public cost of finding him a job? Taking into account the likelihood that he will keep the new job
and switch off social assistance, did the benefits (he is no longer receiving social assistance
and is perhaps paying taxes) exceed the cost of helping him find a job? The best public
service would know the answer to this question.

132
Periodically, the best public service would stand back to ask — and answer — other questions
that are less straightforward. Could the job-search effort have been done more efficiently
within the existing framework? Could it have been done more efficiently in a different
framework? Perhaps it could have been done by a non-governmental organization (NGO) that
is skilled at matching people to jobs — a private company or a not-for-profit community centre,
for example. In return for applying its resources and time on aiding the unemployed, the NGO
might receive a share of the net benefits of its success.
The best public service would be forward looking and take an even broader look at our
employment service. It would assemble the data, study the evidence and use this research
to predict which people are vulnerable to job loss. Where possible, it would make strategic
interventions to head off the problem. This is not easy. The chief obstacle is that the payoff
usually does not appear within the usual political cycle of a few years. Nonetheless,
a forward-looking public service would take this approach.
Such thinking can be applied to almost any policy field.
Health care is a prime example. The health care system on which governments lavish so
much attention accounts for only 25 per cent of the population’s health outcomes,
according to the Senate Subcommittee on Population Health.1 Socio-economic factors
such as education and income explain 50 per cent, biology and genetics another
15 per cent, and the physical environment the remaining 10 per cent. To reduce the health
care bill 20 years from now, it might be more desirable to improve the education of
vulnerable young people today than make direct changes in health care. Health care today
is largely a matter of patching up people after something goes wrong, but we do little to
promote better health in general. Indeed, the research field is not particularly robust, so we
are unclear on what exactly are the smartest health promotion strategies.
Targeting is another issue. A relatively small portion of the population accounts for a huge
share of public spending in almost every field. We know that one per cent of the population
accounts for about 48 per cent of the cost of health care. We know that a relatively small
number of young people in challenging socio-economic conditions will account for much of
the future cost of social assistance and the criminal justice system. The evidence is fairly
clear: the government can either address welfare and justice problems when they become
acute, or it can intervene strategically now to prevent those problems.
1 Standing Senate Committee on Social Affairs, Science and Technology, “Final Report of Senate Subcommittee on Population Health,
A Healthy, Productive Canada: A Determinant of Health Approach,” June 2009, pp. 7–9, downloaded from http://www.parl.gc.ca/Content/SEN/Committee/402/popu/rep/rephealth1jun09-e.pdf

Chapter 3: Our Mandate and Approach
133
Consider mental health. The problems are mounting and the system is not responding.
The result: many people with mental health problems end up in prison, which — aside from
the fact that it is expensive — does them and society no good. We are going at things from
the wrong end; we should conduct research and design programs to get at the roots of
the issues.
Who should conduct such research? A common response is to bring in academics and
consultants whose expertise and other studies have already amassed the intellectual
capital needed to assess these issues. The problem is that the expertise then rests with
the external researcher, not with the government and its employees. And typically, projects
go nowhere in government unless there is an internal champion and people who
understand the research. This means the government must strengthen its own internal
policy research capacity. One reason we heard for the government’s research weakness is
that ministries are hitting their limits for full-time employees, even when they have funds in
their budgets that could finance such work. This surely points to the folly of targeting the
number of full-time employees as a restraint mechanism.
The best public service would focus on outcomes, not inputs. Is a program delivering the
objective? Is it doing so efficiently? How much is it costing? A top public service would not set
multiple objectives that mix outcomes and inputs, like restricting the number of full-time
employees. It would give managers the flexibility to do the job best within their budget.
The best public service would approach risk from a scientific basis. We do not want to
waste taxpayers’ money; this is an understandable and noble goal. But (and this is a decidedly
unscientific approach) hundreds of millions of dollars can be wasted in the interest of
preventing a few dollars from being used inappropriately. The pendulum in Ontario has swung
too far towards devoting massive resources to micro-manage processes such as procurement
and expenses. By all means, establish rules and regulations aimed at preventing waste. Then
let managers and employees do their job as efficiently as possible. Set up monitoring and
audit systems to catch problems, but do not waste everyone’s time by drawing them away
from important policy and service delivery objectives to attend to minute details of reporting
and compliance.
The task ahead need not be dreary. Many will scoff that the business of eliminating a fiscal
deficit is simply a mundane exercise of restraint, that the very idea of creating an organization
that delivers the world’s best public services is hopelessly naive, and that we should not even
think — let alone speak — of such lofty goals. But our reach should always exceed our grasp.
High ambition should never be sneered at. Such an objective could instil in our politicians, our
public servants and all Ontarians a sense of purpose that would help see us through this
monumental mission.
Why not?

134

Chapter 4: Making Transformation Work: Process and Structures
135
Chapter 4: Making Transformation Work: Process and Structures
The public is currently unaware of the depth of the province’s fiscal challenge, so Ontarians
are unprepared for the severity of the restraint needed to balance the budget by 2017–18.
Raising public awareness of this challenge must be done early, clearly and consistently.
This process began with the 2011 Budget, which emphasized in a general fashion that
significant reforms would be necessary to contain program spending growth to 1.4 per cent
per year through 2017–18. Next, the Auditor General noted that “many of the assumptions
underlying its estimates for program expenses (that is, expenses excluding interest on
the public debt and reserves) were optimistic and aggressive rather than cautious.”
The government's November Speech from the Throne and subsequent Ontario Economic
Outlook and Fiscal Review continued the message that difficult decisions would be required
on the fiscal front. The Commission’s report sets out in greater detail the fiscal challenge and
provides both broad parameters and 362 specific recommendations for what actions will be
needed. The 2012 Budget should set out as much detail of the restraint as feasible.
In any organization, a major transformation can succeed only if it is clearly led from the top.
The provincial Budget is the organizing document for any future changes in all corners of the
broader public sector (BPS) in Ontario, simply because the Budget is where the government’s
priorities and plans all come together in one place. It is through the Budget that the
government makes its trade-offs among competing claims on the public purse; spells out its
spending priorities; sets its targets for each ministry and agency; allocates the funds available
to each; and makes provision for the revenues that will cover all spending. Once the Budget is
crafted, the task of ensuring that the spending targets turn into firm action falls to the Premier’s
Office and Cabinet Office. It must be clear to all that the Premier’s Office is giving full moral
and organizational support to the effort, and when prodding is necessary to keep the process
moving, only the Premier’s Office has the clout to push the transformation forward. There will
be difficult days — even weeks or months — along the way, and it is essential that the public
understand both what is being done and how it contributes to the ultimate goal. To this end,
the communications effort should be led by the Premier’s Office.
Given the importance of both the budget process and the long-term management of the reform
process, we deal with each in some detail.

136
Budget Planning
The budget process itself needs some reforms. The annual budget — along with the fiscal
update that precedes it — can be a powerful educational tool both for Ontarians in general
and for the officials who work in the public sector. The general public can learn more about
the nature of the fiscal challenges facing their government and the often difficult trade-offs that
must be made in deciding both the right mix of taxes and spending, and the right priorities for
spending on programs. The public service can learn about the choices that must be made
and their role in helping Cabinet make those choices and implement any decisions made.
Transparency, clarity, the use of reserves and a long-term perspective are all virtues in
budget-making. At the moment, there is too little of all four. Below are recommendations that
would strengthen the fiscal planning process.
1. Chronologically, the sequence of events leading to the next budget is the Speech from the
Throne, Ontario Economic Outlook and Fiscal Review and 2012 Budget. (The first two
have now been done.) Internally, however, the three events should be considered together
and, in a sense, in reverse order. In other words, key elements of the 2012 Budget
should be worked out before the Speech from the Throne and Ontario Economic
Outlook and Fiscal Review so that public messaging can be clear and consistent over
time and across public documents and statements.
2. The Auditor General’s 2011 Pre-Election Report on Ontario’s Finances demonstrated the
confusion around what constitutes a “status quo” outlook, an assumption and a firm plan.
To provide clarity in the 2012 Budget, the government should first take a step backward
and produce a “clean status quo” fiscal projection out to 2017–18 that reflects only
decisions and actions already taken. It should include no assumed future savings from
plans not yet elaborated. From this base, the savings from firm new actions should be
shown. These actions must be sufficient, under credible assumptions, to secure budget
balance no later than 2017–18 and provide a reasonable chance of achieving
balance earlier.

Chapter 4: Making Transformation Work: Process and Structures
137
3. Without tax increases, it will be difficult for Ontario to return to a balanced budget earlier
than 2017–18. Therefore, this date should remain the target. However, a number of steps
should be taken to increase the probability of securing this 2017–18 target:
• Use private-sector forecasts to inform the budget planning process but reduce those
forecasts if it appears the private sector is not appropriately reflecting the risks to the
Ontario economy. Any adjustment to the private-sector growth forecasts should be
based on sophisticated internal economic and risk analyses. Where there is a range
of possible outcomes, do not choose the mid-point of the range, but something on
the prudent side of the middle of the risk distribution.
• Ensure an adequate contingency reserve against forecast errors. To protect against
errors in revenue or expenditure growth rates, the level of the reserve should grow over
time as the budget projection is pushed further out into the future.
• Develop a plan to identify and reduce specific risks to the fiscal plan (the contingency
reserve is designed more to address risks that cannot be identified before the fact).
Examples of specific risks would be certain federal government actions and some
pension liabilities.
• Given the tight constraints that will be imposed on ministry operating budgets, a
centrally held operating reserve should continue to be maintained and accessed only
through a process involving Cabinet and Treasury Board. It should be used in cases
where health and safety might be compromised or services to the most vulnerable are
jeopardized. This operating reserve could also be applied to areas where there is a
convincing argument that an initial investment is required to achieve substantial savings
(and/or quality improvement) over time.
• Between now and 2017–18, it is inevitable that new programs will be introduced.
Consistent with the government’s current policy for program offsets, these will need to
be funded through deeper cuts to some existing programs (or their outright elimination).
This implies that the initial spending targets for ministries will have to be set low enough
to create a policy reserve so that additional cuts do not have to be applied as new
programs are considered.
• At the end of each fiscal year, any reserves not required should be put towards deficit
reduction. A transparent accounting process must be established to demonstrate this.
How the reserves were handled should be explained in a public document issued —
and well publicized — within 60 days of the public accounts figures becoming available
each year.

138
• In the fiscal approach described in the Commission’s mandate, program spending
becomes a residual. The anchor is the target of a balanced budget by 2017–18. As tax
rates are not to be changed, revenues will simply reflect the interaction of economic
performance and the existing tax structure; in effect, they are a given. Similarly, interest
on the public debt is a given, reflecting the interaction of projected interest rates and the
amount of provincial borrowing. This leaves total program spending as the residual; that
is, what is left after interest payments are subtracted from revenues.
• Within the total residual for program spending, the government’s focus should first be
applied to the big-ticket items — health, education and labour costs. Health and
education alone account for more than 60 per cent of total spending (including their
labour component). Including labour costs from the rest of spending, these three broad
areas account for more than 80 per cent of total program spending. Health and
education warrant special attention because they have been among the
fastest-growing components of spending and rank at the top of public interest. Health,
understandably, is always the top priority that people choose in public opinion surveys.
Education is key to the standard of living of individuals and to Ontario society as a
whole. Once the government determines the extent to which health and education can
be restrained, then the rest of program spending becomes the residual from the
residual; that is, what program spending is left over after health and education
allocations have been set. Ministry spending will have to be informed by a view of future
labour costs. It is not satisfactory to simply assume this away by asserting that
ministries must absorb any increases in labour costs. They will be asked to make cuts
for many other reasons. Their overall ability to absorb the restraint will not be
independent of the course of labour costs.
• Fiscal restraint exercises too often feature wage freezes and the elimination of
managers’ bonuses. But in the context of Ontario’s fiscal challenges, focus must remain
on the larger picture, which is the government’s need to get the right people into the
right positions at a cost that is both compatible with its fiscal circumstances and
appropriately aligned with private-sector compensation. The government will have to
attract and retain bright, competent people qualified to carry out the difficult tasks
ahead. It will require considerable flexibility in labour arrangements. Such broader
considerations may well be more important than any short-term cost savings.

Chapter 4: Making Transformation Work: Process and Structures
139
• Each ministry and agency should be given a spending limit over the period it is
projected to take to return to fiscal balance. In this case, the projection period is the
seven years to 2017–18. The process of setting those limits began with the
2011 Ontario Economic Outlook and Fiscal Review, which used realistic economic
assumptions for its projections. The government has also begun to highlight the
seriousness of the challenge and send a clear message to the BPS that their budgets
face an extended period of restraint. This process must continue as decisions are made
that will spell out the details that will force ministries to begin fundamental reform.
• Plans should be reviewed periodically against the fiscal limit and their progress towards
long-term goals should be tracked. This process should be led by the Premier’s Office,
with support from Treasury Board and the Ministry of Finance. (We set out more details
below.) These targets may need to be adjusted for ministries as the process unfolds.
But the total cannot be altered from that needed to return to a balanced budget, so any
concessions to one ministry must be offset by deeper cuts elsewhere.
• The Commission has been instructed not to recommend tax increases. However, there
are a number of ways that revenues can and should be enhanced without raising tax
rates and we will make recommendations in this area.
Transformative Processes and Structures
In Chapter 1, The Need for Strong Fiscal Action, we made the case for immediate bold action
by the government to address the fiscal challenge. The remainder of this report deals with the
substance of reforms — a broad array of transformational measures that represents the
Commission’s best advice on the type of aggressive actions that are necessary. The report
does not, however, lay out a specific implementation plan or schedule for these initiatives. The
expertise of government officials and external advisers — who know their own ground far more
intimately than we do — will be required to translate our recommendations into a more
detailed, step-by-step plan for implementation.
The history of fiscal transformations provides important lessons and demonstrates that there
are three critical ingredients to successful reforms:
The objectives and means of the reforms must be explained clearly and transparently;
The substance of the reforms must be sound and make sense to citizens, officials
and politicians; and
There must be appropriate internal processes to deliver the desired outcomes.
We recommend throughout this document the sorts of communications that will be needed.
Here, we complement that advice with some thoughts on the internal processes the
government will need to carry out this enormous task.

140
The Commission understands that the package of reforms recommended in this report amount
to a heroic challenge. To the fullest extent possible, we think ministers and their officials
should be given a great deal of discretion in deciding how to implement reform in a manner
that meets their objectives for their ministries and agencies. At the same time, there are
several government-wide issues that many ministers and ministries will face in common; some
that ripple through our report are:
Labour issues. Compensation will doubtless be a contentious point, as will questions of
severance packages and moving people into other job categories, as priorities shift and
efficiencies take hold;
Overlap and duplication across programs and services. Economic development programs,
for example, are delivered by nine separate ministries and there are several employment
services that can be consolidated and rationalized;
The possibility that services can be delivered in more efficient ways. Recommendations to
this end are found in several areas; and
Managing the province’s considerable assets more efficiently. Obviously, a common
approach to asset management is desirable.
Ministers and their officials can learn from each other and provide support to their colleagues
by coming together on such questions as they arise.
While all elements of the Ontario Public Service and BPS should have a certain degree of
discretion, the critical importance of the transformation we propose means that a vigilant watch
must be maintained on the individual reforms and how they are coming together.
It is with all this in mind that we recommend some internal processes to guide this work.
Any transformational process, especially one that involves major expenditure management,
must be led from the top. In the case of the Ontario government, this means that the centre
of government — the Premier’s Office and Cabinet Office — must be directly involved and
provide strong leadership to the process for as long as it takes to return the provincial budget
to balance. A steering committee should be established, with representation from the
Premier’s Office, Cabinet Office and Ministry of Finance. This committee, supported by a
secretariat within Cabinet Office, would be the focal point for the government-wide work
necessary to develop implementation proposals for specific reforms and for cross-cutting
measures addressing themes that touch on multiple sectors. Once reform processes are
underway, this committee would also monitor both the overall reform exercise and progress
on individual initiatives.

Chapter 4: Making Transformation Work: Process and Structures
141
The steering committee would direct ministers and their ministries to develop proposals and
implementation plans, and provide a schedule for reporting these proposals to Cabinet.
The steering committee would also guide a number of working groups created to conduct
research and analysis of the major cross-cutting issues: labour and compensation; overlap
and duplication; new delivery models; and optimization of assets. These groups would be
a resource both to the steering committee and to ministries as they develop specific
transformation proposals that have implications for other ministries, as many of them will.
The steering committee could also commission independent research to inform the working
groups on key areas of analysis.
Ministries will bring forward their transformation proposals and plans to a Premier’s results
table on strategic reform for its consideration and input prior to formal Cabinet consideration.
The results table would be chaired by the Premier and composed of a mix of senior Cabinet
ministers and independent experts with experience in cost-cutting and transformational
change within their organizations (either public or private). It would be the main forum for both
championing and contesting reform proposals. The results table would be directly supported
by the steering committee, so there would automatically be direct involvement by senior staff
from the Premier’s Office and Cabinet Office, and senior officials from the Ministry of Finance.
Proposals that are more routine and not “transformational” in scale can proceed through the
normal channel of Treasury Board and on to Cabinet. The steering committee should continue
to monitor the progress of these initiatives, in order to have a comprehensive view of the
status of overall reform.
To support the Premier’s results table and Treasury Board, a technical spending review
mechanism should be established to review all reform or savings proposals from individual
ministries and the annual results-based plan submissions. This technical group would
comprise the necessary expertise from one or more private consulting firms that are
contracted via a competitive procurement process. It would provide a third-party review and
critique of proposals and submissions, ensuring accuracy and adherence to the principles
of reform.
Finally, we would recommend that this structure and the associated processes stay in place
for at least several years given the breadth, depth and likely length of the reforms. Some parts
of it, or at least modifications to it, should become permanent features. For example, we heard
so much evidence of confusing overlap and duplication in work across ministries
(e.g., economic development programs, social services, and training and employment
services) that we recommend that cross-cutting working groups or subcommittees of Cabinet
become a permanent feature to deal with these issues.

142

Chapter 5: Health
143
Chapter 5: Health
Health care is at once the biggest item in the Ontario government’s budget, the issue of most
concern to Ontarians, the source of the most intense and emotional public policy debate, and
the centre of the most complex delivery system of any set of programs financed by the
provincial government.1
For at least two decades now, Ontarians — along with other Canadians — have worried about
the quality and accessibility of their health care. As health has consumed a rising share of the
provincial budget, the debate has increasingly focused on the sustainability of the health care
system in a form that gives Ontarians what they want. The system is sustainable if we can
answer “yes” to one of three questions. Are we willing to pay ever-increasing taxes to support
it? If not, are we willing to squeeze out spending on all other public services — including
education at all levels, social services, justice, infrastructure and economic development —
to make room for rising health care costs? If not, are we willing to shift a significant portion
of health care spending to individuals, regardless of their ability to pay?
Public opinion surveys indicate that the answers to the first two questions are probably “no”
(significant minorities offer a tepid “yes”) and to the third a resounding “no.” Politically,
however, the answers are “no” to all three. Ontarians are unlikely to want either higher new
taxes on individuals or cuts to non-health programs to accommodate the relentless increase in
health care spending; none will even tolerate discussions that so much as hint at moving away
from the public payer nature of financing hospital care and physicians’ services. Indeed, the
Commission’s own mandate forbids us from recommending higher taxes or privatization,
though, as we have already noted, we believe that allows us to recommend more private-
sector involvement in the delivery of health care as long as the public payer model
remains intact.
Some Ontarians may grasp at the hope that economic growth or productivity gains will
generate the additional wealth needed to pay the bills for health care. As we will argue below
in more detail, this is highly unlikely and, in any event, no basis on which to make policy
decisions affecting the health care system years into the future. We cannot count on the magic
bullets of faster economic growth or rapid productivity gains to finance our health care needs
and wants. Nor, apparently, can we accept higher taxes, a reduction in other government
services or greater privatization to square the health care fiscal accounts.
1 The analysis in this chapter and many of the passages is drawn directly from “A Prescription for Canada’s Health System,”
Don Drummond’s Benefactors Lecture to the C.D. Howe Institute, Nov. 17, 2011, downloaded from http://www.cdhowe.org/pdf/Benefactors_Lecture_2011.pdf.

144
So if we cannot — in short — look to “easy” answers to the problem, we are left with hard
answers and difficult solutions. We are left with the challenge of reforming the health care
system to make it operate more efficiently and give us greater value for money. This is not
easy, especially not when every proposal for fundamental change is greeted in some quarters
by cries that medicare will be destroyed if Proposal X or Recommendation Y or Scenario Z is
adopted. The public debate in Canada has been poisoned in recent decades by a widespread
failure to comprehend the issues or trade-offs that must be made; by knee-jerk reactions to
worthy but complex ideas for change; by politicians (and media outlets) who have been too
willing to pander to fear-mongering; by stakeholders in the health care system who, wishing to
cling to the status quo, resist change; and generally by a lack of open-minded acceptance of
the reality that change is needed now and that money alone will solve nothing.
What we need is a broad revamping of the system that makes the parts work better together,
so that the whole is greater than — or at the very least equal to — the sum of the parts.
Such change is already underway in bits and pieces that address specific pressing needs. It is
being carried forward by health care providers in every corner of the system who recognize far
better than the politicians or the public what needs to be done and — perhaps more
importantly — what no longer needs to be done. Already, they are moving the system
incrementally towards the greater integration that is utterly necessary. What they need now
and in the years ahead is more encouragement from government and financial incentives that
will induce people and organizations to behave in ways that will produce a health care system
that better serves us all.
The vital first step is a long-term view of how the health system should change to meet the
needs of the future. The government must set out a 20-year plan with a vision that all
Ontarians can understand and accept as not only necessary but also desirable; a plan that
will, though it involves tough decisions in the short term, deliver a superior health care system
down the road.
The purpose of reform is not simply to save money, though that is a welcome consequence.
The purpose is to improve the quality of the system for the benefit of all Ontarians by shifting
from a system that was built mainly for acute care — and remains largely in that mode —
to a system built mainly for chronic care, which is where the aging of the population is driving
Ontario’s health care needs. We cannot emphasize strongly enough that quality of care and
efficiency are essential to any reform. Better care delivered smoothly and briskly across a
range of needs will benefit patients and providers alike; it will also save money in the long run.

Chapter 5: Health
145
Indeed, quality and efficiency go hand in hand. Too often, treatment delayed is treatment
diminished. The stroke victim who cannot gain immediate access to necessary physiotherapy
may suffer permanent damage, with long-term costs to the patient, the family and the health
care system alike. An efficient system would not let this happen. The elderly person who is
stuck in an acute care hospital bed is not getting the best care, which would be possible if he
or she should instead be transferred to a long-term care facility or sent home with appropriate
support. An efficient system would not let this happen either.
We will recommend a number of ways in which this can be done. Before we get to those
proposals, however, we will sketch out what we regard as the most salient facts about health
care and the perspectives that we bring to the issue.
Background
Health care is the Ontario government’s single biggest spending program. In 2010–11,
the province spent $44.77 billion on health, 40.3 per cent of its total spending on programs.
Based on current trends, this share is likely to expand to more than 44 per cent by 2017–18.
The cost of health care is driven by inflation, population growth, aging, new technology and
the increasing use of procedures like hip and knee replacements. Rising costs —
and questions as to its sustainability — have been a subject of intense public attention and
discussion for at least two decades now. Public opinion surveys consistently show that health
care is one of the biggest issues of concern for Ontarians and other Canadians. Every
provincial government will soon take action to rein in rising health care costs as part of their
efforts to return to balanced budgets. The federal government is also a key player; a 10-year
agreement under which it finances a portion of provincial government health care costs is due
to expire in 2014. The Canadian government has recently committed to grow the Canada
Health Transfer (CHT) by six per cent from now until 2016–17, after which it will grow in line
with a three-year moving average of GDP, with a three per cent floor. Shifting to the GDP-tied
rate, the CHT is estimated to grow by about four per cent per year in 2017–18 and beyond.

146
The focus on rising health care costs is easy to understand. Over the past decade, while the
Ontario government’s total revenue increased by only 4.0 per cent annually, its spending on
health care has risen by an average of 6.9 per cent per year.2 To a degree, these rapid cost
increases reflect some reinvestment following the restraint of the 1990s. Spending growth has
slowed in recent years. In 2010–11, the latest fiscal year, health spending expanded by only
3.7 per cent, its lowest annual rate of growth in a decade. In the latest three years, the growth
rate was 5.5 per cent per year, down from 6.6 per cent in the previous three years.
But recent studies suggest that the trajectory of ever-more-costly health care will moderate
only modestly if left to operate as it does now, not only in Ontario but in other provinces as
well. A 2010 report by TD Economics projected that Ontario’s public health care costs, in the
absence of significant reform, would grow by 6.5 per cent annually over the next two decades.3
Using a similar methodology, Dodge and Dion estimated 6.4 per cent cost increases across
Canada.4 Such increases will greatly exceed the growth of nominal GDP in Ontario and
Canada. In Ontario, as we explained in Chapter 1, The Need for Strong Fiscal Action, nominal
GDP may be on a trend growth rate of only 3.9 per cent per year, but revenues are likely to
grow more slowly. Ontario has made some progress in recent years; between 2007 and 2011,
according to comparisons made available by the Canadian Institute for Health Information
(CIHI), total Ontario government spending on health grew by an average of 5.1 per cent
annually, the second- lowest pace in Canada, and provincial spending per capita increased by
only 3.9 per cent, the second slowest in the country.5 Even so, in a “status quo” environment,
health care costs would absorb an increasing share of tax dollars.
2 This is the compound annual growth rate from 2000–01 to 2010–11. 3 Don Drummond and Derek Burleton, “Charting a Path to Sustainable Health Care in Ontario, 10 Proposals to Restrain Cost Growth
Without Compromising Quality of Care,” TD Economics, May 27, 2010, downloaded from http://www.td.com/document/PDF/economics/special/td-economics-special-db0510-health-care.pdf.
4 David Dodge and Richard Dion, “Chronic Healthcare Spending Disease: A Macro Diagnosis and Prognosis,” C.D. Howe Institute, April 2011, downloaded from http://www.cdhowe.org/pdf/Commentary_327.pdf.
5 Canadian Institute for Health Information, “National Health Expenditure Trends, 1975 to 2011,” October 2011. Calculations based on data in Tables B.4.1 and B.4.2; downloaded from http://secure.cihi.ca/cihiweb/products/nhex_trends_report_2011_en.pdf.

Chapter 5: Health
147
The Cost: Now and Ahead
We have outlined briefly (in Chapter 1, The Need for Strong Fiscal Action) some of the costs
of the health care system financed by the provincial government and the factors that drive
those costs higher. To recap, Ontario’s health care budget in 2010–11 was $44.77 billion,
or 40.3 per cent of everything the provincial government spends on programs.
In 2010–11, the big components of Ontario’s health care spending were:
Community Care, $2.68B, 6.0%
Prescription Drugs,
$3.45B, 7.7%
Long-Term Care Homes, $3.44B, 7.7%
All Other*, $7.76B, 17.3%
Doctors and Practitioners
$11.91B, 26.6%
Operation of Hospitals,
$15.53B, 34.7%
*May include Public Health, e-Health, Capital, Consolidations and the Ministry of Health Promotion and Sport (MHPS).
CHART 5.1 Major Components of Ontario Health Care Spending, 2010–11
Total: $44.77 billion
Sources: Ontario Ministry of Health and Long-Term Care and MHPS.
(i.e., payments under OHIP),
What, then, is the prognosis for the years ahead? It is relatively simple to extrapolate future
costs by examining the factors that drive health care spending. More people need more health
care and any increases in compensation for the people who work in the health care system
are cost drivers that affect all corners of the health care system. Ontario’s population can be
expected to rise by about 1.2 per cent annually in the years to 2017–18, while inflation
(mostly in the form of compensation) is likely to add another two per cent per year to the cost
of health care. New drugs and related technology will add another 1.5 per cent to the cost of
the drug programs. Yet another three per cent in annual cost increases will come from the
more intense use of health care, as new treatments become available.

148
Aging in general will add about one per cent per year to the cost of running hospitals and
community care, which, as we have seen, accounts for about two-fifths of health spending.
Because the government’s drug programs are aimed at the population aged 65 and over,
growth in that age cohort will add about 3.5 per cent annually to those programs. Similarly,
growth in the population aged 75 and over will add about 2.5 per cent per year to the cost of
supporting long-term care homes, which could mean that more long-term care beds would
need to be built — that is, unless we can more efficiently and effectively use home care.
In Denmark, where one-fifth of the population is over age 60, the government stopped creating
new long-term care beds in the late 1980s and instead focused on building a wide variety of
dwellings that are adapted for older people. Now, approximately 80 per cent of the elderly live
independently in the community, receiving home care, community social supports and
practical help around the house.6 Combined, drugs and long-term care account for just over
15 per cent of all costs in Ontario.
Aging is a significant cost driver, though its importance has been overblown in popular
discourse. Members of the large baby boom generation now range in age from about 45 to 65;
by 2018 — the limit of our horizon for this report — they will be 52 to 72. Even by then, most
boomers will not yet have reached an age when medical costs begin to rise sharply. It is
important to remember that the population ages gradually and health care costs also rise
gradually with patients’ age. Population aging is not the killer disease here.
In our Status Quo Scenario, the one that relies heavily on existing drivers to project the overall
cost of government programs, Ontario’s health care budget rises from $44.77 billion in
2010–11 to $62.46 billion by 2017–18, for an average annual increase of 4.9 per cent. This is
below the 5.5 per cent average of the most recent three years, but not by much. Moreover, its
share of total program spending — which would increase by 3.5 per cent annually — would
rise to 44.2 per cent from 40.3 per cent in 2010–11. In this scenario, the cost of OHIP would
rise by an average of 6.4 per cent per year, long-term care homes by 4.7 per cent, community
care by 4.4 per cent, drugs by 4.3 per cent and the operation of hospitals by 4.1 per cent.
In our Preferred Scenario, we have set out a much more modest path for health care
spending, one in which expenditures grow not by 4.9 per cent annually between now and
2017–18, but by 2.5 per cent. Since we are holding all program spending to an increase of
only 0.8 per cent per year, this means — ironically — that by 2017–18, health would account
for 45.4 per cent of all program spending. In recent years, such ratios have provoked concerns
that the health care system is unsustainable in its present form.
6 Dr. David A. Walker, “Caring for our Aging Population and Addressing Alternate Level of Care: Report Submitted to the Minister of Health
and Long-Term Care,” June 30, 2011; downloaded from http://www.health.gov.on.ca/en/public/publications/ministry_reports/walker_2011/walker_2011.pdf.

Chapter 5: Health
149
Is the Health Care System Sustainable?
Sustainability is a slippery concept that can be viewed from several perspectives.
One is public opinion. How do Ontarians see the issue? Do they think the status quo is
acceptable? What do they want from the health care system? What — and how much —
are they willing to pay? And how do they want to pay for what they want — from their own
pockets or through their tax dollars?
There are no straightforward answers to these questions, which depend on both public
attitudes and politicians’ reactions. To an economist, there is nothing particularly surprising or
alarming about health care rising as a percentage of public and private budgets. It is a classic
“luxury” good; as individuals and societies get richer, they wish to allocate a larger share of
their rising income to health care. Nobel prize-winning U.S. economist Robert W. Fogel
estimates that, in the long run, for every one per cent increase in income in the United States,
people will consume 1.6 per cent more health services. Fogel accordingly projects that health
care will roughly double its weight in U.S. GDP over the next three decades.7 So the issue is
not the direction of health care as a share of budgets, but rather by how much that share
will increase.
Polls offer some insight into public attitudes towards health care issues, but must be treated
cautiously. In an Ontario poll done in late 2010 by the Gandalf Group for the Healthcare of
Ontario Pension Plan, most people responded that they were prepared to pay more taxes and
see other public spending crowded out to preserve the health care system. However, there
are reasons to be skeptical of this result, which may apply more in theory than in practice.
Most people substantially underestimated both the public cost of health care and the rate at
which it is increasing. At the time the poll was conducted, health care accounted for just over
40 per cent of Ontario’s program spending. Yet nine per cent of respondents thought health
care was less than 20 per cent of the total, another 25 per cent said the figure was between
20 and 30 per cent, and a further 29 per cent said between 30 and 40 per cent.8 In short,
almost two-thirds of Ontarians underestimated — many of them wildly — health care’s share
of what their provincial government spends. How much weight should we attach to the public’s
view? Would their views change if confronted with the reality of what the current health
system costs?
7 Robert W. Fogel, “Forecasting the Cost of U.S. Health Care in 2040, National Bureau of Economic Research,” Working Paper 14361,
downloaded from http://www.nber.org/papers/w14361. 8 Detailed survey responses provided by the Gandalf Group, downloaded from
http://www.hoopp.com/symposium/docs/deficitdriven/hoopp_thinktank_pres.pdf.

150
A contrary finding comes from a polling summary prepared by the Canadian Health Services
Research Foundation (CHSRF), which revealed that only one-third of Canadians were
prepared to accept higher taxes, and less than one-quarter said they would accept a continued
squeezing out of other public services.9 Support for these remedies fell well short of a majority,
but even these minority views must be qualified: people did not say how big a tax increase
they would accept nor by how much other spending could be cut. Beyond higher taxes or cuts
to non-health spending, however, Canadians have given some thought to another way to pay
for health care. The CHSRF polling summary indicated that two-thirds of respondents were
prepared to accept a contributions-based savings plan to amass money for future health costs
such as long-term care and pharmaceuticals.
Even though Ontarians seriously underestimated the true cost to government of health care,
there is evidence that Canadians in general are increasingly worried about the sustainability
of health care spending. The CHSRF polling summary cited two questions that were asked in
surveys a decade apart. Respondents were first offered this statement: “Health costs will rise
gradually, but the increase will be manageable due to growth in the economy.” In 2000,
19 per cent of respondents agreed, but in 2010, only seven per cent did. The second
statement was: “The demand for health care will increase, but we will be able to contain costs
by operating the health care system more efficiently.” In 2000, 29 per cent of respondents
agreed; in 2010, only 14 per cent. In short, there had been a decline in public confidence that
a growing economy or greater efficiency gains can rescue the system.
Polling also reveals large gaps between how we run health care in Canada and what
Canadians say they want. A good example is the low public coverage of health care costs
other than physicians and hospitals. In 1997, according to the CHSRF polling survey,
94 per cent of Canadians said that if a physician prescribes a medication or vaccine, it
should be covered by a prescription drug plan. In 2006, 91 per cent of respondents said that
publicly insured services should be extended to home care, long-term care, mental health
care and drug benefits. Such moves have been recommended in many health care reports,
including the 2002 Romanow Commission and 2004 Kirby Senate Committee Report.
It appears there is an appetite, reinforced by expert opinion, for an expanded version
of medicare.
9 Stuart N. Soroka, (2011) “Public Perceptions and Media Coverage of the Canadian Healthcare System: A Synthesis,” Canadian Health
Services Research Foundation; released October 2011, downloaded from http://www.chsrf.ca/Libraries/Commissioned_Research_Reports/Soroka1-EN.sflb.ashx.

Chapter 5: Health
151
In Ontario, a few simple messages emerge from the polling results that do seem robust:
Ontarians regard health care as the single most important public policy issue; they are wedded
to the single, public payer model; and they will not tolerate anything that causes deterioration
in access and quality of care. Also, there now seems to be less concern that all services be
delivered under public administration, as long as the bill can be covered by an OHIP card.
Clearly, Ontarians want their health care system not only sustained, but also improved. Can
fears of unsustainability — that the system will not remain affordable — be eased by proposing
some of the more obvious — or at least most often cited — solutions? Again, unfortunately,
there is no straightforward response. Sustainability involves many moving parts; any number
of changes to the equation can render health care more sustainable or less so. Three of the
moving parts come to mind:
First, stronger productivity growth, by generating more economic growth, would make it
easier to afford more health care spending. But even if productivity growth doubled from its
low levels of the past decade, trend growth in nominal GDP would still fall far short of the
projected increases in health care spending. In any case, such an aggressive assumption
about productivity growth is mere wishful thinking since we have no ready answers on how
to revive it. Wishful thinking, needless to say, cannot be the foundation of a policy
response to the sustainability issue.
Second, we could afford more health care if we raised taxes, but tax rates would have to
rise persistently to keep the new revenue received above income growth. This might
generate voter tax fatigue and would inevitably result in broader economic losses as the
economic distortions induced by rising taxes magnified.
Third, we could restrain all other government spending severely to leave more room for
health care. But as TD Economics pointed out, status quo trends suggest that by 2030,
health care would account for 80 per cent of Ontario’s program spending. The remaining
20 per cent would not even cover the current education system, let alone any other
public services.

152
It goes almost without saying that these are not solutions; the status quo growth path of health
care spending needs to be curbed. At the same time, much of the Ontario health care system
not only can be improved, but calls out for improvement. It is easy to be smug when we
compare ourselves with the United States, which spends far more than Canada relative to
both its population and its GDP, yet in 2010 left almost 50 million people — over 16 per cent of
its population — uncovered by health insurance.10 If we compare ourselves to countries other
than the United States, however, we often come up short. We need to do more and we need
to do better — and we need to do both on a tight budget.
Hard Truths, Measures and Comparisons
It is easy — too easy — to restrict our focus to how much the Ontario government spends on
health and where the cash goes. Health care is about so much more than money that such a
blinkered approach is not helpful. Still, a few observations about spending on health care and
the resources devoted to it will establish some context before we broaden our approach to
non-financial issues.
The health care system is not really a system
Throughout this chapter, we have been referring to Ontario’s collection of health care
providers as a “system.” In reality, the province has a series of disjointed services working in
many different silos. The Ministry of Health and Long-Term Care (MOHLTC) must work with
its health care providers, administrators and stakeholders to co-ordinate roles, simplify the
pathways of care and improve the overall patient experience.
Consider the following scenarios presented to the Commission:
10 U.S. Census Bureau, “Income, Poverty, and Health Insurance Coverage in the United States: 2010,” September 2011, downloaded from
http://www.census.gov/prod/2011pubs/p60-239.pdf.

Chapter 5: Health
153
Case Study #1: A 50-year-old woman has a mammogram. The results go to her family physician, whose office calls and asks her to come in for the next available appointment, which is a week later. At the appointment, the family physician says the results are positive for cancer and that she will arrange for a needle aspiration. The family physician has trouble finding a radiologist to do the needle aspiration and it takes three weeks to have it performed. The radiologist then has difficulty finding the mammogram as it was done somewhere other than in his clinic, creating further delay. The aspiration shows suspicious cells and the family physician’s office calls the patient back and asks her to make another appointment to discuss the results. The family physician now wishes to do an MRI, and again there is difficulty getting it done in a timely fashion. Meanwhile, the patient is becoming frantic and taking a lot of time off work. When the MRI is done, the patient is again called back to the family physician’s office where the doctor tries to find a breast cancer surgeon to perform a biopsy as her preferred surgeon is on holiday. Three weeks later, the breast cancer surgeon performs the biopsy, which is found to be negative (i.e., cancer-free).
Case Study #1, What could happen: After a positive mammogram, the patient is referred electronically as a “Category 1” to a breast assessment centre. The patient goes online to her own record and links to the centre, where she can find and book an appointment at a time that suits her that is also within the Category 1 window for diagnosis and treatment. Through this online portal, the patient is also told how to prepare and what to expect at her appointment. When the patient arrives at the breast assessment centre within the proper time-frame set out by best practice guidelines, she sees a nurse practitioner expert and has her blood work done, a needle aspiration and an examination by doctor, all in one appointment. The patient then books her own followup appointment for four days later, which happens to be an early evening appointment so she can go after work. At the followup appointment, her results are discussed and are also available to the patient online, with email and text access to a registered nurse. That followup appointment avoids the unnecessary MRI and the patient is booked for biopsy. Again, the patient can see the results and discuss them immediately by email and phone.
What is most surprising is that both cases could happen in Ontario as it has the resources in
some areas of the province, but lacks the co-ordination. In Case Study #1, the “system” breaks
down, while losing sight of the patient experience as scheduling delays layer on top of one
another. In the alternate outcome scenario, the patient has control of the scheduling and is at
the centre of a standardized process.
We need to see the system proposed in the “what could happen” scenario become the
standard operating procedure for breast cancer diagnosis across the province. Comparable
systems could be developed for a host of conditions, including diabetes, chronic obstructive
pulmonary disease and kidney disease.
Ontario needs to integrate silos and reduce administrative red tape that impedes efficient and
effective service. That said, for the sake of simplicity, we will continue to use the term “system”
for the remainder of this chapter.

154
The health care system is costly
Canada has one of the costliest health care systems in the world, which may surprise people
who are too accustomed to comparing our record only to that of the United States. Canada
spent almost $193 billion on health care in 2010, or 11.9 per cent of GDP.11 In Ontario, where
total health spending was $75.5 billion, the share of GDP was 12.3 per cent, slightly higher
than the national average, but only the fifth highest of any province. This seems like a bargain
compared to the 17.4 per cent (in 2009) for the United States, but Canadians often fail to
recognize that the United States has by far the most expensive system in the world, making it
the major outlier in this and many other health care measures. It is not a useful comparator for
Canada.
Of the 34 countries covered in the latest health data from the Organization for Economic
Co-operation and Development (OECD),12 Canada had the sixth most expensive system in
2009, when it was tied with Switzerland. The second-ranked country (after the United States)
was the Netherlands, whose spending relative to GDP was only 0.6 percentage point over that
of Canada. This puts Canada in the group of developed countries with the costliest health care
systems. Worse, many of the other countries have older populations than Canada so, other
things being equal, our system should be less expensive because health spending rises
sharply with the age of the population. Adjusted for age, Canada definitely has one of the most
expensive systems.
The system is not as public as most people think
Ontarians, like most Canadians, focus almost exclusively on the public component of health
care, around which a robust mythology has grown. Our system is not as public as most
Canadians seem to believe. If a highly public system is a virtue, Canada looks good only
relative to the United States. The latest OECD data show that the public sector accounted for
70.6 per cent of all health care spending in Canada in 2009, much higher than the mere
47.7 per cent in the United States. But the other five G7 countries all have a higher public
share than Canada’s. Of the 27 OECD countries that reported such data for 2009, Canada
ranked 19th.13 Looked at from the other perspective, Canadians spent an average of $636
(U.S.) in out-of-pocket health payments for health, the fifth highest of 27 countries measured.
11 Canadian Institute for Health Information, “National Health Expenditure Trends, 1975–2011,” November 2011, pp. 118, 144, 146,
downloaded from http://secure.cihi.ca/cihiweb/products/nhex_trends_report_2011_en.pdf. 12 Organization for Economic Co-operation and Development, “OECD Health Data 2011 –– Frequently Requested Data,” November 2011,
downloaded from http://www.oecd.org/document/16/0,3746,en_2649_37407_2085200_1_1_1_37407,00.html. 13 In 2008, Canada ranked 23rd of the 32 countries for which there are data.
Chapter 5: Health
155
Canada’s health care system is at its most public when it comes to physician and hospital
services; 91 per cent of the former and 99 per cent of the latter are paid for by governments.
But according to the CIHI, the public sector covers only 46 per cent of prescription drug
expenditures; private insurance pays for 36 per cent and out-of-pocket expenses make up
the remaining 18 per cent. Public coverage of the cost of other professionals’ services is
meagre — a mere seven per cent. Essentially, the medicare system of which Canadians are
so proud covers medically necessary hospital and physician services, and little else. The list of
services not covered by medicare is long: out-of-hospital drugs, nursing, psychology and other
counselling, community mental health services, nutrition advice, ambulance services, addiction
treatment, long-term care, eye care and dental care.
The health care system is only part of the picture
We also need to get past our myopic focus on health care to a broader view of health more
generally. Health is much more than patching up people once something has gone wrong.
The Senate Subcommittee on Population Health14 estimated that only 25 per cent of the
population’s health outcomes can be attributed to the health care system on which we lavish
such attention. Half can be explained by socio-economic factors such as education and
income; another 15 per cent relates to biology and genetics, while the physical environment
accounts for the remaining 10 per cent. To bring about meaningful reform, we must bring all
these environmental factors into the equation. For example, strategic education interventions
may be more effective in reducing future health care costs than investments in hospitals today.
Yet amazingly, three-quarters of the influences that account for health outcomes barely
register in the health care debate.
The system does not produce superior results
Canadians consistently tell pollsters that they do not particularly care much about the cost of
health care — they simply want access and quality of care. The high cost of our health care
system could perhaps be forgiven if the spending produced superior results. It does not.
Canada does not appear in a favourable light on a value-for-money basis relative to other
countries. A 2010 report by the Commonwealth Fund15 ranked the quality of the health care
systems in Australia, Canada, Germany, the Netherlands, New Zealand, Britain and the
United States. Predictably, the United States came last. But Canada was second to last in
the overall ranking, second to last on efficiency and dead last on the timeliness of care.
14 Standing Senate Committee on Social Affairs, Science and Technology, Final Report of Senate Subcommittee on Population Health,
“A Healthy, Productive Canada: A Determinant of Health Approach,” June 2009, pp. 7–9, downloaded from http://www.parl.gc.ca/Content/SEN/Committee/402/popu/rep/rephealth1jun09-e.pdf.
15 Commonwealth Fund, “Mirror, Mirror on the Wall: How the Performance of the U.S. Health Care System Compares Internationally, 2010 Update,” p. 3, downloaded from http://www.commonwealthfund.org/~/media/Files/Publications/Fund%20Report/2010/ Jun/1400_Davis_Mirror_Mirror_on_the_wall_2010.pdf.

156
We have fewer physicians than other jurisdictions
Numerous studies suggest that we do not have enough medical doctors. The CIHI concluded
that fewer physicians per capita in Canada “may lend insight into why Canadians continue to
report difficulties in accessing health care when compared to other countries.”16 According to
the World Health Organization, among the countries in the Commonwealth Fund report, only
Australia has fewer physicians per capita. At 19 physicians per 10,000 people, Canada
compares unfavourably to the United States at 27 and especially to the continental European
G7 countries where most are well into the 30s. On the basis of raw data, Canada is in the
middle of the OECD pack on physicians per capita. Yet in a 2008 report,17 the Fraser Institute
calculated that adjusting for population age, Canada tied for 23rd out of 28 comparable OECD
countries on physicians per capita. And Canada seems to be falling behind: 24 OECD
countries increased their physician-to-patient ratio by at least 10 per cent from 1990 to 2008
whereas the ratio only improved five per cent in Canada.18 Further, 22 per cent of Canadian
physicians are over age 60 so there is a pending wave of retirement.19 The effectiveness of
physicians is also constrained in Canada because of their low use of electronic records.
The Commonwealth Fund report found that only 37 per cent of Canadian physicians used
electronic records to serve their patients, the lowest rate among the 11 countries studied.
The trends in Canada since 1990 are still heavily influenced by cutbacks of the 1990s.
During the past decade, however, the number of most health practitioners has grown.
According to CIHI, the number of physicians graduating from Canadian medical schools
climbed by almost 50 per cent between 1999 and 2009. Between 2001 and 2008, there was
an increase of 16 per cent in registered physicians and 15 per cent in registered nurses;
between 2004 and 2008, the number of nurse practitioners grew by 90 per cent.20
These statistics appear to make a definitive case that we have not only fewer doctors than
elsewhere, but too few doctors in absolute terms. This may not be the case. It may simply be
that we do not make efficient use of their time. Suppose that nurses relieved doctors of the
task of giving most vaccinations. Suppose that a full set of electronic records enabled an
elderly person to stop making multiple visits to different doctors, explaining his or her ailments
again and again. Suppose that pharmacists played a greater role in issuing prescriptions.
These and other changes could free up enough physicians’ time, perhaps by enough to
reduce, if not eliminate, any “shortage” of doctors.
16 Canadian Institute for Health Information, “Health Care in Canada, 2010,” p. 85, downloaded from
https://secure.cihi.ca/estore/productSeries.htm?pc=PCC64. 17 Fraser Institute, “How Good is Canadian Health Care? 2008 Report,” p. 55, downloaded from
http://www.fraserinstitute.org/research-news/display.aspx?id=13104 18 CIHI, “Health Care in Canada, 2010,” op. cit., p. 85. 19 Ibid., p. 84. 20 Ibid., pp. 82–84.

Chapter 5: Health
157
Canada falls short on many measures
The 2008 Fraser Institute report, while acknowledging the difficulty of comparing health
outcomes across countries with universal access, publicly funded, health care systems found
that “Canada, while spending more on health care than any other industrialized country in the
OECD save Iceland and Switzerland, ranks seventeenth in the percentage of total life
expectancy that will be lived in full health, ranks twenty-fourth in infant mortality and
seventeenth in prenatal mortality, ranks sixth in mortality amenable to health care, ranks tenth
in potential years of life lost to disease, ranks tenth in the incidence of breast cancer mortality,
and ranks second in the incidence of mortality from colon cancer.”21
But Ontario’s is the best system in Canada
Internationally comparable data are usually based on Canadian averages. But there is some
evidence that on important matters Ontario has one of the best or even the best system within
Canada. For example, the Frontier Centre ranks Ontario as having the best system according
to its overall Consumer Index of Health,22 although British Columbia and New Brunswick are
very close. The relative strength of Ontario is in primary care and problem prevention.
In particular, the Frontier Centre notes that “a large number of Ontarians have regular access
to a family doctor.”23 However, the Centre hastens to add that “all 10 provinces have
significant work to do to achieve the much shorter health care wait times that exist in top
European countries such as Germany, France and the Netherlands.”24
21 Fraser Institute, op. cit., p. 8. 22 Frontier Centre, “Canada Health Consumer Index 2010,” December 2010, p. 17, downloaded from
http://www.fcpp.org/files/1/PS98_CHCI-2010_DC13_F!B.pdf. 23 Ibid., p. 21. 24 Ibid., p. 29.

158
Drug costs are growing faster than other health spending
Pharmaceuticals have been the fastest-growing component of health care costs in recent
decades. Stabile and Greenblatt note that from 1975 to 2006, inflation-adjusted spending per
capita on hospitals rose 51 per cent, the cost of physician services rose 98 per cent and
pharmaceutical costs went up 338 per cent.25 The same report documents that the cost of
prescription drugs exceeded overall growth for health care spending in every year from
1986 to 2007.26 Busby and Robson found that the Ontario Drug Plan (ODP) now constitutes
10 per cent of Ontario’s health spending — $4.5 billion in 2010 — and has grown by
9.4 per cent per year over the past 20 years.27 About three-quarters of the cost relates to
drugs for seniors, who make very low co-payments; singles with income over $16,018 and
couples with income over $24,175 pay an annual deductible of $100 and a $6.11 dispensing
fee per prescription, while lower-income seniors pay no deductible and $2.00 per prescription.
Both sets of researchers wrestled with the issue of how fast drug costs will grow in future.
On the positive side, many prescription drugs will soon be coming off patent protection so
some argue that cost increases will moderate. Indeed, at less than five per cent, drug costs
had one of the lowest rates of increase in 2010 in many decades. However, drug use is
heavily concentrated in the elderly, and new drug discoveries could push the cost curve back
up. Stabile and Greenblatt looked at scenarios with drug costs rising four, six and eight
per cent annually. At eight per cent growth, still less than in the recent past, drugs would go
from 0.62 to 8.6 per cent of GDP in 50 years. Busby and Robson project ODP costs to rise
8.4 per cent per annum over the next 20 years, just slightly less than the 9.4 per cent pace of
the past 20 years.
In its 2010 Survey of Canada, the OECD noted that Canadian generic drug prices are the
highest in the OECD, even higher than in the United States and twice as high as in Finland.
It is not surprising then that Ontario took decisive action in 2010 to lower generic drug prices
to 25 per cent of brand prices. Other provinces are taking similar steps.
25 Mark Stabile and Jacqueline Greenblatt, “Providing Pharmacare for an Aging Population: Is Prefunding the Solution?” IRPP Study,
February 2010, p. 9, downloaded from http://www.irpp.org/pubs/IRPPstudy/IRPP_Study_no2.pdf. 26 Ibid., p. 7. 27 Colin Busby and William B.P. Robson, “A Social Insurance Model for Pharmacare: Ontario’s Options for a More Sustainable,
Cost-Effective Drug Program,” C.D. Howe Institute, April 2011, downloaded from http://www.cdhowe.org/pdf/Commentary_326.pdf.
Chapter 5: Health
159
There are inefficiencies in the health care system
The Canadian Institute for Health Information’s Health Care in Canada 2010 report discusses
a number of examples of inefficiency in the Canadian health care system. For example,
despite lack of evidence of benefit, 3,600 therapeutic knee arthroscopies and 1,050
vertebroplasties were performed in Canada in 2008–09.28 At 19 per cent of all deliveries,
caesarean sections far exceed clinical guidelines, as does the continuing widespread practice
of hysterectomy.29 Compared with other countries, Canada does poorly on avoidable hospital
admissions for diabetes. The OECD noted in its 2010 Canada Survey that hospitalizations in
Canada for diabetes per 100,000 people are above the OECD average. The CIHI draws the
link to the observation that only 32 per cent of diabetics reported receiving all four
recommended tests in 2007. 30 This illustrates the shift that is needed from hospital-based
treatment to clinic and home-based prevention.
Many hospital beds are occupied by patients who could get better quality care at a lower
overall cost elsewhere in the system. The CIHI tracks what is known as alternate level of
care (ALC), which refers to patients who occupy hospital beds but no longer need acute
care services — “bed-blockers,” in popular parlance. In 2008–09, five per cent of
hospitalizations and 13 per cent of all hospital days were ALC.31 It is understandable to a
degree that patients would end up classified as ALC near the end of their hospital stay.
But nine per cent of ALC patients were admitted to acute care as ALC and they account for
11 per cent of ALC days. The most common reasons for patients being in ALC status is that
they seek palliative care (34 per cent), are waiting for admission to another adequate facility
(27 per cent) or seek physical therapy (11 per cent). These ALC patients tend to stay that way
for a long time — 62 per cent stay more than a week and 24 per cent more than a month. Five
per cent stay even longer than 100 days.
Case Study #2: After the death of his wife, the family of a 76-year-old man decided to move their father closer to their home, which was 250 kilometres away. After noticing some dementia, he was moved into the family home where the dementia worsened to the point where the family brought him to the local hospital emergency department. Home care could not be given for more than two days per week. He was admitted directly to a hospital unit where steps for placement into a long-term care facility were taken. He was in an ALC hospital bed for 115 days awaiting placement because the long-term care homes did not consider him suitable despite the fact that they had empty beds.
28 CIHI, “Health Care in Canada,” 2010, op. cit., pp. 22–24. 29 Ibid., pp. 25–35. 30 Ibid., pp. 43–45. 31 Ibid., pp. 49–54.

160
The results of this inefficiency include people in hospital beds who could be better cared for
elsewhere, crowding of emergency facilities, cancellations of surgeries because beds are not
available and a clogging of ambulance services bringing people to and from hospitals.
These are classic symptoms of a system built for acute care at a time when the needs have
shifted more to chronic care. It must be noted that in Ontario, which has one of the country’s
highest levels of ALC (such patients occupy seven per cent of hospital beds, compared with
five per cent nationally), the government introduced its Aging at Home Strategy in 2007,
designed in part to reduce the number of ALC patients. More recently, Ontario wisely
commissioned a study by Dr. David Walker, who made recommendations (we will return to
these later) on ALC and steps that should be taken to shift the health care system towards
caring for an older population.32
The OECD researchers who took a stab at measuring inefficiency costs in health care systems
came to a startling conclusion about this country. They estimated that if Canada became as
efficient as the best-performing countries, there would be a saving in public health care costs
of 2.5 per cent of GDP in 2017.33 Securing such efficiency gains would not permanently lower
the growth of health care costs, but could certainly do so over the transition period.
The OECD suggests that Canada as a whole “wasted” $40.6 billion of the $136.9 billion that
the public sector spent on health in 2010; the comparable figure for Ontario, if the 2.5 per cent
figure also holds true for the province, would be $13.4 billion in “waste” out of $47.8 billion in
total public spending. In other words, efficiency gains would amount to almost 30 per cent of
public-sector spending in 2010.34 Of course, measuring inefficiency, especially by comparing
differing international systems, is very difficult, so we must be cautious in interpreting the
OECD figure. Further, it simply may not be feasible to eliminate or even substantially reduce
the figure. That said, it is not a large leap to presume that if we could remove as little as 10 per
cent of this inefficiency over the next 10 years, public health care spending could be restrained
to a very low growth rate over that period.
32 Walker, op. cit. 33 Organization for Economic Co-operation and Development. “Healthcare Systems: Efficiency and Policy Settings 2010,” downloaded at
http://www.oecd.org/document/39/0,3343,en_2649_33733_46491431_1_1_1_1,00.html. 34 Calculations based on CIHI, “National Health Expenditure Trends, 1975–2011,” op. cit., Table 4.

Chapter 5: Health
161
A broader perspective can be taken on efficiency of health care by considering the cost
savings possible through improving various lifestyle patterns that have health implications.
The Conference Board of Canada estimated that improving the levels of key risk factors such
as obesity, smoking rates and hypertension would have delivered cumulative cost savings of
$76.4 billion over the 2005–10 period.35
Other reports have estimated efficiency gains. For example, a study by the Canadian Centre
for Policy Alternatives36 estimated that a national pharmacare plan would save between
10 and 42 per cent of total drug expenditures. Yet, no federal attention has been directed at
this question. The issue was hardly raised during the 2011 federal election, nor did it emerge
in any of the many provincial elections over the remainder of 2011.
The conclusion from all this research seems inescapable. The Canadian health care system
does not deliver great value for money when judged from a broader international perspective.
We can and should do better. In brief, despite the public’s relative satisfaction, the system is
showing distinct signs of ill health today.
Complex cases drive costs
Any system designed to address the needs of the majority of the population will be
overwhelmed and diverted by the special needs of the truly complex and expensive cases.
About one per cent of Ontario’s population accounts for 49 per cent of hospital and home care
costs, and 10 per cent of the population accounts for 95 per cent of such costs, according to a
2010 study by the Canadian Health Services Research Group (CHSRG).37 The Institute for
Clinical and Evaluative Sciences (ICES) looked at system-wide health care costs (excluding
in-patient mental health and non-fee-for-service physician costs) and found a similar trend:
one per cent of the population accounts for 34 per cent of costs and 10 per cent accounts for
79 per cent of system-wide costs.38 As a point of comparison, the Journal of the American
Medical Association recently published an article stating that about 10 per cent of the U.S.
population consumes about 64 per cent of health care expenditures.39
35 Conference Board of Canada, “The Canadian Heart Health Strategy: Risk Factors and Future Cost Implications,” February 2010, p. 17,
downloaded from http://www.conferenceboard.ca/e-library/abstract.aspx?did=3447&goal1=AUTHN. 36 Marc-André Gagnon and Guillaume Hébert, “The Economic Case for Universal Pharmacare: Costs and Benefits of Publicly Funded Drug
Coverage for All Canadians,” Canadian Centre for Policy Alternatives, September 2010, downloaded from http://www.policyalternatives.ca/publications/reports/economic-case-universal-pharmacare.
37 C. Preyra, “Realizing the Health Based Allocation Model,” PowerPoint deck provided by Mr. Preyra, 2010, p. 37. 38 W. Wodchis, P. Austin, A. Newman and A. Corallo, “High Cost Users of the Ontario Health Care System: Preliminary Analyses,” 2011,
PowerPoint deck provided by ICES, p. 3. 39 E.J. Emanuel, “Where Are the Health Care Cost Savings?” JAMA 307 (Jan. 4, 2012), no. 1. pp. 39–40.

162
If the province can find efficiencies that reduce these costs by even just 10 per cent, that could
amount to at least $1.5 billion a year in savings,40 a portion of which could be achieved
through better co-ordination of services.41 A much deeper analysis undertaken by Bridgepoint
Health and Boston Consulting Group in 2011 suggests that the savings achieved through
better co-ordination of care in Ontario could be even greater, in the realm of $4 billion to
$6 billion per year.42 However, these special cases need to be handled strategically.
Who are the people in this one per cent category? They are people who are frequently in and
out of our health care system, constantly being admitted to, discharged from, and then
readmitted to hospitals. In the CHSRG’s analysis, these were most likely patients with
circulatory and respiratory system issues, cancer, injuries or poisoning (frequently from post-
surgical complications resulting from either infections or device failures). Heart failure is the
most common reason for people in this one per cent category to be admitted to hospital.
These heart failure patients have a readmission rate of 33 per cent and are most likely to be
readmitted within 10 days of being released from hospital.43 If a person is seen by a health
provider within two days of being released from hospital, studies have shown that their
probability of being readmitted drops by at least one-third. What matters is not merely the
intervention itself, but the timeliness with which it is carried out.
There is also proof that home-based care can reduce readmissions for heart failure.44,45 British
studies suggest that “telemonitoring of vital signs and symptoms facilitate early detection of
deterioration and reduce re-admission rates and length of hospital stay in patients with heart
failure.”46 These interventions are simple and already available to Ontarians.
40 Ontario spent $44.8 billion last year on health. Using the ICES figures, 34 per cent of $44.8 billion is $15.2 billion, so a 10 per cent
reduction in costs would be $1.5 billion. 41 W. Wodchis et al., op. cit., p. 21. 42 Bridgepoint Health and Boston Consulting Group, “Improving Value in Managing Patients with Complex Chronic Disease,” PowerPoint
deck provided by Bridgepoint Health, 2011. 43 C. Preyra, op. cit., p. 41. 44 S. Stewart, A.J. Vandenbroek, S. Pearson and J.D. Horowitz, “Prolonged Beneficial Effects of a Home-Based Intervention on Unplanned
Readmissions and Mortality Among Patients with Congestive Heart Failure,” Arch Intern Med 159 (Feb. 8, 1999), no. 3, pp. 257–61. 45 Preyra, op. cit. 46 A.A. Louis, T. Turner, M. Gretton, A. Baksh and J.G. Cleland, “A Systematic Review of Telemonitoring for the Management of Heart
Failure,“ Eur J Heart Fail 5 (2003), no. 5, pp. 583–90.

Chapter 5: Health
163
However, this is only part of the answer to the one per cent question. Analysis of a Local
Health Integration Network’s (LHIN) 2006–07 billing data done on behalf of MOHTLC revealed
that one subset of hospital inpatients accounted for 40 per cent of all hospital bed days.47
These patients were identified as “complex inpatients,” meaning they did not have just one
health condition but many at once, often including mental health or addiction issues. Strikingly
similar results are found in British Columbia. “Remarkably, over 80 per cent of frequent users
of BC’s health care system had at least six different types of illness, and almost one third
actually had ten or more illnesses, compared with only a small minority of other users.”48 In
Ontario, 80 per cent of all ALC bed days were used by these complex patients, spending an
average of 72.9 days in hospital in 2006–07. As a comparison, the average stay for a non-
complex patient was 6.3 days over the same period. Over half of these patients also tend to be
over age 75 and one-third are discharged from the hospital to another facility (most likely a
long-term care home). Another third are discharged to the community without support
services.49 Similar interventions to those mentioned above could have a great impact when
caring for these patients. Adding to this issue are other social determinants of health such as
poverty, social isolation and illiteracy, which can further increase the need for intervention.
Interestingly, when you look at the patients that used emergency rooms (ERs) most often in
the LHIN analyzed by MOHLTC the profile changes significantly. More than half were under
age 45. These “at-risk” patients accounted for 20 per cent of all ER visits and made over four
visits a year, some over 20 in one year. Even more intriguing is the level of severity of their
medical issues (also known as “acuity” in ERs). Though one might expect that the reason for
frequent visits to the ER was the need for surgery or some other complicated intervention,
these patients were no more likely to be an urgent case than an average, everyday visitor to
the ER. Instead, a strong underlying contributor to frequent visits to the ER appears to be
mental health and addiction issues.50
47 J. Lawson, “High User Analysis,” 2008, PowerPoint deck provided by Mr. Lawson. 48 R.J. Reid, R.G. Evans, M.L. Barer, S. Sheps, K. Kerluke, K. McGrail, C. Hertzman and N. Pagliccia, “Why Do Some People Use So Much
Health Care?” 2003, University of British Columbia Research Brief downloaded from http://www.chspr.ubc.ca/files/publications/2003/chspr03-06S.pdf.
49 It should be noted that in this group it may have been the case that support services were not needed. 50 Lawson, op. cit.

164
Case Study #3: An 80-year-old woman lives alone, has diabetes, arthritis, a colostomy from a previous bout with bowel cancer and is a little forgetful. She has trouble getting an appointment with her family physician as the phone system is tiered and confusing (“press 1 for this, 3 for that”). Her daughter who lives far away gets her an appointment when she visits. The mother trips on a rug one evening and falls, breaking her wrist. She cannot get up and is found the next day by a neighbour and is taken to the ER. She gets a cast on her wrist, but feels unable to go home alone. As a result, she is admitted after spending 36 hours on a gurney in the ER. Due to a mixture of pain medications, sleeplessness and unfamiliarity, the patient gets confused and is prescribed anti-psychotics. She then gets C. difficile and is placed in isolation. The daughter is advised that her mother needs a nursing home (LTC) bed. The daughter’s wish for her first choice of an LTC home and the C. difficile, now complicated by the patient calling out in the middle of the night, result in the patient being on a waiting list for weeks. Eventually the patient gets to the LTC home, where the cancer returns. The patient is sent back to the hospital, where she dies.
Case Study #3, What could happen: The patient is identified by the family physician’s office five years before as being at risk for complications due to her multiple ailments. She is visited by the nurse practitioner from the Community Care Access Centre (CCAC) and Family Health Team (FHT), and receives a full assessment of her capabilities, which are all done in her home. An occupational therapist visits and arranges for a variety of changes to the apartment to reduce risk and increase safety. The patient is seen, with her daughter, by a multidisciplinary assessment team that advises on best practices in management of her various conditions, including her early Alzheimer’s disease. The CCAC and community social service agencies, in co-ordination with the FHT, provide a variety of services to assist with bathing, meals and social interaction and provide an alarm system in case of trouble. The patient now has an identified case manager who texts the daughter regularly. A registered nurse from the FHT visits once every two weeks to oversee her medications and follow progress. The patient also has a regular appointment with the FHT to see the registered nurse and the family physician, where she also sees a behavioural expert registered nurse. The patient does not fall. When the cancer returns, it is identified at a regular visit to the FHT and home-based palliative care is arranged. The patient dies at home.
In the alternate outcome of the above case study, the family physician undertakes a
cross-disciplinary core assessment and risk identification process, including a mental health
check. Based on what we know about patients needing complex care, the physician would be
quickly overwhelmed if he were left to be the lone individual responsible for co-ordinating care.
Interprofessional team-based care, with care managers for the most complex patients,
is essential to ensure that appropriate transition and supports are in place to mitigate the risk
of readmission. Taking this step further, complex patients need to be engaged through
their care providers to develop strategies to cope with loss of ability, set goals for recovery,
and prepare them to rebuild their lives. Helping complex patients to live with the fewest
restrictions and least risk is central to maintaining their dignity and connections with
their community.

Chapter 5: Health
165
Mental health and addiction issues are also cost drivers
As with complex cases, the effects of mental health and addiction on our health care system
should not be underestimated, nor should the ripple effects felt in the justice, educational and
social services sectors. In 2000, the economic costs of mental health and addiction issues
were estimated to be $33.9 billion. Eighty-five per cent of these costs ($28.7 billion) came from
a loss of productivity, while the remaining $5.2 billion were due to costs of hospitalizations,
community mental health and substance abuse programs, law enforcement, supportive
housing, fire losses and capital costs, to name a few.51 More recent estimates of the economic
costs of mental health and addiction are pegged at $39 billion annually, with productivity
losses accounting for 74 per cent of the costs.52 Again, even a 10 per cent reduction in health
care costs gained by developing a more efficient system could present at least $3 billion per
year in savings to the Ontario economy and deliver better care for these patients.
“At-risk” ER patients are more than four times more likely to have mental health and addiction
issues (the mix of the two is called a “co-morbidity”) than other patients visiting the ER.
Complex inpatients are three times more likely.53 As a step towards relieving the pressure felt
by ERs from patients with mental health and addiction issues, more walk-in clinics and FHTs
should be equipped with counselling clinics.54
51 W. Gnam, “The Economic Costs of Mental Disorders and Alcohol, Tobacco, and Illicit Drug Abuse in Ontario, 2000,” 2006, Centre for
Addiction and Mental Health Fact Sheet, downloaded from http://www.camh.net/Research/Research_publications/COI%20FACT%20SHEET_revisedfinal.pdf.
52 Ministry of Health and Long-Term Care, “Every Door is the Right Door: Towards a 10-Year Mental Health Strategy,” 2009, p.16. 53 Lawson, op. cit. 54 Family Service Ontario, “Walk-In Counselling Clinics: A Powerful Relief Valve for Pressure on Ontario’s Health Care System,” 2011.
166
Mental health and addiction issues, including co-morbidities, have been the subject of many
recent consultations and reports,55 including that of the Ontario legislature’s Select Committee
on Mental Health and Addictions, which reported in August 2010.56 The committee noted
that “mental health and addictions services are funded or provided by at least 10 different
ministries. Community care is delivered by 440 children’s mental health agencies,
330 community mental health agencies, 150 substance abuse treatment agencies, and
approximately 50 problem gambling centres.” Like the Commission, the Select Committee
was surprised to discover “that no one person or organization is responsible for connecting
these various parts, or “breaking down the silos” as we so often heard. There is also no single
organization responsible of ensuring that mental health and addictions services and supports
are delivered consistently and comprehensively across Ontario.”57
Further, there is a need to link the health system and social service planning, including youth
protection services, more effectively to serve mental health and addiction patients better.
In June 2011, MOHLTC released “Open Minds, Healthy Minds, Ontario’s Comprehensive
Mental Health and Addictions Strategy” in response to the Select Committee’s observations.
The strategy includes a plan to focus on quality improvement, early intervention and improved
service integration for mental health and addiction patients. In addition, it addresses other
significant underlying causes of poor health outcomes in Ontarians: the social determinants of
health such as poverty and access to care.58
Health care: how it works now and how it should work in future
Canada’s health system, and that of Ontario, developed to deal with acute care and largely
remain in that mode. First, the focus is on patching up people after a health problem has
struck rather than taking a broader approach that might prevent problems or at least mitigate
the effects. Further, the system is designed to bring the patient to the practitioner, often in
a hospital setting. Medicare pays the bills for physicians and hospitals, but little else.
55 Some recent reports include “Wired for Success: An Ontario Brain Strategy,” Neurological Health Charities Canada (December 2010);
“Respect, Recovery and Resilience,” Minister of Health and Long-Term Care’s Advisory Group (December 2010), downloaded from http://www.health.gov.on.ca/en/public/publications/ministry_reports/mental_health/mentalhealth_rep.pdf, and “Every Door is the Right Door: Towards a 10-Year Mental Health Strategy,” MOHLTC (July 2009), all of which are available online.
56 Select Committee on Mental Health and Addictions, “Navigating the Journey to Wellness: The Comprehensive Mental Health and Addictions Action Plan for Ontarians,” downloaded from http://www.ontla.on.ca/committee-proceedings/committee-reports/files_pdf/Select%20Report%20ENG.pdf.
57 Ibid, p. 3. 58 Ontario Ministry of Health and Long-Term Care, “Open Minds, Healthy Minds, Ontario’s Comprehensive Mental Health and Addictions
Strategy,” June 2011, p. 4, downloaded from http://www.health.gov.on.ca/english/public/pub/mental/pdf/open_minds_healthy_minds_en.pdf.

Chapter 5: Health
167
Today, however, the key health issues are increasingly shifting to chronic care questions,
in good part because the population is aging, but also because some lifestyle problems such
as obesity are creating particular health conditions such as adult-onset Type 2 diabetes. In
most chronic care cases, home care is more efficient and of better quality. Yet there has been
no national intergovernmental approach to home care since the federal-provincial discussions
around the Health Accord in 2004. Neither has there been a national approach to long-term
facility-based care for the elderly — a related issue — even though this is where the current
and future pressures lie. There have been some provincial initiatives, however. Ontario’s
Aging at Home Strategy, launched in 2007, provides services for seniors and caregivers to
enable them to remain in their homes. The OECD projects that the total public and private
costs of long-term care will more than double from an estimated 1.4 per cent of GDP in 2006
to 3.3 per cent by 2050.59
What Is the Opportunity?
The ideal health system would put more emphasis on preventing poor health. It would be
patient-centric and would feature co-ordination along the complete continuum of care that a
patient might need. Primary care would be the main point of contact with patients, with much
of the co-ordination across caregiving done through the administration of regional health
authorities. There would be much less emphasis on treating patients in hospitals, which are
costly and expose people to contagious diseases while yielding poor patient satisfaction. To a
much greater degree, care would be provided by primary care facilities, through better
information and in the case of chronic health issues, in the home or long-term care facilities.
The system would allow all professionals to exercise the full scope of their skills in their work;
nurses, for example, would do what they could competently do, like administer vaccines, and
nurse practitioners could provide high-quality management of chronic illnesses like diabetes
and high blood pressure.
In this ideal system, payment schemes and information gathering would be aligned to support
the patient-centric notion. Compensation for hospitals and physicians would be more closely
tied to outcomes of health rather than to the inputs or services. Data would be gathered on the
actual total cost of looking after a patient rather than the present system of collecting data for
separate portions of the system; even then, current data are actually based on government
reimbursement rates rather than true costs.60
The current system and an ideal reformed system are laid out in the following charts.
59 OECD, “Help Wanted? Providing and Paying for Long-Term Care, 2011,” based on data in Table 2.2, p. 80, downloaded from
http://www.oecd.org/document/23/0,3746,en_2649_37407_47659479_1_1_1_37407,00.html#data. 60 There is a good discussion of management and data issues in a patient-centric system in Robert S. Kaplan and Michael E. Porter,
“The Big Idea: How to Solve the Cost Crisis in Health Care,” Harvard Business Review, September 2011, downloaded from http://hbr.org/2011/09/how-to-solve-the-cost-crisis-in-health-care/ar/1.

168
General Approach
Intervention after a problem occurs Acute care Hospital-centric Silos Resource-intensive minority of patients in regular
system Accept socio-economic weaknesses Extraordinary interventions at end of life
Health promotion Chronic care Patient-centric Co-ordination across a continuum of care Dedicated channels for the resource-intensive
minority Address socio-economic weaknesses Pre-agreements on end-of-life care
Hospitals
Draw patients to hospitals Historical cost plus inflation financing Managed through central government Homogeneous, all trying to offer all services
Keep patients out of hospitals Blend of base funding and pay-by-activity Regional management Differentiation and specialization along with
specialized clinics
Long-Term Care, Community Care and Home Care
Not integrated, underfunded and weight on long-term care
Integrated with weight on home care
Physicians and Other Professionals
Not integrated with hospitals and other sectors Work alone or in groups Mostly fee-for-service funding Few standards for medical approaches/conduct of
practice Unclear objectives and weak accountability Inefficient allocation of responsibilities
Integrated with primary care being the hub for most patients
Work in clinics Blend of salary/capitation and fee-for-outcomes Evidence-based guidelines (through quality
councils) Objectives from regional health authorities and
accountability buttressed by electronic records Allocation in accordance with respective skills and
costs; and where feasible shifting services to lower-cost care-providers
Pharmaceuticals
Little cost discipline from governments Cost of plans to private employers driven in good
part by employees
Cost discipline through purchasing power, guidelines for conduct of practice
Greater control exercised by employers
Transforming to Reformed System Current System

Chapter 5: Health
169
Service Delivery
Mostly public sector Blend of public and private sector (within public payer model)
Information Technology
Little used by physicians and especially across the system
Information conveyed in doctors’ offices
Extensive use that is key to co-ordination across system and accountability
Information more easily available and conveyed through multiple sources (phone, Internet, etc.)
Medical Schools
No attention to system (cost) issues Little attention to labour supply issues
Course(s) on system issues Role in directing physicians to areas of demand
(by area of medicine and geographically)
Coverage of Public Payer Model
Hybrid with almost 100 per cent primary, less than half of drugs and limited mental health
Broader coverage widely recommended but not at all clear this will be acted upon
The ideal system begins with a general approach to health care and moves through the major
elements of the system — hospitals, long-term care and home care, physicians and other
professionals, pharmaceuticals, services delivery (public or private), information technology,
medical schools and coverage of the public payer model. Before we get to a more detailed set
of recommendations, here is a summary of the kind of changes we seek.
We have already sketched out the general approach — a shift towards health promotion
rather than after-the-problem treatment; a system centred on patients rather than hospitals;
more attention to chronic care rather than a primary focus on acute care; co-ordination across
a broad continuum of care rather than independent silos that allow too many people to fall
between the cracks; and new ways of dealing with the small minority of patients who require
intensive care.
Transforming to Reformed System Current System

170
Rather than draw patients into hospitals for care, we should strive to direct patients to the
most appropriate care setting for their problem — whether it is a doctor’s office, family care
centre or clinic, rehabilitation centre, long-term care centre or back home. Hospital financing,
traditionally based on historical costs and inflation, should move to a blend of base funding
and pay-by-activity, which would recognize the work of hospitals that take on the toughest and
most expensive cases. This would accompany a shift from hospitals that try to offer all
services to greater differentiation and specialization to reduce overlap and concentrate
expertise. A further transfer of management from the government to regional authorities
should accompany this.
Physicians and other professionals tend to work alone or in small groups where they are
not integrated with other sectors of the health care system; better that they become the
primary care hub for most patients by working in clinics that offer a variety of services and are
well connected with other parts of the care system. And rather than be paid primarily on a
fee-for-service basis, doctors should get a blend of salary, capitation (an annual fee for care of
a particular patient) and fee-for-outcomes. (Already across Canada, alternative payment
methods that include salary and capitation rather than pure fee-for-service account for
27 per cent of total clinical payments to physicians.) A recent report prepared by John Manley,
William Anderson and Peter Barnes for the Ontario Hospital Association recommends that the
compensation of hospital CEOs and senior executives should be tied to performance on
strategic hospital priorities. Further, performance pay should be linked to achieving strategic
health outcomes for each region across all types of health service providers in CCACs,
LTC facilities, FHTs, Community Health Centres and public health units. The Manley report’s
recommendation about transparency of CEO and senior executive compensation should also
be extended beyond hospitals and include LHINs, CCACs and LTC facilities. Evidence-based
guidelines for the care of specific maladies or conditions developed by quality councils and
used by physicians are needed to even out the wide variety of treatments — some more
effective than others — that are now used for the same problems. To its credit, the Ontario
government has established FHTs that go some way to meeting this goal, but they tend to
be too small, with too few physicians and cover too narrow a range of services. Currently,
it is unclear what objectives professionals are expected to meet and accountability is weak;
the former should be set by regional health authorities and the latter strengthened by
electronic record-keeping. In addition, where feasible, services should be shifted to
lower-cost care-providers.

Chapter 5: Health
171
Medical schools pay little attention in their teaching to issues involving the entire health care
system, particularly costs; they should add at least one course (perhaps more) introducing
their students to the broader system in which they will spend their careers, and where
physicians fit. The government should also take a bigger role in directing physicians to areas
of need — defined either in terms of geography or medical specialty.
The government should exercise greater cost control over pharmaceuticals through its own
purchasing power and through the setting of guidelines for pharmaceutical use. The recent
move to reduce the cost of generic drugs was a fine first step in this direction. Private-sector
employers who run drug plans for their employees should exercise greater control over the
cost of these plans.
Long-term care, community care and home care are currently underfunded, with too much
emphasis on long-term care facilities and too little integration of services. There should be
more integration, with more weight given to home care.
There should not be an a priori or ideological bias towards public- or private-sector service
delivery. Both options should be fully tested to see which provides the best service. This
should not be defined simply with respect to cost, but be quality-adjusted. As long as
government remains the payer for all covered services, it should allow for a role to be played
by both the public and private sectors. After all, family physicians are for the most part private-
sector operators paid by OHIP for their services. And we seem to have no trouble with the idea
that private companies now provide publicly funded laboratory work for health care providers.
This should be extended where it is the superior model.
Information technology (IT) is not used enough by physicians and other health care
professionals across the system in a way that allows different disciplines and services to
integrate their activities. Extensive use of IT is key to pushing the health care system to
operate in a co-ordinated fashion. History has shown that huge IT projects are unwieldy.
Most gains will come from local and regional records, so electronic record-keeping should
begin with FHTs and hospitals; these could then be connected and expanded from this base.
It is imperative, of course, that everyone use compatible systems that can communicate with
each other.

172
The public payer model now covers almost all of primary care — physicians and hospitals —
but less than half of drugs and relatively few mental health services; psychological services
for example, are not covered. Extending medicare to a broader range of services would be
difficult and controversial. But an open dialogue on this question is worthwhile and at some
point will become necessary. The government should at least launch such a dialogue;
Ontarians should be prepared to engage in this debate, especially stakeholders who know
the system best.
We must stress two things. First, the health care landscape is not nearly as black and white
as the chart and this short discussion imply. Many segments of the old system are already
moving towards the kind of reformed system we would like to see and are somewhere along
the continuum between old and reformed. Second, none of what we have said will surprise
anyone who manages part of the health care system today. These proposals are common
among health care professionals, who are full of good ideas about how the system can be
reformed; many of them are already pushing the system towards needed reforms with
some success.
Neither are these ideas in any way radical. But too many of them have been stifled in a public
debate by politicians, interest groups and stakeholders who regard even the most sensible
reform proposals as threats to medicare rather than solutions to medicare’s problems.
Among those we talked to, none who manage parts of the system argued that more money
alone is the solution to the problems of the health care system, including the ones they face.
Indeed, some argued that the system is now well funded and that too much money would
simply impede needed reforms. Certainly, the evidence of the recent past is that more
money — political rhetoric notwithstanding — did not buy change, only more of the same,
at higher cost.
Governments have typically recognized that greater co-ordination is required along the
continuum of care and that the co-ordination should be on a regional basis. Ontario created
14 LHINs to do this. Despite the title, the LHINs do not integrate key parts of the system.
Among the activities excluded are primary care and physicians in general, public health and
in some cases, community care. Some LHINs have struck arrangements with the CCACs and
public health units in their regions, but this pattern is fragile and does not apply everywhere.
It is hit and (mostly) miss. In theory, LHINs have the authority to allocate budgets across the
various components of care; in practice, they do not.

Chapter 5: Health
173
There is much to be proud of in Ontario’s health care system, but there are also many
problems, as anyone who works in the system — and many who deal with it as patients —
will tell you. Fortunately, there is an abundance of opportunities for reform that will create a
system that can deliver better quality care more efficiently. The challenge is to realize
those opportunities.

174
Recommendations to Turn Problems into Realized Opportunities
Overall System Planning
Ontario’s health system already possesses many qualities that align with promising health
delivery practices seen in other jurisdictions. In principle, and even in name, the LHINs were
given responsibilities and roles that are essential to a co-ordinated regional health system:
they allocate budgets, set objectives, evaluate performance, and generally have the authority
and independence to make transformative changes within their regions. However, it is now
apparent that LHINs were not given the proper authority or resources to execute the vision for
Ontario’s renewed health system. In some cases they have not yet exercised the full scope of
the authority they were granted. Through these recommendations, it is the Commission’s
intent to further strengthen the existing system, moving forward with the original intent of
integrated regional health delivery.
Recommendation 5-1: Develop and publish a comprehensive plan to address health care
challenges over the next 20 years. The plan should set objectives and drive solutions that are
built around the following principles:
The system should be centred on the patient, not on the institutions and practitioners in the
health care system;
The plan should focus on the co-ordination of services for patients in a fully integrated,
system-wide approach;
Reforms should recognize changes and challenges in both demographics and lifestyles by
putting more emphasis on chronic than acute care;
At the provincial level, the system must be able to carry out health care capacity planning;
it must look at the health needs of the population and project future needs for facilities,
services, funding and human resources;
Policies should be based on evidence that provides guidance on what services,
procedures, devices and drugs are effective, efficient and eligible for public funding;
There should be a heightened focus on preventing health problems, including the role of
public health in meeting this goal;
It should ensure that health data are collected efficiently and shared;
Funding to providers should be based primarily on meeting the needs of patients as they
move through the health care continuum; and
The quality of care can and should be enhanced despite the need to restrain increased
spending; the objectives of quality care and cost restraint must go hand in hand.

Chapter 5: Health
175
Recommendation 5-2: Evaluate all proposals for change that include efficiencies and
cost savings within the vision and plan developed above.
Recommendation 5-3: Divert all patients not requiring acute care from hospitals and into a
more appropriate form of care that will be less expensive, improve the patient experience and
reduce the patient’s exposure to new health risks.
Such services could be provided by private, for-profit entities, but operated within the public
payer system. Government would continue to determine what services are offered and set the
fees paid by OHIP. The patient experience would, however, remain the same: upon
presentation of a health card, the government will pay for the services rendered.
Recommendation 5-4: Increase the use of home-based care where appropriate to reduce
costs without compromising excellent care. For example, home-based care should be used
more extensively for recovery from procedures such as hip and knee surgery.
Recommendation 5-5: To improve the co-ordination of patient care, all health services in a
region must be integrated.
This includes primary care physicians, acute care hospitals, long-term care, CCACs, home
care, public health, walk-in clinics, FHTs (which for the purposes of this chapter includes
Family Health Organizations [FHOs], groups and networks), community health centres and
Nurse Practitioner-Led Clinics (NPLCs).
Cancer Care Ontario, which has recently begun to apply the expertise it built in addressing
cancer to renal disease, is a good model for better co-ordinating chronic care services along a
continuum of providers.
Exceptions to the regional system are specialized health facilities that have provincewide
responsibilities for service co-ordination and system building. Facilities such as the Hospital
for Sick Children, Princess Margaret Hospital and Centre for Addiction and Mental Health
have quite unique roles and relationships with the provincial government as well as their local
health authorities.

176
Fiscal Issues
Recommendation 5-6: Cap the government’s health budget at 2.5 per cent or less annual
growth through 2017–18. After 2017–18, annual health cost increases must be restrained to
no more than five per cent, a level necessary to keep the provincial budget balanced without
relying on tax increases or an unacceptable squeezing-out of other public services.
Recommendation 5-7: Support a gradual shift to mechanisms that ensure a continuum of
care and care that is community-based. Funding for community-based care may need to grow
at a higher rate in the short to medium term in order to build capacity to take pressure off acute
care facilities; on the other hand, with a shift away from a hospital focus, hospital budgets
could grow less rapidly than the average.
Recommendation 5-8: Achieve spending restraint by moving the health care system towards
a more efficient overall design and finding efficiency gains within its constituent parts.
Recommendation 5-9: Do not apply the same degree of fiscal restraint to all parts of health
care. Some areas — including community care and mental health — will need to grow more
rapidly than the average.
Ontario’s Mental Health and Addictions Strategy commits the province to the goal of providing
“more children, youth, adults and their families the services they need, more quickly, and more
effectively....”61 Addressing this historic gap in funding and service is highly laudable,
particularly when mental health-related disability costs are mounting.
As a related point, child and youth mental health services should be reconfigured to improve
co-ordination of the children’s services sector and the health, education and youth justice
sectors. We will return to this point in Chapter 8, Social Programs.
Integrating the Silos into a Health Care System
Recommendation 5-10: Set the overall principles for provincewide health care, but continue
to organize the delivery of health care on a regional basis.
Recommendation 5-11: A regional health authority should be clearly identified as the
key point for integrating services and institutions across the full continuum of care for a
geographic area.
61 Ontario Ministry of Health and Long-Term Care, “Open Minds, Healthy Minds,” op. cit., p. 4, downloaded from
http://www.health.gov.on.ca/en/public/publications/ministry_reports/mental_health2011/mentalhealth_rep2011.pdf.
Chapter 5: Health
177
Several key principles must be established for any such co-ordinating entity to succeed:
The co-ordinator must have the authority, accountabilities and resources necessary to oversee
health within the region; it must have the power to allocate budgets, hold stakeholders
accountable and set incentive systems.
The Commission considered the following possible co-ordinators:
Reverting back to regional offices of the MOHLTC is not the preferred model.
The co-ordinator should have more independence from the ministry, be able to tap
into a broader array of expertise, and be more firmly rooted in the communities served.
The CCACs currently have resources in collective purchasing and IT capacity that the
LHINs lack. However, their reach does not include all health care sectors and a substantial
change to the system would be needed to give it to them. We do not believe they are the
preferred model either.
This leaves the large, mostly academic, hospitals and reconstituted LHINs. Each has pros
and cons.
The advantage of the large hospitals is that this is where the managerial and
organizational expertise now resides. However, the managerial expertise of the hospitals is
often, but not always, only in hospital and acute care issues rather than a broader sector
perspective. Among the disadvantages are the likelihood that we would end up with at
least 25 organizational entities, which would reduce economies of scale, and the risk that
the chosen hospitals would tilt care in the direction of their own facilities even though the
thrust of any reforms is to keep people out of hospitals. There is also a history of
trepidation among other stakeholders towards large hospitals and their capacity to
dominate the system.

178
The LHINs could do the co-ordination, but only if they were substantially reconstituted and
given the human resources and IT and collective purchasing capacity they currently lack.
They would need a clear mandate to integrate almost all parts of health care and be given
the resources adequate to carry out their new role. They would need to be able to pay their
chief executive officers salaries that are competitive with other parts of the system (two
LHINs have recently lost their CEOs to hospitals) and with other sectors. Their numbers
could be reduced from the existing 14, but this is very much a secondary matter relative to
the other changes listed above. On average, each LHIN serves almost one million people,
and, in the case of northern Ontario, covers vast territories. Attention could be paid to the
confusion caused by the five LHINs in the Greater Toronto Area; the boundaries of some
cut across those of the municipalities they must deal with, especially on matters of public
health. New resources would not all need to be incremental since many would involve a
transfer of resources, including staff, from the ministry. The advantages of this option are
that the reconstituted LHIN would be independent of the existing sectors and an
appropriate number (and their boundaries) could be chosen to balance the needs of
regional representation with opportunities for economies of scale. The disadvantage is that
the process of expanding their role would require considerable disruptive change to align
them with the original intent of their function. The change might also involve transferring
people from the management of hospitals and perhaps the CCACs.
The Commission heard arguments in favour both of the large hospitals and of reconstituted
LHINs. On balance, we favour the LHIN option; however, either could be made to work.
And, as indicated above, neither would work if the basic principles were not adhered to.
LHINs 2.0
As the regional health authority, LHINs need to integrate care across the system by executing
three key roles: planning and integrating the system, funding and case management.
Planning and Integrating the System
Streamlining relationships between LHINs and health agencies, sharing information,
optimizing the use of human resource capacity and containing further system expansion are
necessary elements for developing a cohesive plan to substantively integrate the current
health care system.
Streamlining Relationships
Recommendation 5-12: Reduce the number of organizations with which the Local Heath
Integration Networks must deal on a day-to-day basis.

Chapter 5: Health
179
There are more than 2,500 funded health organizations in Ontario, many with their own
leadership teams and boards of directors. In the health care system’s current state, it will be
very difficult for the LHINs to do the job the Commission has set out for them because, in order
to have a truly integrated system, the LHINs will need to broker relationships with every
agency. In addition, the LHINs will have to deal with all the individual FHTs, FHOs, etc.
Similar health care groups, for example, the 155 hospitals, 14 CCACs, 200 FHTs or over 600
long-term care homes in the province, must further consolidate either organizationally by
forming merged leadership and boards, or physically by forming merged agencies.
This network of streamlined relationships should have the following features:
A regional physician network that has:
• Joint accountability for primary and acute care that leverages the talent, infrastructure
and capacity of hospitals while leveraging the comparative advantages the CCACs
have built in the areas of collective purchasing and IT infrastructure;
• Co-ordinated leadership through a body like the Ontario Medical Association (OMA) to
act as the interface with the LHINs, contribute to quality assurance policy development
with bodies such as Health Quality Ontario (HQO) and ICES, and keep their fellow
doctors and other primary caregivers abreast of new developments;
Further amalgamation of hospitals and reduction in the number of boards; and
The creation of an entity that represents the network of long-term care homes.
Recommendation 5-13: Consolidation of health service agencies and/or their boards should
occur where appropriate, while establishing any new consolidated agencies as separate legal
entities to limit major labour harmonization and adjustment costs.
Recommendation 5-14: Establish an advisory panel in each Local Health Integration Network
with appropriate representation of the regional health care stakeholders, including community
hospitals, physicians, community care and long-term care homes.
The LHINs need to have leaders who are savvy to political and community issues at play in
the regions. Do not appoint them through Orders-in-Council, but rather hire them using
executive search best practices to ensure independence and that an appropriate combination
of skills and expertise is brought to the table.

180
Information Sharing and Use
Recommendation 5-15: The Local Health Integration Networks must integrate care across
the system by sharing information on patients among health care providers, co-ordinating
decisions and allocating funds to best reflect regional needs.
Their mandate should include the range of services described in Recommendation 5-5:
primary care physicians, acute care hospitals, long-term care, community care, home care,
public health, etc. The pan-provincial institutions listed in Recommendation 5-5 should have
their own authority, which would be accountable directly to MOHLTC, and the government
should explore opportunities to concentrate very specialized intensive care into a few centres
to take advantage of their existing talent and infrastructure strengths.
Recommendation 5-16: Use data and information sharing to better understand and address
the fiscal impacts of chronic and complex conditions and at-risk patients with mental health
and addiction issues (see Recommendations 5-37 to 5-41 for more on managing their care).
Analysis of potential solutions, including more efficient use of the full range of health services
and other agencies should be done in tandem with an assessment of the potential for greater
involvement of the private sector in providing advice on complex case management.
Integration and co-operation between the health, mental health, addiction, social service,
justice and youth protection service sectors is crucial.
Recommendation 5-17: Use information from funding models such as the Health-Based
Allocation Model (HBAM)62 to examine where services may not be provided equally across
health regions and conduct ongoing evaluations of each Local Health Integration Network’s
progress in managing high-use populations. (See Recommendations 5-50 and 5-73 for more
details on HBAM.)
Optimize the HBAM data set to identify each LHIN’s high-use population on an annual basis,
including their specific demographic, socio-economic, diagnostic and procedural
characteristics. Use this information to better understand and learn from the differences in
treatment practice in each LHIN and apply best practices across the province. Further, use
HBAM data to build specific strategies for co-ordinating health care for each high-use clinical
group, for example: end-of-life care, avoidable complications, and care for those with mental
health and addictions issues.
62 The Health-Based Allocation Model (HBAM) is a tool to allocate funding for health services across communities in the province.
Allocations estimate the demand and costs of these services based on clinical and demographic information such as age, health status, patient flow and rural geography.

Chapter 5: Health
181
Optimize Human Resources Capacity
Recommendation 5-18: Where feasible, services should be shifted to lower-cost caregivers.
Across the spectrum of caregivers, full scope of practice needs to be exercised.
There should be a net shift in responsibilities from physicians to nurses and others in health
teams, including physician assistants. This should be supported by changes to fee schedules;
for example, by not paying physicians for interventions like vaccinations that could be done
by nurses.
There is a significant number of cases where there are minimal risks of complications and
nurses or physician assistants can play a more independent role; however, there is an equally
significant number of cases where there is a somewhat higher but not extreme risk of
complications where nurses or physician assistants would require a doctor to be nearby to
deal with any potential issues. Family Health Teams have optimized a model that could be
transferable to other settings as nurses are often in close proximity to doctors.
Recommendation 5-19: A broader perspective should be applied to decisions that are made
on the scope of practice of health professionals. Government should play a more active role in
working with the professional colleges to apply a system-wide approach rather than dealing
with individual professions in isolation.
Doctors and nurses may discuss among themselves what activities they should retain or give
up, but there is no mechanism to put these internal dialogues together and get some action on
changes that both agree would be beneficial.
Recommendation 5-20: Maximize opportunities to use nurse practitioners with the aim of
efficiency, while maintaining excellent care.
Seven of the controlled acts authorized to physicians are also authorized to nurse
practitioners, for example: periodic health examinations (“full physicals” for children, women
and men); assessment and clinical management of acute episodic illness, for example,
respiratory tract infections; and monitoring stable chronic health conditions, such as
hypertension and diabetes, etc.
Recommendation 5-21: Recognize the increased demand for nurses in the capacity of
nursing programs at colleges and universities and their ability to train more nurses.
There are already severe labour shortages for nurses and various technicians, with some
reports of a 20 to 30 per cent attrition of nurses within the first year after nursing school. There
is a desperate need to increase supply and improve retention. If this is not addressed quickly,
demand-supply imbalance will blow up labour costs and compromise overall restraint.

182
Recommendation 5-22: Increase the use of personal support workers and integrate them into
teams with nurse practitioners, registered nurses and other staff members where appropriate
to optimize patient care.
Increasing the use of personal support workers to apply their full range of skills will allow
other health professionals to focus on what they are trained to do best and deliver excellent
cost-efficient care.
Recommendation 5-23: Local Health Integration Networks need to use funding as a lever
to encourage hospitals and other health care providers to use the full scope of practice of
their staff.
Funding dictated by expensive and sub-optimal use of practitioners must cease. If health care
organizations are not implementing the full scope of practice standards set by the ministry,
the LHINs need to use funding reductions as an incentive for compliance.
Recommendation 5-24: Make changes to the Pharmacy Act to enable an expanded scope
of pharmacy practice. This would involve developing supporting regulations to permit
pharmacists to administer routine injections and inhalations, including immunization.
Contain Further Capital Investment
Recommendation 5-25: Hospital capital plans that extend out-of-hospital services such
as those for outpatients should not be entertained by Local Health Integration Networks.
Hospitals should conduct affairs largely within hospitals, and others, such as Community
Care Access Centres (CCACs) and private health care operators, should be responsible
for providing out-of-hospital services. The CCACs and private health care operators have
demonstrated that they are capable of doing this work for less than hospitals.
Recommendation 5-26: Resist the natural temptation to build many more long-term care
facilities for an aging population until the government can assess what can be done by
emphasizing to a greater extent the use of home-based care that is supported by community
services. Home-based care is less expensive and should generate greater population
satisfaction.
Funding
Recommendation 5-27: Grant Local Health Integration Networks the authority,
accountabilities and resources necessary to oversee health within the region, including
allocating budgets, holding stakeholders accountable and setting incentive systems.

Chapter 5: Health
183
The LHINs should have clear powers to deal with all aspects of the health system’s
performance in their area, including primary care (physicians), acute care (hospitals),
community care and long-term care. This would include setting budgets and/or compensation
for all players.
Recommendation 5-28: Tie compensation for CEOs and senior executives in all parts of the
health care system to strategically targeted health outcomes, not the number of interventions
performed, through a performance pay framework. Mirror this performance pay approach
throughout each hospital, Community Care Access Centre, long-term care facility, etc., at the
physician and health care worker levels.
Recommendation 5-29: Support transparency in senior executive and CEO salaries
throughout the health care system by publicly posting comprehensive compensation
information in a timely fashion.
Recommendation 5-30: Allocate funding based on meeting the needs of patient as they
move through the continuum of care.
Case Management
An apparent weakness in the current health care system is the lack of smooth and consistent
patient case management.
Recommendation 5-31: Some regions have developed roles for “clerical system navigators”
that co-ordinate appointments and assist patients with required forms and paperwork.
Local Health Integration Networks should ensure that a sufficient number of people in this
role are put in place across the entire health care system.
Recommendation 5-32: Empower primary caregivers and physicians in the Family Health
Teams (FHTs) or specialized clinics to play the role of “quarterback,” tracking patients as they
move through the integrated health system. All FHTs should work in tandem with clerical
system navigators and hospitalist63 physicians to track their patients who are in hospitals,
from admission to discharge (see Recommendation 5-55 on hospitalists for more details).
Recommendation 5-33: Tightly integrate Community Care Access Centres (CCACs) with
Local Health Integration Networks (LHINs) to improve patient case management. There are
options that should be explored about the nature of this integration. It could be either through
co-operation of two entities or a more formal and complete merger of CCACs into this one
key aspect of the work of LHINs.
63 Hospitalists are physicians who dedicate their time to caring for hospitalized patients, following individual cases through the system,
ensuring co-ordinated communication among the hospital’s health care providers and specialists, including surgeons and oncologists. This type of role is crucial when dealing with patients with complex cases where multiple specialists may be involved in their care.

184
Recommendation 5-34: Require hospitals to make discharge summaries available
electronically to other care providers (e.g., general practitioners, home care) immediately.
Recommendation 5-35: Switch to electronic delivery of laboratory test results to improve
timeliness and efficiency, as well as support patient privacy.
Recommendation 5-36: Reduce absenteeism for Ontarians and office visits, while improving
patient satisfaction, through secure messaging between patients and providers, online
appointment scheduling, access to test results for patients, and online requests for prescription
refills and renewal.
Management of Complex and Chronic Conditions
Recommendation 5-37: Complex care patients should be managed through interprofessional,
team-based approaches to maximize co-ordination with Family Health Teams and other
community care providers.
Recommendation 5-38: Chronic issues should be handled by community and home-based
care to the fullest extent possible.
Recommendation 5-39: Reach out to patients who need preventive care, particularly chronic
disease and medication management, rather than waiting for them to come to get services.
Leverage electronic medical records, decision support and secure messaging with Ontarians
to achieve these goals.
Recommendation 5-40: Reduce mortality, hospitalizations and costs while improving
patient satisfaction by connecting Ontarians who have serious chronic health problems
(e.g., congestive heart failure) with ongoing monitoring and support through expanded
use of telehomecare.
Recommendation 5-41: Centralize leadership of chronic disease management by developing
co-ordinating bodies for chronic conditions including mental health, heart and stroke and renal
disease, based on the Cancer Care Ontario model.
Governance and Structures
If revamped LHINs are to co-ordinate the system, they would need appropriate representation.
Recommendation 5-42: Resource the Local Health Integration Networks adequately to
perform their expanded functions. Additional resources should come in large part from the
Ministry of Health and Long-Term Care; this would entail a significant transfer of employees.
Chapter 5: Health
185
Recommendation 5-43: Put in place clear structures to clarify the lines of accountability up to
the Local Health Integration Networks (LHINs) and the accountability of LHINs to the Ministry
of Health and Long-Term Care.
The LHINs should be able to set accountabilities for primary care provider remuneration as
well as regional health system performance, removing the direct influence of MOHLTC.
The ministry used to control inputs and paid little attention to outcomes; affording LHINs the
ability to focus on outcomes and ease off on inputs and process will help drive positive results.
Establishing target outcomes for LHINs in areas such as mental health and diabetes will have
a greater impact on health system efficiency than the previous approach focusing on activities
like reducing emergency wait times. In addition, removing the political influence from LHINs’
day-to-day operations will help enable change and innovation. All too often, negative reports in
the media have stymied evolution in health care policy and delivery. Government needs to
stand by the LHINs’ decisions, even facility closures, if need be.
Recommendation 5-44: Move critical health policy decisions out of the context of negotiations
with the Ontario Medical Association and into a forum that includes broad stakeholder
consultation.
Currently, decisions regarding medical procedures that are covered under OHIP or excluded
from coverage are part of the compensation package negotiated periodically by the
government and the OMA. This should stop. As in other jurisdictions, doctors should be
consulted on such questions, but no more. Such decisions should be made elsewhere
(see next recommendation).
Evidence-based Policy
We must recognize that physicians have a tough job. Medicine is complicated and ever-
changing. After many years in school, doctors are thrust into a life of long work hours, which
makes it difficult to keep up with the latest research and best practices. They need research-
based clinical guidelines to help them stay current with developments in medicine. This is why
the government established both the ICES and HQO. Other countries have set up similar
quality councils, like Britain’s National Institute for Health and Clinical Excellence. In Ontario,
the work of ICES and HQO can be the basis for clinical guidelines that can advise physicians
and other health care providers on the most effective and efficient ways of dealing with specific
medical problems.
Recommendation 5-45: The Institute for Clinical Evaluative Sciences and Health Quality
Ontario must work in tandem, integrating their respective expertise into practical
recommendations for health care providers.

186
They could also help the government decide which procedures might be removed from public
coverage, a task now done through the ministry’s negotiations with the OMA.
Recommendation 5-46: As a body of practice is established, expand the mandate of Health
Quality Ontario to become a regulatory body to enforce evidence-based directives to guide
treatment decisions and OHIP coverage.
Health Quality Ontario is responsible for making recommendations with respect to clinical
practice guidelines and the provision of funding for health care services and medical devices
based on scientific evidence. Though effectiveness is a central tenet of their research,
efficiency should also become an equally large focus.
Care should be taken to ensure that innovation is not stifled by directives that are
unreasonably rigid. Such an initiative:
Requires effective input from key stakeholders including physicians;
Requires effective liaisons with quality/research organizations in other provinces, in the
federal government and in other countries; and
Requires an international scientific advisory body.
Recommendation 5-47: Make all Health Quality Ontario work public. Use the evidence found
to inform directives on practices and what will be covered by OHIP.
Recommendation 5-48: More work must be done on the efficiency front for the Institute for
Clinical Evaluative Sciences.
The mandate of ICES is to conduct research that contributes to the effectiveness, quality,
equity and efficiency of health care and health services in Ontario. Its work to date has made
great strides on the fronts of effectiveness, quality and equity; however, the efficiency
component has lagged the others.
Both ICES and HQO could become instrumental in helping increase efficiency of the health
system without jeopardizing quality. It is no longer sufficient to simply ask whether a practice
or a pharmaceutical offers the prospect of improved health. A much more stringent test is to
determine if it is an efficient way to achieve positive health outcomes.
Recommendation 5-49: Explore the potential for a national Organization for Economic
Co-operation and Development-type entity that collates and enhances evidence-based policy
directions and provides enhanced collaboration on issues across jurisdictions. It could provide
a gathering place for dialogue and a secretariat with a capacity for analysis. Such an
organization could be housed with the Council of Health Ministers or Deputy Ministers.
The federal government should be involved.

Chapter 5: Health
187
Despite variations in how health care is provided across the country, all provinces and
territories face the same challenge of controlling health care cost increases without sacrificing
excellent care. Much can be learned by discussing and understanding what each jurisdiction is
doing and there is an opportunity to conduct cross-jurisdictional studies to determine the best
approach. The federal government is unlikely to play the role of facilitating such a dialogue;
however, Ontario should convene with the other provinces and territories and invite the federal
government to participate.
Hospitals
At present, the payment hospitals receive is based on average costs across the province so
there is no incentive to increase efficiency. There is little understanding of the true costs of
hospital procedures and, as such, estimations of value for money are difficult to ascertain.
Both MOHLTC and LHINs need to take a hard look at the variability in the costs incurred by
hospital procedures from region to region and hospital to hospital, and take steps to ensure
that Ontario is getting the best value for its money when allocating funds to hospitals.
Recommendation 5-50: Use data from the Health-Based Allocation Model (HBAM) system to
set appropriate compensation for procedures and cease the use of average costs to set
hospital payments (see Recommendations 5-17 and 5-73 for more details on HBAM).
Recommendation 5-51: Create a blend of activity-based funding (i.e., funding related to
interventions or outcomes) and base funding managed through accountability agreements.
Indeed, a shift to activity-based funding should be applied as well to other parts of the health
system. Currently, hospital budgets are mostly determined by a percentage increase from the
previous year’s budget, regardless of whether a hospital’s activities are increasing or
decreasing. Under activity-based funding, a hospital would get a set amount for a specific
intervention. For example, a hospital might get $2,000 for each cataract surgery, $400 to set a
broken arm and $8,000 for a hip replacement. An activity would shift to the hospitals that can
perform it profitably, while hospitals that cannot meet that standard would either become more
efficient or reduce their efforts in this area, ideally by focusing on activities that they can do
well. The result would be a general reduction in the cost of each procedure.
Recommendation 5-52: Create policies to move people away from inpatient acute care
settings by shifting access to the health care system away from emergency rooms and
towards community care (i.e., walk-in clinics and Family Health Teams), home care and,
in some cases, long-term care.
This alone should reduce the number of people who end up being admitted to hospital beds
even though that is not appropriate for the nature of care they need.

188
Recommendation 5-53: Encourage hospitals to specialize so all are not trying to provide all
services regardless of their comparative advantages.
To a degree, proper funding incentives will energize this shift; if a certain reimbursement rate
is set for an activity, hospitals that cannot provide the service within that rate will gravitate
away from it. More specialty clinics should also be encouraged, because they can cost less
and provide better quality. Again, a proper funding model should support this.
Recommendation 5-54: Given the burden of alternate level of care (ALC) patients on hospital
capacity, hospitals must become more effective in optimizing this capacity while applying best
practices in planning patient discharges. Further, small hospitals with large ALC populations
must be assessed with a goal of redefining their role in care for the elderly. Again, funding
should be aligned appropriately.
Recommendation 5-55: Use hospitalist physicians to co-ordinate inpatient care from
admission to discharge. Hospitalists should work with Family Health Teams to better
co-ordinate a patient’s moves through the health care continuum (acute care, rehabilitation,
long-term care, community care and home care).
Physicians
Recommendation 5-56: Make primary care a focal point in a new, integrated health model.
Recommendation 5-57: Regional health authorities must integrate physicians into a rostered
health system and adopt the appropriate measures to address compensation issues across
disciplines; that is, the proper blend of salary/capitation and fee-for-service.
The primary goal for physician performance should be prevention and keeping people out of
hospitals. Collective administrative support would allow physicians to concentrate on providing
better care, a value proposition that should appeal to them.
Recommendation 5-58: Reduce the sole proprietorship nature of the offices of many primary
care physicians and encourage more interdisciplinary integration through performance
incentives and accountability.
Recommendation 5-59: Compensate physicians using a blended model of salary/capitation
and fee-for-service; the right balance is probably in the area of 70 per cent salary/capitation
and 30 per cent fee-for-service.
Physicians’ compensation, and especially performance pay, should be linked to positive health
outcomes that are linked to strategic targets, not to the number of interventions performed.
Chapter 5: Health
189
Recommendation 5-60: Aggressively negotiate with the Ontario Medical Association for the
next agreement.
The government must be very strategic in its objectives to ensure the promotion of a high-
quality care system that runs efficiently. Since Ontario’s doctors are now the best paid in the
country, it is reasonable to set a goal of allowing no increase in total compensation. However,
the negotiations must go well beyond compensation. They must also address the integration of
physicians into the rest of the health care system and the objective of working towards the
best possible health quality regime.
Recommendation 5-61: Adjust fee schedules in a timely manner to reflect technological
improvements, with the savings going to the bottom line of less expenditure on health care.
Technological improvements often reduce the time required for procedures. Will Falk has
recently pointed to the example of radiology, where government investments, including those
made through the Canada Health Infoway program, have resulted in vast productivity
improvements. Despite the fact that these improvements have drastically reduced the time it
takes to diagnose (and hence greatly increased the volumes of diagnoses that can be made in
any given day), the fee schedule has not been adjusted to reflect these effects.64
Recommendation 5-62: Make Family Health Teams (FHTs) the norm for primary care and
design the incentive structure of physicians’ compensation to encourage this development.
Among the key characteristics of FHTs are the following:
The regional health authority should play a key role in determining their relationship with
the rest of the health care system and setting ground rules for their operation;
Make outcomes the focus of FHTs, not health interventions. Their operation should be
tightened through objectives, accountability and a data collection system;
Conduct research to determine the optimal size of FHTs, taking into account factors such
as geography and patient demography. Balancing economies of scale while maintaining
personal connections between health care providers and patients is crucial: FHTs need the
scale to support a wide range of care providers and be able to support the administration
necessary, including the responsibility of tracking people through the system. It has been
suggested to the Commission that the optimal size, for larger communities, may be in the
range of 8 to 15 physicians, and include practitioners with a wider range of specialties than
is now the case. They now typically have only three to eight physicians; and
64 W. Falk, M. Mendelsohn, J. Hjartarson and A. Southey, “Fiscal Sustainability and the Transformation of Canada’s Healthcare System:
A Shifting Gears Report,” 2011, Mowat Centre, p. 36.
190
To provide a range of services at a lower cost, include other health professionals in the
FHTs (nurse practitioners, registered nurses, dietitians and midwives, for example).
Unlisted practitioners such as physiotherapists and massage therapists would also be part
of FHTs; however, their services would be provided on a cost-recovery basis.
Recommendation 5-63: Require Family Health Teams (FHTs) to accept patients who choose
them, and the FHTs should work with each patient to connect them with the most appropriate
constellation of care providers.
Recommendation 5-64: The regional health authority should establish incentives to
discourage Family Health Teams from referring patients to acute care.
Recommendation 5-65: Regional authorities should also be responsible for assigning heavy
users of the health care system to the appropriate Family Health Team (FHT). If, for example,
there are 300 heavy users within a region and three FHTs, the regional health authority would
try to steer 100 to each, so that no FHT is overburdened.
Recommendation 5-66: Because Family Health Teams (FHTs) will be responsible for patient
tracking, they will need to build a critical mass of an administrative arm to carry out this task.
This administrative arm should be shared among a number of FHTs.
Recommendation 5-67: Better after-hours care must be offered and telephone/Internet
services should direct patients to the most appropriate and convenient care provider.
Recommendation 5-68: All Family Health Teams must be encouraged to add more
specialists to their teams, which will reduce referrals and ease some of the complexities
of patient tracking.
Recommendation 5-69: The Ministry of Health and Long-Term Care should allow the
flexibility necessary for Family Health Teams to share specialists by permitting part-time
contracts.
Recommendation 5-70: All Family Health Team physicians must begin engaging in
discussions with their middle-aged patients about end-of-life health care.
Far too often, patients and their families are thrust into making these types of critical decisions
under duress, where a clear understanding of alternatives and consequences is essential and
the need to rapidly implement the patient’s wishes is required.

Chapter 5: Health
191
The ministry should seek the assistance of and input from seniors’ advocacy organizations
(like CARP65) to engage the public in an open dialogue on the appropriate policies and
approaches to address end-of-life care. A module should be developed to assist people in
setting out their wishes and advising them on the appropriate processes to ensure that their
wishes are carried out. Informing people about the importance of using an advance health
care directive (also known as a “living will”) as opposed to the last will and testament as the
legal document to express one’s end-of-life care wishes is essential.
Primary care physicians need to open the dialogue about a living will that lays out how
individuals wish to be cared for when they are unable to do so, including the need to discuss
the living will with family beforehand to mitigate any possible conflicts later.
If patients indicate their preference in approach, then the physician should receive assurances
from the patient that there is understanding among all family members. If patients have not
indicated a preference, then the physician should gently ensure that the issue is raised.
Having a clear understanding by all parties of patients’ wishes regarding end-of-life care offers
the ability to put in place a plan to provide the care necessary to meet the patients’ needs and
provide the services in a timely manner when the need arises. This in turn will help to reduce
the number of ALC patients who are waiting for places in long-term care facilities and
hospices.
Recommendation 5-71: Improve access to care (e.g., in remote communities) and
productivity for specialists by triaging appropriate patients for telemedicine services
(e.g., teledermatology, teleophthalmology).
Recommendation 5-72: Remove perverse incentives that undermine the quality and
efficiency of care. For example, physicians are penalized when one of their patients goes to
another walk-in clinic, but not when the patient goes to the emergency department of a
hospital. More generally, the fee-for-service compensation model gives an incentive for
medical interventions without due consideration to quality and efficiency of care.
Such incentive issues must be addressed by focusing the Ontario Medical Association’s
negotiations more on quality of care and amending payment systems for physicians and
throughout the health care system.
65 CARP was formerly known as the Canadian Association of Retired Persons and is now known as Canada's Association for the Fifty-Plus,
but it has retained the CARP acronym. For more information, please see www.carp.ca.

192
Recommendation 5-73: The model described in the above recommendations must be
supported by a robust data collection and sharing system that allows the creation of the
necessary records. For example, the model works only if we know how many patients are
not visiting emergency departments or how many diabetes patients are not experiencing
complications (see Recommendations 5-17 and 5-50 on Health-Based Allocation Model data
for more details).
Community Care, Home Care and Long-Term Care
Recommendation 5-74: Increase the focus on home care, supported by required resources,
particularly at the community level.
Recommendation 5-75: Match seniors to the services that they need from the earliest
available care provider, reduce alternate level of care days, and improve co-ordination of
care through the use of referral management tools for long-term care, home care and
community services.
Recommendation 5-76: Implement the recommendations contained in “Caring for Our Aging
Population and Addressing Alternate Level of Care,” a report prepared by Dr. David Walker
and released in August 2011.66
More specifically, the government should move quickly to implement his proposals that:
Ontario’s health care system needs to undergo a broader transformation to meet the care
needs of an aging population;
Primary care providers must make care for the elderly a priority, including the early
identification of seniors at risk of frailty and proactive management of their multiple
challenges;
The continuum of community care must be supported through additional and sustained
resources to integrate, co-ordinate and enhance traditional sectors and assisted living
arrangements while bridging gaps through new models of care that serve populations
whose care needs exceed what is currently available;
Seniors and younger populations with special needs, particularly behavioural challenges,
must be provided with knowledgeable, integrated care across the continuum, wherever
they seek treatment, with equitable and timely transition to the right provider for the
right service;
66 Walker, op. cit.
Chapter 5: Health
193
An “assess and restore” philosophy and function must be central to health care delivery.
There should be an enhancement of programs aimed at restoring and reactivating elderly
patients’ level of functioning, and creating opportunities for them to be transferred home
with appropriate ongoing supports; and
Improved communication between institutions, and between primary care and CCACs,
through the use of electronic medical records is essential. Furthermore, advances made in
the use of telehomecare should be disseminated and adopted broadly for the right
ALC populations.
Recommendation 5-77: In addition to recommendations contained in “Caring for Our Aging
Population and Addressing Alternate Level of Care,” a report prepared by Dr. David Walker
and released in August 2011,67 there is a need for more and varied palliative care; at home
and in residential hospices.
Health Promotion and Prevention
Recommendation 5-78: Integrate the public health system into the other parts of the health
system (i.e., Local Health Integration Networks).
Much public health work is done outside the primary health care sector, for example,
in matters of settlement and housing. The potential impacts of budget integration should
be taken into consideration as the funding sources for public health are strongly linked to
municipal budgets.
Recommendation 5-79: Review the current funding model that requires a 25 per cent match
from municipalities for public health spending.
Many municipalities are now considering reducing their funding, which puts public health units
at risk of losing provincial support as a result of the municipal cuts.
Recommendation 5-80: Consider fully uploading public health to the provincial level to
ensure better integration with the health care system and avoid existing funding pressures.
Recommendation 5-81: Improve co-ordination across the public health system, not only
among public health units, but also among hospitals, community care providers and primary
care physicians.
67 Walker, op. cit.

194
With the advent of LHINs, hospitals refocused on acute care and core services, but as an
unintended result, they began pulling back on public health functions such as diabetes
counselling.
Recommendation 5-82: Replicate British Columbia’s Act Now initiative, which has been
identified by the World Health Organization (WHO) as a best practice for health promotion
and chronic disease prevention, in Ontario.
There appears to be some correlation between health outcomes and the amount provinces
spend on public health. A 2009 study by Douglas Manuel and others revealed that British
Columbia, which spends almost three times as much per capita on public health as Ontario,
is the leading province in terms of overall population health and health behaviours (including
quitting smoking, engaging in regular physical activity, choosing a healthy diet and maintaining
a healthy body weight).68 This apparent correlation between public health spending and health
outcomes needs to be further explored through research to determine the benefit-cost ratios.
Recommendation 5-83: Have doctors address diet and exercise issues before reaching for
the prescription pad when dealing with health issues such as cardiovascular disease and
late-onset Type 2 diabetes.
Patients need to heed their doctor’s advice and make lifestyle changes when requested.
For example, the cholesterol-lowering medication Lipitor has been the biggest selling drug for
over 10 years, in some years exceeding $1 billion in sales. As Lipitor is the most-often
prescribed drug in Canada for those over age 65, this means that the ODB program is
covering a substantial cost that could be potentially alleviated, at least in part, by lifestyle
changes in Ontarians.
Recommendation 5-84: Do more to promote population health and healthy lifestyles and to
reverse the trend of childhood obesity, especially through schools.
In addition, the government should explore regulatory options for the food industry. This would
require the integration of health promotion activities with municipalities and school boards,
among others. It will be important to take a whole of government approach to population health
and include population health in planning considerations.
68 D. Manuel et al., “What Does It Take to Make a Healthy Province?” Institute for Clinical Evaluative Sciences, 2009, p. vi.

Chapter 5: Health
195
Recommendation 5-85: Work with the federal government on nutrition information and,
where appropriate, regulation.
If we apply the WHO population attributable risk estimates to Canadian mortality statistics,
nutrition-related chronic diseases now cause some 48,000 deaths annually in Canada and
perhaps some 16,000 deaths in Ontario.69 If the federal government does not act in a timely
fashion, Ontario should act alone in areas such as restricting the amount of trans fat and
sodium permissible in restaurant and manufactured foods, and establishing a provincial
chronic disease prevention strategy, including nutrition, tobacco, alcohol and physical activity
measures.
Medical Schools/Training
Recommendation 5-86: Medical schools should educate students on “system issues,” so
they better understand how physicians fit into the health care system; for example, how to deal
with patient needs efficiently and effectively, but using fewer resources by connecting different
parts of the health care system.
Recommendation 5-87: Do a better job of flagging health professions and locations that are
currently in short supply or where shortages can be expected in the future.
The school system seems to be the right focal point for carrying out the task of labour supply
planning. Medical schools need to do their part to ensure an adequate supply of health care
professionals is able to care for the aging population.
Pharmaceuticals
Recommendation 5-88: Link the Ontario Drug Benefit program more directly to income.
Almost all of the cost of prescription drugs for seniors is now covered by the provincial
government. This is very expensive. Ontario needs to start having an open, honest discussion
about public coverage of health care costs, which includes the possibility of broader public
coverage of pharmaceutical costs and how it should be financed.
69 World Health Organization, “Global Health Risks: Mortality and Burden of Disease Attributable to Selected Major Risks,” 2009, W.H.O.
Geneva; see especially p. 17, downloaded from http://www.who.int/healthinfo/global_burden_disease/GlobalHealthRisks_report_full.pdf. Statistics Canada, “Mortality, Summary List of Causes,” 2008, Ottawa. Catalogue no. 84F0209X, which indicates the total number of deaths in 2008 was 238,617, 20% of which is 47,723; downloaded from http://www.statcan.gc.ca/pub/84f0209x/84f0209x2008000-eng.pdf.

196
In the meantime, the ODB should be better targeted. Two basic options are on the table, each
with differing effects on who would benefit and the level of savings that can be achieved.
A minimal step would be to make the portion of pharmaceutical costs paid for by seniors rise
more sharply as income increases. The other, preferred, option is to sever the link to age and
instead link the benefit to income only. In either case, changes would need to be phased in
over time.
Option 1, which the Commission views as de minimus, is to change the program only as it
applies to seniors. That change would see the tightening of the relationship to income. In other
words, co-payments would increase more sharply, and in a more graduated fashion,
as income rises. This option would permit substantial savings. Out of the $2.7 billion now
spent within the ODB program on subsidizing pharmaceuticals for seniors, at least
$300 million could be saved annually. Tightening the relationship further, it is feasible to
save as much as $1 billion per year. In that scenario, the highest-income seniors would see
their annual co-payments increase around $1,000 per year.
Option 2, and the preferred route forward for the Commission, is to change the program as
it applies to both seniors and lower-income non-seniors. In this option, the links to age and
social assistance status would end. Instead, the program would be linked solely to income.
So an individual or family would have the same eligibility and extent of assistance with the
cost of pharmaceuticals regardless of age or whether they are receiving social assistance.
This option would greatly strengthen the equity of the program. It would also remove a large
brick in the so-called “welfare wall.”
What is the “welfare wall”? It is a series of barriers that can discourage people from leaving
social assistance. In the case of the ODB, after a short interval social assistance recipients
through Ontario Works and the Ontario Disability Support Program (ODSP) lose access to
pharmaceutical cost support if they take a job. This is a major contributor to what is known as
the high marginal tax rate faced by social assistance recipients entering the workplace (more
information on barriers in the current social support system can be found in Chapter 8, Social
Programs). Put simply, it serves as a disincentive to finding employment. Making the ODB
available to all within a low-income range would remove this disincentive.
However, it would be more difficult under this scenario to extract the large savings feasible
under Option 1. That is because there would be new recipients that would become eligible —
lower-income non-seniors who are not receiving Ontario Works or ODSP — and this would
offset much of the savings from no longer subsidizing pharmaceuticals for higher-income
seniors.

Chapter 5: Health
197
The Commission regrets it was not able to be informed by any modelling of such an option,
which would have helped clarify the net fiscal impact and the incidence. However, we feel that
at worst it should be possible to design such a scenario on a cost-neutral basis that would still
leave the benefits of enhanced equity and less disincentive for social assistance recipients to
enter the workforce. Ontario is not the only province to explore these options. British Columbia
offers a model worthy of study: in 2003, it changed its age-dependent program into one that
links solely to income.
Recommendation 5-89: Help reduce medication errors through the use of electronic supports
to cross-reference multiple prescriptions.
Recommendation 5-90: Reduce fraudulent prescription medication use through the use of
drug information systems.
Recommendation 5-91: Pursue — with other provinces — the possibility of establishing a
national entity that would set a common price for pharmaceuticals for the entire country
(or at least jurisdictions opting in).
This would create economies of scale. In addition, a number of regulatory bodies at both the
provincial and federal levels are responsible for overseeing the pharmaceutical industry.
The regulations set by one body often do not map to those set by another, and often they are
not aligned to those set by comparable bodies in other countries. Overlapping regulations
across provinces and across countries add costs and present barriers to new drugs entering
the marketplace in an efficient manner.
Recommendation 5-92: Conduct drug-to-drug comparisons to determine which drug is the
most efficient at addressing a given ailment.
Drugs are approved by Health Canada for use after studies prove that they are more effective
than a sugar pill. Groups such as ICES and HQO need to conduct treatment comparison
studies to help inform what kinds of pharmaceuticals (and, if applicable, treatment
combinations) should be prescribed to provide the most effective and efficient care.
Decisions regarding coverage of new brand-name drugs should be made with an evidence-
based approach to ensure that all new drugs are adding value that exceeds their cost.
Recommendation 5-93: Work with the federal government to ensure that Ontario’s interests
in expanding use of generic drugs are not undermined by a Canada-European Union Free
Trade Agreement.

198
Harmonizing patent protection for brand-name drugs to European standards could cost
Ontario dearly since generic drugs would be kept off the market for a longer time. Aidan Hollis
at the University of Calgary and Paul Grootendorst at the University of Toronto found in their
February 2011 report that, if all three of the EU’s pharmaceutical intellectual property (IP)
proposals are adopted, it could cost Ontario payers up to $1.2 billion annually ($551 million for
Ontario government, $672 million for private sector),70 which would more than wipe out the
savings achieved through the government’s recent drug reforms.
Recommendation 5-94: Use pharmacists to their full scope of practice.
Permit the practice of therapeutic substitution, which would allow pharmacists to substitute
a less expensive alternative to the physician’s prescription. In British Columbia,
pharmacists can change the dose and the prescription within the same class of drugs
without consulting the prescribing doctor first, though they do have to inform the
prescribing doctor after the prescription is filled. Pharmacists can also change prescription
formulations based on identified risks or side effects. For example, some formulations of
proton pump inhibitor drugs (used to control stomach acid) are better for people with
kidney problems. If the doctor has not prescribed the best formulation, the pharmacist can
change the prescription.
Permit pharmacists to administer injectables and inhalant medications. Pharmacists in
Ontario were just recently permitted to administer them for purposes of demonstration and
education only. Many other provinces and U.S. states permit pharmacists to perform
vaccinations. Ontario has very low vaccination rates. They may be improved through
increased access as pharmacies are prevalent and accessible.
Allow pharmacists to prescribe for minor ailments. In Saskatchewan, prescribing for minor
ailments is being done by pharmacists. They are allowed to prescribe for self-limiting
conditions like skin rashes or eye infections, but if they do not get better in a few days,
they are referred to a physician. Pharmacists could also write prescriptions for smoking
cessation or other non-prescription therapy.
70 P. Grootendorst and A. Hollis, “The Canada-European Union Comprehensive Economic and Trade Agreement: An Economic Impact
Assessment of Proposed Pharmaceutical Intellectual Property Provisions,” 2011.

Chapter 5: Health
199
Cost Efficiencies
Recommendation 5-95: Centralize all back-office functions such as information technology,
human resources, finance and procurement across the health system.
There is redundancy and duplication in the current system design, with hundreds of
independent organizations having some level of administrative/corporate structure and back-
office models that result in higher-than-necessary administrative costs. These structures could
build on some of the procurement mechanisms in place now (e.g., Plexxus, 3SO, Shared
Services West) but need to go further and move forward faster to create stronger single
enterprise solutions for all central back-office functions. They should be integrated at a LHIN
level (and possibly across all LHINs) to reduce the percentage of overall spending on these
services to benchmark levels that have been achieved in other provinces. Assuming a savings
benchmark of six to eight per cent of total spending on administration costs, the potential
savings in Ontario could be up to $1 billion. In addition, leveraging purchasing power,
standardizing procurement practices and managing inventory more effectively would generate
savings through lower costs for goods and services purchased.
Recommendation 5-96: Establish a central mechanism to oversee the creation of a “spot
market” for goods and discretionary services, such as diagnostics, infusions and specialist
consultation services.
A spot market is a system whereby if a hospital or other institution has an overstock of a
particular supply, they can instantly locate and quickly transfer goods to other institutions in the
province that are running short. If there is a need for a particular service in an institution, the
system would be able to quickly identify service providers and provide a portal through which a
price can be efficiently negotiated. This would achieve economies of scale across the system.
Recommendation 5-97: Put a wider array of specialist services to tender based on price and
quality, while remaining under the single-payer model.
Build on the success of the Kensington Eye Institute in treating cataracts quickly and
efficiently. This model could include private for-profit clinics that operate within the public payer
system. Government should continue to determine what services are offered and set the fees
paid by OHIP.
Recommendation 5-98: Put to tender more service delivery, but with the criteria for selection
based on quality-adjusted metrics rather than just price.
Recommendation 5-99: Accelerate the adoption of electronic records, working in a
bottom-up fashion.

200
Begin with doctors, clinics and hospitals and ensure that they use compatible systems. Then
build bridges within a region, and then across regions. Currently, 60 per cent of physicians
keep e-records. Incentives should be used to encourage physicians to adopt e-systems
through the development of usable data and analysis tools. Also, Ontario has a wealth of
information contained in the HBAM database that is currently underutilized. All HBAM data
should be improved through integration with the e-records system so that LHINs and health
care providers can use data to support evidence-based decision-making.
Recommendation 5-100: Adopt the Nova Scotia model in which emergency medical
technicians provide home care when not on emergency calls; this requires integrating
municipal and provincial funding structures.
Recommendation 5-101: Provide better information to individuals and families to facilitate
self-care, for people with conditions such as diabetes.
Scope of Public Sector
Recommendation 5-102: Begin a dialogue with Ontarians on the issue of expanding the
coverage of the health system to include, for example, pharmaceuticals, long-term care and
aspects of mental health care.
Such an expansion could be funded either within a social insurance model or within the current
public payer model that applies to most aspects of primary and physician care.
Reform Process
Recommendation 5-103: Involve all stakeholders in a mature conversation on the future of
health care and the 20-year plan.
History has proven that anything done in the health field can be politically dangerous,
especially if cost restraint is involved. There are ways to mitigate the risk that would clear
the way to important reforms. It will be critical to explain the objectives carefully to the public
and to stress that this is not just another round of cost restraint. The goal is to achieve
efficiencies while enhancing quality. Publication of a far-seeing plan — as set out in
Recommendation 5-1 — will be critical to the exercise. But this must be accompanied by
other communications including pamphlets, speeches, town halls and the use of social media.
The stars are aligning for a discussion on health care because the stakeholders are
themselves reaching out with proposals for reform, many of which are consistent with our
recommendations here. The government can use intermediaries to convene discussions with
stakeholders and the public.

Chapter 5: Health
201
The stakeholders themselves must speak out. Every citizen is a stakeholder, of course, and
should pay attention to and preferably take part in any debate. But we must also hear from
health care providers of all stripes, from drug companies whose products are one of the
fastest-growing components of costs, from employers who bear much of the cost growth
through coverage of their employees’ drug and other health costs, and from academics who
study these issues.
Recommendation 5-104: Establish a Commission to guide the health reforms.
The scale of reform we propose is vast, dealing with organizational, clinical and business
issues. There is a precedent for this approach; the Health Services Restructuring Commission
was given power from 1996 to 2000 to expedite hospital restructuring in the province and to
advise the Minister of Health on revamping other aspects of Ontario’s health system.71
Given that the scale of reform being proposed in this report extends well beyond hospitals,
a new commission should be established to guide the reforms, drawing from a broad range
of stakeholder communities, including providers and citizens/patients.
Recommendation 5-105: Do not let concerns about successor rights stop amalgamations
that make sense and are critical to successful reform.
Successor rights as currently defined do not necessarily limit the right of the government,
for legitimate reasons within its purview of responsibility, to engage in system reorganization.
Successor rights simply require that the government respect successor rights in doing so.
Inherited agreements do not live forever; provisions can be accepted initially and bargained
differently when they come up.
71 Schedule F of The Restructuring and Savings Act, S.O. 1996 Ch. 1 ("Bill 26,"), as quoted in “Looking Back, Looking Forward: The Ontario
Health Services Restructuring Commission (1996–2000), A Legacy Report,” p. iii, downloaded from http://www.health.gov.on.ca/hsrc/HSRC.pdf.

202
Conclusion
We believe these recommendations can guide the health care system over the period to
2017–18 in a way that meets our target of a 2.5 per cent annual increase in health care
funding by the province. In light of our recent past, this is a tough goal; it implies that real
inflation-adjusted spending per person on health care would have to fall by a total of
5.7 per cent in the seven years from 2010–11, or 0.8 per cent per year. But there are many
opportunities we can seize to reform the system in ways that bring better care to more people
at less cost.
The reforms we recommend matter most. Lashing out with major spending cuts solves little.
In the 1990s, the health budget was not only restrained, but cut for a few years. Because
thorough underlying reforms were not implemented, however, pressures built and spending
took off again, beginning in 1999. The experience left the public even more leery of moves to
save money or raise efficiency.
Beyond 2017–18, when a higher proportion of the baby boomers have reached the age at
which health care costs begin to escalate, spending will probably accelerate. But this is where
our recommendation for a 20-year plan and full public debate is crucial.
The tone of such a debate over our health care future matters. The government should
describe the challenges ahead that are posed by demographic and lifestyle changes. It should
highlight the potential to make the system more efficient in terms of both quality and cost.
It should discuss financial issues squarely. It should present the fundamental choices clearly.
The clear danger is that if we do not seize the opportunity to begin creating a more efficient
system that delivers more value for the money we spend on health care, one or two decades
from now, Ontarians will face options far less attractive than the ones we face today. Unless
we act now, Ontarians will be confronted with steadily escalating costs that force them to
choose either to forgo many other government services that they treasure, pay higher taxes to
cover a relentlessly growing health care bill, or privatize parts of the health care system,
something that is anathema to most Ontarians.
We can and should avoid such an outcome by making the right decisions today, however
tough they appear at the moment. Our decisions will not be perfect, but almost certainly,
they will ensure that we bequeath a more equitable, more cost-efficient and higher-quality
system to future generations.

Chapter 6: Elementary and Secondary Education
203
Chapter 6: Elementary and Secondary Education
2010–11 Spending $21.9 billion
Average Annual Growth Rate in Spending, 2001–02 to 2010–11 4.6%
Projected Average Annual Spending Growth Rate Under Status Quo, 2010–11 to 2017–18 4.2%
Average Annual Spending Growth Rate Cap Consistent with Return to a Balanced Budget in 2017–18 1.0%
Since their development in the mid-19th century, publicly funded schools have been a
cornerstone of Ontario’s public services. With the rise of the knowledge economy, a strong
education system is more critical than ever to Ontario’s prosperity and global competitiveness.
The importance of a strong foundation through education and the progress made in Ontario’s
education system in recent years must be kept in mind when considering how to meet
Ontario’s fiscal challenges. Still, we believe that this era of restraint presents an opportunity for
the government to ensure that education is delivered as efficiently and effectively as possible.
Historical Context and Recent Trends
The education sector includes programs and services that support elementary and secondary
education from junior kindergarten through Grade 12. The government provides funds to each
of Ontario’s 72 district school boards using a formula based on student enrolment, number of
schools and local factors, such as the demographic and geographic profile of individual
boards. School boards then make local decisions on funding and staffing schools,
implementing programs to enhance student achievement, and carry out capital projects with
ministry approvals.
Through the Ministry of Education, the province funds nearly 98 per cent of education sector
spending. School boards are funded through direct grants and the education portion of
property taxes. School boards’ expense represented about 94 per cent of the ministry’s total
expense in 2010–11. Over 76 per cent of ministry spending goes to salaries and benefits for
teaching and non-teaching staff.

204
Provincial spending on elementary and secondary education has grown significantly over
the past decade despite declining student enrolment. Since 2002–03, student enrolment
has declined from 1,997,000 to 1,877,000, a decrease of 6.0 per cent, or 0.7 per cent per year
on average. Despite this decline of 120,000 students, there are about 24,000 more teachers
and non-teaching staff in Ontario’s publicly funded schools. If teaching and non-teaching
staff had declined since 2002–03 proportionally to the decline in enrolment, there would
have been 35,000 fewer teaching and non-teaching staff in Ontario’s schools in 2010–11.
The combination of increased funding and declining enrolment has led to a 56 per cent
increase in per-pupil funding from $7,201 in 2002–03 to $11,207 in 2011–12.
Improved student success is critical to the creation of a better-educated and more successful
workforce. Key education priorities have included improved student achievement, reduced
gaps in student achievement and increased public confidence in Ontario’s publicly funded
schools. To advance these priorities, schools have been provided with funds to sustain labour
peace and stability; increase preparation time for elementary teachers; reduce class sizes;
support student achievement initiatives; and, as of 2010–11, begin implementation of a
provincewide full-day kindergarten program (FDK). New programs have been implemented to
improve provincial assessment results at underperforming schools and expand learning
options to increase graduation rates.
The terms of staff compensation, benefits and work structure are founded in collective
agreements mutually negotiated between each teacher federation or staff union and the
individual school boards. Over the past eight years, teacher federations and provincial
associations representing school trustees entered twice into four-year provincial labour
framework agreements, facilitated and funded by the province. In 2008, similar provincial
labour framework agreements were also reached with unions representing support staff.
The last two framework agreements provided for across-the-board salary increases of two
per cent to three per cent in each year of the agreements. While precise benefit levels can
vary by board, labour framework agreements have maintained or enhanced benefit levels,
which are reflected through annual school board funding benchmarks.
Teachers’ collective agreements also include salary grids, which provide salary increases for
teachers as they gain experience during their first 10 years as a teacher, and as they acquire
additional qualifications. Salary increases through the qualification and experience grid are
provided in addition to any across-the-board salary increase specified in the collective
agreement. This means that even without future across-the-board wage increases, teachers
who are not at the top of the grid would still receive real salary increases, provided the grid
and inflation remain approximately at current levels. The same can be said for most support-
staff workers who may not be at the top of their respective salary grids.

Chapter 6: Elementary and Secondary Education
205
Terms of work for classroom teachers in labour framework agreements include increased
teacher preparation time and class-size reductions. These provisions have resulted in
increases in the number of teaching staff. The amount of preparation time allotted to
elementary teachers has increased steadily through the agreements; actual preparation time
for elementary teachers has increased from 152 minutes per week in 2002–03 to 240 minutes
per week in 2011–12. Current school board funding projections include funds for additional
teachers to support specific class sizes; there are hard caps on class sizes of 20 students per
class from junior kindergarten to Grade 3 (excluding FDK), with the option of going up to 23
students in 10 per cent of classes. Certain collective agreement provisions play a central role
in determining the staffing levels at schools and the allocation of time by school staff.
The Current Challenge
These recent trends have led to a status quo in elementary and secondary education
expenditures that is not sustainable given the government’s fiscal constraints. In terms of
immediate costs, the ministry must manage 2011–12 school-year funding commitments that
have not yet been fully absorbed on a fiscal-year basis, and there are provisions of the current
labour framework agreement that kick in on Aug. 31, 2012. Amortization costs incurred
because of approved or existing school renewal projects cannot be avoided. The ministry is
expecting increased costs associated with the qualifications and experience of teachers in the
range of $900 million by 2017–18, before factoring in the impact of retirements. School boards
will face other cost pressures associated with benefits, utilities and fuel. Against this backdrop,
the next collective agreements must be negotiated in a climate of overall fiscal restraint.
The government’s newly introduced FDK program will further increase costs in the education
sector over the next several years and beyond. The program represents a substantial
investment in education with long-term fiscal implications. The program has now been rolled
out in almost 800 schools, with enrolment of about 50,000. That is about one-fifth of the
intended 247,000 students to receive a full day of kindergarten learning when the program is
available across the province in the 2014–15 school year. The program has been implemented
with a staffing model of one teacher and one early childhood educator (ECE) per classroom
during the school day, with an average class size of 26. As a result, 3,000 new teachers and
20,000 ECEs will be added in schools by September 2014. Further implementation will cost an
additional $1.2 billion, resulting in an annual commitment of over $1.5 billion when the program
reaches full maturity.
Because it represents a large and growing share of government expenditures, education
sector spending growth poses a substantial challenge to the government’s plan to return to
balance. Maintaining the existing policy framework and program delivery model for elementary
and secondary education may result in average funding increases of about four per cent per
year until 2017–18.

206
Recommendation 6-1: To meet our overall fiscal objectives, the Commission believes that
the growth rate in the education budget over the term from 2010–11 to 2017–18 must be
constrained to one per cent per year.
The government faces the challenge of restraining the growth of spending on education while
protecting the scholastic progress achieved. Demographics will help initially, because
enrolment is expected to keep declining until 2013–14. But enrolment will begin to rise again
by 2015–16. This projected increase must be considered when planning for a period of
controlled growth in the education sector.
The bottom line for the education sector is the following: • The government has committed to fund the remaining expansion of FDK, at an incremental cost of $1.2 billion over the cost
already budgeted in 2010–11;
• Based on most recent trends of settlements in the broader public sector (BPS), compensation costs could increase by $2 billion between 2010–11 and 2017–18;
• The current funding model features real fiscal pressures to the government estimated at $1.2 billion by 2017–18, funding enhancements already announced, capital projects already approved, and estimated increases in salary costs associated with teacher qualifications and experience;
• These three key pressures total $4.4 billion. The Commission recommends a one per cent annual increase in education spending, generating $1.6 billion in additional revenues by 2017–18, leaving a shortfall of $2.8 billion by 2017–18; and
• This shortfall does not include eventual potential pressures in areas such as benefits, utilities, and so on.
Throughout the remainder of the chapter, we present recommendations aimed at assisting the
government as it tries to alleviate the substantial fiscal pressures that now weigh on the
elementary and secondary education sector. We believe these recommendations will meet the
one per cent average annual growth target for a return to a balanced budget, while striving to
maintain the progress already made in student outcomes.

Chapter 6: Elementary and Secondary Education
207
The Commission is fully mindful of this progress. An agenda focused on student achievement
has brought notable results:
69 per cent of Ontario Grade 3 and Grade 6 students met or exceeded the provincial
standard (level 3 or “B” Grade) in reading, writing and math in 2010–11, up from 54 per
cent in 2002–03; and
The high school graduation rate in 2009–10 was 81 per cent, up from 68 per cent in
2003–04.
There has been improved co-operation among government, school boards and school staff in
recent years.
Recommendation 6-2: The budget constraint must be applied strategically so as not to
jeopardize the improvements in results achieved, such as on provincial assessments and with
graduation rates.
However, since compensation costs make up over three-quarters of the education sector
budget, the recommended one per cent growth rate target would be difficult to achieve without
restraint in this area.
Commission’s Principles and Goals
The government’s approach to the education sector should continue to focus on capacity-
building, strong classroom instruction and the promotion of sound pedagogy rather than
structural reform. Steps should be taken to ensure fiscal sustainability in the education sector
while staying the course with its agenda of improving student achievement, closing student
achievement gaps and increasing confidence in the publicly funded education system.
Progress towards the achievement of these goals has been driven by efforts at the local and
provincial levels. Schools, school boards and the province have worked together to develop
tools and best practices to promote student achievement and take action when goals are not
being met. This “pressure and support” approach to accountability has been the basis for
consistent performance improvement, and should be sustained as reforms are enacted.

208
Recommendation 6-3: The elementary and secondary education sector should stay the
course with its current agenda, which consists of three key goals: improving student
achievement, closing gaps in student outcomes and increasing confidence in the publicly
funded school system. The province and the sector must sustain the current alignment
between provincial, school board and school-level efforts, and sustain the “pressure and
support” approach adopted in recent years.
Co-operation across the sector will continue to play a vital role in achieving goals and building
on recent successes.
Recommendation 6-4: Reforms in the elementary and secondary sector should be introduced
so that all stakeholders have their role to play in ensuring the system’s long-term sustainability
and so that unnecessary sources of distraction are avoided.
Recommendation 6-5: To ensure transparency and effectiveness, the province should
confirm multi-year allocations to school boards for the 2012–13 to 2017–18 period so that they
can plan accordingly, have enough time to find the required efficiencies and enter negotiations
for renewal of the sector’s collective agreements that will expire on Aug. 31, 2012, with clear
knowledge of their budgetary position.
A sound and transparent approach to fiscal planning will also enhance co-operation and
stability. Multi-year allocations will improve the ability of boards to improve efficiency while
protecting key elements of local service. They will also support constructive collective
bargaining. This is likely the Commission’s most important recommendation for the education
sector. Failure by the government to implement this recommendation will lead to poor planning
and decision-making by the sector.

Chapter 6: Elementary and Secondary Education
209
Investments for the Future in First Nations Education
To achieve the government’s objective to return to balance by 2017–18, restraint will be
necessary to curb spending growth through targeted reductions. It will be equally important to
reallocate scarce resources to support strategic investments that will lower long-run costs and
reap significant social dividends.
The Commission believes that there is an urgent need to significantly improve the provision of
on-reserve First Nations education in the province. The current state of on-reserve education
in Ontario is unacceptable. There is a substantial and growing gap in educational attainment
between First Nations peoples living on-reserve and the rest of the Canadian population.1
Data from the 2006 census show that only 40 per cent of on-reserve First Nations adults have
completed high school, compared with 76 per cent of Canada’s overall adult population,
a difference of 36 percentage points.2 Alarmingly, this gap rises to 41 percentage points when
looking specifically at the population aged 25 to 34 (see chart that follows).3 These figures
reflect stagnant outcomes for on-reserve youth contrasted with continuous intergenerational
gains in the high school completion rate of Canada’s non-Aboriginal population.
1 In 2000, the Auditor General of Canada, in an audit of Indian and Northern Affairs Canada’s (INAC) elementary and secondary education
programs, reported that the 1996 Census found a 28 percentage point gap between the on-reserve high school completion rate and that of the Canadian population as a whole. A followup audit in 2004 reporting on 2001 census data found that while the attainment gap had narrowed by 1.3 per cent, the pace of improvement had slowed. Most recently, the 2011 Auditor General’s Status Report found that the trend of slow improvement was reversed over the period from 2001 to 2006, with the attainment gap widening to 36 percentage points.
2 Statistics Canada, Census of Canada, 2006. 3 Ibid.

210
5147
59
28 27
39
10 12
26
0
10
20
30
40
50
60
70
Ages 25 to 34 Ages 35 to 44 Ages 45 and over
North American Indian/First Nations On-reserve North American Indian/First Nations Off-reserve Non-Aboriginal
Source: 2006 Census as reported in Canadian Policy Research Networks 2009.
Per Cent
CHART 6.1 Share of Population with Incomplete K–12 Education, 2006
Improving educational attainment is critical to improving social and economic outcomes for
First Nations peoples. A long-overdue investment in on-reserve education will help alleviate
the long-run costs of the economic exclusion of Ontario’s growing First Nations communities.4
The Cost of the Status Quo In 2009, the Centre for the Study of Living Standards (CSLS) published a report estimating the potential long-run returns of closing the gap in educational attainment and labour-market performance between Aboriginal and non-Aboriginal Canadians. The study looked at the potential gains in overall economic activity as well as the potential benefit to governments’ balance sheets. The CSLS estimated that if these gaps were fully eliminated, Canada could realize a cumulative increase in real economic output of $401 billion over the period from 2001 to 2026. Of this figure, $180 billion is attributed to the impact of improved educational outcomes alone. Further, CSLS estimated that together, governments’ fiscal position could improve by $116 billion as a result of $77 billion less in excess expenditures due to the Aboriginal population’s above-average use of government programs such as health care, social services and the justice system, and $39 billion in increased tax revenue.
Source: “The Effect of Increasing Aboriginal Educational Attainment on the Labour Force, Output and the Fiscal Balance,” Centre for the Study of Living Standards, 2009.
4 This general conclusion is reached in a multitude of studies, including the Centre for the Study of Living Standards, TD Economics and
Canadian Policy Research Networks.

Chapter 6: Elementary and Secondary Education
211
Although on-reserve education is a federal responsibility, the province is affected because
there is significant student mobility between on-reserve and provincially funded schools.
The majority of Aboriginal students in Ontario are educated in provincially funded schools.
In addition, many secondary students living on-reserve are educated off-reserve in provincially
funded district schools through tuition agreements and the underfunding of on-reserve
elementary schools often translates into acute remedial needs at the secondary level in
provincially funded schools.
The federal government identifies “comparability” as a general objective for on-reserve
education.5 It is commonly noted, however, that federal funding falls well short of parity with
provincial education spending on a per-student basis.6 The intolerable delays from the federal
government to increase per-student funding for on-reserve education to close the gap with
provincial funding levels must end.
Recommendation 6-6: The Ontario government should put strong pressure on the federal
government to provide funding for First Nations on-reserve education that at least reaches
parity with per-student provincial funding for elementary and secondary education.
Recommendation 6-7: The province should negotiate with the federal government and First
Nations to ensure the establishment of new multi-year, strategic top-up funding agreements for
on-reserve schools. These agreements, voluntary for interested First Nations, would ensure
that per-student funding for on-reserve schools is at least equivalent to that provided to
adjacent English-language public district school boards.
The federal government’s current approach to funding on-reserve education in Ontario
involves funding individual bands and stand-alone schools. This “one-school, stand-alone
model” does not allow for economies of scale in the provision of educational services.
Back-office services, which are typically supplied by district school boards and provincial
ministries of education, include functions ranging from curriculum development to long-term
capital management.7 Without a comprehensive education system, individual bands and
schools may have less capacity to provide specialized services such as speech therapy and
counselling that are generally shared among schools in district boards. The creation of
administrative bodies could help achieve economies of scale and improve the provision of
educational services on-reserve.
5 Tonina Simone, “Current and Emerging Issues: First Nations Education,” Library of Parliament (2011), p. 22. 6 See, for example, Don Drummond and Derek Burleton, “Aboriginal People in Canada: Growing Mutual Economic Interests Offer
Significant Promise for Improving Well-being of the Aboriginal Population,” TD Economics, (2009), p. 9, and Michael Mendelson, “Improving Education on Reserves: A First Nations Education Authority Act,” Caledon Institute of Social Policy, (2008), p. 7.
7 Michael Mendelson, “Why We Need a First Nations Education Act,” Caledon Institute of Social Policy, (2009), p. 5.

212
Recommendation 6-8: Agreements with the federal government should facilitate the
formation of education entities among participating First Nations with powers similar to
provincially funded district school boards. To establish a system of support services for
on-reserve schools, chief executive officers of the new education entities should join the
Council of Ontario Directors of Education as well as the regional education councils.
Additionally, the new education entities should negotiate with the province multi-year targets
for the proportion of supervisory officers, principals and teachers who will be deemed qualified
by the Ontario College of Teachers. Such qualifications can be earned from existing providers
or from newly accredited Aboriginal service providers.
Recommendation 6-9: When negotiating funding agreements, the province should pressure
the federal government to increase funding for capital for on-reserve schools and consider
transferring this funding to the province, which is better equipped to provide expertise for
K–12 capital renewal and construction.
Recommendation 6-10: Failing to come to an agreement with the federal government,
the Commission recommends that the province step up to provide funding to ensure that
on-reserve schools are funded at parity with adjacent English-language public district
school boards.

Chapter 6: Elementary and Secondary Education
213
Affordability of the Full-Day Kindergarten Program
In recent years, the government has devoted significant attention and resources to early
learning. In 2009, the government committed to implementing full-day learning for four- and
five-year-olds with an investment of $200 million in 2010–11 and $300 million in 2011–12.
Dr. Charles Pascal was appointed as the Premier’s special advisor on early learning8, and was
asked to provide recommendations for implementing a full-day early learning program.
Dr. Pascal’s 2009 report, “With Our Best Future in Mind,” recommended the development and
implementation of a coherent approach to early childhood development and education,
including FDK for four- and five-year-olds. Dr. Pascal also recommended before- and after-
school programming for kindergarten students, funded through parent fees.
In September 2010, FDK was launched in nearly 600 schools across Ontario. The rollout has
continued in 2011 with an additional 200 schools, and about 900 new school sites have been
announced for the 2012–13 school year. A framework for the extended-day component of the
program has also been set; school boards offer the program either independently or through
on-site third-party partners, in areas where there is enough demand.
The Commission appreciates the research and analysis performed by Dr. Pascal. There is
substantial evidence that investments in early childhood education produce significant
socio-economic benefits in the long term. The Pascal report offers a plan that reduces gaps
in child development policy, supports student achievement, and promotes better long-term
economic, health and social outcomes.
However, consideration must also be given to the demands placed on the education system
by the program, and the resources required to meet these demands. Costs associated with
new staff, classroom supplies, transportation, other school operations, capital and stabilization
for the child care sector will result in a mature program expense of over $1.5 billion per year.
Given the current fiscal climate, the Commission is concerned that the timing is not
appropriate for a new program with a cost of this magnitude. The costs of FDK were
incorporated into the March 2011 Budget and the 2011 Ontario Economic Outlook and Fiscal
Review in November. But as we have discussed elsewhere, not enough offsetting restraint
was secured in other spending to ensure that these fiscal plans would achieve the overall
deficit objective.
8 Dr. Charles Pascal was appointed in 2007.

214
The Commission considered recommending the suspension of further implementation of the
FDK program, with a progressive redistribution over time of the funded sites to communities
with the lowest socio-economic status within each board. However, such an approach would
create inequalities, and would pose additional challenges for families, schools, boards and
government.
Recommendation 6-11: Given the difficulties with such an approach, and the prohibitive cost
of the program overall at this time, the Commission recommends cancellation of the full-day
kindergarten (FDK) program, without prejudice to schools that already had FDK before the
introduction of this government strategy.
The Ministry of Education should carefully develop phase-out provisions so that a child who
had a full day in junior kindergarten would not move to a half day in senior kindergarten, and
so that purpose-built spaces are appropriately utilized for child care.
Recommendation 6-12: If the government decides to continue the implementation of the
full-day kindergarten program, then the Commission recommends delaying full implementation
from 2014–15 to 2017–18 and reducing program costs by adopting a more affordable staffing
model, involving one teacher for about 20 students, rather than a teacher and an early
childhood educator for 26 students, to help moderate salary expenditures for the program by
about $200 million. The government should not confirm full implementation of the program
without assurances from school boards, teacher federations and support-staff unions that
negotiated annual wage increases by 2017–18 will not be higher than the current trends in the
broader public sector, and that the class-size increases and reductions in non-teaching staff
contemplated by the Commission by 2017–18 will be achieved.
This approach would also help ease the oversupply of teachers in the labour market and
reduce costs associated with correcting the current undersupply of ECEs.

Chapter 6: Elementary and Secondary Education
215
Class Sizes
The determinants of high student achievement have been a topic of significant debate among
researchers, education-sector stakeholders and governments. Attention has been paid to the
relationship between socio-economic status and education outcomes. Concurrently, significant
efforts have been made to help policy-makers decide how best to allocate resources to
support better outcomes for students.
One of Ontario’s fundamental strategies to support improvements in student achievement has
been to reduce primary class sizes (kindergarten to Grade 3). Since 2008–09, 90 per cent of
classes have had no more than 20 students and the remainder have been capped at
23 students.
These reductions in class size have required significant resources. In 2004–05, when
primary class sizes were funded at an average of 24.5 students per class, the ministry
provided a $90 million, primary class-size reduction grant as a first step to reducing class
sizes to 20 students or fewer. By 2009–10, this grant had increased to over $430 million.
In 2010–11, the funding formula ensured that primary classes were funded based on a class
size of 19.8 students. Capital investments were also made to allow schools to accommodate
smaller class sizes.
The government has also committed resources to reducing class sizes at other levels.
The 2008 provincial labour framework agreements included funding to decrease average
class sizes in Grade 4 through Grade 8 by 0.5 student between 2009–10 and 2012–13. At the
secondary level, increases for teacher preparation time and additional teachers as part of the
Student Success Strategy have also resulted in increased resources.
The government has emphasized the importance of smaller classes in promoting improved
education outcomes. Since 2003, the government has maintained that smaller classes yield
better results through greater teacher-student interaction.9 In its “2011 Progress Report,” the
government said that “[s]tudents in smaller classes get more individual attention from teachers
and other educators, helping improve literacy and numeracy and are more likely to succeed.”
Indeed, Ontario’s recent improvements on provincial assessments and quality indicators have
coincided with the government’s efforts to reduce class sizes.
9 See Ministry of Education, “Building the Ontario Education Advantage: Student Achievement,” Apr. 29, 2004,
http://www.edu.gov.on.ca/eng/document/nr/04.03/building.pdf.; Education — 2011 Progress Report, http://www.ontario.ca/en/initiatives/progressreport2011/ONT05_039131.html?openNav=education.

216
Empirical evidence of the benefit of smaller class sizes on education outcomes presents a
more complicated picture. A review of Ontario’s primary class-size policy by the Canadian
Education Association notes that class-size reductions typically yield at least modest quality
improvements, but questions of “what size class is ‘small enough,’ how and why reducing
class size works, and under what conditions it works, are all under-explained.”10 Research by
the C.D. Howe Institute suggests that “no solid evidence exists to show that smaller classes
improve student achievement in the later primary and secondary grades in Canada.”11
International evidence of the educational benefit of smaller class sizes offers similar
conclusions. Studies have suggested that positive and negative impacts of class sizes were
observed in the same proportion of classes (14 per cent each), while nearly 72 per cent
of results showed no statistically significant impacts.12 The Organization for Economic
Co-operation and Development’s (OECD) Programme for International Student Assessment
(PISA) has shown that “[a]mong systems with comparatively high levels of spending on
education that prioritize small class size, performance patterns are mixed.”13 This evidence
suggests that small class sizes are not a key determinant of educational outcomes, and
certainly small class sizes alone are an insufficient measure to achieve these outcomes.
The debate over the impact of smaller class sizes continues to this day, with conflicting
conclusions and no definite outcome. However, evidence suggests that, in terms of value for
money, investments in lower class sizes do not provide the greatest possible benefit. The
PISA finds that “raising teacher quality is a more effective route to improved student outcomes
than creating smaller classes.”14 Similarly, the C.D. Howe Institute notes that resources
devoted to class-size reduction could have a greater impact if reallocated elsewhere in the
education system.15
While it is true that Ontario’s recent improvements on provincial assessments and quality
indicators have coincided with the government’s efforts to reduce class sizes, there is no
evidence of causality. Even if the reduction of class sizes had some impact on outcomes, the
evidence suggests that investments in smaller classes do not offer the most efficient means of
improving results in the education system.
10 Canadian Education Association, “Ontario’s Primary Class Size Reduction Initiative: Report on Early Implementation,”
February 2010, p. 6. 11 Yvan Guillemette, “School Class Size: Smaller Isn’t Better,” C.D. Howe Institute Commentary 215 (August 2005), p. 13. 12 Eric A. Hanushek, “Assessing the Effects of School Resources on Student Performance: An Update,” Educational Evaluation and Policy
Analysis 19 (June 1997), no. 2; Hanushek, “Evidence, Politics and the Class Size Debate,” in The Class Size Debate, Lawrence Mishel and Richard Rothstein (eds.) (Washington: Economic Policy Institute, 2002), p. 42.
13 Organization for Economic Co-operation and Development, “PISA 2009 Results: What Makes a School Successful?” Resources, Policies and Practices 4, p. 28.
14 Ibid, p. 106. 15 Guillemette, op. cit., p. 13.

Chapter 6: Elementary and Secondary Education
217
Given the lack of convincing empirical evidence to support a policy of reduced class sizes,
the Commission believes that scarce resources should not be applied to this goal.
Recommendation 6-13: Set the cap in class size for primary grades at 23 and eliminate the
other requirement that 90 per cent of classes must be at 20 or fewer, and increase the
averages in junior/intermediate class sizes from 24.5 to 26 and secondary class sizes from
22 to 24.
This shift in policy will undoubtedly dishearten important partners in the education sector.
The recommended increase in class sizes will lead to approximately 5,900 or 4.8 per cent
fewer teaching positions by 2017–18, representing an average annual attrition rate over the
next six years of 0.8 per cent among teaching staff.

218
Non-Teaching Staff
Aside from classroom teachers and ECEs, the Commission notes that since 2002–03, staffing
has increased by more than 13,800 in non-teaching positions. School boards have hired 5,500
more educational assistants, 4,000 more professionals and paraprofessionals, 1,500 more
school maintenance staff, 800 more co-ordinators and consultants/teacher support services,
700 more school office staff, 550 more library and guidance teaching and non-teaching staff,
400 more principals and vice-principals, and 350 more supervisory officers and board
administration staff.16 The Commission projects that about 70 per cent of these 13,800 new,
non-teaching positions must be phased out by 2017–18 through attrition and reductions,
representing annual savings of about $600 million.17 This represents roughly 9,700 fewer
positions (a decline of 11.8 per cent) out of a total of 82,000 positions in place in 2010–11 for
these job categories; by 2017–18, overall staffing for these job categories would fall back to
about their same level as in 2005 through average annual attrition of about two per cent over
the next six years among non-teaching staff. Boards will also have to examine how the
number of non-teaching staff can be reduced in a manner that minimizes impacts on
school operations.
The Commission hopes that an environment of co-operation, transparency and informed
multi-year human resources planning will make this difficult process as manageable and
constructive as possible.
The Commission recognizes the benefits of strategic ministry and school board interventions
to improve education outcomes. The ministry has worked with school boards to provide
additional resources to schools with potential for improved literacy and numeracy results, and
to encourage the adoption of best practices. This approach aligns with research that indicates
a greater benefit from smaller class sizes in lower-income schools.18 In light of this, the
ministry may set aside some of the savings from this for strategic interventions for
vulnerable groups.
16 Ontario Ministry of Education, “2002–03 to 2010–11 School Board Financial Statements,” “2010–11 Revised Estimates — Staffing FTE.”
Based on the revised 2010–11 estimate. 17 2010–11 School Board Revised Estimates – Compensation and Staffing for 2010–11 Education Sector Employees (2010–11 School
Year Basis). 18 Graham J. McKee, Steven G. Rivkin and Katharine R.E. Sims, “Disruption, Achievement and the Heterogeneous Benefits of Smaller
Classes,” NBER Working Paper 15812, March 2010, p. 22.

Chapter 6: Elementary and Secondary Education
219
Similarly, the Commission supports continued emphasis on programs that have proven critical
to increasing graduation rates. More students have graduated with the help of the Student
Success Strategy. Unique programming to support higher graduation rates, such as dual
credits, co-operative education and the Specialist High Skills Majors program, has encouraged
a transition to post-secondary education or better employment opportunities. Care should be
taken to increase class sizes in a manner that does not jeopardize programs that have helped
increase graduation rates and benefited Ontario students.
Limits to Funded Secondary School Credits
To obtain a secondary school diploma, Ontario students must complete 30 secondary school
credits, as well as 40 hours of community service and achievement of the provincial literacy
requirement. While only 30 credits are needed to graduate, the Commission has observed
that many students are completing more than the required number of credits. As a result,
14 per cent of the province’s Grade 12 students return for a fifth year of secondary
education.19
The financial pressure placed on school boards by students returning for additional credits has
been observed in other jurisdictions. A recent report to the Nova Scotia Department of
Education notes that, while there are “understandable reasons” for students returning for a fifth
year of high school, this activity increases public expense, and private tutoring may be a
suitable alternative.20
Recommendation 6-14: The province should cap the funding of high school credits to
32 successful credits per student, and amend the Education Act to give the power to school
boards to charge a modest fee, set by the province, for each additional credit above the
32 successfully completed credit threshold.
Students seeking additional qualifications may seek private alternatives to do so, and school
boards should be given authority to charge a fee set by the province, tied to the cost of
providing additional courses.
19 According to the Ontario Ministry of Education, in 2011 there were a total of 118,360 students who represent two groups of students who
return to secondary school for a fifth year: students who met the graduation requirements but return for a fifth year (50,051 students); and students who have not met the graduation requirements and have not accumulated sufficient credits by the end of their fourth year and must return for a fifth year (68,309 students).
20 Ben Levin, “Steps to Affordable and Sustainable Public Education in Nova Scotia,” Report to the Nova Scotia Department of Education, April 2011, p. 21.

220
Encouraging Efficient Student Transportation
Transporting students to school is a challenge for school boards. Costs associated with
transportation can be difficult to contain, in large part because fuel prices are volatile. To their
credit, the government and school boards have tried to reduce the growth of transportation
costs. The challenges of transportation costs were noted in the 2002 Report of the Education
Equality Task Force.21 The task force’s recommendations led to the adoption of a consortia
model, which called for co-operation in service delivery among coterminous boards. By 2006,
the ministry had integrated the consortia model into its funding formula.22 This approach
encouraged efficiencies through co-operation among adjacent school boards.
Despite these efforts, student transportation expenses have continued to increase.
The Student Transportation Grant in the Grants for Student Needs has increased from
$629 million in 2002–03 to an anticipated $845 million in 2011–12, an increase of over
34 per cent (an average of 3.3 per cent per year). The ministry has also recently placed a
moratorium on new competitive procurement in the sector while it consults with sector
stakeholders.23 This moratorium delays the achievement of efficient, effective student
transportation service through competitive bidding in the sector.
Recommendation 6-15: The province should immediately lift the moratorium on the
competitive procurement requirement for student transportation, so that competitive bids are
used for the 2012–13 school year.
While the government should continue to address student transportation expenses, the
Commission also sees an opportunity to promote sustainability through revenues. A modest
user fee for student transportation would shift a portion of the costs of transportation to those
who use the service. Such a fee could encourage boards to look for efficiencies to better
serve their clients, and would provide an incentive for families to examine other methods of
transportation. Similar approaches have been permitted and adopted in Alberta.24
21 Education Equality Task Force, “Investing in Public Education: Advancing the Goal of Continuous Improvement in Student Learning and
Achievement,” December 2002, downloaded from http://www.edu.gov.on.ca/eng/document/reports/task02/complete.pdf, pp. 48-51. 22 Ministry of Education, “Education Funding for 2006–07,” downloaded from
http://www.edu.gov.on.ca/eng/funding/0607/2006_07MemoB8.pdf. 23 Downloaded from http://www.edu.gov.on.ca/eng/policyfunding/memos/june2011/TransportJune.pdf. 24 Province of Alberta, School Act, s. 51(3).

Chapter 6: Elementary and Secondary Education
221
The Commission is aware of the importance of student transportation for keeping students
safe and providing access to learning. However, given the fiscal picture, it may be necessary
for users to bear a portion of the cost through a student transportation fee. Provisions could be
put in place to ensure that lower-income, special needs and rural students do not have their
access to learning restricted.
Recommendation 6-16: The province should amend the Education Act to give school boards
the power to charge a modest transportation user fee set by the province.

222
A Comprehensive Resource Plan to Live Within One Per Cent Per Year in Education
The funding policy changes contemplated by the Commission to live within a one per cent
annual growth rate in education program spending to 2017–18 are summarized below:
Our recommendation of a one per cent annual increase in education funding means that the
education sector’s 2017–18 budget will be $1.6 billion larger than it was in 2010–11. However,
a combination of higher compensation costs, the remainder of FDK expansion as now planned
and other real fiscal pressures point to an additional $4.4 billion in spending in 2017–18, as
shown in the table below. The result in 2017–18 is a shortfall of $2.8 billion:
TABLE 6.1 2017–18: Where the Status Quo Outlook Leads with 1% Annual Spending Growth
1% growth per year in education spending increases by 2017–18 $1.6 Billion Compensation cost increases by 2017–18 (Annual wage increases as per current public-sector trends of settlements — MOL BPS data)
($2.0 Billion)
Remainder of FDK expansion under current model ($1.2 Billion) Real fiscal pressures by 2017–18 (annualization of 2011–12 enhancements, amortization of approved capital projects, increased teacher qualifications and experience)
($1.2 Billion)
Shortfall ($2.8 Billion)

Chapter 6: Elementary and Secondary Education
223
To enable the government to balance its budget by 2017–18, the Commission has made a
number of recommendations for the elementary and secondary education sector. In the table
below, we begin with the $2.8 billion shortfall from the table above and then reduce it to zero
as we set out the savings from each of our recommendations. These are listed in order
of priority:
TABLE 6.2 2017–18: How 1% Annual Spending Growth Can Be Managed Shortfall ($2.8 Billion) Provision for top funding agreements with First Nations ($0.15 Billion) Capping secondary school funding to 32 successfully completed credits $0.07 Billion 25% reduction by 2017–18 in non-salary investments such as the pupil foundation allocation portion for textbooks and learning materials, classroom supplies and classroom computers
$0.12 Billion
Increase in average class size in Grades 9–12 from 22 to 24 students by 2017–18 $0.23 Billion Set the cap in class size at 23 in primary grades and eliminate the other requirement that 90% of classes must be at 20 or fewer by 2017–18
$0.09 Billion
Increase in average class size in Grades 4–8 from 24.5 to 26 students by 2017–18 $0.14 Billion Elimination by 2017–18 of 70% of the non-teaching staffing increases implemented since 2002–03 (9,700 out of 13,800 new positions created — educational assistants excluding early childhood educators, professionals and paraprofessionals, library and guidance, school office, principals, vice-principals, teacher consultants, supervisory officers, board administration, school maintenance) — Represents annual attrition rate of 1.9% over next six years within these job categories
$0.6 Billion
Cancellation of FDK program $1.4 Billion 25% reduction by 2017–18 in non-salary Investments such as student transportation grant and school renewal allocation
$0.3 Billion
Shortfall $0.0 Billion
Recommendation 6-17: Education stakeholders should build on the climate of trust and
evidence-based decision-making fostered since 2003 to begin a constructive dialogue on how
best to find the savings needed to meet student achievement objectives while holding annual
spending growth to one per cent. To help stakeholders, the Commission believes the following
measures should be phased in progressively over the next six years, in this priority sequence:
Reduce by 25 per cent the per-pupil funding for textbooks and learning materials,
classroom supplies and computers;
Increase the average class size from 22 to 24 in Grades 9 to 12;
Set the cap in class size at 23 in primary grades and eliminate the other requirement that
90 per cent of classes must be at 20 or fewer;
Increase the average class size from 24.5 to 26 in Grades 4 to 8 by 2017–18;
Eliminate 70 per cent of the 13,800 additional non-teaching positions created in school
boards since 2002–03; and
Reduce by 25 per cent the funding for capital renewal and student transportation.

224
The Commission acknowledges that current provisions in some collective agreements may
prevent some school boards from implementing some of these measures. The willingness of
teacher federations and support-staff unions to agree to remove such obstacles should be a
consideration when the province decides, either through new provincial labour frameworks or
through its education funding policy, to fund wage increases by 2017–18.
School boards, teacher federations and support-staff unions may be able to lessen the impact
of the $1.06 billion in savings from larger class sizes and fewer non-teaching staff by agreeing
to compensation increases that are below the current settlement trends in the BPS. The
growth in wages across the BPS has slowed since the government introduced its restraint
policy in March 2010.25 While the parties may be able to secure lower compensation increases
in the early years, the Commission doubts that it is realistic to assume that such a pattern can
persist through to 2017–18.
As indicated in Table 6.2, the Commission has identified other potential restraint measures in
non-salary expenditures related to textbooks, learning materials, classroom supplies and
computers. Permanent funding reductions in capital renewal and student transportation can be
considered, although they would remain the lowest-priority measures recommended by the
Commission.
The Commission assumes that school boards would achieve further efficiencies or seek
increases to other revenues to offset cost pressures from such items as benefits, utilities, fuel
and so on. The following recommendations, while not explicitly costed, have been developed
in this spirit.
We note in Chapter 18, Revenue Integrity, the province could increase revenues for education
by just over $1 billion by 2017–18 through raising the lower business education tax (BET)
rates. Additionally, we discuss a review of education tax rate setting policies for residential and
business tax rates to maintain a stable level of education tax revenues in real terms. Please
see Chapter 18, Revenue Integrity, for further discussion of education taxes.
25 Average annual wage increases in the Ontario BPS (excluding municipalities and federal employees) averaged
1.5 per cent for contracts ratified between April 2010 and Dec. 6, 2011.

Chapter 6: Elementary and Secondary Education
225
Promoting Evidence-Based Solutions in Special Education
Special education grants are a significant portion of education spending, $2.5 billion in
2011–12, about 12 per cent of all grant-based funding for school boards. Since 2002–03,
special education funding has increased by $893 million, or 55 per cent, despite declining
enrolment.26 If funding had grown by only three per cent per year over that period, which would
represent a healthy allowance for inflation and cost escalation, annual funding today would be
almost $400 million less.
Ontario’s Auditor General took note of this rapid growth rate in a 2008 report assessing the
extent to which Ontario’s special education programs met the needs of students and were
delivered “economically and efficiently.” He found “still a number of areas where practices
need to be improved to ensure that the significant funding increases result in continuous
improvement in the outcomes for students with special education needs in Ontario.”27 In a
2010 followup audit, the Auditor General noted progress on a number of recommendations.
The link between increased funding and outcomes for students, however, is not obvious.
Since 2002–03, total enrolment has declined, but the number of students that school boards
report as needing special education services has grown. A student with exceptionalities is
defined by the Education Act as one who requires placement in a special education program
because he or she has one or more special behavioural, communicational, intellectual or
physical needs. School boards are responsible for providing early and continuing identification
of students with exceptionalities through Identification, Placement and Review Committees
(IPRCs). Under the Education Act, all students identified as exceptional must have access to
special education programs. But this requirement does not account for all students receiving
special education services. In the 2007–08 school year, for example, 192,000 students were
identified by an IPRC as exceptional and an additional 96,600 students were provided with
special education programs and services, even though they were not formally identified as
exceptional.28
The Ministry of Education’s data-driven funding allocations for special education are based,
in part, on information reported by school boards. The data, and consequently future
allocations, reflect variation in boards’ philosophies, practices, exceptionality thresholds,
program and service delivery models, and abilities to access community resources. If all
boards used provincial criteria for their IPRCs and if all data were reported independently,
special education funding could be allocated more consistently and more equitably while
maintaining local flexibility and decision-making.
26 Ministry of Education, “Grants for Student Needs Technical Paper 2011–12,” downloaded from
http://www.edu.gov.on.ca/eng/general/elemsec/speced/ontario.html. 27 “2008 Annual Report of the Office of the Ontario Auditor General,” section 3.14, p. 365. 28 Ministry of Education website, http://www.edu.gov.on.ca/eng/general/elemsec/speced/ontario.html.

226
We need more information to understand the impact of increased special education funding on
student achievement. The average gap in student outcomes on Grade 3 and 6 assessments
by the Education Quality and Accountability Office (EQAO) between students with special
needs (excluding gifted) and the overall student population decreased from 36.7 per cent in
2002–03 to 33 per cent in 2010–11. However, there is no system-wide procedure to track
progress and achievement in students in areas such as communication skills, social skills or
behaviour management, all of which affect student achievement. However, some progress has
been made. The Commission recognizes the benefit of pilot initiatives such as the Assessing
Achievement in Alternative Areas guidelines that have been developed to enhance
assessment processes for students with special education needs who do not access the
Ontario curriculum and do not participate in EQAO assessments. More needs to be done,
however, to ensure that funding is being used effectively in a manner that improves
student outcomes.
The Commission commends the province’s focus on supporting students with special needs.
To meet overall spending targets while preserving gains in student achievement, however,
every dollar must be directed to programs where it will achieve the most impact. This will
ensure that investments in special education are being used effectively to improve outcomes.
Recommendation 6-18: The province should review its special education programs and the
results they have achieved, including both “section” programs for students in care, custody or
treatment, and hospital boards, with the aim of ensuring that funding is being used effectively
to improve student outcomes.
As rapidly as special education funding has risen, many school boards report “a deficit” in this
area. It should be noted that to a large extent such deficits are artificial. Any underspending on
special education is taken back by the ministry. It cannot be carried forward to a subsequent
year. This creates an incentive to plan on spending more than will be received. While this
convention protects the use of special education funds for their prescribed purpose, it yields a
misleading assessment of needs. And it often leads to public criticisms of “special education
deficits” that are not well grounded.
For clarity, the Commission does not believe there is a “problem” in the overall special
education funding envelope, or even in the way it is currently allocated among school boards.
The challenge we see is the lack of measurable outcomes from the significant investments
made since 2002–03.

Chapter 6: Elementary and Secondary Education
227
Reform of Provincial Schools
The Ministry of Education directly manages a number of schools for the deaf, Demonstration
Schools for students with learning disabilities and a School for the Blind and Deafblind; these
are located in Belleville, Brantford, London, Milton and Ottawa. About 800 students are served
in these eight schools. Most of the students live in residence on the schools’ property. School
staff members are provincial employees. The provincial schools budget for 2011–12 is
$72 million.29
The Commission believes that the Ontario Public Service is not the optimal governance
arrangement for these schools. Alternative programming in school boards should be
considered instead of Demonstration Schools for students with learning disabilities; this would
allow students to live with their families. Schools for the deaf need a critical mass to offer a
wide range of programs and services, especially at the secondary panel, yet enrolment has
declined significantly; these schools should be consolidated.
Recommendation 6-19: The government should close the Demonstration Schools and
reinvest savings to expand alternative secondary school programs in school boards.
The three Schools for the Deaf in Belleville, London and Milton should be consolidated into
one site to achieve a greater critical mass of students from primary grades through secondary
school. Savings should be reinvested in the consolidated school for the deaf and in enhanced
opportunities for deaf learners in school boards, colleges and universities. The Ministry of
Education should transfer the oversight and management of the Brantford site and of the
newly consolidated school for the deaf to one or two English-language school boards, and
transfer the oversight and management of the Centre Jules-Léger (School for the Deaf) to a
French-language school board.
29 In FY11–12, according to the Ontario Ministry of Education, Provincial Schools Budget is $80.6 million, broken down as follows: operating,
$72 million and capital, $8.6 million. Please note that the capital amount does not include assets and statutory appropriations.

228
Appropriate Incentives for Teachers
Ontario’s goal is a public service that delivers consistent quality, generates excellent value for
money and supports the best possible outcomes for those it serves. A public service of this
sort can only be sustained by recruiting the best and the brightest workforce. If government is
to recruit highly skilled people away from opportunities with other organizations, it needs to
offer a compensation package with appropriate incentives tied to performance, outcomes
and productivity.
These principles have particular resonance in the education sector. Public education is a vital
public service in promoting child development and future prosperity. Teachers are charged
with the critical responsibility of providing service in a manner that promotes the best possible
outcomes on these fronts. Research supports the linkage between quality teachers and
student achievement. For example, one study suggests that jurisdictions seeking to improve
student achievement “may be well-advised to attend, at least in part, to the preparation and
qualifications of the teachers they hire and retain in the profession.”30
A precise relationship between quality and specific types or levels of teacher training is more
difficult to determine, especially because it is difficult to estimate the effects of good teaching
and how long they last.31 However, meaningful and effective professional development is
regarded as an important component of an evaluation and compensation system that supports
student success.32 Research could yield further information that policy-makers would find
useful. For example, the impact of a particular form of teacher training may vary by subject;
studies have suggested that there is a stronger correlation between teacher training and the
student learning experience in mathematics than in other subjects.33 This type of information
could be applied to policies that encourage the most effective forms of teacher training.
Ontario teachers are provided salary increases as incentives to engage in continued learning
and development through the Teacher Qualifications and Experience (Q&E) grant, which
recognizes the additional experience they gain each year between their second and eleventh
year of teaching. These increases are in addition to any across-the-board salary increases
negotiated in collective agreements.
30 Linda Darling-Hammond, “Teacher Quality and Student Achievement: A Review of State Policy Evidence,” Center for the Study of
Teaching and Policy, December 1999, downloaded from http://www.nctaf.org/strategies/assure/teacher_quality_assurance/documents/LDH_State_Policy_Evidence.pdf, pp. 38-39.
31 See, for example, Thomas J. Kane, Douglas O. Staiger, “Estimating Teacher Impacts on Student Achievement: An Experimental Evaluation,” NBER Working Paper 14607, December 2008; Jesse Rothstein, “Teacher Quality in Educational Production: Tracking, Decay, and Student Achievement,” The Quarterly Journal of Economics 125 (2010), no. 1, pp. 175–214.
32 Daniel Weisberg, Susan Sexton, Jennifer Mulhern and David Keeling, The Widget Effect: Our National Failure to Acknowledge and Act on Differences in Teacher Effectiveness (Brooklyn: The New Teacher Project, 2009), pp. 7–8, downloaded from http://widgeteffect.org/downloads/TheWidgetEffect.pdf.
33 Andrew J. Wayne and Peter Youngs, “Teacher Characteristics and Student Achievement Gains: A Review,” Review of Educational Research 73 (Spring 2003), no. 1, p. 103.

Chapter 6: Elementary and Secondary Education
229
The Q&E grant also allows teachers to move into more advanced qualification categories, with
higher salaries, by completing courses of further post-secondary education or in
specializations or teacher training. A teacher’s qualification category is determined by bodies
set up by the teacher federations. The Elementary Teachers' Federation of Ontario, the
Ontario English Catholic Teachers Association and l’Association des enseignantes et des
enseignants franco-ontariens jointly established the Qualifications Evaluation Council of
Ontario to certify the qualifications of their members, while the Ontario Secondary School
Teachers’ Federation provides the same function for its members.
The Q&E grant allows teachers to move to the high end of salary ranges relatively early in
their careers. Based on the 2011–12 instructional salary matrix issued through the Grants
for Student Needs, teachers in the highest qualification category will exceed the provincial
benchmark salary amount of $72,879 by their seventh year of teaching. Moreover, about half
of teachers are at the top level of the salary range (nearly $95,000 per year), up from about
one-third in 2002–03.
The Commission acknowledges the importance of providing incentives for continued
professional development and helping school boards retain excellent teachers. The Q&E grant
should reflect this. However, it is important that the Q&E grant focus on teachers whose
additional qualifications are based on the best available evidence, most likely to help their
students achieve better results.
Recommendation 6-20: The added value of training programs leading to additional
qualification should be reviewed, and decisions regarding the granting of qualifications and
experience should be made by a body that is independent of teacher federations and
school boards.
Many teachers take additional qualification courses — teacher librarian, for example — even
though they have no intention of fulfilling such duties. These courses can even be delivered by
their own teacher federation. In their absence, the employer must pay supply teachers and
disrupt classroom continuity for students.
Recommendation 6-21: The province should be able to exercise legislative and regulatory
authority to require that teachers have a minimum number of years of full-time teaching
experience before they are allowed to attempt an additional qualification. While they could
decide to make contractual arrangements with faculties of education or other service
providers, school boards should ultimately have direct oversight of the content of additional
qualification courses. The design of such courses should be reviewed in tandem with the new
curriculum for the two-year teacher education program in Ontario. Both should be more
rigorous and evidence-based, and focused on those aspects of their work that lead to
improved student outcomes.

230
Other areas of school staff compensation must strike a better balance between fair working
conditions and fiscal responsibility. Many collective agreements offer retirement gratuities to
school employees, which allow them to cash out unused sick days accumulated over the
course of a career prior to retirement. Most teachers are eligible for 20 sick days per year and,
depending on the number of sick days accumulated, retirement gratuities can equal a half-year
of salary in some boards. This system offers protection against long-term illnesses. The
Commission acknowledges that most of these entitlements were grandfathered years ago for
employees with more seniority. However, even such grandfathered entitlements are difficult to
justify from the perspective of their value to taxpayers, particularly in light of the stable pension
plan for teachers that the government already co-sponsors. Since 1998, some boards have
offered retirement gratuities in the form of RRSP contributions; given the benefits of the
pension plan, this gratuity should also be reconsidered. Total provincial liability from retirement
gratuities as of Aug. 31, 2011, amounted to nearly $1.7 billion.34
Recommendation 6-22: In the upcoming renewal of collective agreements, school boards
should negotiate the removal of entitlements associated with retirement gratuities to help offset
the costs of future economic adjustments. School boards’ power in the Education Act to offer
retirement gratuities should be removed.
The phasing out of such entitlements would lift an annual Public Sector Accounting Board
(PSAB) accrual requirement in school board budgets.
Delivering Services More Efficiently
Streamlining services to improve outcomes and reduce duplication is a common objective in
all sectors of government, but has emerged as a particular theme in the children’s services
sector. The province has responsibilities related to children’s health, developmental and social
services, and education. It also provides important support to municipalities for services such
as child care. It is important to recognize opportunities for cross-government strategies for
making the delivery of services to children and families more efficient.
34 According to the Ontario Ministry of Education Retirement Gratuities multi-year summary, the retirement gratuity liability as of
Aug. 31, 2011, amounted to $1,684,289,026.

Chapter 6: Elementary and Secondary Education
231
The government is aware of the benefits of children’s service integration. Strategies to improve
children’s services such as mental health and school health support services have made
compelling cases for the need to reduce duplication and make services simpler to access.35
The Pascal report also warned against “bureaucratic duplication” and supported making
schools “true community hubs” for service delivery.36
The Ministry of Education should be a leader in promoting service efficiency and reducing
duplication. Existing school board facilities and information technology may offer effective
platforms for co-operation with other ministries and agencies in fostering innovative service
delivery. All ministries with a role in supporting children should continuously examine how
government can improve service while lowering costs through co-ordination and co-operation.
School boards should continue to seek opportunities to collaborate with each other and with
other parts of the BPS to foster procurement efficiencies. As significant purchasers of similar
supplies, equipment and services, school boards can work together to make smart purchasing
decisions through their expanded buying power. Important steps have already been taken in
this respect through the establishment of the Ontario Education Collaborative Marketplace
(OECM), a not-for-profit procurement organization. In consultation with the education and
postsecondary sectors, OECM competitively procures common contracts on behalf of school
boards, colleges and universities. Additionally, regional buying groups and transportation
consortia have encouraged prudent joint procurements.
School boards and other BPS bodies, such as post-secondary institutions, should continue to
find ways to create savings and efficiencies through collaborative procurement. Future
measures could include a co-ordinated procurement policy framework, strategic sourcing,
contract management and product/process standardization. Boards should be required to take
advantage of existing organizations such as the OECM and regional buying groups.
Boards can also work together to consolidate back-office functions. Given the similarities in
business demands and functions and technological advances, models of shared services
could help boards operate more efficiently and reduce administrative costs. Information
technology, financial services and human resource co-ordination could all be delivered at
lower costs if effectively consolidated by boards. The Commission notes that French-language
boards share many administrative and educational services.
35 “Open Minds, Healthy Minds — Ontario’s Comprehensive Mental Health and Addictions Strategy,”
http://www.health.gov.on.ca/english/public/pub/mental/pdf/open_minds_healthy_minds_en.pdf; Deloitte, Review of School Health Support Services: Final Report, http://www.health.gov.on.ca/english/public/contact/ccac/docs/deloitte_shss_review_report.pdf, 11.
36 “With Our Best Future in Mind,” p. 6.

232
Shared ownership of employee benefit plans and joint control of decision-making could also
create greater incentives for cost containment than exist when individual employers have
complete control. Through collective agreements, unions in the education sector negotiate
benefit plans that provide services such as drug coverage, and vision and dental care for
members and their families. Opportunities for efficiencies and cost containment can almost
certainly be found in the management of these plans.
Recommendation 6-23: The government should work with school boards, teacher federations
and support-staff unions to investigate mechanisms involving shared ownership and
administration of benefit programs in the education sector.
Efficiency can also be found by maximizing the value of the school boards’ capital assets.
While overall enrolment has declined, enrolment in individual schools has fluctuated with
regional population trends. High-growth areas have required new or expanded schools, and
outdated schools have been replaced. The ministry has made substantial capital investments,
beginning with the Good Places to Learn initiative, from 2005 to 2009, and continuing with
support for board capital priorities.
In some areas of the province, schools have been closed or consolidated because of declining
enrolment or the completion of a new school nearby. As a result, school boards have surplus
properties that could be divested. The current regulation requires school boards to sell surplus
properties at fair market value. In much of the province outside the Greater Toronto Area and
other major urban centres, sales of school boards assets yield limited proceeds.
The Commission therefore advises the ministry to mount a more aggressive and professional
approach to divesting of surplus school properties.
Recommendation 6-24: The government should amend the Education Act to give power to
the minister to order the sale of closed schools or other unused properties, especially when
such dispositions could meet other needs in the broader public sector.
Freeing up surplus schools would also likely help boards gain access to school buildings to
serve French-language rights holders. In addition, divesting of surplus property may reduce
operation and maintenance costs and liabilities for unused assets. New revenues through
prudent divestiture will also generate funds to invest in improving existing schools, building
new schools and reducing the backlog of school renewal needs.

Chapter 6: Elementary and Secondary Education
233
Boards should also consider changing the grade configuration at some underused schools to
make better use of existing facilities. Schools with excess capacity are still subject to the same
fixed costs of school operations, such as utilities and maintenance. Because space is
underused, however, the schools do not receive enough per-pupil funding through basic
foundation grants to cover these fixed costs. To address this problem, the ministry provides
boards with top-up funding, estimated at $237 million for the 2011–12 school year, for costs
associated with excess space in underutilized schools.37
This may be practical in the short term, but does not provide an adequate incentive for school
boards to seek innovative solutions. An increasingly widespread solution is the consolidation
of Grades 7 through 12 in one secondary school. The number of secondary schools in Ontario
that also serve Grade 7 and 8 students in the same facility has grown in recent years,
especially since the Ontario Academic Credit (Grade 13) was eliminated. Using excess
secondary school space to house Grades 7 and 8 offers a practical use of existing resources.
The Commission recognizes that decisions about school organization in specific communities
are better left to locally elected school boards. However, in a period of fiscal restraint,
the Grade 7–12 model can provide capital savings by improving the use of space.
Recommendation 6-25: The province should no longer provide top-up funding to
underutilized secondary schools if these schools could instead accommodate some or all of
the Grade 7 and 8 students in their catchment area.
The transfer of Grade 7 and 8 students in some communities would, as a consequence,
accelerate the consolidation of elementary schools. The transfer of Grade 7 and 8 students to
secondary schools should not be used by boards as a rationale for receiving additional top-up
funding at the elementary level.
We understand that this configuration may increase transportation costs in some cases.
However, savings from staffing, school operations and capital renewal will overwhelmingly
offset such costs. In some cases, it is more cost-efficient for boards to make minor capital
additions to secondary schools to enable the Grade 7–12 configuration, and thus consolidate
more elementary schools.
37 Ministry of Education, “Grants for Student Needs Technical Paper 2011–12,” downloaded from
http://www.edu.gov.on.ca/eng/funding/1112/technical11.pdf, p. 95.

234
Containing Costs of Retirement Benefits
The province’s involvement in public-sector pension plans varies from sector to sector. It is a
sponsor or co-sponsor for some pension plans, and an indirect contributor through transfer
payments to others. Most of the large plans are consolidated in the government’s financial
statements even though the province has no direct control over benefits or contributions in
some of these plans. One plan in which the province plays a major role is the Ontario
Teachers’ Pension Plan (TPP).
The province co-sponsors the TPP with the Ontario Teachers’ Federation (OTF), so the
province is jointly responsible with working teachers for funding the plan. Both parties also
share in financing any shortfalls that may occur. The Province matches the contributions of the
178,000 active members even though teachers are employed by school boards, not the
province directly. The province’s matching contribution was about $1.3 billion in 2010–11.
In recent years, as equity markets have become increasingly volatile and often negative, and
as long-term interest rates have been low, TPP’s funding valuations have revealed deficits.
Ontario’s pension legislation requires all pension plans in Ontario, including those in the
public sector, to file a “balanced” actuarial valuation with the regulator; a filed funding valuation
must indicate how a shortfall is being addressed — through higher contributions, lower
prospective benefits, or a combination of the two.
The province’s matching contribution rate to TPP remained unchanged from 1990 to 2006.
In 2005, the plan revealed an unfunded liability and the sponsors of the plan decided to
increase the contribution rate gradually over three years — from 8.9 per cent on income above
the Year’s Maximum Pensionable Earnings under the Canada Pension Plan to 12 per cent
(the contribution rate on earnings under the YMPE also changed). Both the province and the
plan members contributed 12 per cent respectively. In 2011, the sponsors approved a further
temporary increase in the contribution rate to 13.1 per cent by 2014 to eliminate an unfunded
liability. This latest increase was accompanied by a reduction in future indexation benefits for
certain plan members. While the Plan need not file a valuation until 2014, depending on
circumstances at the time, it may be necessary to further adjust either contribution rates or
benefit provisions to bring the plan back into balance.
We note that TPP’s contribution rate is already in the upper range of what other major Ontario
public-sector pension plans require. Further increases in contribution rates would affect both
parties’ ability to pay. For the province, it would mean fewer financial resources to fund other
programs. For individual teachers, it would mean lower disposable income and more personal
financial resources to fund current benefits.

Chapter 6: Elementary and Secondary Education
235
Recommendation 6-26: To mitigate further increases, the province should, in future
discussions with the Ontario Teachers’ Federation, reject further employer rate increases to
the Teachers’ Pension Plan beyond the current rate, and instead examine which benefits
could be reduced prospectively to make the Plan more affordable and benchmark any
changes to the provisions contained in other plans.
As well, the province should not agree to contribute more to the Plan than teachers, including
additional payments in respect of forgone inflation adjustments to retirement benefits.
The province should also consider increasing the average age of retirement. Under the terms
of the Plan, teachers can retire as young as age 50.38 This is possible because plan members
can qualify for a reduced retirement pension once they are 50 years of age and have two or
more qualifying years of service. While a few teachers do retire this early, the average
retirement age in 2010 was 59. According to the TPP Board’s 2010 annual report, the typical
teacher works 26 years and collects a pension for 30 years. Given the general increase in
longevity in Canada in recent decades, raising the average retirement age would reduce plan
liabilities and help alleviate the need to reduce benefits in the future. For a broader discussion
of pensions, please see Chapter 19, Liability Management.
38 According to the OTPP/TPP website, the pension is defined by a formula that takes into account average salary and credit. For
participating teachers who have at least two qualifying years, they are eligible for an unreduced pension when they reach age 65 or their 85 factor (age + qualifying years = 85 factor). The basic annual pension is: 2 per cent X credit X best-five years’ average salary. For more information, refer to www.otpp.com.

236
Promoting an Efficient Labour Market for Teachers
A looming shift in demographics has characterized much of the thinking about the education
sector’s workforce during the past 20 years. By the late 1990s, evidence showed that people
working in the education sector were older on average than people in other sectors, but had
a lower age of retirement.39 This in turn led to forecasts of the labour market for teachers.
Ministry discussion papers prior to the 2004 provincial labour framework discussions projected
that 32 per cent of the teacher workforce would retire by 2014.40
The late 1990s’ threat of a teacher shortage also prompted the government and university
community to increase teacher education efforts. Funding for additional spaces was provided
to Ontario’s faculties of education, and new bachelor of education (B.Ed.) programs were
accredited at several Ontario universities. In addition, universities based in the United States
and Australia offer Ontario-accredited B.Ed. programs.
As a result of these dynamics, and the relative increase in compensation and benefits, the
number of certified teachers in Ontario increased during the past decade. The Ontario College
of Teachers (OCT), the province’s regulatory and licensing body, tracks and reports on the
labour market for new teachers. According to the OCT, the number of graduates from Ontario-
based teacher colleges who became certified teachers grew by over 3,000 per year between
1998–99 and 2009–10, a total increase of 49 per cent (3.7 per cent per year average annual
growth).41 The rate of teacher retirement also decreased over this period; the OCT noted that
the number of new teachers exceeded the number of retirees by 1,800 per year in the early
part of the decade, but this gap has now widened to 7,600 a year.42
Continued growth in the supply of teachers will lead to an inefficient labour market that fails to
capitalize on the skills of post-secondary graduates. The proposal to convert B.Ed. programs
to two years in length, with enrolment in each cohort halved, offers some prospect of reducing
the oversupply of teachers.
39 Andrew MacKenzie and Heather Dryburgh, “The Retirement Wave,” Statistics Canada Perspectives on Labour and Income 4 (February
2003), no. 2, downloaded from http://www.statcan.gc.ca/pub/75-001-x/00203/6449-eng.html. 40 Ministry of Education, “Teacher Excellence — Unlocking Student Potential Through Continuing Professional Development,” August 2004,
downloaded from http://www.edu.gov.on.ca/eng/document/nr/04.03/teacherexcellence.pdf. 41 Ontario College of Teachers, 2010 Annual Report, downloaded from
http://www.oct.ca/annual_report/2010/en/downloads/OCT_16_New_Members_by_Faculty.xls. 42 Ontario College of Teachers, Transition to Teaching 2010, downloaded from http://www.oct.ca/publications/PDF/transitions10_e.pdf, p. 2.

Chapter 6: Elementary and Secondary Education
237
Recommendation 6-27: The government should work in a co-ordinated fashion to discuss
supply planning and, in particular, the overproduction of teachers, with Ontario’s
13 universities offering teacher education programs. Attempts should be made to direct
teacher education spaces to areas of greater need, especially in light of the staffing changes
contemplated by the Commission between now and 2017–18.
The Ministry of Education and Ministry of Training, Colleges and Universities should work
together to ensure that teacher education is funded with the objective of training an adequate
number of well-qualified teachers without creating inefficiencies in the labour market.
The changes recommended in this chapter need to take place in the context of a continued
focus on improved teaching, especially in light of the importance of continuing learning
opportunities for teachers. Such opportunities must remain one of the cornerstones of
Ontario’s vision of a strong, publicly funded education system.

238

Chapter 7: Post-Secondary Education
239
Chapter 7: Post-Secondary Education
In this increasingly global marketplace, post-secondary education (PSE) remains a vital asset
for Ontario, as over two-thirds of all new jobs in the province are expected to require
PSE. The province’s economic growth and competitiveness will need to rely considerably on
the ability of the post-secondary system to continue offering high-quality education, while
accommodating significant enrolment increases.
Ontario’s PSE system has produced impressive results despite significant challenges. In 2009,
63 per cent of Ontario adults had completed some PSE, the highest such rate in the member
countries of the Organization for Economic Co-operation and Development (OECD).
In addition, both universities and colleges combined have absorbed a 36 per cent increase in
enrolment since 2002–03. Part of this increase has been the result of demographics, but it has
also been fuelled by an Ontario strategy aimed at improving economic competitiveness.
The government recently committed itself to raise the post-secondary attainment rate to
70 per cent by 2020.
It is also notable that, even with greater enrolment growth, more students are completing
programs. Between 2002–03 and 2009–10, degree completion rates increased from
73 per cent to 79 per cent in universities and from 57 to 65 per cent in colleges.
The quality of Ontario’s post-secondary system is high, from both a Canadian and international
perspective. International rankings have recognized the province’s institutions and programs
for the quality of education they provide. Those same institutions, particularly universities,
compete not only for students, but also for the best faculty to maintain excellence in the sector.
However, to meet the challenges of rising demand for higher education at a time of
constrained funding, the post-secondary system will need to become even more efficient.

240
Challenges Ahead
Post-secondary education in Ontario will face significant pressures to meet five critical
demands: educate a rising share of the population; help equalize economic and social
outcomes across the population; provide an important component of lifelong learning; be
an engine of innovation; and deliver quality education in an efficient manner.
With enrolment projected to increase by an average of 1.7 per cent through to 2017–18, about
one of every six adult Ontarians will be enrolled in the province’s public post-secondary
institutions. The existing system has demonstrated the flexibility, capacity and willingness to
accept more students. But its funding levels –– from provincial grants and tuition combined ––
are the lowest in Canada, and an inevitable result of rapid expansion has been some loss in
quality: more sessional instructors, larger classes, fewer projects, less contact with professors
and so on.
Aside from enrolment growth, the PSE sector faces other challenges. Ontario provides its
universities and colleges with the lowest per-student provincial operating grants in the country;
they are lower today on a per-student basis than they were in 2006–07 for colleges and in
2007–08 for universities. This reduction has occurred while the institutions’ costs have been
rising by three per cent to five per cent. Just to keep the system operating as it does now,
post-secondary institutions will need both more funding and more efficiency.
To offset these costs, universities have relied on revenue from tuition fees, which are largely
regulated, and interest from endowment funds and private term-limited donations, which are
now depressed by low interest rates. “University administrators have coped with cost inflation
through two strategies: expanding class size, and/or increasing the proportion of teaching
done by part-time instructors [some of] who do not do research.”1 In addition, the full costs of
research have been covered by funnelling operating funding towards innovation.
In this knowledge-based era, education and innovation will be the key for Ontarians to be
prosperous. But for Ontario to succeed in the competitive global economy where many other
jurisdictions are improving their educational systems, Ontario graduates will need much more
than a simple handle on facts and figures. The value added by a PSE must increasingly be the
ability to think critically, to express those thoughts clearly, and to adapt and apply knowledge
to new areas and tasks. Experience in using ever-changing technology is also integral to
students’ preparation for the workplace.
Such challenges, combined with government spending constraints, will require our
post-secondary institutions to adopt a holistic approach to dealing with these daunting issues.
1 I. Clark, D. Trick and R. Van Loon, Academic Reform: Policy Options for Improving Quality and Cost-effectiveness of Undergraduate
Education in Ontario, 2011, McGill-Queen’s University Press, p.18.
Chapter 7: Post-Secondary Education
241
Need for Clear Objectives
A key target for the government has been to increase attainment rates. The government’s
Reaching Higher plan — a $6.2 billion cumulative investment in PSE to improve access and
quality — has contributed to success in meeting that target. Through Reaching Higher, over
200,000 more students, including 60,000 more apprentices, were pursuing higher education in
2010–11 than in 2002–03.
However, there is no coherent, purposeful plan that extends beyond attainment or addressing
the parts as opposed to the whole system. Because the government’s formula for allocating
grants to post-secondary institutions has tied funding to enrolment growth, it follows that
enrolment growth has been the predominant outcome.
The role of government should be to negotiate and articulate a clear set of expectations for
each institution, informed by the university’s or college’s strategic plan. This plan should
outline how the institution will achieve improved quality and establish a performance measure
of that expectation; it should also modify funding based on the degree to which an institution
succeeds in meeting the expectations.
The government should provide grants to post-secondary institutions in a way that allows them
to maintain best practices, pursue continuous improvement and improve quality across the
board. Setting outcome targets based on the individual mandates of each institution is integral
because it is unreasonable and potentially unproductive to expect all institutions to deliver the
same results. For some institutions, government might bias the performance measures
towards research output and productivity. For others, the performance matrix might be biased
to excellence in undergraduate teaching. For still others, regional economic development
would take on greater importance.
Research is a necessary component of higher learning. In Canada, post-secondary institutions
conduct about one-third of non-government research, compared to an average of 15 per cent
in the OECD and the G7. Canada’s high ratio is a direct result of huge investments by federal
and provincial governments in post-secondary institutions to support research. However, all
levels of government should take a focused approach and carry out an evaluation to ensure
that institutions are not cross-subsidizing research at the expense of teaching. In addition,
efficient funding practices should be undertaken like those identified in the 2009 Auditor
General’s report on the Ontario Research Fund.
Before discussing some more specific issues with the status quo, we address two very topical
matters in PSE: whether tuition freezes are in students’ interests and the balance between
research and teaching excellence.

242
i) Tuition freezes are not in students’ interests
The fact that tuition fees are rising faster than inflation is troubling. It is imperative to first
ensure that post-secondary institutions are being run extremely efficiently; tuition revenue
should represent a good investment for students. Institutions and government must continue
their efforts to ensure that access is not impaired by financial barriers to education. However,
the reality is that tuition freezes are not in students’ interests.
The likely result is a further marked deterioration in the student experience, meaning larger
classes, with fewer opportunities to debate and develop critical thinking skills. This position is
supported by a tuition policy study conducted for the Canada Millennium Scholarship
Foundation, which concluded that “freezes, reductions or eliminations of fees”2 can have a
negative impact on education quality while placing greater strain on institutions. Freezing
tuition now reduces revenues at a time of constrained government funding; institutions
will find other ways to make up for lost potential revenues, resulting in lower-quality PSE.
ii) Research efforts should not trump the teaching experience
As federal government support for research tripled between 1997 and 2003, universities
responded universally. Most universities (and, more recently, some colleges) have elected to
pursue the myriad federal and provincial research dollars available, all in the name of
becoming “world-class research centres.” The reality is that few of Ontario’s research centres
will become the best in Canada, never mind the world. Many, however, have gone so far as to
apply cross-subsidies within their institutions, effectively taking money from undergraduate
tuition revenues to further support research. Increasingly, institutions are allowing professors
to sacrifice teaching commitments to conduct more research, as has been noted in books such
as Academic Reform. Clearly, there must be a better balance; excellent research should not
trump excellent teaching.
Status Quo Is Unsustainable
The confluence of sustained enrolment growth, lower revenue streams from investment
income and higher costs driven by compensation has led to the realization that even
maintaining the status quo requires increased efficiency and system reform. Internal rates of
inflation at post-secondary institutions, which is the cost of continuing to do the same thing,
average three to five per cent. The current system is unsustainable from a financial and quality
perspective, as enrolment growth crowds out the funding that is available even to maintain the
status quo.
2 W. Swail and D. Heller, “Changes in Tuition Policies: Natural Policy Experiments in Five Countries,” 2004, Canada Millennium Scholarship
Foundation, p. 49.

Chapter 7: Post-Secondary Education
243
Perceptions differ on what constitutes teaching quality, but Ontario’s post-secondary sector
faces issues such as increasing reliance on part-time faculty, larger class sizes (which might
not be conducive to students’ engagement in education) and full-time faculty who do less
teaching than a decade ago.3
“Many Canadians are becoming concerned about the quality of teaching and learning in our universities. Similar worries are being voiced in the United States, where studies like those described in the recent book, Academically Adrift, have suggested that, for many students, four years of university produces little or no measurable improvement in writing skills, critical thinking or complex reasoning.”
Ian Clark, “Improving Undergraduate Education in Canada – The Good and Not So Good News,” Association of Universities and Colleges of Canada, Nov. 21, 2011.
Ontario is not alone in this. A recent study from the Association of Universities and Colleges of
Canada identifies the following challenges nationwide: “the overall size of many universities,
which has become problematic; large class sizes and an increasing student-teacher ratio; and
limited student-faculty interaction.”4 However, Ontario could do better in terms of quality with
existing resources.
Transformational change is needed to afford a high-quality system with appropriate access.
Among the challenges is the need to address quality deficiencies, especially at the
undergraduate level.
3 Clark et al., op. cit., p. 18. 4 Association of Universities and Colleges of Canada, “The Revitalization of Undergraduate Education in Canada,” p. 5, downloaded from
http://www.aucc.ca/wp-content/uploads/2011/09/the-revitalization-of-undergraduate-education-in-canada-2011.pdf.

244
Thrust of Our Recommendations
The Commission recommends the following:
1. Contain government funding and institutional expenses;
2. Use differentiation to improve post-secondary quality and achieve financial sustainability;
3. Encourage and reward quality;
4. Revise research funding structures;
5. Maintain the current overall cap on tuition-fee increases, but simplify the framework;
6. Re-evaluate student financial assistance; and
7. Generate cost efficiencies through measures such as integrating administrative and
back-office functions.
Training is addressed in Chapter 9, Employment and Training Services.
Contain Government Funding and Institutional Expenses
The Ontario government has played catch-up for post-secondary sector funding through the
implementation of the $6.2 billion Reaching Higher program and additional infrastructure
investment. Currently, about 46 per cent of total university operating revenue and 47 per cent
of college operating revenue is provided through government operating grants. Institutions
also rely on other sources of funding such as tuition, interest from endowments and ancillary
fees. Based on 2008–09 data, tuition fees accounted for about 37 per cent of total institutional
operating revenues.
The province’s current fiscal situation has added an additional challenge, as grants to post-
secondary institutions and other sectors must be constrained for the government’s budget to
return to balance by 2017–18.
Recommendation 7-1: Grow government funding for the post-secondary education sector by
1.5 per cent per year until 2017–18.
Such growth means that grants will not keep pace with projected enrolment growth of
1.7 per cent per year, nor with the general rate of inflation, never mind with the institutions’
historical internal rates of inflation. Nevertheless, our recommendation protects annual growth
in post-secondary funding at a time when many other public services will be rationalized.

Chapter 7: Post-Secondary Education
245
4,000
5,000
6,000
7,000
8,000
9,000
1990–91 1993–94 1996–97 1999–00 2002–03 2005–06 2008–09 2011–12 2014–15 2017–18
University Historical University Projected*
College Historical College Projected*
* Based on 1.5 per cent growth in current government operating grants.Full-Time Equivalent — includes all domestic students eligible for funding (full-time and part-time, etc).Source: Data up to 2010–11 are from the Ontario Ministry of Training, Colleges and Universities (MTCU) and the projections are based on the Commission’s own recommendations of growing operating grants by 1.5 per cent and dividing by enrolment data provided by MTCU.
CHART 7.1 University and College Per-Student Funding in Ontario Since the 1990s (not adjusted for inflation)
Funding per Full-Time Equivalent Student
Ontario’s post-secondary institutions must become more efficient to preserve, if not enhance,
quality within tighter financing conditions.
Recommendation 7-2: Work with post-secondary institutions to reduce bargained
compensation increases, where they exist, and instead align them with trends in more recent
settlements in the broader public sector; a rigorous performance system should also be
introduced to guide compensation, where one is not already in place.
Salaries, wages and benefits now account for about three-quarters of university and college
expenditures, with annual cost inflation in the sector projected at three to five per cent.

246
Scholarships and Bursaries,
$290.21, 9.0%
Interest$14.52,0.5%
Salary and Benefits, $2,328.92,
72.2%
Buildings, $197.63, 6.1%
Other, $393.55,12.2%
Note: FFTE – Number of students with full-time study load.Source: System Growth, November 2011, Ontario Undergraduate Student Alliance.
CHART 7.2 Increase in Total Expenditure per Fiscal Full-Time Equivalent (FFTE) in Ontario Universities from 2004–05 to 2009–10
Recommendation 7-3: If capital budgets are constrained, post-secondary institutions should
consider using alternative financing and procurement, especially for buildings that do not
qualify for government funding, such as residences.
Residences provide an identified revenue flow, which make them promising as alternative
financing procurement projects for private partners.
Increase Differentiation through Establishing Mandate Agreements
The current design of Ontario’s public university and college system was largely established
by the late 1960s. Both systems have grown since then and the mandate of colleges has
increasingly evolved to include some degree-granting powers, blurring the original rationale for
creating the college system as discrete from universities.
Recommendation 7-4: By 2012–13, establish multi-year mandate agreements with
universities and colleges that provide more differentiation and minimize duplication; these
should be implemented beginning in 2013–14.
Not every institution needs to become a comprehensive research university, nor does each
college require new degree-granting authority. The primary intent of further differentiation is to
provide clarity to the system in terms of mandates.

Chapter 7: Post-Secondary Education
247
“For learners, greater differentiation of Ontario’s university sector offers clearer choices from a larger number of high quality programs, clarifies the institutions that best serve their career and personal aspirations, and facilitates mobility and transitions between institutions and Ontario’s post-secondary system.”
Harvey Weingarten, President and CEO, Higher Education Quality Council of Ontario.
Differentiation is not a panacea for all the system’s issues but simply a logical progression to
improve quality and sustainability. Inherent in differentiation is the potential for reducing
inefficiencies and realizing cost savings by minimizing further duplication of programs.
Recommendation 7-5: Institute a process for establishing mandate agreements using a
review by either a blue-ribbon panel or the Higher Education Quality Council of Ontario to
ensure the highest-quality programs are funded to grow and expand. This should be
completed in the 2012–13 fiscal year and must be transparent for the institutions and
the public.
Recommendation 7-6: Establish and implement a rational and strategic division of roles
between the college and university systems.
This division of roles would include the following features:
Colleges and universities should agree on a standard of educational attainment and quality
that would allow college students who have completed two years and meet predetermined
academic achievement criteria to transfer into the university system;
Colleges should not be granted any new degree programs, but should have existing
programs grandfathered;
New programs at any post-secondary institution should not be approved by government
until the development of multi-year mandate agreements is complete;
When considering future growth, the creation of new professional and specialized
programs such as law, medicine and business should not be approved without a
compelling business case; and
The Colleges of Applied Arts and Technology should work with the College of Trades to
optimize the delivery of apprentice training in non-degree programs (see Chapter 9,
Employment and Training Services, for details on the College of Trades).
Recommendation 7-7: Create a comprehensive, enforceable credit recognition system
between and among universities and colleges. This is an absolutely essential feature
of differentiation.

248
When students want to transfer from one university to another or from one college to
another in comparable programs, they should be able to transfer a good number of credits.
The decision on credit transferability should be communicated in a timely manner.
Residency clauses, which, for example, require students to take 75 per cent of their credits at
one institution to receive a degree from that institution, will also need to be revised to facilitate
ease of transfer between institutions.
In the 2011 Budget, the government invested $73.7 million over five years for credit transfer
but more work must be done to ensure that colleges and universities comply and expand
credit-transfer agreements.
Furthermore, a two-way credit-transfer system between colleges and universities is also
required, given the number of students who choose college post-university and those who
choose university post-college.
Encourage and Reward Quality
Beyond the use of differentiation to support quality, the Commission proposes several specific
initiatives. Evidence from student surveys on the quality of their learning experience, such as
the National Survey of Student Engagement, has shown dissatisfaction with large class sizes
and inadequate library facilities, to name a few.
The Commission highlights three specific areas that should be addressed:
I. Refocus resources and rewards towards teaching in post-secondary institutions;
II. Refocus provincial funding to reward teaching excellence; and
III. Establish a performance regime in mandate agreements that include certain quality
indicators.
I) Refocus resources and rewards towards teaching in post-secondary institutions
Recommendation 7-8: Post-secondary institutions need to devote more resources to
experiential learning such as internships; allow for more independent or self-assigned study;
develop problem-based learning modules; and increase study abroad and international
experiences.5 Many institutions already incorporate these features into their programs, funding
them from within existing portfolios.
A future funding model should contemplate such alternative approaches to furthering the five
objectives of post-secondary institutions we have identified above.
5 Association of Universities and Colleges of Canada, op. cit., p. 6.
Chapter 7: Post-Secondary Education
249
Recommendation 7-9: Encourage universities that do not presently have flexible provisions
regarding teaching and research workloads in their collective agreements with faculty to
consider such provisions in future bargaining. While each university must conduct teaching
and research, top-performing teachers and researchers should be recognized with the
appropriate workloads and rewards.
Progress on this front should be noted: 11 Ontario universities already have such flexibility.6
These successful practices should be continued and mirrored in the remaining complement of
post-secondary institutions.
Some institutions have also experimented with alternate career paths, including formalizing
teaching-only or research-only streams. We consider this to be a viable option for top-
performing teachers and top-performing researchers.
Recommendation 7-10: Have post-secondary institutions redesign incentive systems to
reward excellent teachers, as is currently done for researchers.
Teachers should also be rewarded for developing innovative methods of teaching and
learning, with tenure and promotion linked to innovation. “Safe spaces” should be created for
faculty to try innovative approaches to teaching, and these attempts at innovation should be
included in merit reviews. This innovation should be supported through funding and other
types of recognition. Successful models can then be scaled up and shared, both within the
institution and with others. This would encourage new forms of campus culture to develop and
lead to more interactions between teachers and students.
II) Refocus provincial funding to reward teaching excellence
Recommendation 7-11: Link further provincial funding allocations to quality objectives, which
will encourage post-secondary institutions to be more responsive. In addition, the province
should alter the funding model to also reward degrees awarded, rather than just
enrolment levels.
Because higher enrolment generates higher funding, the current funding framework
encourages post-secondary institutions to increase enrolment.
Recommendation 7-12: Government and post-secondary institutions must measure learning
outcomes; that is, the value added through education, not just whether a person graduates.
6 S. Vajoczki, N. Fenton, K. Menard and D. Pollon, “Teaching-Stream Faculty in Ontario Universities,” Higher Education Quality Council of
Ontario, p.16, downloaded from http://www.heqco.ca/SiteCollectionDocuments/Teaching-Stream%20Faculty%20in%20Ontario%20Universities.pdf.

250
Graduating from a post-secondary institution should not simply be an indication of a student’s
ability to master certain facts and figures (most of which can be memorized even if not
understood). The capacity to integrate ideas and create innovative solutions to problems is at
the heart of the higher education experience. This will be critical to the economic and social
success of Ontario, in an economy where graduates will be working over their career in ways
that cannot even be imagined now.
This approach will require ensuring that academic standards for graduation are maintained
and remain in line with provincial performance metrics. This should create an incentive for
schools to make the learning experience as relevant as possible, leading to more students
remaining in school and higher graduation rates.
III) Establish a performance regime in mandate agreements that includes certain quality indicators
Considerable progress has been made in establishing common indicators between the Council
of Ontario Universities and the multi-year accountability agreements set by the Ministry of
Training, Colleges and Universities (MTCU) with universities. System-wide indicators for
universities in 2009–10 include indicators of credit transfer system use, participation rates
of under-represented communities, space utilization and class size. Outcome indicators such
as university student satisfaction, rates of graduation and post-graduation employment are
also used, while Colleges Ontario has a broad set of indicators including employer satisfaction
with recent college graduates’ skills and performance. However, the underlying measures
used to indicate the quality of the learning environment should be enhanced for both
universities and colleges.
Recommendation 7-13: Enhance performance measures in multi-year accountability
agreements with post-secondary institutions through the use of teacher performance scores
and student satisfaction ratings where the primary reasons for dissatisfaction are adequately
captured.
Recommendation 7-14: Work with private career colleges (PCCs) to collect and publish the
same performance indicators as public colleges and universities. Private career colleges
should bear the cost of such reporting.
This can be done through regulation on the part of the Ontario government or through a
Delegated Administrative Authority (DAA) vehicle by enlisting an association such as the
Ontario Association of Career Colleges or some other comparable body to provide oversight
and ensure accountability.
Chapter 7: Post-Secondary Education
251
No data have been collected or published on the student experience in PCCs since 2006.7
That leaves prospective students very vulnerable to institutions that do not provide a
reasonable student experience, including reasonable prospects of studies leading to a job.
Recommendation 7-15: As a part of the mandate agreements with post-secondary
institutions, tie outcome quality indicators to funding.
Since post-secondary institutions are multi-faceted, producing educated students, research
and innovation, and local economic development, there should be a more all-encompassing
method of measuring outcomes and linking funding to the results. Beyond the indicator
improvements suggested above, efforts should be made to ensure that the funding
agreements cannot be gamed through the provision of watered-down degrees.
Revise Research Funding Structures
Recommendation 7-16: Evaluate the research funding system of post-secondary institutions
and research hospitals as a whole, including how it is affecting university and hospital
budgeting practices.
The federal government, which to its credit prompted the surge in university-based research,
does not cover all associated research costs. As a result, universities subsidize research from
other sources. The review should also analyze commercialization outcomes of research and
development investments. “The ability of Canadian universities to commercialize remains very
weak, as research suggests that U.S. universities perform about 14 times as much research
as Canadian universities, but receive 49 times as much licensing income –– a key indicator of
the value of innovations.”8 The Commission sees great value in investments through the Early
Researcher Award and the Ontario Research Fund — Research Infrastructure program (the
provincial component of the federal Canada Foundation for Innovation investment).
Recommendation 7-17: Award provincial research funding more strategically and manage it
more efficiently. Consolidating and offering a single-window approach for access and reporting
through an online portal will greatly improve efficiency and reduce paperwork, both for
government and for post-secondary institutions.
Maintain Current Tuition Fee Increases but Simplify the Framework
Recommendation 7-18: Maintain the existing tuition framework, which allows annual tuition
increases of five per cent. However, simplify the design to maintain the overall ceiling but allow
institutions greater flexibility to adjust tuition fees at the program level, within the ceiling.
7 Ontario Auditor General, “Auditor’s 2011 Report: Private Career Colleges,” 2011, p. 251. 8 D. Drummond, C. Alexander and S.M. Fard, Post-Secondary Education Is a Smart Route to a Brighter Future for Canadians,”
TD Economics Special Report, May 2010, p. 31.
252
Currently, the tuition framework allows, among other conditions, a maximum annual
percentage increase for new students for first-entry undergraduate programs and another,
slightly higher, percentage increase for professional and graduate programs. The result is a
complex fee administration with different fees for different programs, and, for any particular
program, a different fee for every cohort of students. The maximum total fee increase each
year (all programs, all years) may not exceed five per cent. The multitude of corollary
conditions should be removed while maintaining the overall tuition increase ceiling.
Re-evaluate Student Financial Assistance
Tuition increases must not come at the expense of student affordability and access.
A necessary complement to maintaining the current tuition framework is an improvement to
the student loan financing system. The federal and Ontario governments spend billions on
student financial assistance. The total will rise by almost another $0.5 billion when the new
30% Off Ontario Tuition9 grant matures.
In 2009–10, total Canadian student financial assistance was $8.3 billion (in 2010 dollars).
Most student loans are repaid, so from a fiscal perspective it is relevant to look at the total
excluding loans, which was $5.1 billion. Of that, $3.4 billion was not directly related to need,
with $2.4 billion of tax measures being the largest component. By way of comparison, total
tuition revenue for universities and colleges was $5.8 billion in 2010.
The corresponding numbers for Ontario (including the portion of federal assistance accruing to
Ontario recipients) were $4.0 billion of total assistance, or $2.2 billion excluding student loans.
Of that, $1.4 billion was not related to need, with tax measures accounting for $1.0 billion.
Tuition revenue in Ontario was $3.0 billion in 2010.10
This funding, however, is not focused on lower-income students whose access is most likely to
be compromised by financial considerations. Indeed, the combined impact of all forms of
assistance including student loans, loan remissions, grants and bursaries, tax credits, savings
incentives and summer employment subsidies provides little more for students of the lowest-
income families than those of the best-off.11
9 See www.ontario.ca/30off for details. 10 Council of Ministers of Education, Canada (CMEC), January 2012. Total tuition revenue figures compiled from the Financial Information of
Universities and Colleges (FIUC) annual reports. Figures include total tuition revenue. FIUC annual reports are prepared by Statistics Canada for the Canadian Association of University Business Officers (CAUBO), downloaded from: http://caubo.ca/resources/publications/financial_information_universities.
11 Drummond, et al., op. cit., p. 24.

Chapter 7: Post-Secondary Education
253
Further, the student support system is not consistent with the ample evidence that family
income is not the most serious access problem. Statistics Canada’s Youth in Transition Survey
and work commissioned by the Higher Education Quality Council of Ontario (HEQCO) show
having no family history of college or university is the most significant obstacle to PSE.12
Income seems to be even less of a deterrent in Ontario than in other provinces. An evidence-
based approach to access would suggest that more attention be devoted to “improving student
motivation and performance at (or before) the high school level, providing better information to
students and their families about the costs and benefits of education from an early age and
carrying out other interventions targeted at the early-rooted and family-based factors that
seem to be the most important determinants of access.”13 Addressing the most acute access
issues then becomes very much an issue for the elementary and secondary school system, in
conjunction with post-secondary institutions, community organizations and businesses.
Recommendation 7-19: Maintain the Ontario Student Access Guarantee, which represents
10 per cent of additional tuition revenue that institutions are required to set aside to fund
bursaries and other student assistance programs.
Recommendation 7-20: Reshape student financial assistance provided by both the federal
and provincial governments, including the newly announced 30% Off Ontario Tuition grant, to
target more of the assistance to low-income students whose access is most likely to be
compromised by financial obstacles and broaden the approach to improving access to
post-secondary education.
In its present form, the 30% Off Ontario Tuition grant will be provided to students whose family
income is less than $160,000. Student financial assistance should be redirected towards those
who need it most.
Recommendation 7-21: Explore phasing out provincial tuition and education tax credits to
invest in upfront grants.
12 R. Finnie, S. Childs and A. Wismer, “Under-Represented Groups in Postsecondary Education in Ontario: Evidence from the Youth in
Transition Survey,” 2011, Higher Education Quality Council of Ontario: R. Finnie, S. Childs and A. Wismer, “Access to Postsecondary Education: How Ontario Compares,” 2011, Higher Education Quality Council of Ontario.
13 Higher Education Quality Council of Ontario, “Parental Education Key Determinant of Who Pursues Higher Education,” (press release, Feb. 8, 2011), downloaded from http://www.heqco.ca/enCA/About%20Us/News%20Releases/Pages/Summary.aspx?link=2&title=Parental%20education%20key%20 determinant%20of%20who%20pursues%20higher%20education.

254
Although tax credits are intended to provide assistance to all post-secondary students –– by
recognizing for tax purposes amounts spent on PSE –– the timing of providing financial aid to
students through tuition credits is inconsistent with promoting accessibility or affordability.
Students typically accrue most of their expenses at the start of the first semester while tuition
credits arrive at the end of the academic year because their timing is governed by the annual
cycle of tax filing and refunds.
As for universal government transfers, a report prepared for the Canada Millennium
Scholarship Foundation in 2007 concludes that the tuition and education tax credits do not
encourage participation in PSE and are costly given the fact that they are “at best neutral and
at worst regressive.” The report further concludes that “eliminating credits would create an
opportunity to use these funds in less regressive ways and allow for some effective
restructuring of Canada’s ‘complex web of student financial aid systems.’”14
Recommendation 7-22: Streamline student financial assistance by decoupling loans and
grants. Eligibility for grants should not be contingent on loan applications.
Students may be eligible for a grant and a loan, but might be unaware of the grant availability
unless they have already applied for a loan through the Ontario Student Assistance Program
(OSAP). Currently, students who are required to apply for OSAP loans to gain access to their
grants often repay these loans immediately simply to get the grant that is tied to the loan.
Recommendation 7-23: Harmonize the variety of scholarships, grants and other assistance
programs that the government offers, into already-existing programs of a similar nature, across
post-secondary institutions.
Recommendation 7-24: Lower the current 25 per cent Ontario Student Assistance Program
default-rate threshold for triggering cost-sharing to 20 per cent for all post-secondary
institutions in Ontario and work with institutions towards the objective of setting a still-lower
threshold in future.
Any school exceeding this threshold would be required to reimburse the province for default
costs above the threshold. Although progress has been made in lowering default rates across
the system, more can be done to ensure that a relevant education is provided that will lead to
jobs and protect taxpayers.
14 Drummond et al., op. cit., p. 22, citing Canada Millennium Scholarship Foundation, 2007, Canada’s Tuition and Education
Tax Credits, p. ii.

Chapter 7: Post-Secondary Education
255
The average OSAP default rate for PCCs now stands at 13.0 per cent, while the rates for
universities and colleges are far lower at 3.7 per cent and 10.6 per cent respectively. The high
default rates for PCCs mean the exposure of taxpayers is substantial. Through OSAP,
almost $200 million in loans and grants were provided to an annual average of 9,500 PCC
students over the last three academic years.15 In addition, the government provides
$350 million per year through employment and training supports.
Recommendation 7-25: Extend the review period for Ontario Student Assistance Program
default rates, which are now measured roughly two years after borrowers start repaying.
The government should track repayment beyond the third year after school is completed,
looking at defaults that occur in the fourth through sixth years. Default rates recorded over this
longer period should be applied to the default cost-sharing.
Any institution subject to cost-sharing for two consecutive years would be placed on probation
and would be required to submit to the MTCU, as well as to implement, a plan for reducing its
default rates below the 20 per cent threshold.
Generate Cost Efficiencies through Measures such as Integrating Administrative and Back-Office Functions
Recommendation 7-26: Have the post-secondary sector leverage its existing collective
purchasing capacity through the Ontario Education Collaborative Marketplace and regional
buying groups.
This move would enable a co-ordinated approach to strategic sourcing, contract management
and product/process standardization. This would be similar to other collective back-office
functions such as the student application process, administered through the Ontario University
Application Centre (OUAC) for all universities, or the Ontario College Application Services
(OCAS) for all colleges.
Recommendation 7-27: Establish a single pension fund administrator for all university and
college pensions, while recognizing differences in pensions.
Most hospitals, colleges, municipalities and school boards now operate as separate employers
but participate in a single pension plan. All Ontario colleges take part in the Colleges of
Applied Arts and Technology (CAAT) Pension Plan, which is administered by an independent,
arm’s-length board. The CAAT Pension Plan has assets of about $5.5 billion.
15 Ontario Auditor General, Auditor’s 2011 Report: Private Career Colleges, 2011, p. 251; the Ontario Ministry of Training, Colleges and
Universities notes that its figures are $240 million in Provincial OSAP support, which has flowed to 32,000 PCC OSAP recipients over the past three years (2008–09 through 2010–11).

256
In comparison, Ontario’s university sector has a very fragmented pension arrangement with
more pension plans than institutions –– 29 pension plans for 23 institutions, 17 defined benefit
plans, four defined contribution plans and eight hybrid plans (a defined contribution plan with a
defined benefit floor). These plans vary widely in the benefits they provide and the
contributions made by employers and plan members. There is also wide variation in the size of
these plans. The market value of assets ranges from about $15 million to about $2 billion.
In total, the sector has about $10 billion in assets.
This fragmented arrangement means that each university administers its own pension plan(s),
which implies that each institution may not be realizing the economies of scale that would
result if this function were more centralized. In view of this arrangement, the consolidation of
administrative processes and practices, including the pooling of assets for investment
purposes, may generate savings for the sector.
With a consolidated approach, the administrative function would be carried out by another
body. However, each employer/sponsor would remain the legal administrator of its plan, retain
its fiduciary responsibilities and determine plan benefits, while minimizing costs.
The 2011 Budget announced the government’s intention to undertake a review of single-
employer, public-sector pension plans, with one goal being to pursue greater efficiencies in
plan administration. We support this undertaking; consolidation of the administrative functions
among all pension plans may achieve greater cost savings.
Recommendation 7-28: Before new capital spaces are approved, require universities and
colleges to demonstrate increased use of space and consider year-round optimization of
existing spaces. Priority should be given to the deferred maintenance in the current capital
stock before new capital projects.
Any campus expansions funded by the province should be viewed through a return-on-
investment lens. Factors such as the increase in productivity for the institution through a better
learning experience for students, energy cost reductions through the use of renewable energy
sources and energy-efficient building design should be considered. Currently, the principal
driver for expansion may be increases in enrolment, and while energy conservation aspects
may be part of the building design, they are not integral to the productivity outcomes expected
from the expansion.
Recommendation 7-29: Compel post-secondary institutions to examine whether they can
compress some four-year degrees into three years by continuing throughout the summer.

Chapter 7: Post-Secondary Education
257
This could improve the facility efficiency and reduce the opportunity cost for students. As many
students work in the summer, the four-year degree should not be abandoned, but instead the
three-year option should be made available to those with the desire and capacity to pursue it,
in much the same way that co-operative education streams are available in some programs.
Recommendation 7-30: Cease funding for international marketing of Ontario’s universities
and integrate it into existing trade mission activities. Universities, colleges and the federal
government already invest in these activities.

258
Conclusion
We believe our recommendations address the five significant pressures facing
PSE in Ontario. These include educating a growing share of the population; helping to
equalize economic and social outcomes across the population; providing an important
component of lifelong learning; being an engine of innovation; and delivering quality education,
especially with a constrained provincial fiscal situation.
The status quo is unsustainable and the proposed reforms matter, as they clarify the roles of
our post-secondary institutions and government. Taken together, the reforms present a holistic
approach for a sector that we recommend will receive funding growth of only 1.5 per cent
per year to 2017–18.
If the cost containment measures recommended here are not enough to allow the ministry to
live within the 1.5 per cent growth annually, then it will be necessary to eliminate the 30% Off
Ontario Tuition grant. The government’s highest priority should be to fully fund the operating
grants for colleges and universities contained in the individual institutions’ new multi-year
mandate agreements, followed by existing capital commitments. This will ensure Ontario’s
PSE institutions continue to focus on delivering quality education, which will in turn benefit
students academically and provide the brand recognition that will serve them in their future
careers.
The challenge is for post-secondary institutions to do more with what they have and make the
education even more relevant for the undergraduate experience. Differentiation is the next
logical step for our post-secondary system. Within that clarification lies the potential for more
than simply increased efficiencies, but also support for education quality.
For the individual, PSE represents an opportunity to equalize economic and social outcomes
and provide real private returns with social spillover effects. This requires some contribution
from individuals, not only financially but also academically. For the public, our economic
competitiveness hinges on our post-secondary sector and, as such, our recommendations
guide the sector to achieve a more cost-efficient, affordable and higher-quality system,
with modest funding growth.

Chapter 8: Social Programs
259
Chapter 8: Social Programs
Social programs significantly affect some of Ontario’s most vulnerable citizens.
Social assistance, by far the largest expenditure component, provides the most basic income
and employment supports to the impoverished and people with disabilities. Child protection
services, delivered through a network of Children’s Aid Societies, keep Ontario’s children safe
and healthy. And developmental services support local programs and services that promote
inclusion and involvement of citizens with a developmental disability.
Despite the valuable services that social programs provide, our mandate requires us to
consider their fiscal impact. From 2000 to 2010, spending on social programs grew by
an average of 6.0 per cent per year — well above the rate we will need to return the provincial
budget to balance by 2017–18. A number of factors contribute to this, most notably those
related to social assistance. Demand for the Ontario Disability Support Program (ODSP) has
increased by about five per cent per year over that period. Caseloads for Ontario Works (OW)
too have grown, though only following the global economic downturn in 2008–09, after
remaining more or less unchanged since the start of that decade. Following a period in the
1990s when social assistance rates were increased and then cut dramatically, changes were
brought about in 2004 that would increase rates by 13 per cent over eight years.1 And in 2008,
the province committed to uploading almost the entire municipal share of social assistance2 as
part of the Provincial-Municipal Fiscal and Service Delivery Review. Together, these factors
have driven the increases in social assistance spending that have contributed significantly to
the overall growth of spending on social programs in recent years.
1 Commission for the Review of Social Assistance in Ontario, “A Discussion Paper: Issues and Ideas,” 2011, p. 11; R.D. Kneebone and
K.G. White, “Fiscal Retrenchment and Social Assistance in Canada,” Canadian Public Policy 35 (2009), no. 1, p. 26. 2 Only the administration costs of OW will be a shared expense once OW financial and employment assistance is fully uploaded in 2018.

260
Youth Justice, $362, 3%
Child and Youth Mental Health,
$530, 4%
Developmental Services,
$1,658, 12%Child Care, $848, 6%
Other Programs, $898, 6%
Ontario Child Benefit,
$935, 7%Child Protection, $1,508, 11%
Notes: Child Care in this chart includes funding from Ministries of Education and Children and Youth Services.Source: Public Accounts of Ontario, 2010–2011.
CHART 8.1 Social Programs Spending 2010–11 ($ Millions)
Social Assistance, $7,090, 51%
The result is that expenditure growth at this level is not sustainable in the current fiscal
context. To return the provincial budget to balance by 2017–18, we can allow social program
spending to grow, but at a much constrained rate.
Recommendation 8-1: Hold growth in social programs spending to 0.5 per cent per year.
At 0.5 per cent per year, social programs are one of few areas — along with health,
elementary and secondary, and post-secondary education — where we recommend any
government spending increase out to 2017–18. This stands in sharp contrast to the
recommended annual decreases of 2.4 per cent for all other program spending. We propose
a number of recommendations in this chapter that will bend down the cost curve. Depending
on demand for social programs, which will in part be determined by economic conditions,
these recommendations may not be sufficient to keep spending within the recommended limit.
Accordingly, further reforms may be required. In this regard, we note that two other
Commissions are addressing social programs — social assistance and child welfare
respectively — and they will be reporting later in 2012.

Chapter 8: Social Programs
261
The Challenge
There are two types of social programs. Most spending is carried out through mandated and
entitlement-based programs, meaning benefits or service levels are set by law. These benefits
and services, such as social assistance and the Ontario Child Benefit (OCB), accounted for
two-thirds of total sector spending in 2010–11.
Other programs are discretionary in nature. These programs are not entitlement-based and so
clients who qualify for these services are not guaranteed to receive them right away. These
programs include support for child and youth mental health, developmental services, child care
subsidies and childhood development programs.
The distinction between entitlement-based and discretionary programs is important in the fiscal
context. When demand for entitlement-based programs rises (for example, when assistance
caseloads increase), so too does funding; clients are entitled to those benefits. This is not the
case for discretionary programs: when demand outstrips supply, the result is a waiting list.
Managing expenditures, particularly for entitlement-based supports, means the government
will have to achieve more by operating more efficiently. Program design and delivery will need
to be integrated and aligned across different government ministries and delivery agents.
Various levels of government will need to work together to determine the most efficient ways
to provide services for those most in need.
Attaining this integration and transformation will require the government to evaluate and align
its policies and service delivery methods from a client-based perspective. When vulnerable
people need support, they and their families do not care which level of government or
government department is responsible for providing that support — they just want help,
which could be more accessible and more effectively planned and delivered.
Transforming Ontario’s Benefit Programs
The province delivers 45 different income-based benefit programs through many service
providers and under several different funding arrangements. For instance, social assistance
programs are delivered by the province, municipalities and First Nations delivery agents, but
are mainly provincially funded. The OCB is funded by the province, but administered and
delivered by the Canada Revenue Agency. And housing programs can be funded by various
levels of government and non-governmental organizations and can be delivered by municipal,
provincial or third-party delivery agents.

262
When these activities lack co-ordination across delivery agents, gaps and duplications of effort often result. Many programs require unique applications, apply different income tests using various definitions of income, and produce separate payments. Moreover, some programs assess eligibility only once while others do so monthly. Consequently, administrative efforts are unnecessarily replicated across benefit programs, leading to inefficiencies. And those in need are forced to navigate through a complex array of access points for the supports they dearly need, creating significant access issues.
This array of program delivery models and eligibility criteria can lead to further unintended consequences. Many social programs are universal, some are income-tested and still others are based on specific need. These conflicting eligibility requirements can create inequities and can result in barriers to seeking employment or pursuing higher earnings. In the context of social assistance, this is commonly referred to as the “welfare wall,” where individuals face losing supports — be they income or in-kind benefits, such as the Ontario Drug Benefit (ODB) program — shortly after finding work or when passing a specific income threshold.
There is scope to do this more efficiently:
Income testing and payment delivery could be centralized;
Much of the processing of applications, eligibility assessment and payments could be automated;
Income verification could be made more transparent and consistent through automation; and
Consolidating program delivery and standardizing eligibility criteria across similar programs
could reduce barriers to employment.
Positive steps have been taken towards simplifying access to Ontario’s income-tested benefit programs. In March 2011, the Ontario Benefits Directory was launched, providing one-stop access to information for more than 40 programs and tax credits organized by population segment and type of benefit. Similarly, the Ministry of Community and Social Services recently introduced a new single-window access point to developmental services and supports; clients can find information about community resources and go through a standardized application process for provincially funded services and supports. This must only be the beginning: The government should move to improve client access by creating a single point of access for benefits and a co-ordinated interface for clients.
Improving the delivery, administration and equity of the broad spectrum of Ontario’s benefits system is critical to ensuring that strong support exists for those clients who most need it. More and better data measuring client outcomes is also needed to determine program effectiveness and to understand how programs interact; the utmost care must be taken to continue to respect and protect personal information and privacy. Nevertheless, transforming the delivery of Ontario’s benefits system into a fully integrated model represents a clear opportunity to simultaneously make programs more effective and reduce costs in the long run.
Chapter 8: Social Programs
263
Recommendation 8-2: Move aggressively towards a fully integrated benefits system that simplifies client access, improves client outcomes and improves fiscal sustainability through greater program effectiveness and reduced administrative costs.
Recommendation 8-3: A fully integrated benefits system should seek efficiencies by, at a minimum, centralizing income testing and payment delivery; automating the processing of applications, eligibility and payments; automating income verification; consolidating program delivery; and standardizing eligibility criteria.
Recommendation 8-4: Collect the information necessary to deliver and evaluate a fully integrated benefits system. In doing so, continue to respect and protect personal information and privacy.
Social Assistance
Our approach to social assistance has been different from other policy areas in that the Commission for the Review of Social Assistance in Ontario (SAR Commission), under Frances Lankin and Munir Sheikh, is already actively engaged on the subject matter.3 However, the SAR Commission is not due to release its final report until late 2012, well after this report is completed. Because of the considerable impact that social assistance has on the province’s finances, we too must propose recommendations.
Our focus has been to apply the themes that run through our reviews of all sectors, such as achieving efficiencies in administration and service delivery, rationalizing jurisdictional oversight and shifting from measuring inputs to outcomes. By no means, however, do our recommendations address all aspects of social assistance that warrant reform; for that we defer to our colleagues on the SAR Commission and lend them our full support. For example, we say little about the structure and level of benefits. We are cognizant that we are leaving to them not only the need to broaden the scope of review beyond what we have covered, but also to deepen the analysis, even in areas where we have made recommendations. Social assistance programs are very complex and we have had neither the time nor the resources to fully analyze the likely impact of our reforms on cost and quality, though they appear promising.
Finally, while we believe our suggestions will bend down the cost curve, we recognize they
may well be insufficient to keep spending within the annual 0.5 per cent growth cap if demand
for these services continues to grow appreciably. On that too we would respectfully request
the views of the SAR Commission.
3 For more information, go to http://www.socialassistancereview.ca/home.

264
Social assistance consists of two programs: the provincially delivered ODSP and locally
delivered4 OW. Both ODSP and OW recipients are eligible for drug coverage under the ODB
program, among other benefits. Caseload levels for OW, which provides temporary income
support, are closely tied to economic conditions such as unemployment; ODSP is less
responsive to these conditions. Policy changes affecting eligibility criteria and administrative
procedures can also significantly affect demand, as we saw in the mid-1990s when eligibility
criteria for social assistance programs were tightened.5
Since the mid-1990s, ODSP caseloads have increased by approximately five per cent a year.
Factors contributing to this increase include changes in the economic environment, policy
changes that created financial incentives for clients to move from OW to ODSP, and a
broadening of the definition of disability, primarily through court decisions.6 As a result,
ODSP caseloads have exceeded those of OW — even through the recent economic downturn
(as illustrated in the chart that follows).
0
100,000
200,000
300,000
400,000
500,000
600,000
1988
–89
1990
–91
1992
–93
1994
–95
1996
–97
1998
–99
2000
–01
2002
–03
2004
–05
2006
–07
2008
–09
2010
–11
Ontario Works Ontario Disability Support Program
Source: “A Discussion Paper: Issues and Ideas,” June 2011, Commission for the Review of Social Assistance in Ontario.
Cases
CHART 8.2 Trend in Cases Receiving Social Assistance
4 For OW, as of January 2011 this included 37 consolidated municipal service managers, 10 district social services administration boards
and 100 First Nations. 5 R.D. Kneebone and K.G. White, op. cit., p. 33. 6 For example, a recent court decision determined that the government was violating the Ontario Human Rights Code by not allowing
addictions to drugs and/or alcohol addictions as sufficient criteria to qualify a person as “a person with a disability” as defined in the ODSP legislation.

Chapter 8: Social Programs
265
In the absence of policy changes, social assistance spending is projected to grow by roughly
five per cent per year. Containing growth to 0.5 per cent annually would mean reducing total
social assistance spending by over $2 billion per year by 2017–18 relative to what it would
have been in our Status Quo projection.
Through our review, we have uncovered evidence of higher costs and reduced quality of
services due to maintaining two separate social assistance programs delivered by two levels
of government. Compared to a single program, there are clear overlaps in administration, and
variations in specific benefit levels between programs can lead to inequitable outcomes. Better
co-ordination could lead to fiscal and quality rewards, but as we have pointed out in other
program areas, efforts that support better co-ordination can themselves be an inefficient use of
time and other resources. Further, and more profoundly, the continued operation of separate
programs perpetuates the antiquated idea that all those eligible for disability supports are
unemployable. In fact, 54.9 per cent of Ontarians between the ages of 15 and 64 who self-
identified as having a disability participated in the labour market in 2006; we believe this figure
could and should be even higher.7
We urge the SAR Commission to examine models for improving service delivery and in
particular for improving employment services for recipients of OW and ODSP. Consolidating
OW and ODSP into a single program and delivering it at the local level seems to offer promise.
This would reduce outdated divisions between the two clienteles and facilitate the connection
to other local services. But it would also require reforms to best utilize the employment
services available from Employment Ontario (EO).
Equal attention must therefore be given to how to better integrate EO with social assistance.
This needs to be done regardless of whether OW and ODSP continue to be delivered
separately or are combined and delivered at the local level. An efficient referral system from
case workers is essential.
An advantage of integrating social assistance with EO is that all job seekers would be served
by the same entity, further reducing the stigma for people receiving social assistance.
Economies of scale could clearly be achieved by having all job seekers served by the same
employment service.
7 R. Miner, “People Without Jobs, Jobs Without People: Ontario’s Labour Market Future,” Miner and Miner Management Consultants,
downloaded from http://www.collegesontario.org/research/research_reports/people-without-jobs-jobs-without-people-final.pdf.

266
Recommendation 8-5: The Commission for the Review of Social Assistance in Ontario
should examine system design options that deliver a more efficient and higher-quality service
to social assistance recipients. This examination should consider combining Ontario Works
and the Ontario Disability Support Program, and having the combined program delivered at
the local level. It should also address the further integration of employment services available
through Employment Ontario.
A more efficient, higher-quality program should:
Be integrated with other municipally delivered services (such as child care and social
housing);
Establish more formal linkages with EO with an eye on further integration (see Chapter 9,
Employment and Training Services);
Deliver transactional tasks through ServiceOntario where there is clear added value in
doing so; and
Operate with a clear focus that supports reattachment to the labour market, wherever
appropriate.
There are two other features we would like to see in social assistance programs, but where we
recognize much more work is required before firm recommendations can be offered. We once
again hope the SAR Commission can address these items.
First, to the extent possible, the benefits of the two main social assistance programs should be
consolidated. There could, for example, be a common base level of supports and benefits with
additional, targeted supports for persons with disabilities. The complexity of the current design
of those benefits would make this a difficult task and, if not done with care, it could actually
cost more.
Second, we hope the SAR Commission will examine the prospects for moving towards an
audit-based accountability structure rather than the current intensive use of verification and
compliance. We have been struck by the enormous resources required from both government
and recipients to cope with the current system that could otherwise be put to better use.
However, we are also cognizant that, to be successful, an audit-based program would have to
be carefully constructed to have the appropriate checks and penalties.

Chapter 8: Social Programs
267
Initial Assessment
Efficiency gains and improvements to service quality can be made if clients are thoroughly
assessed upon entering the program and given targeted supports, from self-serve resources
to high-intensity, face-to-face support with a case worker, based on their individual needs.
Clients requiring a low degree of intervention may need minimal, if any, face-to-face
contact with a case worker. Direct these clients quickly to EO and other low-intensity
supports. Emphasize telephone and Internet-based tools or other low-cost means of
delivering these supports.
Clients requiring a high degree of intervention may need a great deal of intensive,
face-to-face contact with a case worker. Provide continued support as they reintegrate
into the workforce.
Clients requiring a moderate degree of intervention should receive a blend of high- and
low-intensity supports. We suspect most clients would fall into this group.
Clients for whom attachment to the labour force is not a reasonable expectation because
of a disability should be connected with a national income-support program for persons
with a disability; later in this chapter we recommend the establishment of such a program.
Recommendation 8-6: Undertake a thorough initial assessment of new entrants into social
assistance to identify the degree of intervention required to help them return to the labour
market. Triage new entrants to appropriate supports according to this assessment.
Employment and Training
With a focus on reattaching people to the workforce, the employment and training component
of social assistance becomes even more crucial. Chapter 9, Employment and Training
Services, highlights recent efforts to integrate employment and training services through EO.
However, additional benefits are likely possible if the employment services provided through
Ontario Works and ODSP are further integrated with EO. Such integration would address
program overlap and duplications; likely improve client service and client outcomes; and could
reduce costs of employment services and demand for social assistance. Examples of these
services include job search supports, work experience programs, skills training, supports for
self-employment, and the screening and matching of participants to employers.
Recommendation 8-7: Streamline and integrate other employment and training services with
Employment Ontario, including the bulk of the employment and training service component
of social assistance, in a carefully sequenced manner.
Many people with disabilities are able and want to work. Yet we are only now beginning
to understand what is needed to accommodate people with physical disabilities in the
workplace, and we are even further away from doing so for those with mental disabilities.

268
Recommendation 8-8: Prepare and support people with disabilities who are entering the
workplace. Work with employers and fellow employees to properly understand and
accommodate the specific needs of the individual in the workplace.
Federal–Provincial Issues
About 22 per cent of people with severe or very severe disabilities now receive social
assistance in Canada. Most people are unemployable or have only a tenuous attachment to
the paid labour force. This population would be better served by a national basic income
program instead of social assistance.8
A growing number of organizations have criticized the federal Employment Insurance (EI)
program for not meeting the needs of the modern labour market. In 2010, Ontarians
contributed about 40 per cent of EI premiums, yet received only 32 per cent of benefits
and 31 per cent of funding allocated for training. It is unclear to what extent reform of the
EI system might reduce pressure on Ontario’s social assistance budget. However, it is clear
that unemployed Ontarians do not now receive equitable income support and appropriate
training opportunities to facilitate their return to the workforce. In addition, an increasing
proportion of people who are either new workers (new immigrants) or youth in non-standard
employment (such as part-time, multiple jobs, temporary employment) do not quality for EI.9
The Final Recommendations of the Mowat Centre EI Task Force, if implemented, would be
a considerable improvement.
Recommendation 8-9: Advocate for federal reforms in two key areas:
Work with other provinces and the federal government to establish a national income-
support program for people with disabilities who are unlikely to re-enter the workforce.
Implement the final recommendations of the Mowat Centre Employment Insurance
Task Force.
Reinvest further savings in targeted social assistance measures
Should the growth of social programs spending be reduced below the 0.5 per cent target —
whether because of policy reforms, reduced demand for social programs, or other reasons —
the savings should be used to make reforms that eliminate barriers that prevent people from
moving back to the workplace. Three areas in particular require attention.
8 M. Mendelson, K. Battle, S. Torjman and E. Lightman, “A Basic Income Plan for Canadians with Severe Disabilities,” 2010, Caledon
Institute for Social Policy. 9 “Making It Work,” Final Recommendations of the MOWAT Centre Employment Insurance Task Force, 2011.

Chapter 8: Social Programs
269
To qualify for social assistance, potential recipients must divest all liquid assets above a
certain threshold. This threshold varies by category, such as single person, non-disabled, etc.
However, these asset caps for OW were cut dramatically in the mid-1990s and have barely
been raised since. As of December 2011, for example, a single parent of one child receiving
OW was allowed to have no more than $1,645 in liquid assets — less than the estimated cost
of moving from a shelter into a basic bachelor apartment.10 Depriving social assistance
recipients of these most basic means of climbing the “welfare wall” is counterproductive.
Second, in Chapter 5, Health, we discuss reforms to the ODB that would make eligibility for
the ODB solely dependent on income as opposed to age or, more importantly for this chapter,
social assistance status. Currently, all recipients of a social assistance benefit unit (the social
assistance recipient and his or her dependants) receive ODB coverage in each month they
qualify for social assistance but lose this benefit (along with other extended health benefits)
shortly after finding employment. The loss of extended health benefits represents a strong
disincentive to work — thus contributing to the “welfare wall.”
Dealing comprehensively with these two issues would probably absorb any savings below the
recommended 0.5 per cent expenditure annual growth rate. In the unlikely event that funds
remain, we recommend that the basic needs and shelter amounts of social assistance be
raised to fill any gap. However, any changes to these amounts should be supported with a
clear evidence base.
Recommendation 8-10: If growth in expenditures for social programs is contained below
the 0.5 per cent annual growth rate, reinvest savings into social assistance, with priority
given to:
Increasing asset limits for social assistance qualification;
Tying specific benefits (beginning with the Ontario Drug Benefit program) to income levels
rather than to social assistance status to help tear down the “welfare wall”; and
If funds remain, raising basic needs and shelter amounts.
10 J. Stapleton, “Why Don’t We Want the Poor to Own Anything?” 2009, George Cedric Metcalf Charitable Foundation.

270
Child Welfare
Like social assistance, we have approached child welfare differently than most other policy
areas out of deference to the ongoing work of the Commission to Promote Sustainable Child
Welfare, which was created in November 2009 with a three-year mandate.11 Its previous
reports and papers are consistent with recurring themes in this report such as the endless
search for efficiencies and a clear focus on evidence-based policy-making. Containing the
annual rate of expenditure growth at 0.5 per cent will nonetheless be immensely challenging
for a sector that has grown by five per cent per year on average over the past eight years.
Three elements in any solution will be increasing the capacity of Children’s Aid Societies
(CAS); adopting an accountability framework tied to outcomes rather than inputs or processes;
and strengthening the links between child welfare and other sectors through better service
integration.
Recommendation 8-11: Continue implementing reforms to child welfare proposed by the
Commission to Promote Sustainable Child Welfare. This must include building on reforms to
Children’s Aid Societies, implementing an outcome-based accountability structure and
strengthening links between the child welfare sector and services in other sectors, such as
education, post-secondary education, and employment and training services.
Ontario Child Benefit
The Ontario Child Benefit (OCB) provides up to $1,100 annually per child and aids about one
million children in almost 530,000 families. The OCB is a non-taxable, income-tested monthly
benefit paid to low- to moderate-income families with children under age 18.
The OCB has transformed children’s benefits by providing support to all low- to moderate-
income families with children, regardless of the source of their income. The OCB treats all
children in these families equally and makes it easier for parents to move from social
assistance to employment; previously, because child benefits were provided through social
assistance, parents would lose benefits for their children as well as themselves upon finding
employment.
11 http://www.sustainingchildwelfare.ca/

Chapter 8: Social Programs
271
While this is commendable in terms of helping to remove the “welfare wall,” we note that the
2011 Ontario Budget committed the government to increasing the maximum support level
further to $1,310 annually per child, at an additional cost of $245 million per year when fully
implemented. However, the Commission has recommended that if social program spending
grows by less than 0.5 per cent annually, then any savings should be channelled into specific
social assistance measures; accordingly, further increases in the OCB should not be
considered at this time.
Recommendation 8-12: In light of the Commission’s recommendation to reinvest savings
achieved by holding the increase of social program spending below the recommended
0.5 per cent annual growth rate into specific social assistance reforms, the government should
retain the current maximum level of the Ontario Child Benefit.
Other Social Programs
Discretionary social programs are overseen by many government ministries and broader
public-sector partners with varying levels of capacity. Despite this degree of variation, there
are common trends across services:
The province funds most services, with a few exceptions (e.g., social housing is supported
by all three levels of government, regulated child care is supported by municipalities and
there is modest charitable support for most social services);
Recent trends have seen the province assume more funding responsibility from both
municipalities (e.g., social assistance costs) and the federal government (e.g., stepping
in when child care funding was cancelled);
There are trends towards more integrated human service delivery and better co-operation
across sectors (e.g., mental health reform, developmental services, some municipal
service integration), but much more must be done; and
Unfortunately, wait-lists still exist for most services in most programs — and some
are growing.
Given that the province provides most of the funding for social programs, it must lead change
in these programs, and work with all its partners to deliver better or more effective services at
less cost.
This means mapping out a vision to better integrate human service delivery and the
associated policy work. Such an approach is consistent with the goal of transforming
benefits — better service integration helps simplify client access, improve outcomes and
reduce overhead costs.
272
Children’s Mental Health Services
As noted by the Ontario legislature’s Select Committee on Mental Health and Addictions,
mental health and addictions services in Ontario are fragmented, spread across several
ministries and offered in various care settings.12 The government has taken steps to reduce
this fragmentation by developing a comprehensive strategy for mental health services.
Recommendation 8-13: Reconfigure child and youth mental health services to consolidate
agencies and improve service delivery and integration both within the sector itself and with
other sectors such as children’s services, health, education and youth justice.
Children’s Services Integration
Greater integration of services for children and youth should be expanded beyond mental
health. As with the alignment of other services, co-operation across ministries and with other
levels of government (particularly at the municipal level) will be key. This may require a
redefinition and/or restructuring of ministry roles and responsibilities.
Recommendation 8-14: Integrate children’s services to enhance early identification
and intervention.
Developmental Services
Recent developmental services legislation13 recognizes that individuals with a developmental
disability can live independently with the appropriate supports and that they and their families
want more choice and flexibility in choosing supports that meet their needs.
Shifting funding from transfer payment service agencies to service recipients over time could
encourage changes in the developmental services sector by promoting a more competitive
and market-driven approach to the provision of services and supports, based on individual
need and demand. If the individuals and families had the purchasing power to choose the
community participation supports they preferred, service agencies would be driven to realign in
response to this market.
Recommendation 8-15: Move towards consolidating developmental services funding for
community-based support programs into a single direct funding program.
12 “Navigating the Journey to Wellness: The Comprehensive Mental Health and Addictions Action Plan for Ontarians,” (August 2010). 13 Services and Supports to Promote the Social Inclusion of Persons with Developmental Disabilities Act, 2008, when fully proclaimed, will
replace the existing Developmental Services Act.

Chapter 8: Social Programs
273
Youth Justice
The youth justice sector has changed significantly since the introduction of the federal Youth
Criminal Justice Act in 2003. The greater focus placed on community-based interventions has
resulted in a decrease in the use of youth justice facilities, some of which are underused and
require considerable capital investment to keep operational. Current facilities should be
continually evaluated for their contribution to achieving the sector’s policy objectives. Where
excess capacity can be demonstrated and a more efficient option exists, strategic closures
should occur and those assets should be put to more productive uses or divested entirely.
Recommendation 8-16: Reduce excess capacity in the youth justice system through
strategic closures of facilities.
Contributions of the Non-Profit Sector
The non-profit sector is an often-overlooked contributor to the Canadian economy.
In 2007, the value-added or gross domestic product (GDP) of the non-profit sector was
$35.6 billion, accounting for 2.5 per cent of the total Canadian economy. This share
increases to 7.0 per cent when hospitals, universities and colleges are included, reaching
$100.7 billion in 2007.14 Excluding hospitals, colleges and universities, the non-profit sector
employs 600,000 people and has over five million volunteers, supporting a wide variety of
sectors including health, education, environment and social services in Ontario. These same
non-profit organizations in the province have annual revenues of $29 billion, 45 per cent
coming from earned income, 29 per cent from federal and provincial government grants
and service contracts, and 26 per cent from gifts, donations and other sources.15
Most non-profit organizations (53 per cent) in Ontario are completely volunteer-run, having no
paid staff.16 We must not underestimate the contributions of volunteers to care for our elderly,
retrain the unemployed, educate our children and care for our environment. Steps should be
taken to ensure that these organizations continue to get funding. However, there is room for
improvement in terms of streamlining administration and ensuring that accountability
frameworks focus on outcome metrics. In addition, multi-year agreements can help create
predictable budget cycles for non-profit organizations.
14 Statistics Canada, “Satellite Account of Non-Profit Institutions and Volunteering,” Catalogue no. 13-015-X, downloaded from
http://www.statcan.gc.ca/pub/13-015-x/13-015-x2009000-eng.pdf. 15 Imagine Canada, “The Nonprofit and Voluntary Sector in Ontario: National Survey of Nonprofit and Voluntary Organizations Fact Sheet,”
2005, downloaded from http://library.imaginecanada.ca/files/nonprofitscan/en/nsnvo/factsheet_voluntary_sector_ontario.pdf. 16 Ibid.

274
Recommendation 8-17: Reform funding practices in the non-profit sector to increase flexibility
and reduce administrative costs by focusing on measuring outcomes rather than inputs.
There is also room for improving the responsiveness of the government to the non-profit
sector. The Commission notes the precedent set by the Open for Business initiative that
creates a single window through which business can engage all government ministries.
We believe a similar model would be helpful to the non-profit sector, which is just as varied
and diverse as the private sector.
Recommendation 8-18: Provide a single point of access within government for the non-profit
sector to improve and broaden relationships across ministries that enter into contracts with the
non-profit sector, using a model such as the Open for Business initiative.
Social Impact Bonds
Non-profit and for-profit organizations may be able to take new approaches to achieve more
cost-effective social outcomes. A prime example is Social Impact Bonds (SIBs). Through a
SIB, a government contracts with a partner organization to deliver a particular service, with
payment conditional on improvements to an associated social outcome. If the social outcome
is achieved, the social impact bondholder receives a risk-adjusted rate of return from the
government, while the government saves money because the improved social outcome offsets
future expenditures. The United Kingdom has undertaken the best known pilot to date, a
criminal justice project in Peterborough, U.K.; early results show promise.17
Recommendation 8-19: Undertake pilot projects using Social Impact Bonds across a range of
applications.
17 For more information, see the Social Finance website at http://www.socialfinance.org.uk/resources/social-finance.

Chapter 8: Social Programs
275
General Approach
Transaction focused, with limited information on client outcomes
Complex maze of programs that creates access barriers
Unclear how programs respond to client needs Services funded and delivered inconsistently
across the province.
Client-focused programs that provide services and benefits fairly across client groups in similar circumstances
Improved co-ordination or clustered programs, resulting in reduced overlaps, greater efficiencies and improved client outcomes
Simplified and transparent access through range of channels (e.g., websites)
Improved data collection to ascertain extent to which programs meet client needs
Consolidated back-office operations, through a shared service delivery model.
Social Services
Fragmented planning and delivery; programs operate independently
Social assistance involves multiple programs, the combined effects of which can create barriers to work
Training/employment support offered by multiple agencies
Social housing is offered through more than 20 provincial programs
Child care and child development supports are provided in multiple settings, not often integrated.
Co-ordinated access to social services in the community (e.g., social assistance, child care, housing)
Front-line workers trained on intake for all programs offered; back-end supports amalgamated
Support transition to work through consolidated training opportunities with appropriate access provisions
Consolidated housing and homelessness programs
Better integrated programming for preschool and school-aged children.
Child Welfare
Services delivered by 53 CASs Historical, volume-based funding model that may
generate perverse incentives, detrimental to client outcomes
Several heritage information systems with various definitions of business processes, making it difficult to compare services across the province.
Fewer agencies providing more integrated, cost-effective services
Client-outcome-based funding model with appropriate incentives/disincentives
One provincial information system with standardized definitions of business processes and desired client outcomes
Improved links to other service systems, including education, post-secondary education and training.
Transforming to Reformed System Current System

276
Child and Youth Mental Health
Fragmented services, provided by 260 community agencies, 17 hospital-based outpatient programs, and supports at a number of secure custody/detention facilities for youth in conflict with the law
Long wait-lists Inadequate information on where to get help Increasing mental health disability costs with a
significant economic impact.
Improved co-ordination with standardized definitions and application processes
Integrated service delivery, including client communications, intake, eligibility and entitlement, and payment issuance
Streamlined governance and accountability Effective early intervention would address the
risk of mental health disability costs becoming unsustainable
Clear roles, responsibilities and accountabilities across education, health and children’s systems.
Developmental Services
Over 370 agencies deliver residential services and community living support, with diverse ways of assessing needs and determining funding levels
Long wait-lists Historically, inconsistent eligibility across
Ontario — new, single point of contact to access services for new clients, since July 2011
Inconsistent service delivery — lack of choice, life-stage interruptions, quality concerns.
Fully implemented single point of contact to access services
Funding allocated based on assessed needs, using individual-based funding allocation model (community services)
Clear eligibility criteria used consistently provincewide
Person-centred, individualized approach to planning and making life transitions with minimal service disruption; quality assurance measures support consistent service standards.
Youth Justice
A network of facilities/agencies including seven directly operated secure custody/detention youth centres, 64 directly operated youth probation offices, and 210 transfer payment agencies that are mainly not-for-profit organizations
Declining demand for custodial facilities.
More community-based system, with reduced use of custody and more youth being diverted from the formal court process for less serious offences and more youth being referred to alternatives to custody program
Savings reinvested in preventive measures (e.g., mental health supports).
Current System Transforming to Reformed System

Chapter 9: Employment and Training Services
277
Chapter 9: Employment and Training Services
Why Provide Employment and Training Services?
A highly educated and skilled workforce is a key determinant of healthy and sustainable
long-term economic growth. With the rise of the knowledge economy and rapid technological
change, there is growing demand for highly skilled, adaptable workers. The government plays
an important role in helping meet this demand. Studies have demonstrated the need for, and
benefits from, government investment in education and training. For example, Riddell argues
that government intervention in human capital development is justified on both equity and
efficiency grounds.1 Equity arguments for government intervention include the promotion
of equal opportunity, social mobility and more equal distribution of economic rewards.
Efficiency arguments for government intervention are based on three tenets:
It ensures that benefits to society are captured when valuing education or training;
It helps to overcome failures in credit markets; and
It mitigates the challenges of judging the quality of education and training programs.
Ontario’s aging population, slower labour-force growth and increasing global competition,
among other forces, have made skills development, workplace training and lifelong learning
more important. For example, literacy needs have evolved and increased over time as a result
of fundamental changes in the economy. In addition to reading and writing, many people today
require analytical skills, numeracy, and technological and computer literacy to do increasingly
complex work.
Employment and training programs are important tools to ensure that workers have skills that
are relevant for available jobs and to facilitate job matching. Effective government training
programs help reduce the skills gap for many of these displaced workers and can increase
their re-employment earnings.
1 W.C. Riddell, “Investing in Human Capital: Policy Priorities for Canada,” in J. Leonard, C. Ragan and F. St-Hilaire (eds.), A Canadian
Priorities Agenda: Policy Choices to Improve Economic and Social Well-Being, 2008, Institute for Research on Public Policy, pp. 13–55.
278
Ontario Labour-Market Challenges
Ontario was particularly hard hit by the recent global recession, accounting for 60 per cent of
Canada’s job losses in 2009. Even before the onset of the recent recession, Ontario’s
economy faced challenges that continue to stifle job creation, including a sharp appreciation of
the Canadian dollar, historically high energy prices, rising competition from emerging countries
and a weakening U.S. economy. For example, the manufacturing industry lost jobs for six
consecutive years, bringing manufacturing employment in 2010 to its lowest level since 1976.
This trend in manufacturing and job losses in resource sectors such as forestry have
contributed to increasing unemployment for long-tenured workers. Many of these workers face
significant challenges to re-employment.
While employment in Ontario is growing again and has already recovered all the jobs lost
during the recession, young people, recent immigrants and Aboriginals continue to
underperform. The recession worsened their employment outcomes, but they struggled in
the job market well before that. Groups facing such labour-market challenges include:
Youth (aged 15 to 24) employment shrank in 2010 for the third consecutive year;
Very recent immigrants (five years or less in Canada) continue to experience a rising
unemployment rate, up from 12.7 per cent in 2008 to 18.4 per cent in 2010;
The unemployment rate for Aboriginal youth was 20.8 per cent in 2010, up from
19.8 per cent in 2008;
The number of laid-off older workers nearly doubled — from 75,600 in 2006 to
141,500 in 2009;
The unemployment rate for female single parents with children under age six increased
from 12.4 per cent in 2009 to 17.2 per cent in 2010; and
Barely half of the population aged 15 to 64 with a disability was in the labour force
(54.9 per cent in 2006).
The persistent lack of employment opportunities for these groups, as well as media reports of
skill mismatches and unfilled vacancies, shows that the existing program delivery structure
needs significant improvement.

Chapter 9: Employment and Training Services
279
Employment and Training Services Provided by Ontario Ministries
Ontario offers a range of employment and training services through the Ministry of Training,
Colleges and Universities (MTCU) as well as other ministries, including Citizenship and
Immigration, and Community and Social Services.
The MTCU administers the bulk of these services through its employment and training
network, Employment Ontario (EO). Employment Ontario was created through the integration
of a variety of federal and provincial programs when the Canada–Ontario Labour Market
Development Agreement (LMDA) of 2007 transferred control of a broad range of labour-
market and training programs to the province. With a budget of about $1 billion annually, EO
currently serves more than one million people including employers, laid-off workers,
apprentices, older workers, newcomers and youth.
The Ministry of Community and Social Services (MCSS) provides employment supports to
social assistance clients through the Ontario Disability Support Program (ODSP) and
Ontario Works (OW). In 2010, MCSS spent over $200 million on employment supports for
social assistance recipients. The ODSP provides income and employment support to enable
people with disabilities and their families to live independently. Through OW Employment
Assistance, recipients receive practical assistance preparing for and finding jobs.
The Ministry of Citizenship and Immigration (MCI) offers programs to facilitate labour-market
integration of immigrants, including bridge training programs to provide newcomers with the
occupation-specific training that gives them the skills, language capabilities and Canadian
work experience to obtain employment in their field. Language programs for newcomers are
provided through Ontario’s school boards, as well as Specialized Language Training Pilot
Projects.
A number of other provincial ministries also provide employment and training supports,
including the OPS internship for professional immigrants, delivered by the Ministry of
Government Services, and Youth Opportunities Strategy, delivered through the Ministry
of Children and Youth Services.
In addition to funding programs directly, Ontario provides indirect support for training through
tax credits such as the Apprenticeship Training Tax Credit (ATTC) and Co-operative Education
Tax Credit (CETC). In 2010, the ATTC provided an estimated $120 million and the CETC
provided an estimated $25 million to businesses to support hiring and training. See Chapter 11,
Business Support, for a further discussion.
280
The large number of programs and services provided by multiple ministries suggests there
are clear opportunities to improve the efficiency of their delivery, quality of service and rigour
of program evaluations.
Continue to Seek EO System Improvements
Ontario has taken some steps towards integrating employment and skills training. As part of
the plan to transform EO, MTCU launched the Employment Service (ES) model in 2010, a new
program that streamlines many functions that were formerly offered in an unco-ordinated
manner (e.g., former federal Employment Assistance Services and Targeted Wage Subsidy
programs, as well as Ontario’s Job Connect). The new ES model provides Ontarians with a
client-centred, “one-stop shop” where they can find a full range of employment support
services to help them acquire and retain a job.
The EO’s clientele needs varying degrees of assistance. The majority of unemployed
Ontarians whom EO serves require minimal intervention. Interactions with these clients should
be made as efficient as possible through the use of low-cost, self-serve tools (e.g., online
resources) to allow staff to focus on more intensive cases.
Recommendation 9-1: Focus the efforts of Employment Ontario on clients who need complex
interventions. Streamline clients requiring modest intervention to low-cost, self-serve
resources as efficiently as possible.
Streamline Training and Employment Supports across Government
While Ontario has begun integrating employment and training services in recent years, the fact
that so many ministries are still in this line of business highlights that opportunities exist to do
more. Particular consideration should be given to the provision of employment services for
social assistance recipients and new immigrants. Examples of these services include job
search supports, work experience programs, skills training, supports for self-employment, and
the screening and matching of participants to employers. Integrating these types of programs
with EO would result in gains in administrative efficiency, improved client access to services,
clearer jurisdictional alignment and reduced program costs.
Challenges are associated with pursuing further integration. First, EO is still in its relative
infancy and so integrating additional employment and training initiatives all at once may not be
feasible. Second, while it is beneficial in other ways, integrating the employment and training
component of locally delivered programs like OW presents its own hurdles. Careful
sequencing will be necessary to integrate these and other employment and training
expediently but without diminishing service quality during the transition.

Chapter 9: Employment and Training Services
281
Recommendation 9-2: Streamline and integrate other employment and training services with
Employment Ontario, including the bulk of the employment and training service component of
social assistance and integration and settlement services for newcomers, in a carefully
sequenced manner.
Ontario–Federal Arrangements for Employment and Training Programs
The federal government provides a significant amount of annual funding to Ontario through a
number of federal-provincial labour market agreements, including the Labour Market
Development Agreement (LMDA) and Labour Market Agreement (LMA). Each agreement has
its own client eligibility, program design, and reporting and accountability requirements. The
following table summarizes the major categories of programs covered by bilateral agreements,
eligibility requirements and magnitude of funding.
TABLE 9.1 Federal-Provincial Labour-Market Agreements
Agreements Eligibility Total Funding
Labour Market Development Agreement
• Devolution of federal funding, staff and ongoing responsibility to deliver employment and training programs to Ontario (occurred in 2007).
• Primarily targeted to Employment Insurance (EI) clients.
• Approximately $550 million/year.
• Fluctuates on an annual basis according to labour-market and economic indicators.
• Term: Signed in 2005; no expiry.
Labour Market Agreement
• Supports the delivery of employment and training programs that enhance the labour-market participation of those not eligible for EI.
• Unemployed individuals who are not EI-eligible such as social assistance recipients, immigrants and other key groups.
• Employed individuals who are low skilled (no high school diploma or recognized certification).
• $194 million/year.
• Term: 2008–09 to 2013–14.
Targeted Initiative for Older Workers
• Increase the employability of older workers in communities experiencing economic restructuring.
• Laid-off workers aged 50 and over (primarily targeted to 55–64 age group).
• Must be in communities of less than 250,000 people that have high unemployment or a high reliance on single industries.
• This is a cost-sharing agreement for a total of $58.5 million over three years.
• The federal government supports 84% ($49.1 million) of total costs and Ontario provides 16% ($9.4 million).
• Term: 2009–10 to 2011–12; extended to 2012–13.
Labour Market Agreement for Persons with Disabilities
• To improve the employment circumstances of persons with disabilities.
• Employment-related programming for persons with disabilities.
• $76.4 million/year.
• Term: 2004–2013 (extended multiple times).
Source: Ontario Ministry of Training, Colleges and Universities.
282
Comprehensive Reform in Federal-Provincial Arrangements
The patchwork of federal-provincial labour-market agreements that targets various groups of
clients not only creates challenges for Ontario’s “one-stop shop” vision of employment and
training service delivery, but also leads to fragmented and distorted policy-making, based on
federal notions of labour-market priorities as opposed to responsiveness to local conditions.
The differing program and client eligibility requirements contained in these agreements
limit Ontario’s ability to maximize the benefits from providing an integrated suite of labour-
market programs and services. For example, under the LMDA, Ontario can only fund
programs and services that are “similar” to those originally designed and delivered by the
federal government in the early 1990s. This unnecessarily restricts Ontario’s capacity to meet
its fluid labour-market requirements.
Ontario received only 31 per cent of the funding allocation for EI training in 2010 although
Ontarians accounted for 42 per cent of Canada’s unemployed population. This shortfall
restricts access to training and employment supports because most of these initiatives are
available only to active and former EI recipients. Removing the EI eligibility condition from
LMDA programs would enable Ontario to fund programs most relevant to its current labour-
market challenges.
The Strategic Training and Transition Fund (STTF) provided an additional $207 million over
two years for programming to support both unemployed and employed individuals affected
by the economic downturn regardless of their EI eligibility. The STTF allowed Ontario to
introduce innovative approaches to target those who need it most before it expired at the
end of March 2011, exemplifying the benefits of having flexibility in program design and scope.
There are also federally funded and delivered employment and training programs for youth,
persons with disabilities and Aboriginals who are not part of existing bilateral agreements:
The federal Youth Employment Strategy (YES) offers a range of programming for youth
aged 15 to 30; and
The federal Opportunities Fund for Persons with Disabilities provides funding to
organizations that help people prepare for, find and maintain employment.
This arrangement creates administrative inefficiencies, complexity for stakeholders and
service providers, and confusion for potential clients.

Chapter 9: Employment and Training Services
283
Recommendation 9-3: Advocate for a comprehensive training agreement to replace the
patchwork of federal-provincial employment and training funding agreements currently in
place, many of which are about to expire, with a single arrangement.
This new arrangement should:
Include residual federal training responsibility for youth and persons with disabilities,
in addition to areas already covered under current agreements;
Provide Ontario with enough flexibility to fully integrate these services under the EO
banner, identify and respond to its fluid labour-market needs, and innovate using
small-scale pilot projects; and
Not be tied in any way to EI eligibility.
Strengthening Labour-Market Information and Evidence-Based Policy
A recurring theme in this report is the need to base policies and programs on a defensible
evidence base. Employment and training programs are currently not strategically organized
nor consistently evaluated against labour-market success factors, clear targets or performance
measures linked to outcomes. Labour-market information must be improved in two respects.
First, Ontario must improve how it tracks outcomes. Most program measures focus on service
indicators (e.g., clients served, satisfaction) as opposed to outcomes. While client satisfaction
and throughput are important, they are no substitute for measures of success such as
employment duration, wage level and growth, and so forth. Key success indicators should be
chosen based on best practices in other jurisdictions and from current literature. Indicators will
likely vary by training program but every effort should be made to avoid minor differences to
minimize administrative costs and allow for comparisons across programs. Regular evaluation
of program performance using the collected data should be undertaken to inform future
changes that will continually improve effectiveness.
Second, data gaps limit Ontario’s ability to effectively target investments in labour-market
programming at a strategic level. While the Labour Force Survey reports monthly on those
currently working, there was until very recently no equivalent survey about jobs that need to
be filled. A better understanding of employment gaps could shed light on how to make
employment and training services more effective.

284
Building on previous work,2 Statistics Canada released job vacancy data on Jan. 24, 2012,
which included Canadian, provincial and territorial estimates of the number and rate of job
vacancies by industry and enterprise size. This is a positive first step. However, given regional
variations in labour requirements, Ontario should advocate for the collection of sub-provincial
data to enable more effective program decision-making and policy development.
Recommendation 9-4: Tie employment and training programs more explicitly to measured
outcomes. Data collection must in turn be improved.
Recommendation 9-5: Advocate for the collection of sub-provincial data in all future federal
surveys on labour vacancies. Leverage labour vacancy data to inform employment and
training program design and delivery.
Leveraging Workforce Planning Boards
In 1994, 25 Workforce Planning Boards were established across Ontario through a joint
funding arrangement between Canada and Ontario to plan and lead labour-market activities at
the community level. Today, the boards receive about $6 million annually from MTCU to help
improve labour-market conditions in Ontario’s communities by:
Engaging labour-market partners at a local level to identify and respond to key
employment and training issues and priorities;
Researching employers’ labour requirements to gain insight into occupational and skill
needs specific to local industry;
Facilitating local planning where community organizations agree to implement joint actions
to address local labour-market gaps; and
Developing partnership projects that respond to local labour-market challenges.
Despite the existence of the ministry’s regional offices, the oversight of the boards has
remained centralized. Maintaining an additional degree of separation is incongruent with the
local focus of the boards. The ministry is now planning to decentralize the management of
the boards by transferring the oversight function to the ministry’s regional offices as of
Apr. 1, 2012. This is a positive first step to expand regional autonomy, promote stronger
local linkages, and broaden community and regional planning for economic development.
2 “Working Together to Build a Better Labour Market Information System for Canada,” 2009, Advisory Panel on Labour Market Information.

Chapter 9: Employment and Training Services
285
The boards can also serve as a vehicle to encourage greater support for workplace-based
training among employers. Various studies show that, compared to international competitors,
Canadian employers invest less in training on a per capita basis and that Canadian workers
have a lower participation rate in training. According to a recent Conference Board of Canada
report,3 Canada’s capacity for innovation is decreasing. One of the key drivers for this decline
might be the relatively low priority placed on learning and development within Canadian
organizations. From 2006 to 2010, Canadian organizations spent on average only 64 cents for
every dollar spent by American organizations on these types of initiatives. The boards play a
role in improving these fortunes.
Recommendation 9-6: Transfer responsibility for Workforce Planning Boards to the Ministry
of Training, Colleges and Universities’ regional offices to develop stronger local linkages and
broaden community and regional planning for economic development.
Recommendation 9-7: Direct Workforce Planning Boards to encourage employers to
increase investments in workplace-based training.
Improving the Link between Training and Economic Development
A number of ministries currently administer economic development programs that include
a training component. Some examples include:
Ministry of Economic Development and Innovation (MEDI) initiatives such as the Strategic
Jobs and Investment Fund (SJIF) and Eastern Ontario Development Fund; and
The Ontario Ministry of Agriculture, Food and Rural Affairs’ (OMAFRA) Rural Economic
Development program.
Although MTCU fosters links with these ministries, a labour-market planning framework would
facilitate broader program co-ordination. One major drawback of current practice is that
economic development programs largely function separately from EO. While this may in part
be a result of rigid employment and training services funding rules, it is crucial that services be
more strongly linked to strategic economic development initiatives such as the Ring of Fire
once sufficient flexibility under those arrangements is achieved.
Recommendation 9-8: Develop a labour-market policy framework to link planning for
employment and training services more strongly to economic development initiatives led
by ministries such as Economic Development and Innovation; Agriculture, Food and Rural
Affairs; and Northern Development and Mines.
3 C. Lavis, “Learning and Development Outlook 2011: Are Organizations Ready for Learning 2.0?” 2011, The Conference Board of Canada.

286
Ontario’s Apprenticeship System
Ontario’s apprenticeship system provides programs for more than 150 trades and occupations
in four sectors: industrial/manufacturing, motive power, service and construction.
In 2010, Ontario established the College of Trades, a self-funding regulatory college that will
help modernize the province’s apprenticeship and skilled trades system. Once operational,
the College of Trades will be responsible for establishing the scope of practice and for setting
out policies and procedures for the trades. The College of Trades will also tackle a variety of
issues facing the apprenticeship system, including apprenticeship ratios and compulsory
certification.
Shift Responsibility for Apprenticeship Administration
Too many administrative functions remain centralized in the ministry when they could be
shifted to parties that are better positioned to carry out these tasks. For example, the College
of Trades could undertake administrative responsibilities for apprenticeships once it is up and
running. As a self-funding institution, the College can assume responsibilities that are now
under the auspices of the ministry; this will reduce costs to government. In addition, colleges
and union training centres that provide classroom training for apprentices could take on the
administrative responsibilities related to that function.
Recommendation 9-9: Shift the responsibility for all apprenticeship administration to other
actors in the sector. Functions related to the administration of apprenticeship classroom
training should be given to colleges and union training centres. All other administrative
responsibilities for apprenticeships should be transferred to the College of Trades over time.

Chapter 10: Immigration
287
Chapter 10: Immigration
The Economic Importance of Immigration
Immigration has long been a key element of Canada’s and Ontario’s labour-market policy.
Ontario’s population is aging and fertility rates remain low. Consequently, immigrants will
constitute a rising proportion of population growth. Within this decade, immigration will account
for all net growth in the working-age population. By attracting skilled workers from abroad,
Ontario can better address potential labour-market shortages. Maintaining labour-force growth,
aided by successful immigrants, can help sustain Ontario’s long-term economic growth.
Lower levels of immigration would result in significantly slower growth in the working-age
population. For example, according to the Ontario Ministry of Finance, if immigration averaged
about 70,000 per year (which is about half the population projection reference scenario
of 139,000 per year), Ontario would have 1.4 million fewer people in the 15–64
working-age group by 2036 available to contribute to the economy and pay taxes.
On the other hand, if immigrants are unable to use their skills and education, their
contributions to the Ontario economy cannot be fully realized. There is considerable
concern about the deteriorating economic outcomes among recent immigrants over the
past two decades. In short, future trends in immigration and the degree to which Ontario can
successfully integrate new arrivals into the province’s labour market and social fabric will
have a significant effect on Ontario’s fiscal fortunes.

288
Recent Trends in Immigration
Ontario remains the top destination for immigrants to Canada. Over the last 20 years, Ontario
received 2.4 million landed immigrants — 52 per cent of all those who came to Canada.
However, over the last decade, rising economic fortunes in other provinces and major changes
to Canadian immigration policy have adversely affected Ontario’s immigration levels and the
mix of immigrants coming to Ontario. In 2010, Ontario received 118,114 permanent residents,
representing 42.1 per cent of total admissions to Canada and well below the province’s long-
term average. While regional economic conditions are a major factor, Ontario’s Ministry of
Citizenship and Immigration has also noted that new rules by the federal Minister of
Citizenship and Immigration, giving priority to certain types of applicants, has influenced the
mix of Ontario immigrants. The latest changes allow only 500 applicants in each of the 29
Federal Skilled Worker (FSW) occupations.
Studies have shown that immigrants selected on the basis of their human capital (e.g., high
levels of education and language skills) are more resilient to changes in their new environment
and culture.1 Historically, Ontario has relied heavily on admissions of economic class
immigrants, and particularly the FSW class who are admitted using a points-based system
measuring education, work experience, knowledge of English and/or French, and
other criteria. As the long-standing destination of choice for immigrants to Canada, Ontario
has been able to rely on the FSW program for most new economic immigrants to the province.
However, federal policy changes expanding the number of those admitted under the provincial
nominee, live-in caregiver and Quebec skilled worker programs have contributed to a decline
in FSW class landings to Ontario. In 2010, Ontario received 53,885 immigrants through the
FSW program, about 46 per cent of all landings to the province, down from a high of 89,078 in
2001. Fewer economic immigrants coming to Ontario each year means that Ontario’s mix is
shifting towards a higher proportion of family class and refugee immigrants, who are not
selected on the basis of their human capital.
Recommendation 10-1: Develop a position on immigration policies that is in the province’s
best economic and social interests. Present this position to the federal government with the
expectation that, as the largest recipient of immigrants in Canada, Ontario’s interest will be
given considerable weight in federal policy development.
Recommendation 10-2: Catalyze national discussions on immigration policy as the
successful integration of immigrants is critical for Canada’s and Ontario’s economic futures.
1 Naomi Alboim, “Adjusting the Balance: Fixing Canada’s Economic Immigration Policies,” 2009, A Maytree Report; Citizenship and
Immigration Canada, “Evaluation of the Federal Skilled Worker Program,” 2010, downloaded from http://www.cic.gc.ca/english/pdf/research-stats/FSW2010.pdf.

Chapter 10: Immigration
289
The federal government has allowed provinces to launch provincial nominee programs (PNP)
that allow for direct recruitment of workers to their provinces. Nominees’ applications are
fast-tracked by the federal government: PNP applications are generally processed within one
year, while skilled worker applications take two to five years, depending on the visa office.
TABLE 10.1 Permanent Residents Admitted in 2010, by Destination and Immigration Category (Including Dependants)
Category Atlantic Provinces
Que. Ont. Man. Sask. Alta. B.C. Territories Total
Economic Class
Skilled workers 1,373 34,240 53,885 898 712 11,513 16,659 77 119,357
Business immigrants 180 2,489 4,419 24 20 305 5,860 5 13,302
Provincial and territorial nominees
4,626 80 1,528 12,178 5,354 7,492 4,900 270 36,428
Live–in caregivers 63 1,082 7,310 139 124 2,277 2,884 30 13,909 Canadian experience class
66 25 2,360 37 33 811 571 14 3,917
Total economic class 6,308 37,916 69,502 13,276 6,243 22,398 30,874 396 186,913
Other
Total family class 821 9,629 29,341 1,377 726 7,372 10,865 89 60,220
Total protected persons
591 4,711 13,914 1,032 574 2,204 1,667 2 24,696
Total other 108 1,724 5,353 124 72 668 776 19 8,845 Category not stated 0 2 4 0 0 0 1 0 7 Total 7,828 53,982 118,114 15,809 7,615 32,642 44,183 506 280,681
Percentage 2.8 19.2 42.1 5.6 2.7 11.6 15.7 0.2 100
Note: Total includes immigrants that did not state a province of destination.
Source: Citizenship and Immigration Canada, “Facts and Figures 2010.”

290
Ontario was not only the last province to launch a PNP, but it is also limited to 1,000 principal
applicants a year, a very small number relative to the volume of annual immigration to the
province. Expanding the PNP could help the province partially offset the recent decline in the
number of economic immigrants and cover the full cost of providing integration services.
Evidence from other jurisdictions (such as British Columbia) has shown that PNPs have
benefited provinces in terms of increased revenues, jobs, skilled labour and investment.2
However, it is important that Ontario continue to emphasize its need to increase the numbers
of federal skilled workers in relation to provincial nominees. Although provincial nominees
enter Canada with an employment offer, their long-run earnings progression (employment
earnings in the years after landing) is not as robust as it is for skilled immigrants.3 Nationally,
earnings of FSW class immigrants grow faster than those of provincial nominees. By the fifth
year after landing, FSWs’ annual earnings are on average $2,000 to $7,000 higher than
those of provincial nominees.4
Recommendation 10-3: Advocate the federal government for a greater provincial role in
immigrant selection to ensure that the level and mix of immigrants coming to Ontario is
optimized to support economic prosperity and improve outcomes for immigrants. Barring
success, advocate for an expanded Provincial Nominee Program.
Ontario’s refugee population must also be considered in the context of Ontario’s overall
immigration levels and the skills required to support economic and labour-market growth.
In 2010, Ontario received 56.3 per cent of all refugees accepted into Canada. The incidence
of social assistance attachment for refugees is substantial,5 at a considerable cost for society
and the provincial treasury. Studies have shown that refugees experience much higher rates
of unemployment, part-time employment and temporary employment than do Canadian-born
individuals.6 Refugees are also less likely to have their credentials recognized in Canada.7
Refugees have complex needs and typically require more supports than other classes of
immigrants. Although they receive initial federal support, provincial social services are
unavoidably required.
Moreover, refugee claimants — those who request asylum upon landing in Canada — are not
eligible for such federally funded services as language instruction and information and referral
services, and thus rely directly on provincial supports until their immigration status is settled.
In 2010, Ontario received 65 per cent of refugee claimants who arrived in Canada.
2 “BC Provincial Nominee Program Evaluation Report,” 2011, Ministry of Jobs, Tourism and Innovation. 3 Stan Kustec and Li Xue, “Recent Immigrant Outcomes — 2005 Employment Earnings,” 2009, Citizenship and Immigration Canada. 4 David Kurfurst, “Evaluation of the Provincial Nominee Program,” 2011, Citizenship and Immigration Canada. 5 Don DeVoretz, Sirgiy Pivnenko and Beiser Morton, “The Economic Experience of Refugees in Canada,” 2004, Institute for the Study of
Labor. 6 Harvey Krahn, Tracey Derwing, Marlene Mulder and Lori Wilkinson, “Educated and Underemployed: Refugee Integration into the
Canadian Labour Market,” Journal of International Migration and Integration, 2000. 7 Rene Houle and Lahouaria Yssaad, “Recognition of Newcomers’ Foreign Credentials and Work Experience,” 2010, Statistics Canada.

Chapter 10: Immigration
291
Recommendation 10-4: Press the federal government to be more transparent in its refugee
policies and practices and to compensate Ontario for the costs of providing additional social
supports to refugees and refugee claimants.
Immigrant Integration
Labour-Market Performance
Immigrants were among the groups hardest hit by the recent global recession. During the peak
of the economic downturn (from 2008 to 2009), landed immigrants lost almost 55,000 jobs
(33.0 per cent of all jobs lost in Ontario) though they made up only 28.9 per cent of the labour
force in 2009. The overall employment level for all immigrants in 2010 was still below the 2006
level. In particular, very recent immigrants (in Canada for five years or less) were the most
adversely affected by the global recession, registering employment losses in each of the last
three years (2009, 2010 and 20118). In the first three quarters of 2011, Ontario’s
unemployment rate for very recent immigrants remained among the highest in Canada
(15.7 per cent), behind only Quebec (18.6 per cent).
However, even before the recent global recession, there were negative trends in immigrant
labour-market performance, compared to previous cohorts.
Employment levels among immigrants in Ontario hardly changed from 2006 to 2010. Ontario
accounted for 36.7 per cent of new immigrants (aged 15 and over) in Canada during that
period, but only 15.6 per cent of national immigrant employment growth.
8 Year to date: January to September.
TABLE 10.2 Distribution of Landed Immigrant Employment and Population Growth, Age 15+
(2006 to Year-to-Date 2011)
Atlantic
Provinces Que. Ont. Man. & Sask. Alta. B.C.
Share of Population Growth (Per Cent)
3.1 19.9 36.7 7.2 19.8 13.3
Share of Employment Growth (Per Cent)
3.3 27.3 15.6 11.3 31.9 10.7
Year to date = January to September.
Source: Statistics Canada, Labour Force Survey.

292
Immigrants to Ontario tend to be better educated than people born in Canada. Among very
recent immigrants (five years or less) between the ages of 25 and 54, 76 per cent have a
post-secondary certificate, diploma or university degree as of 2010, compared to 65 per cent
of the Canadian-born Ontario population in the same age category. Despite high educational
attainment, recent immigrants’ earnings remain well below those of Canadian-born citizens.
A recent study found that although federally selected economic immigrants have consistently
higher earnings levels than any other category among both males and females, overall the
earnings gap between immigrants and Canadian-born workers has been growing.9 Data from
the Labour Force Survey show average weekly wages of very recent immigrants in Ontario
(here for five years or less) were 23.9 per cent below those of Canadian-born workers in 2010,
up from 20.6 per cent in 2006. The earnings gap between university-educated immigrants and
their Canadian-born counterparts is even more startling: in 1995, the gap stood at $24,437
annually; by 2005, this figure had grown to $27,020.10
Recent immigrants are also more likely to live in poverty. Nearly one-quarter (23.8 per cent) of
immigrants who had been in Ontario for less than five years were considered low income in
2009, much higher than the overall low income rate of 13.1 per cent. Even among those in the
province for less than 10 years, nearly one in five was living in poverty (19.1 per cent).
9 Michael G. Abbott and Charles M. Beach, “Do Admission Criteria and Economic Recessions Affect Immigrant Earnings?” 2011, Institute
for Research on Public Policy. 10 D. Drummond, and F. Fong. “The Changing Canadian Workplace,” TD Economics, TD Bank Financial Group, 2010, p. 8,
downloaded from http://www.td.com/document/PDF/economics/special/td-economics-special-ff0310-canlab.pdf.
TABLE 10.3 Average Weekly Earnings Lower for Landed Immigrants in Ontario
2006 2007 2008 2009 2010
Total $766.16 $784.58 $814.88 $830.86 $848.00 Total landed immigrants 759.55 780.38 796.17 802.53 818.43 Very recent immigrants, 5 years or less 610.72 597.78 636.75 626.53 654.63 Recent immigrants, 5+ years 782.77 808.92 822.42 828.47 841.06 Recent immigrants, 5 to 10 years 714.02 706.70 747.61 734.58 733.95 Established immigrants, 10+ years 799.08 834.23 840.52 849.01 865.29 Non-landed immigrants 734.62 712.07 772.81 786.25 823.65 Born in Canada 769.62 787.98 823.12 842.75 860.04 Source: Statistics Canada, Labour Force Survey.

Chapter 10: Immigration
293
Other Integration Issues
Apart from current economic conditions, Ontario immigrants face a number of persistent
integration challenges that prevent them from performing well in the labour market.
The increased susceptibility of immigrants to low-income status suggests that they are having
a more difficult transition into the labour market. Two of the key drivers of labour-market
success for immigrants are a working knowledge of one of Canada’s official languages and
educational credentials that are accepted by regulatory bodies and potential employers.
Many immigrants arrive with valuable education and work experience, but often face barriers
that impede recognition of their credentials and work experience. This has negative
consequences for their labour-market performance and broader integration within Canadian
society. Potential contributing factors include the relevance of foreign education to the needs
of the Canadian labour market, linguistic ability in English or French, and entry requirements
for some trades and professions.
Language is one of the greatest barriers for immigrants seeking employment or pursuing
further education or training. Knowledge of English or French is crucial to an individual’s job
search and the process of professional, trade or academic accreditation.11 Citizenship and
Immigration Canada’s (CIC) “Facts and Figures 2010” indicated that about 25.3 per cent of
landed immigrants to Ontario had no English or French language capability. The International
Adult Literacy and Skills Survey (IALSS) 2003 results also confirm that knowledge of an official
language (as measured by the mother tongue of the immigrant) is favourably associated with
literacy performance. Recent proposed changes to the FSW program would increase points
for official language proficiency and younger applicants, place less emphasis on work
experience obtained abroad, and require mandatory third-party educational credential
assessment. The proposed change to the language proficiency requirement is a good first
step towards attracting immigrants who can more successfully integrate into Ontario’s
economy.
11 Shirley B. Seward and Kathryn McDade, “Immigrant Women in Canada: A Policy Perspective,” Canadian Advisory Council on the Status
of Women, 1988; Fernando Mata, “The Non-Accreditation of Immigrant Professionals in Canada: Societal Dimensions of the Problem,” Department of Canadian Heritage, 1999, downloaded from http://canada.metropolis.net/research-policy/conversation/MATAPAPER.html.

294
If employers and the regulatory bodies for the professions and trades do not recognize foreign
credentials and work experience, the result can be underutilization of the “human capital” of
many immigrants who were selected for their skills, work experience and other
socio-demographic characteristics.12 To address a similar problem, in 1999 the Australian
government instituted the pre-application skills assessment. This requires that prospective
applicants’ overseas qualifications be reviewed by the appropriate domestic body for regulated
professions or by Trades Recognition Australia for skilled trades prior to applying for a visa.
The assessment is valid only for the purpose of immigration as registration and licensing are
still required upon arrival. Six years after this program commenced, labour-force attachment of
recently arrived skilled migrants had increased from 76 per cent to 83 per cent.13
Recommendation 10-5: Advocate for the federal government to undertake a pilot program
equivalent to Australia’s pre-application skills assessment.
Over the past decade, the Ontario government has made significant investments in programs
and services to help newcomers settle, receive language training, and become
job-ready and licensed in their field. The value of these investments should be leveraged
against complementary services already offered through Employment Ontario, such as those
under the Canada-Ontario Labour Market Agreement that focus on literacy and essential skills.
Recommendation 10-6: Streamline and integrate provincially delivered integration and
settlement services for recent immigrants with Employment Ontario.
As noted in Chapter 9, Employment and Training Services, this should be carefully sequenced
to ensure no drop occurs in service quality during the transition.
12 Monica Boyd and Grant Schellenberg, “Re-Accreditation and the Occupations of Immigrant Doctors and Engineers,” 2007, Statistics
Canada; Monica Boyd and Derrick Thomas, “Skilled Immigrant Labour: Country of Origin and the Occupational Locations of Male Engineers,” Special Issue on Migration and Globalization, Canadian Studies in Population 29 (2002) pp. 71–99; Sarah V. Wayland, “Unsettled: Legal and Policy Barriers for Newcomers to Canada,” 2006, Law Commission of Canada.
13 B. Birrell, L. Hawthorne and S. Richardson, “Evaluation of the General Skilled Migration Categories,” 2006, Australia Department of Immigration and Citizenship.
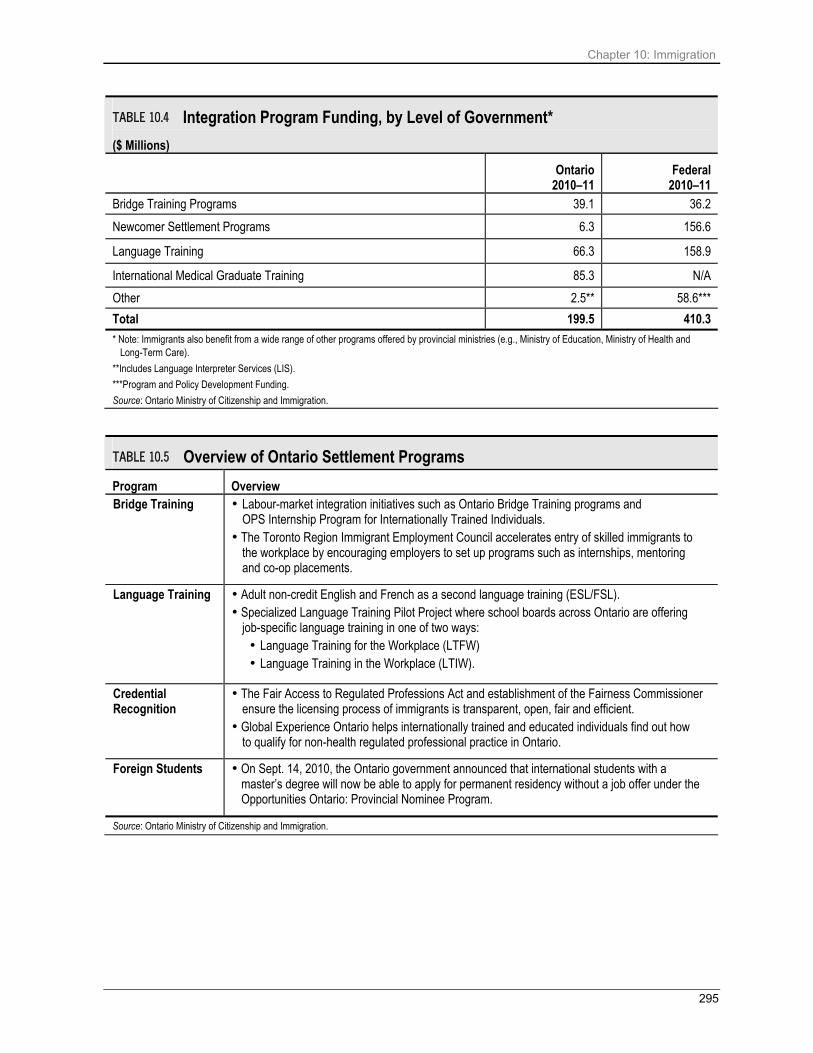
Chapter 10: Immigration
295
TABLE 10.4 Integration Program Funding, by Level of Government*
($ Millions) Ontario
2010–11 Federal
2010–11 Bridge Training Programs 39.1 36.2
Newcomer Settlement Programs 6.3 156.6
Language Training 66.3 158.9
International Medical Graduate Training 85.3 N/A
Other 2.5** 58.6***
Total 199.5 410.3
* Note: Immigrants also benefit from a wide range of other programs offered by provincial ministries (e.g., Ministry of Education, Ministry of Health and Long-Term Care).
**Includes Language Interpreter Services (LIS).
***Program and Policy Development Funding.
Source: Ontario Ministry of Citizenship and Immigration.
TABLE 10.5 Overview of Ontario Settlement Programs
Program Overview Bridge Training
Labour-market integration initiatives such as Ontario Bridge Training programs and OPS Internship Program for Internationally Trained Individuals. The Toronto Region Immigrant Employment Council accelerates entry of skilled immigrants to
the workplace by encouraging employers to set up programs such as internships, mentoring and co-op placements.
Language Training
Adult non-credit English and French as a second language training (ESL/FSL). Specialized Language Training Pilot Project where school boards across Ontario are offering
job-specific language training in one of two ways: Language Training for the Workplace (LTFW) Language Training in the Workplace (LTIW).
Credential Recognition
The Fair Access to Regulated Professions Act and establishment of the Fairness Commissioner ensure the licensing process of immigrants is transparent, open, fair and efficient. Global Experience Ontario helps internationally trained and educated individuals find out how
to qualify for non-health regulated professional practice in Ontario.
Foreign Students On Sept. 14, 2010, the Ontario government announced that international students with a master’s degree will now be able to apply for permanent residency without a job offer under the Opportunities Ontario: Provincial Nominee Program.
Source: Ontario Ministry of Citizenship and Immigration.

296
The first immigration agreement between the federal and Ontario governments — the 2005
Canada-Ontario Immigration Agreement (COIA) — provided an infusion of new funds to help
newcomers settle and learn or improve their English or French language skills. However,
the government of Ontario has noted that the federal government has not kept its commitment
to spend all the funding allocated to Ontario. To date, the federal government has underspent
its commitment through the COIA by more than $220 million.
TABLE 10.6 Federal Spending in Ontario under the Canada-Ontario Immigration Agreement since 2005–06
($ Millions)
Funds Promised
Base Allocation COIA
Allocation Total Promised Actual Funds Spent Spending Shortfall
Under COIA
2005–06 108.0 50.0 158.0 111.2 46.8 2006–07 108.0 115.0 223.0 169.3 53.7 2007–08 108.0 185.0 293.0 241.0 52.0 2008–09 108.0 250.0 358.0 317.5 40.5 2009–10 108.0 320.0 428.0 413.6 14.4 Total 540.0 920.0 1,460.0 1,252.6 207.4
COIA Extension (2010–11)
2010–11 108.0 320.0 428.0 410.3 17.7 Source: Ontario Ministry of Citizenship and Immigration.
Even with these investments, immigrants struggle in the current economic environment and
continue to find it difficult to integrate into the Ontario economy. Achieving the full benefits of
immigration to Ontario requires not only that we refine the selection process but also that we
take more effective measures to facilitate the economic integration of new immigrants. Ontario
should push for greater policy control and full funding support for immigrant settlement and
integration through the next COIA. We are optimistic that the recent collaboration between the
two governments through the Federal Skilled Worker Program Backlog Reduction Pilot may
signal that we are embarking on a new, more co-operative era in Canada-Ontario
immigration policy.

Chapter 10: Immigration
297
A new COIA will ideally include devolution of settlement and integration services. This will
allow the province to reduce duplication and help immigrants get services they need when
they need them, and allow service providers to spend more time helping immigrants and less
on administration.
With devolved settlement funding, the province will be better positioned to address the needs
of recent immigrants. In the coming year, Ontario should continue to build a business case for
devolution of settlement and integration services by working with key stakeholders, as it
considers its approach for the next negotiations with the federal government.
Recommendation 10-7: Advocate for devolving federal immigrant settlement and training
programs to the province with an appropriate funding mechanism, similar to those established
in British Columbia and Manitoba.

298

Chapter 11: Business Support
299
Chapter 11: Business Support
Like many jurisdictions around the world, the Ontario government provides financial and
other forms of support to private businesses to foster investment and economic growth.
Many funding programs also aim to create jobs in the private sector, and are often targeted
at specific industry sectors and regions. Looked at from the perspective of the total fiscal plan,
however, discretionary spending on business support is not in the same league as spending
on education and health care — nor is it at the same level of priority. Yet it can have a
substantial impact on the economy — both good and bad. It is time for the government to
rethink and reset the province’s business support programs (commonly referred to as
“business subsidies”).
Economic Vision
Much of Ontario’s economic success was driven by advantages that no longer exist (such as a
competitive and often undervalued Canadian dollar, relatively free access to a rapidly growing
U.S. market and low-cost energy supplies), so a new direction is now required.1
Ontario must chart a path that reduces Ontario’s reliance on the U.S. economy — a path that
features bold policy action by the provincial government in concert with other governments and
the private sector. Such a policy should include nine key ingredients:
Top-quality labour force;
Effective integration of immigrants into the workforce;
World-class infrastructure, including transit;
Reliable electricity system;
Being a leader in the environment;
Competitive tax system;
Enhanced trade;
Shift from dependence (social assistance) to labour-force participation; and
Supportive federal policy.
1 The analysis in this section is drawn directly from Don Drummond and Derek Burtleton’s TD Economics Paper, “Time for a Vision of
Ontario’s Economy: Much of the Foundation of Past Economic Success Has Crumbled,” Sept. 29, 2008, downloaded from http://www.td.com/document/PDF/economics/special/td-economics-special-db0908-ont.pdf.

300
The Ontario government must issue a broad discussion paper this year on where it wants to
take the economy over time. Such a report, which would replace the relatively sterile exercise
of the mandated long-term economic and fiscal outlook, could form the basis of debate on this
issue. It is vital that the discussion paper deal with far more than numbers and budget
balances. It should address the fundamental issues that matter to Ontarians — jobs, income
and improving people’s lives.
Understand Productivity Challenges
Ontario’s economic vision must also generate interest in and understanding of productivity. 2
The aging of Ontario’s population means that labour-force growth will slow; this means that
productivity growth is becoming increasingly important to economic success. Despite this
importance, governments fear the word “productivity” because of public misunderstanding of
its meaning. Polls and focus groups tend to find that many Canadians believe productivity
means working harder for less pay — the opposite of an economist’s definition.
Economists and other analysts have compiled lists in recent decades of the actions they
believe are needed to improve Canada’s productivity performance. Elements in common on
many of these lists include the following:
Low, stable inflation;
Lower public debt-to-GDP ratios;
Free trade externally and internally;
Promotion of competition, including removal of foreign ownership restrictions;
Removal of barriers to firm growth, including the jump in taxation rates from small to large
businesses;
Removal of work disincentives, including those embedded in Employment Insurance;
Reduction in regulatory burden;
Lower taxes on capital;
Lower marginal personal income tax rates, especially for very low- and modest-income
Canadians (although this might raise labour-force participation rather than productivity);
A shift away from taxing income and capital towards taxing consumption;
Improvement in the selection and integration of immigrants;
Increased investment in public infrastructure, especially transportation and electricity;
2 The analysis in this section is drawn directly from Don Drummond’s paper, “Confessions of a Serial Productivity Researcher,” International
Productivity Monitor 22, (Fall 2011), pp. 3–10, downloaded from http://www.csls.ca/ipm/22/IPM-22-Drummond.pdf.

Chapter 11: Business Support
301
Investment in post-secondary education; and
Attention to the non-post-secondary education stream, including literacy, apprenticeships
and training.
To the credit of the federal and Ontario governments, action has been taken in about
70 per cent of these areas. However, productivity has continued to lag. If government policy
action does not cure what ails us regarding productivity, what is missing?
Ontario must turn its attention to the role of the private sector. How can the business sector
become more competitive, more entrepreneurial, more productive? Shifting private business
behaviour to capitalize on the value of investing profits in machinery and equipment is central
to improving productivity. Higher productivity, or output per worker, creates opportunities for all
segments of the Ontario economy to win. It can raise real wages of workers; allow businesses
to expand, thereby creating more jobs; and generate more revenue for the Ontario
government.
Government’s role in this cultural shift begins with understanding the underlying causes of
puzzling aspects of current business behaviour such as:
Why does only four per cent of Canadian small to medium enterprise (SME) revenue come
from exports to the emerging economies?
Why do we have a much higher concentration of small firms than the United States?
Why did firm size not grow in response to NAFTA, as had been predicted?
Why did so many firms try so desperately to remain below the small business income
threshold?
Why do Canadian and U.S. firms deal with information and communications technology
(ICT) and computers so differently? Why do Canadian firms dramatically underinvest in
ICT on a relative basis and use the equipment in less sophisticated ways?
Transferring the focus of productivity research from macro to micro and exploiting new data at
the firm level through collaborations with Statistics Canada and Industry Canada are essential
underpinnings of Ontario’s economic vision.
This is not just putting together yet another “expert panel”; it is about getting regular, reliably
collected data from Ontario businesses (and preferably businesses across Canada) that
can help guide initial policy transformations, educate businesses about the opportunities that
lie in investing in productivity improvements and track Ontario’s progress towards
economic recovery.

302
Recommendation 11-1: Government needs to publish an “economic vision” for Ontario.
This should include the context of recent history in terms of what sectors have been growing
and declining to identify targeted areas for investment, and summarize the challenges and
opportunities provincewide and by sector and region. Finally, and most importantly, it needs
to present a strategy that aligns with efforts to realize the economic objectives of the
government — one that uses increased productivity as a keystone.
Poised for Growth
Ontario has two critically important assets that support economic growth: it has one of the
world’s most highly skilled workforces and an internationally competitive tax regime.
About 64 per cent of the province’s population in the 25–64 age group has a
post-secondary education.3 More than 28 per cent of the workforce is employed
in knowledge-based industries — higher even than in the United States.4
When fully implemented, the province’s recent tax reforms will save business about
$4.4 billion per year from the removal of the embedded sales tax, $2.5 billion per year
from corporate income tax (CIT) rate reductions and more than $1.8 billion per year from
elimination of the capital tax. This will amount to more than $8 billion in annual tax savings
to business, distributed across all sectors of the economy. These measures will help cut
Ontario’s marginal effective tax rate on new business investment in half by 2018, making
Ontario one of the most attractive jurisdictions in the industrialized world in which to invest
and create jobs.
3 Statistics Canada, Labour Force Survey (special tabulation for Ontario based on Organization for Economic Co-operation and
Development (OECD) postsecondary education attainment classification), 2010. 4 2011 Ontario Budget, p. 8, Ministry of Finance estimate. Following the OECD, knowledge-based industries include “high tech”
manufacturing industries such as automotive manufacturing and aerospace, and “knowledge-intensive” service industries such as financial services, digital media and computer system design.

Chapter 11: Business Support
303
TABLE 11.1 Total Business Tax Relief by Sector — Annual Savings1,2 ($ Millions)
Sector Harmonized Sales Tax
(HST)
Corporate Income Tax
(CIT) Capital Tax3 Total Agriculture 30 15 s 45 Forestry, Fishing and Hunting 20 s s 20 Mining, Utilities, and Oil and Gas 120 35 85 240 Construction 2,115 145 50 2,310 Manufacturing 465 280 275 1,020 Wholesale Trade 400 255 90 745 Retail Trade 255 120 55 430 Transportation and Warehousing 550 50 50 650 Information and Cultural Industries 575 95 105 775 Financial Services (except Insurance) (875) 685 740 550 Insurance (160) 190 10 40 Real Estate (50) 125 95 170 Rental and Leasing 90 25 40 155 Professional, Scientific and Technical Services 445 285 165 895 Other Services (except Public Administration) 390 195 75 660
Total Business 4,370 2,500 1,835 8,705 1 Represents the annual savings following the full phase-in of the tax measures in 2011 dollars. Savings do not include more than $700 million annually in
business education tax reductions and targeted tax measures introduced in 2009, and over $635 million in annual compliance cost savings from a single HST administration and a single corporate tax administration.
2 Annual savings of less than $5 million are denoted by the letter “s” (small). 3 Capital tax savings compared to the capital tax structure before the 2004 Ontario Budget measures. Source: Ontario Ministry of Finance, December 2011.
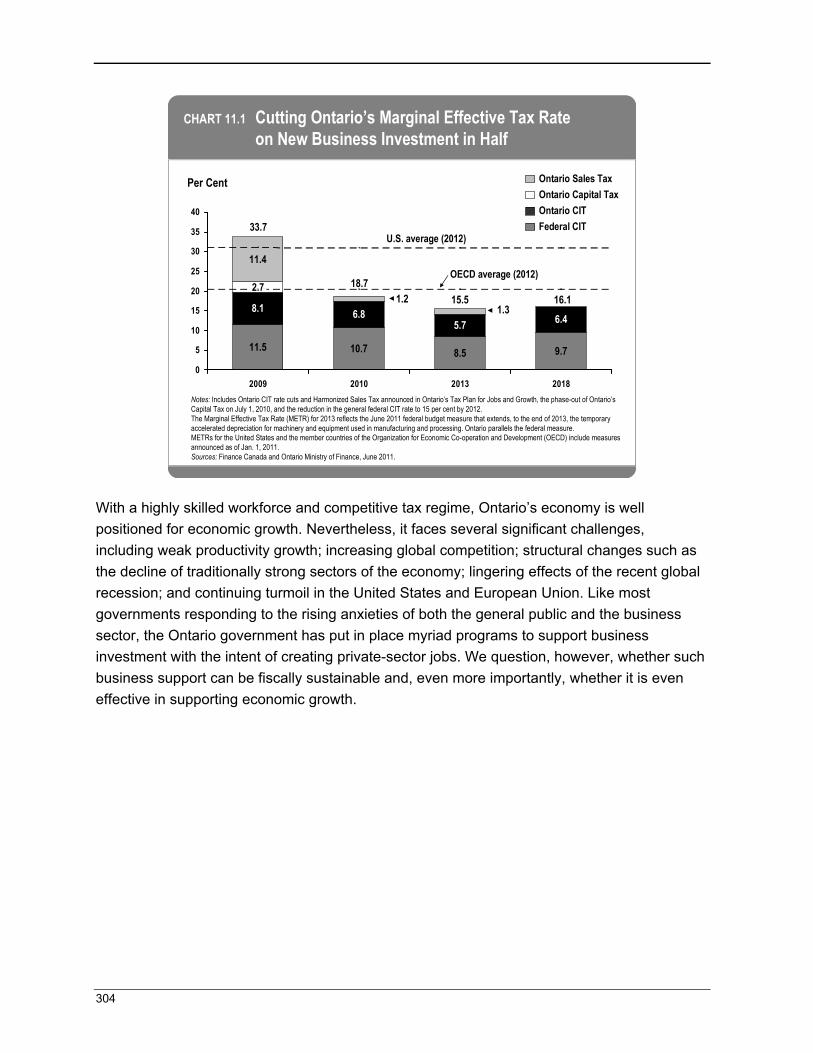
304
Per Cent
CHART 11.1 Cutting Ontario’s Marginal Effective Tax Rate on New Business Investment in Half
11.5 10.7 8.5 9.7
8.1 6.85.7 6.4
11.4
1.21.3
18.7
33.7
15.5 16.1
0
5
10
15
20
25
30
35
40
2009 2010 2013 2018
Notes: Includes Ontario CIT rate cuts and Harmonized Sales Tax announced in Ontario’s Tax Plan for Jobs and Growth, the phase-out of Ontario’s Capital Tax on July 1, 2010, and the reduction in the general federal CIT rate to 15 per cent by 2012. The Marginal Effective Tax Rate (METR) for 2013 reflects the June 2011 federal budget measure that extends, to the end of 2013, the temporary accelerated depreciation for machinery and equipment used in manufacturing and processing. Ontario parallels the federal measure. METRs for the United States and the member countries of the Organization for Economic Co-operation and Development (OECD) include measures announced as of Jan. 1, 2011.Sources: Finance Canada and Ontario Ministry of Finance, June 2011.
Federal CIT
Ontario CIT
Ontario Capital Tax
Ontario Sales Tax
◄
◄
U.S. average (2012)
OECD average (2012)2.7
With a highly skilled workforce and competitive tax regime, Ontario’s economy is well
positioned for economic growth. Nevertheless, it faces several significant challenges,
including weak productivity growth; increasing global competition; structural changes such as
the decline of traditionally strong sectors of the economy; lingering effects of the recent global
recession; and continuing turmoil in the United States and European Union. Like most
governments responding to the rising anxieties of both the general public and the business
sector, the Ontario government has put in place myriad programs to support business
investment with the intent of creating private-sector jobs. We question, however, whether such
business support can be fiscally sustainable and, even more importantly, whether it is even
effective in supporting economic growth.

Chapter 11: Business Support
305
Types of Business Support
The numerous types of support to business can be generally classified as either direct or
indirect. In this analysis, direct support mainly includes grants, loans and equity investments
made available to businesses through various funding programs. Some support is aimed at
specific sectors such as forestry, agriculture, manufacturing and the entertainment and
creative cluster. Programs like the Strategic Jobs and Investment Fund and Northern Ontario
Heritage Fund tend to be aimed at a broader range of sectors. In 2010–11, the government
provided over $1.3 billion to businesses in the form of grants, loans and loan guarantees as
well as support that did not directly involve transfers of cash or credit to individual firms
through 44 funding programs across nine ministries5 — an increase of about 95 per cent
since 2006–07.
1,313
675
0
350
700
1,050
1,400
2006–07 2010–11
Source: Ontario Ministry of Finance and Public Accounts 2006–07 through 2010–11.
$ Millions
CHART 11.2 Total Direct Business Support
Fiscal Year
5 See Appendix 11.1 for the list and note that two ministries have since merged into one.

306
In 2011, $2.3 billion of indirect support was provided to businesses in two forms:
tax expenditures, including tax credits for research and development (R&D) and for specific
sectors such as media industries, and lower CIT rates for small business and for income from
manufacturing and processing. Tax credits that were introduced when CIT rates were high by
international standards have been maintained, even though CIT rates in Ontario have
fallen significantly.
0
500
1,000
1,500
2,000
2,500
2006 2011
Source: Ontario Ministry of Finance based on estimates of Ontario-only tax provisions as reported in the Ontario Economic Outlook and Fiscal Review in 2006 and 2011.
$ Millions
CHART 11.3 Indirect Business Support — Tax Expenditures
Year
2,310
1,882
Refundable Tax CreditsNon-Refundable Tax Credits/Deductions/Exemptions
In the 2011 Ontario Budget, the government committed to undertake a review of direct
business support programs. As well, the 2011 Ontario Economic Outlook and Fiscal Review
announced that the province would conduct a review of business tax expenditures to
assess their effectiveness and administrative efficiency. The Commission commends the
government for undertaking these reviews as an important opportunity for the province to
maximize value-for-money and return on investment for taxpayers.

Chapter 11: Business Support
307
The province also provides businesses with a wide range of other supports not traditionally
considered to be subsidies, though businesses can benefit from them, which are included in
this analysis but not in government reviews. These include various business services such as
funding for general services provided by industry, information, consulting and marketing
services, certain public procurement activities, targeted training/skills development programs,
and research and development (R&D) performed at public institutions6 where a business is
often a co-funder. While these programs are included in our analysis, we refrain from
commenting on them at length as data have not been gathered and evaluated consistently
across ministries.
Recommendation 11-2: Expand government reviews of direct business support programs
and tax expenditures to include supports such as business services, procurement, and publicly
funded research and development (see Chapter 7, Post-Secondary Education, for details on
research funding for universities and colleges).
Business subsidies are not the only way government can help make Ontario a more
competitive jurisdiction for doing business. The province has made significant investments in
public infrastructure such as roads and bridges to facilitate the movement of goods and labour,
and in a skilled workforce through education and training. It is working collaboratively with the
federal government and other provinces in areas such as immigration and international trade.
It has taken major steps to reduce the regulatory burden on firms and, as noted above, has
significantly reduced business taxes. All told, these policy initiatives by the provincial
government have dramatically improved the opportunity for firms in Ontario to succeed in an
increasingly competitive global economy and they have reduced the need for business support
programs aimed at subsidizing the costs of business inputs such as labour, machinery and
equipment, and buildings.
6 Based on data reported by Statistics Canada in its annual survey of scientific activities of the Ontario government, the province
transferred an average of $386 million per year over 10 years from 2001–02 to 2010–11 for R&D performed by universities and hospitals. Direct assistance to business for R&D averaged $19 million per year for the same period.

308
Our View on Business Subsidies
Empirical evidence suggests that business subsidies are often not an efficient use of public
resources and have done little to raise living standards. Subsidy programs can distort business
decisions to the point that they are no longer based on sound economic criteria or require a
reasonable degree of private risk. Without proper accountability, these programs are also
susceptible to stakeholder lobbying, which can result in an economically inefficient allocation
of funds. Furthermore, the outcomes of these programs are often vague and difficult to
measure, preventing thorough evaluation and analysis. It is not enough to demonstrate that
a program creates or retains jobs, especially as these jobs may have been created without
government support. We agree with the conclusion reached by the Task Force on
Competitiveness, Productivity and Economic Progress, headed by Roger Martin, that an
economic policy focused on job creation “can be very costly with few results.”7
Subsidies that are used to bail out failing firms or declining sectors are also problematic.
While they can achieve short-term objectives such as job retention, over the long term they
can impede structural shifts and allocation of resources that would improve productivity in the
overall economy. Bailouts entail a potential political risk, provoking questions of fairness and
the creation of an “un-level” playing field among business competitors. The record of such
interventions has generally featured more failures than successes.
Certain sectors and activities rely considerably on government support. When the combined
subsidy of federal and provincial grants and tax credits is considered, the support can be
significant. For example, it is estimated that almost 60 per cent of all film and television
production spending in Ontario in 2010 was subsidized by federal and Ontario film tax credits,
grants and other related funding.8 Similarly, federal and provincial tax incentives for research
and development can reduce the after-tax cost of a $100 R&D expenditure in Ontario to as low
as $37. There are also situations where a single dollar of business expense is eligible for two
or more provincial tax incentives, or in which tax incentives are provided on expenses where
the business received direct funding from the provincial or federal government.
7 “Prospects for Ontario’s Prosperity,” Task Force on Competitiveness, Productivity and Economic Progress, November 2011, p. 31. 8 Ministry of Finance estimate based on data from the 2010 Ontario Transparency in Taxation Report, the Federal Tax Expenditures and
Evaluations 2010, the Canada Media Fund, Telefilm Canada, the Ontario Media Development Corporation, and Statistics Canada.

Chapter 11: Business Support
309
An Illustrative Example: In many cases, current incentives are geared towards stabilization instead of industry transformation. Ontario’s new Risk Management Program (RMP) is an example of a business support program in which incentives are not aligned with productivity growth and market principles. This program helps manage business risk by providing income stability to participating farmers in grain and oilseeds, cattle, hog, sheep and veal, as well as edible horticulture sectors. As it is currently designed, it is a so-called “risk-sharing” program, but the province assumes the lion’s share of the risk by assuming all the liability to compensate for any drop in commodity prices. A significant drop in prices could drive up the cost of the program by hundreds of millions of dollars, with no share being borne by the businesses.
Programs like the RMP serve to support the status quo. By focusing the program objective on maintenance, not improvement, it provides businesses with no incentive to increase efficiency or expand markets — the very activities necessary to increase incomes and jobs. Instead of stabilizing industries, the province should be shifting efforts towards investments in innovation that support efficiencies and productivity gains. In the case of the RMP, investments in equipment and process improvements that help farmers become more competitive and less sensitive to shifting costs are the preferred route.
Reviewing the RMP, and other programs like it, within a broader context of support for businesses could lead to a more integrated bundle of mutually supportive and complementary initiatives that support producers in the short term but also align incentives to assist the target sectors in achieving long-term competitiveness and, in turn, job creation.
Currently, Ontario has a hodgepodge of direct and indirect programs scattered across a
variety of ministries with various economic development mandates. This unco-ordinated
system leads to duplication in delivery and processing, resulting in unnecessary costs. Many
firms, especially small ones, have difficulty navigating this complex program landscape, which
is further complicated by the existence of federal and local subsidies and other programs.
Business support programs are fragmented and lack clear and coherent objectives.
This creates significant challenges for tracking and evaluating program costs against
outcomes. As data on outcomes are often poor and inconsistent, it is unclear whether the
programs are achieving any economic benefits for Ontario.
Some argue that since other jurisdictions employ subsidies to lure business investment,
Ontario must do the same to remain competitive. This line of thinking can lead to situations
where companies are able to bid up incentives across competing jurisdictions, resulting in
what is known as the “winner’s curse.”
The government’s business support programs require a reset in light of Ontario’s fiscal and
economic challenges. If we were to design business support programs from scratch, they
would not look like what we have now.

310
Towards a New Business Support Framework
Given the spending reduction targets we propose in Chapter 1, The Need for Strong Fiscal
Action, spending on business support at current levels is unsustainable. To address the
challenges noted above, we can either restructure the existing programs, including ending
poor performers, or make a clean break and start over by asking ministries to develop fewer
programs that are better focused on helping Ontario businesses become more productive
and competitive.
We believe the second option is the better way. We suggest that the government develop a
new business support framework built on five policy pillars:
Refocus mandate to sharpen objectives and incorporate evidence-based analysis;
Consolidate funding across ministries;
Include tax expenditures;
Integrate delivery; and
Strengthen accountability and transparency.
Refocus Mandate
A refocused mandate for business support programs would shift from an emphasis on job
creation towards encouraging firms to enhance productivity through innovation; technology
adoption and training; improved business practices; and energy conservation and efficiency.
It also means encouraging entrepreneurship. Innovative new firms can increase productivity
directly, as well as drive incumbent firms to become more productive in order to compete.
Research performed in universities, colleges and hospitals is an especially fertile field for
harvesting commercial opportunities by entrepreneurs and risk capitalists.
The impetus for improving productivity is clear. As noted in Chapter 1, it will be difficult to
achieve Ontario’s deficit target by 2017–18 with a continuation of the weak productivity growth
seen in the private sector in recent years. Business support programs that promote improved
productivity growth will therefore play an important part in ensuring Ontario’s fiscal viability.
Improving private-sector productivity allows businesses to successfully compete in domestic
and global markets and create jobs. Governments do not create jobs in the private sector —
only successful businesses can do that. Rather than the traditional focus on job creation as an
end in itself, government should focus its business support on those areas with the greatest
potential to improve productivity. New programs must clearly demonstrate that they are
aligned with this objective.

Chapter 11: Business Support
311
The productivity lens should also be applied when using subsidies to attract foreign business
investment to Ontario. Some flexibility will be needed, as there may be opportunities where
government support can attract a substantial anchor investment to the province. Such action,
however, should be reserved for exceptional or extraordinary cases. In the global context,
especially as developing economies ramp up their business investments, Ontario must
collaborate nationally and build international bridges to be competitive. Efforts should continue
to strategically target international investment based on the province’s potential to
improve productivity.
Similarly, further consideration needs to be given to whether a productivity focus should apply
across all industries or if it needs to be fine-tuned to specific industry sectors. Our preference
is for a more broad-based approach.
Recommendation 11-3: Refocus the mandate of business support programs from job
creation to productivity growth in the private sector.
Consolidate Funding
To develop new and better business support programs, the government must change the
process by which ministries allocate funds for such programs. Currently, direct business
program funding resides within a ministry’s “envelope,” or annual funding allocation.
Tax-based support is currently not counted as part of this allocation. This hinders alignment
and decreases efficiency, as money cannot easily be shifted away from underperforming
programs. As well, it often results in duplicated and unco-ordinated efforts by different
ministries.
Recommendation 11-4: Starting in 2012–13, make ministries responsible and accountable
for tax expenditures that align with their respective program areas. Ministries should initially
be provided with the means to fund the tax expenditures (i.e., a net zero impact for the
ministries), but after that they will have to manage the pooled envelope of tax expenditures
and direct business support programs to meet budgetary targets.
This will provide an incentive to tighten inefficient tax expenditures as the ministries
responsible for the tax expenditures will have the ability to reform tax expenditures when
seeking potential savings.

312
Recommendation 11-5: Introduce a new funding model that encourages efficiency and
harmonizes efforts across ministries. We propose that money for both direct and indirect
business support programs, including refundable tax credits, should be pooled into a single
funding envelope.
Ministries would compete for access to this funding to deliver their proposed business support
programs. A proposed program should satisfy the following criteria:
The program is designed to fix a particular economic problem related to productivity growth
based on solid evidence-based analysis. The rationale for government involvement must
constitute a compelling case that the support is still necessary despite Ontario’s
internationally competitive tax regime.
The support program is based on a logic model that uses economic theory and evidence to
link policy action to a desired outcome that would not have been achieved without the
program in place, and that the incentives are aligned with basic business practices and
market principles.
The program is the most cost-effective way to achieve the same or better result. In other
words, the outcomes or economic benefits must exceed all the potential costs of
implementing the program to government, business and the economy as a whole. These
would normally include the costs to government for administering the program and the
costs to business in effort and money for accessing the program. Just as important,
however, the cost-benefit analysis must include the economic costs of the distortions from
the taxes used to finance the program.
The program does not create market distortions and other perverse consequences such
as crowding out private investment and skewing benefits to certain groups. If it does
(most programs will have some negative effects), are these issues managed or corrected
through the design of the program?
The program does not duplicate other programs and services offered at the federal or local
level. (Better yet, it complements or leverages business support from other government,
community and industry sources.) It should, however, prohibit “double dipping” (where
grants are used in calculating tax support) and limit the “stacking” or combination of federal
and provincial grant and tax support to no more than 30 per cent of the business expense.
To support continuous program improvement, the program design should include a formal
evaluation component that would assess performance against these criteria on an
ongoing basis.
Chapter 11: Business Support
313
To fund this single envelope, we propose that a sunset of all existing direct business support
programs occur at the end of fiscal year 2012–13 (see Recommendation 11-8 regarding
refundable corporate income tax credits). This would help distinguish between priority services
and programs that have simply continued beyond their need. Instead of the government
creating more programs to address the same concerns, outdated initiatives would be
eliminated, giving ministries enough time to prepare for the funding model being proposed by
the Commission. The government would still be expected to meet all legal and financial
commitments of existing programs, and complete legacy projects. The remaining money
should be devoted to the single envelope, while also allowing some savings to help the
government meet its 2017–18 deficit reduction target. By following this approach, we believe
it should be possible to reduce the current level of direct business support by one-third or
possibly more.
Recommendation 11-6: Sunset all current direct business support programs in 2012–13.
After accounting for legal commitments and legacy projects, as well as the 2017–18 deficit
reduction target, pool the remaining funds and tax expenditures into a single envelope used
to fund business support programs submitted by ministries. These programs must align with
the productivity focus of the government economic development policy and meet rigorous
design criteria.
Through these changes, we hope that ministries will work together to develop better-aligned
and more strategic business support programs that address Ontario’s key economic
challenges.
Include Tax Expenditures
In 2011, Ontario provided approximately $2.3 billion of support to business per year in the
form of tax expenditures such as refundable and non-refundable tax credits. This is in addition
to the annual savings from the recent tax reforms introduced by the province that, when
fully implemented, will amount to more than $8 billion for business across all sectors of the
economy. The savings include about $4.4 billion per year from the removal of the embedded
sales tax, $2.5 billion per year from CIT rate reductions and more than $1.8 billion per year
from elimination of the capital tax. The level of support provided through tax credits may have
made sense at a time when provincial tax rates were high and credits could help make Ontario
more competitive for business investment. It makes less sense when Ontario’s tax system is
already competitive for business investment because of major tax reforms.

314
Refundable Corporate Income Tax Credits
Tax expenditures are a form of spending through the tax system. However, for external
reporting purposes, most tax expenditures are currently offset against tax revenue, with only
the net amount of revenue being reported. The Public Sector Accounting Board (PSAB) of the
Canadian Institute of Chartered Accountants has released a new standard for tax revenue that
distinguishes between tax concessions and transfers made through a tax system. It has been
recommended that this new standard be applied to financial statements for fiscal years
beginning on or after Apr. 1, 2012. Adopting the PSAB standard would result in the reporting of
certain tax expenditures as expenses, which would strengthen fiscal accountability and
transparency in financial reporting.
Recommendation 11-7: Follow the Public Sector Accounting Board (PSAB) recommendation
to report transfers through the tax system as expenses, and adopt the PSAB standard for tax
revenue beginning with the 2012 Ontario Budget. In 2011, Ontario provided refundable
business tax credits (tax credits that are “refunded” or paid out, even if no tax is payable)
totalling $723 million to three main areas: media industries, research and development, and
apprenticeship and co-op student training. Many of these tax credits overlap with the
objectives of direct business support programs, and all should be subjected to the same
degree of scrutiny as program spending. Further gains could be achieved by making the tax
system more neutral, removing special preferences that favour some business activities over
others and better aligning refundable corporate income tax credits with direct business
support programs.
Recommendation 11-8: Introduce legislation to sunset all current refundable corporate
income tax (CIT) credits in 2012–13 as part of the government’s tax expenditure review.
Add refundable CIT credits that demonstrate effectiveness and administrative efficiency into
the single envelope used to fund business support programs, and include revenue forgone
from those tax credits in the funding allocation of an appropriate ministry.
Non-Refundable Tax Credits and Other Business Support in the Tax System
Refundable tax credits are not the only form of government spending in the tax system.
With a more competitive business tax structure, non-refundable tax credits and business
support in other areas of the tax system should also be examined for effectiveness and
administrative efficiency. The province should aim to maximize value for money and ensure
that the tax system directly supports economic growth in Ontario.

Chapter 11: Business Support
315
Tax expenditures should provide only the degree of support necessary to achieve the intended
results. For example, the Ontario small business deduction (SBD) provides a reduced CIT rate
of 4.5 per cent (versus the general CIT rate of 11.5 per cent) on the first $500,000 of Ontario
active business income of Canadian-controlled private corporations (CCPCs). The SBD is
intended to provide tax relief to small CCPCs that have historically had difficulty raising capital,
a process generally achieved through the use of loans and/or equity contributions. Small firms’
access to these sources of funding is often limited by the inherent risks associated with
investments in small or start-up businesses; small business owners tend to rely on their
personal savings as a source of capital. Federally, and in all other provinces, the benefit of
the SBD is generally phased out for CCPCs with levels of capital between $10 million and
$15 million. Ontario is alone in extending the benefit of the SBD to all CCPCs without regard to
the size of the company. Given the considerable capital requirements of larger companies
compared to the relatively small tax benefit provided by the SBD, this tax measure is unlikely
to generate efficient or effective investment decisions by larger companies.
Recommendation 11-9: Restrict the Ontario small business deduction (SBD) for large
Canadian-controlled private corporations by paralleling the federal business limit reduction,
and include the Ontario SBD in the review of tax expenditures for effectiveness and
administrative efficiency.
Ontario’s corporate tax base parallels the federal tax system and, as such, federal tax
expenditures can have a significant impact on Ontario’s revenue and support to business.
With a few exceptions, tax expenditures should be restricted to promote business activity that
generates taxable income. For example, the deduction of expenditures related to investment
in, or operations of, a foreign business should not be deductible against Canadian income
where the foreign income is exempt or not otherwise taxed in Canada. Also, tax expenditures
that provide personal benefits must be captured in the income of the recipient or denied as
a deduction. Currently, businesses may deduct 50 per cent of expenditures for meals and
entertainment. However, the individuals who benefit from these expenditures do not have to
include those benefits when calculating their own income for tax purposes. A practical way to
correct the failure to include the personal benefit in the income of the recipient would be to
deny businesses the deduction for meals and entertainment.
Recommendation 11-10: Work with the federal government to ensure that tax expenditures
outside of Ontario’s control maximize value for money and directly support economic growth
in Ontario.

316
The horse racing industry is another area where subsidies to racetracks and horse people
require a review and adjustment to realign with present-day economic and fiscal realities.
Ontario has more racetracks than any other jurisdiction in the U.S. or Canada. In addition to
revenues from wagering, since the late 1990s the industry has benefited from a provincial tax
expenditure (a reduction to the provincial pari-mutuel tax) and a percentage of the Ontario
Lottery and Gaming Corporation’s gross slot revenues that together are worth an estimated
$400 million in 2011–12. Over the past 12 years, approximately $4 billion has flowed through
17 racetracks to support purses, racetrack capital improvement and operating costs. Ontario’s
support is 10 times that of British Columbia, which has six racetracks, and 17 times that of
Alberta, with five racetracks. Ontario’s approach is unsustainable and it is time for the industry
to rationalize its presence in the gaming marketplace. For more on the horse racing and
breeding industry, please see Chapter 17, Government Business Enterprises.
Recommendation 11-11: Review and rationalize the current provincial financial support
provided to the horse racing industry so that the industry is more appropriately sustained
by the wagering revenues it generates rather than through subsidies or their preferential
treatments.
Ontario’s mining tax system, including CIT expenditures such as the Ontario resources tax
credit and mining tax expenditures, was designed to encourage investment when corporate
tax rates were high. The tax regime for this sector is also designed to ensure that the province
is appropriately compensated for extraction of its non-renewable resources. With the
significant improvement in Ontario’s international tax competitiveness, the cost of doing
business in Ontario is more favourable, encouraging businesses to invest and extract the
province’s minerals. As such, Ontario needs to review the impact of tax expenditures for the
mining sector and, more broadly, on its resource pricing.
Recommendation 11-12: Eliminate the Ontario resource tax credit and review the mining tax
system to ensure that the province is supporting the exploration and production of minerals in
Ontario while receiving a fair return on its natural resources.
Integrate Delivery
Changes in how ministries receive program funding must be accompanied by changes in the
way ministries deliver programs to make them more accessible and user-friendly.

Chapter 11: Business Support
317
For example, a more user-friendly “one-window” portal would make it easier for firms,
communities and individuals to find and use information about all provincial economic
development programs, policies and services. It would feature standardized online
applications and a system for tracking a proposal as it goes through the approvals process.
Subject to confidentiality requirements, it could also allow for proponents to submit financial
statements and other information such as meeting project milestones. It should include a
help-desk function for anyone having difficulties using the system, although it is important that
an additional layer of bureaucracy not be created and that clients can be linked seamlessly
to specialized expertise in ministries, agencies and regional centres. More efficient,
streamlined and effective program delivery using the latest information technology will lead
to less duplication of effort, resulting in savings in time and money for both business clients
and the government. Local communities will also be better able to align their economic
development plans with provincial objectives and facilitate more collaborative,
community-based economic strategies.
Recommendation 11-13: Establish a more user-friendly, “one-window” portal where clients
can have seamless access to information about all business support and other economic
development programs provided by all ministries, and be able to make online transactions
such as applications, approvals, and financial and other types of reports.
In addition, a single, shared back-office would support all ministries in the delivery of their
business assistance programs to eliminate duplicated functions. The single back-office could
also include enhanced automation to help track spending and outcomes. Ministries would
retain lead responsibility for current clients, but centralize their contract administration and
payment processing in one branch. Provisions should be made to allow interfacing with federal
and municipal governments as needed. The net effect should be a faster, more nimble public
service that is better able to deliver business assistance programs for the needs of today’s
business community. A step towards this approach is the recent merging of two ministries into
one Ministry of Economic Development and Innovation, which should achieve efficiencies by
consolidating the processing of transfer payments.
Another vital element to this approach is ensuring that regulatory administrations and
processes are also supportive to businesses.
Recommendation 11-14: Establish a single, shared “back-office” support for all ministries in
the delivery of their business support programs, including contract administration, payment
processing, expenditure tracking, client contacts, project milestones and outcomes.

318
Strengthen Accountability and Transparency
The final, yet very important, component of our proposed framework for business support
programs is improved accountability and transparency. In an era of fiscal restraint, the use of
public funds must be closely monitored and studied to ensure that they are being spent in the
best way possible.
Business support programs must be subject to rigorous evaluation that links public
expenditures to new, incremental activities by business. The impact of these expenditures on
the economy as a whole must also be evaluated. We acknowledge, however, that measuring
short-term and long-term effects of a particular program is challenging.
Recommendation 11-15: Establish a four-year sunset rule for all future business support
programs. Extend only programs that have demonstrated their merit through a mandatory,
comprehensive evaluation in the third year of operation — and end all others.
The final accountability component should be greater transparency. The Commission was
surprised to find that something as simple as an inventory of direct business support programs
and spending across ministries seemed to be difficult for the Ontario Public Service to
produce. Existing inventories were either limited to certain sectors or incomplete; some even
stated that spending was “unknown.” Such weak transparency impedes accountability.
In the current system of public accounts, information is available on which companies have
received government funding during a fiscal year. However, it is difficult to determine whether
this funding was from a business support program or for other types of government activities.
A clearer linkage between which program is supporting what company is preferable, so that
the public can decide if their funds are being used appropriately.
Recommendation 11-16: Publish an annual list of direct business support programs, tax
expenditures and related annual spending. In addition, a list of companies receiving direct
financial support from the government, including total amount received, should be published.
We believe that the new framework for business support outlined above will have positive and
demonstrable impacts for Ontario. The changes that are identified represent a significant but
necessary shift in how government tries to help business. By following an objective of
improving productivity, the outcome will hopefully be a better-focused, more flexible and more
cost-effective use of public resources to achieve longer-term economic objectives. The impact
of these changes should result in stronger, more productive firms able to produce higher-value
products and services, while creating more higher-paying, skilled jobs for Ontarians.

Chapter 11: Business Support
319
Appendix 11.1 List of Business Support Expenditures1 Program 2006–07 Expenditures ($M) 2010–11 Expenditures ($M) Ministry of Aboriginal Affairs
Aboriginal Community Capital Grants Program 3.4 3.6 New Relationship Fund — Economic Development Funding 0.0 14.0
Ministry of Agriculture, Food and Rural Affairs Ontario Ethanol Growth Fund 2.5 72.0 Rural Economic Development Program 11.3 40.1 Business Risk Management (also known as Risk Management Program) 370.0 145.2 Growing Forward 0.0 32.4 Rural Summer Jobs 2.7 4.5 Rural Connections 0.0 4.5
Ministry of Citizenship and Immigration Provincial Nominee Program 0.0 1.2
Ministry of Economic Development and Innovation2 Communities in Transition Initiative 1.6 1.0 Ontario Automotive Investment Strategy Fund (OAIS) 59.7 8.8 Eastern Ontario Development Fund (EODF) 0.0 11.8 Advanced Manufacturing Investment Strategy (AMIS) 2.0 7.1 Strategic Jobs and Investment Fund (SJIF) 0.0 3.0 Next Generation of Jobs Fund — Jobs and Investment Program N/A3 101.4 VQA Support Program 1.0 6.0 Ontario Wine Strategy Fund 2.0 3.0 Ontario Craft Brewers Opportunity Fund 0.0 2.0 Ontario Small Brewers Strategy Fund 1.0 0.9 Grants in Support of Business Development 0.3 5.2 Ontario Life Sciences Commercialization Strategy4 0.0 6.0 Next Generation of Jobs Fund — Biopharmaceutical Investment Program (BIP) (incl. interest incentives)4
0.0 6.8
Ontario Emerging Technologies Fund4 0.0 23.1 Innovation Demonstration Fund (incl. interest incentives)4 0.6 15.6 Grants in Support of Innovation and Commercialization4 0.4 4.9 Business Ecosystem Support Fund4 0.0 11.8 Commercialization and Innovation Network Support4 60.3 75.6 Water Technology Acceleration Project4 0.0 0.05
Ministry of Energy Ontario Clean Energy Benefit to Business6 0.0 299.8
Ministry of Finance Grants in Support of Economic and Financial Services Policy Research 0.4 11.7
Ministry of Natural Resources Forest Sector Prosperity Fund 2.7 17.4 Forest Access Roads 75.0 75.0 Ontario Wood Promotion Program 0.9 1.1
Ministry of Northern Development and Mines7 Northern Ontario Heritage Fund 60.0 90.0 Export Assistance N/A 2.0 Northern Communities Investment Readiness Initiative 0.4 0.5 Northern Industrial Electricity Rate Program N/A 104.5 Forestry Loan/Guarantee Program (Bad Debt Expense) 0.4 7.3
Ministry of Tourism, Culture and Sport8 Entertainment and Creative Cluster Partnership Fund 0.0 3.0 Interactive Digital Media Fund 0.0 2.0 Tourism Development Fund 1.6 1.4 International Fund 0.0 1.3 Other Ontario Media Development Corporation Funding 14.3 19.8 Grants in Support of Tourism Regions 0.0 65.0
Total 674.5 1,313.3
Notes on following page.

320
1 This list is not comprehensive. It reflects information in Ontario’s 2010–11 Public Accounts and ministry responsibilities at the time of printing, but the Commission is aware of other programs for which information is not available. Where available, the former names of ministries are provided.
2 Formerly two separate ministries: Ministry of Economic Development and Trade (MEDT) and Ministry of Research and Innovation (MRI).
3 N/A indicates data were not available. This means the program name was not listed in the Public Accounts, either because the program did not exist at the time or the program name has changed.
4 Indicates programs formerly with MRI prior to the amalgamation of MEDT and MRI. 5 Program to be funded in 2011–12, budget to be determined. 6 The Ontario Clean Energy Benefit helps over four million residential consumers, and more than 400,000 small businesses, farms and
other consumers by providing eligible consumers with a benefit equal to 10 per cent of the total cost of electricity on their bills, including tax, effective January 1, 2011.
7 Formerly the Ministry of Northern Development, Mines and Forestry. Responsibility for forestry was transferred to the Ministry of Natural Resources.
8 Formerly the Ministry of Tourism and Culture (MTC). MTC took responsibility for the “Sport” component from the Ministry of Health Promotion and Sport (MHPS) when MHPS was merged with the Ministry of Health and Long-Term Care.

Chapter 12: Infrastructure, Real Estate and Electricity
321
Chapter 12: Infrastructure, Real Estate and Electricity
Infrastructure
From a fiscal perspective, public infrastructure, in the form of roads, subways or buildings,
is a double-edged sword for the province. Built infrastructure depreciates over time,
representing an inevitable but predictable draw on the government’s fiscal position. Yet done
properly, these assets improve the productivity of a jurisdiction and either create returns
elsewhere (through greater tax revenue) or offset future opportunity costs (such as traffic
congestion). A study by the Conference Board of Canada suggests that every dollar invested
recently in Ontario’s public infrastructure generated $1.11 in economic output.1 As public
infrastructure investment affects both sides of the ledger, Ontario must seek to maximize the
value returned to the province through its public infrastructure. Effective procurement
practices, such as the use of Infrastructure Ontario’s expertise, should be central to the
government’s infrastructure plans.
Public Infrastructure
Public infrastructure underpins all types of public services and programs. From complex
health procedures to simple transactions such as renewing a driver’s licence or health card,
infrastructure is pervasive in Ontario. Leveraged properly, public infrastructure is also a key
enabler of economic growth. Public roads and bridges allow goods and services to flow more
freely, public schools ensure that generations of Ontarians are highly educated, and public
spaces allow citizens to share innovative thoughts, ideas and talents. But public infrastructure
is also costly — since 2003, about $62 billion has been spent and $12.8 billion was planned
for public infrastructure in the most recent fiscal year.2
Ontario’s fiscal context will complicate matters further. Funding additional infrastructure
investments in the years ahead will be more difficult than it is now. Later in the chapter,
we recommend that the province begin a civilized dialogue on alternative methods to fund
further transportation needs. More can be done in other areas where public funds are spent
on infrastructure.
1 P. Antunes, K. Beckman and J. Johnson, “The Economic Impact of Public Infrastructure in Ontario,” 2010, Conference Board of Canada. 2 Ontario Ministry of Infrastructure, “Building Together: Jobs and Prosperity for Ontarians,” 2011,
downloaded from http://moi.gov.on.ca/pdf/en/BuildingTogether_En.pdf.
322
For example, the Long-Term Infrastructure Plan (LTIP) commits to requiring universities,
municipalities, social service agencies and other transfer payment partners receiving
significant provincial capital funding to publish a detailed asset management plan. While this is
laudable, revitalizing Ontario’s public infrastructure will require more robust measures to keep
these assets in a state of good repair.
Recommendation 12-1: Place more emphasis on achieving greater value from existing
assets in asset management plan reporting requirements than is currently proposed in the
Long-Term Infrastructure Plan for certain organizations (e.g., universities, municipalities, etc.).
There are also cases where the fees charged for services provided via publicly owned
infrastructure do not fully cover costs. Where discrepancies exist, the gap falls to taxpayers.
A prime example is in municipal water and wastewater services, where average capital
investment chronically lags what is actually needed by $1.5 billion per year.3 In these two
sectors, where the equivalent of about half of the $72 billion in municipally owned assets used
to deliver these services needs renewal over the period from 2005 to 2019, a funding gap of
that magnitude poses serious fiscal risks.4 While a degree of “catching up” has occurred,
stable investment over the long term is more efficient and results in greater intergenerational
fairness;5 Alternative Financing and Procurement (AFP) could be a useful tool in this regard.
Moreover, full-cost pricing in water and wastewater services has the added benefit of
encouraging conservation — an area in which Canada desperately lags the world’s best.6 The
electricity sector already operates on a cost recovery model; so too should water and
wastewater services.
Recommendation 12-2: Implement full cost pricing for water and wastewater services.
Finally, specific sectors will need to fully consider their approach to infrastructure investments.
As outlined in Chapter 7, Post-Secondary Education, universities and colleges should find
ways to optimize the use of existing space before new capital projects are approved.
Chapter 5, Health, notes that any marginal operating costs resulting from current infrastructure
expansions and costs from future projects must fit within the health sector’s fiscal constraint
proposed in this report. And Chapter 6, Elementary and Secondary Education, and
Chapter 14, Justice Sector, also have infrastructure-related recommendations.
3 Financial Information Return, 2002–2006, Ontario Ministry of Municipal Affairs and Housing and Ontario Ministry of Infrastructure. 4 Water Strategy Expert Panel, “Watertight: The Case for Change in Ontario’s Water and Wastewater Sector,” 2005,
downloaded from http://www.moi.gov.on.ca/pdf/en/Watertight-panel_report_EN.pdf. 5 V. Gill, “Tapped Out: Efficiency Options for Closing the Municipal Infrastructure Gap,” 2011, Conference Board of Canada. 6 Ibid.

Chapter 12: Infrastructure, Real Estate and Electricity
323
Transportation
The Greater Toronto and Hamilton Area (GTHA) is one of the fastest-growing regions in
North America. By 2031, it is estimated that the GTHA will grow from over six million to nearly
nine million people, the equivalent of moving the population of Greater Montreal into
the GTHA.7
A population influx of that magnitude will place stress on public infrastructure, much of which
is nearing full capacity. Gridlock on the GTHA’s roads and highways is already problematic.
At present, the average Toronto round-trip commute is estimated to be 82 minutes, the longest
for any North American city. It is estimated that this congestion costs $6 billion annually in lost
productivity. If the population of the GTHA increases to the level expected, within 25 years that
cost would rise to $15 billion and the average round-trip commute time would reach a
staggering 109 minutes.
Public transit must surely be part of the solution and we recognize that Metrolinx released
a 25-year plan in 2008 entitled “The Big Move.” But with an overall capital cost estimate of
$50 billion, of which only $11.5 billion has received a funding commitment,8 seeing this plan
through to fruition while maintaining existing transportation infrastructure poses a serious
financial hurdle to the province. Overcoming this massive funding gap is the elephant in the
transit room. With few exceptions, public discourse on the actions needed to meet this
challenge — or the consequences of not acting — has simply not materialized with any degree
of provincewide prominence.
It would be completely disingenuous to suggest that plucking the low-hanging fruit is sufficient
to fix the problem — it is not. However, we must again emphasize that our mandate does not
allow us to recommend tax increases. This limitation prevents us from undertaking a more
complete review of the means to fund public transit investment over the next generation.
Accordingly, we turn our attention to reforms on the expenditure side of the ledger.
7 Material in this and the following paragraphs is drawn from Metrolinx, “The Big Move: Transforming Transportation in the Greater Toronto
and Hamilton Area,” November 2008, downloaded from http://www.metrolinx.com/thebigmove/Docs/big_move/TheBigMove_020109.pdf. 8 As noted in “The Big Move,” p. 70, the province has committed $11.5 billion to support Metrolinx’s plan through the province’s
MoveOntario 2020 initiative.

324
Operating transportation services more efficiently
The public transit network in the GTHA is provided predominantly by a hodgepodge of
municipal operators, complemented by regional services offered by Metrolinx/GO Transit and
private intercity transportation. Recent public discussion and study on mass transit have
naturally tended towards service levels and quality; little has been done to study the
effectiveness of the current structure of transit offerings. Are the roles of the service providers
optimally defined? Is there unnecessary duplication or overlap? Are operations sufficiently
co-ordinated and integrated? Answers to these questions and others could illuminate
opportunities to deliver transit services more efficiently through means such as rationalizing
and better co-ordinating routes, services and fares; pursuing additional common
procurements; and exploring other measures to reduce overlap and duplication.
The Ontario Northland Transportation Commission (ONTC), which currently offers subsidized
transportation services in northern Ontario,9 is different. Studies and reviews conducted over
the past several years in Ontario and other provinces illustrate how its services could be
provided more effectively and efficiently through targeted private-sector involvement.
These steps should be undertaken.
Recommendation 12-3: Where gaps in information and evidence exist, review the roles and
operations of public and private mass transit service providers in the Greater Toronto and
Hamilton Area and services provided by Ontario Northland Transportation Commission in the
north to find efficiencies in those regions’ transportation networks. Act on that evidence to
improve the efficiency of those services.
GO Transit Parking
At present, GO Transit does not charge patrons for the use of its parking facilities. While this
may seem trivial, the cost of providing parking spaces is considerable. In February 2009,
the provincial and federal governments announced a joint contribution of $500 million in
funding to GO to support major infrastructure projects, including new parking structures
throughout its network.10 If parking is not priced and charged for, it will be overused; this
effectively penalizes those who get to a GO station by means other than a personal vehicle.
Moreover, the Toronto Transit Commission (TTC) already demonstrated that providing free
parking for monthly pass holders is not sustainable.
Recommendation 12-4: Following the precedent set by the Toronto Transit Commission,
begin charging for parking at GO Transit parking lots.
9 Rail freight, passenger services (bus and rail), telecommunications and railcar refurbishment. 10 “Prime Minister Harper and Premier McGuinty Announce Major Improvements to GO Transit System,” Feb. 17, 2009, downloaded from
http://www.premier.gov.on.ca/news/event.php?ItemID=3325&Lang=EN.

Chapter 12: Infrastructure, Real Estate and Electricity
325
Unfortunately, initiatives on this scale are still not significant enough to overcome the problem
at hand. Honest discussions between citizens, government and key stakeholders must begin
at once on alternative revenue measures that could address a much more significant portion of
the gap in funding needed to implement an ambitious transit plan.
The first is to redouble efforts to negotiate with the federal government on developing a
national transit strategy. Despite Canada’s enormous geographical size, it is a largely urban
nation. Eighty per cent of Canadians live in urban centres, making Canada one of the world’s
most urbanized countries. Traffic congestion is a systemic issue from coast to coast, justifying
a national approach. Indeed, the federal government is affected by gridlock as much as any
province through lost productivity and tax revenue; in 2006, Transport Canada noted that
congestion poses a national challenge in terms of its costs in lost time, increased fuel
consumption, and increased greenhouse-gas emissions.11 And despite Canada’s urban
nature, the Canadian Chamber of Commerce has noted that Canada is the sole member
nation of the Organization for Economic Co-operation and Development (OECD) that lacks a
national transit strategy.12
Recommendation 12-5: Pursue a national transit strategy with the federal government,
other provinces and municipalities.
Federal funding is just one part of the equation — ultimately, Ontario will determine how best
to fund its future needs for transportation infrastructure. While general tax revenues will also
be a certain source of funds in the foreseeable future, jurisdictions elsewhere are looking at
alternatives: congestion charges, comprehensive road tolling, high-occupancy/toll (HOT)
lanes, regional gas taxes and parking surcharges. Each produces various incentives that
require thoughtful analysis and consideration. However, without clear input from citizens,
striking the right balance of these measures will be near impossible.
Recommendation 12-6: Engage citizens in an open, public dialogue on how best to create
new revenue sources for future transportation capital needs.
11 Transport Canada — Environmental Affairs, “The Cost of Urban Congestion in Canada,” Mar. 22, 2006, downloaded from
http://www.gatewaycouncil.ca/downloads2/Cost_of_Congestion_TC.pdf. 12 Canadian Chamber of Commerce, “Strengthening Canada’s Urban Public Transit System,” downloaded from
http://www.chamber.ca/images/uploads/Resolutions/2009/T-Strengthening_Canada.pdf.
326
Real Estate
The government of Ontario is the largest owner of realty in the province. This portfolio is a
collection of valuable assets, worth an estimated $14 billion including $2 billion for the land
alone.13 The province’s real estate holdings include office buildings, jails, courts, hospitals
and more. These buildings are an important tool in the provision of services to Ontarians.
For all of its value, the real estate portfolio also poses challenges. Most buildings are old,
with the average age being 46. Consequently, buildings are expensive to maintain properly.
In 2010–11, the province spent $842 million to operate and maintain those assets.
Reductions in maintenance only offset the inevitable expense of upkeep and can lead to more
costly problems down the road; this is true even for buildings that are underused, vacant or
which the province has no plans to use in the future. Real estate can therefore represent a
costly proposition. Practices that maximize the value generated by these assets are
therefore needed.
Rational incentives must be put in place to encourage more efficient use of current space.
We learned that ministries are charged below market rates for use of government buildings,
suggesting that more office space is being used than should be if ministry budgets were forced
to consider its full cost.
Recommendation 12-7: Subject ministries to market prices for the use of government
real estate.
There are also buildings owned by the Ministry of Infrastructure but managed and used by a
second ministry to deliver a program or service — jails and courthouses being prime
examples. This has created unnecessary duplication across ministries in administrating
payments for accommodation and capital repairs. Such an arrangement also inhibits the
government from taking a more integrated approach to rationalize the use of real estate.14
Recommendation 12-8: Consolidate the real estate and accommodation function now resting
in line ministries and locate it centrally at the Ministry of Infrastructure.
13 Information in this chapter has been provided by the Ontario Ministry of Infrastructure unless otherwise cited. 14 For more on justice sector-related buildings, see Chapter 14, Justice Sector.

Chapter 12: Infrastructure, Real Estate and Electricity
327
Together, these recommendations must work towards reducing the government’s realty
footprint. In doing so, Ontario will increase its potential to monetize its portfolio of real estate
assets — a potential that must be leveraged. While full ownership of properties may be
desirable in many circumstances, it should not be the only approach used. Indeed, an array of
innovative alternatives could generate further revenue streams if used appropriately, such as
arranging sale-leaseback agreements, leveraging air rights, or undertaking land swaps or land
asset-based vehicles.
Recommendation 12-9: Develop a strategic plan for the province’s real estate portfolio that
adopts market principles for the acquisition, disposition, use and investment in real estate.
Electricity
The performance of Ontario’s electricity sector has considerable implications for the province.
First, there are direct connections between the electricity sector and the province’s fiscal plan
through the province’s ownership of Ontario Power Generation (OPG) and Hydro One, and
spending on programs like the Ontario Clean Energy Benefit (OCEB). In addition, electricity
prices influence regional competitiveness in sectors such as manufacturing and forestry,
when energy represents a significant input. Policies such as the feed-in tariff (FIT) for
renewable resources are designed to attract domestic and global companies to invest in
Ontario and create jobs for Ontarians. Finally, in addition to these economic impacts, policies
related to a changing electricity supply mix have direct environmental implications.
Until Mar. 31, 1999, the province’s primary electricity utility was Ontario Hydro, a large,
vertically integrated, government-owned electric utility that provided most generation and
transmission in the province, and distribution to about a quarter of Ontario customers,
primarily in rural Ontario. After significant criticism of Ontario Hydro’s performance for cost
overruns and a rapid increase in rates in the early 1990s, the government passed the Energy
Competition Act, dividing Ontario Hydro into several companies including Hydro One,
OPG, Independent Electricity System Operator (IESO) and Ontario Electricity Financial
Corporation (OEFC).
Following the restructuring of Ontario Hydro, there was a plan to introduce a competitive
market for the electricity commodity (generation), in part to create an incentive for
private-sector investment in electricity infrastructure. However, once the competitive electricity
market opened in May 2002, prices were high and volatile during the summer and early fall
of 2002. In response to consumer concerns, the government then froze electricity commodity
rates for residential, low-volume and other designated consumers. The price freeze was
replaced as of Apr. 1, 2004, by a one-year interim pricing plan, until the government put in
place a Regulated Price Plan for residential, low-volume and other designated consumers.

328
Over the last several years, Ontario’s electricity sector has seen significant private-sector
investment driven primarily by long-term Ontario Power Authority (OPA) contracts.
These procurement contracts, initially required for system reliability, were implemented
because the prices in the wholesale electricity market were too low to cover costs for private
generators. In addition, policy objectives such as replacing coal-fired generation with cleaner
sources such as renewables, domestic content requirements under the FIT program,
and increased conservation efforts, reflect the government’s priorities related to job creation
and environmental benefits. These policy goals, combined with costs to replace and maintain
aging infrastructure, have resulted in higher electricity rates for consumers.
The current commodity market reflects a partially regulated structure in which the Ontario
Energy Board (OEB) regulates the rates for OPG-operated nuclear and large hydroelectric
generation. The remainder of the market consists of participants that have long-term electricity
contracts with entities like the OPA, and other OPG generation that receives market prices.
To mitigate price volatility on consumer bills but still recover the true cost of power, the OEB
pre-sets electricity prices for residential and small business consumers once every six months.
Transmission and distribution rates are also regulated by the OEB.
Fiscal Impacts of the Electricity Sector
There are a number of key points of interaction between Ontario’s fiscal position and the
electricity sector. We turn our attention first to direct program and tax expenditures related
to the electricity sector. We exclude the performance of the provincially owned electricity
corporations, as their impact on the fiscal plan is dealt with specifically in Chapter 17,
Government Business Enterprises. We then discuss the fiscal implications of managing the
former Ontario Hydro’s debts and liabilities. Finally, the inextricable link between electricity
prices and economic performance requires us to review possible avenues to reduce long-term
costs to electricity consumers. We believe evidence-based policies that drive efficiencies and
improve effectiveness would prove beneficial over time.
I. Direct Program and Tax Expenditures
Tax revenues support a number of direct program expenditures aimed at subsidizing
electricity costs. The most significant of these is the OCEB, which provides a 10 per cent
rebate on electricity bills for residential, farm and small business customers. Implemented
on Jan. 1, 2011, the OCEB is projected to cost $1.1 billion in 2011–12. The government’s
stated commitment is to leave it in place for five years. Although the government itself
acknowledges in its Long-Term Energy Plan (LTEP) that electricity prices will continue to rise,
the Commission believes the OCEB should be reconsidered to reduce its long-term impact on
the province’s fiscal position.

Chapter 12: Infrastructure, Real Estate and Electricity
329
While we understand that the government initiated the OCEB to help with the transition to
higher prices associated with the shift to cleaner energy supply, the program distorts true cost
of electricity and discourages conservation. In addition, we foresee that the sudden end to
such a generous incentive will be difficult if concluded as planned on Dec. 31, 2015, as it will
create a considerable price shock to ratepayers. We are wary of the possibility that the OCEB
would remain on the provincial treasury and thus risk Ontario’s ability to return to a balanced
budget in 2017–18. This is further complicated by the fact that the OEFC is not guaranteeing
that the Debt Retirement Charge (DRC) will be removed in lock-step with the OCEB,
suggesting this may not happen until as far out as 2018.15 Any soft landing provided by
removing the cost of the DRC simultaneously with the expiry of the OCEB would evaporate if
such a delay were to occur.
Finally, the opportunity costs associated with the OCEB are substantial. The Commission
strongly believes there are more effective uses for the over $1 billion per year spent on this
initiative. The Commission would be satisfied with a gradual phase-out of the OCEB. However,
a more aggressive timeline or an immediate cease to the program would be welcomed.
Recommendation 12-10: Eliminate the Ontario Clean Energy Benefit as quickly as possible.
Although the OCEB is the largest electricity rate subsidy in Ontario, it is not the only one.
A number of programs target specific customer types (e.g., small or large volume) or certain
areas of the province. Each of these initiatives may offer relief to consumers in terms of energy
costs (electricity, gas, oil, diesel, etc.), but over time could discourage conservation, leading to
higher costs, and should periodically be revisited to ensure they are meeting policy goals and
represent value for money.
Recommendation 12-11: Review all other energy subsidy programs against measures of
value for money and achievement of specific policy goals.
15 Ontario Electricity Financial Corporation, 2011 Annual Report, p. 2.

330
Overview of Provincial Tax-Based Energy Subsidies • Ontario Energy and Property Tax Credit (OEPTC): This income-tested program allows eligible seniors, single people
and families to receive an energy tax credit of up to $200 annually. People who live on a reserve and pay home energy costs or who live in a long-term care facility are eligible to claim an inflation-adjusted energy amount.
• Ontario Emergency Energy Fund: The Ministry of Community and Social Services runs the Emergency Energy Fund, which helps low-income Ontarians who are facing energy-related emergencies, such as utility arrears, security deposits and reconnection costs for electricity, natural gas and other forms of energy.
• Northern Ontario Energy Credit: This is an ongoing program to provide families living in northern Ontario with up to $204 in 2011 to help with their home energy costs, which are often higher in the north due to more severe winters. Single people can receive up to $132 in 2011 to defray costs through this program. These amounts depend on several factors such as age, family income and marital status, and are adjusted for inflation each subsequent year.
• Northern Industrial Electricity Rate Program: This three-year program (averaging $150 million annually) is directed at large industrials in northern Ontario consuming more than 50,000 megawatt-hours of electricity a year. The program offers a rebate of two cents per kilowatt hour when qualifying industrials commit to the preparation and implementation of comprehensive energy management plans. Up to Mar. 31, 2011, rebates totalled $105 million.
II. Electricity Stranded Debt
During the restructuring of the electricity system in 1999, only $17.2 billion of the $38.1 billion
of debt that had been accrued by Ontario Hydro was deemed to be supported by the value of
the assets of its successor companies. This resulted in $20.9 billion of stranded debt.
The OEFC was set up as the legal continuance of Ontario Hydro to take on and manage
this debt.
The Electricity Act provided for dedicated revenue streams to retire the stranded debt through
payments in lieu of taxes (PILs) to the OEFC from OPG, Hydro One and Municipal Electricity
Utilities (MEUs). The government also committed to dedicate to OEFC the portion of the
cumulative annual combined profits of OPG and Hydro One above the province’s financing
costs for these companies. As of Apr. 1, 1999, these revenue streams were estimated to have
a value of $13.1 billion. The difference of $7.8 billion was the initially estimated “residual
stranded debt,” and the Electricity Act provides for consumers to pay a DRC until residual
stranded debt is retired.
The fiscal impact of the OEFC revenue streams is significant as the OEFC is consolidated on
a line-by-line basis on the province’s financial statements. All OEFC revenues and expenses,
including interest payments, directly affect the province’s deficit/surplus position, and the
OEFC’s debt is included on the province’s balance sheet. This further underlines the
importance of the financial performance of OPG and Hydro One as their PILs and some part of
their combined net income are used to service the OEFC debt. Any PILs paid by MEUs also
represent a portion of OEFC revenues. The PILs include amounts equal to federal and
provincial corporate income taxes, which are fully used to service the stranded debt.

Chapter 12: Infrastructure, Real Estate and Electricity
331
As the OEFC’s revenue streams directly impact the province’s fiscal plan, it is imperative for
the province to ensure that OPG and Hydro One are run efficiently in order to service and
retire the debt and liabilities of the old Ontario Hydro.
III. Options to Reduce Long-Term Electricity Costs
While the Commission’s mandate is directly linked to Ontario’s fiscal outlook, we feel that the
report’s principles as outlined in Chapter 3, Our Mandate and Approach, are transferable to
the electricity rate base as well. This is particularly significant in the context of the province’s
LTEP that projects electricity prices to increase 46 per cent over the five-year period from
2010 to 2015, prior to the application of the OCEB. There are a number of potentially large
opportunities to source efficiencies in the sector and slow down electricity rate increases.
However, the Commission also recognizes the amount of change that has occurred in the
sector since Ontario Hydro was broken into its constituent parts in 1999. A degree of normalcy
may very well be helpful for the sector to take stock and reflect on the status quo.
Consequently, the Commission has a series of recommendations that are meant to balance
the need for stability in the sector with the need to curb costs.
Recommendation 12-12: Produce an Integrated Power System Plan (IPSP) built on the
foundation of the province’s Long-Term Energy Plan.
The OPA initially filed an application for approval of the original IPSP in 2007 with the OEB,
but this process was never completed. An approved IPSP would provide producers,
consumers, utilities and other sector participants with a detailed, 20-year blueprint for the
electricity sector.
Recommendation 12-13: Consolidate Ontario’s 80 local distribution companies (LDCs) along
regional lines to create economies of scale.
Reducing the $1.35 billion spent on operations, maintenance and administrative costs for
Ontario’s LDCs16 would result in direct savings on the delivery portion of the electricity bill.
Flexibility regarding LDC sector reform could be greatly enhanced through a co-operative
federal-provincial tax arrangement that returns to the province any federal corporate taxes
paid by newly privatized electricity utilities. This would allow the province to remove the
33 per cent transfer tax on such divestitures currently in place that goes towards stranded
debt. It would also help compensate for the future loss of the federal portion of PILs when a
publicly owned LDC is sold to the private sector. There is precedent for such co-operation as
illustrated by the previous federal Public Utilities Income Tax Transfer Act.
16 Calculation based on figures from Ontario Energy Board, 2010 Yearbook of Electricity Distributors, p. 7.
332
Larger regional entities might allow for economies of scope as well as scale, allowing greater
participation in planning, design of conservation programs and expanding responsibilities to
deliver other resources such as water.
Recommendation 12-14: As part of the review of the feed-in tariff (FIT) program, take steps
to mitigate its impact on electricity prices by:
Lowering the initial prices offered in the FIT contract and introducing degression rates
that reduce the tariff over time to encourage innovation and discourage any reliance on
public subsidies17; and
Making better use of “off-ramps” built into existing contracts.
Recommendation 12-15: Procure larger generation facilities through a request for
proposal (RFP) process.
Recommendation 12-16: Review the roles of various electricity sector agencies to identify
areas for economies in administration. This could include investigating the potential to
co-ordinate back-office functions.
Recommendation 12-17: Make wholesale electricity prices inclusive of transmission costs
such as capacity limitations and congestion as part of a comprehensive restructuring of the
wholesale electricity market.
Consumers located nearer to generation stations should be able to benefit from lower
electricity prices. Sending more efficient price signals to the marketplace should encourage
more optimal levels of investment in electricity infrastructure — generation, transmission
and distribution.
Recommendation 12-18: Make regulated prices more reflective of wholesale prices by
increasing the on-peak to off-peak price ratio of time-of-use pricing and by making critical peak
pricing available on an opt-in basis.
17 For example, Germany’s equivalent tariff program builds in an annual nine per cent reduction in rates paid to solar photovoltaic
generators. See W.E. Mabee, J. Mannion and Tom Carpenter, “Comparing the Feed-in Tariff Incentives for Renewable Electricity in Ontario and Germany,” Energy Policy 40 (2011), pp. 480–89.

Chapter 12: Infrastructure, Real Estate and Electricity
333
Recommendation 12-19: Co-ordinate a comprehensive, proactive electricity education
strategy across sector participants that at a minimum covers:
Ontario’s electricity resources including nuclear, hydroelectric, thermal and renewable
generation;
The role and value of electricity import and export markets;
Roles and responsibilities of the various entities operating in the electricity sector;
The evolving role of the electricity ratepayer in the smart grid paradigm; and
Electricity prices — what drives them, how they are communicated and how they are best
responded to.
Recommendation 12-20: Strategically promote Ontario’s strengths in the energy sector,
capitalizing on export opportunities for domestic goods and services.

334

Chapter 13: Environment and Natural Resources
335
Chapter 13: Environment and Natural Resources
Need for Transformation
Most responsibility for protecting the province’s environmental and natural heritage falls
to two ministries: the Ministry of the Environment (MOE) and Ministry of Natural
Resources (MNR).
As recently noted by the Environmental Commissioner of Ontario, the core business of
these two ministries has become much more complex since their inception. And though they
must deal with expanding responsibilities that address entirely new environmental issues,
their overall capacity — financial resources, staffing levels and in-house expertise — has not
kept pace.1
A new paradigm for environmental and natural resource programs and services is desperately
needed, shaped by factors of both supply and demand. On the supply side, the fiscal restraint
we recommend in this report will further limit the funding available to meet these ministries’
legislated and policy-driven obligations.
At the same time, demand for continued oversight of environmental approvals, compliance
and natural resource stewardship is set to rise. For example, development of the Ring of Fire
(an area of northern Ontario with potentially large deposits of valuable minerals such as
chromite, nickel, copper and platinum) will put added stress on the approval and compliance
resources of several provincial ministries. It will also demand greater collaboration among
provincial ministries and other levels of government. In addition, increased demand for
renewable energy will place further pressure on the province’s approvals and compliance
processes, such as the Renewable Energy Approvals (REAs) that directly support the
province’s Green Energy and Green Economy Act.
Transformational changes are essential to improve how government operates in this area.
We recommend several measures that would improve effectiveness and efficiency.
1 Environmental Commissioner of Ontario, Annual Report 2010–11, p. 81.

336
Move towards full cost recovery and user-pay models
The government’s environmental programs are not all run on a full cost recovery basis and
existing fees do not keep pace with the rising costs of program delivery. Where the opportunity
exists and where the beneficiary can be identified, the cost burden of providing these services
should be placed on the beneficiary’s shoulders rather than the public’s.
For example, the government spends about $15 million per year through multiple ministries to
manage water quantity and encourage its efficient use. In Ontario, anyone who takes more
than 50,000 litres of water per day from a lake, river, stream or groundwater source must
obtain a Permit to Take Water from MOE. A permit will not be issued if the proposed water-
taking will adversely affect existing users or the environment. The cost of the permit ranges
from $750 to $3,000, but yields too little annual revenue to offset the cost of the program.2
More costs could be recovered if the commercial and industrial water users who create the
need for water management programs pay for their use of water. The charge would also
create a financial incentive for companies to use water more efficiently.
Phase 1 of the Water Taking Charges Program, launched in April 2007, established a charge
of $3.71 for every million litres of water taken by high-consumption industrial and commercial
users. Facilities in this category (under the regulations) include beverage producers,
canning/pickling facilities and concrete manufacturers.3
Phase 2 of the program would expand the charge to include medium-consumption
(e.g., mining, construction, textile, wood production, metal production and recreational
facilities) and low-consumption (e.g., electric power generation) users.4 This could increase
annual revenue to almost $6 million, with minimal incremental costs to government,
and would recover about 40 per cent of the government’s direct costs on water quantity
management programs.
2 “Permits to Take Water,” Nov. 16, 2010, downloaded from
http://www.ene.gov.on.ca/environment/en/industry/assessment_and_approvals/water_taking/STDPROD_075554.html. 3 “Stewardship, Leadership, Accountability: Safeguarding and Sustaining Ontario’s Water Resources for Future Generations,” Proposal
Paper, Summer 2009, p. 40. 4 Ibid.

Chapter 13: Environment and Natural Resources
337
The Auditor General has been particularly critical of the fact that MOE’s approvals program
recovers less than 40 per cent of program costs.5 Further, this high program spending
(compared to amount recovered) is not reflected in the quality of the services provided.
Gaps in delivery standards in previous years resulted in a backlog of 1,700 applications,
requiring the addition of temporary resources to resolve.6 Continuing to improve service
delivery and focusing ministry efforts on the highest-risk activities should drive
modernization efforts.
An example of a modern approval is the REA, implemented in September 2009. This new
regulatory approval simplifies and consolidates the number and types of approvals needed for
renewable energy projects; it replaces environmental assessments, certificates of approval,
Permits to Take Water and municipal planning approvals.
While the REA fee schedule was developed on the basis of full cost recovery, in the case of
some smaller projects, the fee was capped at $1,000 so that project proponents would not be
overburdened. Even with these limitations, the ministry developed the program on a cost
recovery basis, and now recoups about 90 per cent of its direct operating costs through
revenue — a marked improvement over historical programs.
A program that fully recovers costs is Drive Clean, Ontario’s mandatory vehicle-emission
inspection and maintenance program. Drive Clean is funded through fees charged to motorists
for emissions tests performed at accredited, privately owned facilities. The $35 test fee for
passenger vehicles is shared between the government (one-third) and the facility providing the
emissions test (two-thirds).
Recommendation 13-1: Move towards full cost recovery and user-pay models for
environmental programs and services.
5 Ontario Auditor General, Auditor’s 2009 Report: Government User Fees, p. 154. 6 See http://news.ontario.ca/ene/en/2010/03/moving-forward-to-modernize-environmental-approvals.html (accessed Jan. 25, 2012).

338
Rationalize roles and responsibilities between levels of government
While the Canadian Constitution does not assign specific responsibilities regarding the
environment to federal and provincial governments, the mandates of several provincial
ministries include some elements of environmental protection. In addition, municipalities are
increasingly using powers provided to them by the province to set environmental rules.
The federal government has a role in fisheries and water, as well as an approval role in
projects that trigger federal environmental assessments. There is also overlap in areas that the
province already regulates, such as air quality.
Among provincial ministries, MNR regulates water, aggregates, and protects endangered
species. The Ministry of Municipal Affairs and Housing sets provincial planning requirements,
including land use planning. And the Ministry of Energy sets goals for the province’s energy
plans, including conservation and fuel standards.
Municipalities make local planning decisions and operate in areas that are currently regulated
by the province, such as local air standards and waste. This overlap could be reduced, saving
associated costs and relieving businesses of the need to apply for different approvals from
various levels of government. As well, environmental outcomes and goals for a municipality
may not be aligned with provincial views or interests.
In addition, Ontario’s 36 Conservation Authorities are involved in local protection efforts such
as flood control and watershed management, and play a role in local development decisions.
This jurisdictional crowding results in inefficient use of government resources and creates
uncertainty and confusion for industry, developers and citizens. The federal government is
moving into areas that the province already regulates (e.g., air quality and emissions), with
unclear benefits for Ontario, and is not engaging in areas where a national approach may be
more appropriate (e.g., waste reduction).
Recommendation 13-2: Rationalize roles and responsibilities for environmental protections
that are currently shared across levels of government.

Chapter 13: Environment and Natural Resources
339
Reform the approvals process
Future growth in the natural resource extraction and energy sectors will place fiscal pressure
on provincial environmental approvals and compliance resources. Indeed, a large number of
FIT contracts are expected to drive demand for MOE approvals in the coming years.
As an example of how reform could be undertaken, MOE recently launched a significant
transformation of the environmental approvals process. It is risk-based, responds to the needs
of business, takes advantage of current technology and addresses the increasing complexity
of approvals.
The previous Certificates of Approval process was relatively inflexible, requiring that all
activities go through the same approval process regardless of the activity’s complexity and risk
to the environment. This prevented MOE from focusing on potentially unique or more complex
applicants that posed more significant environmental risks.
Launched on Oct. 31, 2011, the new system has two processes: 7
1. Environmental Activity and Sector Registry (EASR) — Businesses involved in certain
routine activities that are less likely to affect the environment can self-register on the new
registry. The facility registering the activity would be required to operate according to rules
established in regulations. The EASR is currently available for heating systems, standby
power systems and automotive refinishing.
2. Environmental Compliance Approvals (ECA) — Businesses with more complex activities
apply for a single, facility-based approval that addresses all potential impacts to air, land
and water pertaining to the facility’s operation. This would result in a ministry-issued
decision based on a detailed technical review of documentation submitted by the applicant,
and public input. All activities at the facility can be covered in one application.
Despite these recent improvements to the process, more can and must be done. This need is
best illustrated by an example cited in the Environmental Commissioner of Ontario’s 2009–10
Annual Report:8
7 “Proposed Environmental Activity and Sector Registry,” EBR Registry Number: 011–1959,” Jan. 18, 2011. 8 Environmental Commissioner of Ontario, Annual Report 2009–10, p. 122.

340
In September 2009, a company submitted an environmental approval application to MNR
to construct a mining camp and an airstrip to service the Ring of Fire area.
The project involved 81 hectares of Crown land, the airstrip, helicopter pads, a fuelling
area, storage facilities and staff accommodations. Several days into the approvals process,
MNR staff flew over the site for an inspection and were surprised to discover that the
proponent had already cleared the forest, and built the mining work camp and the airstrip,
both of which appeared to be in active use. As a response, the proponent said it had
decided to begin construction because of delays in initiating the approval
application process.
To help prevent future transgressions, provincial and federal ministries conducted
information and training sessions for companies working in northern Ontario in 2010.
These sessions set out the governments’ regulatory environment, and the requirements for
authorizing mineral exploration activities — not a simple subject, given the existence of
multiple overlapping pieces of legislation.
Recommendation 13-3: Employ a risk-based approach for environmental approvals that
focuses on improving outcomes and prevention.
Streamline the Environmental Assessment (EA) process
Many projects trigger both provincial and federal EA requirements as a result of differing
legal frameworks.
The Canadian Environmental Assessment Act (CEAA) covers the conduct of federal EAs.
The federal EA process applies to projects that are planned by a federal authority; on federal
Crown land; those funded by the federal government; or those requiring federal licences
or permits.
In an effort to reduce potential duplication, the Canada–Ontario Agreement on Environmental
Assessment Cooperation was struck in 2004. This agreement commits both governments to
conducting a co-operative EA while retaining their respective decision-making powers.9 In a
recent decision by the Supreme Court of Canada, it was noted that responsible authorities
“can, and should, minimize duplication by using the coordination mechanisms provided for in
the [CEAA]. In particular, federal and provincial governments can adopt mutually agreeable
terms for coordinating environmental assessments…. Full use of this authority would serve to
reduce unnecessary, costly and inefficient duplication.”10
9 “Provincial and Federal Roles in Environmental Assessments,” Dec. 16, 2010, downloaded from
http://www.ene.gov.on.ca/environment/en/industry/assessment_and_approvals/environmental_assessments/STDPROD_075713.html. 10 “MiningWatch Canada v. Canada (Fisheries and Oceans),” 2010 SCC 2, [2010] 1 S.C.R. 6, Jan. 21, 2010, downloaded from
http://scc.lexum.org/en/2010/2010scc2/2010scc2.html.

Chapter 13: Environment and Natural Resources
341
The CEAA is now under review by the federal government, which has expressed interest in
improvements that would include eliminating the duplication of approvals processes
by accepting specific federal and provincial requirements as equivalent. This would give
federal authorities the ability to designate a provincial EA as equivalent to an assessment
conducted under the CEAA. However, removing duplication may require legislative changes at
both levels of government, and there is reluctance among both parties to give up decision-
making authority.
In addition, some groups or classes of projects that are carried out routinely and that have
predictable environmental effects can follow an EA process that is more streamlined.
Streamlined EA projects do not need a separate approval by the ministry if the planning
process set out in the class EA is followed and successfully completed. Such projects include
municipal roads, water and wastewater infrastructure, highway construction and maintenance,
forest management activities and other public-sector activities.11
Currently, some projects requiring an EA also need many subsequent environmental and land
use approvals; many proponents are unaware of this at the start of the EA process. Where
sufficient environmental information is provided, environmental approvals could be granted as
part of the EA. However, the EA is completed at a higher level of analysis, which might not be
detailed enough to assess a project; asking for additional detail at this stage could prolong the
EA process.
Recommendation 13-4: Review opportunities to further streamline the environmental
assessment process, such as co-ordinating further with the federal government’s process
or integrating it with certain approvals.
11 “Streamlined Environmental Assessments,” June 14, 2011, downloaded from
http://www.ene.gov.on.ca/environment/en/industry/assessment_and_approvals/environmental_assessments/STDPROD_075691.html and “Class Environmental Assessment,” Feb. 2, 2011, downloaded from
http://www.ene.gov.on.ca/environment/en/industry/assessment_and_approvals/environmental_assessments/STDPROD_075721.html.

342
Move towards prevention and a polluter-pay principle for contaminated sites
Under the Environmental Protection Act (EPA), the province has the “right to compensation”
for loss or damage incurred as a direct result of a spill, and for all reasonable costs and
expenses incurred for a cleanup. This can be difficult when the owner of a contaminated site is
insolvent, no longer exists, or lacks sufficient funds to pay for the cleanup. This can occur
when property ownership reverts to the Crown, which in effect transfers the responsibility for
cleanup back to the province.
The province can take legal action to ensure the polluter pays for damages or property
ownership can revert to the province, with the responsibility to clean up. While financial
assurance measures exist under the EPA, they do not require companies to take into account
the entire cost of cleaning up a site.
As committed to in the 2011 Ontario Budget, the Ministries of the Environment, Natural
Resources, Northern Development and Mines (MNDM), and Infrastructure are currently
undertaking an enterprise-wide review of contaminated sites, with the goal of consolidating
environmental cleanup activities across the province. The review is expected to include
options for a new governance model, financial management and implementation.
The MOE uses Financial Assurance (FA) as an instrument to reduce the financial risk to the
province resulting from environmental contamination. Currently, the ministry holds
approximately $37 million in cash in addition to other non-cash forms of assurance such as
letters of credit and bonds.12 The FA requirement applies only to select sites and industrial
sectors, addressing a small portion of the overall risk exposure. The existing legislation13 does
not provide an effective policy framework for a robust FA program covering all relevant
industrial sectors. Proponents of advanced exploration and mine production projects are
required to provide FA for the costs of eventual site rehabilitation under the Mining Act.
At present, MNDM holds $33 million of FA in cash, in addition to other non-cash forms,
pursuant to projected rehabilitation costs for mine closure plans.14
One example of a successful program is the Superfund, a U.S. Environmental Protection
Agency program with federal authority to clean up uncontrolled hazardous waste sites and
respond to oil and chemical spills. Funding is provided by the respective industries — primarily
the chemical and petroleum industries. Since the start of the program in 1980, the Superfund
has paid for the cleanup of thousands of hazardous sites and oil and chemical spills.
12 Ministry of the Environment financial records. 13 Namely, the Environmental Protection Act and Ontario Water Resources Act. 14 Public Accounts of Ontario 2010–11, p. 4-8.

Chapter 13: Environment and Natural Resources
343
The program assesses sites, places them on a National Priorities List, and establishes and
implements appropriate cleanup plans. In addition, the Agency has the authority to conduct
removal actions where immediate action is required or states are involved; enforce against
potentially responsible parties; ensure community involvement; and ensure long-term
protectiveness.15
Recommendation 13-5: Place greater emphasis on prevention and the polluter-pay principle
for contaminated sites using appropriate financial tools, such as financial assurance.
Identify opportunities to improve performance of the Ontario Clean Water Agency
The Ontario Clean Water Agency (OCWA) operates 187 water treatment and 203 wastewater
treatment facilities for over 170 clients, most of which are municipalities. In 2009, OCWA
essentially broke even on operations, generating $2.4 million in net revenue against total
operating expenses of $143 million.16
Despite this, OCWA is unique in the Ontario government: it is the only agency that competes
in the marketplace for its business and receives no government funding. And while OCWA
made $11.7 million over the last 10 years, it also ran a deficit on the operations side of its
business over the same period.17 Additionally, although OCWA services the municipal sector,
the wages it offers skilled water and wastewater operators are not competitive with those
offered in the municipal sector, resulting in skilled operators leaving the agency.
The Ontario Clean Water Agency’s current business model is neither sustainable nor
competitive. It cannot offer appropriate compensation to its skilled operators and it cannot
move quickly and flexibly to pursue more lucrative business opportunities.
Recommendation 13-6: Review the effectiveness of the current governance structure
of the Ontario Clean Water Agency to evaluate the merits of restructuring it as a for-profit,
wholly owned government entity.
15 “Superfund – Basic Information,” Oct. 3, 2011, downloaded from http://www.epa.gov/superfund/about.htm. 16 Ontario Clean Water Agency, Annual Report 2009, p. 38. 17 Ontario Ministry of the Environment.

344
Rationalize and consolidate the number of entities/agencies involved in the arena of land use planning and resource management
Many agencies deliver natural resource management activities in southern Ontario.
Administrative consolidation could be achieved by merging activities of the Niagara Parks
Commission, St. Lawrence Parks Commission and Ontario Parks. This could achieve
efficiencies of scale, such as lower costs in the procurement of merchandise for sale in parks’
souvenir stores.
The number of advisory groups/councils in many of the province’s traditional program areas
(i.e., forests, fish and wildlife) could be reduced by having multidisciplinary advisory groups.
A review of the programs and services delivered by MNR and Conservation Authorities could
be undertaken to clarify responsibilities and eliminate any duplication.
Across central southern Ontario, a single agency (similar to Metrolinx) could be created to
deliver natural resource management activities. Examples of current agencies are the Niagara
Escarpment Commission, EcoVision, Greenbelt, Oak Ridges Moraine and Conservation
Authorities. Consolidation into a single agency, with its one-window approach, could offer
streamlined, more efficient service and fiscal savings over the long term.
Recommendation 13-7: Rationalize and consolidate the entities and agencies involved in
land use planning and resources management.

Chapter 13: Environment and Natural Resources
345
Ring of Fire
The Ring of Fire development in northern Ontario represents a significant opportunity to both
realize major mineral development in the region and improve socio-economic opportunity and
quality of life for Aboriginal People and other residents of the north. Managed properly,
the project will provide benefits over several decades.
Success in the Ring of Fire will require collaboration between Aboriginal People, industry, and
the federal and provincial governments. With a focus on creating a healthy workforce,
education and skills training, and basic community infrastructure, the government should take
innovative approaches to expand labour-market and training programs for First Nations
communities. This approach would include implementing a full range of employment programs
and related social supports that are available through social assistance for recipients living on
reserve. These include education programs, job-specific training, literacy programs and
programs that support young parents. The Commission is optimistic that industry partners will
employ Aboriginal People throughout the life of the Ring of Fire and work as partners with
government to deliver or fund (perhaps both) the employment and training services required.
If voluntary efforts by the business sector lag, the government should consider putting a levy
on mining-related activities to directly fund initiatives that will prepare Aboriginal People to
participate economically in the Ring of Fire.
The government should also enhance its efforts to develop partnerships with the private and
not-for-profit sectors in supporting innovative programs such as “Right to Play,” which focus on
promoting leadership among Aboriginal youth — essential for future growth and prosperity.
The federal and provincial governments also have a responsibility to improve regulatory
certainty in order to secure future investment and growth in the region. This should include
streamlining and co-ordinating environmental assessment and regulatory processes to
improve timelines while ensuring Aboriginal communities have the capacity to fully participate
in these processes.
Recommendation 13-8: Ensure that the government’s approach to the Ring of Fire
maximizes opportunities for Aboriginal People and all Ontarians.

346
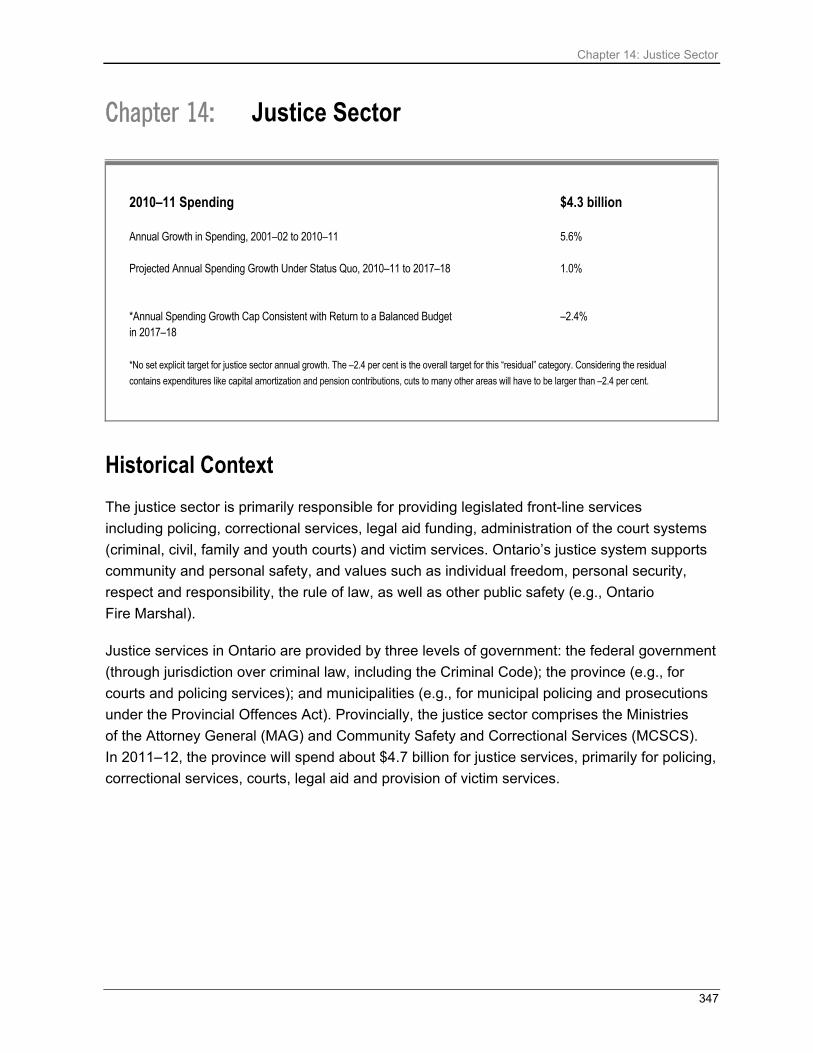
Chapter 14: Justice Sector
347
Chapter 14: Justice Sector
2010–11 Spending $4.3 billion Annual Growth in Spending, 2001–02 to 2010–11 5.6%
Projected Annual Spending Growth Under Status Quo, 2010–11 to 2017–18 1.0%
*Annual Spending Growth Cap Consistent with Return to a Balanced Budget –2.4% in 2017–18
*No set explicit target for justice sector annual growth. The –2.4 per cent is the overall target for this “residual” category. Considering the residual
contains expenditures like capital amortization and pension contributions, cuts to many other areas will have to be larger than –2.4 per cent.
Historical Context
The justice sector is primarily responsible for providing legislated front-line services
including policing, correctional services, legal aid funding, administration of the court systems
(criminal, civil, family and youth courts) and victim services. Ontario’s justice system supports
community and personal safety, and values such as individual freedom, personal security,
respect and responsibility, the rule of law, as well as other public safety (e.g., Ontario
Fire Marshal).
Justice services in Ontario are provided by three levels of government: the federal government
(through jurisdiction over criminal law, including the Criminal Code); the province (e.g., for
courts and policing services); and municipalities (e.g., for municipal policing and prosecutions
under the Provincial Offences Act). Provincially, the justice sector comprises the Ministries
of the Attorney General (MAG) and Community Safety and Correctional Services (MCSCS).
In 2011–12, the province will spend about $4.7 billion for justice services, primarily for policing,
correctional services, courts, legal aid and provision of victim services.

348
In the last 11 years, provincial justice spending has grown by an average of six per cent
annually; it currently represents about four per cent of all program spending. The table below
outlines historical spending in the justice sector:
TABLE 14.1 Historical Spending in Justice Sector ($ Millions)
2001–02 2002–03 2003–04 2004–05 2005–06 2006–07 2007–08 2008–09 2009–10 Actual
2010–11
Current Outlook 2011–12
Attorney General1
1,029 1,088
1,223
1,209
1,291 1,348
1,652
1,749 1,663 1,737 1,908
% Growth – 5.7% 12.4% (1.1%) 6.8% 4.4% 22.6% 5.9% (4.9%) 4.4% 9.8%
Community Safety & Correctional Services2
1,689 1,819
1,713
1,750
1,767 1,876
2,003
2,121 2,201 2,610 2,755
% Growth – 7.7% (5.8%) 2.2% 1.0% 6.2% 6.8% 5.9% 3.8% 18.6% 5.6%
Justice Sector Total
2,718 2,907
2,936
2,959
3,058 3,224
3,655
3,870 3,864 4,347 4,663
Justice Sector % Growth – 7.0% 1.0% 0.8% 3.3% 5.4% 13.4% 5.9% (0.2%) 12.5% 7.3%
1 MAG: 2008–09 to 2010–11 restated to reflect the transfer of adjudicative tribunals into MAG. 2 MCSCS: Ministry of Public Safety and Security changed to MCSCS in 2003–04. Note: Numbers may not add due to rounding.
The integrated nature of the justice sector, including services provided by the federal and
municipal governments, means that changes to one part of the sector often drive program
changes and costs in other parts of the sector. For example, the hiring of additional police
officers or new federal legislation could lead to increased costs for courts/correctional facilities.
Justice spending grew by an average of 5.6 per cent annually from 2001–02 to 2010–11.
Spending under our Status Quo outlook is projected to grow by 1.0 per cent per year from
2010–11 to 2017–18. This sharp slowdown in projected spending growth can be explained
by the high rate of spending on special initiatives in recent years; no further special
initiatives are assumed in the Status Quo projection.

Chapter 14: Justice Sector
349
Recent Expenditures
Over the past few years, significant investments have been made across the sector, including:
Legal Aid Ontario (LAO): Beginning in 2009–10, the government invested an additional
$150 million over four years in LAO. The government provides over $300 million annually
for legal aid services to low-income Ontarians. Legal Aid Ontario provides low-income
Ontario residents with legal assistance in matters including criminal charges, child
protection and custody cases, and representation for refugee claimants.
Justice Infrastructure: Construction is complete on a new consolidated courthouse in
Durham and underway on courthouses in Quinte, Waterloo, St. Thomas and Thunder Bay.
There is also construction underway on two new detention centres in Toronto and Windsor,
as well as a Forensic Services and Coroner’s Complex in Toronto, and 18 Ontario
Provincial Police (OPP) modernization initiatives across the province.
Provincial-Municipal Fiscal and Service Delivery Review (PMFSDR): As part of an
agreement with Ontario’s municipalities, the government committed to upload the costs
of court security and offender transportation from municipalities. This expenditure by the
province is to be phased in over seven years, beginning in 2012, to a maximum of
$125 million annually.

350
Current Context — Key Fiscal Challenges Facing the Sector
Moving forward, the justice sector faces fiscal challenges that will need to be addressed
to bend down the cost curve for justice services. Key challenges facing the sector include
compensation, increasing remand costs, infrastructure costs, the impact of federal legislation
and greater expectations from the public for justice-related services.
Compensation: The primary cost driver in the justice sector is compensation, including
salaries and benefits for the 25,000 staff. Compensation costs represent about 70 per cent
of total expenditures. Increases in compensation are almost entirely driven through collective
bargaining awards or compensation commissions (e.g., for lawyers, judges/justices of the
peace, OPP and AMAPCEO/OPSEU). As pointed out in the Auditor General’s Review of the
2011 Pre-Election Report on Ontario’s Finances, the OPP negotiated an 8.5 per cent wage
increase for 2014 (the three-year contract starting in 2012 begins with wage freezes in 2012
and 2013), while the correctional officers’ collective agreement (the OPSEU collective
agreement) ends on Dec. 31, 2012.
Custody Remand: There has been a substantial increase in remand, particularly in the
Greater Toronto Area. Remand refers to accused individuals who have been charged and
detained in custody and have either been denied bail or have yet to appear before a judge.
They are in custody while awaiting trial. There are currently more people on remand than
there are sentenced offenders in Ontario correctional facilities.
Infrastructure: The justice sector’s infrastructure is aging and deteriorating. There are now
103 courthouse facilities and 26 correctional facilities that are over 30 years old and require
significant renewal or replacement.
Federal Legislation: The impact of federal legislation is a significant challenge. The federal
government has jurisdiction over criminal law, including amendments to the Criminal Code.
The September 2011 omnibus crime bill, the Safe Streets and Communities Act, includes
proposals for tougher sentences and mandatory jail time for serious offences. The provincial
government has estimated that the minimum annual operating impact for Ontario on an
ongoing basis will range from $22 million to $26 million at maturity, but this estimate could be
much higher and we will return to this later in the chapter. The Safe Streets and Communities
Act follows another federal crime initiative, the Truth in Sentencing Act, passed in October
2009, which contained several changes including ending two-for-one credit for time served.
Both of these are expected to have fiscal implications for Ontario’s justice system. Increased
incarceration rates and more trials in Ontario’s criminal justice system will result from
these bills.

Chapter 14: Justice Sector
351
Public Expectations: There are increasing expectations from the public for justice-related
services and for assurance that public safety remains a key consideration for the government.
In Toronto, there are increasing rates of certain violent crime. As a result, the public may not
perceive that the crime rate is, in fact, decreasing. Criminal investigations (e.g., organized
crime, gangs and Internet crime) are increasingly complex and require significant resources.
There has also been a significant increase in family court workload due to increased child
protection initiatives. As well, public focus on emergency management has increased due
to catastrophic events (such as 9-11).
The spending reduction targets proposed in Chapter 1, The Need for Strong Fiscal Action, to
get Ontario back to balance by 2017–18, clearly illustrate that the sector will need to transform
its service delivery and find efficiencies to meet its spending targets, while also ensuring public
confidence in the system and meeting the criminal justice system’s standards. Several of the
Commission’s recommendations should assist the sector in reaching those objectives.
Commission Principles and Goals for the Justice Sector
Evidence-Based Data Collection
Recommendation 14-1: Improve evidence-based data collection in the justice sector to
achieve better outcomes in sector programs.
To support evidence-based decision-making, the sector needs to improve its collection of
standardized data that can be used to evaluate whether policies and programs are meeting
their intended objectives, and how efficiently. The Justice On Target (JOT) program, which
uses existing court activity data, is an example of a provincial program using evidence-based
data to achieve better outcomes. Decision-making and analytical tools (e.g., dashboards)
have been developed to help decision-makers measure success.

352
An example of where the Ontario broader public sector (BPS) can improve its evidence-based
data collection is through the municipal costing of court security and offender transportation
programs. As part of the PMFSDR agreement, this year the province is scheduled to begin
the phased upload of up to $125 million annually at maturity to municipalities for court security
and offender transportation costs. However, neither the province nor the municipalities have
created a standardized inventory of what should be included in municipal costs for court
security and offender transportation. The province will distribute funding to municipalities
based on an expenditure-based model from municipally self-reported data.1 For example, if a
municipality reports it has 10 per cent of the provincial costs for court security, it will receive
10 per cent of the available funding. Standardizing cost data for municipal court security and
prisoner transportation programs will lead to a more equitable distribution of provincial funding
to municipalities and improved outcomes for the sector.
The sector should identify areas where standardizing data and improving data collection will
assist the evaluation and analysis of policy and service delivery and then commence doing so.
Other areas in which improving evidence-based data collection could help the sector include:
Correctional services delivery models, including private alternative service delivery;
Ontario’s policing services model;
Ontario’s public safety training programs, including but not limited to police, fire and
emergency medical services (EMS);
Impact of federal legislation on the Ontario justice sector;
Working with the judiciary and stakeholders to improve data collection;
Building a new integrated court-case tracking system that will automate data entry and
support the collection of more detailed data (e.g., types of motions); and
For family mediation and information services, standardized data collection can help
determine the effectiveness of services and the speed at which cases are resolved. Recent
developments include the development and use of a new database to track non-identifying
information about clients including income, issues, referral sources and settlement rates.
Future improvements will include linking of non-court mediation and information activity
with court-case activity to illuminate the linkage between use of services and court activity.
1 “AMO Policy Update,” Dec. 15, 2011. The upload value for each municipality is based on its relative share of the total 2010 municipal
costs. All municipalities, regardless of whether they hosted a court, were asked to itemize their 2008 and 2010 court security and prisoner transportation expenses. In OPP-policed communities, the OPP provided these estimates.

Chapter 14: Justice Sector
353
Continuous improvement of standardized data will achieve better outcomes, and in turn will
create better data for further evaluation and progress. Yet, to achieve better outcomes for
the sector, it will be important for various institutions to work collaboratively. This will include
further standardization of data across the federal, provincial and municipal governments,
and the court and correctional system working together towards shared outcomes.
Transformational Options to Address Fiscal Challenges
Leading transformational change and altering the culture in Ontario’s justice system presents
a unique set of challenges. Ontario’s justice system is based on an adversarial model. The
justice system is operationally interdependent, yet many of the key players have independent
decision-making powers that are guaranteed by the Canadian Constitution. These are
foundational principles that must be respected and protected. These same principles mean
that systemic change cannot be led by a single group. Indeed, all members of the justice
community must collectively and collaboratively lead restraint efforts and transformational
reforms within Ontario’s justice system.
Recommendation 14-2: Increase use of the Justice On Target program to assist with the
reduction of custody remand, and implement evidence-based approaches to increase
efficiency in the field of family law and family courts.
Reduction of Custody Remand
Custody remand in Ontario is increasing and so are the associated costs. In 2009–10, the
daily average count of remanded individuals in Ontario’s correctional facilities was about
5,700 and they accounted for 67 per cent of the total custodial population. From 2000–01
to 2009–10, the number of people in remand increased by 55 per cent.2 According to MCSCS,
the per diem cost of incarcerating an adult is about $183 as opposed to about $5 per day
in community supervision. The median number of days spent in remand by adults in Ontario
was eight in 2008–09; although this figure has not changed since 1999–2000, it is the
third-highest number among the provinces and territories on record.3
Given the projected annual expenditures for this sector, Ontario must address the trend of
increasing custody remand and the additional costs associated with this trend if the province
is to balance its budget by 2017–18.
2 L. Porter and D. Calverley, “Trends in the Use of Remand in Canada,” 2011, Statistics Canada, Canadian Centre for Justice Statistics. 3 Ibid.

354
The MCSCS needs to work in tandem with MAG to address the growing challenge of
increased custody remand. The Commission recognizes that the JOT program, launched by
MAG in June 2008, is one initiative that is working towards this objective. Justice On Target’s
strategy is to move cases through the criminal justice system more effectively, with an original
goal of reducing by 30 per cent the average number of appearances and days required to
complete a criminal case. For instance, JOT local and regional leadership teams have
implemented enhanced video conferencing, using existing equipment, to perform video pleas,
or scheduled private and secure consultations between defence counsel and in-custody
accused, to reduce the number of appearances and time in between appearances. The
program has not met the goal of 30 per cent reduction, but criminal court statistics from July
2010 to June 2011 demonstrate that Ontario has reversed the trend in criminal court delay.
The average number of appearances needed to complete a criminal charge provincewide has
fallen more than seven per cent since its outset. Over 360,000 court appearances have been
eliminated since inception. Previous to this reduction, the number of appearances needed to
complete a criminal charge increased for nearly 20 years. This strategy has the potential to
reduce the number of inmates on remand in institutions as criminal cases move through the
system faster and with fewer appearances. To date, the province has been unable to quantify
the impact of JOT on the remand population.
Using Evidence-Based Approaches to Increase Efficiency in Family Law and Family Courts
The 2010 Report of the Ontario Civil Legal Needs Project found that the breakdown of a family
relationship is a major underlying reason why low-income Ontarians encounter multiple civil
legal problems.4 This phenomenon often leads to greater demands on the justice system and
other social welfare programs, such as housing, legal aid, welfare, and physical and mental
health programs. In the 2008 Ontario “Report of the Legal Aid Review,” based on research
from Canada and the United Kingdom, it was found that early intervention in civil legal
problems is cost-effective from a broader fiscal perspective in that it can prevent the
occurrence of multiple legal problems and other health and social issues in the future.5
4 “Listening to Ontarians: Report of the Ontario Civil Legal Needs Project,” The Ontario Civil Legal Needs Project Steering Committee,
2010, downloaded from http://www.lsuc.on.ca/media/may3110_oclnreport_final.pdf. 5 Michael Trebilcock, “Report of the Legal Aid Review 2008,” Ontario Ministry of the Attorney General,
downloaded from online: http://www.attorneygeneral.jus.gov.on.ca/english/about/pubs/trebilcock/legal_aid_report_2008_EN.pdf.

Chapter 14: Justice Sector
355
Building on the progress of the JOT program in Ontario’s criminal justice courts, MAG should
implement the principles of the program to family law and family courts. Working with justice
participants across the sector, the focus should be to remove less contentious family disputes
from the court resolution stream, and divert them to non-court alternatives (mediation,
information services). This builds on the previous initiative that expanded family mediation and
information services to all courts in the summer of 2011. Expansion of family mediation would
help families avoid the courtroom by providing faster, more affordable, out-of-court resolutions.
Mental Health Diversion Programs
Recommendation 14-3: Expand diversion programs for low-risk, non-violent offenders with
mental illness as an alternative to incarceration.
The sector should implement additional mental health diversion programs to divert low-risk,
non-violent offenders with mental illness away from incarceration and into the mental health
treatment system. In 2010–11, MCSCS estimated that 19 per cent of remanded inmates in
the Ontario correctional system required some form of clinical intervention for mental health
issues, and, over the last decade, the number of accused with mental health alerts remanded
to provincial custody increased by 69 per cent. This would help those with a mental illness
(who commit minor, low-risk offences and come into conflict with the law) receive appropriate
support outside the criminal justice system. The sector will need to assess the impact of these
initiatives on other ministries, including the Ministry of Health and Long-Term Care. The sector
should also collaborate with the Ministry of Children and Youth Services (MCYS) on youth
custody. The MCYS is undertaking a needs assessment of government-owned, youth-justice,
secure-custody facilities across the province to determine their ability to meet the unique
programming needs of youth in conflict with the law. The sector, with MCYS, should ensure
that services for youth are aligned with the principles and provisions of the Youth Criminal
Justice Act and contribute to community safety by focusing on prevention, diversion and
rehabilitation, and addressing the underlying causes of youth crime.
Review of Core Responsibilities for Police
Recommendation 14-4: Review the core responsibilities of police to eliminate their use
for non-core duties. This review would include an examination of alternative models of police
service delivery. Criteria for the review would include determining the relative costs of the
various security providers and an evaluation of their respective comparative advantages.

356
Many factors have contributed to the rising cost of policing, including technology and
increasing labour costs; the changing nature/complexity of crime and the complexity of the
criminal justice system; and federal legislative changes. At the same time, public expectations,
demographic change and environmental factors influence policing. Policing is an essential
service for the maintenance of public safety and is also one of the fastest-growing areas of
public expenditures in Canada. Stakeholders such as the Ontario Association of Chiefs of
Police, Ontario Association of Police Services Boards and municipalities have voiced concerns
over rising policing costs and the risk that this poses to the provision of police services in
the future.
The Commission recommends that the province review and define the core responsibilities
for policing services to eliminate use of police officers for non-core policing duties. Instead,
alternative models of service delivery can be used that would result in improved fiscal
sustainability for police services throughout Ontario. Alternative models of police service
delivery could include increasing use of private security and expanding the role of special
constables, in circumstances deemed appropriate. The review should examine a range of
alternative models of police service delivery, determine the relative costs of the various
security providers for service delivery and evaluate their respective advantages.
Alternative Service Delivery for Non-Core Services in Corrections
Recommendation 14-5: Use alternative service delivery for the delivery of non-core services
within correctional facilities, where it is feasible.
Using alternative service delivery for non-core services would help to bend down the cost
curve within the sector by taking advantage of the potential for cost savings and efficiencies
and the ability to use the private sector. Currently, MCSCS provides a number of services
under the purview of corrections that are not necessarily core correctional service business
functions, such as inmate transportation and community escorts, inmate health care, food
services and laundry services. Use of alternative service delivery arrangements would enable
MCSCS to focus on the delivery of core correctional services business functions, such as
the safety and security of institutions and supervision of offenders in the community. The
Commission notes, however, that this would have to be examined on a case-by-case basis
because there is a high probability that implementation of this recommendation would require
upfront investment capital to produce the requisite savings for the sector over the longer term.
Facilitating Voluntary Movement towards Municipal Centralized Bargaining for Police and Fire
In Chapter 15, Labour Relations and Compensation, we recommend that the province facilitate
a voluntary movement to centralized bargaining, for municipalities, particularly in relation to
police and firefighting bargaining. Please refer to that chapter for a more complete discussion
of this recommendation.

Chapter 14: Justice Sector
357
Efficiencies
Clustering OPS Adjudicative Tribunals
Recommendation 14-6: Continue the process of clustering adjudicative tribunals across
the Ontario Public Service (OPS).
In 2010, the government strengthened agency accountability, efficiency and oversight by
creating two new agency clusters covering 13 adjudicative tribunals under MAG;
1. The Environment and Land Tribunals Ontario (includes the Assessment Review Board,
Board of Negotiation, Conservation Review Board, Ontario Municipal Board and
Environmental Review Board); and
2. The Social Justice Tribunals Ontario (includes the Custody Review Board, Ontario Special
Education Tribunal — English, Ontario Special Education Tribunal — French, Landlord and
Tenant Board, Human Rights Tribunal of Ontario, Social Benefits Tribunal, and Child and
Family Services Review Boards).
The intention of clustering was to co-ordinate, align and enhance services with existing
resources, improve access to justice, and enhance the efficiency and effectiveness of the
clustered tribunals. Several advantages have been gained from the clustering of
adjudicative tribunals:
Common administrative functions: Clustering enabled a permanent shift to common
administrative functions supporting all tribunals within the cluster. Combining staff under
a cluster infrastructure allows for greater mobility and addressing financial oversight at a
cluster level has enabled greater flexibility for management. As the organization matures,
it is expected that further streamlining of administrative operations may occur. Additionally,
legal services, program development and communications have been consolidated at
the cluster level, allowing the individual agencies within the cluster to focus on case
management.
Co-location of offices: The Environment and Land Tribunals Ontario cluster has been
successful in co-locating its organization in a single building with contiguous floors,
including all hearing and mediation rooms.
Procedural improvements: As these cluster organizations evolve, it is expected that
procedural improvements will begin to emerge in the adjudicative process. The individual
agencies will begin to leverage best practices and have access to technology and an ability
to streamline physical resources (hearing rooms, regional offices).

358
The remaining 23 adjudicative tribunals could be clustered around themes of health,
community and consumer safety, agriculture, commerce and labour. Service improvements
and cost efficiencies may be found through consolidation of administrative functions, co-
location of offices and procedural improvements. The lessons learned by MAG through its
clustering efforts for adjudicative tribunals would provide insight and strategies for further
strengthening agency accountability, efficiency and oversight throughout the OPS.
Integration and Consolidation Opportunities for Public Safety Training
Recommendation 14-7: Examine integration opportunities and consolidate where possible
public safety training in policing, fire services and correctional services, which are currently
delivered individually through their respective colleges.
Consolidation options could also examine the use of alternative service delivery models
in delivering training (e.g., increased use of e-learning) and partnerships with community
colleges to provide training. The following chart provides some of the business models
that can be examined for delivery of public safety training:
TABLE 14.2 Business Models for Delivery of Public Safety Training
Business Models Description
Privatization (Divest Functions)
Full transfer of public safety training delivery to a private operator(s)
Agency (Divest Functions)
Transition of public safety training delivery to a classified operational enterprise agency
Public Private Partnership (Alternate Financing)
Transfer of some training delivery to a private operator
Maximize efficiencies (Modernization of Status Quo)
The ministry retains responsibility for training delivery with a focus on capitalizing on opportunities for efficiencies and revenue streams

Chapter 14: Justice Sector
359
Analysis will be needed to determine the specific efficiencies associated with each business
model identified. A new business model for delivery of public safety training could:
Increase efficiencies resulting in opportunities for primary stakeholders to guide or
contribute to strategies that support training delivery through effective governance;
and redefine roles in a manner that supports a focus on the core business;
Contribute to fiscal savings to potentially reduce funding and redeploy labour;
Increase and diversify revenue streams, thereby contributing to enhanced and financially
self-sufficient training; and
Depending on the preferred model, there may be opportunities to increase the revenue
streams and redirect dollars generated to support ongoing training delivery for financial
self-sufficiency.
Capital Infrastructure
Recommendation 14-8: Have the justice sector continue to work with Infrastructure Ontario
to use alternative financing and procurement to assist in replenishing its capital infrastructure.
Much of the infrastructure in this sector is dated. For example, over 70 per cent of Ontario
courthouses are over 40 years old, and over 80 per cent of Ontario’s correctional facilities
are over 30 years old, including 21 per cent that are more than 100 years old. To address
the issue of aging justice infrastructure, the sector should continue to work with Infrastructure
Ontario (IO) to use alternative financing and procurement (AFP) models that better assess the
risk and value for money of capital projects. The sector should also evaluate the performance
of completed AFP projects to assess if value for money was achieved as intended and to
identify potential improvements to the AFP model for future projects.
One of the key requirements for projects that are delivered using the AFP method versus
traditional financing is that IO ensures that the project would provide value for money.
If IO determines that value for money would not be achieved for a project using the AFP
model, a traditional procurement model would be favoured. Savings achieved can differ from
project to project as value-for-money analysis is conducted for each project. However, more
often, AFPs achieve savings because certain project risks are transferred to the private-sector
actors that have the expertise in construction, project and contract management to be able to
better mitigate those risks. Risks include construction price uncertainty, project delays and
facilities maintenance risk.

360
The sector should collaborate more effectively to improve asset management and explore
options to better consolidate existing assets and options to collaborate on future AFP projects.
For example, the sector should explore options of shared facilities to reduce construction and
operating costs.
The sector must answer one question to meet its upcoming fiscal challenges: will the existing
infrastructure footprint be sustainable in the medium and long term? Tough decisions will need
to be made regarding the potential for consolidation and even the closure of some aging and
underutilized facilities. A comprehensive plan is needed. Additionally, the questionable existing
infrastructure is one reason why higher incarceration rates might require about $1 billion in
new infrastructure. Broader discussion of Ontario’s infrastructure challenge is captured in
Chapter 12, Infrastructure, Real Estate and Electricity, and Chapter 19, Liability Management.
Federal Government
Recommendation 14-9: Improve co-ordination between federal and provincial governments
in areas such as justice policy and legislation, law enforcement and correctional services.
There needs to be better clarity and agreement on the roles and responsibilities of each of
the federal and provincial levels of government. Particular attention should be paid to better
estimating the impact of federal legislation on the sector. For example, recent bills such as
the Truth in Sentencing Act will result in additional fiscal pressures.
Responsibility for the Criminal Code rests with the federal government while responsibility
for implementation lies mainly with the provinces. Recent crime legislation will place further
demands on the provincial court and corrections systems, only adding to the fiscal burden of
the provinces as the federal government has not yet recognized or addressed the additional
cost. The provincial government has projected Ontario’s daily inmate count to increase by
1,265 to 1,530 inmates in 2015–16 as a result of Bill C-10. The lowest cost estimate of the
impact of the federal crime bill is ongoing annual increases in operating budgets of $22 million
to $26 million per year at maturity. Staying with this minimum cost impact would require fitting
the larger number of inmates into the existing infrastructure. That may not prove feasible,
or at least may not be consistent with the province’s strategy to modernize and increase its
institutional capacity. Under that plan, the province would close four older facilities and build
two new facilities to bring Ontario’s utilization rate to 88 per cent. The current rate is
95 per cent, but, under this bill could rise to a provincial average of between 101 per cent
and 104 per cent; some institutions could have rates as high as 125 per cent to 150 per cent.
In the worst-case scenario, the province would be required to build a new 1,000-bed facility,
with an estimated capital cost of $900 million and ongoing operating costs of $60 million
per year. The ministry could consider retrofits to existing institutions but, here too, the capital
implications would be significant.
Chapter 14: Justice Sector
361
Recommendation 14-10: Negotiate the transfer of responsibility for incarceration for
sentences longer than six months to the federal government.
Offenders sentenced to two years or less serve their terms in provincial prisons while
offenders sentenced to over two years serve in federal penitentiaries. Effective rehabilitation
services can be provided for inmates serving longer than six months. We recommend that the
province negotiate uploading the responsibility for inmates serving six months and longer to
the federal government, which would better align fiscal incentives for corrections and would
give inmates access to federal rehabilitation services. Government should determine the
potential savings, efficiencies and improved outcomes gained by transferring the responsibility
for incarceration for sentences longer than six months to the federal government.

362
Chapter 15: Labour Relations and Compensation
363
Chapter 15: Labour Relations and Compensation
Size of Broader Public-Sector Labour Force and Degree of Unionization
There are thousands of public-sector employers and over one million broader public
sector (BPS) employees in Ontario. This diverse group of employees includes roughly
300,000 in the health and social services sector, 294,000 in the elementary/secondary
education sector, 133,000 in colleges and universities, 114,000 in municipalities1 and 65,000
in the Ontario Public Service (OPS).2
About 70 per cent of BPS employees are unionized — a far higher percentage than the
roughly 15 per cent unionization rate in the private sector.3 There are important variations in
density across BPS sub-sectors. For example, while overall union density in the health and
social services sector is estimated at about 45 to 47 per cent, some estimates place union
density in hospitals and acute care facilities at about 75 per cent, child welfare agencies at
about 87 per cent, and youth justice service agencies at about 24 per cent.4 In the
elementary/secondary education sector, over 95 per cent of employees are unionized.5
This high level of unionization produces a two-way street that requires joint oversight to foster
effective union-management relationships. Any government or organization that wants to
change the way in which services are delivered must work with the people who deliver those
services and with the unions that represent those people.
1 Statistics Canada's Labour Force Survey, 2010 - data refer only to Ontario BPS workers (federal workers are excluded). 2 2011–12 Ontario Public Service full-time equivalent cap is 65,253. 3 Statistics Canada’s Labour Force Survey, 2010. 4 Chaykowski and Hickey, p.14. 5 Based on 2010–11 FTE counts across the elementary/secondary education sector.

364
Trends in Ontario Labour Relations and Employment
Ontario has a history of reasonably good labour relations, with some periods of conflict.
In general, there have been fewer work stoppages in Ontario’s BPS than in the private sector.6
Employment has increased steadily in the past two decades across the major BPS sectors
and industries, including education, health and social services, and public administration.
From 1989 through to about 1993, employment increased in these broad industries and then
levelled off through the 1990s; subsequently, employment increased, modestly at first in
education and public administration, before increasing rapidly after about 2005. The increase
in health and social services employment has been quite significant since the end of the
1990s. Over the period from 2000 to 2011, Ontario public-sector employment in health care
and social services increased by 39 per cent and in education by 34 per cent. By 2011,
Ontario BPS employment accounted for just over 17 per cent of total employment in Ontario.7
Total Compensation
Since 2003, prices in Ontario, as measured by the consumer price index, have increased by
17 per cent, average wages in Ontario have increased by 24 per cent and average BPS
wages have increased by 28 per cent.8 These wage gains are based on reports of earned
income from a statistical sampling of Ontarians. As such, simple statistics like these miss
some key facts about compensation in Ontario.
6 Ontario Ministry of Labour, 2011. 7 Statistics Canada Labour Force Survey. 8 Calculated from Statistics Canada's Labour Force Survey, 2003–10.

Chapter 15: Labour Relations and Compensation
365
Total compensation includes many components. Generally, the largest component of
compensation is a “base wage” or salary. When it is publicly reported that an employer and a
bargaining agent have reached an agreement of, for example, two per cent increases per year
for three years, this usually refers to the magnitude of across-the-board increases in base
wages. However, other components of total compensation can increase compensation growth
beyond the growth in base wages. Premium payments such as overtime, shift premiums, merit
pay and movement through “grids” can add significantly to total compensation. For example, in
some sectors, merit pay for satisfactory performance can provide an additional 3.5 per cent
per year.9 In other sectors, movement through a qualification and experience grid, for those
not at the top, can add about five per cent per year solely for gains in experience that are not
tied specifically to merit.10 Given that low inflation is projected for the near future, many
employees with such arrangements could still see real wage gains even in the absence of
across-the-board wage rate increases.
Wages and premium pay are two components that contribute to a “substantial and ongoing”
public-sector wage advantage relative to the private sector in Canada. Key reasons cited for
this wage advantage include more advanced pay equity policies in the public sector (thus
narrowing male-female pay differentials) and the tendency for governments to pay higher for
non-management service jobs, which statistically outweigh the smaller number of managers
who tend to be paid less than in the private sector. “In other words, the spread between the
top and the bottom of the pay scale is less in government than in the private sector, which is
likely a result of political, public and collective bargaining pressures.”11 Other factors have
been cited as reasons for a public-sector total compensation premium: public-sector workers
are, on average, older and have longer tenure than private-sector workers; and public-sector
workers have a higher average education attainment than private-sector workers.12
9 Association of Management, Administrative and Professional Crown Employees of Ontario (AMAPCEO) Ontario Public Service (OPS)
Collective Agreement, Apr. 1, 2009 through Mar. 31, 2012. 10 Average gain due to one additional year of experience in the A1 or A2 qualification level, not including benefits or pension contributions.
Calculated from the provincially funded salary grid in the Education Funding Technical Paper, 2011–12, p. 71, downloaded from http://www.edu.gov.on.ca/eng/funding/1112/technical11.pdf.
11 Morley Gunderson, Douglas Hyatt and Craig Riddell, “Pay Differences between the Government and Private Sectors: Labour Force Survey and Census Estimates,” 2000.
12 See, for example, Gunderson et al., 2000, “Wage Watch: A Comparison of Public-Sector and Private-Sector Wages,” 2008, Canadian Federation of Independent Business; and “Battle of the Wages: Who Gets Paid More, Public or Private Sector Workers?” 2011, Canadian Union of Public Employees.

366
Other key components of total compensation costs include benefits (both vacation benefits
and health benefits), pensions and job security provisions. In general, benefit levels in the
public sector are generous; public-sector employees often have access to jointly funded
defined benefit pension plans; and many collective agreements include job security provisions
that greatly reduce the likelihood that employees in a particular bargaining unit would find
themselves out of work (especially employees with seniority under collective agreements with
“bumping” provisions).13 Benefits, pensions and job security are undoubtedly valued by
employees and also by many employers who recognize this reduces turnover and contributes
to workforce continuity and stability. Thus, they must be considered as part of the total
compensation package that is negotiated or bargained with employees and employee groups.
The Challenge
Growth in public-sector wages has slowed since the introduction of the government’s restraint
policy in March 2010.14 However, many major agreements, including the agreement covering
Ontario’s 24,875 physicians15 and those covering over 200,000 full-time equivalent (FTE)
employees in the education sector, have not been renegotiated since the 2010 restraint was
announced.
The previous chapters of this report have outlined the scope of the fiscal challenge that
Ontario is facing. If the target of a balanced budget by 2017–18 is to be met, government
program expenditures must be restrained. As has been indicated, this restraint will take
different forms in different sectors. However, one recommendation that crosses all sectors is
the need for prolonged moderation of growth in public-sector total compensation.
It is tempting to argue that this moderation should be achieved through a reduction or freeze in
wages. Although temporary wage moderation may be necessary to meet short-term fiscal
targets, longer-term action will require co-operative approaches that can drive the institutional
and system-level change recommended in this report. Ultimately, moderation in total
compensation will require that wage restraint give way to a reduction in the size of the
work force, supported by increased productivity and improved service delivery.
13 “Bumping” refers to the situation where a laid-off worker with more seniority takes over the job of a worker with less seniority
(i.e., “bumps” the less senior worker). 14 Average annual wage increases in the Ontario BPS (excluding municipalities and federal employees) averaged 1.5 per cent for contracts
ratified between April 2010 and Dec. 6, 2011. 15 Ontario Physician Human Resources Data Centre – Active Physician Registry as of Dec. 31, 2010.

Chapter 15: Labour Relations and Compensation
367
Wage freezes have been common tools in previous governments’ deficit fights. However,
history shows that wage freezes are often followed by wage catch-up periods. Such action,
if undertaken in the current fiscal climate, would undermine our longer-term fiscal mandate and
damage labour relations. The Commission confronted considerable confusion over what the
Supreme Court decisions16 mean for issues such as wage freezes. However, it is the
Commission’s understanding that the two decisions stress the importance of consultation
when governments seek to achieve their desired industrial relations outcomes. The interests of
positive longer-term labour relations and the emerging law dictate that the same path be
followed at this time: make the fiscal objectives and the implications for labour compensation
very clear, and then negotiate towards securing the desired results.
Previously in Chapter 3, Our Mandate and Approach, the Commission provided
recommendations on the size of the workforce and unionization, which we revisit in this
chapter. Focus should be on program outcomes and budgets, and not on arbitrary limits on the
size of the civil service. There should be no ideological or other bias towards or away from
public- or private-sector delivery of services. Such matters should be dealt with from a position
of practical logic: What produces the best result for the people of Ontario? What produces the
best public services at an affordable cost? Increasingly, services should be put to tender to
secure the optimal results. Yet, the winner should not be decided simply on the basis of the
lowest cost. Instead, it should be decided on a quality-adjusted cost basis. For some services,
a measure of quality would include, for example, the ability to provide the services in both
official languages.
Recommendations for compensation and the labour force should focus on the bigger picture.
As long as the system keeps deploying the same short-term solutions (i.e., wage/hiring
freezes, global FTE reduction targets, suspension of performance pay), the government will
continue to find itself in the same situation in the end. A shift in thinking must take place that
moves approaches from short-term solutions to broader sectoral transformation. The lead
problem (and solution) cannot be labour itself. The focus of discussions must begin with
defining what businesses and services the government should undertake and what policy
goals and outcomes the government should seek.
In theory, the system of labour relations in Ontario should allow governments, employers,
employees and employee representatives to work together to deliver the public services that
people depend on. The principles and recommendations below are intended to help bring
reality closer to that theory.
16 Two recent court decisions (Health Services and Support – Facilities Subsector Bargaining Assn. v. British Columbia, [2007] 2 S.C.R. 391,
2007 SCC 27 (“B.C. Health”) and Ontario (Attorney General) v. Fraser, 2011 SCC 20, [2011] 2 S.C.R. 3 (“Fraser”) have further clarified the need for changes to collective agreements to be made collaboratively and in good faith.

368
Principles
1. The labour relations system in Ontario should be balanced, effective and transparent.
It should respect the interests of both employers and employees; help to provide value to
citizens receiving public services; and be seen to do both these things.
2. Collective bargaining agreements that are negotiated between the parties are preferred to
settlements or outcomes that are either legislated or arbitrated.
3. Accountability for labour relations and service delivery outcomes should be appropriately
distributed. Governments, BPS employers and bargaining agents need to bear appropriate
levels of responsibility for bargaining outcomes. Broader public-sector management and
employees need to bear appropriate levels of responsibility for delivering high-quality
public services and value for public money.
4. Broader system changes should be part of a larger vision, in which labour relations play a
part, but are not an end in themselves.

Chapter 15: Labour Relations and Compensation
369
A Balanced, Effective and Transparent System
A Balanced System
Essential Services
It is generally accepted that negotiated settlements or outcomes achieved between parties
through unconstrained collective bargaining with the right to strike/lockout are superior to other
mechanisms for achieving contracts. The reasons for this are that the parties are best
positioned to understand the trade-offs that allow them to optimize in negotiations, and the
parties are more likely to live with the settlement or outcomes if the contract is freely
negotiated (e.g., a lower grievance rate is more likely).
Some occupations are often regarded as essential. If the parties do not agree on a settlement
and the union decides to exercise its right to strike, the public at large takes an immediate
interest. “Many of the services provided in BPS industries are considered ‘essential’ insofar as
the withholding of the provision of the services would materially affect the health and/or
security of the public.”17
It is very difficult to determine which services should be deemed to be “essential” because
there is no litmus test of hardship. In some medical or personal security cases, it is fairly clear,
but in many other cases it is not. Some medical procedures can wait, others can wait but not
for too long, and still others may require immediate assistance. Furthermore, there is the issue
of consumer/public and political tolerance. There may be little tolerance for any service
disruptions in health care and primary and secondary education by the affected public, while
the non-affected (i.e., the healthy or those without children in school) may have a greater
tolerance for service disruptions. So there is no clear distinction to divide specific services that
are essential and those that are not.
Various governments have tended to undertake policy measures to respond to public
pressures to avoid the public outcry that would result from public service delivery disruptions.
Policy measures that governments undertake usually take one of these options in response to
the public’s pressure:
I. Increasing the number of designated workers in a bargaining unit (i.e., increase the
proportion of employees designated as essential, to maintain a basic level of what is
viewed as an essential service to the public); and
II. Increase usage of outright strike bans.
17 Chaykowski and Hickey report, p. 12.

370
“In labour relations, the main issue is identifying which industries/employers provide essential
services and what proportion of a given workforce ought to be deemed essential. This issue
determines the right to strike or, in the case of enterprises where only a portion of the
workforce is designated as essential, whether a strike by remaining employees would have
any meaningful impact on the operations of the employer … [and that] … BPS employers are
under pressures and have unique incentives to rely on designating employees as essential;
just as unions and employees are wary of the tendency to invoke this rationale for limiting the
right to strike.”18
Recommendation 15-1: Establish an independent working group to consider and determine
which broader public-sector occupations and industries should be deemed as providing
essential services, the appropriate essential-worker designation process, and the appropriate
form of dispute resolution mechanism for broader public-sector industries and occupations.
The Commission understands that this issue is highly complex and that trade-offs need to be
made in any decision to deem any service as “essential,” as highlighted previously. However,
as we clearly state from the outset, freely negotiated outcomes achieved between parties are
always the best option. About one-third of employees in Ontario’s BPS are in occupations that
are deemed to be essential; Ontario has the highest percentage of BPS employees in Canada
who fall into this category. An independent review would seek to define the litmus test and
examine whether Ontario has the correct public services deemed as essential.
Interest Arbitration
There is a well-established legal framework on bargaining rights in Canada — this is to be
respected. However, this does not mean change is neither possible nor necessary — just that
change must be collaborative and done in good faith.
The need to reach a balance between the rights of workers and the needs of employers is a
key component of our labour relations system. As with any large, complex and vitally important
system, it is worth reviewing its components to ensure that they are functioning as intended.
One such component of the system that has received increased scrutiny in recent years is the
system of arbitration.
18 Chaykowski and Hickey report, p. 13.

Chapter 15: Labour Relations and Compensation
371
The interest arbitration process in Ontario is a major determinant of wage (compensation)
settlements in the Ontario BPS for unionized employees; all hospital employees, long-term
care workers, police officers, professional firefighters and Toronto Transit Commission
employees have no right to strike and thus have unresolved bargaining issues decided
through interest arbitration. Interest arbitration is also used periodically in other industries,
such as ambulance services and energy, and is used as a dispute mechanism of last resort to
settle disputes after striking employees are ordered back to work.
The system of interest arbitration is very important. Unfortunately, the system has recently
come under increasing scrutiny and attack. The arbitration system thus must not only work,
but it must be seen to work.
The Commission heard many submissions from employers in the BPS claiming that arbitration
is seriously flawed, even broken. Specific charges included the granting of high compensation
awards, ignoring “ability to pay” arguments and long delays that are sometimes followed by
high retroactive awards that had not been budgeted for.
Our research leads us to make recommendations to improve the arbitration process. But we
hasten to add that we do not find the system to be broken. In general, arbitration awards have
followed freely negotiated settlements. The notion of “ability to pay” is understandably difficult
to apply in the public sector where most of the employer entities could raise taxes if pressed.
Further, we found that the employer often did not present evidence of this argument to the
arbitrators.
We believe the recommendations set out below will improve the system. However, by
themselves, the changes will not materially change the sorts of compensation increases
awarded through arbitration. The fiscal situation dictates that those compensation
increases must be highly constrained over the next several years. That will only happen if the
public-sector employers adopt tough, but fair, stances in negotiations. The pattern will then
likely be reflected in arbitration.
Wherever government, BPS employers and bargaining agents have established a pattern of
negotiating moderated wage increases, then interest arbitrators should follow that lead.
Bringing the Interest Arbitration Process under One Roof
The Commission recognized the need to establish principles/outcomes that would assist its
recommendations for interest arbitration process reform.
Recommendation 15-2: Establish the overall principles/outcomes necessary for reform to the
interest arbitration process going forward.

372
Several key principles must be established to maintain the integrity of the interest
arbitration process:
Assignment to cases independently of the parties;
Co-ordination of case assignment, in part to ensure that cases are handled in a
timely/efficient manner;
Monitoring — which requires that decisions be reviewed with a view to ensuring that
decisions reflect clear assessments based on criteria specified; and
Transparency — publishing decisions and decision summaries is critical; this is a form of
external regulation by virtue of pressure from the parties and the interested public.
Recommendation 15-3: The normal course of an arbitration process should begin with
mediation, prior to arbitration, to attempt to arrive at a negotiated settlement between
the parties.
Again, the best settlements are freely negotiated between parties. The Commission
acknowledges that a negotiated settlement is not always possible between parties; however,
all efforts should be made to have parties attempt to settle on a negotiated agreement.
A negotiated agreement is always preferable to one that is legislated or arbitrated.
Recommendation 15-4: The arbitration system needs to be shifted in favour of more
objective analysis, based on objective criteria, and supported by systematic data
and research.
Prepare and propose changes to labour and other relevant legislation and procedures that
guide the arbitration process, to create a more efficient process, and a more professional line
of business with standards and appropriate training.
Changes should include:
The establishment of an independent tribunal or commission to create, maintain and
manage a roster or a panel of independent arbitrators. Three might be the optimal number.
Arbitrators would be assigned to cases by the tribunal/commission independent of the
parties. Arbitrator and mediator assignments should be co-ordinated across the BPS,
including provision for the appointment of arbitrators across sectors of the BPS. Either a
roster or a panel of three arbitrators could work, but without the principles/outcomes
outlined for the interest arbitration process, neither would work well. The Commission also
emphasizes that the independence of the arbitrators from government influence or
interference is of vital importance for either the roster or panel model to be implemented;
Chapter 15: Labour Relations and Compensation
373
Establish a time limit on the arbitration process and the time arbitrators can take to issue a
decision (currently they can take as long as three years, often because parties seek a
particular arbitrator who is busy — such delays in decisions can mean they are ultimately
out of sync with the current environment);
Develop specific and well-defined objective criteria that interest arbitrators would be
required to account for in formulating their awards/decisions. For example, “ability to pay”
criteria should be broadened to include economic and fiscal environment, and productivity
criteria in arbitration awards/decisions;
Arbitrators should be required to provide clear assessments and reasons for their
awards/decisions based on the specific and well-defined criteria specified in legislation,
as well as any others;
Ensuring transparency by publishing arbitration awards electronically;
Arbitrators should function within well-defined parameters of the process and
expectations of the stakeholders regarding the quality and scope of the awards rendered;
Arbitrators should not make judgments on issues not presented to them by either party;
Centralized support provided to arbitrators, as required; and
Increase professionalization of arbitration practitioners to enhance the quality of arbitration
services provided. There are two dimensions to address to increase the professionalization
of these practitioners. First, the core skill required for the profession must be identified, and
programs to build these skills must be developed. Second, in arbitration and mediation
professions that determine outcomes that affect the fundamental interests of third parties,
a formal Code of Conduct should be developed for the profession.
As with any change, some groups will be negatively affected and thus will resist change. In the
case of the changes proposed above, the community of arbitrators in Ontario will likely be
displeased with the additional conditions imposed on their profession. In addition,
the imposition of an independent tribunal/commission to create, maintain and manage a roster
of independent arbitrators and mediators may limit arbitrators’ ability to determine which work
they take on and thus may directly affect their livelihoods.
The government should be prepared for criticism and also be prepared to explain why
changes are being sought. The rights of employees need to be respected, as do the needs of
citizens who depend on public services being delivered within shrinking budgets.
Communication, much like the system, needs to be balanced.

374
An Effective System
Ontario’s workforce and economy are changing. Its population is aging; global competition
is increasing; technology is improving; and all signs point to an extended period of slower-
than-historical economic growth.
As has been discussed in previous chapters, public services will need to be delivered
differently — more effectively and efficiently — if service levels are to be maintained.
That means increased productivity — more services provided per employee.
This is primarily a management problem. Most Ontario BPS workers are well educated, highly
competent and dedicated to their jobs. However, the system in place to manage those workers
does not measure productivity well, nor does it encourage active steps to improve it.
This can and must change.
Recommendation 15-5: Provide zero budget increase for wage costs in the Ontario
government so any increases must be accounted for within the respective growth rates
recommended in this report.
This will encourage government ministries/departments/agencies to consistently re-evaluate
their internal expenditures and will help to maintain the type of healthy tension that drives
out inefficiencies.
Annual re-evaluations of departmental budgets also support the more fundamental service
reviews recommended elsewhere in this paper. The move to more effective provision of health
care, education and social services will inevitably have labour relations implications. When an
organization is closed, when two organizations are merged or when the responsibility for a
service is outsourced to a different entity, workers are affected. The government has a
responsibility to ensure that those effects are balanced against the need for more effective
service delivery.
Recommendation 15-6: Bumping provisions (i.e., seniority) in collective agreements are
unduly impeding the move towards a progressive and efficient public service. The government
needs to work with bargaining agents and employers to explore options for modifying these
provisions and monitor progress towards fixing this problem.
Recommendation 15-7: Do not let concerns about successor rights in the broader public
sector stop privatizations or amalgamations that make sense and are critical to successful
reform. Inherited agreements do not live forever; provisions can be accepted initially and
bargained differently when they come up for renewal.

Chapter 15: Labour Relations and Compensation
375
Recommendation 15-8: Consider expanding the authority of the Ontario Labour Relations
Board to facilitate the establishment of effective and rationalized bargaining structures that
support the delivery of quality and effective public services.
The new powers could include:
on receiving an application for certification of a new unit, to combine the new unit with
existing units at that employer or
on merger of two employers, to combine units (as happens now in the public sector under
the Public Sector Labour Relations Transition Act) or
on receiving an application from a union or employer anytime, to combine existing units at
that employer.
Another way in which the government can support the transition to more effective service
delivery in the BPS is to establish new relationships with BPS employers.
For government to have sustained compensation moderation in the BPS and responsiveness
to BPS employers on critical needs that they identify, there needs to be sustained and direct
government encouragement and direction to BPS employers. This could take various forms:
Requiring and supporting employers to adopt best bargaining practices in areas such as
total compensation costing, preparing for negotiation, co-ordinating with fellow BPS
employers, communicating with government with respect to what their plans are, and being
required to provide information on their outcomes;
Setting targets for BPS employers (i.e., specific expectations for total compensation and
costly non-monetary items); and
Setting parameters for employers, enforced through funding levers.
Effectively, the government has the responsibility to encourage sustainable outcomes in BPS
bargaining and provide support to BPS employers and bargaining agents so that those
outcomes can be achieved. The form of that support will differ from sector to sector.
Recommendation 15-9: Further rationalize bargaining, while recognizing that multiple models
of rationalized bargaining exist (e.g., centralized, co-ordinated, legislated, voluntary). Work
collaboratively with broader public-sector employers and bargaining agents to determine the
most appropriate model on a sector-by-sector basis.

376
The overall bargaining structure in the province needs to change. It is now highly fragmented,
with over 3,900 bargaining units. Many bargaining units, particularly in the BPS, are poorly
resourced. One difficulty with a large number of collective agreements is that many employers,
particularly small employers, cannot appropriately resource the negotiations. To a degree, the
effects of this risk can be mitigated through consolidation of bargaining. Ultimately, the
province needs to move to a smaller number of bargaining units and allow that to facilitate
more consistent and complete attention and allocation of resources.
A smaller number of collective agreements will reduce overhead costs for both employers and
bargaining agents. However, it will not directly result in lower wage settlements.
Centralized bargaining may take the form of a master table to negotiate sector-wide issues of
concern (e.g., wages and benefits) in conjunction with sub-agreements that address issues
related to local practices and distinctions in job structures and work processes. This two-tier
approach provides the flexibility of not requiring consolidation of bargaining units or
standardization of local terms and practices. Depending on the industry or segment of the
BPS, the specific centralized bargaining framework may be structured along either occupation-
based lines, across an entire sector, or through a combination of specific employers and
occupations. Examples of this include elementary and secondary education, colleges, specific
occupations in health, and community and social service transfer payment agencies. Some
segments of the BPS would not be candidates for more centralized models of bargaining.
However, even where more centralized bargaining would not be appropriate, mechanisms to
support desirable co-ordination should occur. Fostering effective sectoral and local practices,
including ongoing discussion, and relevant data collection and analysis would be beneficial.
Recommendation 15-10: The government should facilitate a voluntary movement to
centralized bargaining for municipalities — particularly in relation to police and firefighting
bargaining.
A fundamental problem with municipalities is that they each have a different funding base
(i.e., own-source revenues — property taxation, user fees, municipal licensing fees,
development charges, investment income, etc., and the amount of funding from senior levels
of government). Centralized bargaining works best when the employer side has one funding
envelope (e.g., the OPS and its employees). In some circumstances, very small employers
would be quite disadvantaged if swept up in a wage settlement driven by larger employers with
deeper pockets.
The Commission recognizes that mandating centralized bargaining for municipalities would not
be ideal for the reason discussed above. The financially weakest municipalities would likely
face slightly higher-than-normal compensation increases, rather than the larger municipalities
seeing their employees’ pay increases dragged down.

Chapter 15: Labour Relations and Compensation
377
The benefit of this voluntary approach of centralization for municipal bargaining is that
municipalities might not be completely “centralized,” but rather become “more centralized”
in bargaining. The larger municipalities, or some groups of them, will tend to bargain together,
and, likewise, the smaller municipalities will bargain together but separate from the larger
ones.
A Transparent System
There are many misconceptions around public-sector labour relations and compensation.
Often, misconceptions are heightened by rhetoric about “unreasonable” union demands or
employer-proposed “cuts.” Many citizens have emotional responses to public-sector labour
relations issues. Some may feel intrinsic solidarity with other workers fighting for their rights or
their livelihood; others — particularly those who do not enjoy the same level of benefits or job
security — may instinctively side with employers. In general, public-sector labour relations are
a highly politicized policy area.
A government striving to ensure value for public money and sustainable delivery of public
services needs to rise above knee-jerk politics. That means sticking to the facts:
Total compensation involves more than just wages. Thus, any conversation about total
compensation must consider all elements of a pay package — including benefits,
pensions, job security and working conditions/rules;
There is no such thing as a “typical” public-sector job (nor a “typical” private-sector job,
for that matter). Thus, it does not make sense to consider all BPS workers the same, nor to
treat them the same when it comes to compensation;
There are challenges in measuring productivity across different job categories (in both the
public and private sectors) and with comparing job categories, but these challenges can
be overcome; and
Labour markets are important, but the existence of public-sector monopoly employers
complicates the influence of those markets. In general, retention premiums should not be
provided to employees in jobs with an excess supply of labour.
These facts can and must be supported by data. To foster balanced, effective and transparent
labour relations, good, independent information is key.
Recommendation 15-11: Establish a Labour Relations Information Bureau to collect and
disseminate the range of data and information relevant to employers and unions in the broader
public sector in their negotiations, and identify data and other information/knowledge gaps.
Of particular importance is developing data and measures of productivity.

378
Through the bureau, support research on targeted areas of significant relevance to the
collective bargaining process (e.g., productivity studies, conflict resolution, arbitration).
Also, data collected should include collective agreements being made readily available as
raw data on the Internet.
This bureau should support the independent tribunal/commission for independent
arbitrators and mediators by providing current objective data and other information on the
labour, economic and fiscal environment.
Recommendation 15-12: Introduce a comprehensive and transparent benchmarking system
for Ontario Public Service and broader public-sector compensation, which would include a
costing of the full compensation package, including benefits, pensions and moving through
“grids” with seniority.
In Chapter 19, Liability Management, we provide a detailed discussion and our
recommendations for public-sector pensions.
Appropriately Distributing Accountability
As we hope this paper makes clear, labour relations is about balance. Public-sector
employees and employers have responsibilities to each other, to the government and to the
citizens of Ontario. As such, public-sector employees and employers, at all levels, must be
held to account.
Recommendation 15-13: Ensure that leaders in the Ontario Public Service and broader
public sector are held to account and that they are adequately compensated and encouraged
through incentives to lead and excel.
This recommendation should apply to both the OPS and the BPS — but the OPS should lead
by example.
Achieving this vision will require thoroughly competent employees, including managers.
This means they must be adequately compensated and offered appropriate incentives through
the reward structure. The usual temptation to suspend managers’ bonuses during restraint
should be resisted.

Chapter 15: Labour Relations and Compensation
379
Significant bonuses should go to those who are deemed, through their job evaluations,
as exceeding job requirements. If the government wants to apply restraint to overall bonuses
paid, then it could divide the second, and largest, evaluation category. At present, this “fully
effective” category, which includes about 70 per cent of managers, gets an automatic bonus
that goes into their base pay (until they hit the pay ceiling for their category). There could be
two categories within this group, where only a portion get the bonus, or two levels of the bonus
could be established. The third category, those not fully meeting requirements, but judged to
be in that position due to exceptional and likely temporary circumstances, such as being new
to their job, could be denied an automatic bonus amount. Those not meeting requirements
would continue not to get a bonus and would clearly be on notice that dismissal will follow if
their performance does not soon improve. As in any organization, a certain percentage of
employees are likely underperforming and this should be reflected in the distribution of
overall ratings.
This tough-but-fair approach should then be encouraged across the BPS. Ongoing
conversations about appropriate executive compensation and performance incentives have
been initiated in the health sector. Such conversations should be expanded to other sectors.
In general, executives who do not perform should be held to account. Conversely, those who
do perform should be encouraged and retained.
Recommendation 15-14: Ensure that the job descriptions and collective agreement
provisions defining management’s ability to organize work are flexible enough to allow for the
movement of people to ensure that the best people are in the right places at the right time.
The government will need greater flexibility to move people around and to address
underperforming employees and areas that are no longer priorities or where the service could
be provided better by another entity. The government must become more organized in
pursuing the dismissal of public servants significantly failing to meet job requirements. Often
the effort is not made because the process can be long and difficult. But that sends an
inappropriate message that taxpayers’ money will continue to go where little value is
generated. To achieve this, more emphasis must be placed on top-quality management
throughout the BPS, including training, recognition and support of top performers, action with
underperformers (remedial and ultimately dismissal if required) and more emphasis on
performance appraisals and incentives based on ability and performance.
Recommendation 15-15: Provide a better sense of expectations and objectives for each
program, how those fit into the broader public policy thrust, and communicate those
expectations to the broader public sector.

380
Achieving improvements in organizational effectiveness and productivity across the BPS
through a centrally-driven “top-down” approach is highly unlikely to succeed given the sheer
size and complexity of the entire BPS. A government-led approach that is more likely to
achieve some of the desired objectives across BPS industries is one that supports
professionalism, diffusion of best practices and innovation. Government-led reform of
public-sector management and human resources management practices (including labour
relations and collective bargaining) requires a comprehensive strategy that:
Sets out common global objectives to be achieved across organizations, including an
expectation of sustainable outcomes (without necessarily being specific);
Supports the development of objectives, and strategies to achieve those objectives, that
are more specific to organizations/sectors with unique requirements; and
Requires that organizations develop metrics/benchmarks to measure progress.
A Broad Vision
The government should clearly set out the objectives and context for labour relations in a
public document, and summarize these objectives in subsequent opportunities. It should
signal, in the most respectful fashion, the strong intention to achieve low or no cost increases
for total compensation across the BPS (defined broadly to include not only wages but also
work conditions, flexibility, benefits, and so on, so that potential wage increases could be offset
by other aspects of the agreement) and productivity increases. Such a document will provide
the opportunity to seek labour co-operation in these efforts; will put government in the best
possible position to achieve the desired outcomes; and is necessary should bargaining not
ultimately produce the desired results.
Many public-sector workers have agreed to contracts that include a moderation of
compensation increases. Non-bargaining employees have had some moderation legislatively
imposed. However, some large employee groups are just now entering into bargaining rounds
in which they will be asked to make trade-offs.
Given the high percentage of spending on health and education, it is appropriate that
employees in these sectors do their part. The stakes are high. The government will need to
work collaboratively and co-operatively with BPS employers and bargaining agents to reach
compromises that recognize fiscal reality. The government may have to take and maintain
hard positions in the face of disagreement and disruption; however, all parties should have
a shared focus on results.

Chapter 15: Labour Relations and Compensation
381
It is also important for the government and its BPS partners to realize that moderation in
compensation will be difficult to maintain over the long term. A broad vision for labour relations
must recognize this and plan for the future. Wages must be moderated in the near term, but it
will be transformation and productivity increases that ultimately allow the government to
provide sustainable services into the future.

382

Chapter 16: Operating and Back-Office Expenditures
383
Chapter 16: Operating and Back-Office Expenditures
Ontario Public Service (OPS) operating expenditures account for about $10 billion in annual
spending.1 In the OPS, operating and back-office expenditures include information technology,
human resource management, financial services, procurement, transportation,
accommodations and facilities management, legal services, communications and business
planning. These expenditures support and assist public departments to deliver on policy and
program development and in the delivery of services.
Governments everywhere face challenges to improve public services while containing
expenditure growth. Part of the Commission’s mandate is to recommend ways to improve
value for money in all government activities by focusing on improved outcomes for programs
and services within available resources. The recommendations in this chapter are intended to
achieve fiscal efficiencies in operating and back-office expenditures without compromising
service delivery. In most cases, they will improve it.
Context
Business operations continue to change rapidly for the public sector. Variables such as
economic trends, rapid changes in technology, increasing integration into a global system,
and increased accountability and transparency for public institutions have significant
operational impact on the public sector. The OPS and broader public sector (BPS) must keep
pace with this rapid change to provide services as effectively and efficiently as possible.
The biggest component of OPS operating expenditures consists of wages and salaries, which
account for 48 per cent of the $10 billion spent.2 Another 26 per cent goes to the provision of
services and 20 per cent to employee benefits. Transportation, communication and supplies
account for the remaining 6 per cent. Similar to program areas, labour costs are the primary
fiscal driver.
1 Public Accounts of Ontario, 2010–11 — Includes total salary and wages, employee pension and benefits, transportation and
communications, services and supplies for unconsolidated expenses. 2 This figure does not represent the full costs of labour to the province or taxpayers. A significant portion of labour costs are embedded in
program spending numbers for ministries. We estimate that labour costs amount to about half of all program spending.

384
Employee Benefits
20%
Services26%
Salaries & Wages48%
Supplies4%
Transportation and
Communications2%
CHART 16.1 Ontario Public Service Operating Expenses, 2010–11
Source: Ontario Ministry of Finance.
In addition to the operating expenditures outlined in Chart 16.1, the Ontario government
funded $109 billion in transfer payments in 2010–11. Of this, 45 per cent went to BPS
organizations such as Local Health Integration Networks (including hospitals), schools,
colleges and universities.3 The remaining 55 per cent includes transfers to individuals,
municipalities4 and other organization such as agencies, boards and commissions (typically
known as the ABCs).
Implicitly, a portion of the annual transfer payments made by the Ontario government is
directed to operating and back-office expenditures, though this portion varies by recipient.
Since a significant portion of labour costs is embedded in program spending, the figure of
$10 billion does not represent the full cost of labour to the province or taxpayers.
We estimate that labour costs amount to about half of all program spending.
3 Local Health Integration Networks and hospitals are discussed in greater detail in Chapters 5. Schools are discussed in Chapter 6,
while colleges and universities are the focus of Chapter 7. 4 Municipalities are discussed in detail in Chapter 20.

Chapter 16: Operating and Back-Office Expenditures
385
CHART 16.2 Ontario Public Service Operating Expensesand Net Expenses as Percentage of Total Government Spending, 2003–11
Salaries and Wages
Employee BenefitsTransportation and
Communications
Services
Supplies
0.0
2.0
4.0
6.0
8.0
10.0
12.0
2003–04 2004–05 2005–06 2006–07 2007–08 2008–09 2009–10 2010–11
0.0
2.0
4.0
6.0
8.0
10.0
12.0
“Net” Operating Expenses as Per Cent of Total Government SpendingPer Cent$ Billions
Source: Ontario Ministry of Finance.
Chart 16.2 provides an overview of OPS operating expenditures over time and their relative
portion of total government spending. As a percentage of total government spending,
operating expenditures have decreased to less than 8 per cent in 2010–11, down from a
historic high of over 10 per cent. However, total expenditures in this category have increased
to over $10 billion as of 2010–11. Efficiencies may have been found through the creation of
more streamlined processes, lowered administrative costs, better use of technology, and
ongoing cost-avoidance and cost-reduction initiatives, but the Commission has been unable to
quantify this through our research. Our challenge is to bend down the cost curve while driving
for greater value-for-money outcomes, focusing on client service and ensuring accountability
to taxpayers.

386
The Challenge
The Ontario government faces the twin challenges of creating the best public service in the
world under the constraints of reaching fiscal balance by 2017–18. We have not placed an
annual growth target on operating and back-office expenditures because of their diffusion
through other program areas. However, just like program areas, back-office and operating
expenditures must transform to find cost efficiencies. That effort will require innovative ideas
and new ways to deliver on government priorities. This will include letting service delivery
outcomes adjust the size of the civil service; considering alternative service delivery where
value for money can be enhanced without compromising quality or access; and effectively
managing public service delivery by balancing the need for accountability with governance that
ensures the efficient and effective delivery of outcomes.
The objective of this chapter is to envision how Ontario government and BPS programs and
service delivery can achieve the best possible outcomes with their available resources.
The Commission recommends ways to transform and find cost efficiencies in areas such as
front-line service delivery, arm’s-length operations, regulatory services, information technology
practices and transfer payments. Achieving a sustainable fiscal environment will require
government to focus on future investment, as opposed to that which serves the status quo.

Chapter 16: Operating and Back-Office Expenditures
387
ServiceOntario Transformation
ServiceOntario was originally given a mandate in 2006 to become the provincial government’s
public-facing delivery organization, with responsibility for delivering information and high-
volume routine transactions, to individuals and businesses. ServiceOntario operates nearly
300 locations that provide the public with such services as health card and driver’s licence
renewal. ServiceOntario is estimated to have reduced costs per transaction for driver, vehicle
and health card services by about 7.6 per cent. It now provides innovations such as online
service delivery, kiosk services, cross-government services, service guarantees and service
consolidation, establishing ServiceOntario as a leader in client-focused public services.
Looking ahead, the Commission believes it will be important to continue this success and
broaden the mandate of the organization to reduce overall expenditures, increase productivity
and improve service delivery to the public.
A. Expansion of ServiceOntario Services
Recommendation 16-1: Expand the services ServiceOntario delivers. This includes pursuing
additional partnerships for service delivery within the Ontario Public Service, and furthering
service delivery partnerships with municipal and federal levels of government.
A crucial part of the expansion of ServiceOntario is the growth of services both horizontally
(i.e., across provincial ministries) and vertically (i.e., in conjunction with federal and municipal
services). This one-stop interface is more productive for clients and efficient for government.
The efficiencies gained by integrating health card and driver’s licence renewal to one window,
for example, could be replicated by migrating additional transactions such as tax collection,
employment training and benefit administration to ServiceOntario.
For an example of the scale of just one site of possible integration, in 2010–11 Ontario
provided citizens with nearly $18 billion in benefits through 37 income-based programs.
Some of these programs were provided through 163 Ontario Works offices. ServiceOntario
could deliver these services in a more integrated, seamless, timely and ultimately more cost-
efficient manner.
The government should pursue additional partnerships within the OPS, such as transferring its
call and Internet-based enquiries on employment standards and occupational health and
safety from the Ministry of Labour to ServiceOntario. Expanding current ServiceOntario-
managed databases to occupational health and safety inspectors would also permit more
efficient management of enforcement activities.

388
Further steps should be taken to advance partnering with municipal and federal services —
efficiencies can be found by working collaboratively with other levels of government. For
example, ServiceOntario in Ottawa co-locates with the City of Ottawa and Service Canada to
provide services from one location, therefore improving the client experience. Additionally, the
new BizPal account (which allows Ontario businesses to manage multiple government
requirements from a single account) allows 127 Ontario municipalities (such as Kingston,
Timmins, Brampton and Sudbury) to partner with ServiceOntario and become more efficient in
issuing business permits and licensing. The creation of more such hubs, with their critical
mass, would make it easier to provide services in both official languages. Such synergies in
service delivery will improve customer experience and capitalize on economies of scale.
B. Improving how ServiceOntario Delivers its Services
How ServiceOntario delivers its services is just as important as the kinds of services it
delivers. Three principles — a focus on the client, efficiency gains and accountability —
should drive ServiceOntario’s delivery methods. This suggests a variety of changes, ranging
from the delivery of services through new or alternate platforms, all the way to partnerships
with the private sector, as long as accountability and a focus on the client are not
compromised by the transformation.
Recommendation 16-2: The government should direct clients to more convenient and less
expensive channels, such as online service delivery for birth registration.
Capital investment in new technology will play an important role in this transformation. Where
possible, services should be shifted to the least expensive platforms available, resulting in
savings for the government, a more efficient service experience for the client and a positive
environmental impact through digitized services (i.e., digital rather than paper records). As a
consequence, the government should stop delivering services in person if it can do so by
telephone or through the Internet. As long as the move does not compromise service delivery
— such as the provision of service in both official languages — the government should use the
lowest-cost platforms.
An example of shifting consumers towards more convenient and less expensive channels is
the provision of Vehicle Validation Stickers (Val Tag). ServiceOntario processed about
6.6 million validation stickers in 2010, at a cost of $18.4 million. Vehicles need not receive and
display a new sticker each year; instead, their registration could be logged in an electronic
database. Other jurisdictions, such as Quebec, have successfully moved away from vehicle
licensing stickers and found that technology-based enforcement (like licence-plate scanning)
is far more effective.
Recommendation 16-3: ServiceOntario should optimize current virtual processes.

Chapter 16: Operating and Back-Office Expenditures
389
As an example, Ontario health cards are now renewed every five years. Extending that
renewal cycle to seven or 10 years could avoid significant costs without compromising
security. Expanded electronic infrastructure might also lead to additional revenue through bulk
data sales; it is also more compatible with transparency goals, such as “open government”
initiatives. Moving from paper to digital records can save time, is environmentally friendly, and
results in higher-quality services.
C. Investment in Growth
Recommendation 16-4: The government needs to increase ServiceOntario’s current annual
$2 million capital budget.
This shift would allow ServiceOntario to make the necessary changes to more effectively
deliver its service. As ServiceOntario expands, a small capital budget increasingly limits its
ability to secure efficiency gains, particularly where investment in new technology is
necessary for additional savings in the future. Most capital, in particular information
technology, is antiquated and denies the possibility of automation and amalgamations of
information systems.
Recommendation 16-5: Savings from efficiency gains in ServiceOntario operations should be
used to generate a fiscal dividend.
ServiceOntario has generated efficiency gains on a number of fronts, and our proposed
recommendations are designed to create more. To date, most of these efficiency gains have
been put towards service improvements. In the current fiscal context, savings from further
efficiency gains should be used to generate a fiscal dividend and make ServiceOntario an
important contributor to fiscal sustainability. Further gains must come from capital, but there
could — and likely will — be separate sources.
Recommendation 16-6: Where possible, private-sector participation should be used to move
ServiceOntario further towards a full cost recovery model.
A significant opportunity exists for ServiceOntario to find new capital and expand services by
leveraging private-sector investment and participation through competition. Partnerships with
the private sector can provide better value for taxpayer money, as private-sector investments
and expertise can drive expansion while still delivering a fiscal dividend. In these cases,
private-sector delivery must meet the standards expected of public service delivery, such as
the provision of service in both official languages.

390
Teranet’s agreement with the Ontario government is an example of a public-private
partnership in public service delivery that modernized the way customers conduct electronic
transactions in real property, title and writ searches, and registrations. Since the introduction of
electronic registration in 1999, over 15.3 million documents have been registered
electronically. Additional private-sector partnerships that improve public service delivery and
quality need to be sought and attained.
Review Existing Agency Mandates
Ontario has about 630 agencies, defined as entities to which the government makes at least
one appointment. Agencies fall into one of two broad categories: classified and non-classified.
There are about 258 classified agencies, which are generally constituted by a statute,
a regulation under existing statute or an Order in Council, and to which the government makes
the majority of appointments. These include a wide variety of bodies such as commissions,
councils, authorities, foundations, trusts and boards.5 There are also over 300 non-classified
agencies that are excluded from the financial and administrative requirements of the Ontario
government but to which the government makes at least one representative appointment.
The mandate of Ontario’s agencies is diverse and complex. Agencies can perform a variety of
roles from the provision of technical advice and expertise to quasi-judicial decisions that are
independent of direct political involvement. Agencies can also operate an enterprise using
specialized expertise or capabilities not found in government ministries. Owing to their very
diverse role, they also vary widely in size, from the Workplace Safety and Insurance Board
(WSIB) to the Ontario Geographic Names Board.
The role of agencies has been the subject of several reviews. The governance framework and
accountability mechanisms of classified operational agencies were reviewed in the December
2010 “Report of the Special Advisor on Agencies” to the Minister of Government Services.
The report contained a number of recommendations, including a plan to centralize and expand
within one of the ministries full responsibility for all aspects of corporate oversight and
governance support for agencies.6 However, there has yet to be a more extensive review of all
agencies to determine if their mandates are still relevant and whether overall efficiencies can
be achieved in the government’s use of these entities.
Recommendation 16-7: The government should review existing agency mandates and
functions to determine if greater efficiencies could be achieved through rationalization or
consolidation of programs, delivery through existing ministry resources, or the outright
elimination of functions. 5 Often they are referred to as the ABCs (agencies, boards and commissions). Classified agencies are subject to the Agency and
Establishment and Accountability Directive, which is the most significant accountability instrument of government. 6 For more information, see p. 34 of the “Report of the Special Advisor on Agencies,” by Rita Burak.

Chapter 16: Operating and Back-Office Expenditures
391
Expand the Use of Delegated Administrative Authorities to Deliver Regulatory Services
Similar to the agencies model used by government, Delegated Administrative Authorities
(DAA) have been used to deliver a number of regulatory services since their inception in the
mid-1990s. Under the DAA model, legislation is enacted that establishes an accountability and
governance framework between a ministry and a private not-for-profit corporation, which then
administers legislation on behalf of the government. Under the framework of the DAA model:
The legislative assembly retains overall accountability and control over what is set out
in the enabling legislation, and the government retains overall accountability and
control over what is set out in the regulations;
The minister monitors, and remains accountable to the legislative assembly for,
the overall performance of the DAA. The government approves rules covering such
matters as the composition of the board of directors, fee-setting process and
conflict of interest. It also appoints a minority of members to an independent
board; and
The DAA assumes responsibility for all aspects of day-to-day decision-making and
regulatory service delivery, including administering licences or registrations; handling
complaints; conducting inspections, investigations and other enforcement activities;
disciplining the conduct of licensees or registrants; enhancing industry professionalism;
providing consumer awareness and industry education activities; and appointing a
majority of board members.

392
The Delegated Administrative Authority Review found that the DAAs are working effectively
and efficiently as regulators of public safety and consumer protection.7 Delegated
Administrative Authorities had the following benefits:
Reduced costs to government, because regulatory services are funded through fees
collected from industry;
Reduced size of government as service delivery was transferred to an external,
not-for-profit service provider;
Improved regulatory outcomes, as existing DAAs achieved significant gains across a
number of measures, including increases in enforcement activities and decreases in
incidents, injuries and fatalities;
Improved efficiencies. As independent operations responsible for their own risk
management and financial decisions, DAAs are well positioned to make efficient
risk-based decisions on resource allocations;
Government oversight is retained, as the overseeing ministry uses a number of
accountability mechanisms, including administrative agreements, business plans and
regular reporting on performance; and
Increased industry engagement through participation on boards and advisory
committees, which allow regulated industries to directly voice their views.
A DAA is funded by industry, not taxpayers. It is self-financing through fees collected from
regulated businesses and, in some instances, licensed practitioners. A DAA is responsible for
setting its fees, under a process agreed to by the minister.8
Recommendation 16-8: Where there is an existing non-tax revenue stream or where such a
revenue stream can be created, strong consideration should be given to transferring or
establishing responsibility for direct delivery to an arm’s-length, not-for-profit corporation,
under the Delegated Administrative Authorities or similar model.
The Ontario government currently delivers a number of regulatory programs directly, covering
a broad range of sectors and serving a number of public interests, including public safety,
worker safety, environmental protection and consumer protection. In a time of fiscal constraint,
there is a risk of service erosion as regulatory ministries seek to reduce costs. It is important to
explore different forms of service delivery through arm’s-length bodies.
7 Elaine Todres and Associates, “Delegated Administrative Authority Review,” May 2009. 8 Currently, the Ministry of Consumer Services is responsible for overseeing eight authorities, boards and corporations that operate under the
DAA or similar model: Ontario Motor Vehicle Industry Council (Motor Vehicle Dealers and Salespersons); Real Estate Council of Ontario (Real Estate Salespersons and Brokers); Travel Industry Council of Ontario (Travel Retailers and Wholesalers); Technical Standards and Safety Authority (Technical Standards and Safety); Electrical Safety Authority (Electrical Safety); Vintners Quality Alliance of Ontario (Ontario VQA wines); Board of Funeral Services; and TARION (New Home Warranty Program). The Ontario Seniors’ Secretariat is currently implementing a new administrative authority, the Retirement Homes Regulatory Authority, established under the Retirement Homes Act.

Chapter 16: Operating and Back-Office Expenditures
393
Examples of regulatory services now delivered from within government that should be
examined include:
Motor Vehicle Inspection Station oversight;
Clean Air Certification (Drive Clean);
Commercial Vehicle Safety Enforcement;
Private Career Colleges9; and
Private Schools.
In considering whether to create new non-tax revenue streams to finance additional DAAs,
it should be noted that, under Ontario’s new competitive corporate tax environment,
industry may now have greater capacity to take on costs of service delivery currently borne
by taxpayers.
Recommendation 16-9: Consideration should be given to rationalizing and consolidating
programs that regulate inter-related sectors or that could otherwise gain efficiencies from
greater integration.
Examples of regulatory programs that should be examined for potential efficiency and
effectiveness improvements through consolidation include regulatory programs related to
technical aspects of residential and commercial construction as well as consumer
protection programs.
9 For further discussion, see Chapter 7, Post-Secondary Education.

394
Use Alternative Service Delivery Options for Information and Information Technology Functions
While less visible in the public’s eye than service delivery, information and information
technology (I&IT) functions form the technological backbone of government operations.
These functions include services such as a help desk, local and wide area network
management, mainframe operations, web hosting, and the development of applications that
can advance the government’s business vision and provide flexible solutions to IT problems
faced by all organizations.
Previously, there were separate I&IT infrastructures developed by over 20 ministries. In the
late 1990s, however, the government combined this hodgepodge of IT solutions into eight
ministry clusters and one corporate cluster. Further efficiency and better value for money can
be found by eliminating redundant services and centralizing common functions.
Recommendation 16-10: The government should shift its service delivery of information and
information technology (I&IT) from in-house to external sources, where feasible.
The government’s existing I&IT infrastructure already uses a blended approach of service
delivery made up of both in-house and external service delivery that includes both small and
large arrangements with vendors. This blended approach typically reflected decisions to keep
certain functions in-house, which retains the I&IT expertise that comes with being a
knowledgeable owner. In a constrained fiscal environment, however, outsourced contracts
may make the difference between the continuation and the end of some services.
Blended approaches to service delivery have been successfully adopted by British Columbia,
Alberta and Saskatchewan. They have also been used broadly at the national level in the
United Kingdom. The difference in outsourcing I&IT services is a choice of scope.
Most jurisdictions explicitly engineer a solution to remain a knowledgeable owner in some
areas, so policy, standards development and strategic/operational planning normally
remain in-house.
In the current fiscal environment, the Commission believes that government IT service delivery
should be driven by considerations of relative value-for-money and effectiveness calculations.
Simply put, governments cannot afford to remain the only centres of expertise when it comes
to IT service delivery if more cost-effective options are available.

Chapter 16: Operating and Back-Office Expenditures
395
Balance the Requirements of Accountability and Efficiency for Government Operations
Accountability is an essential aspect of government operations, but we often treat that goal as
an absolute good. Taxpayers expect excellent public-sector management as well as open and
transparent procurement practices. However, an exclusive focus on rigorous financial
reporting and compliance as the measure of successful management requires significant
investments of time, energy and resources. At some point, this investment is subject to
diminishing returns.
While acknowledging the importance of transparency and prudent use of taxpayers’ money,
the implicit costs of accountability measures should be reviewed as well. The Commission has
found that little consideration has been given to the appropriate balance between containing
risk and the effort and expense diverted to compliance with rules and regulations. The impact
of inefficient rules in this regard go well beyond the OPS, and extend throughout the BPS to
include hospitals, post-secondary education, elementary and secondary schools, and
municipalities. The added cost to the government — and thus by extension to the public,
private and non-profit sectors in ensuring compliance — should be considered in gauging the
appropriate response to the risk of waste or fraud in operations.
The government should shift to measuring outcomes rather than inputs and process,
and should take a risk-based approach to accountability. In trying to balance the goals of
accountability and efficiency, the government may well find that there are opportunities both to
streamline administration and ensure accountability in the OPS, BPS, private sector and
non-profit sector.10
Recommendation 16-11: The government should ask the Ontario Auditor General to help find
an appropriate balance between ensuring accountability and continuing oversight of
compliance with rules and regulations.
Recommendation 16-12: At a minimum, the government should allow principles of efficiency
to drive accountability programs, such as switching from individually tracked expenses to a
per diem for civil servants and consultants, as is done by the federal government.
10 The non-profit sector is further discussed in Chapter 8, Social Programs.

396
Expanding Shared Services to the Broader Public Sector
Cost Efficiencies through the Expansion of Shared Services To keep pace with the rising expectations of citizens for high-quality and cost-effective public
services, the OPS introduced shared back-office services in the late 1990s. Among the
services consolidated were back-office functions (such as payroll, financial transactions,
procurement, collections and insurance) and common administrative services (such as
printing, mail, translation and asset management) into one integrated and specialized
organization. While this is a good example of how Ontario has transformed the operations of
the OPS, it is just the tip of the iceberg in terms of cost-saving practices that could be
extended further to the BPS.
Recommendation 16-13: Selected shared services should be expanded to agencies, boards
and commissions (ABCs) and the broader public sector.
This would include I&IT consolidation, supply chain management, back-office functions and
centralized maintenance. Given that the introduction of shared services produced over
$900 million in savings across the OPS, the magnitude of potential savings in the BPS is
substantial.
The Commission’s recommendations address four main areas where shared services could be
expanded to the BPS: I&IT transformation, supply chains, back-office consolidation and
centralized maintenance. Other chapters in this report also discuss the importance of shared
services and back-office efficiencies.11
11 For more on sector-specific approaches, please see Chapter 5, Health, Chapter 6, Elementary and Secondary Education, and Chapter 8,
Social Programs.
Chapter 16: Operating and Back-Office Expenditures
397
I&IT Transformation
Information and information technology (I&IT) is a business enabler, and it drives service
delivery productivity. In 2010–11, the OPS spent about $987 million on I&IT. This includes IT
infrastructure such as networks, telecom, desktops, data centres and servers, as well as
information and data management, IT policy and governance structures. Significant leaps
have been made in I&IT consolidation, integration and rationalization in the past 10 years.
Recommendation 16-14: The government should consolidate information and information
technology (I&IT) services throughout the broader public sector.
Infrastructure consolidations within the OPS resulted in a permanent reduction of $100 million
in costs annually.12 Further efficiencies can be found by pushing these efficiencies out to the
BPS in the following services:
Consolidate data network environments by leveraging existing network services to
create one provider;
Consolidate email, service desks, desktops and mainframes;
Reduce data centres by identifying consolidation opportunities; and
Consolidate licensing agreements.
12 Public Accounts.

398
Supply Chains
Recommendation 16-15: Significant savings and efficiencies can be achieved by further
co-ordinating existing horizontal supply chains across the broader public sector.
A formal mandated framework would help. This would further reinforce key principles across
the BPS such as value for money, specialization and differentiation, and accountability.
Implementation of this recommendation should be phased in over three to five years to give
the parties time to explore provincial, regional and sector-specific opportunities.
A shared service delivery model that is applied to collaborative purchasing, standardization
of products and processes and back-office consolidation would further exploit economies of
scale throughout the BPS. Within sectors, it would reduce administrative burdens, increase
co-operation among sector partners, and encourage better performance management
and measurement.
For example, a single hospital shared service organization (SSO) offering consolidated
procurement and logistics to 11 hospitals in the Greater Toronto Area has saved $52 million
cumulatively over five years and now generates $14 million in annual savings for its
member hospitals.
Collaborative procurement practices across the BPS are now done on a voluntary basis.
A standardized framework would enable the BPS to take advantage of its immense purchasing
power and accelerate future savings and efficiencies.
A significant supply chain transformation would require medium- to long-term planning and
investment in change management. To generate savings and efficiencies through transformed
business practices, BPS organizations will need to establish a culture of collaboration,
standardization and performance measurement.

Chapter 16: Operating and Back-Office Expenditures
399
Back-Office Consolidation
Back-office consolidation improves operational performance by replacing fragmented and
duplicated systems with specialized and differentiated ones. Human resource (HR)
management is invisible to the public but essential to the operation of public enterprises.
Recommendation 16-16: The province should take a direct leadership role in using core
provincial infrastructure and expertise to foster shared services across the broader public
sector. Significant economies of scale can be created through common shared services
foundations, applications, resources and expertise.
Back-office consolidation in the BPS should include the centralization of:
HR transactional services, such as payroll;
Financial transactions, such as accounts payable and accounts receivable;
Collections;
Forms, printing and distribution;
Risk management and insurance services;
High-volume mail services, such as mail-outs; and
Contact centre services.
Centralized Maintenance
Recommendation 16-17: Expand consolidation of maintenance and plant management
practices already established in the Ontario Public Service into the broader public sector to
create efficiencies.
Given the Ontario Realty Corporation’s merger with Infrastructure Ontario, experience in
property management could be extended to the BPS.

400
Create Efficiencies in the Administration of Transfer Payment and Grant Programs
Transfer Payment and Grant Programs
Transfer payment and grant programs in OPS ministries have tended to develop in relative
isolation and are thus primed to deliver centralized efficiencies. By their nature, transfer
payments and grant systems support a wide variety of agencies, programs and stakeholders.
To list just a few examples, they support granting agencies such as the Ontario Arts Council,
Ontario Media Development Corporation and Ontario Trillium Foundation, as well as highly
specialized programs such as support for tourism development; operating funding for public
libraries, museums and heritage organizations; project funding for arts and culture
organizations; and support for small businesses.
Perhaps because these programs are so specialized, there has been little development of a
formal “community of practice” through horizontal integration of administrative services. As a
result, the government has failed to reap potential efficiencies in program administration that
could also improve customer service. Currently, many organizations are funded by multiple
ministries, but the government has no easy way to assess the universe of funded
organizations as a whole. Likewise, recipient organizations have expressed frustration at
having to deal with multiple requirements.
To address these issues, the Commission makes several recommendations that would
centralize operations common to transfer payment and grant programs and, it is hoped,
improve client experience, value-for-money outcomes and program efficiency.
Recommendation 16-18: The Ontario Public Service should develop an integrated transfer
payment operation centre and an enterprise grant management system.
A joint project by the Ministry of Tourism, Culture and Sport and Ministry of Citizenship and
Immigration resulted in the development of the Enterprise Grants Management System
(EGMS). Further efficiency and value-for-money gains would be achieved by expanding this
platform to the OPS. The expansion would create efficiencies in program administration as
well as lower per unit ministry maintenance costs.
Recommendation 16-19: Consolidate back-office operations for grant programs or transfer
payments with identical recipients.

Chapter 16: Operating and Back-Office Expenditures
401
Under the integration of a common management system, ministries should also be able to
gain efficiencies through the identification and establishment of common administrative
groups, forms production and the design and use of tracking and forecasting databases.
For example, a number of programs in the Ministry of Economic Development and Innovation
support the business development of Ontario’s brewery and vintners sector; this sector is also
recipient of parallel programs by the Ontario Ministry of Agriculture, Food and Rural Affairs.

402

Chapter 17: Government Business Enterprises
403
Chapter 17: Government Business Enterprises
Ontario’s Government Business Enterprises
The government of Ontario owns four government business enterprises (GBEs), as outlined in
the box below, each of which returns significant revenues to the province. Government
business enterprises are government organizations that:1
Are separate legal entities with the power to contract in their own name;
Have the financial and operating authority to carry on a business;
Are principally focused on the selling of goods and services to individuals and
non-government organizations; and
Are able to maintain their operations and meet their obligations through revenues
generated outside the government reporting entity.
Government Business Enterprise Overview
Liquor Control Board of Ontario (LCBO)
The LCBO is a non-share, capital Crown corporation under the Liquor Control Act, reporting to the Ministry of Finance. The LCBO is responsible for regulating the importation, distribution and sale of alcohol in Ontario. The mission of the LCBO is to be a “socially responsible, performance-driven, innovative and profitable retailer.”2 The LCBO is governed by an 11-member board of directors, appointed by the lieutenant governor-in-council, on the recommendation of the Premier and Minister of Finance.
As at Mar. 31, 2011, the LCBO had 611 retail stores and 216 agency stores3 across Ontario.
Ontario Lottery and Gaming Corporation (OLG)
The OLG is a non-share capital Crown corporation established on Apr. 1, 2000, by the Ontario Lottery and Gaming Corporation Act. The OLG’s mandate is to enhance economic development in Ontario, generate revenues for the province, and promote responsible gaming. It is governed by a 12-member board that reports to the Minister of Finance.
The OLG is responsible for the sales of lottery products at approximately 10,000 retail locations, and 27 gaming sites that include 17 slot facilities at racetracks, five casinos and the Great Blue Heron Slot Machine Facility, and four resort casinos (including Caesars Windsor, Casino Rama, Casino Niagara and Niagara Fallsview Casino Resort), across Ontario. The OLG has operating agreements with the private sector for the four resort casinos and the Great Blue Heron Slot Machine Facility.
Continued
1 Downloaded from http://www.fin.gov.on.ca/en/budget/paccts/2011/11_cfs.html#notes. 2 Downloaded from http://www.lcbo.com/aboutlcbo/index.shtml. 3 Agency stores are authorized outlets in existing private-sector stores, such as grocery stores, that sell beer and alcohol in communities
that the LCBO has determined cannot support a regular LCBO store.

404
Ontario Power Generation (OPG)
OPG was incorporated under the Business Corporations Act on Dec. 1, 1998, and the province is OPG’s sole shareholder. OPG reports to the Minister of Energy. OPG assumed the generating assets of the former Ontario Hydro and is now the largest electricity producer in the province. OPG’s generating assets have a fleet capacity of almost 20,000 megawatts (MW), and include two nuclear generating stations (6,606 MW), five thermal generating stations (6,996 MW) and 65 hydroelectric generating stations (6,327 MW). In addition, OPG owns two other nuclear generating stations that are leased out on a long-term basis to Bruce Power LP. The corporation is governed by a 12-member board that reports to the Minister of Energy.
OPG’s large hydroelectric facilities, which include plants located near Niagara Falls and on the St. Lawrence River, as well as its nuclear facilities, are regulated by the Ontario Energy Board (OEB). OPG’s smaller hydroelectric facilities are unregulated and receive market prices for energy produced.
Hydro One
Hydro One was incorporated under the Business Corporations Act on Dec. 1, 1998, and the province is Hydro One’s sole shareholder. Hydro One reports to the Minister of Energy. Hydro One assumed all of the transmission assets, as well as the distribution assets that were not transferred to municipalities from the former Ontario Hydro. Hydro One owns 97 per cent of transmission in Ontario, and has four subsidiaries that operate in electricity transmission, distribution and telecommunications. These four subsidiaries include:
• Hydro One Networks, which plans, constructs, operates and maintains Hydro One’s transmission and distribution network;
• Hydro One Brampton, which was acquired from the City of Brampton in 2001 and operates a separate unit;
• Hydro One Remote Communities, which operates generation and distribution assets in 19 off-grid communities in northern Ontario; and
• Hydro One Telecom, which provides telecommunication services, including commercial and retail services.
The transmission and distribution businesses of Hydro One are rate-regulated by the OEB.

Chapter 17: Government Business Enterprises
405
Ontario’s four GBEs play a critical role in the province’s fiscal condition. In 2010–11, the four
combined to produce net income of $4.6 billion, with LCBO, OLG, OPG and Hydro One
contributing $1.6 billion, $2.0 billion, $0.4 billion and $0.6 billion respectively. Since 2006,
these four organizations have provided an average combined net income of $4.3 billion
annually (see Chart 17.1).
0.0
0.5
1.0
1.5
2.0
2.5
3.0
3.5
4.0
4.5
5.0
2006 2007 2008 2009 2010 2011
$ Billions
CHART 17.1 GBE Net Income
Source: Public Accounts of Ontario.
The combined net assets of the four GBEs amounted to $17.6 billion at the end of last fiscal
year, about 13 per cent of the government’s total assets. With $8.6 billion in net assets, OPG
makes up the largest share of assets, followed by Hydro One ($6.2 billion), OLG ($2.4 billion)
and LCBO ($0.4 billion).
The GBEs also contribute to the fiscal plan in other ways. The OLG is required under
legislation to remit to the province a “win contribution” of 20 per cent of gaming revenue from
the privately operated Resort Casinos and Great Blue Heron Slot Machine Facility.
Ontario Power Generation and Hydro One provide the province with payments in lieu of taxes
(PILs) that go towards paying down the stranded debt that remains from the restructuring of
the former Ontario Hydro.

406
Creating Additional Value from Ontario’s GBEs
The magnitude of the GBE’s fiscal impact compels us to investigate means of generating
further value from them. In doing so, we look at two distinct approaches: partial or full
divestiture of the business; and improving business efficiencies while retaining full
government ownership.
Asset Transactions
Given their relatively stable net income and strong value, the GBEs may be attractive to
potential private-sector investors. However, because these assets contribute substantial,
ongoing and growing revenues to the province, any potential divestiture would need to
carefully assess the value of any upfront, one-time gains against loss of future revenues.
To compare one-time benefits and ongoing losses, we consider how proceeds from a potential
sale could be deployed. A full divestiture of any or all of the GBEs would result in a lump-sum
payment to the province at the expense of future revenue streams. If proceeds of a sale were
used to pay down provincial debt, Ontario could save on interest costs of up to four per cent,
based on recent bond yields. By comparison, GBEs provide a return on assets (ROA) of at
least eight per cent. Any full divestiture would have to overcome this spread to provide a fiscal
benefit to Ontario.
A second divestiture model is to sell a minority stake in any or all of the GBEs and shift the
management role to a private partner. A partial sale, in the range of 10 to 20 per cent, would
provide the government with an upfront payment to reduce provincial debt load as well as
ongoing interests in the GBEs through its remaining stake. Notionally, such an arrangement
would allow the businesses to act in a more commercial manner, thus increasing the value of
the province’s remaining interest. To make economical sense for Ontario, the partnership
would need to raise the overall returns of the GBEs so that the net income or dividends flowing
to the province, combined with upfront payments, would ultimately provide more value relative
to the status quo. In such a model, further clarity would be needed on the application of federal
income tax rules for new limited partnership models.
In addition to either model, transactions or partnerships could be contemplated to achieve
wider policy objectives and/or structural reform goals. Regardless of the rationale,
a transaction or new partnership model should meet key principles that include:
Appropriate risk transfer;
Leveraging business and/or operating expertise through strategic partnership; and
Leveraging assets or other intangibles through strategic partnership.

Chapter 17: Government Business Enterprises
407
As a condition of any sale, the province would certainly have to consider the sensitive nature
of the lines of business in which the GBEs operate. To ensure that these businesses
continued to operate in a manner consistent with other legitimate policy goals, such as social
responsibility, the government might wish to attach certain conditions or employ careful
regulatory constraints as part of any divestiture. Such conditions would, we expect, be
incorporated in the market’s valuation of the business.
Current circumstances do not appear to offer a convincing value proposition for the province;
even so, the province should not ignore the option of selling its GBEs. Indeed, the opposite
applies. Ontario must be prepared and willing to entertain new approaches that generate
better value out of the GBEs. However, we caution that any action must not be driven by
ideology. Before any sale is executed, there must be overwhelmingly clear evidence that
Ontario would benefit from such an arrangement in the long run.
Recommendation 17-1: Do not partially or fully divest any or all of the province’s government
business enterprises — Ontario Lottery and Gaming Corporation, Liquor Control Board of
Ontario, Ontario Power Generation and Hydro One — unless the net, long-term benefit to
Ontario is considerable and can be clearly demonstrated through comprehensive analysis.
Improving GBE Operations
A second option is to retain full government ownership of the GBEs but improve their
performance. As described above, the GBEs make significant contributions to the province’s
fiscal plan. However, the GBEs may not be achieving their full potential because of operational
inefficiencies and because they are at times required to act in ways that are counter to their
direct commercial interest. In this light, there are opportunities to enhance the GBEs’ value
and the contributions they make by focusing on efficiency opportunities and allowing them to
operate more commercially and focus on their core businesses.
Augmenting asset efficiency and allowing GBEs to operate in a more commercial manner
would contribute to the province’s fiscal position. For example, removing implicit subsidies and
other price-distorting effects would increase transparency for suppliers and customers alike.
Liquor Control Board of Ontario (LCBO)
There may be opportunities to improve LCBO returns, through increased efficiencies and new
business opportunities. The Auditor General of Ontario’s 2011 Annual Report noted that the
LCBO could more effectively use its purchasing power and improve the current markup
structure used to determine retail prices.4
4 Ontario Auditor General, “Auditor’s 2011 Report: LCBO New Product Procurement,” 2011, pp. 186–201.

408
The LCBO has other obligations that reduce profitability. For example, it provides discounted
shipping as well as premium shelf space to support and promote Ontario producers. These
may not represent profit-maximizing strategies, and their policy merits should be balanced
against reduced profitability.
With respect to new business lines, the LCBO may be able to grow its bottom line through
a more aggressive store-expansion program while continuing to promote socially
responsible consumption.
Recommendation 17-2: While continuing to promote socially responsible consumption,
undertake initiatives to enhance the Liquor Control Board of Ontario’s profits, including:
Direct it to use its purchasing power more effectively and improve its markup structure for
setting retail prices;
Continually compare the merits of providing supports to Ontario producers against desired
policy outcomes; and
More aggressively pursue store expansion.
Ontario Lottery and Gaming (OLG)
The OLG provides significant net income to the province, but operational efficiencies could be
explored to improve the company’s margins while continuing to respect social responsibility
and meet its conduct and management requirement for the operation of all lottery schemes.
For example, a number of questionable business practices should, at a minimum, be reviewed
from a value-for-money perspective.
OLG maintains two head offices, one each in Toronto and Sault Ste. Marie;
OLG continues to operate Casino Niagara despite the opening of the permanent and
considerably larger5 Niagara Fallsview Casino Resort in 2004;
The Slots at Racetracks Initiative, which allows slot machines to be co-located at racetrack
facilities only, earmarks a share of revenues generated from slots for racetrack owners and
horse breeders. This amounted to $334 million in 2009–10.6 Municipalities that play host to
a racetrack also receive a share — five per cent of proceeds from the first 450 slot
machines at the facility and two per cent for each machine over that. This totalled
$78 million in 2009–10,7 and
OLG purchases and provides lottery terminals to point-of-sale locations.
5 The gaming floor space and total complex space at Fallsview are twice and nine times, respectively, as large as those at Casino Niagara.
downloaded from http://www.fallsmanagement.com/The_Casinos/index.html 6 Ontario Lottery and Gaming, “2009–10 Annual Report,” 2010. 7 Ontario Auditor General, “Auditor’s 2010 Report: Casino Gaming Regulation,” 2010, pp. 46–63

Chapter 17: Government Business Enterprises
409
Finally, OLG should continue to seek new and innovative ways to deliver gaming in Ontario to
increase its revenues. These include expanding existing business lines, creating new business
lines (as it is doing for Internet gambling), and leveraging further private-sector involvement.
In all such ventures, the OLG must remain mindful of its mandate to promote
responsible gaming.
Recommendation 17-3: Improve the Ontario Lottery and Gaming Corporation’s efficiency
through, at a minimum, the following measures:
Close one of the two head offices;
Close one of the two casinos in Niagara Falls;
Allow slot machine operations at sites that are not co-located with horse racing venues;
and
Stop subsidizing the purchase and provision of lottery terminals to point-of-sale locations
and begin to introduce other points of sale for lotteries.
Recommendation 17-4: Re-evaluate, on a value-for-money basis, the practice of providing a
portion of net slot revenues to the horse racing and breeding industry and municipalities in
order to substantially reduce and better target that support.
Recommendation 17-5: Consider directing the Ontario Lottery and Gaming Corporation to
expand its existing business lines, develop new gaming opportunities and make effective use
of private-sector involvement.
Ontario Power Generation (OPG) and Hydro One
In an effort to reduce short-term cost increases to consumers, the government has
occasionally intervened in both OPG’s and Hydro One’s regulatory rate filings. The result of
such action can effectively decouple electricity rates from costs, providing an implicit subsidy
to ratepayers. It may also put at risk the net incomes of both companies to the potential fiscal
detriment of the province. While stable, effective regulation is required for both companies
given their dominant positions in their respective sectors, intervention that impedes on
standard business practices without a clear, legitimate policy objective should be avoided.

410
Aside from reducing this form of government intervention, there are operational efficiencies
that Hydro One could explore to improve its net income. On the revenue side, Hydro One has
immediate opportunities to increase its top line. Hydro One could consider strategic
partnerships, such as the recently created joint venture between Hydro One, a private partner
and six First Nations, to compete to build a new transmission line in northwestern Ontario.
Continuing to focus on these sorts of opportunities would increase revenues and allow it to
share financial and construction costs with a private-sector partner, while affording
development opportunities to local communities.
In Chapter 12, Infrastructure, Real Estate and Electricity, we recommend that Ontario should
seek to capitalize on its strengths in the energy sector through developing and expanding
export opportunities for its goods and services. A great deal of expertise lies within OPG and
Hydro One; leveraging these firms’ human capital in a strategic fashion could be beneficial to
taxpayers and rate payers alike in the long term.
Recommendation 17-6: The government should avoid intervening in Ontario Power
Generation or Hydro One’s rate filings for the purpose of delaying short-term price increases;
too often this leads to greater costs down the road. When regulations or directives are required
that impinge on normal utility business practices, the policy objectives being sought must
be transparent.
Recommendation 17-7: The government should seek and achieve efficiencies within
the operations of Ontario Power Generation and Hydro One through means such as
strategic partnerships.
Conclusion
The GBEs should examine their operations to find efficiencies. Benchmarking exercises and
operational reviews should support these activities. Opportunities to increase revenues,
augment efficiency and improve margins should also be fully explored.
Recommendation 17-8: Each government business enterprise must continue to build on its
industry’s best practices to improve its operational efficiency. Each should revisit
memorandums of understanding and other agreements to ensure that they reflect commercial
mandates. And each should undergo peer ranking and benchmarking on the basis of financial
and other metrics both to better understand the organization’s relative performance and
find efficiencies.

Chapter 18: Revenue Integrity
411
Chapter 18: Revenue Integrity
A simplified and harmonized tax system with competitive rates is a key component to
improving the investment climate in Ontario and creating jobs. However, the province also
needs to look to enhanced administration and enforcement activities as a way to improve the
integrity of the tax system and build Ontario’s fiscal capacity.
Ontario businesses that employ aggressive tax planning as their competitive advantage must
be challenged. To do this, the province must be as nimble and creative as those that use such
strategies — those that, in effect, take valuable tax dollars away from important public services
such as health care and education.
Enhancing the integrity of the tax administration system also requires a focused pursuit of
those who owe the government money. Improving collections tools and processes will ensure
that money currently owed will be collected and available for those services where they are
most needed.
The overall strategy should cultivate a balance between providing a fair and competitive
environment for businesses, while optimizing compliance with Ontario’s tax laws and taking
action on outstanding debts.
Increasing Compliance
Strengthening the Business Tax Base
Increased globalization is creating new complex business transactions that span the globe.
As businesses become more international and transactions more complex, tax authorities
around the world need to continue to enhance international taxation agreements to avoid
double taxation as well as to avoid tax leakage. The federal government must continue to
ensure that Canada and Ontario obtain their fair share of international taxation revenue.
Within Canada, the federal government and provincial and territorial governments must work
together to ensure a fair allocation of tax revenues across the country. Specifically, both levels
of government need to take additional steps to prevent aggressive tax planning to avoid tax
leakage and ensure a fair allocation of tax revenue across Canada. Particular challenges
to provincial governments include: i) the ability of corporations to eliminate or decrease
payment of provincial corporate income tax through creative mechanisms; and ii) the shifting
of losses across Canada to avoid or reduce taxation in the province where income
was earned.

412
Currently, corporate groups can use complex transactions and federal administrative
concessions to transfer losses among group members and across provincial borders.
Complex transactions can also be used by corporate groups to shift income from a higher-tax
jurisdiction to a lower-tax jurisdiction even though the corporation benefits from public services
in the higher-tax jurisdiction. In addition, corporate groups can use aggressive international tax
planning strategies to shift profits to foreign-based businesses. All of these activities can
unduly reduce provincial tax revenue.
Recommendation 18-1: Work with the federal government to ensure that a fair share of a
company’s worldwide income is allocated to Canada and the provinces.
Recommendation 18-2: Work with the federal government to address aggressive
interprovincial and international tax avoidance activities by:
Undertaking additional data review and research to identify activities of particular concern
to Ontario;
Entering into an agreement with the Canada Revenue Agency to invest resources
in additional compliance efforts; and
Implementing additional reporting requirements that disclose activities that cause income
and losses to be allocated to a province where the underlying economic activity was
minimal or did not occur.
Recommendation 18-3: Collaborate with the federal government and other provinces to
investigate options to tax corporations on a consolidated basis, with the purpose of ensuring
a fair allocation of losses and income across Canada.
By pursuing these steps, Ontario could raise up to $200 million per year when fully phased in.
Underground Economy
The federal and Ontario governments have taken significant steps to reduce the tax burden on
people and businesses. At the same time, there is increasing pressure to fund important public
services that citizens benefit from such as health care and education. The underground
economy creates an unfair tax burden for taxpayers and makes it difficult for legitimate
businesses to remain competitive with those participating in the underground economy.
Addressing the underground economy creates a level playing field for taxpayers and
businesses. It also helps provide greater protection to consumers who may not realize the
risks of participating in the cash economy.

Chapter 18: Revenue Integrity
413
Statistics Canada estimates that the underground economy was about 2.2 per cent of
Canada’s gross domestic product in 2008, or about $36 billion. While the province has
taken action to enhance collections and audits, more can be done to address the
underground economy.
Other jurisdictions have implemented a number of measures that Ontario should consider.
In particular, Quebec has been successful in tackling the underground economy and tax
evasion through action in specific sectors:
Introducing recent legislative changes to broaden penalties for non-compliance, which
include the imposition of prison sentences of up to five years less a day for serious
tax delinquency;
Intensifying tax audits;
Working across government and with industry to address key high-risk sectors such as
construction and products like alcohol and tobacco;
Raising public awareness of the impact of unreported income;
Requiring compliance certificates for businesses wanting to obtain public contracts; and
Requiring that certain establishments provide their customers with a bill produced using
a sales recording module authorized by Revenu Québec.
Recommendation 18-4: Enhance Ontario’s ability to detect and recover revenues from
underground economic activity by linking more databases to reported transactions for
tax purposes.
Working with the Office of the Information and Privacy Commissioner of Ontario to ensure
the protection of privacy, actions would include:
Implementing legislative changes to better enable data sharing (e.g., permit, licensing
and registration information) and database matching across ministries, municipalities
and federal government departments;
Creating a wealth indicator database as done in Quebec;
Expanding reporting requirements for certain financial transactions;1 and
Entering into an underground economy agreement with the federal government to better
share information and invest more resources in co-ordinating and strengthening
compliance efforts to combat the underground economy.
1 For example, Quebec recently introduced a bill to regulate non-bank operators of automatic teller machines, foreign-exchange counters
and money transfer offices, obliging them to obtain a licence and make reports to Quebec’s Autorité des marchés financiers. The goal of this bill is to combat possible tax evasion and money laundering.
414
Recommendation 18-5: Review the adoption of government-authorized sales-recording
modules in certain sectors (e.g., food services) to address “zapper” software (zappers remove
a vendor’s record of sale).
The module would prevent businesses from deleting transactions to reduce taxes (installed
with success in Quebec and parts of Europe).
Recommendation 18-6: Develop a concept of self-certification of electronic point-of-sales
(ePOS) software. The self-certification is based on the principle of tax authorities developing
and publishing a set of requirements for accounting software and ePOS systems.
Recommendation 18-7: Develop a public awareness campaign on the impact of the
underground economy. For example, by using unregistered contractors or contractors who do
not issue receipts, there are risks of not obtaining a warranty for repairs, risks of not being able
to seek legal remedy for poor workmanship, and risks of liability for injuries or damages that
occur on a customer’s premises.
Recommendation 18-8: Create employee deeming provisions where businesses substitute
independent contractors for employees to avoid paying Ontario’s Employer Health Tax.
Recommendation 18-9: Establish a forum to discuss emerging issues and trends in
the underground economy as well as innovations and best practices for addressing them.
The forum should include representatives from various ministries, and federal and municipal
governments as well as industry associations.2
Implementing these and other measures could yield the province more than $500 million
per year when fully phased in.
2 In December 2010, the Ministry of Labour’s Expert Panel on Occupational Health and Safety recommended a provincewide underground
economy strategy.

Chapter 18: Revenue Integrity
415
Uncollected Fines
Recent attention has been brought to the estimated $1 billion in uncollected fines related to the
Provincial Offences Act (POA).3 Collection mechanisms should be improved so that the
estimated $2.5 million unpaid POA fines can be recovered.
Recommendation 18-10: The Ministry of Finance should take the lead by providing
assistance to municipalities in developing policy for the collection of unpaid Provincial
Offences Act fines in the province.
Recommendation 18-11: Use licence and registration suspensions as a tool to facilitate the
collection of Provincial Offences Act fines related to vehicles, including parking, speeding and
automobile insurance violations.
Recommendation 18-12: Allow fines to be added via the property tax roll by adding Provincial
Offences Act fines to the offender’s property tax bill, even if the property is jointly owned.
Recommendation 18-13: Offset tax refunds against unpaid Provincial Offences Act fines.
Centralized and Co-ordinated Collections
A number of ministries with accounts receivables either operate their own independent
collection functions, have those activities performed/delivered by Ontario Shared Services,
or do not perform collections activity beyond internal set-offs. As a result, the delivery of
collections activities in the Ontario Public Service (OPS) is currently fragmented and carried
out by a number of ministries using various methods and technology solutions. Recent reports
by the Auditor General related to the various collection functions across the OPS found
opportunities to improve the efficiency and effectiveness of collections activities and controls
over accounts receivable and overdue accounts.
In the 2011 Ontario Budget, the government proposed to move towards a more co-ordinated
and centralized collections function within the Ministry of Revenue (now the Ministry of
Finance). Consolidating collections activities across the OPS would reduce costs and
duplication, improve tracking and monitoring of overdue accounts, and reduce accounts
receivable to better support the funding of key public services. Other jurisdictions have
moved towards greater consolidation of collection functions to take advantage of economies
of scale, reduce compliance costs for businesses and ensure optimal investment in
technology systems.
3 Ontario Association of Police Services Boards, “Provincial Offences Act: Unpaid Fines, A $Billion Problem,” 2011, p. 5.

416
Recommendation 18-14: Require that recipients of government grants or refundable tax
credits, contracts, loans and loan guarantees are first in good standing with the government in
terms of accounts receivable and have no outstanding taxes due before providing assistance.
Recommendation 18-15: Require that all ministries record Crown debt receivables in the
enterprise financial system so that collection action can be commenced in a timely fashion.
Recommendation 18-16: Proceed with the 2011 Ontario Budget proposals by moving to
rationalize the collection of non-tax revenue between Ontario Shared Services and the Ministry
of Finance with the intent to consolidate, in a staged fashion, all non-tax and tax collection
functions into the Ministry of Finance.
Recommendation 18-17: Develop a legislative framework to provide the Ministry of Finance
with the authority to collect all provincial Crown debts and incorporate more effective
collections tools and mechanisms.
Recommendation 18-18: Develop standard policies and practices across the Ontario Public
Service for collections to ensure the optimum return for dollars spent.
Recommendation 18-19: Work with the Office of the Information and Privacy Commissioner
of Ontario to ensure the protection of privacy in the implementation of these proposals.
Based on early estimates, the consolidation of collections and incorporation of more effective
collection tools would generate more than $250 million per year when fully phased in.
Improving Audit Functions
In addition to improving the overall integrity and fairness of Ontario’s tax system, restoring
fiscal balance will require the best use of administrative tools in the most efficient manner.
This means ensuring that the government can identify activities that pose the greatest
financial risk to focus resources more effectively and generate better results. The Ministry of
Finance has developed a sophisticated risk assessment tool that employs data matching and
data analysis to identify areas of greatest risk. This sophisticated audit risk tool provides
important information to auditors/inspectors on where they should focus their attention.
More targeted and informed enforcement strategies will lead to a system that is more efficient
and responsive.

Chapter 18: Revenue Integrity
417
The Ministry of Finance’s risk assessment tool would provide a valuable resource for
information sharing among ministries by co-ordinating and consolidating government-wide
audits of companies. The Ministry of Finance is in a better position to recover funds on behalf
of the province more efficiently with its risk assessment tool. Having a risk-based approach to
auditing may reduce the number of times per annum a business is audited or inspected by
the government.
Recommendation 18-20: Improve methods for information gathering and sharing across
government, including making greater use of the Regulatory Modernization Act, in order to
identify emerging and current issues to improve responsiveness in a compliance environment.
Recommendation 18-21: Use the Ministry of Finance’s risk assessment technology to better
focus enterprise-wide audit activity on areas where rates of return are highest for the province.
Recommendation 18-22: Implement measures to better co-ordinate and consolidate
government audits of companies within the Ministry of Finance to recover funds on behalf of
the province.
Recommendation 18-23: Develop risk assessment approaches with other jurisdictions to help
address audit issues that cross provincial and international boundaries.
Ontario could raise more than $50 million per year when fully phased in by implementing
these measures.
Non-Tax Revenue
User Fees
In 2011–12, Ontario ministries plan to collect about $1.8 billion in revenues classified as
user fees. There are over 400 types of user fees charged to individuals and businesses
(e.g., drivers’ licences).
Most user fees are approved at a specific rate to recover all or some of the costs of providing
a related service. There is no formal recurring process for changing fees to keep them up to
date. Over time, the fees do not reflect inflation or the costs of providing the related service.
This is one of the reasons revenues in the status quo do not tend to grow as rapidly as the
(nominal) economy. Since 2003, there have been minimal increases to many of the most
prominent user fees.

418
A decision on whether to move forward with user-fee changes to generate additional revenue
is required. Two options to consider are full cost recovery and indexation.
Full Cost Recovery: Over $500 million in additional annual revenue is available if the
government moves forward with full cost recovery on all user fees. Currently, most fees are
not set at a level that results in the recovery of all costs associated with a service provided.
Moving forward with full cost recovery is consistent with the 2009 Auditor General’s Report
on User Fees that recommended the government consider full cost recovery for fees.
However, there are some fees the government may not want to increase for public policy
reasons (e.g., user’s ability to pay, to encourage certain behaviour, etc.).
Indexation: Indexing existing user fees annually by the rate of inflation of two per cent could
result in additional revenues of about $36 million in 2012–13 to $227 million by 2017–18.
Indexation would allow the government to avoid periodic steep fee increases, and better
reflects the cost of providing services. Indexation is consistent with the federal government’s
approach, which recently introduced reforms to regularly adjust fees, and with Quebec and
Nova Scotia, where most fees are indexed to the consumer price index.
Indexation is also consistent with the 2009 Auditor General’s Report on User Fees (which
recommended that the government establish a process for the regular review of fees).
Of course, a blend of the two approaches could provide the best of both worlds.
Recommendation 18-24: Instead of user fees remaining in fixed nominal terms, they should
be updated using a blend of full cost recovery and indexation and be phased in over the next
two years.

Chapter 18: Revenue Integrity
419
Tax Revenue
The Commission’s mandate does not allow us to recommend tax increases. However, we
have noted throughout the report that certain aspects of the tax system work to ensure that
revenues do not tend to grow in sync with the overall economy, defined as nominal GDP.
As such, the Status Quo Scenario features a decline in the tax burden, defined broadly as the
ratio of revenues to nominal GDP.
This, of course, compounds the difficulty of returning to a balanced budget. Allowing the
overall tax burden to decline magnifies the severity of program spending restraint required.
This severity could be alleviated if taxes begin to keep pace with economic activity.
Consistent with our mandate, we have not incorporated any increases in revenues from such
reform into our Preferred Scenario. We simply note for consideration the relatively
straightforward reforms that could be implemented to prevent the overall tax burden from
declining over time.
The main sources of this downward bias in the tax burden are education property taxes,
business education taxes and a number of excise taxes that are levied on the volume of
products sold rather than the value at which they are sold.
Education Taxes
Provincial-Municipal Relationship and Property Tax
A key feature of the provincial-municipal fiscal relationship is the fact that the property tax base
is used to support municipal services and to fund a portion of Ontario’s elementary and
secondary education costs. In 2010, property taxes raised over $23 billion in Ontario, including
over $6.6 billion4 in provincial education property tax revenues. The municipal portion of the
tax raises $16.4 billion, and is the largest single source of revenue for municipalities.
4 All education tax revenue numbers included in this paper exclude the property tax component of the Ontario Energy and Property Tax
Credit, which is netted against education property tax in provincial Budget documents.

420
Education Property Tax,
$6.6B
Municipal Property Tax,
$16.4B
Source: Ontario Ministry of Finance.
CHART 18.1 Property Tax Revenue, 2010
$ Billions
The province has proven to be a good partner in sharing the property tax base. At the time of
Local Services Realignment in 1998, the province transferred $2.5 billion in residential tax
revenue to municipalities. By 2011, the value of the transferred residential education tax
revenue had grown to an estimated $3.1 billion as a result of non-reassessment-related
growth, such as new construction. In addition, the province has adopted a policy to fully offset
reassessment impacts when resetting residential and business education tax rates. This
practice of cutting education tax rates has been positive for municipalities, as it has offset the
impact of municipal tax increases on taxpayers and reduces pressure on municipalities to limit
tax increases. For more details on the provincial-municipal relationship, see Chapter 20,
Intergovernmental Relations.
Property Tax Trends
Since 2000, there has been significant growth in municipal property taxes, which have
increased 70 per cent. However, the growth in education tax revenues has been relatively flat,
averaging only one per cent per year. This occurred over a period when property values more
than doubled as a result of property reassessments.

Chapter 18: Revenue Integrity
421
113
70
10
0
20
40
60
80
100
120
Assessment Municipal Taxes Education Taxes
Source: Ontario Ministry of Finance.
Per Cent
CHART 18.2 Assessment and Tax Growth, 2000–10
The level of education property tax revenues since 2000 has decreased by 10 per cent in real
terms. At the same time, funding for education has increased. These factors have contributed
to a significant decrease in education property tax revenues as a share of education
expenditures, from 44 per cent in 1998–99 to 30 per cent in 2010–11. If the property tax
component of the Ontario Energy and Property Tax Credit had been included, as it is in
provincial reporting of education property tax revenue, the share of education expenditures
funded by education property tax revenues would have been even lower.

422
44
30
0
10
20
30
40
50
1998–99 SY 2010–11 SY
SY = school year.Source: Ontario Ministry of Finance.
Per Cent
CHART 18.3 Education Property Taxes as a Per Cent of Education Expenditures
The decrease in education funding supported by property taxes is primarily the result of a
long-standing provincial policy to fully offset reassessment impacts when resetting business
and residential education tax rates. For example, the residential education tax rate has been
cut in half since 1998. While this has contributed to nominal stability in the property tax base,
in real terms, this practice has reduced provincial education tax revenues available to support
Ontario’s education system.
Selected Historical Residential Education Tax Rates
1998 2008 2011
0.460% 0.264% 0.231%

Chapter 18: Revenue Integrity
423
The current education tax rate-setting practice raises a number of concerns, including the
continued decrease in education tax revenues in real terms. As property tax revenues
decrease as a share of education expenditures, provincial transfers to school boards increase
to offset this decline. Other jurisdictions, such as British Columbia, have recognized the fiscal
challenges associated with this practice, and do not fully offset reassessment impacts when
setting education tax rates. In British Columbia, the business and residential education
property tax rates are reset to increase revenues by an inflationary factor. In fact, tax rate
reductions that allow for some measure of inflationary revenue increase should be considered
in Ontario to maintain a stable level of revenue in real terms.
Business Education Taxes
An additional concern related to education property taxes in Ontario is the wide range of
business education tax (BET) rates across the province. Ideally, a provincial tax rate would
be the same across all regions of the province, similar to the provincial uniform rate for
residential properties.
However, the province continues to set a range of BET rates, which vary across municipalities.
There is no policy rationale for the variation in BET rates other than it being a result of
historical assessment and tax inequities that were in place for many years prior to the province
taking over responsibility for education tax rate setting in 1998.
The variance in BET rates distorts efficient business location decisions and places many
businesses in the province at a disadvantage, therefore having a negative impact on jobs and
the provincial economy overall. These distortions are particularly difficult to justify when there
are large differences between neighbouring municipalities, such as Toronto and the 905
regions. While the tax inequities can be expected to have been capitalized into the value of
properties, it is still important to address these gradually over time.
In fact, in 2007 the province announced a BET reduction plan to address these distortions and
inequities. Under the plan, high BET rates are being reduced to a target rate by 2014, saving
businesses $540 million annually, once fully implemented. The phased-in approach of the BET
reduction plan was designed to minimize potential windfall gains and/or losses associated with
the capitalization of abrupt changes in tax burdens.

424
Since introducing the plan, the province has made major progress in the following areas:
High BET rates have decreased overall, resulting in savings to businesses;
BET rate cuts have been accelerated and fully implemented for northern Ontario
businesses;
Eligible newly constructed properties are immediately taxed at a rate no higher than the
BET target rate, partly addressing distortions for new business location decisions; and
The variance between BET rates has narrowed. For example, in 2007, the highest BET
rate was more than 50 times greater than the lowest rate. By 2012, this will be reduced to
15 times greater. Despite the progress, a considerable gap still exists.
Education tax rate-setting policies and the BET reduction plan have significantly reduced the
education tax revenue available to support education expenditures. Furthermore, the current
BET reduction plan does not address municipalities with low BET rates. By not addressing
low rates, the province will have difficulty addressing distortions and inequities in the education
property tax base. These could be addressed by moving towards a policy of a single
provincewide BET rate for all regions of the province, while also limiting the cost of the
BET reductions.
Recommendation 18-25: Conduct a review of education tax rate-setting policies for
residential and business tax rates to maintain a stable level of education tax revenues in
real terms.
Recommendation 18-26: Continue to implement the business education tax (BET) reduction
plan while considering options for adjusting the plan in order to avoid part or all of the revenue
loss associated with reducing high BET rates by also increasing low BET rates.
Recommendation 18-27: Build on the existing business education tax (BET) reduction plan to
address historical BET rate inequities and distortions by gradually implementing a single
uniform BET rate.
Implementing these policies could ensure a more equitable business tax system, while
providing a significant increase in revenues, up to just over $1 billion by 2017–18.
Contraband Tobacco
The Ministry of Finance is responsible for administration of the province’s tax on tobacco
products imposed under the Tobacco Tax Act.

Chapter 18: Revenue Integrity
425
The tobacco tax is a key component of Ontario’s smoke-free strategy. Since 2003, a number
of policy and enforcement tools in both the Tobacco Tax Act and the Smoke-Free Ontario Act,
including tobacco tax rate increases, have helped to reduce tobacco consumption by over
20 per cent.
However, in recent years, tobacco consumption has “flatlined” after more than a decade of
decline in smoking rates. The availability of cheap illegal tobacco products makes it easier for
youth to start smoking and removes an incentive for existing smokers to quit. Illegal tobacco
supplies have also adversely affected provincial revenues. In a 2008 report, the Auditor
General estimated the loss of tobacco tax revenue for fiscal 2006–07 as being in the range
of $500 million.
Improved enforcement efforts, especially those over the past three years, have generated
results. Between Apr. 1, 2008 and Sept. 30, 2011, Ontario has seized more than 172 million
illegal cigarettes. In 2010–11, provincial tobacco tax revenue increased by $77 million over the
previous fiscal year to $1.16 billion.
On June 1, 2011, the Ontario legislature approved Bill 186 — Supporting Smoke-Free Ontario
by Reducing Contraband Tobacco Act — with all-party support. Bill 186 provides the
government with important new tools to enhance enforcement while also providing legislative
authority to enter into agreements with First Nations communities related to administration and
enforcement of the Tobacco Tax Act on-reserve.
Recommendation 18-28: Further develop and implement results-focused strategies to deter
illegal tobacco, including enforcing existing laws and developing new partnerships and
legislative and regulatory tools.
These strategies could involve:
Discussions with First Nations communities to jointly improve the regulation of tobacco
activities on reserves;
Clear joint actions with the federal government to better align the regulation of tobacco in
Ontario and close loopholes;
Working with key partners including law enforcement, First Nations and other governments
(e.g., Quebec, the U.S. federal government and New York State) to co-ordinate actions;
and
Launching an education and awareness strategy to increase public awareness and
understanding of contraband tobacco, including the consequences of its use for Ontarians
and their communities.

426
Bill 186 measures, in combination with additional enforcement tools and approaches,
including partnerships with key stakeholders, could result in increased revenue of up to
$225 million per year when fully phased in.
Tax Value, Not Volume
Taxes on many so-called “sin” goods, such as gasoline, diesel, tobacco, beer and wine, apply
to the volume of the product, not the value (these are known as specific, not ad valorem,
taxes). This means when prices rise, revenues from the taxes do not respond; they rise only if
there is an increase in the volume of the goods sold. The volume of tobacco sales and hence
the revenue have been trending down. Volumes and revenues from gasoline and diesel have
been growing very slowly.
Future revenue effects of taxing values rather than volumes are difficult to estimate because
they depend on changes in the specific commodity prices. We can be reasonably certain the
pace of overall consumer price index (CPI) inflation will be around the Bank of Canada’s
two per cent target. But prices for individual components may deviate substantially; they could
even decline.
Rather than attempt an inevitably imprecise forecast, we will illustrate the sensitivity of
revenues to values rather than volumes by calculating the impact on historical revenues had
the taxes been ad valorem rather than specific. Had gasoline and diesel taxes been converted
to ad valorem in 2000, revenues in 2010 would have been $1.9 billion higher than actually
recorded. The cumulative incremental gain in revenues over the period — and hence,
everything else being equal, the decline in public debt at the end of 2010 — would have been
$10.2 billion. Had the tobacco tax been converted to ad valorem in 2006, revenues would have
been $0.4 billion higher than recorded, with a cumulative gain over the period of $1.1 billion.
There would have been little change in net beer and wine revenues. To the extent the higher
taxes induced lower consumption, the revenue impacts would be somewhat lower than
shown above.
There are several ways to capture the revenue impacts of changes in value: the specific taxes
could be converted to ad valorem form; the specific tax rates could be indexed; or the specific
tax rates could be adjusted periodically.
The education property tax is effectively a specific tax as well. By offsetting any increases in
assessed property value, revenue only reflects changes in volumes. Having taxes be in step
with the value of the property would provide increased revenues for the province.
Recommendation 18-29: Replace taxes tied to a good’s volume with taxes tied to the good’s
value (i.e., replace specific taxes with ad valorem taxes or otherwise capture changes in
values).

Chapter 18: Revenue Integrity
427
Appendix 18.1: Revenue Measures Included and Not Included in Preferred Scenario
$ Millions 2012–13 2013–14 2014–15 2015–16 2016–17 2017–18 Revenue Measures Included in the Preferred Scenario
Contraband Tobacco 50 75 100 150 200 225
Collections/Audit1 75 100 150 200 250 300
Underground Economy 50 100 200 300 400 500
Increasing Compliance 50 75 100 185 200 200
Non-Tax Revenue: Full Cost Recovery Part 12 50 75 100 150 200 225
Government Business Enterprises: Retain and Increase Efficiency
200 300 400 500 500 500
Total Revenue Measures 475 725 1,050 1,485 1,750 1,950
Revenue Measures Discussed But Not Included in the Preferred Scenario
Non-Tax Revenue: Full Cost Recovery Part 22 – 186 422 372 322 297
Non-Tax Revenue: Indexation of User Fees3 36 73 110 148 187 227
Residential and Business Education Taxes4 125 375 625 775 925 1,075
Taxing Value, Not Volume5 N/A N/A N/A N/A N/A N/A 1 Some collections activity may only reduce cash requirements and not result in a bottom-line improvement. 2 As a conservative estimate, only a portion of the full cost recovery of non-tax revenue was accounted for in the Preferred Scenario. The full impact could
be as high as $522 million ($225 million plus $297 million). 3 Indexation applied to the estimated user-fee revenue base of $1.8 billion, using the rate of inflation (two per cent annually). These amounts should not be
added to the estimates for full cost recovery because that would involve an element of double-counting. 4 Represents two per cent inflation increase on residential and business properties and increasing low BET rates to offset the cost of the BET reduction
plan. Assumes implementation for 2013 calendar year. Revenue impacts may vary based on reassessment impacts. 5 Future revenue impacts would depend on price changes for the commodities. The text provides an illustration of the impact on historical revenues had ad
valorem taxes been applied to gasoline, diesel, tobacco, beer and wine.

428

Chapter 19: Liability Management
429
Chapter 19: Liability Management
Introduction
No fiscal projection is a static plan. For any government, revenue and expense estimates
are generally based on economic assumptions, policy decisions and direction, and the best
available information at a given point in time. There is a lot of uncertainty that surrounds the
estimates in the plan. Once released, it becomes subject to a number of risks that could
emerge and impact the previously outlined fiscal objectives.
Any information or events that were unanticipated during the planning process present a risk
to the fiscal projection. Risks can come from uncertainty in financial markets, project failures,
legal liabilities, credit risk, accidents, natural causes and disasters, or events of an uncertain or
unpredictable nature. For Ontario, as a sub-national jurisdiction, the risk of a policy change by
the federal government continually exists.
These risks can have a positive or negative impact on the province’s actual fiscal results.
Generally, positive impacts are easier for governments to manage. For example, in cases
where economic performance turns out better than expected, the government has additional
flexibility to manage existing priorities and meet its fiscal objectives. However, if the economy
were to fall short of what was expected, then the province would feel the negative impact
through lower government revenue, higher expense and, in Ontario’s current fiscal situation,
larger deficits and increasing debt.
To help ensure that fiscal objectives are met, the Fiscal Transparency and Accountability Act
requires Ontario’s fiscal plan to include a reserve to protect against unexpected and adverse
changes in the revenue and expense outlook. In the 2011 Budget, the government included a
reserve of $0.7 billion in 2011–12 and $1.0 billion in each following year through to 2017–18.
However, the reserve in its current state does not provide enough flexibility for variances
that may emerge over this time, especially compounding errors resulting from forecasted
growth rates.
Recommendation 19-1: General risks can and should be handled through the contingency
reserve, which should be set higher than in recent budgets and should grow over time to
address the possibility of growth rate biases in the revenue projection. Modest internal risks
should be addressed through an operating reserve. The contingency reserve should be
increased to cover a 0.2 percentage point annual overestimate of revenue growth.

430
The contingency reserve should be set at an adequate amount to protect against forecast
errors; it should grow over time to cover not only an error in level estimates but also to address
the possibility of any growth-rate bias. Our recommendation is that the contingency reserve
be increased to cover a 0.2 percentage point annual overestimate of revenue growth.
Our longer-term projection is implicitly based on a projection of annual productivity growth of
1.2 per cent (i.e., increase in Ontario real output per hour worked). As discussed in Chapter 1,
The Need for Strong Fiscal Action, we believe this is an appropriate assumption. However,
we are well aware that the figure is considerably stronger than the actual productivity growth
rate recorded over the past decade. Therefore, it must be considered to be at risk. It could
easily be somewhat weaker, say 1.0 per cent. That would roughly translate into a 0.2
percentage point weaker growth rate in revenues over the entire projection period. This is
precisely the sort of risk we envision when we recommend the contingency reserve be set to
cover a 0.2 percentage point risk to revenue growth in the first year of this exercise (2010–11)
and that it rise by 0.2 percentage points annually to 1.4 per cent in the target year. This
requires the contingency reserve to be $1.9 billion in 2017–18, compared to $1.0 billion in
the 2011 Budget.
Regardless of how prudent and rigorous the government is in its annual planning of revenue
and expense, there are always risks that the government cannot account for. Many of these
risks are unknown to the government at the time of budgeting. In previous years, these risks
have resulted in major one-time costs, such as the government’s response to SARS and
H1N1, or its support for the auto sector. Other risks are known at the time of budgeting, but
the scope, extent or amount of the liability are unknown. A recent example of this type of risk
is the additional forest firefighting resources the province has required. While the government
anticipated a cost for this risk, the amount and severity were unknown. Finally, the province
should plan for risks with an unknown probability of occurrence and cost. It is the unknown
element of all these risks that makes them hard to plan for.
In the past, Ontario has used the operating and capital contingency funds — or the reserve
in extreme cases — to mitigate risks in-year that would otherwise have had a negative impact
on its financial results. While this strategy has been effective, in a period of severe fiscal and
economic challenges, wholly absorbing the cost of these risks without a mitigation plan will
prove increasingly difficult if the government is committed to returning to balanced budgets.
Recommendation 19-2: Specific risks should be addressed through an explicit strategy.
Care should be taken in budget-setting processes to diligently identify any known risks of
significant fiscal magnitude, and a strategy developed to mitigate those risks.

Chapter 19: Liability Management
431
To increase the probability of securing the 2017–18 target, risks and liabilities should be
identified as early as possible in the planning process. Ministries must be vigilant in
anticipating what could go wrong with all projects. Strategies will need to be developed to
identify and reduce specific risks to the fiscal plan, such as federal government action and
pension liabilities. The following section identifies liability risks that require the province to
develop management plans for moving forward. This is intended to be an illustrative list of
risks that should be currently known and subject to mitigation strategies. There are, no doubt,
many more current risks, and more will undoubtedly surface as we move through the
projection period. As such, the liability management strategy must be very fluid.
Upcoming Liability Risks
Pension Benefits Guarantee Fund
Ontario’s Pension Benefits Guarantee Fund (PBGF) was created in 1980 and was intended
to assist pensioners and plan members when occupational pension plans are wound up with
insufficient funds to cover promised benefits, and the employer is unable to make the required
payments. The PBGF is administered by the Superintendent of Financial Services and
generally covers single-employer defined benefit pension plans in the private and broader
public sectors. Ontario is the only jurisdiction in Canada to provide such coverage.
In 2009, the government retained an independent actuarial firm to conduct the first actuarial
study of the PBGF, including revenues and claims, to inform the development of long-term
policy. The study, released in 2010, concluded that the PBGF was not sustainable in its
current form and noted that overall assessments would have to increase by as much as
1,000 per cent if coverage were increased to $2,500 a month as had been previously
recommended by the Arthurs Commission.1
On several occasions over the last 30 years, there has not been enough cash in the Fund
to cover large anticipated PBGF claims. In those instances, several loans were made from
the Consolidated Revenue Fund to cover claims. The only loan amount still outstanding is
$242 million of a $330 million loan made in 2004 to cover a significant claim. In 2010, the
government made a $500 million grant to the PBGF to initiate the PBGF reform process and
stabilize the Fund in the near term. In May 2011, $384 million was paid out of the Fund in
partial settlement of another significant claim.
1 This estimate did not take into account the $500 million grant made in 2010.

432
Ontario is the only sub-national jurisdiction in the world with a pension benefits guarantee
fund. With fewer than 1,600 covered plans, and PBGF exposure concentrated in certain
industries, risk is not spread according to insurance principles. To fully insulate the PBGF from
catastrophic claims and update coverage levels, significantly higher assessments and larger
reserves would be required.
Recommendation 19-3: We recommend that the province either terminate the Pension
Benefits Guarantee Fund or explore the possibility of transferring it to a private insurer.
The Fund is no longer sustainable in its current form as it presents a large fiscal risk for
the province in the event of another economic downturn.
Liability from Pension Funds in the Broader Public Sector
Introduction
Ontario Public Service (OPS) and broader public-sector (BPS) pension plans include some
of the largest plans in the country — both in terms of the value of assets and number of
members. The province provides funding to these plans through both direct and
indirect mechanisms.
The topic of pensions is multi-faceted and technical, with varying governance structures and
risk-sharing arrangements, as well as distinct funding and accounting considerations. Many
aspects of the plans could be reviewed. Yet the Commission’s mandate suggests our focus
be on the fiscal dimensions and hence our approach has been rather narrow. We examine the
public cost of the plans, the risks they represent to the Province’s fiscal plan and strategies to
manage these risks.
Given the government’s significant exposure to liabilities associated with some of these plans,
we believe that steps should be taken to improve transparency and strategic planning with
respect to pension expense in an effort to better manage this risk.
Recommendation 19-4: The Ontario government should conduct and publish its own liability
management assessment of the public-sector pension plans and develop plans to contain any
fiscal risks identified.
Description of BPS Pension Plans
There are currently five plans consolidated in the province’s financial statements: Public
Service Pension Plan (PSPP); OPSEU Pension Plan (OPSEUPP); Ontario Teachers’ Pension
Plan (TPP); Healthcare of Ontario Pension Plan (HOOPP); and Colleges of Applied Arts and
Technology (CAAT) Pension Plan.

Chapter 19: Liability Management
433
The PSPP is solely sponsored by the province, and the remaining four plans are Jointly
Sponsored Pension Plans (JSPPs). In the case of solely sponsored plans, the employer is
wholly responsible for funding any shortfall. In contrast, JSPPs require that both employer
sponsors and employees share responsibility for making up any shortfall by negotiating some
combination of contribution increases and prospective benefit reductions. These obligations
are set out in the Pension Benefits Act, its Regulations and individual plan documents.
TABLE 19.1 Public-Sector Pension Plans Reflected in the Province’s Financial Statements
Contribution Rates (%) Pension Plan Assets ($ Billions)
Active Members
Employees Employers
Retirement Factors*
PSPP 17.4 41,000 9.5 9.5 Factor 90 or Age 60 + 20 Years
OPSEUPP 13.3 47,000 10.0 10.0 Factor 90 or Age 60 + 20 Years
TPP 107.5 175,000 12.0 12.0 Factor 85 or 35 Years
HOOPP 35.7 170,000 9.2 10.67 Age 60 or Age 55 + 30 Years
CAAT 5.5 19,000 12.9 12.9 Factor 85 or Age 60 + 20 Years
Notes: Teachers’ Pension Plan contribution rate is scheduled to increase from 12.0 per cent in 2011 to 13.1 per cent over three years, with full implementation in 2014. The CAAT contribution rate is scheduled to increase to 13.7 per cent by 2014. “Years” indicates Years of Service. Public safety workers (e.g., fire, police, paramedics) have a normal retirement age of 60 and can generally retire earlier.
Ultimate Question
One of the biggest questions from a liability management perspective is who is ultimately
responsible should a plan or plans get into serious financial difficulty. The answer is different
for different types of pension plans. Most of the major public-sector plans are jointly
sponsored, which means employer sponsors and members share this responsibility.
The government, and hence the taxpayer, bears significant risk as joint sponsor of the TPP
and the OPSEUPP, and sole sponsor of the PSPP. This is a serious potential liability. For the
other major public-sector plans, HOOPP and CAAT, employers share legal liability for funding
shortfalls with members.
Because of the significance of this risk, it is critical to ensure greater public clarity and address
fiscal and liability issues associated with these plans.
Recommendation 19-5: Clarify who bears the ultimate financial responsibility for funding
deficits of the public-sector pension plans as the Commission encountered considerable
confusion on this issue.

434
Health of the Plans
There are two types of actuarial valuations that public-sector plan sponsors are required to
prepare: a funding valuation and an accounting valuation. Each valuation employs different
methods and assumptions.
The funding valuation is prepared in accordance with the Pension Benefits Act and actuarial
standards, and is intended to secure the benefits provided by the pension plan. The funding
valuation also determines the contributions necessary to fund the benefits being earned.
The funding valuation is used to determine whether a pension plan is actuarially sound.
However, the contributions determined by funding valuations do not represent the province’s
pension expense for budgetary purposes. Pension expense is based on actuarial valuations
that are prepared on an accounting basis. These valuations are prepared in accordance with
recommendations of the Public Sector Accounting Board (PSAB), and are based mainly on
the present value of benefits earned by plan members, not the cash contributions.
Three of Ontario’s largest public-sector pension plans currently have funding shortfalls. These
include the three pension plans that are directly sponsored or co-sponsored by the province
(i.e., PSPP, OPSEUPP and TPP). These shortfalls are largely the result of investment losses
during the financial crisis in 2008 as well as the low level of long-term interest rates.
The following summarizes the current funded status of the three plans that are directly
sponsored or co-sponsored by the province:
The TPP is a jointly sponsored, defined benefit pension plan, with assets of about
$107.5 billion as at Jan. 1, 2011. The TPP’s preliminary Jan. 1, 2011, funding valuation
revealed an unfunded liability of $17.2 billion. A balanced Jan. 1, 2011 valuation was
filed with the Financial Services Commission of Ontario (FSCO) in June 2011, which
(1) reduced benefit indexation for future service to 60 per cent of the annual changes in
the consumer price index; and (2) increased the contribution rate for both the province and
plan members by 1.1 percentage points for the next 15 years.
The PSPP is a defined benefit pension plan solely sponsored by the province. It had
assets of about $17.4 billion as at Dec. 31, 2010. The PSPP’s Dec. 31, 2010, funding
valuation had a $1.19 billion unfunded liability, which the province is eliminating over
15 years.
The OPSEUPP is a jointly sponsored defined benefit pension plan with assets of about
$13.3 billion as at Dec. 31, 2010. The plan had an unfunded liability of about $586 million
in the Dec. 31, 2010, funding valuation. Retirement of the OPSEUPP shortfall is being
shared equally between the government and the plan members. Their respective Rate
Stabilization Funds, composed of reserves that were set aside during years of surpluses
and are now being drawn down to finance shortfalls, are sufficient to cover this deficiency.

Chapter 19: Liability Management
435
Both HOOPP and CAAT are not directly sponsored by the province, but are consolidated
in the province’s financial statements. HOOPP, which had assets of about $35.7 billion,
was fully funded as at the last valuation date of Dec. 31, 2010, while CAAT had assets of
about $5.5 billion and a small surplus.
Many of these plans responded to the shortfalls created by the financial crisis by increasing
employer and employee contribution rates. For example, in the case of the TPP, teachers and
the province each contributed 8.9 per cent above the Year’s Maximum Pensionable Earnings
(YMPE) in 2006. That rate has increased since then to 12.4 per cent in 2012 and will rise to
13.1 per cent in 2014. The CAAT surplus is largely attributable to the fact that the contribution
rate for employers and plan members is set to increase from 12.9 per cent in 2012 to
13.7 per cent by 2014.
Three plans (HOOPP, CAAT and TPP) have taken steps to reduce or eliminate the level of
guaranteed inflation protection on a prospective basis. This action has mitigated the pressure
for further contribution rate increases.
Rates of Return
In accordance with PSAB rules, the province values the liabilities of the pension plans
consolidated in its financial statements using long-term nominal rates of return varying from
6.25 to 6.75 per cent. This reflects public-sector portfolios, which include equity investments.
Some argue that the actuarial positions should also be valued using more conservative (lower)
rates of return based on a portfolio of fixed income securities, as is the case in private-sector
accounting standards. This is neither the current accounting convention under the PSAB rules,
nor consistent with expected long-term rates of return on a diversified investment portfolio,
including both equities and bonds.
Nevertheless, it would be useful for the government to conduct a sensitivity analysis of the
health of these pension plans. This test could be as simple as assuming a static change in
the long-term rate of return, or could rely on a probability distribution of expected investment
returns. This type of analysis is consistent with current Canadian Institute of Actuaries’
standards of practice for individual pension plans.
In the case of more conservative estimates, the Commission believes this analysis could
reveal significant funding deficiencies across public-sector plans. While this result would not
suggest any immediate action needed to be taken, it would support the development of a
liability management plan to address the volatility of equity investments.
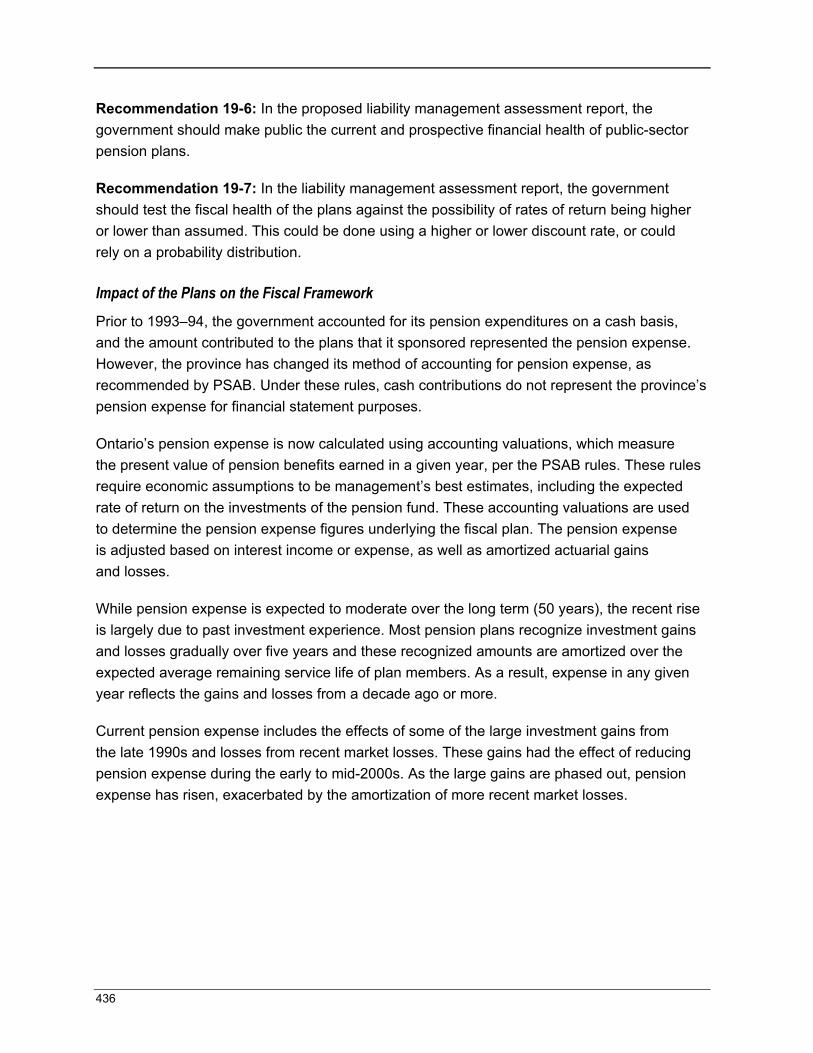
436
Recommendation 19-6: In the proposed liability management assessment report, the
government should make public the current and prospective financial health of public-sector
pension plans.
Recommendation 19-7: In the liability management assessment report, the government
should test the fiscal health of the plans against the possibility of rates of return being higher
or lower than assumed. This could be done using a higher or lower discount rate, or could
rely on a probability distribution.
Impact of the Plans on the Fiscal Framework
Prior to 1993–94, the government accounted for its pension expenditures on a cash basis,
and the amount contributed to the plans that it sponsored represented the pension expense.
However, the province has changed its method of accounting for pension expense, as
recommended by PSAB. Under these rules, cash contributions do not represent the province’s
pension expense for financial statement purposes.
Ontario’s pension expense is now calculated using accounting valuations, which measure
the present value of pension benefits earned in a given year, per the PSAB rules. These rules
require economic assumptions to be management’s best estimates, including the expected
rate of return on the investments of the pension fund. These accounting valuations are used
to determine the pension expense figures underlying the fiscal plan. The pension expense
is adjusted based on interest income or expense, as well as amortized actuarial gains
and losses.
While pension expense is expected to moderate over the long term (50 years), the recent rise
is largely due to past investment experience. Most pension plans recognize investment gains
and losses gradually over five years and these recognized amounts are amortized over the
expected average remaining service life of plan members. As a result, expense in any given
year reflects the gains and losses from a decade ago or more.
Current pension expense includes the effects of some of the large investment gains from
the late 1990s and losses from recent market losses. These gains had the effect of reducing
pension expense during the early to mid-2000s. As the large gains are phased out, pension
expense has risen, exacerbated by the amortization of more recent market losses.

Chapter 19: Liability Management
437
TABLE 19.2 Historical and Projected Pension Expense by Plan
($ Millions)
PSPP and OPSEUPP
TPP HOOPP CAAT TOTAL
2005–06 227 295 663 70 1,255
2006–07 172 345 719 82 1,318
2007–08 131 342 750 93 1,316
2008–09 321 50 853 94 1,318
2009–10 536 255 956 153 1,900
2010–11 726 522 938 184 2,370
2011–12 759 526 1,023 177 2,485
2012–13 862 908 1,123 206 3,099
2013–14 858 1,385 1,227 230 3,700
2014–15 784 1,354 1,231 232 3,601
2015–16 831 1,372 1,301 237 3,741
2016–17 938 1,409 1,370 233 3,950
2017–18 1,051 1,472 1,456 232 4,211
As noted elsewhere in this report, growth in total program expense must be held to
0.8 per cent if the province wishes to balance its budget by 2017–18. Total pension expense,
including HOOPP and CAAT,2 grew at an average rate of more than 13 per cent from
2005–06 to 2010–11. As demonstrated above, pension expense is expected to continue to
grow at a rate well in excess of 0.8 per cent through 2017–18. Should these high rates of
growth persist, total 2005–06 pension expense will have more than tripled by 2017–18.
Currently, pension expense is about two per cent of total program spending growth and
is responsible for much of the total increase in program spending under the 0.8 per cent
growth cap. Total program spending can rise $6.3 billion from 2010–11 to 2017–18. This
program pension expense will, under the Preferred Scenario, take up $1.8 billion or almost
30 per cent of the total increase. It will go from 2.1 per cent of total program spending in
2010–11 to 3.6 per cent in 2017–18 in our Preferred Scenario.
2 While included in Table 19.2 for the sake of completeness, pension expenses related to HOOPP and CAAT are contained in the health
and post-secondary sector expenses, respectively. As such, they do not constitute part of the residual expenditure.

438
Plan-specific costs are spread across various schedules and explanatory notes, and the total
pension expense is not identified in any single place in the province’s financial statements.
The Commission is only aware of the province publishing pension expense figures once in
recent history — the 2009 Ontario Budget. In the Commission’s framework, pension expense
attributed to PSPP, OPSEUPP and TPP is embedded in the residual spending category
(i.e., excluding health, primary and secondary education, post-secondary education and
social programs). Pension expense attributed to HOOPP and CAAT is found in health and
post-secondary expenditures respectively.
Although the volatility in the investment returns plays a large role in determining the expense
in the out-years, an adjustment to prospective benefits would be recognized in the year the
change is made. This would have the effect of lowering the future expense as soon as the
plan is amended.
Contribution Rates
As noted earlier, contribution rates have been trending upward in public-sector plans in
recent years and these rates are now high relative to past experience and to those in the
private sector. About half of private-sector plans require contributions from plan members
and, where contributions by plan members are made, those contributions tend to be lower
than those found in public-sector plans. This makes it difficult to make comparisons between
benefit levels in the two sectors.
Given the high levels of employee contributions to these plans, plan members may well be
unwilling to agree to further increases. For example, CAAT and TPP members now pay more
than 12 per cent in employee contributions. Higher contribution rates mean lower disposable
income for plan members, particularly for those at the outset of their careers.
The government should shift its focus from contribution rate increases to changes in future
benefit levels when faced with future shortfalls. Measures should be taken to reduce
prospective benefits to limit the need for further contribution rate increases.
As noted above, many public-sector employees are members of JSPPs, which require that
both sponsors agree to any prospective benefit changes. Employer plan sponsors, including
the government, colleges and hospitals, should work with employee sponsors to develop
solutions that limit contribution increases. The government may need to consider legislative
options should the parties be unable to reach agreements to address these issues.

Chapter 19: Liability Management
439
Recommendation 19-8: The government’s objective, when faced with pension funding
deficits, should be to reduce prospective benefits rather than increase the contribution rate
beyond current levels. This would help to close the funding gap and reduce the accrual
of pension benefits on a prospective basis, mitigating the impact on the fiscal plan.
The government may need to consider legislative options, should negotiations with plan
sponsors be unsuccessful.
Benefits
Even if the government’s share of contributions for future service were limited, this would
not in itself reduce the rate of growth of pension expense for financial statement purposes.
There are two ways this goal could be achieved:
1. Reduce the benefits earned by plan members in the future; and/or
2. Increase the share that plan members pay towards financing new deficits.
If employees are willing to maintain current benefit levels through an increased employee
share of total contributions, this would require legislative changes to the Ontario Pension
Benefits Act and the federal Income Tax Act, if employees would be contributing more
than 50 per cent.
In the absence of a larger share of total contributions paid by employees, the government
could undertake negotiations to reduce benefits on a prospective basis, such as changes to
indexation or early retirement provisions (e.g., by increasing the early retirement factors noted
in Table 19.1). These types of actions would reduce future benefit accruals and thus growth in
pension expense.
Recommendation 19-9: The government should accelerate work on the design of
public-sector benefits and make containing the growth in the cost of benefits part of the
broader public-sector compensation negotiation strategy.
BPS Efficiencies
Most hospitals, colleges, municipalities and school boards operate as separate employers but
participate in a single pension plan. In comparison, much of the rest of the BPS, including the
university sector (as discussed in Chapter 7, Post-Secondary Education) and the energy
sector, has a very fragmented pension arrangement, with more pension plans than institutions.
These plans vary widely in size and the benefits they provide, as well as the contributions
made by employers and plan members.

440
This fragmented arrangement suggests that, due to their size, some institutions may not be
realizing the economies of scale that would result if this function were more centralized.
The consolidation of administrative processes and practices, including the pooling of assets for
investment purposes, may generate savings. With a consolidated approach, the administrative
functions for plan administration and investment management would be carried out by another
body, and each employer/sponsor would remain the legal administrator of its plan(s), retain
its fiduciary responsibilities and determine plan benefits.
Recommendation 19-10: The province should examine opportunities to achieve savings
and better investment returns through the consolidation of the administrative functions and
investment pooling of pension plans across the broader public sector.
Transparency
Pensions are deferred compensation, and are too often viewed separately from wages and
other, more immediate benefits. In Chapter 15, Labour Relations and Compensation, we
discuss the need to broaden the perspective on public-sector compensation to make it more
inclusive. Pension benefits and their cost must be part of that equation. To accomplish this,
the cost of public-sector pensions to taxpayers must be more transparent.
As noted above, currently the only way to compile a full picture of public-sector pension
expense is by pulling together different entries and notes in the government’s financial
statements. Making these expenses more transparent will assist the government in developing
a comprehensive compensation strategy. It will also assist in making comparisons across
sectors, including the private sector.
Recommendation 19-11: The province must make the government’s cost of the public-sector
pension plans — both in concept and in magnitude — much clearer in the Public Accounts
and other financial statements, including the Budget.
Environmental Risks
Under the Environmental Protection Act (EPA), the province has the “right to compensation”
for loss or damages incurred as a direct result of a hazardous spill, and for all reasonable
costs and expenses incurred for a cleanup. However, as discussed in Chapter 13,
Environment and Natural Resources, difficulties can arise in situations when the owner of
a contaminated site becomes insolvent, no longer exists, or lacks sufficient funds to pay
for the cleanup. While the province can take legal action to ensure the polluter pays for
the environmental cleanup, most often the province is left with the responsibility of the
cleanup and the associated costs.

Chapter 19: Liability Management
441
Recommendation 19-12: To better protect the province against the costs of environmental
cleanup, adjust the current legislative framework so that more focus is placed on the
polluter-pays principle.
Other options include the introduction of a program like Superfund, currently in place in the
United States, that has federal authority to clean up the nation’s uncontrolled hazardous
waste sites.
Risks to Ontario Posed by the Federal Government
In some areas of responsibility, the federal and provincial governments work together to
help provide services to Ontarians, but as a sub-national jurisdiction Ontario is always subject
to the risk of a policy change by the federal government. Such policy changes can cause
disruptions to both provincial fiscal planning and public services; therefore, allowances
must be taken to account for unplanned changes.
Negotiations for a comprehensive free trade agreement with the European Union (EU) are
underway and the outcome of these negotiations could have significant impact on the cost of
prescription drugs in Ontario. The potential harmonization of patent rules with the EU could
cost Ontario dearly since generic drugs would be kept off the market for a longer time. If all
three of the EU pharmaceutical intellectual property proposals are adopted, estimates suggest
it could cost Ontarians up to $1.2 billion annually ($551 million for the Ontario government,
and $672 million for the private sector),3 which would more than wipe out the savings achieved
through the government’s recent drug reforms. The province should work with the federal
government to ensure that a Canada–European Union Free Trade Agreement (CETA)
does not undermine Ontario’s interest in expanding the use of generic drugs.
Ontario and the federal government share a common personal income tax base to help
simplify the process of filing returns. This common tax base could lead to significant costs to
Ontario moving forward, since Ontario generally parallels any federal government tax changes
to maintain similarity. As an example, the federal government has proposed changes related
to the expansion of income-splitting and doubling the current annual limit on contributions to
Tax-Free Savings Accounts. These two proposals alone could result in $1.3 billion less in
revenue annually for Ontario.
3 Paul Grootendorst and Aidan Hollis, “The Canada-European Union Comprehensive Economic and Trade Agreement: An Economic
Impact Assessment of Proposed Pharmaceutical Intellectual Property Provisions,” 2001, Canadian Generic Pharmaceutical Association.

442
Discussed in greater detail in the federal-provincial relations portion of Chapter 20,
Intergovernmental Relations, changes in the Canada Health Transfer (CHT) beginning in
2017–18 stand to cost Ontario about $239 million per annum based on current forecasts, but
could reach about $421 million if GDP growth falls to the three per cent floor. These reductions
will grow over time. By 2023–24, Ontario’s CHT payment could be $2.3 billion to $3.8 billion
lower than under the current formula. As discussed in Chapter 5, Health, over the long run,
health costs tend to increase more rapidly than nominal GDP. By tying the federal transfer
for health to GDP growth, it is almost inevitable that, over time, the federal government’s
contribution to total health spending will continuously decline.
In Canada, responsibility for the Criminal Code rests with the federal government while
responsibility for implementation lies mainly with the provinces. As addressed in Chapter 14,
Justice Sector, and Chapter 20, Intergovernmental Relations, recent crime legislation will
place further demands on the provincial court and corrections systems, only adding to the
fiscal burden of the provinces as the federal government has not yet recognized or addressed
the additional cost. The provincial government has projected Ontario’s inmate count to
increase by 1,265 to 1,530 inmates in 2015–16 as a result of Bill C-10. The lowest cost
estimate of the impact of the federal crime bill is ongoing annual increases in operating
budgets of $22 million to $26 million per year at maturity. In the worst-case scenario, the
province would be required to procure a new 1,000-bed facility to offset the resulting impact.
The estimated capital cost of a new facility is $900 million, with ongoing operating costs of
$60 million per year.
Recommendation 19-13: Work with the federal government to mitigate risks to the
Ontario fiscal framework from federal policy changes. Known risks at the time include the
Canada–European Union Free Trade Agreement (CETA) being negotiated, proposed
changes to personal income taxes and the federal omnibus crime bill (Bill C-10).

Chapter 19: Liability Management
443
Social Housing
Social and affordable housing4 is provided by Ontario’s municipalities. However, Ontario is
responsible for setting rules and standards, flowing federal dollars to municipalities, and
directly funding various housing and related support programs. Much of Ontario’s social
housing was constructed over 30 years ago, resulting in a need to invest in repair and
rehabilitation work. At the same time, Ontario’s population continues to grow and to age,
which requires specialized affordable housing. In July 2011, the province signed a three-year
bilateral agreement with the federal government for investment in affordable housing.
The agreement will provide $480.6 million, cost-shared 50/50 between the federal and
provincial governments, to fund the creation or repair of about 6,000 affordable housing units.
There is currently no federal funding commitment beyond the end of the current agreement.
The absence of an agreement with the federal government for affordable housing would
impact both capital programs (repair and construction) as well as operating programs
(rental supplements).
Recommendation 19-14: Ontario should negotiate with the federal government to commit to
a housing framework for Canada that includes adequate, stable, long-term federal funding and
encourages its housing partners and stakeholders, including municipal governments, to work
with the federal government to secure this commitment.
Risks to Ontario Posed by the Municipal Sector
Similar to the shared responsibility of service delivery between the federal and provincial
governments, the province works with the municipal sector to provide services to Ontarians.
As discussed throughout this report, there are instances in which all three levels
of government are responsible for public service delivery. While the province and its
municipalities should continue to develop their partnerships in the funding and implementation
of service delivery, in some cases the province may ultimately be considered liable in the
event of a default by an Ontario municipality.
Municipal Infrastructure
About 40 per cent of public infrastructure in Ontario is owned by the province’s
444 municipalities. Assets include roads and bridges, water and wastewater infrastructure,
transit systems, affordable/social housing, solid waste facilities, public buildings, Conservation
Authority infrastructure, and land. Since the 1950s, municipalities’ share of public infrastructure
has grown significantly.
4 Social housing is also known as “assisted housing,” meaning housing where tenants either pay lower end of market rent or rent-geared-to-
income (RGI) and receive government assistance. Affordable housing generally refers to rental stock for low-income families who are not receiving subsidies but pay lower than market rent.

444
Municipalities are responsible for maintaining their infrastructure — a responsibility clearly
defined through policies that govern municipalities. The province also has an ongoing
obligation to help ensure the safety and sustainability of municipal infrastructure. The province
accomplishes this through a variety of policy instruments (e.g., standards and inspections) as
well as funding programs that support municipal infrastructure priorities. Despite these efforts,
there are continual calls on senior governments to ensure adequate investment in
municipal infrastructure.
In recent years, there have been numerous efforts to quantify the need for investment in
municipal infrastructure and develop provincial policies and funding programs in response.
While policies have rightly focused on specific issues (such as drinking water safety), there is
a need for a more comprehensive plan that points the province, municipalities and the federal
government in the same direction as efforts are made to address the ongoing challenge of
underinvestment in the sector. While probably part of the solution, this challenge cannot be
resolved through funding alone. More fundamental reforms are needed for the sector to be
on a sustainable footing.
Asset management planning for municipal infrastructure should be comprehensive and
achieved through a one-window requirement of the province. Poorly maintained infrastructure
delivers a lower quality of service, costs more to repair and replace, and can increase risks to
health and safety from potential failures. Asset management provides the information needed
to make strategic decisions about investing in the maintenance, rehabilitation and replacement
of assets. This tool helps optimize service delivery, minimize risk and provide services more
efficiently. While many municipalities are practising asset management, there are no set
standards for how this should be done. Some municipalities have detailed asset management
plans while others do not. In Chapter 12, Infrastructure, Real Estate and Electricity, we
recommend that more emphasis be placed on achieving greater value from existing assets in
asset management plan reporting requirements than is currently proposed in the Long-Term
Infrastructure Plan (LTIP).
As a starting point, an effective plan would include a set of principles to guide future
investments and policies. Examples of principles include:
Recognition that safe and sustainable municipal infrastructure is a shared priority for
all orders of government;
Municipalities are the stewards of their own infrastructure;
Comprehensive asset management plans should guide investment decisions;
Health and safety issues are top priorities; and
Small communities face unique challenges that require tailored solutions.

Chapter 19: Liability Management
445
For this work to be meaningful, a range of tough issues needs to be tabled, debated
and resolved through new or amended policies and programs. Examples include exploring:
If municipalities are using the range of revenue, financing and organizational tools
available to them effectively;
How a one-window approach to asset management (where one plan satisfies a range
of provincial requirements) could be implemented;
If the way the province has been funding municipal infrastructure is yielding the best
possible outcomes;
If “stable and predictable” funding (as the municipal sector calls for) is a good solution
or if it will perpetuate the problem;
What role the private sector should play in all aspects of municipal infrastructure
(with “no role” not being a viable approach);
How grants can be used as an incentive to achieve financial sustainability; and
If small/economically disadvantaged communities should receive entitlement funding
for infrastructure.
This is an opportune time to take stock of the current approach to municipal infrastructure,
make any needed policy improvements, and develop a plan that will be in the phases
of implementation when the time comes for new rounds of infrastructure funding programs.
Even if the process takes a few years, it will help ensure that whatever funding and policies
are developed along the way address the most pressing priorities — priorities identified
through robust asset management plans. It will also allow the province to negotiate more
strongly with the federal government on municipal infrastructure priorities and ensure the
most critical needs are being addressed
Pan/Parapan American (Pan Am) Games
In the summer of 2015, Toronto and the Golden Horseshoe region will host the 2015
Pan/Parapan American Games. The budget for hosting the Games is about $1.4 billion,
and the province is providing $500 million.

446
The province guarantees to cover any deficit for the Games and as such is responsible for any
cost overruns beyond the approved $1.4 billion budget. As the deficit guarantor, the province
has a major interest in ensuring that appropriate measures are in place to minimize risk to the
business plan and ensure the budget remains within the approved financial envelope.
Provincial consent/approval is required if any major areas of Pan Am expense (i.e., venue
operations, transportation, communication services) increase by five per cent or $5 million.
As well as ensuring that checks and balances are in place to spot potential increased
expenditures, the province must also be vigilant in holding the parties involved to account
for any overrun in expenditures.
Recommendation 19-15: Work with the municipal sector to mitigate risks to the Ontario fiscal
framework by ensuring that commitments are adhered to. Known risks at this time include
potential overruns in municipal infrastructure and the Pan Am Games.
Unknown Risks
It is naive to believe the seven years from 2010–11 to 2017–18 will unfold exactly as projected
by the government or the Commission, especially in light of the widespread uncertainties that
currently persist over the world economy and its financial system. As the province proceeds
along its course towards returning to fiscal balance, many of the risks already discussed
could certainly emerge. For the province to continue to meet its fiscal targets, sufficient
contingencies will need to be allocated. In an era where political, environmental, economic
and technological factors are constantly changing, the fiscal plan must also be prepared for
the unexpected and must provide contingencies and mitigation plans for any unknown
risks as well.
Consistent with this approach, an adequate contingency reserve should be included to protect
against forecast errors. The level of the contingency reserve should grow over time as the
budget projection is pushed further out into the future, to provide the government with a
degree of latitude for handling general risks that emerge.
Additionally, given the tight constraints that will be imposed on ministry operating budgets,
a centrally held operating reserve should continue to be maintained that can be accessed only
through a process involving Cabinet and Treasury Board. The operating reserve will be used
to address cases where health and safety might be compromised or services to the most
vulnerable are jeopardized. The operating and contingency reserves will be used to address
unknown risks that materialize.

Chapter 19: Liability Management
447
For risks known in advance, the province should form an explicit strategy to address these
risks in advance. Care should be taken in the budget-setting processes to diligently identify
any known risks of significant fiscal magnitude, and a strategy developed to mitigate those
risks moving forward to increase the probability of securing the fiscal targets outlined
by the government.
Taxpayer Protection Act
In this report, we set out a plan based largely on spending restraint to return the province
to fiscal balance in 2017–18. The policy framework recommended should permit the province
to remain in balance beyond that time. However, we have noted a number of risks to the
economic and fiscal environment that could throw a fiscal plan off track. The province would
want as much flexibility as possible to be able to respond. That response might be specific
to the particular risk that manifests, or it could require further adjustments to spending and
revenues. There are no substantial constraints on the government’s ability to manage
expenditures. However, we believe most will agree that it would be exceedingly difficult to
drive program spending growth below the 0.8 per cent annual increases we have laid out here.
Hence, unforeseen events may require a strengthening of revenues. The Taxpayer Protection
Act (TPA) significantly fetters the government’s capacity to make decisions regarding
revenues due to its restricting conditions on increasing tax rates or introducing a new tax.
This is not to suggest that tax increases should be taken lightly. With or without the TPA,
it is unlikely any government would pursue that option lightly, given pressure from taxpayers.
Further, implementation of the principles of transparency, efficiency and equity we discuss in
this report would sharpen the tests the public would put to governments wishing to raise taxes
in the future. In brief, it should be possible to maintain both spending and taxes as tools to
address fiscal pressures without causing the public to lose confidence that taxes will not be
raised for unjustifiable reasons.
Recommendation 19-16: Modify or eliminate the Taxpayer Protection Act so that both
spending and taxes can be used as required to address threats to fiscal sustainability.

448

Chapter 20: Intergovernmental Relations
449
Chapter 20: Intergovernmental Relations
The Canadian Constitution provides a rough division of powers across the two
levels of government: federal and provincial. Municipal government was born out of
provincial/territorial legislation. Today, all three levels of government share responsibility for
service delivery to Ontarians. In practice, however, the lines have proven to be rather fuzzy
and have shifted many times in many areas. In our study of numerous policy and service
delivery areas, we found two, and often three, levels of government involved. We often noted
inconsistent objectives and unco-ordinated activities among these governments. The result
is less-than-optimal overall public service to the people of Ontario. In some cases, we can
identify fairly straightforward ways in which all governments can better co-ordinate their
activities. In other cases, we question whether the additional effort and expense of
co-ordination is not second best to a clearer and sometimes different delineation of
responsibilities. In many instances, efforts at co-ordination can themselves be a
deadweight loss.
Intergovernmental relations also have a profound bottom-line fiscal impact on the provincial
government. Its bottom line is being squeezed from both ends. The net result of federal tax
and spending policies is a large, persistent draw of resources from the Ontario economy.
This leaves the Ontario government with fewer resources to provide the services that its
population wants and deserves. At the other end, transfers from the Ontario government to
municipalities have been one of the fastest-growing spending items and, even as that growth
moderates in our Status Quo Scenario, it will continue to grow faster than our overall target
for program spending.
Within this chapter, we divide our discussion of Ontario’s intergovernmental relations into
two subsections: federal-provincial relations and provincial-municipal relations.

450
Federal-Provincial Relations
Introduction: Federal-Provincial Context
The Economic Challenge
Despite the hurt caused by the recent global recession, Ontario continues its tradition
of punching above its weight in the federation. On a net basis, the federal government
persistently transfers large resources out of the province for redistribution elsewhere in
the country. It would be enough of a challenge for Ontario to prosper in an increasingly
competitive global economy with all its resources at its disposal.
The net flow of dollars out of Ontario can be assessed by comparing the federal government’s
revenues and expenditures in Ontario to the province’s population share. In 2009–10,
Ontarians contributed about 39 per cent of federal revenues; this appears fair as Ontario is
also home to 39 per cent of Canada’s population. Parity is as good it as it gets for Ontario in
recent history — 10 years prior, when they constituted 37.8 per cent of the Canadian
population, Ontarians provided 43.8 per cent of federal revenues. This gradual decline is
attributable to the erosion of Ontario’s economic advantage over other Canadian provinces
and the absence of province-specific features in the federal government’s tax structure.
On the expenditure side, the disparity is worse: despite its 39 per cent population share, only
34 per cent of federal program spending, in the form of services and transfers, was returned to
Ontario in 2009–10. This too is the most modest gap since 1999–2000, again in part reflecting
the loss of Ontario’s economic advantage.
The net result of this revenue and spending pattern on a per capita basis is worth about
$12.3 billion or 2.1 per cent of Ontario’s 2009 GDP.1 These are resources that would have
been available to Ontarians if not for the per capita net federal expenditure gap in
the province.
1 Calculations based on figures from the National and Provincial Accounts for 2009.

Chapter 20: Intergovernmental Relations
451
CHART 20.1 Ontario’s Share of Federal Revenue, Spending and Population
Notes: Federal revenue and program spending have been adjusted to include the Quebec Abatement. Excise taxes have been adjusted to be distributed on a per capita basis.Sources: Shares of contribution to federal revenue and program spending are from Statistics Canada’s Provincial Economic Accounts data, adjusted as described below. Federal budgetary balance data are from federal budgets and public accounts. Population figures are from Statistics Canada.
0
5
10
15
20
25
30
35
40
45
50
1999–00 2000–01 2001–02 2002–03 2003–04 2004–05 2005–06 2006–07 2007–08 2008–09 2009–10
Ontario’s Share of Federal Revenue
Ontario’s Share of Federal Program Spending
Ontario’s Population Share
Per Cent
A second measure illustrating this phenomenon requires a deconstruction of the Canadian
budget surplus (or deficit). In 2009–10, the federal government ran a $55.6 billion deficit.
Put another way, $55.6 billion more was spent on services and transfers across Canada plus
interest on the public debt than was recouped from Canadians in all provinces and territories.
However, knowing that Ontarians provided 39 per cent of federal revenues but benefited from
only 34 per cent of federal expenditures, we observe that Ontario received only $9.2 billion of
that $55.6 billion overspend.2 This is a full $12.3 billion shy of an equal per capita share,
matching the previous methodology, or 2.1 per cent of Ontario’s 2009 GDP. In recent times,
this gap has exceeded $20 billion — quite an astounding figure given Ontarians’ expectation
that their provincial government provide excellent public services that will enable the province
to compete on the global stage. For instance, over the period from 1999–00 to 2005–06,
the federal funding gap in Ontario relative to its equal per capita share averaged $19.1 billion,
or 4.0 per cent of Ontario’s GDP.
2 Based on federal revenues of $86.4 billion, program spending of $84.3 billion and public debt interest of $11.4 billion.

452
CHART 20.2 Nominal GDP per Capita,Ontario versus Rest of Canada
Sources: National Accounts and Ontario Economic Accounts.
Per Cent
70
75
80
85
90
95
100
105
110
115
120
125
130
1980 1985 1990 1995 2000 2005
Rest of Canada = 100
2009
Some degree of disparity is natural when Ontario has a comparative economic advantage
relative to other provinces. Progressive tax systems, for example, tend to extract more
revenue per capita from wealthier provinces. But this is no longer the case for Ontario:
per capita GDP has been below the national average since 2006, clearly demonstrating
the perverse structure of Canadian fiscal federalism.3
3 Calculation based on 2010 StatsCan data for provincial population and GDP.
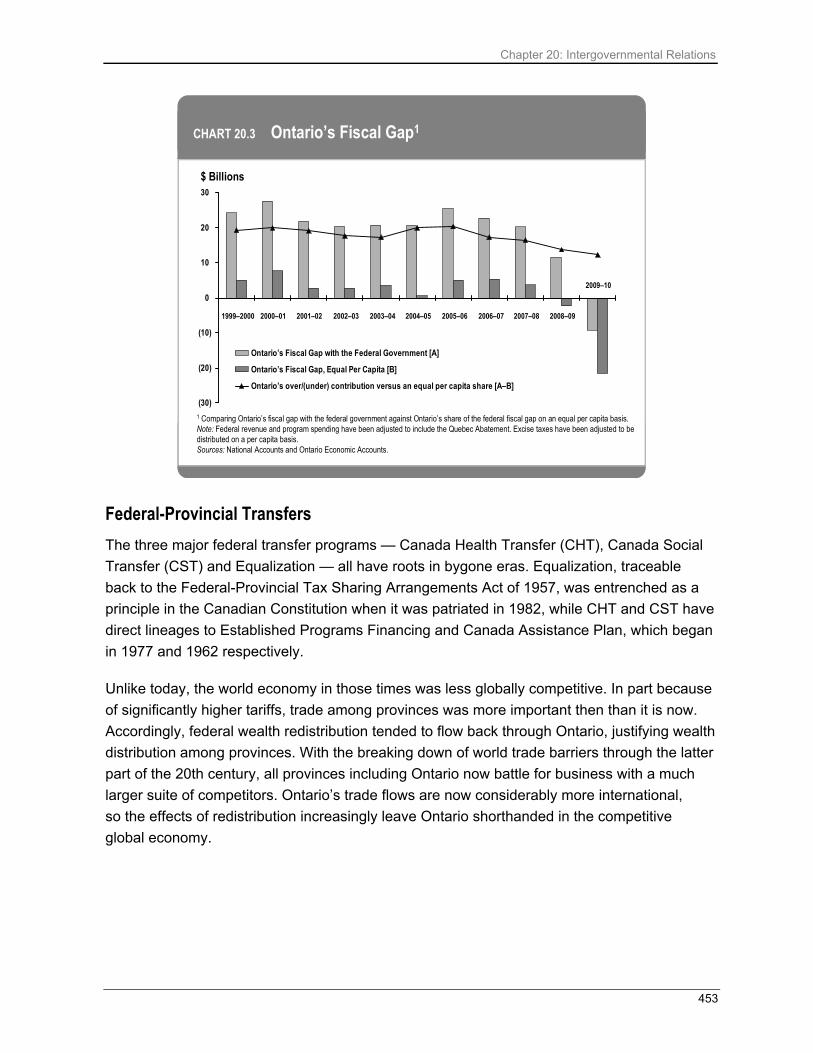
Chapter 20: Intergovernmental Relations
453
(30)
(20)
(10)
0
10
20
30
Ontario’s Fiscal Gap with the Federal Government [A]
Ontario’s Fiscal Gap, Equal Per Capita [B]
Ontario’s over/(under) contribution versus an equal per capita share [A–B]
CHART 20.3 Ontario’s Fiscal Gap1
1 Comparing Ontario’s fiscal gap with the federal government against Ontario’s share of the federal fiscal gap on an equal per capita basis.Note: Federal revenue and program spending have been adjusted to include the Quebec Abatement. Excise taxes have been adjusted to be distributed on a per capita basis. Sources: National Accounts and Ontario Economic Accounts.
$ Billions
1999–2000 2000–01 2001–02 2002–03 2003–04 2004–05 2005–06 2006–07 2007–08 2008–09
2009–10
Federal-Provincial Transfers
The three major federal transfer programs — Canada Health Transfer (CHT), Canada Social
Transfer (CST) and Equalization — all have roots in bygone eras. Equalization, traceable
back to the Federal-Provincial Tax Sharing Arrangements Act of 1957, was entrenched as a
principle in the Canadian Constitution when it was patriated in 1982, while CHT and CST have
direct lineages to Established Programs Financing and Canada Assistance Plan, which began
in 1977 and 1962 respectively.
Unlike today, the world economy in those times was less globally competitive. In part because
of significantly higher tariffs, trade among provinces was more important then than it is now.
Accordingly, federal wealth redistribution tended to flow back through Ontario, justifying wealth
distribution among provinces. With the breaking down of world trade barriers through the latter
part of the 20th century, all provinces including Ontario now battle for business with a much
larger suite of competitors. Ontario’s trade flows are now considerably more international,
so the effects of redistribution increasingly leave Ontario shorthanded in the competitive
global economy.
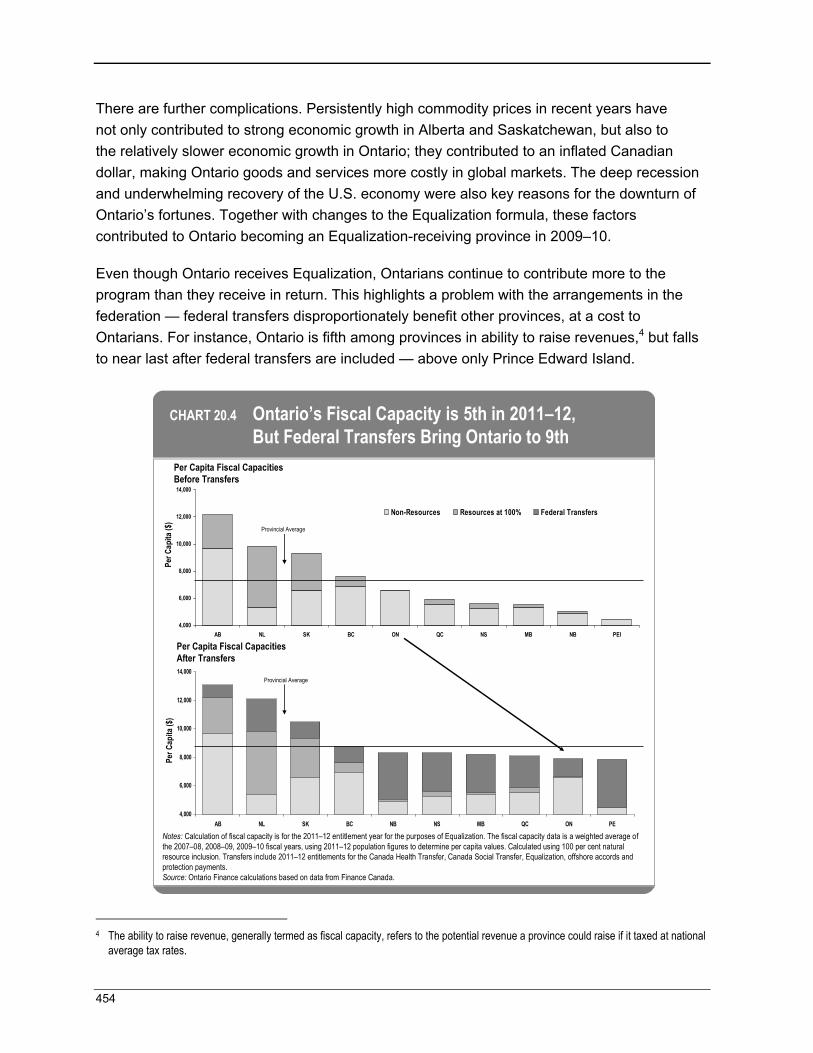
454
There are further complications. Persistently high commodity prices in recent years have
not only contributed to strong economic growth in Alberta and Saskatchewan, but also to
the relatively slower economic growth in Ontario; they contributed to an inflated Canadian
dollar, making Ontario goods and services more costly in global markets. The deep recession
and underwhelming recovery of the U.S. economy were also key reasons for the downturn of
Ontario’s fortunes. Together with changes to the Equalization formula, these factors
contributed to Ontario becoming an Equalization-receiving province in 2009–10.
Even though Ontario receives Equalization, Ontarians continue to contribute more to the
program than they receive in return. This highlights a problem with the arrangements in the
federation — federal transfers disproportionately benefit other provinces, at a cost to
Ontarians. For instance, Ontario is fifth among provinces in ability to raise revenues,4 but falls
to near last after federal transfers are included — above only Prince Edward Island.
Notes: Calculation of fiscal capacity is for the 2011–12 entitlement year for the purposes of Equalization. The fiscal capacity data is a weighted average of the 2007–08, 2008–09, 2009–10 fiscal years, using 2011–12 population figures to determine per capita values. Calculated using 100 per cent natural resource inclusion. Transfers include 2011–12 entitlements for the Canada Health Transfer, Canada Social Transfer, Equalization, offshore accords and protection payments.Source: Ontario Finance calculations based on data from Finance Canada.
Per Capita Fiscal Capacities Before Transfers
CHART 20.4 Ontario’s Fiscal Capacity is 5th in 2011–12,But Federal Transfers Bring Ontario to 9th
4,000
6,000
8,000
10,000
12,000
14,000
AB NL SK BC ON QC NS MB NB PEI
Non-Resources Resources at 100% Federal Transfers
4,000
6,000
8,000
10,000
12,000
14,000
AB NL SK BC NB NS MB QC ON PE
Per Capita Fiscal Capacities After Transfers
Per C
apita
($)
Per C
apita
($)
Provincial Average
Provincial Average
4 The ability to raise revenue, generally termed as fiscal capacity, refers to the potential revenue a province could raise if it taxed at national
average tax rates.

Chapter 20: Intergovernmental Relations
455
In addition, the federal government recently dictated changes to the CHT that will have a
negative impact on Ontario. Its recent commitment to move to a per capita cash transfer in
2014 without expanding the existing funding mechanism will result in an annual $400 million
hit to Ontario compared to the current formula. Tying future growth of the CHT to nominal
national economic output beginning in 2017 is certain to constrain payments further (more on
this later in the chapter). Outside the major transfers, the federal government has not
committed to renew other expiring transfers for infrastructure and labour-market training that
support vital public services.
Shared Policy Spaces Although Canada’s Constitution invests each order of government with certain responsibilities, overlap exists. In areas such as public safety and agriculture, the Constitution provides a role for both orders of government, federal and provincial. In other areas, modern issues that transcend traditional 19th-century constitutional divisions of roles and responsibilities have necessitated that governments work together.
This collaboration has resulted in many accomplishments, including the establishment of universal medicare, expansion of social services and reform of the tax system, but it has also presented challenges. As a result of this shared policy space, the actions of the federal government can sometimes cause disruptions to provincial fiscal planning and public services.
Public services and fiscal arrangements must be reformed for Ontario to address the fiscal, economic and demographic challenges that it faces. But this complex system of intergovernmental interdependence means that, in many areas, the province requires the co-operation of the federal government.
Towards Reforming Public Services
The purpose of this Commission is to provide recommendations to get Ontario back to balance
by 2017–18. But Ontario is not alone. Most governments in Canada, including the federal
government, are also facing budgetary pressures and are working towards fiscal sustainability
(see Chart 20.5). Now, perhaps more than ever, governments at all levels must work together
towards reforming public services.

456
*The federal government’s fiscal forecast indicates a return to budget balance in 2016–17. If the anticipated $4 billion in savings from the Strategic and Operating Review is achieved, the federal government could balance a year earlier.Sources: Various Budget and Fiscal Updates.
Fiscal Year Budget to be Balanced
CHART 20.5 Governments in Canada Are WorkingTowards Budgetary Balance
NL
SK
AB
PEI
NS
QC
BC
NB
MB
CAN*
ON
Balanced Budget as of 2011–12
Balanced Budget as of 2011–12
2016–172015–16 2017–182014–152013–142012–13
While independent, Canada’s two orders of government work collaboratively to serve their
citizens. But collaboration should not mean delivering the same services. Both federal and
provincial governments deliver services for labour-market training, immigration settlement and
corrections. This duplication creates an environment that is both inefficient and confusing
for citizens.
While improving co-ordination is often the instinctive response to dealing with duplication —
and in many circumstances is appropriate — sharper treatments too must be considered.
Often, co-ordination efforts require considerable resources that add up to a deadweight loss,
adding no value to the outcome of the program or service. Alternatively, a succinct delineation
of responsibilities can be more efficient, accountable and transparent. Provincial and federal
governments must not shy away from these choices.
The world is rapidly changing and the structure and arrangements of the Canadian federation
must keep pace. Ensuring that Ontario continues to have the capacity and flexibility to
compete on the world stage will reap dividends for the province and the federation. The time
for a new federal-provincial paradigm is now.

Chapter 20: Intergovernmental Relations
457
Potential Federal Impacts on Ontario’s Fiscal Position
Recommendation 20-1: Establish an understanding with the federal government that actions
taken at the federal level pose fiscal risks to Ontario.
Prime examples of these risks include:
Changes to the common tax base;
Changes to the Criminal Code;
Reducing support for immigration settlement services; and
Long-term health costs likely outpacing federal funding.
In some sectors, both federal and provincial governments work together to provide services
to citizens. This partnership has resulted in many accomplishments but has also created
challenges, particularly when the actions of the federal government have effects on provincial
fiscal planning and public services. Some notable examples: in the mid-1990s, the federal
government significantly reduced transfer payments for health care and education; in 2005,
it cut support for child care, forcing Ontario to step in with more funding; and more recently,
it has been underfunding settlement agencies in Ontario.
TABLE 20.1 Examples of Federal Actions and their Effects on Ontario Federal Action Effect on Ontario Mid-1990s Cuts to Provincial Transfers
The federal government cut transfers for health, post-secondary education and social services from $18.8 billion in 1993–94 to $12.5 billion in 1997–98 nationally. This drastic cut severely impacted provincial health and education systems, and put significant pressure on provincial budgets.
Federal Income Tax Error (T3 Error Forgiveness)
The federal government revealed in January 2002 that overpayments of $2.8 billion were made to Ontario for the 1993 to 1999 tax years. Although overpayments were made to other provinces, only Ontario has been required to pay back a portion of the error, amounting to $1.3 billion over 10 years.
Termination of the 2005 Early Learning and Child Care Agreement (ELCC)
In 2006, the federal government terminated the 2005 ELCC Agreement with provinces, which put 8,500 child care spaces at risk. In its 2010 Budget, the province stepped in with a $63.5 million annual investment to maintain these spaces.
Underspending for Immigration Services
Breaking its commitment under the Canada-Ontario Immigration Agreement, the federal government underspent by more than $220 million in Ontario immigration settlement services.
Error in Calculation of 2011–12 Equalization Entitlements
The federal government committed an error in its calculation of 2011–12 Equalization entitlements, which disrupted provincial fiscal planning by $700 million over three years.
Source: Ontario Ministry of Finance.

458
Changes to the Common Tax Base
Ontario and the federal government share common bases for personal and corporate income
taxes and the HST, which simplify the process of filing tax returns. Proposed federal changes
on income splitting and Tax-Free Savings Accounts would affect the shared personal income
tax base because Ontario would probably mirror these changes to maintain similarity. These
two proposals alone could result in $1.3 billion less revenue for Ontario per year. Additionally,
Ontario parallels certain federal tax provisions for businesses, such as the base of the federal
Scientific Research and Experimental Development tax credit, to reduce the complexity of the
tax system and minimize administrative and compliance costs. Federal changes to these tax
measures affect both Ontario businesses and the province’s tax system, and should only be
done in consultation with the province.
Changes to Canada’s Criminal Code
Responsibility for the Criminal Code rests with the federal government while responsibility
for implementation lies mainly with provinces. Changes to federal crime legislation can place
further demands on the provincial court and corrections system, adding to the fiscal burden
on provinces. For example, as outlined in Chapter 14, Justice Sector, the new “tough on crime
legislation” is expected to result in ongoing costs of $22 million to $26 million annually. It also
risks creating the need for an additional facility, with an estimated capital cost of $900 million
and additional ongoing costs of about $60 million per year.
Reducing Support for Immigration Settlement Services
In 2005, the federal and Ontario governments agreed to increase funds for immigration
settlement services in the province. However, the federal government has underspent relative
to its commitment under this Canada-Ontario Immigration Agreement (COIA) by more than
$220 million. The success of immigrants could be impaired without adequate services to help
newcomers settle, integrate, receive language training and find work. The federal government
informed Ontario in 2010 that funding for Ontario settlement agencies will be further reduced
by $44 million in 2011–12.

Chapter 20: Intergovernmental Relations
459
Long-Term Health Costs Likely Outpacing Federal Funding
The CHT, along with the Wait Times Reduction Fund (which is also set to expire in 2013–14),
provides valuable resources to provincial health systems. The federal government has
committed to retaining the six per cent growth rate on the CHT until 2016–17, but its growth
beginning in 2017–18 will be tied to a three-year moving average of Canada’s nominal GDP
growth, with a three per cent floor. While we recommend capping the growth in Ontario health
expenditures below that level to achieve a balanced budget by 2017–18, the long-run cost of
health care will almost certainly grow at a rate above nominal GDP. The effects of Ontario’s
aging population on health costs will not ramp up considerably until after the six per cent
growth rate is no longer in effect. And as a “luxury good” — purely in the microeconomic
sense — demand for health care services tends to increase faster than income. One estimate
implies that a four per cent rise in nominal GDP results in additional 6.4 per cent growth in
health care costs.5
Moving to a GDP-based growth rate is not an insignificant issue. In 2017–18, the new growth
rate based on GDP would cost Ontario almost $239 million based on current forecasts6
but could reach almost $421 million if GDP growth falls to the three per cent floor. These gaps
will grow over time. In 2023–24, Ontario’s CHT share could be $2.3 billion to $3.8 billion lower
than under the current formula. By constraining CHT transfers to nominal GDP growth, the
federal government’s minority share of health care funding in Ontario, as in other provinces,
is likely to steadily decline even further in the long run. This must be factored into Ontario’s
fiscal and health policy design.
5 R.W. Fogel, “Forecasting the Cost of U.S. Healthcare in 2040,” Journal of Policy Modeling 31 (2009), no. 4, pp. 482–88. 6 Assumes a flat line of the 4.3 per cent federal forecast for nominal GDP growth in 2016, as presented in the 2011 Update of Economic
and Fiscal Projections.

460
0
5,000
10,000
15,000
20,000
25,000
2011–12 2013–14 2015–16 2017–18 2019–20 2021–22 2023–24
Source: Ontario Ministry of Finance.
CHART 20.6 CHT Payments to Ontario under Different Growth Scenarios
$ Millions
Growth at 3%
Growth at 6%
Growth at GDP
Negotiations for the Canada-European Union Free Trade Agreement (CETA) The outcome of the negotiations for a comprehensive free trade agreement with the European Union could have significant impact on the cost of prescription drugs in Ontario. A key negotiating point, the extension of Canadian patent protections for pharmaceutical drugs to European standards, could cost Ontario taxpayers up to $1.2 billion annually ($551 million for the Ontario government and $672 million for the private sector), thus wiping out gains from recent drug reforms. The province should work with the federal government to ensure that a CETA does not undermine Ontario’s interest in expanding the use of generic drugs.
Aside from the major transfers,7 the federal government has made no commitment to renew
any other expiring transfer. These transfers support health, labour-market training and
infrastructure in addition to other vital public services that could otherwise be at risk.
7 Major transfers include Equalization, Canada Health Transfer and Canada Social Transfer.

Chapter 20: Intergovernmental Relations
461
TABLE 20.2 Selected Examples of Transfers Set to Expire in 2013–14
Transfer 2011–12 Payment to Ontario
Function
Wait Times Reduction Fund $97 million Supports provinces for initiatives to reduce wait times. Labour Market Agreement $0.2 billion Supports provincial training measures for unemployed
workers not eligible for Employment Insurance benefits. Labour Market Agreement for Persons with Disabilities
$0.1 billion Provides funding for employment programs for persons with disabilities.
Building Canada Plan $0.2 billion Provides support for investments in infrastructure. Source: Ontario Ministry of Finance.
In the mid-1990s, provinces and territories endured major cuts to federal transfers that put
pressure on their fiscal plans and public services. At a time when Ontario is moving to sustain
and improve both, the province needs a reliable and predictable federal partner.
“Federal involvement in areas of provincial jurisdiction can undermine the ability of provinces to plan and deliver the services and programs for which they are responsible. When the federal government moves in and out of social policy and programs, it is disruptive to provincial plans and leaves provinces on the hook financially for picking up programs it abandons.”
M. Mendelsohn, J. Hjartarson and J. Pearce, “Saving Dollars and Making Sense,” 2010, Mowat Centre for Policy Innovation.

462
Areas for Potential Reform
Through its programs, policies and transfers, the federal government plays an important role
in the provision of public services in Ontario. Some federal programs that directly serve
Ontarians or fiscal arrangements that support provincial services should be modernized
and reformed.
Recommendation 20-2: Advocate strongly for reforming federal programs that are not
working effectively in Ontario’s interests.
Equalization
The Equalization program constitutionally mandates the federal government to ensure that
provinces have the ability to “provide reasonably comparable levels of public services at
reasonably comparable levels of taxation.” Provinces unable to raise revenues at the national
average standard are provided with payments funded through federal taxation.
Over the past 10 years, Ontarians have contributed almost $45 billion more to the Equalization
program through their contribution to federal revenue than they have received back in
Equalization payments. Additionally, Ontario’s per capita GDP is slightly less than the national
average8 and at 7.7 per cent its unemployment rate is above the 7.5 per cent national rate.9
Yet, as noted earlier in the chapter, federal spending in and transfers to Ontario falls short of
an equitable share of its revenues. Further, there is no requirement under the funding formula
for provinces to include full resource revenues in the redistribution equation, to Ontario’s
considerable detriment. The Equalization program requires reform.
“Ontario has yet to find its competitive positioning in the new global economy, in part because it has been the largest net contributor to federal regional subsidies for over 50 years and has been unable to build a more globally competitive economy as a result.”
Joe Cordiano and David MacKinnon, “New Regional Policies Are Urgently Needed,” Ottawa Citizen, June 24, 2011.
Despite rising fiscal disparities among provinces, the federal government introduced a ceiling
on Equalization in 2009 that limited the size of the program to the growth rate of national GDP.
As a result, the program equalizes less now than at any other time in the previous 20 years,
measured as a proportion of GDP. Under this ceiling, Equalization cannot fully capture and
share the wealth generated from high commodity prices in other regions of Canada.
8 $46,303 versus $47,605; as calculated using 2010 CANSIM data accessed in January 2011, downloaded from
http://www40.statcan.ca/l01/cst01/econ15-eng.htm or http://www40.statcan.gc.ca/l01/cst01/demo02a-eng.htm. 9 Figures from December 2011.

Chapter 20: Intergovernmental Relations
463
Note: Population is a weighted average of data from 2007–08, 2008–09 and 2009–10.Source: Finance Canada.
CHART 20.7 2011–12 Equalization Entitlements by Province
2,351
1,983
1,3791,245
1,006
170
0
500
1,000
1,500
2,000
2,500
PEI NB MB NS QC ON
$ Per Capita
In addition, the program does not account for differences in price levels across the country,
which affect the cost of public services. Ontario faces higher cost pressures than other
provinces (see Chart 20.7). Even with its Equalization payment, Ontario may not be able to
deliver “comparable levels of public services” because of these additional cost pressures.
Similar to other equalization programs across the world, Equalization should recognize and
address these differences in prices.
Recommendation 20-3: Advocate for reforms to Equalization by, at a minimum, fully
capturing resource revenues and accommodating differing price levels between provinces.

464
CHART 20.8 Intercity Price Index, 2009
85
90
95
100
105
110
Toronto, O
N
Ottawa-G
atinea
u, ON/Q
C
Edmonton, AB
Vanco
uver, BC
Halifax,
NS
Charlotte
town, PEI
Regina, SK
St. John's,
NF
Saint J
ohn, NB
Montréal,
QC
Winnipeg, M
B
Rel
ativ
e Pr
ice
Inde
x
Average
Source: Statistics Canada.
“It is important to note that Ontario’s actual per capita revenues are, after equalization, less than those of any traditional have-not province… It will cost more (i.e. require more revenue) for Ontario to provide one such bundle [of public services] than it will for any of the traditional recipients, because wages and prices are higher here.”
Tom Courchene, “Economy, Ontario: Have Not Province,” Sept. 20, 2011, Mowat Centre for Policy Innovation.
“…in many important ways, residents of the have provinces of British Columbia, Alberta and Ontario receive lower levels of government services than do taxpayers in the have-not provinces whose government activities they subsidize.”
Ben Eisen and Mark Milke, Frontier Centre for Public Policy, 2010.

Chapter 20: Intergovernmental Relations
465
Canada Social Transfer
Canada’s fiscal arrangements have served to narrow fiscal inequities through cash transfers
but experts have argued for more structural reform — to allow provinces to raise more of
their own revenues to fund their services. There is a clear basis to this argument.
As noted, the federal government generates revenues from Ontario at a rate very close to
an equal per capita basis. The CST then returns money to the province, again on an equal
per capita basis. Unlike the CHT, where provinces are technically required to adhere to the
Canada Health Act, there are no such provisions for the CST. It is a block transfer with
effectively no strings attached — little more than a semantic shell game. This unnecessary
step is a source of inefficiency and reduces both accountability and transparency, but it
also presents an opportunity for reform.
Without a clear purpose, the CST should be eliminated and transferred to provinces in the
form of tax points. The federal government should reduce its taxes so provinces could
increase theirs by an equivalent, revenue-neutral amount. A similar approach was undertaken
in 1977 when the federal government transferred personal and corporate income tax points
to the provinces. It should be done again.
Recommendation 20-4: Simultaneously eliminate the Canada Social Transfer and transfer
the equivalent tax points to the provinces.
Employment Insurance
A growing number of organizations have criticized the federal Employment Insurance (EI)
program for not meeting the needs of the modern labour market. In 2010, Ontarians
contributed about 40 per cent of EI premiums, but received only 32 per cent of benefits.
Despite being one of the hardest-hit provinces during the global economic recession and
with the province’s unemployment rate above the national average,10 Ontarians’ coverage
remained near the lowest in the country, with only 32 per cent of the unemployed receiving EI.
This inadequate coverage in EI benefits also restricts Ontarians’ eligibility for training
measures associated with EI.
It is clear that the system needs reform. The changes recommended by the Mowat Centre
for Policy Innovation,11 including a single national entrance requirement, as well as consistent
formulas to calculate benefit durations and levels, would improve outcomes for Ontario
workers and employers.
See Chapter 8, Social Programs, for the full recommendation.
10 As of December 2011. 11 Mowat Centre EI Task Force, “Making It Work: Final Recommendations of the Mowat Centre EI Task Force,” 2011, Mowat Centre for
Policy Innovation.

466
0
20
40
60
80
100
120
NL PE NS NB QC ON MB SK AB BC
Note: EI coverage rate refers to EI regular beneficiaries as a per cent of unemployed persons. Some EI regular beneficiaries are not accounted for in Statistics Canada’s definition of unemployed persons, which results in EI coveragerates exceeding 100 per cent in Newfoundland. EI Part II is not included.Source: Statistics Canada.
Per Cent
CHART 20.9 Employment Insurance Coverage, September 2011
Excluding Ontario, the average coverage rate for other provinces is 50.5 per cent.
Income Assistance for Persons with Disabilities
Individuals with severe disabilities face significant barriers to participating in the labour
force, gaining employment and earning a decent wage (see Chart 20.10). Those with severe
disabilities are half as likely as those without disabilities to participate in the labour force.
Those who are active in the labour force are twice as likely to be unemployed, and earn over
40 per cent less if they can find a job. As described by the Caledon Institute, people with
severe disabilities “have a tenuous relationship to the labour force.”12
12 Michael Mendelson, Ken Battle, Sherri Torjman and Ernie Lightman, “A Basic Income Plan for Canadians with Severe Disabilities,”
November 2010, Caledon Institute of Social Policy.

Chapter 20: Intergovernmental Relations
467
Chart 20.10 Employment Outcomes for Persons with Disabilities, 2006
0
5,000
10,000
15,000
20,000
25,000
30,000
35,000
40,000
Without Disability Mild Disability Moderate Disability Severe or Very SevereDisability
0
10
20
30
40
50
60
70
80
90
Average Income Participation Rate Unemployment Rate
Source: Statistics Canada’s Participation and Activity Limitation Survey, 2006.
Average Income ($) Per Cent
These vulnerable individuals are currently served by a “tangled safety net” that includes
disability benefits from the Canada Pension Plan (CPP) disability benefit, federal disability tax
credit and provincial social assistance programs. However, assistance from CPP and disability
tax credit is of little benefit to individuals who are detached from the labour market. In addition,
provincial social assistance programs, which already serve 22 per cent of those with severe
disabilities, are overburdened.
See Chapter 8, Social Programs, for the full recommendation.
Immigration Policy
Immigration will be an increasing source of growth for Ontario’s working-age population and
economy. As discussed in Chapter 10, Immigration, the integration of these newcomers into
society and the workforce requires effective settlement and integration services, in addition
to health, social and education services. Despite this, the federal government underinvested
in settlement services in Ontario from 2005 through 2011 compared to its commitment to
the province, and plans to further reduce its immigration settlement spending in Ontario in
2011–12 and beyond. Moreover, Ontario is allowed to nominate only 1,000 principal
applicants through its Provincial Nominee Program, compared to 5,000 for Alberta.

468
The province requires greater influence in determining the policy that governs immigration to
meet Ontario’s specific needs. In addition, the federal government should provide the province
with the tools it needs to effectively integrate these newcomers by devolving immigration
services, with funding, to Ontario.
The federal government should also look to jurisdictional best practices, particularly in the
area of foreign credential recognition, where non-recognition too often gets in the way of
a newcomer’s ability to participate in the labour force. Australia’s Pre-Application Skills
Assessment is promising and an equivalent program should be piloted in Canada.
See Chapter 10, Immigration, for the full recommendation.
TABLE 20.3 Selected Examples of Federal-Provincial Immigration Agreements Responsibility for immigrant selection and management of settlement services is devolved to the province.
Quebec (1991)
Province is responsible for planning and delivering settlement services on behalf of the federal government; compensation is provided.
Manitoba (1996) British Columbia (1998)
Planning of settlement services is co-managed by provincial and federal governments, but federal government is responsible for delivery; formal consultation mechanisms exist and partnerships with municipalities are identified as an objective.
Ontario (2005) Alberta (2007)
Source: Nick Bradford and Caroline Andrew, “The Harper Immigration Agenda: Policy and Politics in Historical Context,” in How Ottawa Spends 2011–12, Christopher Stoney and G. Bruce Doern, eds., 2011.
Education for First Nations On-Reserve
There is an alarming gap in the educational attainment rate between on-reserve First Nations
and the non-Aboriginal population. Improving educational outcomes on reserves is crucial to
improving the social and economic outcomes of First Nations peoples. A serious investment
in on-reserve education has the potential to increase their economic inclusion and reduce the
long-run strain on public resources by reducing above-average demand for government
programs such as health care, social services and the justice system.
It is commonly noted that federal funding for on-reserve education falls short of the per-student
provincial average, making it difficult to achieve the goal of “provincial comparability.”
The Commission believes there is an urgent need to significantly reform the provision of
on-reserve First Nations education. The province should put strong pressure on the federal
government to provide funding for First Nations on-reserve education that at least reaches
parity with per-student provincial funding for elementary and secondary education. Barring
the action that is clearly justified and desperately needed, the province should step up and
fill this gap.
See Chapter 6, Elementary and Secondary Education, for the full recommendation.

Chapter 20: Intergovernmental Relations
469
Green Energy
The federal government has provided little support for Ontario’s move towards green energy.
Yet it provides direct and indirect subsidies to Canada’s oil and gas sectors worth $1.4 billion
annually,13 in addition to $2.0 billion in total spending14 for carbon capture and storage, the
Clean Energy Fund and the ecoEnergy Technology program — all of which are primarily spent
in two provinces. Even where the federal government has promised support for clean energy,
most has been directed to fossil fuels and projects that do not build on Ontario’s strengths.
Ontario needs fair and equitable support for its clean energy initiatives.
Recommendation 20-5: Advocate for federal greenhouse gas mitigation programs to provide
fair and equitable support for Ontario’s clean energy initiatives.
Working Together to Rationalize Public Services
The purpose of this Commission is to provide recommendations to get Ontario back to
balance by 2017–18. This includes making existing services more efficient. Given the level
of interdependency in the Canadian federation, Ontario cannot seek these efficiencies alone.
Services overlap and are inefficiently allocated between the two orders of government.
Recommendation 20-6: Sort out areas of responsibility with the federal government where
there is overlap and duplication and establish a more efficient economic and fiscal relationship
that saves money and provides better services to citizens.
There are opportunities to reshape roles and responsibilities to capture efficiencies and
improve effectiveness. This discussion could start by examining:
The inefficiencies in overlapping employment and labour-market training services;
The effectiveness of federal immigration settlement programs;
The gains from each government specializing in corrections services;
The collaboration in direct citizen transactional services;
The benefit of a national transit strategy; and
The rationalization of environmental protection activities and regulations.
13 Department of Natural Resources Canada, downloaded from http://www.nrcan.gc.ca/energy/science/programs-funding/1477 and
http://www.nrcan.gc.ca/energy/science/1335. 14 M. Bramley, “Evaluation of the Government of Canada’s Greenhouse Gas Reduction Policies,” prepared for the Climate Change
Performance Index 2011, Pembina Institute, p. 2, downloaded from http://www.pembina.org/pub/2129.

470
“Due to large budget deficits, particularly at the provincial level, there is considerable public concern over the sustainability of existing government services. These pressures are not temporary. An aging population means that public services will be under increasing strain, making rationalization of program delivery necessary.”
M. Mendelsohn, J. Hjartarson and J. Pearce, “Saving Dollars and Making Sense,” 2010, Mowat Centre for Policy Innovation.
Employment and Training Services
Ontario is best positioned to deliver employment and training services that meet the changing
needs of its labour market, and fit coherently into its larger human capital agenda that
incorporates other programs such as post-secondary education.
“Workforce development … has a deep historic relationship to higher and post-secondary education, since many aspects of labour market training are delivered by community colleges, part of the higher education sector. Devolution has provided provincial governments with enhanced flexibility to tailor employment and training programs and services that are responsive to provincial and local labour market conditions and political directions.”
Donna Wood and Thomas Klassen, “Bilateral Federalism and Workforce Development Policy in Canada.”
“Budget 2007 delivers on that commitment through a comprehensive new labour market training architecture that will provide labour market programming to those who need it…by recognizing that provinces and territories are best placed to design and deliver this programming…With the full implementation of this new architecture, in combination with existing provincial and territorial labour market programming, Canadians will have access to integrated labour market programming delivered by provinces and territories that can be tailored to their specific needs.”
2007 Federal Budget.
Recognizing that provinces are best positioned to deliver training programs, the federal
government devolved responsibility for training programs associated with EI to Ontario in
2007. This devolution, funded through an allocation under the Employment Insurance Act,
requires that corresponding provincially delivered programs need to be similar to the original
federal training programs and that clients must be eligible for EI.
The federal government continued to provide support to provincial training programs by
creating a number of agreements — each with its own client eligibility criteria, program design,
and reporting and accounting requirements. For example, the Labour Market Development
Agreement only supports services for EI-eligible job seekers (only 31 per cent of EI Part II
funding flowing to Ontario). In addition, the Targeted Initiative for Older Workers supports
services for only older workers. For job seekers, this fragmentation presents a confusing
environment comprising multiple offices and locations, exacerbating an already stressful time.

Chapter 20: Intergovernmental Relations
471
As discussed in Chapter 9, Employment and Training Services, the fragmented nature of
these agreements also limits the province’s ability to maximize the benefits and savings that
fully integrated services and streamlined reporting requirements would provide, and results
in fragmented and distorted policy-making.
TABLE 20.4 Labour-Market Transfers
Agreements Eligibility Labour Market Development Agreement
Primarily targeted to Employment Insurance (EI) clients.
Labour Market Agreement Unemployed individuals who are not EI eligible such as social assistance recipients, immigrants and other key groups. Employed individuals who are low skilled (no high school diploma or recognized certification).
Targeted Initiative for Older Workers
Laid-off workers aged 50 and over (primarily targeted to those aged 55 to 64). Must be in communities of less than 250,000 people that have high unemployment or a high reliance on single industries.
Labour Market Agreement for Persons with Disabilities
Employment-related programming for persons with disabilities.
Source: Ontario Ministry of Training, Colleges and Universities.
The devolution is not complete. In its 2007 budget, the federal government committed
to exploring the transfer of around $500 million annually to allow provinces to deliver the
remaining federal training programs. These programs include services for youth and persons
with disabilities, which overlap with existing provincial programming. Despite this commitment,
the federal government has not yet consulted the provinces on further devolution.
Ontario’s services for youth and persons with disabilities are effective. Client surveys indicate
that both participants and employers are satisfied with programs. The transfer of responsibility
for the training of these groups would allow the province to integrate remaining federal
programs into the existing suite of effective provincial services. This would improve the quality
of programming and outcomes for job seekers, while achieving efficiencies through
administrative savings.
TABLE 20.5 Outcomes from Select Summer Jobs Services
Client Satisfaction Year Number of Placements
Participant Employer 2009–10 48,108 96% 99% 2010–11 59,161 96% 99% Source: Ontario Ministry of Training, Colleges and Universities.

472
Several labour-market agreements expire after 2013–14, presenting an opportunity for reform.
The current patchwork of labour-market agreements for persons with disabilities, older
workers, EI or non-EI recipients should be replaced with a flexible per-capita transfer that is
wholly funded outside of the EI program, with streamlined reporting requirements and that
includes the further devolution of residual training programs for youth and persons with
disabilities. Greater flexibility for Ontario would allow the province to continue adapting the
full suite of labour-market programs to keep pace with the changing needs of its labour force.
See Chapter 9, Employment and Training Services, for the full recommendation.
Immigration Settlement and Integration Services
Given the importance of immigration to the growth of Ontario’s labour force and economy,
it is crucial that newcomers are effectively integrated into the community and the labour
force so they can fully realize their potential.
Both the federal and Ontario governments provide immigration settlement services. Although
both governments share the same values and desired outcomes, significant overlap in
services and administration exists, which creates inefficiencies and reduces co-ordination.
“The Manitoba and BC experiences provide evidence that devolution can provide the space for innovation and adaptation to changing circumstances and the needs and views of the settlement sector.”
F. Leslie Seidle, “The Canada-Ontario Immigration Agreement.”
“Even countries with traditions of highly centralized government, such as the United Kingdom, are now experimenting with new devolutionary, decentralized arrangements.”
Myer Siemiatycki and Phil Triadfilopoulos, “International Perspectives on Immigrant Service Provision.”
Experts agree that responsibility for integrating newcomers should lie with regional or
local authorities, which can design programs that best meet regional needs. Ontario could
also integrate federal settlement services into its existing suite of settlement programs
(see Table 20.6), in addition to programs for education, training and social services.
Settlement programs have been devolved to provincial governments in British Columbia,
Manitoba and Quebec, but the federal government has not agreed to do the same for Ontario.

Chapter 20: Intergovernmental Relations
473
TABLE 20.6 Examples of Provincial Programs to Settle and Integrate Newcomers
Program Achievements Bridge Training Over 100 different highly skilled, in-demand occupations have been targeted with Ontario
Bridge Training Programs. Approximately 70 per cent of participants who complete bridge training programs targeting licensure obtained licensure in their profession within a year of completing the program. On average, 65 per cent of participants who completed bridge training programs obtained employment in their field within a year of completing the program.
Language Training 94 per cent of learners surveyed responded that their class would be either “helpful” (33 per cent) or “very helpful” (61 per cent) in reaching their goals.
Newcomer Settlement Program
97 per cent of service users report a high overall level of satisfaction with the services they received, and find the services useful and relevant. 78 per cent say that they can make more informed decisions about their new life in Ontario after receiving services. 75 per cent indicate that they are more knowledgeable about services and how to access them.
Global Experience Ontario
Over 90 per cent of clients who met with GEO advisors indicated that they were satisfied with the overall quality of services they received.
Source: Ontario Ministry of Citizenship and Immigration.
With the expiration of the COIA, anticipated reductions in federal immigration settlement
spending, and the growing importance of immigration to Ontario’s economy, the federal
government should provide the province with the tools it needs to effectively integrate
newcomers by devolving settlement services to Ontario, with funding. Devolution would
produce savings through rationalization and generate better outcomes for newcomers.
See Chapter 10, Immigration, for the full recommendation.
Corrections Services
Effective rehabilitation services help keep communities safe and control correctional
expenses. But the current arrangement for allocating responsibilities for inmates prevents
Canada’s correctional sector from maximizing the benefits of these services. Offenders
sentenced to two years or less serve their terms in provincial prisons while the remainder
serve in federal penitentiaries. Effective rehabilitation services can be provided for inmates
serving longer than six months. However, provincial inmates serving sentences longer than six
months (and under two years) do not constitute a critical mass for provinces to provide
rehabilitation services at scale.

474
Furthermore, recent federal changes to the Criminal Code put fiscal pressures on provincial
court and correctional services. The Commission recommends that the Ministry of Community
Safety and Correctional Services explore the possibility of uploading responsibility for inmates
serving six months and longer to the federal government, which would better align fiscal
incentives for corrections, and would give these inmates access to federal rehabilitation
services. In addition, the uploading of these responsibilities would allow governments to
specialize and enhance their services to reduce recidivism, which could reduce long-run
costs while making communities safer.
See Chapter 14, Justice Sector, for the full recommendation.
Citizen Transactional Services
The Ontario government has transformed the way front-line public services are delivered with
the creation of ServiceOntario, which integrates the services delivered by various ministries
into one easy-to-access location. ServiceOntario has reduced wait times, improved
accessibility and achieved efficiencies.
The province has worked with the federal government to deliver integrated services such as
the Newborn Registration Service, BizPaL and a single 1-888 number for business, in addition
to co-locating four shared offices. The federal, provincial and municipal governments should
continue to explore other opportunities to work together and deliver integrated, seamless and
timely solutions for citizens.
See Chapter 16, Operating and Back-Office Expenditures, for the full recommendation.
National Transit Strategy
Despite Canada’s enormous geographical size, it is one of the world’s most urbanized
countries. Eighty per cent of Canadians live in urban centres. Unsurprisingly, traffic congestion
is not limited to the Greater Toronto and Hamilton Area or Ontario. It is a systemic issue from
coast to coast, justifying a national approach. Indeed, the federal government is affected by
gridlock as much as any province through lost productivity and tax revenue; in 2006, Transport
Canada noted that congestion poses a national challenge in terms of the costs it imposes in
lost time, increased fuel consumption, and increased greenhouse-gas emissions.15 And the
Canadian Chamber of Commerce has noted that despite Canada’s urban nature, it is the sole
member nation of the Organization for Economic Co-operation and Development that lacks a
national transit strategy.16
See Chapter 12, Infrastructure, Real Estate and Electricity, for the full recommendation.
15 Transport Canada — Environmental Affairs, “The Cost of Urban Congestion in Canada,” March 22, 2006, downloaded from
http://www.gatewaycouncil.ca/downloads2/Cost_of_Congestion_TC.pdf. 16 Canadian Chamber of Commerce, “Strengthening Canada’s Urban Public Transit System,” downloaded from
http://www.chamber.ca/images/uploads/Resolutions/2009/T-Strengthening_Canada.pdf.

Chapter 20: Intergovernmental Relations
475
Environmental Protection and Regulation
Environmental management is a responsibility shared by both orders of government. Some
major projects are subject to the assessment and regulation of both jurisdictions, which
creates complexity and uncertainty for proponents.
To reduce duplication and streamline environmental assessment, Ontario signed the
Canada–Ontario Agreement on Environmental Assessment Co-operation in 2004, which
commits both governments to conduct a co-operative assessment while retaining their
respective decision-making powers.
However, more remains to be done to streamline environmental assessments and harmonize
regulations. As discussed in Chapter 15, Labour Relations and Compensation, the federal
government is currently reviewing its legislation governing federal environmental assessments,
the Canadian Environmental Assessment Act, and has expressed interest in the removal of
duplication between approvals processes. The Commission recommends that the federal and
provincial governments continue to press ahead in their efforts to create a “one project–one
environmental assessment” approach that continues to maintain high environmental
standards.
See Chapter 13, Environment and Natural Resources, for the full recommendation.
Summary
Canadians are served by two orders of sovereign governments that, while independent,
should work collaboratively to serve their citizens. But collaboration and working together do
not necessarily mean delivering the same services. Rather, collaboration means having a
dialogue on rationalizing and disentangling services or, where necessary, working together
towards common objectives.
“Nineteenth century institutional arrangements groan under the weight of 21st century pressures.”
M. Mendelsohn, J. Hjartarson and J. Pearce, “Saving Dollars and Making Sense,” 2010, Mowat Centre for Policy Innovation.
Having a strong federal partner means a federal government that is willing to discuss
transformative changes to how the federation works. The arrangements within and structure
of the federation must keep pace with a rapidly changing world.

476
Provincial-Municipal Relations
The provincial-municipal relationship in Ontario is complex and intertwined. There are
444 municipalities in Ontario, ranging in population from over 2.5 million in the City of Toronto
to fewer than five permanent residents in the Township of Cockburn Island. Municipalities
have shared responsibility for many important areas of public policy and provide many of their
services based on provincial legislation, requirements and standards. Examples of municipal
service delivery include social housing, social assistance, drinking water quality, public
transportation, land use planning and waste management.
Significant strides have been made in recent years to stabilize and strengthen the
provincial-municipal relationship. However, as we highlight in the federal-provincial section,
intergovernmental arrangements must keep pace with a rapidly changing world. While it is
important that the province and municipalities continue to have dialogue on improving
co-ordination of services, as discussed previously, a sharper delineation of responsibilities
between governments may be more prudent. For municipal service delivery, the Commission
has noted that quite often all three levels of government are involved in delivering programs
and services, and in some cases, a fourth layer is added through the involvement of non-profit
or community service organizations. This causes service delivery confusion, duplication of
efforts and additional bureaucracy. A thorough review of funding and service delivery
relationships and responsibilities may prove to be useful in providing clarity.
Provincial support to municipalities has increased significantly in recent years, and it is
important that both levels of government work together to ensure that these provincial
investments result in tangible outcomes for Ontarians.
The Fiscal Relationship
Municipalities raise most of their annual revenues from their own sources; these include
property taxation, user fees and licences, and other revenues such as investment income,
development charges, donations and so on. These sources accounted for 78 per cent of
municipal annual revenues in 2009 (see Chart 20.11). Yet provincial transfers remain an
important source of funding for municipalities — nearly one-fifth of their annual revenues
(see Chart 20.11). These transfers include the provincial share of funding for cost-shared
programs, as well as unconditional funding provided through the Ontario Municipal
Partnership Fund (OMPF).

Chapter 20: Intergovernmental Relations
477
Ontario Grants $7.1B18%
User Fees and Licences
$8.2B21%
Property Taxation$15.7B
41%
Canada Grants $1.3B
4%
Other Revenues* $6.1B16%
*Other Revenues includes investment income, deferred revenue earned (development charges), donations, revenue from other municipalities, fines and penalties.Note: Does not add due to rounding.Source: 2009 Ministry of Municipal Affairs and Housing Financial Information Return.
CHART 20.11 2009 Municipal Revenues
Total $38.6 billion
Recent Historical Provincial Support to Ontario’s Municipalities
From 2003 to 2010, the Ontario government increased financial support to municipalities by
almost $1.6 billion or 150 per cent through the upload of social assistance benefit program
costs, as well as other uploads in the areas of public health, land ambulance and the provincial
gas tax. This significant increase in support to municipalities was intended to address
municipal concerns regarding previous efforts to realign service and funding responsibilities,
particularly through the Local Services Realignment (LSR) initiative in 1998.
Through the LSR exercise, the provincial government transferred the full or partial cost of a
number of services to municipalities, including social housing, Ontario Drug Benefit (ODB)
program, Ontario Disability Support Program (ODSP) and child care. To help municipalities
fund this realignment of services, the province transferred $2.5 billion in residential education
tax revenue to municipalities.17 The province also created an unconditional grant, the
Community Reinvestment Fund (CRF), to ensure that the transfer of services was
revenue neutral.
17 By 2011, the $2.5 billion in transferred residential education tax revenue had grown to an estimated $3.1 billion in revenue for
municipalities, as a result of non-reassessment-related growth, such as new construction.

478
Municipalities argued that LSR was not revenue neutral and that it imposed additional
costs on the property tax base, which prevented needed investments in local priorities such
as infrastructure. Municipalities maintained that the burden of paying for social assistance
benefits, in particular, constrained their ability to invest in important priorities.
The OMPF replaced the CRF in 2005 and is the province’s main transfer to municipalities.
It is designed to target support to municipalities with high social program and policing costs,
as well as address challenges faced by northern and rural communities. The program
responds to the individual circumstances of each municipality. In 2012, the province will
provide $583 million in OMPF grants to 373 municipalities.18
A landmark agreement for the provincial-municipal relationship was the Provincial-Municipal
Fiscal and Service Delivery Review (PMFSDR) in 2008. The PMFSDR was a joint initiative
involving the province, Association of Municipalities of Ontario (AMO) and City of Toronto.
This agreement committed the province to upload from the property tax base municipal costs
related to the ODB, ODSP, Ontario Works, and court security and prisoner transportation
costs between 2008 and 2018, without any corresponding commitment from the municipal
sector. In 2012, the estimated benefit of the provincial uploads to municipalities, combined with
$583 million in OMPF funding, totals $1.8 billion.
In addition to this ongoing support, the province is increasingly involved in funding municipal
infrastructure — having provided municipalities with over $12 billion for infrastructure
since 2003.
Provincial-Municipal Issues Addressed in Report
Provincial-municipal issues and recommendations are found throughout the report’s chapters.
Below, we provide a comprehensive recommendation list. Please refer to the respective
chapters for broader discussion of the recommendations.
Social Programs, Chapter 8
Recommendation 8-5: The Commission for the Review of Social Assistance in Ontario
should examine system design options that deliver a more efficient and higher-quality service
to social assistance recipients. This examination should consider combining Ontario Works
and the Ontario Disability Support Program and having the combined program delivered at the
local level. It should also address the further integration of employment services available
through Employment Ontario.
18 Ontario Ministry of Finance.

Chapter 20: Intergovernmental Relations
479
Infrastructure, Real Estate and Electricity, Chapter 12
Recommendation 12-1: Place more emphasis on achieving greater value from existing
assets in asset management plan reporting requirements than is currently proposed in the
Long-Term Infrastructure Plan for certain organizations (e.g., universities, municipalities, etc.).
Recommendation 12-2: Implement full cost pricing for water and wastewater services.
Recommendation 12-5: Pursue a national transit strategy with the federal government,
other provinces and municipalities.
Recommendation 12-13: Consolidate Ontario’s 80 local distribution companies along
regional lines to create economies of scale.
Environment and Natural Resources, Chapter 13
Recommendation 13-7: Rationalize and consolidate the entities and agencies involved in
land use planning and resources management.
Labour Relations and Compensation, Chapter 15
Recommendation 15-10: The government should facilitate a voluntary movement to
centralized bargaining for municipalities — particularly in relation to police and firefighting
bargaining.
Operating and Back-Office Expenditures, Chapter 16
Recommendation 16-13: Selected shared services should be expanded to agencies,
boards and commissions and the broader public sector.
Recommendation 16-14: The government should consolidate information and information
technology (I&IT) services throughout the broader public sector.
Recommendation 16-15: Significant savings and efficiencies can be achieved by further
co-ordinating existing horizontal supply chains across the broader public sector.
Revenue Integrity, Chapter 18
Recommendation 18-10: The Ministry of Finance should take the lead by providing
assistance to municipalities in developing policy for the collection of unpaid Provincial
Offences Act fines in the province.
Recommendation 18-12: Allow fines to be added via the property tax roll by adding Provincial
Offences Act fines to the offender’s property tax bill, even if the property is jointly owned.

480
Recommendation 18-25: Conduct a review of education tax rate-setting policies for
residential and business tax rates to maintain a stable level of education tax revenues
in real terms.
Recommendation 18-26: Continue to implement the business education tax (BET) reduction
plan while considering options for adjusting the plan in order to avoid part or all of the revenue
loss associated with reducing high BET rates by also increasing low BET rates.
Recommendation 18-27: Build on the existing business education tax (BET) reduction plan
to address historical BET rate inequities and distortions by gradually implementing a single
uniform BET rate.
Liability Management, Chapter 19
Recommendation 19-14: Ontario should negotiate with the federal government to commit to
a housing framework for Canada that includes adequate, stable long-term federal funding and
encourages its housing partners and stakeholders, including municipal governments, to work
with the federal government to secure this commitment.
Looking Forward — Provincial Support to Municipalities
Going forward to 2018, support to municipalities is projected to increase at an average
annual rate of 5.2 per cent (using 2010 as the base year). This projected annual growth is
well in excess of the 0.8 per cent annual growth target for total program spending identified
in this report.
TABLE 20.7 Historical and Projected Average Growth Rates in Provincial Support to Municipalities
Total Increase from 2003 to 2010
(cumulative) Average Annual Increase
from 2003 to 2010 Projected Average Annual
Increase from 2010 to 2018
Support to Municipalities 148% 13.8% 5.2%1
1 Large incremental increases in provincial upload occurred in 2010 and 2011, which increased the percentage of the projected average annual increase. Using 2012 as the base year, the projected average annual increase until 2018 is 3.8 per cent.
Source: Ontario Ministry of Finance.

Chapter 20: Intergovernmental Relations
481
The province is in the process of uploading social assistance benefit costs as agreed through
the PMFSDR. Municipal representatives recognized through the PMFSDR that the OMPF
would decline to reflect the reduction in municipal costs associated with the provincial uploads.
More specifically, they agreed that the OMPF would decline to $500 million by 2016, when
the social programs component of this grant would be completely phased out. In 2012, the
province will provide municipalities with total ongoing support of about $3.2 billion (see
Table 20.8).
This support, in addition to the OMPF and provincial uploads committed to through
the PMFSDR, includes funding to maintain the provincial share of public health and land
ambulance costs, as well as gas tax funding — an increase of $2.2 billion since 2003
(see Chart 20.12).
TABLE 20.8 Ongoing Support for Municipalities ($ Millions) Funding Programs (e.g., OMPF) $583 Projected value of the uploads committed to through the PMFSDR (ODB, ODSP, OW, court security)
$1,056
Other Uploads (OW – Admin; Public Health; Land Ambulance; Provincial Gas Tax)
$1,548
Total $3,187 The figures in this table reflect the province’s ongoing support to municipalities, which includes provincial uploads of municipal social assistance benefit programs costs (ODB, ODSP, Ontario Works benefits, and additional funding for Ontario Works Administration costs), court security and prisoner transportation costs, OMPF/CRF, provincial gas tax funding, public health and land ambulance. The figures do not include other transfers, such as the provincial share of social program costs. In addition, these values do not capture one-time infrastructure investments. Source: Ontario Ministry of Finance.

482
Note: Includes provincial uploads of social assistance benefit programs (ODB, ODSP, OW Benefits and additional funding for OW Administration costs), Court Security and Prisoner Transportation Costs, OMPF/CRF, Provincial Gas Tax Funding, Public Health and Land Ambulance. Does not include one-time investments such as Infrastructure Stimulus Fund, Building Canada Fund –Communities Component, Investing in Ontario Act, etc. Sources: Provincial–Municipal Fiscal and Service Delivery Review: Facing the Future Together (October 2008), Ontario Ministries of Finance, Transportation, Health and Long-Term Care, and Community and Social Services.
$ Billions
CHART 20.12 Ongoing Support to Municipalities Is Increasing270% increase over 2003 by 2018
1.07 1.141.37
1.681.96
2.20 2.292.66
3.07 3.20 3.303.50 3.60 3.70 3.80
4.00
0.0
0.5
1.0
1.5
2.0
2.5
3.0
3.5
4.0
4.5
2003 2004 2005 2006 2007 2008 2009 2010 2011 2012 2013 2014 2015 2016 2017 2018
Actuals Projected
Between 2010 and 2018, provincial support is projected to grow by 5.2 per cent per year.
Such a rate of growth is simply unaffordable. It significantly exceeds the 0.8 per cent annual
growth target for total program spending identified in this report. A portion of the projected
growth comes from the remaining $500 million of uploading. Excluding that, support would
grow by 3.5 per cent per year — a rate of growth that is still far in excess of our 0.8 per cent
annual growth target. The projected 3.5 per cent annual growth in the absence of the
remaining uploads can be attributed mainly to increased costs associated with uploads that
have already been completed — the uploads of ODB and ODSP. As a result of factors such
as increased caseloads, the costs to the province (and by extension, the effective savings
to municipalities) of these already completed uploads continue to increase.
The Commission supports the general notion of the upload — these matters are better
financed by the broader, more diverse provincial revenue base. And we realize that any
change in the upload simply shifts the fiscal problem in the province from one jurisdiction to
another; it does not solve it. Most of the province’s municipalities are also struggling with
their budgets.

Chapter 20: Intergovernmental Relations
483
Nonetheless, we feel that to respect the overall spending restraint required at the provincial
level, total transfers to the municipalities should increase by less than 5.2 per cent per year.
Therefore we recommend two main measures:
Recommendation 20-7: Extend the period of the final $500 million of upload by another two
years, so it is not complete until 2020. For illustration, if we reach 2015’s $232 million by 2017,
that would save $165 million ($397 million minus $232 million).
Recommendation 20-8: Ensure that, beginning in 2013, the Ontario Municipal Partnership
Fund (OMPF) declines to the planned $500 million by 2016. A reasonable assumption would
be a $25 million decrease in each of the next four years beginning in 2013, resulting in a
$500 million OMPF envelope in 2016.
We recognize the important public policy rationale, as well as the provincial commitment,
to uploading social assistance benefits program costs from the property tax base. However,
given the current fiscal climate, the Commission is concerned that continued implementation
at this time, according to the current schedule, may not be appropriate.
Additionally, it is important to ensure that these provincial investments result in tangible
outcomes for Ontarians.
Recommendation 20-9: The province and municipalities must work together to establish an
accountability framework that would track how municipalities are investing the benefits realized
as a result of the uploads.
Because infrastructure investments were identified as an important priority by municipalities,
the focus of this accountability framework should be on tracking incremental new municipal
capital expenditures. Some municipalities, such as the City of Ottawa, have released a
detailed accounting of how the savings associated with the uploads are being invested,
and we encourage the province to collaborate with municipalities to share best practices
in this area.

484
The Province and Municipalities Share the Property Tax Base
Another key feature of the provincial-municipal fiscal relationship is the fact that the province
and municipalities share the property tax base.
Property taxes raised over $23 billion in 2010 in Ontario. The municipal portion of the tax
raises $16.4 billion, and is the largest single source of revenue for municipalities. The
provincial education portion of the tax raises over $6.6 billion.
Property taxes are a stable source of revenue for municipalities to fund local services and for
the province to fund a portion of elementary and secondary education.
Municipalities were provided with $2.5 billion in “property tax room” at the time of LSR, and
in subsequent years, the province has adopted a policy to fully offset reassessment impacts
when resetting residential and BET rates.
This practice of cutting education tax rates to offset reassessment increases has contributed to
a significant decrease in revenues in real terms and as a share of education funding supported
by property taxes. In fact, the province’s education tax rate decisions have contributed to a
30 per cent decrease in revenue in real terms over the last two decades, which has provided
municipalities with additional tax room to fund local services.
We recommend that the province conduct a review of its education tax rate-setting policies to
maintain a stable level of education tax revenues in real terms. More on that recommendation
is found in Chapter 18, Revenue Integrity.
Chapter 20: Intergovernmental Relations
485
Enhancing Efficiency in the Service Delivery Relationship
As we discuss in Chapter 8, Social Programs, municipalities play an important role in providing
programs to Ontarians. For instance, social assistance programs are delivered by
municipalities but funded mainly by provincial transfer payments. Other examples include
social housing and child care programs, which are delivered primarily by municipalities and
funded by all three levels of government.
As also discussed in that chapter, program design and delivery will need to be integrated and
aligned across different government ministries and delivery agents. And as we note in the
federal-provincial relations section of this chapter, people expect public services to be easy
to use, timely and staffed by knowledgeable people. Different levels of government will need to
work together to determine the most efficient ways to provide services for those most in need.
If service levels are to be maintained within a 0.8 per cent growth in overall program spending,
a sustained commitment to enhanced efficiency and transformation will be required from all
players, including municipalities.

486
Appendix: Commission Recommendations
487
Appendix 1: Commission Recommendations
Table of Contents Chapter 1: The Need for Strong Fiscal Action.......................................................................................................... 489
Chapter 3: Our Mandate and Approach ................................................................................................................... 490
Chapter 5: Health ..................................................................................................................................................... 494
Chapter 6: Elementary and Secondary Education ................................................................................................... 506
Chapter 7: Post-Secondary Education ..................................................................................................................... 511
Chapter 8: Social Programs ..................................................................................................................................... 514
Chapter 9: Employment and Training Services........................................................................................................ 517
Chapter 10: Immigration........................................................................................................................................... 518
Chapter 11: Business Support ................................................................................................................................. 519
Chapter 12: Infrastructure, Real Estate and Electricity............................................................................................. 521
Chapter 13: Environment and Natural Resources.................................................................................................... 523
Chapter 14: Justice Sector ....................................................................................................................................... 524
Chapter 15: Labour Relations and Compensation ................................................................................................... 525
Chapter 16: Operating and Back-Office Expenditures ............................................................................................. 527
Chapter 17: Government Business Enterprises ....................................................................................................... 529
Chapter 18: Revenue Integrity ................................................................................................................................. 531
Chapter 19: Liability Management............................................................................................................................ 534
Chapter 20: Intergovernmental Relations................................................................................................................. 536

488

Appendix: Commission Recommendations
489
Chapter 1: The Need for Strong Fiscal Action
Recommendation 1-1: We recommend the following annual changes in program spending
out to 2017–18:
Health care — plus 2.5 per cent;
Education (primary and secondary) — plus 1.0 per cent;
Post-secondary education (excluding training) — plus 1.5 per cent;
Social services — plus 0.5 per cent; and
All other programs — minus 2.4 per cent.

490
Chapter 3: Our Mandate and Approach
Recommendation 3-1: Do not simply cut costs. The imperative to restrain spending should
instead be an opportunity to reform programs and service delivery. Simple cost-cutting can be
effective in hitting near-term deficit reduction targets, but it does not encourage longer-run
fiscal stability or allow for reforms that will generate more value for money spent.
Recommendation 3-2: Avoid across-the-board cuts. Such a blunt tool treats equally a
valuable, efficiently run program and one that is outdated and sloppily managed. This is dumb.
Spending should be aligned with government priorities so that high-priority initiatives are
adequately funded while lower-priority programs are either cut substantially or eliminated
outright. Across-the-board cuts represent an abdication of the government’s responsibility to
make real, and often difficult, decisions.
Recommendation 3-3: Avoid setting targets for the size of the civil service; instead, set
targets for outputs, not inputs. Focus on the cost of programs and services and on value for
money. A smaller and leaner civil service will be an inevitable result of reducing the cost of
programs and achieving greater value for money.
Recommendation 3-4: The government should not rely unduly on hiring freezes and attrition
to reduce the size of the civil service as a result of any spending restraint. Such approaches
typically weaken the quality of the civil service for years — even decades — to come.
Lower-priority and less efficient programs and services must be targeted for reduction; the
result will be fewer employees working in these areas. More generally, the focus must be on
retaining good employees while letting go of those who are not performing well. All employee
appraisal and bonus schemes must be aligned to these objectives; for example, the
government should continue to offer performance bonuses to those who exceed
job requirements.
Recommendation 3-5: Do not hang onto public assets or public service delivery when better
options exist. Consider privatizing assets and moving to the private delivery of services
wherever feasible. We suggest pursuing this course only where the public can get better
value for money spent without compromising access to services, not for ideological reasons.
In budget planning, do not count chickens before they are hatched. If assets are to be sold,
never incorporate any revenue from such planned sales into a budget before the fact; there is
always uncertainty over the timing, accounting treatment and ultimate market value of any
sale. Instead, simply record any sale in the appropriate manner if and when it is completed.
Appendix: Commission Recommendations
491
Recommendation 3-6: The length of time it will take to return to balance in a sustainable
fashion significantly changes the nature of the approach. Traditional “short-term fixes” will not
be adequate or even, in many cases, appropriate. Examples include asset sales solely for the
purpose of a one-time cash injection; freezes to wages or managers’ bonuses; and deferrals of
capital investments and other necessary spending. Kicking the can down the road is no
solution. Spending restraint must be thoroughly and consistently tied to permanent reforms in
how government operates so the results of the restraint exercise can be sustained over a
long period.
Recommendation 3-7: Once it has decided how to respond to this report, the government
should begin with a good road map –– a formal document of its vision and the path to the goal.
There are precedents for such a tool. In 1984, the Mulroney government published its Agenda
for Economic Renewal, an extensive paper that laid out in one place all the government’s
plans. The Chretien government did the same in 1994 with two documents recalled more for
their colour — the Purple Book and the Grey Book — than their titles. Each of these
documents not only informed the public about the changes that lay ahead, but also became a
script for all bureaucrats, who saw how their own programs and activities fit into the
broader picture.
Recommendation 3-8: Higher priority should be assigned to programs and activities that
invest in the future as opposed to those that serve the current status quo. This is never easy:
the status quo has plenty of advocates; the future does not. It is up to government to fill this
breach. As Massachusetts Institute of Technology economist Lester Thurow once suggested,
“The proper role of government in capitalist societies is to represent the future to the present.”
Recommendation 3-9: Policy development and the public service in general should be more
evidence-based. This requires setting clear objectives based on sound research and evidence.
The government should collect data and use it to evaluate whether objectives are being met
and how efficiently. Managers should be accountable for achieving these objectives. Where
objectives are not being met, programs and services should be adjusted. Reporting should be
transparent and audits conducted. The evidence-based model should be applied to the
success of individuals and departments in meeting objectives. At the same time, ministries,
as well as agencies and entities accountable to the government, should be given some latitude
to conduct their affairs in an efficient manner.

492
Recommendation 3-10: This raises a tricky issue that faces all governments. On the one
hand, they need to minimize the cost of operations; on the other, they need rules and reporting
to ensure that taxpayers’ money is not being abused. All governments must strike a balance
between these competing obligations. We believe the pendulum has now swung too far
towards excessive rules. Government operations have trouble responding quickly and
consistently, often because it takes so much time, for example, to process minor requests for
proposals (RFPs) or to get consistent supplies when everything is broken into discrete RFPs.
When there are too many rules, as there are now, government employees and private
suppliers are forced to divert people — or even add new staff — to ensure that compliance
and reporting requirements are met. This is the case even though the information reported is
often not used at the other end to influence changes in policy or service delivery. Although it is
impossible to get a full accounting of the costs of monitoring compliance relative to the benefits
gained, we believe there are simply too many layers of watchers at the expense of people who
actually get things done. The government must find a new middle ground.
Recommendation 3-11: Boundaries between public- and private-sector activities should be
shifted and, in many cases, removed. For the most part, policy development needs to remain
in the realm of the government, though various stakeholders and community groups could and
should be more involved. External groups should even be involved in advising the most senior
government decision-making bodies, including the Cabinet.
Recommendation 3-12: Within their operations, public-sector service providers should
assign people to jobs where they are most effective, efficient and affordable. Physicians
should not perform tasks that could be done more efficiently and at a lower cost by physician
assistants, registered nurses, nurse practitioners or pharmacists. Case workers need not deal
with all aspects of social assistance, employment or training matters when some clients are
willing and able to receive services by telephone or through the Internet. In the policing sector,
non-core services such as data entry could be done by clerical staff rather than officers whose
time and training are better deployed elsewhere.

Appendix: Commission Recommendations
493
Recommendation 3-13: Seek common themes across the reforms to achieve economies of
scale in action and simplify communications. Common themes would include a shift towards
evidence-based policy development and service delivery; more efficient service delivery
models for all areas interacting with the public; the efficient use of and appropriate rates of
return on Crown assets; and consolidation of such backroom operations as information
technology and human resources.
Recommendation 3-14: Reform must be pervasive and speedy. There is an understandable
tendency to approach any set of reforms piecemeal and over an extended period. This
tendency must be resisted, in part because the record is not kind to such an approach and
more importantly, because it runs contrary to our fiscal mandate to balance the budget by
2017–18. First, the government will need to implement all the reforms we recommend — or at
least some reasonable facsimile in fiscal terms — to restrain the growth of program spending
enough to achieve balance by 2017–18. This is not a smorgasbord from which the government
can choose only the tastiest morsels and ignore the less palatable. Second, the restraint
process will succeed only if the public believes the reforms are fair. Broader action favours
such a perception as opposed to a view that a handful of programs were unfairly targeted.
Third, we can all agree that change is disruptive, but the medicine does not go down more
easily if it is dragged out over a long period. Indeed, such delay merely discourages people —
public servants and those receiving government services — and postpones the day when a
new system is operating efficiently. Although there may be limits to the capacity of the public
service to instigate, execute and monitor change, once the financial parameters are set, first
for ministries and then for programs, many of the reforms will be handled by people further
down the chain.

494
Chapter 5: Health
Recommendation 5-1: Develop and publish a comprehensive plan to address health care
challenges over the next 20 years. The plan should set objectives and drive solutions that are
built around the following principles:
The system should be centred on the patient, not on the institutions and practitioners in the
health care system;
The plan should focus on the co-ordination of services for patients in a fully integrated
system-wide approach;
Reforms should recognize changes and challenges in both demographics and lifestyles by
putting more emphasis on chronic than acute care;
At the provincial level, the system must be able to carry out health care capacity planning;
it must look at the health needs of the population and project future needs for facilities,
services, funding and human resources;
Policies should be based on evidence that provides guidance on what services,
procedures, devices and drugs are effective, efficient and eligible for public funding;
There should be a heightened focus on preventing health problems, including the role of
public health in meeting this goal;
It should ensure that health data are collected efficiently and shared;
Funding to providers should be based primarily on meeting the needs of patients as they
move through the health care continuum; and
The quality of care can and should be enhanced despite the need to restrain increased
spending; the objectives of quality care and cost restraint must go hand in hand.
Recommendation 5-2: Evaluate all proposals for change that include efficiencies and
cost savings within the vision and plan developed above.
Recommendation 5-3: Divert all patients not requiring acute care from hospitals and into a
more appropriate form of care that will be less expensive, improve the patient experience and
reduce the patient’s exposure to new health risks.
Recommendation 5-4: Increase the use of home-based care where appropriate to reduce
costs without compromising excellent care. For example, home-based care should be used
more extensively for recovery from procedures such as hip and knee surgery.

Appendix: Commission Recommendations
495
Recommendation 5-5: To improve the co-ordination of patient care, all health services in a
region must be integrated.
Recommendation 5-6: Cap the government’s health budget at 2.5 per cent or less annual
growth through 2017–18. After 2017–18, annual health cost increases must be restrained to
no more than five per cent, a level necessary to keep the provincial budget balanced without
relying on tax increases or an unacceptable squeezing-out of other public services.
Recommendation 5-7: Support a gradual shift to mechanisms that ensure a continuum of
care and care that is community-based. Funding for community-based care may need to grow
at a higher rate in the short to medium term in order to build capacity to take pressure off acute
care facilities; on the other hand, with a shift away from a hospital focus, hospital budgets
could grow less rapidly than the average.
Recommendation 5-8: Achieve spending restraint by moving the health care system towards
a more efficient overall design and finding efficiency gains within its constituent parts.
Recommendation 5-9: Do not apply the same degree of fiscal restraint to all parts of health
care. Some areas — including community care and mental health — will need to grow more
rapidly than the average.
Recommendation 5-10: Set the overall principles for provincewide health care, but continue
to organize the delivery of health care on a regional basis.
Recommendation 5-11: A regional health authority should be clearly identified as the
key point for integrating services and institutions across the full continuum of care for a
geographic area.
Recommendation 5-12: Reduce the number of organizations with which the Local Heath
Integration Networks must deal on a day-to-day basis.
Recommendation 5-13: Consolidation of health service agencies and/or their boards should
occur where appropriate, while establishing any new consolidated agencies as separate legal
entities to limit major labour harmonization and adjustment costs.
Recommendation 5-14: Establish an advisory panel in each Local Health Integration Network
with appropriate representation of the regional health care stakeholders, including community
hospitals, physicians, community care and long-term care homes.

496
Recommendation 5-15: The Local Health Integration Networks must integrate care across
the system by sharing information on patients among health care providers, co-ordinating
decisions and allocating funds to best reflect regional needs.
Recommendation 5-16: Use data and information sharing to better understand and address
the fiscal impacts of chronic and complex conditions and at-risk patients with mental health
and addiction issues (see Recommendations 5-37 to 5-41 for more on managing their care).
Recommendation 5-17: Use information from funding models such as the Health-Based
Allocation Model (HBAM) to examine where services may not be provided equally across
health regions and conduct ongoing evaluations of each Local Health Integration Network’s
progress in managing high-use populations. (See Recommendations 5-50 and 5-73 for
more details on HBAM.)
Recommendation 5-18: Where feasible, services should be shifted to lower-cost caregivers.
Across the spectrum of caregivers, full scope of practice needs to be exercised.
Recommendation 5-19: A broader perspective should be applied to decisions that are made
on the scope of practice of health professionals. Government should play a more active role in
working with the professional colleges to apply a system-wide approach rather than dealing
with individual professions in isolation.
Recommendation 5-20: Maximize opportunities to use nurse practitioners with the aim of
efficiency, while maintaining excellent care.
Recommendation 5-21: Recognize the increased demand for nurses in the capacity of
nursing programs at colleges and universities and their ability to train more nurses.
Recommendation 5-22: Increase the use of personal support workers and integrate them into
teams with nurse practitioners, registered nurses and other staff members where appropriate
to optimize patient care.
Recommendation 5-23: Local Health Integration Networks need to use funding as a lever
to encourage hospitals and other health care providers to use the full scope of practice of
their staff.
Recommendation 5-24: Make changes to the Pharmacy Act to enable an expanded scope
of pharmacy practice. This would involve developing supporting regulations to permit
pharmacists to administer routine injections and inhalations, including immunization.

Appendix: Commission Recommendations
497
Recommendation 5-25: Hospital capital plans that extend out-of-hospital services such
as those for outpatients should not be entertained by Local Health Integration Networks.
Hospitals should conduct affairs largely within hospitals, and others, such as Community
Care Access Centres (CCACs) and private health care operators, should be responsible
for providing out-of-hospital services. The CCACs and private health care operators have
demonstrated that they are capable of doing this work for less than hospitals.
Recommendation 5-26: Resist the natural temptation to build many more long-term care
facilities for an aging population until the government can assess what can be done by
emphasizing to a greater extent the use of home-based care that is supported by community
services. Home-based care is less expensive and should generate greater population
satisfaction.
Recommendation 5-27: Grant Local Health Integration Networks the authority,
accountabilities and resources necessary to oversee health within the region, including
allocating budgets, holding stakeholders accountable and setting incentive systems.
Recommendation 5-28: Tie compensation for CEOs and senior executives in all parts of the
health care system to strategically targeted health outcomes, not the number of interventions
performed, through a performance pay framework. Mirror this performance pay approach
throughout each hospital, Community Care Access Centre, long-term care facility, etc., at the
physician and health care worker levels.
Recommendation 5-29: Support transparency in senior executive and CEO salaries
throughout the health care system by publicly posting comprehensive compensation
information in a timely fashion.
Recommendation 5-30: Allocate funding based on meeting the needs of the patient as they
move through the continuum of care.
Recommendation 5-31: Some regions have developed roles for “clerical system navigators”
that co-ordinate appointments and assist patients with required forms and paperwork.
Local Health Integration Networks should ensure that a sufficient number of people in this
role are put in place across the entire health care system.

498
Recommendation 5-32: Empower primary caregivers and physicians in the Family Health
Teams (FHTs) or specialized clinics to play the role of “quarterback,” tracking patients as they
move through the integrated health system. All FHTs should work in tandem with clerical
system navigators and hospitalist physicians to track their patients who are in hospitals, from
admission to discharge (see Recommendation 5-55 on hospitalists for more details).
Recommendation 5-33: Tightly integrate Community Care Access Centres (CCACs) with
Local Health Integration Networks (LHINs) to improve patient case management. There are
options that should be explored about the nature of this integration. It could be either through
co-operation of two entities or a more formal and complete merger of CCACs into this one key
aspect of the work of LHINs.
Recommendation 5-34: Require hospitals to make discharge summaries available
electronically to other care providers (e.g., general practitioners, home care) immediately.
Recommendation 5-35: Switch to electronic delivery of laboratory test results to improve
timeliness and efficiency, as well as support patient privacy.
Recommendation 5-36: Reduce absenteeism for Ontarians and office visits, while improving
patient satisfaction, through secure messaging between patients and providers, online
appointment scheduling, access to test results for patients, and online requests for prescription
refills and renewal.
Recommendation 5-37: Complex care patients should be managed through interprofessional,
team-based approaches to maximize co-ordination with Family Health Teams and other
community care providers.
Recommendation 5-38: Chronic issues should be handled by community and home-based
care to the fullest extent possible.
Recommendation 5-39: Reach out to patients who need preventive care, particularly chronic
disease and medication management, rather than waiting for them to come to get services.
Leverage electronic medical records, decision support and secure messaging with Ontarians
to achieve these goals.

Appendix: Commission Recommendations
499
Recommendation 5-40: Reduce mortality, hospitalizations and costs while improving
patient satisfaction by connecting Ontarians who have serious chronic health problems
(e.g., congestive heart failure) with ongoing monitoring and support through expanded
use of telehomecare.
Recommendation 5-41: Centralize leadership of chronic disease management by developing
co-ordinating bodies for chronic conditions including mental health, heart and stroke and renal
disease, based on the Cancer Care Ontario model.
Recommendation 5-42: Resource the Local Health Integration Networks adequately to
perform their expanded functions. Additional resources should come in large part from the
Ministry of Health and Long-Term Care; this would entail a significant transfer of employees.
Recommendation 5-43: Put in place clear structures to clarify the lines of accountability up to
the Local Health Integration Networks (LHINs) and the accountability of LHINs to the Ministry
of Health and Long-Term Care.
Recommendation 5-44: Move critical health policy decisions out of the context of negotiations
with the Ontario Medical Association and into a forum that includes broad stakeholder
consultation.
Recommendation 5-45: The Institute for Clinical Evaluative Sciences and Health Quality
Ontario must work in tandem, integrating their respective expertise into practical
recommendations for health care providers.
Recommendation 5-46: As a body of practice is established, expand the mandate of Health
Quality Ontario to become a regulatory body to enforce evidence-based directives to guide
treatment decisions and OHIP coverage.
Recommendation 5-47: Make all Health Quality Ontario work public. Use the evidence found
to inform directives on practices and what will be covered by OHIP.
Recommendation 5-48: More work must be done on the efficiency front for the Institute for
Clinical Evaluative Sciences.
Recommendation 5-49: Explore the potential for a national Organization for Economic
Co-operation and Development-type entity that collates and enhances evidence-based policy
directions and provides enhanced collaboration on issues across jurisdictions. It could provide
a gathering place for dialogue and a secretariat with a capacity for analysis. Such an
organization could be housed with the Council of Health Ministers or Deputy Ministers.
The federal government should be involved.

500
Recommendation 5-50: Use data from the Health-Based Allocation Model (HBAM) system to
set appropriate compensation for procedures and cease the use of average costs to set
hospital payments (see Recommendations 5-17 and 5-73 for more details on HBAM).
Recommendation 5-51: Create a blend of activity-based funding (i.e., funding related to
interventions or outcomes) and base funding managed through accountability agreements.
Recommendation 5-52: Create policies to move people away from inpatient acute care
settings by shifting access to the health care system away from emergency rooms and
towards community care (i.e., walk-in clinics and Family Health Teams), home care and,
in some cases, long-term care.
Recommendation 5-53: Encourage hospitals to specialize so all are not trying to provide all
services regardless of their comparative advantages.
Recommendation 5-54: Given the burden of alternate level of care (ALC) patients on hospital
capacity, hospitals must become more effective in optimizing this capacity while applying best
practices in planning patient discharges. Further, small hospitals with large ALC populations
must be assessed with a goal of redefining their role in care for the elderly. Again, funding
should be aligned appropriately.
Recommendation 5-55: Use hospitalist physicians to co-ordinate inpatient care from
admission to discharge. Hospitalists should work with Family Health Teams to better
co-ordinate a patient’s moves through the health care continuum (acute care, rehabilitation,
long-term care, community care and home care).
Recommendation 5-56: Make primary care a focal point in a new, integrated health model.
Recommendation 5-57: Regional health authorities must integrate physicians into a rostered
health system and adopt the appropriate measures to address compensation issues across
disciplines; that is, the proper blend of salary/capitation and fee-for-service.
Recommendation 5-58: Reduce the sole proprietorship nature of the offices of many primary
care physicians and encourage more interdisciplinary integration through performance
incentives and accountability.
Recommendation 5-59: Compensate physicians using a blended model of salary/capitation
and fee-for-service; the right balance is probably in the area of 70 per cent salary/capitation
and 30 per cent fee-for-service.

Appendix: Commission Recommendations
501
Recommendation 5-60: Aggressively negotiate with the Ontario Medical Association for the
next agreement.
Recommendation 5-61: Adjust fee schedules in a timely manner to reflect technological
improvements, with the savings going to the bottom line of less expenditure on health care.
Recommendation 5-62: Make Family Health Teams (FHTs) the norm for primary care and
design the incentive structure of physicians’ compensation to encourage this development.
Among the key characteristics of FHTs are the following:
The regional health authority should play a key role in determining their relationship with
the rest of the health care system and setting ground rules for their operation;
Make outcomes the focus of FHTs, not health interventions. Their operation should be
tightened through objectives, accountability and a data collection system;
Conduct research to determine the optimal size of FHTs, taking into account factors such
as geography and patient demography. Balancing economies of scale while maintaining
personal connections between health care providers and patients is crucial: FHTs need the
scale to support a wide range of care providers and be able to support the administration
necessary, including the responsibility of tracking people through the system. It has been
suggested to the Commission that the optimal size, for larger communities, may be in the
range of 8 to 15 physicians, and include practitioners with a wider range of specialties than
is now the case. They now typically have only three to eight physicians; and
To provide a range of services at a lower cost, include other health professionals in the
FHTs (nurse practitioners, registered nurses, dietitians and midwives, for example).
Unlisted practitioners such as physiotherapists and massage therapists would also be part
of FHTs; however, their services would be provided on a cost-recovery basis.
Recommendation 5-63: Require Family Health Teams (FHTs) to accept patients who choose
them, and the FHTs should work with each patient to connect them with the most appropriate
constellation of care providers.
Recommendation 5-64: The regional health authority should establish incentives to
discourage Family Health Teams from referring patients to acute care.
Recommendation 5-65: Regional authorities should also be responsible for assigning heavy
users of the health care system to the appropriate Family Health Team (FHT). If, for example,
there are 300 heavy users within a region and three FHTs, the regional health authority would
try to steer 100 to each, so that no FHT is overburdened.

502
Recommendation 5-66: Because Family Health Teams (FHTs) will be responsible for patient
tracking, they will need to build a critical mass of an administrative arm to carry out this task.
This administrative arm should be shared among a number of FHTs.
Recommendation 5-67: Better after-hours care must be offered and telephone/Internet
services should direct patients to the most appropriate and convenient care provider.
Recommendation 5-68: All Family Health Teams must be encouraged to add more
specialists to their teams, which will reduce referrals and ease some of the complexities
of patient tracking.
Recommendation 5-69: The Ministry of Health and Long-Term Care should allow the
flexibility necessary for Family Health Teams to share specialists by permitting part-time
contracts.
Recommendation 5-70: All Family Health Team physicians must begin engaging in
discussions with their middle-aged patients about end-of-life health care.
Recommendation 5-71: Improve access to care (e.g., in remote communities) and
productivity for specialists by triaging appropriate patients for telemedicine services
(e.g., teledermatology, teleophthalmology).
Recommendation 5-72: Remove perverse incentives that undermine the quality and
efficiency of care. For example, physicians are penalized when one of their patients goes to
another walk-in clinic, but not when the patient goes to the emergency department of a
hospital. More generally, the fee-for-service compensation model gives an incentive for
medical interventions without due consideration to quality and efficiency of care.
Such incentive issues must be addressed by focusing the Ontario Medical Association’s
negotiations more on quality of care and amending payment systems for physicians and
throughout the health care system.
Recommendation 5-73: The model described in the above recommendations must be
supported by a robust data collection and sharing system that allows the creation of the
necessary records. For example, the model works only if we know how many patients are
not visiting emergency departments or how many diabetes patients are not experiencing
complications (see Recommendations 5-17 and 5-50 on Health-Based Allocation Model data
for more details).

Appendix: Commission Recommendations
503
Recommendation 5-74: Increase the focus on home care, supported by required resources,
particularly at the community level.
Recommendation 5-75: Match seniors to the services that they need from the earliest
available care provider, reduce alternate level of care days, and improve co-ordination of
care through the use of referral management tools for long-term care, home care and
community services.
Recommendation 5-76: Implement the recommendations contained in “Caring for Our Aging
Population and Addressing Alternate Level of Care,” a report prepared by Dr. David Walker
and released in August 2011.
Recommendation 5-77: In addition to recommendations contained in “Caring for Our Aging
Population and Addressing Alternate Level of Care,” a report prepared by Dr. David Walker
and released in August 2011, there is a need for more and varied palliative care; at home and
in residential hospices.
Recommendation 5-78: Integrate the public health system into the other parts of the health
system (i.e., Local Health Integration Networks).
Recommendation 5-79: Review the current funding model that requires a 25 per cent match
from municipalities for public health spending.
Recommendation 5-80: Consider fully uploading public health to the provincial level to
ensure better integration with the health care system and avoid existing funding pressures.
Recommendation 5-81: Improve co-ordination across the public health system, not only
among public health units, but also among hospitals, community care providers and primary
care physicians.
Recommendation 5-82: Replicate British Columbia’s Act Now initiative, which has been
identified by the World Health Organization as a best practice for health promotion and chronic
disease prevention, in Ontario.
Recommendation 5-83: Have doctors address diet and exercise issues before reaching for
the prescription pad when dealing with health issues such as cardiovascular disease and
late-onset Type 2 diabetes.
Recommendation 5-84: Do more to promote population health and healthy lifestyles and to
reverse the trend of childhood obesity, especially through schools.

504
Recommendation 5-85: Work with the federal government on nutrition information and,
where appropriate, regulation.
Recommendation 5-86: Medical schools should educate students on “system issues,” so
they better understand how physicians fit into the health care system; for example, how to deal
with patient needs efficiently and effectively, but using fewer resources by connecting different
parts of the health care system.
Recommendation 5-87: Do a better job of flagging health professions and locations that are
currently in short supply or where shortages can be expected in the future.
Recommendation 5-88: Link the Ontario Drug Benefit program more directly to income.
Recommendation 5-89: Help reduce medication errors through the use of electronic supports
to cross-reference multiple prescriptions.
Recommendation 5-90: Reduce fraudulent prescription medication use through the use of
drug information systems.
Recommendation 5-91: Pursue — with other provinces — the possibility of establishing a
national entity that would set a common price for pharmaceuticals for the entire country
(or at least jurisdictions opting in).
Recommendation 5-92: Conduct drug-to-drug comparisons to determine which drug is the
most efficient at addressing a given ailment.
Recommendation 5-93: Work with the federal government to ensure that Ontario’s interests
in expanding use of generic drugs are not undermined by a Canada-European Union Free
Trade Agreement.
Recommendation 5-94: Use pharmacists to their full scope of practice.
Recommendation 5-95: Centralize all back-office functions such as information technology,
human resources, finance and procurement across the health system.
Recommendation 5-96: Establish a central mechanism to oversee the creation of a “spot
market” for goods and discretionary services, such as diagnostics, infusions and specialist
consultation services.
Recommendation 5-97: Put a wider array of specialist services to tender based on price and
quality, while remaining under the single-payer model.
Appendix: Commission Recommendations
505
Recommendation 5-98: Put to tender more service delivery, but with the criteria for selection
based on quality-adjusted metrics rather than just price.
Recommendation 5-99: Accelerate the adoption of electronic records, working in a
bottom-up fashion.
Recommendation 5-100: Adopt the Nova Scotia model in which emergency medical
technicians provide home care when not on emergency calls; this requires integrating
municipal and provincial funding structures.
Recommendation 5-101: Provide better information to individuals and families to facilitate
self-care, for people with conditions such as diabetes.
Recommendation 5-102: Begin a dialogue with Ontarians on the issue of expanding the
coverage of the health system to include, for example, pharmaceuticals, long-term care and
aspects of mental health care.
Recommendation 5-103: Involve all stakeholders in a mature conversation on the future of
health care and the 20-year plan.
Recommendation 5-104: Establish a Commission to guide the health reforms.
Recommendation 5-105: Do not let concerns about successor rights stop amalgamations
that make sense and are critical to successful reform.

506
Chapter 6: Elementary and Secondary Education
Recommendation 6-1: To meet our overall fiscal objectives, the Commission believes that
the growth rate in the education budget over the term from 2010–11 to 2017–18 must be
constrained to one per cent per year.
Recommendation 6-2: The budget constraint must be applied strategically so as not to
jeopardize the improvements in results achieved, such as on provincial assessments and with
graduation rates.
Recommendation 6-3: The elementary and secondary education sector should stay the
course with its current agenda, which consists of three key goals: improving student
achievement, closing gaps in student outcomes and increasing confidence in the publicly
funded school system. The province and the sector must sustain the current alignment
between provincial, school board and school-level efforts, and sustain the “pressure and
support” approach adopted in recent years.
Recommendation 6-4: Reforms in the elementary and secondary sector should be introduced
so that all stakeholders have their role to play in ensuring the system’s long-term sustainability
and so that unnecessary sources of distraction are avoided.
Recommendation 6-5: To ensure transparency and effectiveness, the province should
confirm multi-year allocations to school boards for the 2012–13 to 2017–18 period so that they
can plan accordingly, have enough time to find the required efficiencies and enter negotiations
for renewal of the sector’s collective agreements that will expire on Aug. 31, 2012, with clear
knowledge of their budgetary position.
Recommendation 6-6: The Ontario government should put strong pressure on the federal
government to provide funding for First Nations on-reserve education that at least reaches
parity with per-student provincial funding for elementary and secondary education.
Recommendation 6-7: The province should negotiate with the federal government and First
Nations to ensure the establishment of new multi-year, strategic top-up funding agreements for
on-reserve schools. These agreements, voluntary for interested First Nations, would ensure
that per-student funding for on-reserve schools is at least equivalent to that provided to
adjacent English-language public district school boards.

Appendix: Commission Recommendations
507
Recommendation 6-8: Agreements with the federal government should facilitate the
formation of education entities among participating First Nations with powers similar to
provincially funded district school boards. To establish a system of support services for
on-reserve schools, chief executive officers of the new education entities should join the
Council of Ontario Directors of Education as well as the regional education councils.
Additionally, the new education entities should negotiate with the province multi-year targets
for the proportion of supervisory officers, principals and teachers who will be deemed qualified
by the Ontario College of Teachers. Such qualifications can be earned from existing providers
or from newly accredited Aboriginal service providers.
Recommendation 6-9: When negotiating funding agreements, the province should pressure
the federal government to increase funding for capital for on-reserve schools and consider
transferring this funding to the province, which is better equipped to provide expertise for
K–12 capital renewal and construction.
Recommendation 6-10: Failing to come to an agreement with the federal government,
the Commission recommends that the province step up to provide funding to ensure that
on-reserve schools are funded at parity with adjacent English-language public district
school boards.
Recommendation 6-11: Given the difficulties with such an approach, and the prohibitive cost
of the program overall at this time, the Commission recommends cancellation of the full-day
kindergarten (FDK) program, without prejudice to schools that already had FDK before the
introduction of this government strategy.
Recommendation 6-12: If the government decides to continue the implementation of the
full-day kindergarten program, then the Commission recommends delaying full implementation
from 2014–15 to 2017–18 and reducing program costs by adopting a more affordable staffing
model, involving one teacher for about 20 students, rather than a teacher and an early
childhood educator for 26 students, to help moderate salary expenditures for the program
by about $200 million. The government should not confirm full implementation of the program
without assurances from school boards, teacher federations and support-staff unions that
negotiated annual wage increases by 2017–18 will not be higher than the current trends in the
broader public sector, and that the class-size increases and reductions in non-teaching staff
contemplated by the Commission by 2017–18 will be achieved.
Recommendation 6-13: Set the cap in class size for primary grades at 23 and eliminate the
other requirement that 90 per cent of classes must be at 20 or fewer, and increase the
averages in junior/intermediate class sizes from 24.5 to 26 and secondary class sizes from
22 to 24.

508
Recommendation 6-14: The province should cap the funding of high school credits to
32 successful credits per student, and amend the Education Act to give the power to school
boards to charge a modest fee, set by the province, for each additional credit above the
32 successfully completed credit threshold.
Recommendation 6-15: The province should immediately lift the moratorium on the
competitive procurement requirement for student transportation, so that competitive bids are
used for the 2012–13 school year.
Recommendation 6-16: The province should amend the Education Act to give school boards
the power to charge a modest transportation user fee set by the province.
Recommendation 6-17: Education stakeholders should build on the climate of trust and
evidence-based decision-making fostered since 2003 to begin a constructive dialogue on how
best to find the savings needed to meet student achievement objectives while holding annual
spending growth to one per cent. To help stakeholders, the Commission believes the following
measures should be phased in progressively over the next six years, in this priority sequence:
Reduce by 25 per cent the per-pupil funding for textbooks and learning materials,
classroom supplies and computers;
Increase the average class size from 22 to 24 in Grades 9 to 12;
Set the cap in class size at 23 in primary grades and eliminate the other requirement that
90 per cent of classes must be at 20 or fewer;
Increase the average class size from 24.5 to 26 in Grades 4 to 8 by 2017–18;
Eliminate 70 per cent of the 13,800 additional non-teaching positions created in school
boards since 2002–03; and
Reduce by 25 per cent the funding for capital renewal and student transportation.
Recommendation 6-18: The province should review its special education programs and the
results they have achieved, including both “section” programs for students in care, custody or
treatment, and hospital boards, with the aim of ensuring that funding is being used effectively
to improve student outcomes.

Appendix: Commission Recommendations
509
Recommendation 6-19: The government should close the Demonstration Schools and
reinvest savings to expand alternative secondary school programs in school boards.
The three Schools for the Deaf in Belleville, London and Milton should be consolidated into
one site to achieve a greater critical mass of students from primary grades through secondary
school. Savings should be reinvested in the consolidated school for the deaf and in enhanced
opportunities for deaf learners in school boards, colleges and universities. The Ministry of
Education should transfer the oversight and management of the Brantford site and of the
newly consolidated school for the deaf to one or two English-language school boards, and
transfer the oversight and management of the Centre Jules-Léger (School for the Deaf) to a
French-language school board.
Recommendation 6-20: The added value of training programs leading to additional
qualification should be reviewed, and decisions regarding the granting of qualifications and
experience should be made by a body that is independent of teacher federations and
school boards.
Recommendation 6-21: The province should be able to exercise legislative and regulatory
authority to require that teachers have a minimum number of years of full-time teaching
experience before they are allowed to attempt an additional qualification. While they could
decide to make contractual arrangements with faculties of education or other service
providers, school boards should ultimately have direct oversight of the content of additional
qualification courses. The design of such courses should be reviewed in tandem with the new
curriculum for the two-year teacher education program in Ontario. Both should be more
rigorous and evidence-based, and focused on those aspects of their work that lead to
improved student outcomes.
Recommendation 6-22: In the upcoming renewal of collective agreements, school boards
should negotiate the removal of entitlements associated with retirement gratuities to help offset
the costs of future economic adjustments. School boards’ power in the Education Act to offer
retirement gratuities should be removed.
Recommendation 6-23: The government should work with school boards, teacher federations
and support-staff unions to investigate mechanisms involving shared ownership and
administration of benefit programs in the education sector.

510
Recommendation 6-24: The government should amend the Education Act to give power to
the minister to order the sale of closed schools or other unused properties, especially when
such dispositions could meet other needs in the broader public sector.
Recommendation 6-25: The province should no longer provide top-up funding to
underutilized secondary schools if these schools could instead accommodate some or all of
the Grade 7 and 8 students in their catchment area.
Recommendation 6-26: To mitigate further increases, the province should, in future
discussions with the Ontario Teachers’ Federation, reject further employer rate increases to
the Teachers’ Pension Plan beyond the current rate, and instead examine which benefits
could be reduced prospectively to make the Plan more affordable and benchmark any
changes to the provisions contained in other plans.
Recommendation 6-27: The government should work in a co-ordinated fashion to discuss
supply planning and, in particular, the overproduction of teachers, with Ontario’s
13 universities offering teacher education programs. Attempts should be made to direct
teacher education spaces to areas of greater need, especially in light of the staffing changes
contemplated by the Commission between now and 2017–18.

Appendix: Commission Recommendations
511
Chapter 7: Post-Secondary Education
Recommendation 7-1: Grow government funding for the post-secondary education sector by
1.5 per cent per year until 2017–18.
Recommendation 7-2: Work with post-secondary institutions to reduce bargained
compensation increases, where they exist, and instead align them with trends in more recent
settlements in the broader public sector; a rigorous performance system should also be
introduced to guide compensation, where one is not already in place.
Recommendation 7-3: If capital budgets are constrained, post-secondary institutions should
consider using alternative financing and procurement, especially for buildings that do not
qualify for government funding, such as residences.
Recommendation 7-4: By 2012–13, establish multi-year mandate agreements with
universities and colleges that provide more differentiation and minimize duplication; these
should be implemented beginning in 2013–14.
Recommendation 7-5: Institute a process for establishing mandate agreements using a
review by either a blue-ribbon panel or the Higher Education Quality Council of Ontario to
ensure the highest-quality programs are funded to grow and expand. This should be
completed in the 2012–13 fiscal year and must be transparent for the institutions and
the public.
Recommendation 7-6: Establish and implement a rational and strategic division of roles
between the college and university systems.
Recommendation 7-7: Create a comprehensive, enforceable credit recognition system
between and among universities and colleges. This is an absolutely essential feature
of differentiation.
Recommendation 7-8: Post-secondary institutions need to devote more resources to
experiential learning such as internships; allow for more independent or self-assigned study;
develop problem-based learning modules; and increase study abroad and international
experiences. Many institutions already incorporate these features into their programs, funding
them from within existing portfolios.
Recommendation 7-9: Encourage universities that do not presently have flexible provisions
regarding teaching and research workloads in their collective agreements with faculty to
consider such provisions in future bargaining. While each university must conduct teaching
and research, top-performing teachers and researchers should be recognized with the
appropriate workloads and rewards.

512
Recommendation 7-10: Have post-secondary institutions redesign incentive systems to
reward excellent teachers, as is currently done for researchers.
Recommendation 7-11: Link further provincial funding allocations to quality objectives, which
will encourage post-secondary institutions to be more responsive. In addition, the province
should alter the funding model to also reward degrees awarded, rather than just
enrolment levels.
Recommendation 7-12: Government and post-secondary institutions must measure learning
outcomes; that is, the value added through education, not just whether a person graduates.
Recommendation 7-13: Enhance performance measures in multi-year accountability
agreements with post-secondary institutions through the use of teacher performance scores
and student satisfaction ratings where the primary reasons for dissatisfaction are adequately
captured.
Recommendation 7-14: Work with private career colleges to collect and publish the same
performance indicators as public colleges and universities. Private career colleges should bear
the cost of such reporting.
Recommendation 7-15: As a part of the mandate agreements with post-secondary
institutions, tie outcome quality indicators to funding.
Recommendation 7-16: Evaluate the research funding system of post-secondary institutions
and research hospitals as a whole, including how it is affecting university and hospital
budgeting practices.
Recommendation 7-17: Award provincial research funding more strategically and manage it
more efficiently. Consolidating and offering a single-window approach for access and reporting
through an online portal will greatly improve efficiency and reduce paperwork, both for
government and for post-secondary institutions.
Recommendation 7-18: Maintain the existing tuition framework, which allows annual tuition
increases of five per cent. However, simplify the design to maintain the overall ceiling but allow
institutions greater flexibility to adjust tuition fees at the program level, within the ceiling.
Recommendation 7-19: Maintain the Ontario Student Access Guarantee, which represents
10 per cent of additional tuition revenue that institutions are required to set aside to fund
bursaries and other student assistance programs.

Appendix: Commission Recommendations
513
Recommendation 7-20: Reshape student financial assistance provided by both the federal
and provincial governments, including the newly announced 30% Off Ontario Tuition grant, to
target more of the assistance to low-income students whose access is most likely to be
compromised by financial obstacles and broaden the approach to improving access to
post-secondary education.
Recommendation 7-21: Explore phasing out provincial tuition and education tax credits to
invest in upfront grants.
Recommendation 7-22: Streamline student financial assistance by decoupling loans and
grants. Eligibility for grants should not be contingent on loan applications.
Recommendation 7-23: Harmonize the variety of scholarships, grants and other assistance
programs that the government offers, into already-existing programs of a similar nature, across
post-secondary institutions.
Recommendation 7-24: Lower the current 25 per cent Ontario Student Assistance Program
default-rate threshold for triggering cost-sharing to 20 per cent for all post-secondary
institutions in Ontario and work with institutions towards the objective of setting a still-lower
threshold in future.
Recommendation 7-25: Extend the review period for Ontario Student Assistance Program
default rates, which are now measured roughly two years after borrowers start repaying.
Recommendation 7-26: Have the post-secondary sector leverage its existing collective
purchasing capacity through the Ontario Education Collaborative Marketplace and regional
buying groups.
Recommendation 7-27: Establish a single pension fund administrator for all university and
college pensions, while recognizing differences in pensions.
Recommendation 7-28: Before new capital spaces are approved, require universities and
colleges to demonstrate increased use of space and consider year-round optimization of
existing spaces. Priority should be given to the deferred maintenance in the current capital
stock before new capital projects.
Recommendation 7-29: Compel post-secondary institutions to examine whether they can
compress some four-year degrees into three years by continuing throughout the summer.
Recommendation 7-30: Cease funding for international marketing of Ontario’s universities
and integrate it into existing trade mission activities. Universities, colleges and the federal
government already invest in these activities.

514
Chapter 8: Social Programs
Recommendation 8-1: Hold growth in social programs spending to 0.5 per cent per year.
Recommendation 8-2: Move aggressively towards a fully integrated benefits system that simplifies client access, improves client outcomes and improves fiscal sustainability through greater program effectiveness and reduced administrative costs.
Recommendation 8-3: A fully integrated benefits system should seek efficiencies by, at a minimum, centralizing income testing and payment delivery; automating the processing of applications, eligibility and payments; automating income verification; consolidating program delivery; and standardizing eligibility criteria.
Recommendation 8-4: Collect the information necessary to deliver and evaluate a fully integrated benefits system. In doing so, continue to respect and protect personal information and privacy.
Recommendation 8-5: The Commission for the Review of Social Assistance in Ontario
should examine system design options that deliver a more efficient and higher-quality service
to social assistance recipients. This examination should consider combining Ontario Works
and the Ontario Disability Support Program, and having the combined program delivered at
the local level. It should also address the further integration of employment services available
through Employment Ontario.
Recommendation 8-6: Undertake a thorough initial assessment of new entrants into social
assistance to identify the degree of intervention required to help them return to the labour
market. Triage new entrants to appropriate supports according to this assessment.
Recommendation 8-7: Streamline and integrate other employment and training services with
Employment Ontario, including the bulk of the employment and training service component
of social assistance, in a carefully sequenced manner.
Recommendation 8-8: Prepare and support people with disabilities who are entering the
workplace. Work with employers and fellow employees to properly understand and
accommodate the specific needs of the individual in the workplace.
Appendix: Commission Recommendations
515
Recommendation 8-9: Advocate for federal reforms in two key areas:
Work with other provinces and the federal government to establish a national income-
support program for people with disabilities who are unlikely to re-enter the workforce.
Implement the final recommendations of the Mowat Centre Employment Insurance
Task Force.
Recommendation 8-10: If growth in expenditures for social programs is contained below
the 0.5 per cent annual growth rate, reinvest savings into social assistance, with priority
given to:
Increasing asset limits for social assistance qualification;
Tying specific benefits (beginning with the Ontario Drug Benefit program) to income levels
rather than to social assistance status to help tear down the “welfare wall”; and
If funds remain, raising basic needs and shelter amounts.
Recommendation 8-11: Continue implementing reforms to child welfare proposed by the
Commission to Promote Sustainable Child Welfare. This must include building on reforms to
Children’s Aid Societies, implementing an outcome-based accountability structure and
strengthening links between the child welfare sector and services in other sectors, such as
education, post-secondary education, and employment and training services.
Recommendation 8-12: In light of the Commission’s recommendation to reinvest savings
achieved by holding the increase of social program spending below the recommended
0.5 per cent annual growth rate into specific social assistance reforms, the government should
retain the current maximum level of the Ontario Child Benefit.
Recommendation 8-13: Reconfigure child and youth mental health services to consolidate
agencies and improve service delivery and integration both within the sector itself and with
other sectors such as children’s services, health, education and youth justice.
Recommendation 8-14: Integrate children’s services to enhance early identification
and intervention.
Recommendation 8-15: Move towards consolidating developmental services funding for
community-based support programs into a single direct funding program.
Recommendation 8-16: Reduce excess capacity in the youth justice system through
strategic closures of facilities.

516
Recommendation 8-17: Reform funding practices in the non-profit sector to increase flexibility
and reduce administrative costs by focusing on measuring outcomes rather than inputs.
Recommendation 8-18: Provide a single point of access within government for the non-profit
sector to improve and broaden relationships across ministries that enter into contracts with the
non-profit sector, using a model such as the Open for Business initiative.
Recommendation 8-19: Undertake pilot projects using social impact bonds across a range of
applications.

Appendix: Commission Recommendations
517
Chapter 9: Employment and Training Services
Recommendation 9-1: Focus the efforts of Employment Ontario on clients who need complex
interventions. Streamline clients requiring modest intervention to low-cost, self-serve
resources as efficiently as possible.
Recommendation 9-2: Streamline and integrate other employment and training services with
Employment Ontario, including the bulk of the employment and training service component of
social assistance and integration and settlement services for newcomers, in a carefully
sequenced manner.
Recommendation 9-3: Advocate for a comprehensive training agreement to replace the
patchwork of federal-provincial employment and training funding agreements currently in
place, many of which are about to expire, with a single arrangement.
Recommendation 9-4: Tie employment and training programs more explicitly to measured
outcomes. Data collection must in turn be improved.
Recommendation 9-5: Advocate for the collection of sub-provincial data in all future federal
surveys on labour vacancies. Leverage labour vacancy data to inform employment and
training program design and delivery.
Recommendation 9-6: Transfer responsibility for Workforce Planning Boards to the Ministry
of Training, Colleges and Universities’ regional offices to develop stronger local linkages and
broaden community and regional planning for economic development.
Recommendation 9-7: Direct Workforce Planning Boards to encourage employers to
increase investments in workplace-based training.
Recommendation 9-8: Develop a labour-market policy framework to link planning for
employment and training services more strongly to economic development initiatives led
by ministries such as Economic Development and Innovation; Agriculture, Food and Rural
Affairs; and Northern Development and Mines.
Recommendation 9-9: Shift the responsibility for all apprenticeship administration to other
actors in the sector. Functions related to the administration of apprenticeship classroom
training should be given to colleges and union training centres. All other administrative
responsibilities for apprenticeships should be transferred to the College of Trades over time.

518
Chapter 10: Immigration
Recommendation 10-1: Develop a position on immigration policies that is in the province’s
best economic and social interests. Present this position to the federal government with the
expectation that, as the largest recipient of immigrants in Canada, Ontario’s interest will be
given considerable weight in federal policy development.
Recommendation 10-2: Catalyze national discussions on immigration policy as the
successful integration of immigrants is critical for Canada’s and Ontario’s economic futures.
Recommendation 10-3: Advocate the federal government for a greater provincial role in
immigrant selection to ensure that the level and mix of immigrants coming to Ontario is
optimized to support economic prosperity and improve outcomes for immigrants. Barring
success, advocate for an expanded Provincial Nominee Program.
Recommendation 10-4: Press the federal government to be more transparent in its refugee
policies and practices and to compensate Ontario for the costs of providing additional social
supports to refugees and refugee claimants.
Recommendation 10-5: Advocate for the federal government to undertake a pilot program
equivalent to Australia’s pre-application skills assessment.
Recommendation 10-6: Streamline and integrate provincially delivered integration and
settlement services for recent immigrants with Employment Ontario.
Recommendation 10-7: Advocate for devolving federal immigrant settlement and training
programs to the province with an appropriate funding mechanism, similar to those established
in British Columbia and Manitoba.

Appendix: Commission Recommendations
519
Chapter 11: Business Support
Recommendation 11-1: Government needs to publish an “economic vision” for Ontario.
Recommendation 11-2: Expand government reviews of direct business support programs
and tax expenditures to include supports such as business services, procurement, and publicly
funded research and development.
Recommendation 11-3: Refocus the mandate of business support programs from job
creation to productivity growth in the private sector.
Recommendation 11-4: Starting in 2012–13, make ministries responsible and accountable
for tax expenditures that align with their respective program areas. Ministries should initially
be provided with the means to fund the tax expenditures (i.e., a net zero impact for the
ministries), but after that they will have to manage the pooled envelope of tax expenditures
and direct business support programs to meet budgetary targets.
Recommendation 11-5: Introduce a new funding model that encourages efficiency and
harmonizes efforts across ministries. We propose that money for both direct and indirect
business support programs, including refundable tax credits, should be pooled into a single
funding envelope.
Recommendation 11-6: Sunset all current direct business support programs in 2012–13.
After accounting for legal commitments and legacy projects, as well as the 2017–18 deficit
reduction target, pool the remaining funds and tax expenditures into a single envelope used
to fund business support programs submitted by ministries. These programs must align with
the productivity focus of the government economic development policy and meet rigorous
design criteria.
Recommendation 11-7: Follow the Public Sector Accounting Board (PSAB) recommendation
to report transfers through the tax system as expenses, and adopt the PSAB standard for tax
revenue beginning with the 2012 Ontario Budget. In 2011, Ontario provided refundable
business tax credits (tax credits that are “refunded” or paid out, even if no tax is payable)
totalling $723 million to three main areas: media industries, research and development, and
apprenticeship and co-op student training. Many of these tax credits overlap with the
objectives of direct business support programs, and all should be subjected to the same
degree of scrutiny as program spending. Further gains could be achieved by making the tax
system more neutral, removing special preferences that favour some business activities over
others, and better aligning refundable corporate income tax credits with direct business
support programs.

520
Recommendation 11-8: Introduce legislation to sunset all current refundable corporate
income tax (CIT) credits in 2012–13 as part of the government’s tax expenditure review.
Add refundable CIT credits that demonstrate effectiveness and administrative efficiency into
the single envelope used to fund business support programs, and include revenue forgone
from those tax credits in the funding allocation of an appropriate ministry.
Recommendation 11-9: Restrict the Ontario small business deduction (SBD) for large
Canadian-controlled private corporations by paralleling the federal business limit reduction,
and include the Ontario SBD in the review of tax expenditures for effectiveness and
administrative efficiency.
Recommendation 11-10: Work with the federal government to ensure that tax expenditures
outside of Ontario’s control maximize value for money and directly support economic growth
in Ontario.
Recommendation 11-11: Review and rationalize the current provincial financial support
provided to the horse racing industry so that the industry is more appropriately sustained by
the wagering revenues it generates rather than through subsidies or their preferential
treatments.
Recommendation 11-12: Eliminate the Ontario resource tax credit and review the mining tax
system to ensure that the province is supporting the exploration and production of minerals in
Ontario while receiving a fair return on its natural resources.
Recommendation 11-13: Establish a more user-friendly, “one-window” portal where clients
can have seamless access to information about all business support and other economic
development programs provided by all ministries, and be able to make online transactions
such as applications, approvals, and financial and other types of reports.
Recommendation 11-14: Establish single, shared “back-office” support for all ministries in
the delivery of their business support programs, including contract administration, payment
processing, expenditure tracking, client contacts, project milestones and outcomes.
Recommendation 11-15: Establish a four-year sunset rule for all future business support
programs. Extend only programs that have demonstrated their merit through a mandatory,
comprehensive evaluation in the third year of operation — and end all others.
Recommendation 11-16: Publish an annual list of direct business support programs, tax
expenditures and related annual spending. In addition, a list of companies receiving direct
financial support from the government, including total amount received, should be published.

Appendix: Commission Recommendations
521
Chapter 12: Infrastructure, Real Estate and Electricity
Recommendation 12-1: Place more emphasis on achieving greater value from existing
assets in asset management plan reporting requirements than is currently proposed in the
Long-Term Infrastructure Plan for certain organizations (e.g., universities, municipalities, etc.).
Recommendation 12-2: Implement full cost pricing for water and wastewater services.
Recommendation 12-3: Where gaps in information and evidence exist, review the roles and
operations of public and private mass transit service providers in the Greater Toronto and
Hamilton Area and services provided by Ontario Northland Transportation Commission in the
north to find efficiencies in those regions’ transportation networks. Act on that evidence to
improve the efficiency of those services.
Recommendation 12-4: Following the precedent set by the Toronto Transit Commission,
begin charging for parking at GO Transit parking lots.
Recommendation 12-5: Pursue a national transit strategy with the federal government,
other provinces and municipalities.
Recommendation 12-6: Engage citizens in an open, public dialogue on how best to create
new revenue sources for future transportation capital needs.
Recommendation 12-7: Subject ministries to market prices for the use of government
real estate.
Recommendation 12-8: Consolidate the real estate and accommodation function now resting
in line ministries and locate it centrally at the Ministry of Infrastructure.
Recommendation 12-9: Develop a strategic plan for the province’s real estate portfolio that
adopts market principles for the acquisition, disposition, use and investment in real estate.
Recommendation 12-10: Eliminate the Ontario Clean Energy Benefit as quickly as possible.
Recommendation 12-11: Review all other energy subsidy programs against measures of
value for money and achievement of specific policy goals.
Recommendation 12-12: Produce an Integrated Power System Plan built on the foundation
of the province’s Long-Term Energy Plan.
Recommendation 12-13: Consolidate Ontario’s 80 local distribution companies along
regional lines to create economies of scale.

522
Recommendation 12-14: As part of the review of the feed-in tariff (FIT) program, take steps
to mitigate its impact on electricity prices by:
Lowering the initial prices offered in the FIT contract and introducing degression rates
that reduce the tariff over time to encourage innovation and discourage any reliance on
public subsidies; and
Making better use of “off-ramps” built into existing contracts.
Recommendation 12-15: Procure larger generation facilities through a request for
proposal process.
Recommendation 12-16: Review the roles of various electricity sector agencies to identify
areas for economies in administration. This could include investigating the potential to
co-ordinate back-office functions.
Recommendation 12-17: Make wholesale electricity prices inclusive of transmission costs
such as capacity limitations and congestion as part of a comprehensive restructuring of the
wholesale electricity market.
Recommendation 12-18: Make regulated prices more reflective of wholesale prices by
increasing the on-peak to off-peak price ratio of time-of-use pricing and by making critical peak
pricing available on an opt-in basis.
Recommendation 12-19: Co-ordinate a comprehensive, proactive electricity education
strategy across sector participants that at a minimum covers:
Ontario’s electricity resources including nuclear, hydroelectric, thermal and renewable
generation;
The role and value of electricity import and export markets;
Roles and responsibilities of the various entities operating in the electricity sector;
The evolving role of the electricity ratepayer in the smart grid paradigm; and
Electricity prices — what drives them, how they are communicated and how they are best
responded to.
Recommendation 12-20: Strategically promote Ontario’s strengths in the energy sector,
capitalizing on export opportunities for domestic goods and services.

Appendix: Commission Recommendations
523
Chapter 13: Environment and Natural Resources
Recommendation 13-1: Move towards full cost recovery and user-pay models for
environmental programs and services.
Recommendation 13-2: Rationalize roles and responsibilities for environmental protections
that are currently shared across levels of government.
Recommendation 13-3: Employ a risk-based approach for environmental approvals that
focuses on improving outcomes and prevention.
Recommendation 13-4: Review opportunities to further streamline the environmental
assessment process, such as co-ordinating further with the federal government’s process or
integrating it with certain approvals.
Recommendation 13-5: Place greater emphasis on prevention and the polluter-pay principle
for contaminated sites using appropriate financial tools, such as financial assurance.
Recommendation 13-6: Review the effectiveness of the current governance structure
of the Ontario Clean Water Agency to evaluate the merits of restructuring it as a for-profit,
wholly owned government entity.
Recommendation 13-7: Rationalize and consolidate the entities and agencies involved in
land use planning and resources management.
Recommendation 13-8: Ensure that the government’s approach to the Ring of Fire
maximizes opportunities for Aboriginal Peoples and all Ontarians.
524
Chapter 14: Justice Sector
Recommendation 14-1: Improve evidence-based data collection in the justice sector to
achieve better outcomes in sector programs.
Recommendation 14-2: Increase use of the Justice On Target program to assist with the
reduction of custody remand, and implement evidence-based approaches to increase
efficiency in the field of family law and family courts.
Recommendation 14-3: Expand diversion programs for low-risk, non-violent offenders with
mental illness as an alternative to incarceration.
Recommendation 14-4: Review the core responsibilities of police to eliminate their use
for non-core duties. This review would include an examination of alternative models of police
service delivery. Criteria for the review would include determining the relative costs of the
various security providers and an evaluation of their respective comparative advantages.
Recommendation 14-5: Use alternative service delivery for the delivery of non-core services
within correctional facilities, where it is feasible.
Recommendation 14-6: Continue the process of clustering adjudicative tribunals across
the Ontario Public Service.
Recommendation 14-7: Examine integration opportunities and consolidate where possible
public safety training in policing, fire services and correctional services, which are currently
delivered individually through their respective colleges.
Recommendation 14-8: Have the justice sector continue to work with Infrastructure Ontario
to use alternative financing and procurement to assist in replenishing its capital infrastructure.
Recommendation 14-9: Improve co-ordination between federal and provincial governments
in areas such as justice policy and legislation, law enforcement and correctional services.
Recommendation 14-10: Negotiate the transfer of responsibility for incarceration for
sentences longer than six months to the federal government.

Appendix: Commission Recommendations
525
Chapter 15: Labour Relations and Compensation
Recommendation 15-1: Establish an independent working group to consider and determine
which broader public-sector occupations and industries should be deemed as providing
essential services, the appropriate essential-worker designation process, and the appropriate
form of dispute resolution mechanism for broader public-sector industries and occupations.
Recommendation 15-2: Establish the overall principles/outcomes necessary for reform to the
interest arbitration process going forward.
Recommendation 15-3: The normal course of an arbitration process should begin with
mediation, prior to arbitration, to attempt to arrive at a negotiated settlement between
the parties.
Recommendation 15-4: The arbitration system needs to be shifted in favour of more
objective analysis, based on objective criteria, and supported by systematic data
and research.
Recommendation 15-5: Provide zero budget increase for wage costs in the Ontario
government so any increases must be accounted for within the respective growth rates
recommended in this report.
Recommendation 15-6: Bumping provisions (i.e., seniority) in collective agreements are
unduly impeding the move towards a progressive and efficient public service. The government
needs to work with bargaining agents and employers to explore options for modifying these
provisions and monitor progress towards fixing this problem.
Recommendation 15-7: Do not let concerns about successor rights in the broader public
sector stop privatizations or amalgamations that make sense and are critical to successful
reform. Inherited agreements do not live forever; provisions can be accepted initially and
bargained differently when they come up for renewal.
Recommendation 15-8: Consider expanding the authority of the Ontario Labour Relations
Board to facilitate the establishment of effective and rationalized bargaining structures that
support the delivery of quality and effective public services.
Recommendation 15-9: Further rationalize bargaining, while recognizing that multiple models
of rationalized bargaining exist (e.g., centralized, co-ordinated, legislated, voluntary). Work
collaboratively with broader public-sector employers and bargaining agents to determine the
most appropriate model on a sector-by-sector basis.

526
Recommendation 15-10: The government should facilitate a voluntary movement to
centralized bargaining for municipalities — particularly in relation to police and firefighting
bargaining.
Recommendation 15-11: Establish a Labour Relations Information Bureau to collect and
disseminate the range of data and information relevant to employers and unions in the broader
public sector in their negotiations, and identify data and other information/knowledge gaps.
Of particular importance is developing data and measures of productivity.
Recommendation 15-12: Introduce a comprehensive and transparent benchmarking system
for Ontario Public Service and broader public-sector compensation, which would include a
costing of the full compensation package, including benefits, pensions and moving through
“grids” with seniority.
Recommendation 15-13: Ensure that leaders in the Ontario Public Service and broader
public sector are held to account and that they are adequately compensated and encouraged
through incentives to lead and excel.
Recommendation 15-14: Ensure that the job descriptions and collective agreement
provisions defining management’s ability to organize work are flexible enough to allow for the
movement of people to ensure that the best people are in the right places at the right time.
Recommendation 15-15: Provide a better sense of expectations and objectives for each
program, how those fit into the broader public policy thrust, and communicate those
expectations to the broader public sector.

Appendix: Commission Recommendations
527
Chapter 16: Operating and Back-Office Expenditures
Recommendation 16-1: Expand the services ServiceOntario delivers. This includes pursuing
additional partnerships for service delivery within the Ontario Public Service, and furthering
service delivery partnerships with municipal and federal levels of government.
Recommendation 16-2: The government should direct clients to more convenient and less
expensive channels, such as online service delivery for birth registration.
Recommendation 16-3: ServiceOntario should optimize current virtual processes.
Recommendation 16-4: The government needs to increase ServiceOntario’s current annual
$2 million capital budget.
Recommendation 16-5: Savings from efficiency gains in ServiceOntario operations should be
used to generate a fiscal dividend.
Recommendation 16-6: Where possible, private-sector participation should be used to move
ServiceOntario further towards a full cost recovery model.
Recommendation 16-7: The government should review existing agency mandates and
functions to determine if greater efficiencies could be achieved through rationalization or
consolidation of programs, delivery through existing ministry resources, or the outright
elimination of functions.
Recommendation 16-8: Where there is an existing non-tax revenue stream or where such a
revenue stream can be created, strong consideration should be given to transferring or
establishing responsibility for direct delivery to an arm’s-length, not-for-profit corporation,
under the Delegated Administrative Authorities or similar model.
Recommendation 16-9: Consideration should be given to rationalizing and consolidating
programs that regulate inter-related sectors or that could otherwise gain efficiencies from
greater integration.
Recommendation 16-10: The government should shift its service delivery of information and
information technology (I&IT) from in-house to external sources, where feasible.
Recommendation 16-11: The government should ask the Ontario Auditor General to help find
an appropriate balance between ensuring accountability and continuing oversight of
compliance with rules and regulations.

528
Recommendation 16-12: At a minimum, the government should allow principles of efficiency
to drive accountability programs, such as switching from individually tracked expenses to a per
diem for civil servants and consultants, as is done by the federal government.
Recommendation 16-13: Selected shared services should be expanded to agencies, boards
and commissions and the broader public sector.
Recommendation 16-14: The government should consolidate information and information
technology (I&IT) services throughout the broader public sector.
Recommendation 16-15: Significant savings and efficiencies can be achieved by further
co-ordinating existing horizontal supply chains across the broader public sector.
Recommendation 16-16: The province should take a direct leadership role in using core
provincial infrastructure and expertise to foster shared services across the broader public
sector. Significant economies of scale can be created through common shared services
foundations, applications, resources and expertise.
Recommendation 16-17: Expand consolidation of maintenance and plant management
practices already established in the Ontario Public Service into the broader public sector to
create efficiencies.
Recommendation 16-18: The Ontario Public Service should develop an integrated transfer
payment operation centre and an enterprise grant management system.
Recommendation 16-19: Consolidate back-office operations for grant programs or transfer
payments with identical recipients.

Appendix: Commission Recommendations
529
Chapter 17: Government Business Enterprises
Recommendation 17-1: Do not partially or fully divest any or all of the province’s government
business enterprises — Ontario Lottery and Gaming Corporation, Liquor Control Board of
Ontario, Ontario Power Generation and Hydro One — unless the net, long-term benefit to
Ontario is considerable and can be clearly demonstrated through comprehensive analysis.
Recommendation 17-2: While continuing to promote socially responsible consumption,
undertake initiatives to enhance the Liquor Control Board of Ontario’s profits, including:
Direct it to use its purchasing power more effectively and improve its markup structure for
setting retail prices;
Continually compare the merits of providing supports to Ontario producers against desired
policy outcomes; and
More aggressively pursue store expansion.
Recommendation 17-3: Improve the Ontario Lottery and Gaming Corporation’s efficiency
through, at a minimum, the following measures:
Close one of the two head offices;
Close one of the two casinos in Niagara Falls;
Allow slot machine operations at sites that are not co-located with horse racing venues;
and
Stop subsidizing the purchase and provision of lottery terminals to point-of-sale locations
and begin to introduce other points of sale for lotteries.
Recommendation 17-4: Re-evaluate, on a value-for-money basis, the practice of providing a
portion of net slot revenues to the horse racing and breeding industry and municipalities in
order to substantially reduce and better target that support.
Recommendation 17-5: Consider directing the Ontario Lottery and Gaming Corporation to
expand its existing business lines, develop new gaming opportunities and make effective use
of private-sector involvement.
Recommendation 17-6: The government should avoid intervening in Ontario Power
Generation or Hydro One’s rate filings for the purpose of delaying short-term price increases;
too often this leads to greater costs down the road. When regulations or directives are required
that impinge on normal utility business practices, the policy objectives being sought must
be transparent.

530
Recommendation 17-7: The government should seek and achieve efficiencies within
the operations of Ontario Power Generation and Hydro One through means such as
strategic partnerships.
Recommendation 17-8: Each government business enterprise must continue to build on its
industry’s best practices to improve its operational efficiency. Each should revisit
memorandums of understanding and other agreements to ensure that they reflect commercial
mandates. And each should undergo peer ranking and benchmarking on the basis of financial
and other metrics both to better understand the organization’s relative performance and
find efficiencies.

Appendix: Commission Recommendations
531
Chapter 18: Revenue Integrity
Recommendation 18-1: Work with the federal government to ensure that a fair share of a
company’s worldwide income is allocated to Canada and the provinces.
Recommendation 18-2: Work with the federal government to address aggressive
interprovincial and international tax avoidance activities by:
Undertaking additional data review and research to identify activities of particular concern
to Ontario;
Entering into an agreement with the Canada Revenue Agency to invest resources
in additional compliance efforts; and
Implementing additional reporting requirements that disclose activities that cause income
and losses to be allocated to a province where the underlying economic activity was
minimal or did not occur.
Recommendation 18-3: Collaborate with the federal government and other provinces to
investigate options to tax corporations on a consolidated basis, with the purpose of ensuring
a fair allocation of losses and income across Canada.
Recommendation 18-4: Enhance Ontario’s ability to detect and recover revenues from
underground economic activity by linking more databases to reported transactions for
tax purposes.
Recommendation 18-5: Review the adoption of government-authorized sales-recording
modules in certain sectors (e.g., food services) to address “zapper” software (zappers remove
a vendor’s record of sale).
Recommendation 18-6: Develop a concept of self-certification of electronic point-of-sales
(ePOS) software. The self-certification is based on the principle of tax authorities developing
and publishing a set of requirements for accounting software and ePOS systems.
Recommendation 18-7: Develop a public awareness campaign on the impact of the
underground economy. For example, by using unregistered contractors or contractors who do
not issue receipts, there are risks of not obtaining a warranty for repairs, risks of not being able
to seek legal remedy for poor workmanship, and risks of liability for injuries or damages that
occur on a customer’s premises.
Recommendation 18-8: Create employee deeming provisions where businesses substitute
independent contractors for employees to avoid paying Ontario’s Employer Health Tax.

532
Recommendation 18-9: Establish a forum to discuss emerging issues and trends in the
underground economy as well as innovations and best practices for addressing them.
The forum should include representatives from various ministries, and federal and municipal
governments as well as industry associations.
Recommendation 18-10: The Ministry of Finance should take the lead by providing
assistance to municipalities in developing policy for the collection of unpaid Provincial
Offences Act fines in the province.
Recommendation 18-11: Use licence and registration suspensions as a tool to facilitate the
collection of Provincial Offences Act fines related to vehicles, including parking, speeding and
automobile insurance violations.
Recommendation 18-12: Allow fines to be added via the property tax roll by adding Provincial
Offences Act fines to the offender’s property tax bill, even if the property is jointly owned.
Recommendation 18-13: Offset tax refunds against unpaid Provincial Offences Act fines.
Recommendation 18-14: Require that recipients of government grants or refundable tax
credits, contracts, loans and loan guarantees are first in good standing with the government in
terms of accounts receivable and have no outstanding taxes due before providing assistance.
Recommendation 18-15: Require that all ministries record Crown debt receivables in the
enterprise financial system so that collection action can be commenced in a timely fashion.
Recommendation 18-16: Proceed with the 2011 Ontario Budget proposals by moving to
rationalize the collection of non-tax revenue between Ontario Shared Services and the Ministry
of Finance with the intent to consolidate, in a staged fashion, all non-tax and tax collection
functions into the Ministry of Finance.
Recommendation 18-17: Develop a legislative framework to provide the Ministry of Finance
with the authority to collect all provincial Crown debts and incorporate more effective
collections tools and mechanisms.
Recommendation 18-18: Develop standard policies and practices across the Ontario Public
Service for collections to ensure the optimum return for dollars spent.
Recommendation 18-19: Work with the Office of the Information and Privacy Commissioner
of Ontario to ensure the protection of privacy in the implementation of these proposals.
Recommendation 18-20: Improve methods for information gathering and sharing across
government, including making greater use of the Regulatory Modernization Act, in order to
identify emerging and current issues to improve responsiveness in a compliance environment.

Appendix: Commission Recommendations
533
Recommendation 18-21: Use the Ministry of Finance’s risk assessment technology to better
focus enterprise-wide audit activity on areas where rates of return are highest for the province.
Recommendation 18-22: Implement measures to better co-ordinate and consolidate
government audits of companies within the Ministry of Finance to recover funds on behalf of
the province.
Recommendation 18-23: Develop risk assessment approaches with other jurisdictions to help
address audit issues that cross provincial and international boundaries.
Recommendation 18-24: Instead of user fees remaining in fixed nominal terms, they should
be updated using a blend of full cost recovery and indexation and be phased in over the next
two years.
Recommendation 18-25: Conduct a review of education tax rate-setting policies for
residential and business tax rates to maintain a stable level of education tax revenues in
real terms.
Recommendation 18-26: Continue to implement the business education tax (BET) reduction
plan while considering options for adjusting the plan in order to avoid part or all of the revenue
loss associated with reducing high BET rates by also increasing low BET rates.
Recommendation 18-27: Build on the existing business education tax (BET) reduction plan to
address historical BET rate inequities and distortions by gradually implementing a single
uniform BET rate.
Recommendation 18-28: Further develop and implement results-focused strategies to deter
illegal tobacco, including enforcing existing laws and developing new partnerships and
legislative and regulatory tools.
Recommendation 18-29: Replace taxes tied to a good’s volume with taxes tied to the good’s
value (i.e., replace specific taxes with ad valorem taxes or otherwise capture changes in
values).

534
Chapter 19: Liability Management
Recommendation 19-1: General risks can and should be handled through the contingency
reserve, which should be set higher than in recent budgets and should grow over time to
address the possibility of growth rate biases in the revenue projection. Modest internal risks
should be addressed through an operating reserve. The contingency reserve should be
increased to cover a 0.2 percentage point annual overestimate of revenue growth.
Recommendation 19-2: Specific risks should be addressed through an explicit strategy.
Care should be taken in budget-setting processes to diligently identify any known risks of
significant fiscal magnitude, and a strategy developed to mitigate those risks.
Recommendation 19-3: We recommend that the province either terminate the Pension
Benefits Guarantee Fund or explore the possibility of transferring it to a private insurer.
The Fund is no longer sustainable in its current form as it presents a large fiscal risk for
the province in the event of another economic downturn.
Recommendation 19-4: The Ontario government should conduct and publish its own liability
management assessment of the public-sector pension plans and develop plans to contain any
fiscal risks identified.
Recommendation 19-5: Clarify who bears the ultimate financial responsibility for funding
deficits of the public-sector pension plans as the Commission encountered considerable
confusion on this issue.
Recommendation 19-6: In the proposed liability management assessment report, the
government should make public the current and prospective financial health of public-sector
pension plans.
Recommendation 19-7: In the liability management assessment report, the government
should test the fiscal health of the plans against the possibility of rates of return being higher
or lower than assumed. This could be done using a higher or lower discount rate, or could
rely on a probability distribution.
Recommendation 19-8: The government’s objective, when faced with pension funding
deficits, should be to reduce prospective benefits rather than increase the contribution rate
beyond current levels. This would help to close the funding gap and reduce the accrual
of pension benefits on a prospective basis, mitigating the impact on the fiscal plan.
The government may need to consider legislative options, should negotiations with plan
sponsors be unsuccessful.

Appendix: Commission Recommendations
535
Recommendation 19-9: The government should accelerate work on the design of
public-sector benefits and make containing the growth in the cost of benefits part of the
broader public-sector compensation negotiation strategy.
Recommendation 19-10: The province should examine opportunities to achieve savings
and better investment returns through the consolidation of the administrative functions and
investment pooling of pension plans across the broader public sector.
Recommendation 19-11: The province must make the government’s cost of the public-sector
pension plans — both in concept and in magnitude — much clearer in the Public Accounts
and other financial statements, including the Budget.
Recommendation 19-12: To better protect the province against the costs of environmental
cleanup, adjust the current legislative framework so that more focus is placed on the
polluter-pays principle.
Recommendation 19-13: Work with the federal government to mitigate risks to the
Ontario fiscal framework from federal policy changes. Known risks at the time include the
Canada–European Union Free Trade Agreement being negotiated, proposed changes to
personal income taxes and the federal omnibus crime bill (Bill C-10).
Recommendation 19-14: Ontario should negotiate with the federal government to commit to
a housing framework for Canada that includes adequate, stable, long-term federal funding and
encourages its housing partners and stakeholders, including municipal governments, to work
with the federal government to secure this commitment.
Recommendation 19-15: Work with the municipal sector to mitigate risks to the Ontario fiscal
framework by ensuring that commitments are adhered to. Known risks at this time include
potential overruns in municipal infrastructure and the Pan Am Games.
Recommendation 19-16: Modify or eliminate the Taxpayer Protection Act so that both
spending and taxes can be used as required to address threats to fiscal sustainability.

536
Chapter 20: Intergovernmental Relations
Recommendation 20-1: Establish an understanding with the federal government that actions
taken at the federal level pose fiscal risks to Ontario.
Recommendation 20-2: Advocate strongly for reforming federal programs that are not
working effectively in Ontario’s interests.
Recommendation 20-3: Advocate for reforms to Equalization by, at a minimum, fully
capturing resource revenues and accommodating differing price levels between provinces.
Recommendation 20-4: Simultaneously eliminate the Canada Social Transfer and transfer
the equivalent tax points to the provinces.
Recommendation 20-5: Advocate for federal greenhouse gas mitigation programs to provide
fair and equitable support for Ontario’s clean energy initiatives.
Recommendation 20-6: Sort out areas of responsibility with the federal government where
there is overlap and duplication and establish a more efficient economic and fiscal relationship
that saves money and provides better services to citizens.
Recommendation 20-7: Extend the period of the final $500 million of upload by another two
years, so it is not complete until 2020. For illustration, if we reach 2015’s $232 million by 2017,
that would save $165 million ($397 million minus $232 million).
Recommendation 20-8: Ensure that, beginning in 2013, the Ontario Municipal Partnership
Fund (OMPF) declines to the planned $500 million by 2016. A reasonable assumption would
be a $25 million decrease in each of the next four years beginning in 2013, resulting in a
$500 million OMPF envelope in 2016.
Recommendation 20-9: The province and municipalities must work together to establish an
accountability framework that would track how municipalities are investing the benefits realized
as a result of the uploads.

Appendix: List of Acronyms
537
Appendix 2: List of Acronyms
ABCs agencies, boards and commissions
AFP alternative financing and procurement
ALC alternate level of care
AMAPCEO Association of Management, Administrative and Professional Crown
Employees of Ontario
AMO Association of Municipalities of Ontario
ASD Alternative Service Delivery
ATTC Apprenticeship Training Tax Credit
BET business education tax
BPS broader public sector
CAAT Colleges of Applied Arts and Technology Pension Plan
CCAC Community Care Access Centre
CEAA Canadian Environmental Assessment Act/Agency
CETA Canada–European Union Free Trade Agreement
CETC Co-operative Education Tax Credit
CHSRF Canadian Health Services Research Foundation
CHSRG Canadian Health Services Research Group
CHT Canada Health Transfer
CIHI Canadian Institute for Health Information
COIA Canada–Ontario Immigration Agreement
CPI consumer price index
CPP Canada Pension Plan

538
CRA Canada Revenue Agency
CRF Community Reinvestment Fund
CST Canada Social Transfer
DAA Delegated Administrative Authorities
DRC debt retirement charge
EA environmental assessment
EASR Environmental Activity and Sector Registry
ECA Environmental Compliance Approval
ECE early childhood educator
EGMS Enterprise Grants Management System
EI Employment Insurance
ELCC Early Learning and Child Care
EMS Emergency Medical Services
EO Employment Ontario
EPA Environmental Protection Act
EQAO Education Quality and Accountability Office
ER emergency room
ES Employment Service
ETFO Elementary Teachers' Federation of Ontario
EU European Union
FDK full-day kindergarten
FHO Family Health Organization
FHT Family Health Team

Appendix: List of Acronyms
539
FIT feed-in tariff
FSCO Financial Services Commission of Ontario
FSW Federal Skilled Worker
FTE full-time equivalent
GBE government business enterprise
GEO Global Experience Ontario
GDP gross domestic product
GTA Greater Toronto Area
GTHA Greater Toronto and Hamilton Area
HBAM Health-Based Allocation Model
HOOPP Healthcare of Ontario Pension Plan
HOT high-occupancy/toll lane
HQO Health Quality Ontario
HST harmonized sales tax
I&IT information and information technology
ICES Institute for Clinical Evaluative Sciences
ICT information and communications technology
IESO Independent Electricity System Operator
INAC Indian and Northern Affairs Canada
IO Infrastructure Ontario
IP intellectual property
IPRC Identification, Placement and Review Committee
IPSP Integrated Power System Plan

540
IT information technology
JOT Justice On Target
JSPP Jointly Sponsored Pension Plan
LAO Legal Aid Ontario
LCBO Liquor Control Board of Ontario
LDC local distribution companies
LHIN Local Health Integration Network
LMA Labour Market Agreement
LMDA Labour Market Development Agreement
LSR Local Services Realignment
LTC long-term care
LTEP Long-Term Energy Plan
LTIP Long-Term Infrastructure Plan
MAG Ministry of the Attorney General
MCI Ministry of Citizenship and Immigration
MCSCS Ministry of Community Safety and Correctional Services
MCSS Ministry of Community and Social Services
MEU municipal electrical utility
MGS Ministry of Government Services
MNDM Ministry of Northern Development and Mines
MNR Ministry of Natural Resources
MOE Ministry of the Environment
MOHLTC Ministry of Health and Long-Term Care

Appendix: List of Acronyms
541
MTCU Ministry of Training, Colleges and Universities
NAFTA North American Free Trade Agreement
NPLC Nurse Practitioner-Led Clinic
OACP Ontario Association of Chiefs of Police
OAPSB Ontario Association of Police Services Boards
OCB Ontario Child Benefit
OCEB Ontario Clean Energy Benefit
OCT Ontario College of Teachers
OCWA Ontario Clean Water Agency
ODB Ontario Drug Benefit Program
ODSP Ontario Disability Support Program
OECD Organization for Economic Co-operation and Development
OECM Ontario Education Collaborative Marketplace
OECTA Ontario English Catholic Teachers Association
OEFC Ontario Electricity Financial Corporation
OEPTC Ontario Energy and Property Tax Credit
OHIP Ontario Health Insurance Plan
OLG Ontario Lottery and Gaming Corporation
OLRB Ontario Labour Relations Board
OMA Ontario Medical Association
OMAFRA Ontario Ministry of Agriculture, Food and Rural Affairs
OMPF Ontario Municipal Partnership Fund
ONTC Ontario Northland Transportation Commission

542
OPA Ontario Power Authority
OPG Ontario Power Generation
OPP Ontario Provincial Police
OPS Ontario Public Service
OPSEU Ontario Public Service Employees Union
OPSEUPP OPSEU Pension Plan
OSSTF Ontario Secondary School Teachers' Federation
OTF Ontario Teachers' Federation
OW Ontario Works
PBA Pension Benefits Act
PBGF Pension Benefits Guarantee Fund
PIL payments in lieu of taxes
PISA Programme for International Student Assessment
PMFSDR Provincial-Municipal Fiscal and Service Delivery Review
PNP Provincial Nominee Program
POA Provincial Offences Act
PSAB Public Sector Accounting Board
PSE post-secondary education
PSLRTA Public Sector Labour Relations Transition Act
PSPP Public Service Pension Plan
Q&E Teacher Qualification & Experience
QECO Qualifications Evaluation Council of Ontario
R&D research and development

Appendix: List of Acronyms
543
REA Renewable Energy Approval
RFP request for proposal
RMP Risk Management Program
SBD small business deduction
SIB Social Impact Bond
SJIF Strategic Jobs and Investment Fund
SME small and medium enterprises
SR&ED Scientific Research and Experimental Development
SSO shared-service organization
STTF Strategic Training and Transition Fund
TFSA Tax-Free Savings Account
TPA Taxpayer Protection Act
TPP Teachers’ Pension Plan
TTC Toronto Transit Commission
Val Tag Vehicle Validation Sticker
WHO World Health Organization
YES Youth Employment Strategy
YMPE Year’s Maximum Pensionable Earnings
3SO Shared Support Services Southeastern Ontario

©Queen’s Printer for Ontario, 2012
ISBN 978-1-4435-8896-6 (PRINT)
ISBN 978-1-4435-8897-3 (HTML)
ISBN 978-1-4435-8898-0 (PDF)