of migraine and recurrent headache in children: a long
TRANSCRIPT

Page 1/21
Long-term ambient air pollutant exposure and riskof migraine and recurrent headache in children: A12-year cohort studySyuan-Yu Hong
China Medical University Hospital https://orcid.org/0000-0002-5097-1206Lei Wan
China Medical UniversityHui-Ju Lin
China Medical UniversityCheng-Li Lin
China Medical University HospitalChang-Ching Wei ( [email protected] )
https://orcid.org/0000-0003-4835-3246
Research
Keywords: air pollution, headache, migraine
Posted Date: January 27th, 2020
DOI: https://doi.org/10.21203/rs.2.21882/v1
License: This work is licensed under a Creative Commons Attribution 4.0 International License. Read Full License
Version of Record: A version of this preprint was published at International Journal of EnvironmentalResearch and Public Health on December 7th, 2020. See the published version athttps://doi.org/10.3390/ijerph17239140.
Page 2/21
AbstractBackground
Although research has suggested environmental factors to be triggers of headache, the contribution oflong-term air pollution exposure to migraine and recurrent headaches (migraine/headaches) is poorlyunderstood. Hence, we executed this nationwide cohort study to investigate the association of levels ofambient air pollution with the incidence and the risk of migraine/headaches in Taiwan children from2000 to 2012.
Methods
We collected data from the Taiwan National Health Insurance Research Database and linked them to theTaiwan Air Quality Monitoring Database. Overall 218,008 children aged <18 (0-17) years old wereidenti�ed from January 1, 2000 and then followed until they were diagnosed by a physician >=3 timeswith migraine/headaches or until December 31, 2012. We categorized the annual average concentrationof each air pollutant (�ne particulate matter, total hydrocarbon, methane, sulfur dioxide, and nitrogendioxide) into quartiles (Q1-Q4). We measured the incidence rate, hazard ratios (HRs), and thecorresponding 95% con�dence intervals for migraine/headaches strati�ed by the quartiles.
Results
A total of 28037 children (12.9%) were identi�ed with migraine/headaches. The incidence rate andadjusted HR for migraine/headaches increased with higher-level exposure of air pollutants, except sulfurdioxide.
Conclusions
We herein demonstrate that long-term ambient air pollutant exposure might be a risk factor for childhoodmigraine/headaches.
IntroductionMigraine, characterized by recurrent headaches, are among the most common childhood headaches [1,2].Children with recurrent headaches result in great impact on their life but also on their families.Furthermore, childhood migraine may persist into adulthood [3]. The in�uence of environmental factorson the attacks of migraine and recurrent headaches (migraine/headache) leads to extensive debate overthe past decades [4]. Determining the triggering factors of migraine/headaches is crucial to prevent theillness. Chemical exposure and speci�c environmental irritants are well-known triggers ofmigraine/headaches [4]. Air pollution is the most widespread and inevitable form of pollution, and it maycontribute to serious short-term and long-term health effects [5], involving a large variety of ailments andconditions that include chronic obstructive pulmonary disease, neurobehavioral disorders, lung cancer,birth defects, leukemia, premature death, asthma, immune system defects, and cardiovascular diseases

Page 3/21
[6–8]. Patients with migraine/headaches often complain that poor air quality aggravates or triggers theirheadaches [9]. Indeed, environmental factors, such as air pollutants and weather, may produceneurogenic in�ammation and trigger migraine/headaches onset [10,11]. To date, several studies havesuggested an association between some outdoor air pollutants and frequency, severity, or medicalconsultation rates for migraine/headaches [12–14]; nevertheless, among the mentioned studies, themajority have accentuated adult patients and short-term in�uences induced by air pollution onmigraine/headaches [12–14]. Most of our current knowledge about migraine/headaches in children isbased on extrapolations from studies conducted on adults. Children and adolescents are notablydifferent from adults in terms of their rapid growth, signi�cant neurological development, andpsychological changes. Thus, the long-term in�uences engendered by air pollution onmigraine/headaches should be examined for the pediatric age group speci�cally.
This nationwide cohort study entailed employing the Taiwan National Health Insurance ResearchDatabase (NHIRD) and the Taiwan Air Quality Monitoring Database (TAQMD) for probing the long-termin�uences induced by outdoor air pollution on the incidence rates and risk of childhoodmigraine/headaches. The �ndings may promote informed practical clinical perspectives and advancepublic awareness of the negative in�uences that are induced by air pollution on children’s health.
Methods And MaterialsData Source
The Taiwan National Health Insurance (NHI) program is known to offer coverage to 99% of Taiwan’s 25million residents and to contains information regarding contracts with over 90% of the country’s nationalhealth care facilities (https://nhird.nhri.org.tw/en/index.html) [15,16]. The corresponding electronicdatabase of this program, namely the NHIRD, comprises the claims data of insurants. Published studieshave validated the high reliability of NHIRD diagnostic data [15,16]. The NHIRD includes detailedinformation, such as outpatient visits, hospital admissions, prescriptions, procedures, and diseasediagnoses executed on the basis of the International Classi�cation of Diseases, Ninth Revision, ClinicalModi�cation (ICD-9-CM) [17]. An exclusive personal identi�cation number (PIN) is assigned to everyindividual in Taiwan. In the NHIRD, for patient privacy protection, data concerning patient identities arescrambled cryptographically [15,17]. The entirety of NHI data sets can also be cross-referenced with eachindividual’s PIN. This study utilized an NHIRD-derived data �le, namely the Children �le, that comprisesinformation from half (chosen at random) of all insured children in Taiwan [18]. The data set wasdetermined to afford an adequate sample for pursuing the study objectives. This study was rati�ed byChina Medical University Hospital’s Institute Review Board (CMUH104-REC2-115), and it complied withthe principles outlined in the Declaration of Helsinki.
Study population, outcome of interest, endpoints, and confounding factors
This was a retrospective cohort study. From the Children �le, we formed a child cohort by selectingindividuals aged <18 (0-17) years on of January 1, 2000 (baseline). The study period was from January 1,

Page 4/21
2000, to December 31, 2012. The follow-up period of each participant began from baseline untilmigraine/headaches, end of the follow-up, termination of insurance, or death. Individuals who weremissing information such as their address, sex, and air pollution data and individuals that had ever beendiagnosed with migraine/headaches before the baseline were excluded. Migraine/headaches werede�ned as≧3 times diagnoses of ICD-9-CM code 346 and/or 784.0 in any diagnosis �eld during anyinpatient or ambulatory claim process during study period. By the end of the study period, someparticipants would be entering adulthood. The �nal study population contained 218,008 participants. Ourmean (standard deviation) follow-up years for patients with migraine was 10.7 (2.6). Urbanization level ofresidence, age, number of consultations/visits with a physician per year, monthly income, sex, andallergic diseases constituted the confounding factors. On the basis of the method realized by Liu et al[19], we classi�ed the study patients’ residential areas, encompassing 365 townships of Taiwan, intoseven urbanization levels, with Levels 1 and 7 representing the “most urbanized” and “least urbanized,”respectively. We strati�ed the townships for de�ning urbanization levels by using several variables,including the following: population ratio of people with an educational level of college or higher,population density (people/km2), population ratio of agricultural workers, number of physicians per100,000 people, and population ratio of elderly people aged older than 65 years [19]. Because Levels 4-7were determined to have low sample size, we combined these four levels into a single group (Level 4).Thus, we strati�ed the factor urbanization level into four levels, with Levels 1 and 4 representing thehighest density and lowest density, respectively. We also classi�ed monthly income into the followingthree groups: >NT$20,000, NT$15,000-19,999, and <NT$15,000.
Exposure assessment
Ambient air monitoring of monthly average data for SO2, NO2, THC, CH4, and PM2.5 are available for 74Taiwan Environmental Protection Administration (EPA) monitoring stations on Taiwan’s main island since1994. Concentrations of each pollutant are measured hourly—CO by nondispersive infrared absorption,NO2 by chemiluminescence, SO2 by ultraviolet �uorescence, THC and CH4 by �ame ionization detector,and PM2.5 by beta-gauge—and are reported hourly.
We identi�ed the map coordinates of the monitoring stations and air pollution sources. The ultraviolet�uorescence in these recording stations were automatically monitoring and recording readings of PM2.5,THC, CH4, SO2, and, NO2. The daily air pollution data were averaged based on these recording stations.Yearly average concentrations of pollutants were calculated from the baseline to the date of migraine andrecurrent headaches occurrence, the withdrawal of patients, or the end of the study period, and the datawere categorized into quartiles. The participants were assigned to residential districts based on the clinicwhere they most frequently sought treatment for acute upper respiratory infection (ICD-9-CM code 460).We divided the annual average air pollutant concentrations into quartiles: Q1, Q2, Q3, and Q4. Wecategorized annual average PM2.5 into Q1 (<11120 μg/m3), Q2 (11120-12652 μg/m3), Q3 (12652-15056μg/m3), and Q4 (>15056 μg/m3); THC into Q1 (<835 ppm), Q2 (835-877 ppm), Q3 (877-949 ppm), and Q4(>949 ppm); CH4 into Q1 (<735 ppm), Q2 (735-754 ppm), Q3 (754-770 ppm), and Q4 (>770 ppm) ; SO2into Q1 (<1346 ppb), Q2 (1346-1914 ppb), Q3 (1914-2338 ppb), and Q4 (>2338 ppb); NO2 into Q1 (<7896

Page 5/21
ppb), Q2 (7896-8894 ppb), Q3 (8894-10214 ppb), and Q4 (>10214 ppb). The air pollutant measurementsfrom Taiwan EPA monitoring stations were integrated into monthly point data and interpolated topollutant surfaces using inverse distance weighting (IDW). For the IDW approach, we used inversesquared distance (1/squared distance) weighted average of the three nearest monitors to computemonthly mean concentration. IDW predicts values of unknown points based on the similarity of twoobjects by its distance. When the unknown point to be estimated is closer to the known measuring point,the weighted value of the unknown point will be higher. We used the air pollution exposure in 2-yearbefore and current year of diagnosis headaches to predict the monthly air pollution. And used IDWmethod to estimate the air pollution concentrations between the measured values of the air monitoringstations around the household registered by each patient according to the distance. Then explore theassociation between air pollutant and headaches (All data were managed by a geographic informationsystem (ArcGIS version10.3; ESRI, Redlands, CA, USA)).
Statistical analysis
The sociodemographic factors in the current study included residential area urbanization level, sex,monthly income, age, and daily average exposure to air pollutants. To test the differences in daily averageconcentration distributions for each air pollutant by quartile and urbanization, we executed χ2 testing.Moreover, we calculated the incidence density rate of migraine/headaches (per 1000 person-years)according to each quartile of daily average concentrations for the �ve air pollutants. By employing Coxproportional hazard regression, we also derived estimates of the hazard ratios (HRs) as well as 95%con�dence intervals (CIs) corresponding to migraine/headaches at the Q2-Q4 levels for air pollutantconcentrations relative to the lowest level (Q1). To address the concern of constant proportionality, weexamined the proportional hazard model assumption using a test of scaled Schoenfeld residuals. In themodel evaluating the migraine and recurrent headaches risk throughout overall follow-up period, resultsof the test revealed a signi�cant relationship between Schoenfeld residuals for PM2.5, THC, CH4, SO2,and NO2 and follow-up time (p-value<0.001, respectively), suggesting the proportionality assumption wasviolated. To deal with non-proportional hazards, we were used extended Cox models with time-dependentterms shows results. We adjusted the applied the multivariable model for allergic diseases, sex, numberof consultations/visits with a physician per year, urbanization level, age, and monthly income. We alsoadded the exposures as a continuous variable to estimate the risk of migraine and recurrent headachesas sensitivity testing. Further, we calculate the month average air concentration to estimate the monthexposed air concentration for each patient by Inverse Distance Weighting Method (IDW methods). TheIDW method is one of the most commonly used spatial interpolation methods in Geosciences, whichcalculates the prediction values of unknown points by weighting the average of the values of knownpoints (This data were analyzed with ArcGIS version 10.3). We accessed the air pollution in 2-year beforeand current year the diagnosis of migraine and recurrent headaches and used IDW method to estimatethe air pollution concentrations between the measured values of the air monitoring stations around thehousehold registered by each patient according to the distance as sensitivity testing. The StatisticalPackage for the ArcGIS version 10.3 as well as SAS 9.3 (SAS Institute Inc, Cary, NC) constituted the
Page 6/21
platforms for all the executed analyses in this study. Additionally, for all executed statistical analyses, wedeemed 2-tailed P values of <0.05 to indicate statistically signi�cant tests.
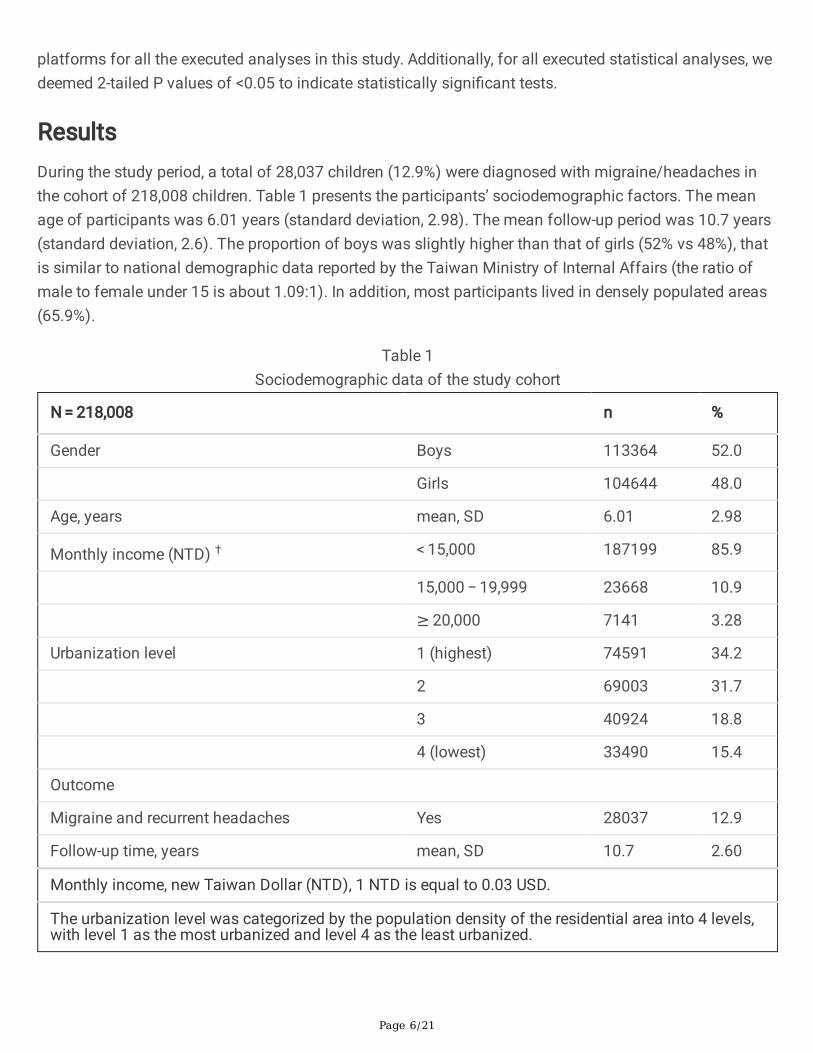
ResultsDuring the study period, a total of 28,037 children (12.9%) were diagnosed with migraine/headaches inthe cohort of 218,008 children. Table 1 presents the participants’ sociodemographic factors. The meanage of participants was 6.01 years (standard deviation, 2.98). The mean follow-up period was 10.7 years(standard deviation, 2.6). The proportion of boys was slightly higher than that of girls (52% vs 48%), thatis similar to national demographic data reported by the Taiwan Ministry of Internal Affairs (the ratio ofmale to female under 15 is about 1.09:1). In addition, most participants lived in densely populated areas(65.9%).
Table 1Sociodemographic data of the study cohort
N = 218,008 n %
Gender Boys 113364 52.0
Girls 104644 48.0
Age, years mean, SD 6.01 2.98
Monthly income (NTD) † < 15,000 187199 85.9
15,000 − 19,999 23668 10.9
≥ 20,000 7141 3.28
Urbanization level 1 (highest) 74591 34.2
2 69003 31.7
3 40924 18.8
4 (lowest) 33490 15.4
Outcome
Migraine and recurrent headaches Yes 28037 12.9
Follow-up time, years mean, SD 10.7 2.60
Monthly income, new Taiwan Dollar (NTD), 1 NTD is equal to 0.03 USD.
The urbanization level was categorized by the population density of the residential area into 4 levels,with level 1 as the most urbanized and level 4 as the least urbanized.

Page 7/21
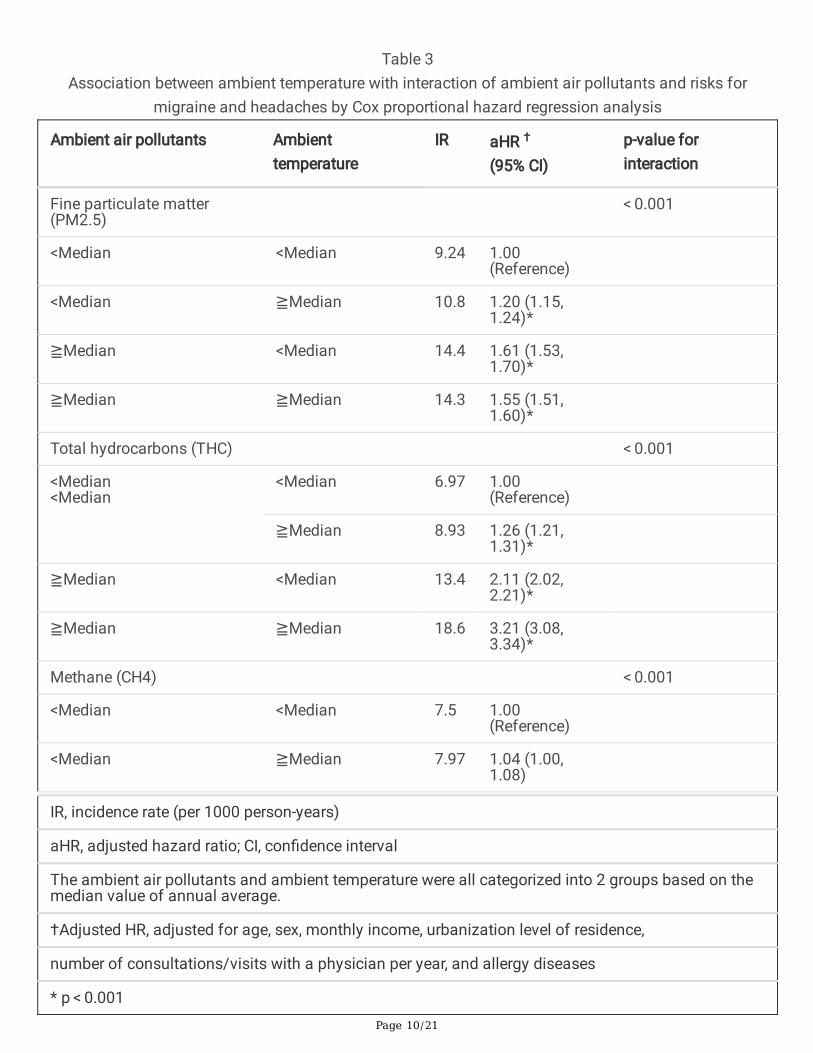
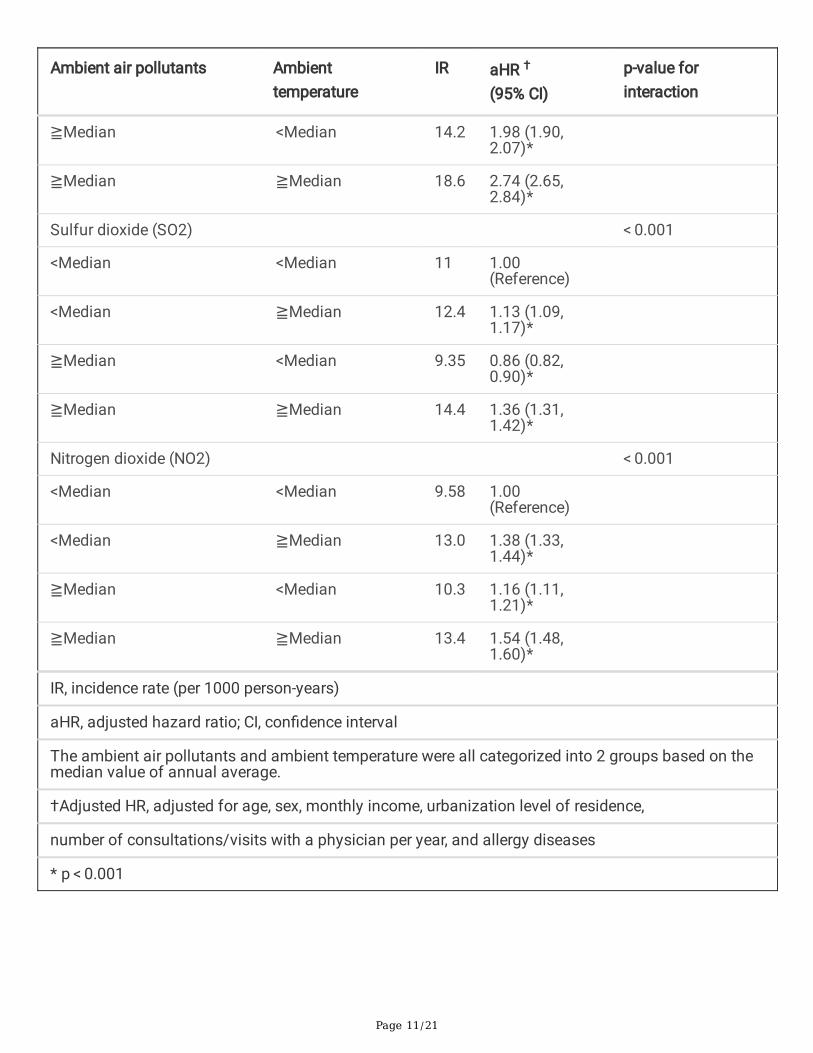
The incidence rates for migraine/headaches increased with higher levels of PM2.5, THC, CH4, and NO2exposure (Table 2). The increasing incidence rates from Q1 to Q4 in PM2.5, THC, CH4, and NO2 werefrom 8.62 to 15.0, from 8.06 to 16.3, and from 8.93 to 24.1, and from 11.8 to 12.9 per 1000 person-years,respectively (Table 2). The adjusted HR for migraine/headaches increased with higher levels of exposurein PM2.5, THC, CH4, and NO2 (Table 2). We also analyzed incidence rate and adjusted HR strati�ed byquartiles and two age groups ( ≦ 6 years and > 6 years) in supplementary Table 1. The risk of migraineand recurrent headaches increased while exposed to higher level air pollutants in children older than 6.The Kaplan-Meier plots (Fig. 1A-E) with pollutant concentration strati�ed by quartiles showed thatpatients exposed to higher pollution concentrations had higher accumulative incidence ofmigraine/headaches than those exposed to lower pollution concentrations of �ne PM2.5, THC, CH4, SO2,and NO2. Figure 2 showed the distribution of air pollution exposures during the follow up time. In theinteraction analyses for the risk of migraine/headaches between ambient temperature and concentrationof ambient air pollutants, we found that the highest incidence rate and the highest adjusted HR were inthose exposed ≧ median temperature and ≧ median-level of pollutants (Table 3). We also used annualaverage concentrations as continuous variables and used extended Cox models with time-dependentterms to consider non-linear relations and interaction between air pollutants and time. Further analysis ofthe extended Cox models with time-dependent terms shows results, indicating that the strength of theassociation increased over time (HR [p value], for PM2.5, 1.000072 [p < 0.001]; for interaction term ofPM2.5 and time, 1.000016 [p < 0.001]; for SO2, 1.0003 [p < 0.001]; for interaction term of SO2 and time,1.0001 [p < 0.001]), and reduced over time (HR [p value],for THC, 1.02 [p < 0.001]; for interaction term ofTHC and time, 0.99 [p < 0.001]; for CH4, 1.045 [p < 0.001]; for interaction term of CH4 and time, 0.99 [p < 0.001]; for NO2, 1.0005 [p < 0.001]; for interaction term of NO2 and time, 0.99 [p < 0.001]). Table 4 showedthat the adjusted HR of migraine and recurrent headaches development was increased with �ve airpollutants concentration (PM2.5, THC, CH4, SO2, and, NO2). Supplement Table 1 showed that InverseDistance Weighting (IDW) to speculate monthly average concentration of PM2.5, THC, CH4, SO2, and, NO2,and. Air pollutant concentrations were grouped into four levels based on quartile. After controlling for riskfactors, patients exposed in higher air pollutant concentrations had a signi�cant higher risk of migraineand recurrent headaches than patients exposed in lower air pollutant concentrations which includingSO2, and NO2. For SO2, relative to Q1 concentrations, the Q2 (adjusted HR = 2.14, 95%CI = 2.06–2.23 andadjusted HR = 1.39, 95%CI = 1.33–1.45), Q3 (adjusted HR = 3.59, 95%CI = 3.45–3.73 and adjusted HR = 1.67, 95%CI = 1.60–1.75), and Q4 (adjusted HR = 3.46, 95%CI = 3.33–3.60 and adjusted HR = 3.29, 95%CI = 3.15–3.44) concentrations were had a signi�cant higher risk of migraine and recurrent headaches.Table 4 revealed the risks for migraine and recurrent headaches increased in participants exposed tovarious annual average concentrations as continuous variable of air pollutants.

Page 8/21
Table 2The risk of migraine and recurrent headaches in children exposed to air pollutants strati�ed by quartile of
annual average concentration in Cox proportional hazard regression
IR cHR (95%CI) aHR† (95%CI)
Fine particulate matter (PM2.5)
Quartile 1, < 11120 µg/m3 8.62 Reference group Reference group
Quartile 2, 11120–12652 µg/m3 11.0 1.30 (1.26, 1.35)** 1.29 (1.25, 1.34)**
Quartile 3, 12652–15056 µg/m3 13.5 1.59 (1.54, 1.65)** 1.57 (1.51, 1.62)**
Quartile 4, > 15056 µg/m3 15.0 1.78 (1.72, 1.84)** 1.75 (1.69, 1.81)**
Total hydrocarbons (THC)
Quartile 1, < 835 ppm 8.06 Reference group Reference group
Quartile 2, 835–877 ppm 8.40 1.05 (1.01, 1.09)* 1.08 (1.04, 1.12)**
Quartile 3, 877–949 ppm 16.9 2.26 (2.18, 2.34)** 2.41 (2.33, 2.49)**
Quartile 4, > 949 ppm 16.3 2.25 (2.17, 2.33)** 2.50 (2.41, 2.59)**
Methane (CH4)
Quartile 1, < 735 ppm 8.93 Reference group Reference group
Quartile 2, 735–754 ppm 6.82 0.76 (0.73, 0.79)** 0.78 (0.75, 0.81)**
Quartile 3, 754–770 ppm 11.0 1.27 (1.22, 1.32)** 1.29 (1.24, 1.33)**
Quartile 4, > 770 ppm 24.1 3.16 (3.06, 3.26)** 3.22 (3.11, 3.33)**
Sulfur dioxide (SO2)
Quartile 1, < 1346 ppb 13.7 Reference group Reference group
Quartile 2, 1346–1914 ppb 10.4 0.75 (0.72, 0.77)** 0.79 (0.76, 0.81)**
Quartile 3, 1914–2338 ppb 11.7 0.87 (0.84, 0.90)** 0.89 (0.86, 0.92)**
IR, incidence rate (per 1000 person-years)
cHR, crude hazard ratio; aHR, adjusted hazard ratio; CI, con�dence interval
The annual average air pollutant concentrations were categorized into 4 groups based on quartiles foreach air pollutant.
†Adjusted HR, adjusted for age, sex, monthly income, urbanization level of residence, number ofconsultations/visits with a physician per year, and allergy diseases
* p < 0.01, ** p < 0.001

Page 9/21
IR cHR (95%CI) aHR† (95%CI)
Quartile 4, > 2338 ppb 12.3 0.90 (0.87, 0.92)** 0.93 (0.90, 0.96)**
Nitrogen dioxide (NO2)
Quartile 1, < 7896 ppb 11.8 Reference group Reference group
Quartile 2, 7896–8894 ppb 12.0 1.02 (0.99, 1.05) 1.07 (1.03, 1.10)**
Quartile 3, 8894–10214 ppb 11.5 0.99 (0.96, 1.02) 1.05 (1.01, 1.09)*
Quartile 4, > 10214 ppb 12.9 1.13 (1.10, 1.17)** 1.23 (1.19, 1.27)**
IR, incidence rate (per 1000 person-years)
cHR, crude hazard ratio; aHR, adjusted hazard ratio; CI, con�dence interval
The annual average air pollutant concentrations were categorized into 4 groups based on quartiles foreach air pollutant.
†Adjusted HR, adjusted for age, sex, monthly income, urbanization level of residence, number ofconsultations/visits with a physician per year, and allergy diseases
* p < 0.01, ** p < 0.001
Page 10/21
Table 3Association between ambient temperature with interaction of ambient air pollutants and risks for
migraine and headaches by Cox proportional hazard regression analysis
Ambient air pollutants Ambienttemperature
IR aHR †
(95% CI)p-value forinteraction
Fine particulate matter(PM2.5)
< 0.001
<Median <Median 9.24 1.00(Reference)
<Median ≧Median 10.8 1.20 (1.15,1.24)*
≧Median <Median 14.4 1.61 (1.53,1.70)*
≧Median ≧Median 14.3 1.55 (1.51,1.60)*
Total hydrocarbons (THC) < 0.001
<Median<Median
<Median 6.97 1.00(Reference)
≧Median 8.93 1.26 (1.21,1.31)*
≧Median <Median 13.4 2.11 (2.02,2.21)*
≧Median ≧Median 18.6 3.21 (3.08,3.34)*
Methane (CH4) < 0.001
<Median <Median 7.5 1.00(Reference)
<Median ≧Median 7.97 1.04 (1.00,1.08)
IR, incidence rate (per 1000 person-years)
aHR, adjusted hazard ratio; CI, con�dence interval
The ambient air pollutants and ambient temperature were all categorized into 2 groups based on themedian value of annual average.
†Adjusted HR, adjusted for age, sex, monthly income, urbanization level of residence,
number of consultations/visits with a physician per year, and allergy diseases
* p < 0.001
Page 11/21
Ambient air pollutants Ambienttemperature
IR aHR †
(95% CI)p-value forinteraction
≧Median <Median 14.2 1.98 (1.90,2.07)*
≧Median ≧Median 18.6 2.74 (2.65,2.84)*
Sulfur dioxide (SO2) < 0.001
<Median <Median 11 1.00(Reference)
<Median ≧Median 12.4 1.13 (1.09,1.17)*
≧Median <Median 9.35 0.86 (0.82,0.90)*
≧Median ≧Median 14.4 1.36 (1.31,1.42)*
Nitrogen dioxide (NO2) < 0.001
<Median <Median 9.58 1.00(Reference)
<Median ≧Median 13.0 1.38 (1.33,1.44)*
≧Median <Median 10.3 1.16 (1.11,1.21)*
≧Median ≧Median 13.4 1.54 (1.48,1.60)*
IR, incidence rate (per 1000 person-years)
aHR, adjusted hazard ratio; CI, con�dence interval
The ambient air pollutants and ambient temperature were all categorized into 2 groups based on themedian value of annual average.
†Adjusted HR, adjusted for age, sex, monthly income, urbanization level of residence,
number of consultations/visits with a physician per year, and allergy diseases
* p < 0.001

Page 12/21
Table 4Comparisons of differences in migraine and recurrent headaches incidences and associated HRs in
participants exposed to various annual average concentrations of air pollutants.
Pollutant levels cHR 95%CI aHR† 95%CI
Fine particulate matter (PM2.5) 1.000 (1.000, 1.000)* 1.000 (1.000, 1.001)*
Total hydrocarbons (THC) 1.003 (1.003, 1.003)* 1.004 (1.004, 1.004)*
Methane (CH4) 1.010 (1.010, 1.010)* 1.010 (1.010, 1.010)*
Sulfur dioxide (SO2) 1.000 (1.000, 1.000)* 1.000 (1.000, 1.001)*
Nitrogen dioxide (NO2) 1.000 (1.000, 1.000)* 1.000 (1.000, 1.001)*
IR, incidence rate (per 1000 person-years)
cHR, crude hazard ratio; aHR, adjusted hazard ratio; CI, con�dence interval
The annual average air pollutant concentrations were categorized into 4 groups based on quartiles foreach air pollutant.
†Adjusted HR, adjusted for age, sex, monthly income, urbanization level of residence, number ofconsultations/visits with a physician per year, and allergy diseases
* p < 0.001
DiscussionAir pollution has become the one of the most signi�cant worldwide environmental health risks [5–8].Currently, Southeast Asia is established to be most polluted area worldwide, with 2.6 and 3.3 milliondeaths ascribed to outdoor and indoor air pollution, respectively [20,21]. Taiwan is in east Asia, near themost polluted area of the world. Previously executed research has reported an association between airpollution and increased frequency and severity of migraine [12–14]. The prevalence of migraine inTaiwanese adolescents has risen over the past decade [22]. Motivated by these clinical, public health, andenvironmental concerns, as well as the lack of data on the childhood headaches–air pollution interaction,we executed the �rst nationwide study on the association of long-term exposure to air pollution with theincidence and risk of childhood migraine/headaches. The �ndings quantify how air pollution affectschildren’s health, indicating higher ambient temperature and ambient air pollutant exposure levels to beassociated with increased incidence and risk of childhood migraine/headaches. Our study thusdemonstrates that ambient air pollutant exposures are indeed associated with migraine/headaches inTaiwanese children. According to the information released by the Environmental Protection Agency ofTaiwan, the domestic air pollution emissions are mainly from two categories. First, mobile pollutionsources (transportation), such as NO2, lead, THC, CO and CH4. Secondly, �xed pollution sources(industrial processes, power generation or waste disposal), including suspended particulates (PM2.5). As

Page 13/21
a representative, we chose THC and CH4 on the behalf of mobile pollution sources and �ne PM2.5 for the�xed pollution sources.
Lewis (2009) assessed epidemiological research executed over the past 25 years on migraine headachein adolescents and children; the researcher detected 64 cross-sectional studies that involved a total of227,249 subjects and were published in 32 different countries. The overall mean prevalence values ofheadache and migraine were estimated to be 54.4% (95% CI 43.1–65.8) and 9.1% (95% CI 7.1–11.1) byadolescence, respectively [23]. Concerning speci�c regions, in the United States, up to 5% of the pediatricpopulation was determined to endure migraine [24]. Another study executed in Sweden recruited 9000school children for probing the migraine prevalence; the mentioned study reported that approximately 4%of the recruited children had migraine, with the average onset age being six years [25]. Furthermore, themigraine prevalence estimates for the ages of seven and 15 years were 1.4% and 5.3%, respectively [25].In the present study, we de�ned recurrent migraine as visiting health care facilities more than 3 timesbecause of migraine to avoid temporary headaches secondary to common cold or acute viral illness.Based on these criteria, the overall prevalence of migraine in children in Taiwan was 12.9%. The risk ofmigraine and recurrent headaches increased while exposed to higher level air pollutants in children olderthan 6. Although migraine is less common in children than in adults, it can begin in childhood andincrease in prevalence with age.
Airborne pollutants have long been regarded as environmental factors that trigger migraine/headaches.However, most previously published studies have accentuated the short-term in�uences engendered byair pollution on migraine/headaches [10,12–14]. The current state of knowledge suggests that a primaryneuronal dysfunction leading to an increased sensitivity to a broad range of stimuli accounts for humanmigraine disorders [11,26]. Both genetic and environmental factors are likely to be pivotal to migrainephenomena [27,28]; a child’s brain develops in response to genes, the environment, and their interactions[29]. Although beyond the scope of the present study, future study exploring the interactions of gene, airpollution exposure and migraine headaches is crucial to improve understanding of the mechanisms ofchildhood migraine/headaches.
Previously published studies regarding the in�uences exerted by air pollution on migraine headacheshave offered inconsistent results. Chen et al executed a similar investigation in 2015 and determined thathigh PM2.5 levels raise the risk of migraine-related clinic visits in Taipei (the capital city of Taiwan) [10].Research in a Canadian population analyzed patients who visited emergency rooms for migrainebetween 1992 and 2002; the results showed PM2.5 to be associated with 3.3% increases in visits formigraine (95% CI: 0.6-6.0) as well as 3.4% increases in visits for headache (95% CI: 0.3–6.6) (12). Daleset al (2009) studied seven Chilean urban centers; they observed an association between acute increasesin ambient air pollution and increases in the number of headache-related hospital admissions [13].However, Mukamal et al (2009), who executed their work in Boston, did not �nd a clear association of airpollutants with risk of emergency room visits for migraine [14]. Our results support the association oflong-term exposure to THC, PM2.5, and CH4 and high AMB TEMP to increased incidence and risk ofchildhood migraine.
Page 14/21
Furthermore, our results indicate that most individuals living in areas with higher urbanization levels hadhigher air pollutant exposure, most likely due to the high vehicle density and population density in urbanareas. Hence, the consumption of large amounts of energy and resources results in the emission of largeamounts of air pollutants into the atmosphere in urban settings. On the other hand, although there aremany sources of PM2.5, it is mainly from �xed pollution source (industrial processes, power generation orwaste disposal) and dust raised by the public works (constructions) based on the statistics of theEnvironmental Protection Agency of Taiwan. Domestic data also revealed numerous large factories andheavy industries (such as cement, petrochemical, oil re�ning, steel and shipbuilding, and other relatedfactories) are mostly concentrated in areas with low population density. In addition, due to the highdegree of construction in Taiwan city, most public works have been transferred to suburbs or lowpopulation density areas in recent years. Therefore, the concentration of PM2.5 in these areas is relativelyhigh. To date, the mechanism by which ambient temperature in�uences headache remains largelyunknown. From a physiological view, headache is associated with hemodynamic variations, and coldweather might aggravate such variations [30]. In addition, regarding both particulate air pollution andambient temperature, PM2.5 was previously reported to be associated with migraine-related visits in thecold season, especially in female patients [12]. Additionally, during cold-front passages, the concentrationof PM2.5 is relatively high [31]. Thus, it is inferred that when the temperature is low, it may cause poorvertical diffusion conditions and thus may result in a relatively high PM2.5 concentration under ordinarydischarge conditions [31].
Our results reveal children who lived in areas with relatively a high ambient temperature had a relativelyhigh accumulated incidence of migraine/headaches, in accordance with previously published studies[32]. Chen et al and Roberts et al [9,33] have emphasized the daily particulate air pollution–daily meantemperature interaction and gave several plausible explanations for this �nding. In Taiwan, people have ahigher likelihood of opening their windows or going outdoors in the warm season than they do in the coolseason, leading to increased exposure; accordingly, monitored air pollutant concentrations could be moreclosely correlated with personal exposure in the warm season than in the cool season. However,extremely cold or extremely hot weather can be a triggering factor for migraine headache [34–38]. InTaiwan, a subtropical country, summer temperatures are often above 38 °C, and annual averagetemperatures are often above 25 °C; hence, the effect of high temperatures is signi�cantly higher thanthat of low temperatures.
The WHO ambient air quality guidelines suggest an annual mean PM2.5 concentration limit of 10 µg/m3and 25 µg/m3 for the 24-hourly mean [39]. In the United States (US), the EPA reduces particle pollution bytightening the annual National Ambient Air Quality Standard for PM2.5 from 15 to 12 µg/m3 in 2012 [39].Populations in large parts of the world, especially in East and Southeast Asia and the Middle East, areexposed to levels of �ne particulate pollution that far exceed the WHO guidelines. In our study, the limit ofinternational guideline for PM 2.5 (25 µg/m3) is only within the �rst quartile of current study. Hence, mostof our population exposed to levels of PM2.5 that far exceed the WHO guidelines. Taiwan is in east Asia,near the most polluted area of the world. The prevalence of migraine in Taiwanese adolescents has risen

Page 15/21
over the past decade. Our �ndings show ambient air pollutant exposure levels to be associated withincreased incidence and risk of childhood migraine/headaches.
Potential limitations that could serve as confounders to this study should be acknowledged. First, geneticand environmental factors (such as stress, family member’s smoking habits, physical activity,occupational exposures, dietary habits, family history of migraine, and emotional factors), severity ofmigraine, and subtype of migraine were not captured in administrative claims databases. Second,children with high exposure to air pollution lived in areas with relatively high urbanization levels. Childrenliving in relatively crowded environments might have relatively high stress associated with notablycrowded housing. Moreover, children in highly polluted areas may have numerous diseases other thanmigraine/headaches, their consultations for respiratory tract infections and allergic diseases may bemore frequent than the national average; the more frequently a child consults the doctor, the moreopportunities that child has of being diagnosed with migraine/headaches. Thus, we adjusted for possibleconfounders such as numbers of consultations/visits with a physician (both per year and overall),monthly income, residence area urbanization level, and allergic diseases. Third, coding accuracy and�nancial incentives may lead to bias when ICD-9 CM codes are used for diagnosis in large insuranceclaims data for research. Although migraine is said to be the most common cause of primary headachein children, most children with headache were coded as ‘unspeci�ed headache’. Some physicians wereaccustomed to give a diagnosis of headache rather than migraine for patients by only few visits. Thisimplies that migraine may be underdiagnosed, particularly in young children and those with mild orinfrequent symptoms. Children with mild symptoms, which may not be recognized by caregivers may beonly treated with over-the-counter medications. Doctors’ specializations may also interfere with thediagnosis. Therefore, we de�ned the studying children should have at least 3 times medical visits andwere given diagnosis of "migraine " and/or "headache" in any diagnosis �eld during any inpatient orambulatory claim process to capture more cases of migraine. Fourth, data from �xed monitoring stationsmay not re�ect the true exposure level to air pollutants in patients and residence may change over thecourse of the study. In Taiwan, because of 12-year compulsory education law, children usually study at a�xed school district of residence area before entering college (> 18-year-old). Hence, residence changedover the course of the study is not quite often seen for children. Sixth, weather change was previouslymentioned as a trigger of migraine [38]. Because Taiwan has a subtropical climate, it does not have 4distinct seasons; thus, climate should not be responsible for changes in prevalence throughout the year.
ConclusionsWe herein demonstrate that long-term exposure to ambient air pollutants and relatively high ambienttemperature are associated with migraine not only in adults but also in children. With this study, we hopeto facilitate the implementation of an appropriate policy of public health for monitoring and furtherimproving air quality—for the health of our children, who are the backbone of the future.
Declarations

Page 16/21
Acknowledgments
This manuscript was edited by Wallace Academic Editing.
This study is supported in part by grants from the Taiwan Ministry of Science and Technology (MOST107-2314-B-039-037-), China Medical University Hospital (DMR-108-200), Taiwan Ministry of Health andWelfare Clinical Trial Center (MOHW108-TDU-B-212-133004), Academia Sinica Stroke BiosignatureProject (BM10701010021), MOST Clinical Trial Consortium for Stroke (MOST 108-2321-B-039-003-),Tseng-Lien Lin Foundation, Taichung, Taiwan, Katsuzo and Kiyo Aoshima Memorial Funds, Japan.
Authors’ contributions
Syuan-Yu Hong, Lei Wan, Hui-Ju Lin and Chang-Ching Wei conceptualized and designed the study.Syuan-Yu Hong drafted the initial manuscript. Cheng-Li Lin carried out the analysis, reviewed andapproved the �nal manuscript as submitted. Chang-Ching Wei coordinated and supervised datacollection, critically reviewed the manuscript, and approved the �nal manuscript as submitted.
Funding: The authors have indicated they have no �nancial relationships relevant to this article todisclose.
Availability of data and materials
All data related to this case report are contained within the manuscript.
Ethics approval and consent to participate
Consent for discussion of the clinical history was provided by the family. The study protocol wasapproved by the Ethics Review Board of the China Medical University ethics committee (Approval #CMUH104-REC2-115). Written informed consent of participation was obtained from the legal guardians.A copy of the written consent is available for review by the Editor of this journal.
Consent for publication
The patient’s guardians have consented to submission of this case report to the journal, and we haveobtained a written informed consent.
Competing Interest: None.
AbbreviationsEPA: Environmental Protection Administration; HRs: hazard ratios; ICD-9-CM: International Classi�cationof Diseases, Ninth Revision, Clinical Modi�cation; IDW: inverse distance weighting; NHIRD: NationalHealth Insurance Research Database; NT: New Taiwan Dollar; PIN: personal identi�cation number;TAQMD: Taiwan Air Quality Monitoring Database

Page 17/21
References1. Stovner L, Hagen K, Jensen R, Katsarava Z, Lipton R, Scher A, et al. The global burden of headache: a
documentation of headache prevalence and disability worldwide. Cephalalgia. 2007; 27: 193-210.https://doi.org/10.1111/j.1468-2982.2007.01288.x
2. Steiner TJ, Birbeck GL, Jensen RH, Katsarava Z, Stovner LJ, Martelletti P Headache disorders are thirdcause of disability worldwide. J Headache Pain. 2015;16:58. https://doi.org/10.1186/s10194-015-0544-2
3. Frare M, Axia G, Battistella PA. Quality of life, coping strategies, and family routines in children withheadache.Headache. 2002;42:953-62. https://doi.org/10.1046/j.1526-4610.2002.02224.x
4. Friedman DI, De ver Dye T. Migraine and the environment. Headache. 2009;49:941-52.http://dx.doi.org/10.1111/j.1526-4610.2009.01443.x
5. Schwartz J. Air pollution and children's health. Pediatrics. 2004;113(4 Suppl):1037-43.https://doi.org/10.1542/peds.113.4. S1.1037
�. Cohen AJ, Ross Anderson H, Ostro B, Pandey KD, Krzyzanowski M, Künzli N, et al. The global burdenof disease due to outdoor air pollution. J Toxicol Environ Health A. 2005;68(13-14):1301-7.http://dx.doi.org/10.1080/15287390590936166
7. Pervin T, Gerdtham UG, Lyttkens CH. Societal costs of air pollution-related health hazards: A review ofmethods and results. Cost Eff Resour Alloc. 2008;6:19. https://doi.org/10.1186/1478-7547-6-19.
�. Brauer M, Freedman G, Frostad J, van Donkelaar A, Martin RV, Dentener F,et al. Ambient Air PollutionExposure Estimation for the Global Burden of Disease 2013.Environ Sci Technol. 2016;50:79-88.https://doi.org/10.1021/acs.est.5b03709
9. Chen CC, Tsai SS, Yang CY. Association between Fine Particulate Air Pollution and Daily Clinic Visitsfor Migraine in a Subtropical City: Taipei, Taiwan. Int J Environ Res Public Health. 2015;12:4697-708.https://doi.org/10.3390/ijerph120504697
10. Meggs WJ. Neurogenic switching: a hypothesis for a mechanism for shifting the site ofin�ammation in allergy and chemical sensitivity. Environ Health Perspect. 1995;103:54-6.https://doi.org/10.1289/ehp.9510354
11. Szyszkowicz M, Stieb DM, Rowe BH. Air pollution and daily ED visits for migraine and headache inEdmonton, Canada.Am J Emerg Med. 2009;27:391-6. https://doi.org/10.1016/j.ajem.2008.03.013
12. Dales RE, Cakmak S, Vidal CB. Air pollution and hospitalization for headache in Chile. Am JEpidemiol. 2009;170:1057-66. https://doi.org/10.1093/aje/kwp217
13. Mukamal KJ, Wellenius GA, Suh HH, Mittleman MA. Weather and air pollution as triggers of severeheadaches. Neurology. 2009;72:922-7. https://doi.org/10.1212/01.wnl.0000344152.56020.94
14. Ezzati M, Baumgartner JC. Household energy and health: where next for research and practice?Lancet. 2017;389:130-132. https://doi.org/10.1016/S0140-6736(16)32506-5
15. Davis K, Huang AT. Learning from Taiwan: experience with universal health insurance. Ann InternMed. 2008;148:313-4. https://doi.org/10.7326/0003-4819-148-4-200802190-00011
Page 18/21
1�. Cheng TM, Taiwan's National Health Insurance system: high value for the dollar. In Okma, K.G.H. andCrivelli, L. ed. Six Countries, Six Reform Models: The Health Reform Experience of Israel, theNetherlands, New Zealand, Singapore, Switzerland and Taiwan. New Jersey: World Scienti�c; 2009.p.171-204. https://doi.org/10.1142/9789814261593_0007
17. Wu CS, Lai MS, Gau SS, Wang SC, Tsai HJ. Concordance between patient self-reports and claimsdata on clinical diagnoses, medication use, and health system utilization in Taiwan. PLoS One.2014;9:e112257. https://doi.org/10.1371/journal.pone.0112257
1�. Wei CC, Lin CL, Kao CH, Liao YH, Shen TC, Tsai JD,et al. Increased risk of Kawasaki disease inchildren with common allergic diseases. Ann Epidemiol. 2014;24:340-3.https://doi.org/10.1016/j.annepidem.2014.02.003.
19. Liu CY, Hung YT, Chuang YL, Chen YJ, Weng WS, Liu JS, et al. Incorporating developmentstrati�cation of Taiwan townships into sampling design of large scale health interview survey. JHealth Management (Chin) 2006; 4:1-22. https://doi.org/10.29805/JHM.200606.0001
20. Maji S, Ghosh S, Ahmed S. Association of air quality with respiratory and cardiovascular morbidityrate in Delhi, India. Int J Environ Health Res. 2018;28:471-490.https://doi.org/10.1080/09603123.2018.1487045
21. Wang SJ, Fuh JL, Juang KD, Lu SR. Rising prevalence of migraine in Taiwanese adolescents aged13-15 years. Cephalalgia. 2005;25:433-8. https://doi.org/10.1111/j.1468-2982.2005.00873.x.
22. Wöber-Bingöl C. Epidemiology of migraine and headache in children and adolescents. Curr PainHeadache Rep. 2013;17:341. http://dx.doi.org/ 10.1007/s11916-013-0341-z
23. Lewis DW. Pediatric migraine. Neurol Clin. 2009;27:481-501.http://dx.doi.org/10.1016/j.ncl.2008.11.003
24. Alpay K, Ertas M, Orhan EK, Ustay DK, Lieners C, Baykan B. Diet restriction in migraine, based on IgGagainst foods: a clinical double-blind, randomised, cross-over trial. Cephalalgia. 2010;30:829-37.https://doi.org/10.1177/0333102410361404
25. Bille B. A 40-year follow-up of school children with migraine. Cephalalgia. 1997;17:488-91;discussion 487. https://doi.org/10.1046/j.1468-2982.1997.1704488.x
2�. Cutrer FM. Pathophysiology of migraine. Semin Neurol. 2006;26:171-80. https://doi.org/10.1055/s-2006-939917
27. Gervil M, Ulrich V, Kaprio J, Olesen J, Russell MB. The relative role of genetic and environmentalfactors in migraine without aura. Neurology. 1999;53:995-9. https://doi.org/10.1212/WNL.53.5.995
2�. Ducros A, Tournier-Lasserve E, Bousser MG. The genetics of migraine.Lancet Neurol. 2002;1:285-93.https://doi.org/10.1016/S1474-4422(02)00134-5
29. Lenroot RK, Giedd JN. The changing impact of genes and environment on brain development duringchildhood and adolescence: initial �ndings from a neuroimaging study of pediatric twins. DevPsychopathol. 2008;20:1161-75. https://doi.org/10.1017/S0954579408000552
30. Cheshire WP. Headache and facial pain in scuba divers.Curr Pain Headache Rep. 2004;8:315-20.https://doi.org/10.1007/s11916-004-0015-y

Page 19/21
31. Feng X, Wang S. In�uence of different weather events on concentrations of particulate matter withdifferent sizes in Lanzhou, China. J Environ Sci (China). 2012;24:665-74.https://doi.org/10.1016/S1001-0742(11)60807-3
32. Chabriat H, Danchot J, Michel P, Joire JE, Henry P. Precipitating factors of headache. A prospectivestudy in a national control-matched survey in migraineurs and nonmigraineurs. Headache.1999;39:335-8. https://doi.org/10.1046/j.1526-4610.1999.3905335.x
33. Roberts S. Interactions between particulate air pollution and temperature in air pollution mortalitytime series studies. Environ Res. 2004;96:328-37. https://doi.org/10.1016/j.envres.2004.01.015
34. Solotareff L, Cuvellier JC, Duhamel A, Vallee L, Tich SNT Trigger Factors in Childhood Migraine: AProspective Clinic-Based Study From North of France. Solotareff L, Cuvellier JC, Duhamel A, Vallée L,Tich SNT. Trigger Factors in Childhood Migraine: A Prospective Clinic-Based Study From North ofFrance. J Child Neurol. 2017;32:754-758. https://doi.org/10.1177/0883073817705251
35. Neut D, Fily A, Cuvellier JC, Vallée L. The prevalence of triggers in paediatric migraine: aquestionnaire study in 102 children and adolescents. J Headache Pain. 2012;13:61-5.http://dx.doi.org/10.1007/s10194-011-0397-2
3�. Chakravarty A, Mukherjee A, Roy D. Trigger factors in childhood migraine: a clinic-based study fromeastern India. J Headache Pain. 2009;10:375-80. https://doi.org/10.1007/s10194-009-0147-x
37. Kelman L. The triggers or precipitants of the acute migraine attack. Cephalalgia. 2007;27:394-402.https://doi.org/10.1111/j.1468-2982.2007.01303.x
3�. Zebenholzer K, Rudel E, Frantal S, Brannath W, Schmidt K, Wöber-Bingöl C, et al. Migraine andweather: a prospective diary-based analysis. Cephalalgia. 2011;31:391-400.https://doi.org/10.1177/033310241038558039.
39. Giannadaki D, Lelieveld J, Pozzer A. Implementing the US air quality standard for PM2.5 worldwidecan prevent millions of premature deaths per year. Environ Health. 2016;15:88.https://doi.org/10.1186/s12940-016-0170-8
Figures

Page 20/21
Figure 1
Kaplan-Meier curves of the accumulative incidence rate of migraine and recurrent headaches during thefollow-up period among the four quartiles of each air pollutant. (A) PM2.5 (B) THC (C) CH4 (D) SO2 (E)NO2
Figure 2

Page 21/21
The distribution of annual air pollution exposures during the follow up time. (A) PM2.5 (B) THC (C) CH4(D) SO2 (E) NO2
Supplementary Files
This is a list of supplementary �les associated with this preprint. Click to download.
SupplementaryTable1.docx