of escherichia coli adenylate kinase and nucleotides: nmr ... · pdf file(barzu &...
TRANSCRIPT

Biochemistry 1990, 29, 7459-7467 7459
Tagaya, M., Yagami, T., & Fukui, T. (1987) J . Biol. Chem.
Tagaya, M., Yagami, T., Noumi, T., Futai, M., Kishi, F., Nakazawa, A., & Fukui, T. (1989) J . Biol. Chem. 264,
Taylor, J. W., Ott, J., & Eckstein, F. (1985) Nucleic Acids
Thompson, H. T., Cass, K. H., & Stellwagen, E. (1975) Proc.
Thompson, S. T., & Stellwagen, E. (1976) Proc. Natl. Acad.
Vetter, I. R., Reinstein, J., & Rosch, P. (1990) Biochemistry
Walker, J. E., Saraste, M., Runswick, M. J., & Gay, N. G. (1982) EMBO J . 1 , 945-951.
Wells, T. N. C., & Fersht, A. R. (1986) Biochemistry 25, 1881-1886.
Wiesmuller, L., Noegel, A,, Barzu, O., Geniod, G., & Schleicher, M. (1990) J . Biol. Chem. 265, 6339-6345.
262, 8257-828 1.
8257-8281.
Res. 13, 8765-8785.
Natl. Acad. Sci. U.S.A. 72, 669-672.
Sci. U.S.A. 73, 361-365.
(third paper of three in this issue).
Reinstein, J., Brune, M., & Wittinghofer, A. (1988) Bio- chemistry 27, 47 12-4720.
Reinstein, J., Gilles, A.-M., Rose, T., Wittinghofer, A., Saint Girons, I., Birzu, O., Surewicz, W. K., & Mantsch, H. H. (1 989) J . Mol. Biol. 264, 8 107-8 1 12.
Reinstein, J., Vetter, I . R., Schlichting, I., Rosch, P., Wit- tinghofer, A., & Goody, R. s. (1990) Biochemistry (first paper of three in this issue).
Rosenthal, A., Jung, R. R., & Hunger, H.-D. (1986) Gene 42, 1-9.
Sachsenheimer, W., & Schulz, G. E. (1977) J. Mol. Biol. 114, 23-36.
Saint Girons, I., Gilles, A,-M., Margarita, D., Michelson, S., Monnot, M., Fermandjian, S. , Danchin, A., & Barzu, 0. (1987) J . Biol. Chem. 262, 622-629.
Seeburg, P. H., Colby, W. W., Capon, D. J., Goeddel, D. V., & Levinson, A. D. (1984) Nature (London) 312, 71-75.
Subramanian, S . (1982) Arch. Biochem. Biophys. 216, 1 16-1 25.
Complexes of Escherichia coli Adenylate Kinase and Nucleotides: ‘H NMR Studies of the Nucleotide Sites in Solution
Ingrid R. Vetter, Jochen Reinstein, and Paul Rosch*v* Department of Biophysics, Max Planck Institute for Medical Research, Jahnstrasse 29, 0-6900 Heidelberg 1 . FRG
Received August 16, 1989; Revised Manuscript Received April 2, 1990
ABSTRACT: One- and two-dimensional nuclear magnetic resonance (NMR) studies, in particular sub- strate-protein nuclear Overhauser effect (NOESY) measurements, as well as nucleotide and P1,Ps-bis- (5’-adenosyl) pentaphosphate (AP5A) titrations and studies of the temperature-dependent unfolding of the tertiary structure of Escherichia coli adenylate kinase (AKEc) were performed. These experiments and comparison with the same type of experiments performed with the porcine enzyme [Rosch, P., Klaus, W., Auer, M., & Goody, R. S. (1989) Biochemistry 28, 4318-43251 led us to the following conclusions: (1) At pH 8 and concentrations of approximately 2.5-3 mM, AKEc is partially unfolded a t 318 K. (2) ATP*Mg2+ binds to the ATP site with a dissociation constant of approximately 40 pM under the assumption that ATP binds to one nucleotide site only. (3) AP5A*Mg2+ binds to both nucleotide sites and thus simulates the active complex. (4) The ATP-Mg2+ adenine in the AKEc.AP5A*Mg*+ complex is located close to His134 and Phe19. (5) The AKEc “G-loop” with bound ATP.Mg2+ is structurally highly homologous to the loop region in the oncogene product p2 1 with bound GTP.Mg2+.
A d e n y l a t e kinases (AK,I ATP:AMP phosphotransferase, EC 2.7.4.3) catalyze the transfer of the terminal phosphoryl group of ATP to AMP in the presence of a divalent metal ion, physiologically Mg2+, which binds to the triphosphate and one of the product diphosphates, respectively (Noda, 1971; Ray et al., 1988):
ATP.Mg2+ + AMP F= ADP*Mg2+ + ADP
van, 1982; Fry et al., 1985; Mildvan, 1989). The bisubstrate analogue P’,PS-bis(5’-adenosyl) penta-
phosphate (AP5A) is a potent inhibitor of all tested adenylate kinases, in particular of the porcine enzyme (Lienhard & Secemski, 1973; Feidhaus et al., 1975). Whereas it was not possible so far to cocrystallize any of the mammalian adenylate kinases with either one of the substrates or, alternatively, the
According to the reaction scheme, the enzyme has two dif- ferent nucleotide binding sites, the AMP site and the ATP- Mg2+ site, corresponding to the product ADP and ADP-Mg2+ site, respectively. The location of these two sites is a subject of much controversy between X-ray crystallographers (Pai et al., 1977; Egner et al., 1987; Muller & Schulz, 1988) and NMR spectroscopists (Hamada et al., 1979; Smith & Mild-
8 Permanent address: Department of Structure and Chemistry of Biopolymers, University of Bayreuth, Postfach IO 12 51, D-8580 Bay- reuth, FRG.
0006-2960/90/0429-7459%02.50/0
I Abbreviations: ADP, adenosine diphosphate; AK, adenylate kinase; AKI, cytosolic adenylate kinase; AKec, E. coli adenylate kinase; AKY, yeast adenylate kinase; AMP, adenosine monophosphate; APsA, P1,Ps-bis(5’-adenosy1) pentaphosphate; ATP, adenosine triphosphate; COSY, correlated spectroscopy; lD, one dimensional; 2D, two dimen- sional; aAH and aA-, chemical shift at low and high pH, respectively; af and ab, chemical shift in the free and bound form, respectively; DQF- COSY, double quantum filtered COSY; DSS, sodium 2,2-dimethyl-2- silapentanesulfonate; DTE, dithioerythritol; HEPES, N(2-hydroxy- ethyl)piperazine-N’-2-ethanesulfonic acid; HPLC, high-pressure liquid chromatography; Kd, dissociation constant; NMR, nuclear magnetic resonance; NOE, nuclear Overhauser effect; NOESY, nuclear Over- hauser enhancement spectroscopy.
0 1990 American Chemical Society

7460 Biochemistry, Vol. 29, No. 32, 1990
bisubstrate analogue AP5A, the yeast and the Escherichia coli enzymes cocrystallize with AP5A (Egner et al., 1987; Muller & Schulz, 1988).
The NMR spectrum of the stoichiometric AP5A complex of porcine AK, in the presence of MgCI2 shows very char- acteristic chemical shifts of the bound diadenosine penta- phosphate (Rosch et al., 1989). The two nucleotides in the complex can be distinguished by the chemical shift of the adenine C8-H and C2-H and the ribose Cl’-H resonances, all of which are different for the two sites. Very characteristic of this complex is the downfield shift of one of the adenine C2-H resonances to about 8.9 ppm on complex formation. The site corresponding to this low-field C2-H adenosine resonance was called the “A-site”, and there is evidence for assuming this site to be the AMP site (Rosch et al., 1989). The C2-H resonance and, to a lesser extent, the resonance of the C4-H of the imidazole ring of His36 also experience a downfield shift not only on AP,A complexation but also on complexation of either of the two substrates. This shift is induced on addition of substoichiometric amounts of ATP.Mg2+, but only on ad- dition of comparatively high amounts of AMP in excess of the enzyme. It is thus generally assumed that it is the occupation of the ATP.Mg2+ site which causes the structural changes leading to the observed chemical shift change (McDonald et al., 1975; Smith & Mildvan, 1983; Rosch et al., 1989). It should be noted that His36 was recently proposed to stabilize the three-dimensional structure of the enzyme (Tian et al., 1988) or, more specifically, to function as a switch between the active and the nonactive conformation of the porcine protein (Dreusicke & Schulz, 1988).
One of the interesting features of the AKEc in connection with the experiments described here is the fact that the AKEC-ATP complex has an even lower dissociation constant Kd than the AKEc.ATP.Mg2+ complex (Reinstein et al., 1989). This rationalizes use of the AKECaATP complex instead of the hydrolytically unstable AKEc.ATP.Mg2+ complex in our present experiments. In addition, we could show by fluores- cence studies that ATP is a competitive inhibitor of ATP.Mg2+ binding to the enzyme (Reinstein et al., 1990).
The method of choice for the localization of substrate binding sites in solution is the observation of nuclear Over- hauser effects (NOE) between substrate and protein protons in NMR spectra. The NOE in ‘H NMR reveals spatial proximity of two protons by making use of their dipolar in- teraction. In general, if two protons in a macromolecule show an NOE, and spin diffusion is not contributing, it is fairly widely assumed that these protons have a distance of less than approximately 0.4 nm; the same upper distance is generally accepted for the appearance of cross peaks in two-dimensional nuclear Overhauser enhancement spectroscopy (NOESY; Jeener et al., 1979; Macura et al., 1981) experiments of proteins (Wuthrich, 1986). NOESY experiments thus are ideally suited for study of the interaction of substrates and enzymes with the aim of identifying substrate binding sites. This method is particularly useful if the assignment of reso- nances is known for those protein protons that are identified to be located close to the substrate by observation of inter- molecular NOESY cross peaks or one-dimensional NOE ef- fects. Former NMR studies indicated that the ATP.Mg2+ site (Fry et al., 1983, 1985; Smith & Mildvan, 1982) is close to His36.
In order to further clarify the location of the ATP-Mg2+ site and resolve the discrepancy between the differing NMR results and the X-ray results, we performed experiments with the E. coli adenylate kinase similar to those we did with the porcine
Vetter et al.
enzyme (Rosch et al., 1989). Suggestions for the sequence- specific assignment for several resonances in the aromatic side-chain region of the spectrum were reported earlier (Bock et al., 1988). The E. coli and the Paracoccus denitrifcans sequences are unique among the known adenylate kinase se- quences in so far as there are no His residues homologous to Hi@ in the porcine enzyme; instead, a Gln residue is found in the homologous position [Gln2* in E. coli AK (Haase et al., 1988); Gln29 in P. denitrifcans AK (Spurgin et al., 1989)l.
MATERIALS AND METHODS Preparation of Protein. Adenylate kinases were prepared,
and activity was measured essentially as described earlier (Barzu & Michelson, 1983; Tomasselli et al., 1983; Berghauser & Schirmer, 1978; Haase et al., 1988) from an overproducing E. coli strain (Brune et al., 1985; Reinstein et al., 1988). The proteins were stored as lyophilized powders at 253 K after the preparation. The nucleotide concentration of the preparations was checked by HPLC before use and found to be below the limits of detection. We checked the nucleotide and AP5A content in representative experiments after the NMR mea- surements and found it to be over 95% of the starting con- centration in all cases except for the experiments with ATP-Mg2+ complexes, where the nucleotide had a half-life of several hours only.
Preparation of Nucleotides. Nucleotides were obtained from Sigma at the highest purity commercially available. AP,A was prepared according to Feldhaus et al. (1975) with minor modifications.
Preparation of NMR Samples. For the NMR experiments residual H 2 0 was exchanged with D 2 0 by addition of D 2 0 (99.8%, from Sigma) to a preweighed amount of protein, followed by overnight storage at room temperature in order to exchange labile amide protons, lyophilization, and subse- quent solution in 99.96% D 2 0 (“100% DzO” from Sigma) to the desired concentration. Accurate protein concentration was determined before the NMR experiments according to Eh- resman et al. (1973). In some experiments, the residual amide protons of the enzyme were exchanged with D 2 0 by titration of the sample to about pH 1 with DCI and subsequent back- titration to the neutral pH range with NaOD. In the course of our experiments we found out that a better alternative to the pH 1 treatment for amide proton exchange is heating the protein sample to 318 K in the sample tube, a temperature where the protein is partially unfolded, and keeping it at this temperature for approximately 5 min before cooling it to room temperature again. This latter procedure results in complete renaturation for samples with a pH above about 7.5 as checked by NMR as well as the standard activity test (Berghauser & Schirmer, 1978). The heat exchange procedure was used for convenience in all the experiments with preexchange of N H protons presented here. The amide proton exchange according to either heat or pH treatment was virtually complete. Final buffer concentration was about 50 mM HEPES in all ex- periments. In titration experiments, nucleotides and AP5A were added to the enzyme solution from 100 and 40 mM stock solutions. All stock solutions were stored at 253 K.
1 D NMR Experiments. NMR experiments were performed on a commercial Bruker AM 500 spectrometer operating at a proton resonance frequency of 500 MHz. Standard pro- cedures were used throughout. The samples were in 5-mm tubes (from Norell); internal 2,2-dimethyl-2-silapentane- sulfonate (DSS) was used as a reference.
The samples were kept at the desired temperature (usually 303 K ) with a precooled stream of dry air temperature reg- ulated with a standard Bruker VT 1000 unit. The residual

NMR of E . coli Adenylate Kinase
Yi.0
Biochemistry, Vol. 29, No. 32, 1990 7461
I P i d I I
( I I I I I , < , ,
8.2 8.0 7.8 7.6 7.4 712 7.0 6.8 6.6 6.4 6.2 ppm
FIGURE 1: The aromatic ring proton resonance region of the NMR spectrum of the E . coli adenylate kinase. Conditions: [AK,c] = 2.8 mM; HEPES, 50 mM at pH 8.0.
HDO resonance was suppressed by permanent (except ac- quisition) selective irradiation, except for the one-dimensional nuclear Overhauser effect (NOE) experiments, where no water suppression procedure was used. For 1 D experiments, 90° pulses were used for spectral accumulation, and 80-256 scans were accumulated for every single spectrum on 16K memory. NOE experiments were performed under the same conditions as the other 1D experiments except for the introduction of a relaxation delay of 1.2 s and an irradiation time period of 1 s before data collection. This gave a total pulse spacing of approximately 3.8 s. The NOE data were collected as usual according to the scheme {[RD-IR(wi)-DS],-[RD-IR(wi)- AQ]32]n, where i = 1 or 2 [ i = 1, on-resonance irradiation (duration: 1 s); i = 2, off-resonance irradiation in a reso- nance-free region of the spectrum (duration: 1 s)], RD = 1.2 s, DS is dummy scans without data collection (usually four), IR is irradiation at the frequency wi, and AQ is data acqui- sition. About 1600 scans per experiment were accumulated overnight.
2D N M R Experiments. Two-dimensional (2D) experiments were performed according to well-established procedures (Wiithrich, 1986). All 2D spectra were obtained in the phase-sensitive mode with quadrature detection in both di- mensions according to the time proportional phase incre- mentation technique (TPPI; Marion & Wiithrich, 1986). The residual water resonance was suppressed by permanent irra- diation (except for the acquisition period) at the HDO fre- quency. Essential experimental parameters were as follows: for COSY and double quantum filtered COSY experiments (DQF-COSY; Piantini et al., 1982; Shaka & Freeman, 1983), 4K X 5 12 W frequency domain matrix, spectral width 5000 Hz in both dimension, relaxation delay 1.2 s, sine-bell filter in w1 as well as in w2 dimension, and zero-filling to 1K in wI dimension before Fourier transformation; for NOESY ex- periments, 4K X 5 12 W frequency domain matrix, spectral width 5000 Hz in either dimension, relaxation delay 1.2 s, ~/32-shifted sine-bell filter in w1 dimension and ~/64-shifted sine-bell filter in w2 dimension, and zero-filling to 1K in w2 dimension before Fourier transformation.
Data Evaluation Procedures. Binding constants and the calculated chemical shifts were determined from the titration experiments as described earlier (Rosch et al., 1989). pK, values were determined as usual by fitting the modified Henderson-Hasselbalch equation 6 = 6AH + (6A- - ?jAH)-
10pH-pK/( 1 + 1OpHTK) to the experimental chemical shift data with the same method. Here, 6 is the observed chemical shift, 6 A H is the chemical shift at low pH, and bA- is the chemical shift at high pH. In addition to the commercial Bruker NMR software, we used home-written software on a Convex 210 computer partially based on a package supplied by Drs. R.
7 5
PH 5 6 8
FIGURE 2: Dependence of the chemical shift value of the His imidazole resonances of the E. coli adenylate kinase on pH. The experimental data resulted in the following set of parameters for the HisA protons: 6H+ = 8.86 ppm, 6H- = 7.84 ppm (C2-H), 6"+ = 7.54 ppm, 6H- = 7.20 ppm (C4-H), and PKA = 7.6. Data for HisA could not be obtained between pH 6.5 and pH 8.0 (C2-H) and between pH 7.1 and pH 8.0 (C4-H) due to the severe line broadening experienced by the resonances of this imidazole ring in the pK region.
9 0 8 6 8 2 7 8 7 4 7 0 6 6 6 2 5 8 5 4
FIGURE 3: Temperature dependence of the aromatic ring proton resonance region of the AKEc spectrum. AK, was heated from 303 K (lower trace) to 318 K for 5 min (middle trace) and then cooled back to 303 K (upper trace). [AKEc] = 2.8 mM; HEPES buffer, 50 mM, pH 8.0.
Kaptein, Utrecht, and R. Scheek, Groningen. For visualization of molecular structures and molecular modeling, the QUANTA software system on a Silicon Graphics IRIS 4D/GT graphics workstation was used.
RESULTS p H Titration. The NMR spectrum of the aromatic residues
of the E. coli adenylate kinase is extremely well resolved for a protein of molecular weight 23 600 [Figure 1; the labeling of the resonances is according to Bock et al. (1988)l. Of the imidazole resonances only the ones belonging to the residue arbitrarily labeled HisA titrate with a pK, value in the phys- iologic pH range (pK, = 7.6; Figure 2). This situation is analogous to the titration behavior exhibited by the imidazole protons of the His36 residues of adenylate kinases from pig, human, and rabbit muscle [see, e.g., McDonald et al. (1 979 , Fry and Mildvan (1989, and Kalbitzer et al. (1982)l.
Heat Denaturation. The AKEc has a very favorable rena- turation behavior not only after pH denaturation (Bock et al., 1988) but also after mild temperature treatment as described under Materials and Methods (Figure 3). The tertiary structure of AKEc is partially unfolded at about 3 18 K at pH 8 and concentrations of about 3 mM in D20 with either sodium borate or HEPES buffer as evidenced by severe changes in the 'H NMR resonance positions on heating of the sample to
Vetter et al. 7462 Biochemistry, Vol. 29, No. 32, 1990
CB-Hffee C2-HfrB [AK] = 2.0 mM
Jk
2.4
9.0 8.5 8.0 7.5 7.0 6.5 6.0 5 5 ppm
FIGURE 4: Aromatic ring proton resonance region of the spectrum of AKEc and the AKEc.AP5A.Mg2+ complex at concentrations of AP5A as indicated. [AKEc] = 2.0 mM; [MgCI2] = 10 mM; HEPES buffer, 50 mM, pH 8.0.
this temperature. The protein refolds spontaneously and completely reestablishes its former phosphoryl-transfer activity after subsequent lowering of the temperature. We used this procedure for a virtually total exchange of amide backbone protons in most experiments described here.
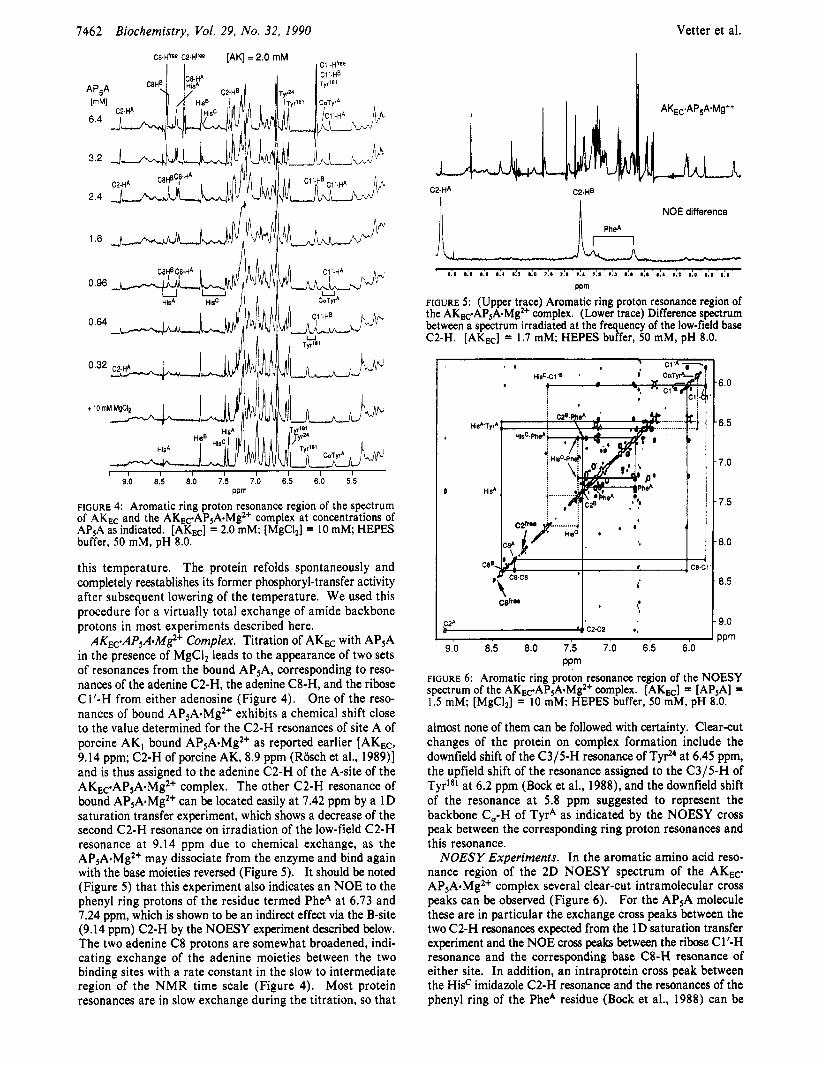
AKEc.AP5A.M$+ Complex. Titration of AKEc with APsA in the presence of MgC1, leads to the appearance of two sets of resonances from the bound AP5A, corresponding to reso- nances of the adenine C2-H, the adenine C8-H, and the ribose CI'-H from either adenosine (Figure 4). One of the reso- nances of bound AP5A.Mg2+ exhibits a chemical shift close to the value determined for the C2-H resonances of site A of porcine AK, bound AP5A.Mg2+ as reported earlier [AKEc, 9.14 ppm; C2-H of porcine AK, 8.9 ppm (Rosch et al., 1989)] and is thus assigned to the adenine C2-H of the A-site of the AKEc.AP5A.Mg2+ complex. The other C2-H resonance of bound AP5A.Mg2+ can be located easily at 7.42 ppm by a 1D saturation transfer experiment, which shows a decrease of the second C2-H resonance on irradiation of the low-field C2-H resonance at 9.14 ppm due to chemical exchange, as the AP5A.Mg2+ may dissociate from the enzyme and bind again with the base moieties reversed (Figure 5 ) . It should be noted (Figure 5 ) that this experiment also indicates an NOE to the phenyl ring protons of the residue termed PheA at 6.73 and 7.24 ppm, which is shown to be an indirect effect via the B-site (9.14 ppm) C2-H by the NOESY experiment described below. The two adenine C8 protons are somewhat broadened, indi- cating exchange of the adenine moieties between the two binding sites with a rate constant in the slow to intermediate region of the NMR time scale (Figure 4). Most protein resonances are in slow exchange during the titration, so that
CZ-HA
NOE difference I(, ,
n 0.0 1.0 0 . 1 0.1 1!1 0.0 7.1 7.0 7.8 7.1 7.0 1.0 1.1 1.b 1.1 d 0 d 0 r:O
PPm
FIGURE 5 : (Upper trace) Aromatic ring proton resonance region of the AKEc-AP5A.Mg2+ complex. (Lower trace) Difference spectrum between a spectrum irradiated at the frequency of the low-field base C2-H. [AKE,] = 1.7 mM; H E P B buffer, 50 mM, pH 8.0.
\ .- I I C@&f * CB-l
'I i
6.0
6.5
7.0
7.5
8.0
8.5
9.0 PPm
9.0 8.5 8.0 7.5 7.0 6.5 6.0 PPm
FIGURE 6: Aromatic ring proton resonance region of the NOESY spectrum of the AKEc.AP5A.Mg2+ complex. [AKEc] = [AP3A] = 1.5 mM; [MgCI2] = 10 mM; HEPES buffer, 50 mM, pH 8.0.
almost none of them can be followed with certainty. Clear-cut changes of the protein on complex formation include the downfield shift of the C3/5-H resonance of TyrN at 6.45 ppm, the upfield shift of the resonance assigned to the C3/5-H of Tyr1*I at 6.2 ppm (Bock et al., 1988), and the downfield shift of the resonance at 5.8 ppm suggested to represent the backbone C,-H of TyrA as indicated by the NOESY cross peak between the corresponding ring proton resonances and this resonance.
NOESY Experiments. In the aromatic amino acid reso- nance region of the 2D NOESY spectrum of the AKEc. APSA.Mg2+ complex several clear-cut intramolecular cross peaks can be observed (Figure 6). For the AP5A molecule these are in particular the exchange cross peaks between the two C2-H resonances expected from the 1D saturation transfer experiment and the NOE cross peaks between the ribose C1'-H resonance and the corresponding base C8-H resonance of either site. In addition, an intraprotein cross peak between the HisC imidazole C2-H resonance and the resonances of the phenyl ring of the PheA residue (Bock et al., 1988) can be

NMR of E . coli Adenylate Kinase
C&H [AK] = 2.7 mM C1 '-H
I C2-H
Biochemistry, Vol. 29, No. 32, 1990 7463
FIGURE 7: Aromatic ring proton resonance region of the spectrum of AKEC and the AKEeAMP complex at concentrations of AMP as indicated. [AKEc] = 2.7 mM; HEPES buffer, 50 mM, pH 8.0.
observed. From a comparison with the X-ray structure it can be inferred immediately that these resonances represent His134 and PheIg, respectively, since this is the only pair of this type of residues with a mutual distance of less than 0.5 nm in the crystal structure of the AKEc.AP5A.MgZ+ complex (Muller & Schulz, 1988) and thus is the only pair of this type which is expected to generate cross peaks in the NOESY spectrum. By the same argument, the residue originally labeled HisA is identified as His'72 and the residue originally labeled TyrA is identified as TyrI7', since HisA and TyrA show a cross peak in the NOESY spectrum and the pair H i ~ ' ~ ~ - T y r ~ ' ~ is the only one of this type with a side-chain to side-chain distance of less than 0.5 nm. Hise is then identified as HisIz6 by exclusion.
Two prominent substrateprotein intermolecular cross peaks appear in the aromatic spectral region: first, between the high-field adenine C2-H resonance (B-site) and the high-field resonance of the Phe19 aromatic ring protons; second, between the low-field resonance of the imidazole ring of His'34 (it cannot be decided from the present data whether this repre- sents C2-H or C4-H) and the ribose CI'-H resonance be- longing to the same site as the high-field (B-site) adenine C2-H resonance. From these cross peaks it follows clearly that this base moiety in the AKEc.AP5A-Mg2+ complex is located very close (X0.4 nm) to the side chains of residues 134 and 19.
AKK.AMP Complex. Complex formation of AMP and E. coli adenylate kinase in the absence of divalent metal ions is accompanied by severe changes of the NMR spectrum of the protein, exemplified by the aromatic spectral part in Figure 7. All resonances in the aromatic part, including the adenine C2-H, adenine C8-H, and ribose Cl'-H resonances of the nucleotide, are in fast exchange between the free and bound forms. From the concentration dependence of the chemical
Table I: Chemical Shift (ppm) of Nucleotide Base Proton Resonances'
compd C2-H C8-H APSA free AKl*AP5A.Mg2'
A B
A B
AKEc.AP5A*Mg2+
ATP free AKI*ATP*Mg2' AKE~sATP
AKIeAMP AKnpAMP
AMP free
8.12
8.90 8.26
9.14 7.42 8.26
7.80 8.22 8.65 8.82
ca. 8.4
8.44
8.40 8.31
8.26 8.39 8.55
8.42 8.59 8.58 8.41
ca. 8.5
' Values for the completely bound nucleotides are derived from ex- trapolations of the chemical shifts observed in the titration experi- ments. Values for the porcine AK, are adopted (and corrected) from Rosch et al. (1989).
shift of the adenine C2-H and C8-H it can be seen immedi- ately that the C2-H resonance in the fully bound state is shifted to the low-field side of the C8-H resonance, thus reversing the order of chemical shifts of the free nucleotide. Extrapolation of the chemical shift of the C2-H to the fully bound state yields approximately bb = 8.82 ppm (see Table I). Obviously, this suggests assignment of the low-field C2-H resonance of the AKEc.AP5A.MgZ+ complex to the AMP-site adenine C2-H. From the difference between the chemical shift values of the free and bound forms the value for the dissociation rate, /con, can be determined to be much greater than 300 s-I. The chemical shift of the low-field imidazole resonance of His134 shows a biphasic dependence on AMP concentration (Figure 8A): Titration of AMP up to stoichiometric amounts exerts no significant effect on the shift of this resonance, whereas it is shifted upfield at larger AMP concentrations. This could well be caused by sequential occupation of the two nucleotide sites by AMP, which was shown to occur in the E . coli enzyme earlier (Reinstein et al., 1989). Interestingly, no such biphasic shift change was observed for the C2-H resonance of His172 on AMP addition (Figure 8B). Of the other resonances un- dergoing obvious shifts in their positions, the resonance as- signed to the C,-H of T y P experiences an upfield shift on AKECvAMP formation whereas the signal of the high-field (probably C2/6-H) signal of Tyrz4 shifts downfield (Figure 7).
AKEc.ATP Complex. Titration of AKEc with ATP in the absence of Mgz+ ions resulted in strong distortions of the protein spectrum as well as the nucleotide spectrum, as ex- emplified by the spectral region between 5.9 and 8.8 ppm in Figure 9. The most remarkable feature of these spectra is the behavior of the adenine C2-H resonance of ATP, which is shifted to approximately 7.8 ppm at an ATP to protein ratio of about 0.28 (Figure 10). The chemical shift of the C2-H resonance cannot be determined at lower nucleotide concen- trations due to line-broadening effects and signal overlap, but it can be extrapolated from the chemical shift values measured above this nucleotide to protein ratio and the dissociation constant of the complex, Kd. Kd can be determined to be around 40 pM from the concentration dependence of the chemical shift of the adenine C8-H resonance and the as- sumption that ATP binds to its own site only (Reinstein et al., 1990). Thus, for the C8-H resonance we get bb = 8.42 ppm and bf = 8.55 ppm, and for the C2-H we get bb = 7.80 ppm and bf = 8.26 ppm (Table I and Figures 10 and 11A). This yields immediately the assignment of the high-field adenine C2-H resonance of the AKEc.AP5A.MgZ+ complex (B-site)

1464 Biochemistry, Vol. 29, No. 32, 1990
7.50
A Ib".""~.,
B - 8.23 -
- 8.22 -
-
Vetter et al.
0 0
0 2 4 6 8 10 12 14 16 AMP [mM]
0.24 I
8.21 4 0
0 0
0
0
0
0 2 4 6 8 10 12 14 16 AMP [mM]
FIGURE 8: (A) Dependence of the chemical shift of the low-field imidazole proton resonance of His'" on the AMP concentration. (B) Dependence of the chemical shift of the imidazole C2-H resonance of His172 on the AMP concentration. Data from the Figure 7 ex- periment. [AKEc] = 2.7 mM.
to the ATP-site adenine C2-H, thus corroborating the as- signment of the low-field C2-H resonance of this complex to the AMP site. The assignment of the two different sets of peaks of the AKEc.AP5A.Mg2+ complex seems to be further strengthened by the observation that the C1'-H resonance of the AKEC-AMP complex is downfield from the Cl'-H reso- nance of the AKEC-ATP complex (AKEC-AMP, 6 = 5.97 ppm; AKEc.ATP, 6 = 6.1 1 ppm), just as it is the case with the corresponding resonances of the AKEc.AP5A-Mg2+ complex (A-site, 6 = 5.87 ppm; B-site, 6 = 6.1 ppm). In contrast, the C8-H resonances exhibit a chemical shift order that opposes the suggested assignments. Albeit, the differences in chemical shifts between the C 1'-H and the C8-H proton resonances, respectively, are far less striking and thus much less convincing than the differences between the chemical shifts of the C2-H resonances.
Of the protein proton resonances, the upfield shift of the low-field resonance of the imidazole of His134 (labeled I in Figure 9) on formation of the ATP complex is most prominent (Figure 9). I t can be seen that it is approximately linear up to stoichiometric concentrations, and an increase of ATP above stoichiometric concentration has only a small effect on this resonance (Figure 11B). This is expected from the low dis- sociation constant of the complex if this shift is caused by a conformational change induced by ATP binding to the high- affinity site. The high-field imidazole resonance of the same residue (labeled I 1 in Figure 9) shifts to lower field with a similar titration pattern (Figures 9 and 10). The C3/5-H resonance of Tyr24 clearly shifts downfield on complexation, whereas the C3/5-H resonance of TyrIE1 shifts upfield. Also, the C2-H imidazole proton resonances of His172 shifts upfield
[AK] = 2.8 mM C8-H C2-H C1 '-H
1 1 1 1 1 1 1 1 1 1 1 1 I 1 8.6 8.4 8.2 8.0 7.8 7.6 7.4 7.2 7.0 6.8 6.6 6.; 6.2 6.0
PPm
FIGURE 9: Aromatic ring proton resonance region of the spectrum of AKEc and the AKEc~ATP complex at concentrations of ATP as indicated. [AKEc] = 2.8 mM; HEPES buffer, 50 mM, pH 8.0.
on ATP complexation (Figure 11C). An as yet unassigned C,-H resonance at 5.37 ppm can be used to monitor nucleotide binding as well (Figure 11D). Other changes of the protein spectrum cannot be followed easily due to the severe overlap of resonances even in this spectral region.
D~SCUSSION A simple observation that may be explained in structural
terms is the fact that the temperature denaturation of the E . coli adenylate kinase is reversible only if the protein solution is above approximately pH 7.5. This pH value coincides with the pK, value of His'72. In fact, from the crystallographic tertiary structure (Muller & Schulz, 1989) it can be seen that His172 is located at the C-terminus of the a-helix extending from residue 165 to residue 172, and deprotonation of this residue may thus influence the stability of the native structure and the refolding pathway.
The dissociation constants of the AKEc.AMP complex de- termined in the absence of Mgz+ (Reinstein et al., 1989) clearly demonstrate that AMP binds to E . coli adenylate kinase in a 2:l ratio, presumably to both nucleotide sites, as would be expected from earlier experiments (Rhoads & Lowenstein, 1969). The binding of AMP to the correct site, however, is preferred by a factor of 10 (Reinstein et al., 1989). Binding of AMP complexed with Mg2+ to the AMP site was not ob- served. The influence of the metal ion is also reflected in the fact that the two base moieties of the adenylate kinase bound AP5A.Mg2+ can be distinguished easily in the NMR spectrum, whereas this is not the case for the complex in the absence of the divalent ion (Vetter and Rosch, unpublished results), a point that strengthens earlier observations of asymmetry in- duced into the 31P NMR spectrum of the porcine AK,.AP,A

NMR of E . coli Adenylate Kinase
0 0 O n 0 0
Biochemistry, Vol. 29, No. 32, 1990 7465
~ I I I I I I I I I I I I I 8.8 8.6 8.4 8.2 8.0 7.8 7.6
PPm FIGURE I O : Excerpt from Figure 9.
complex on addition of Mg2+ (Nageswara Rao & Cohn, 1977). Thus, Mg2+ may be considered as a component necessary for the correct placement of the phosphate chain in the enzyme, in particular the orientation of the 8-7 phosphate bond (Ray et al., 1988).
From the present studies, it is clear that both adenine moieties of AP5A bind to the protein in the AKEc.AP5A.Mg2+ complex, a fact that has been treated with care in the past (Egner et al., 1987). Moreover, we conclude from the closeness of the extremely unusual chemical shifts of the C2 proton resonances of bound AP5A.Mg2+ with the shifts of the re- spective proton resonances of AMP and ATP that the two adenine moieties of the bound AP5A.Mg2+ bind to the two nucleotide sites of the enzyme (see Table I). Accordingly, the low-field C2-H resonance represents the AMP-site adenine, whereas the high-field C2-H resonance represents the corre- sponding ATP-Mg2+-site proton of the bound AP5A-Mg2+ complex. From the above two-dimensional NOESY results it thus follows clearly that the location of the ATP.Mg2+ site in E. coli adenylate kinase in solution is close to the side chain of His'34 and Phelg. It is thus compatible with the location of one of the nucleotide sites observed in the AKEc.AP5A.Mg2+ and AKy.AP5A.MgZ+ crystals, respectively (Egner et al., 1987; Muller & Schulz, 1988).
Our earlier data on the nucleotide and AP5A complexes of porcine adenylate kinase were of appreciably lower quality than the ones we presented here with the E . coli enzyme. Those experiments did not result in such clear-cut assignments of the resonances of enzyme-bound AP5A.Mg2+ to the AMP- and ATP-site adenosine protons, since we were not able to de- termine the chemical shift of the C2-H of ATP.Mg2+ in the fully or even partially bound state. These earlier experiments thus still left open the possibility that the downfield-shifted
..
A 8.52
8.50
8.48
8.46
8.44
8.42
7.40 a a
0 0 7.34 I I I I I I I I I I I I l o l I p
0 2 4 6 8 10 12 14 16 18 ATP [mM]
8.20 , c 8.19 4
8.16
8.15
0 8.14 -1 8.13 4 0
ATP [mM]
6.0 I
D
E, 5.7
5.6
n 0 0
0 2 4 6 8 10 12 14 16 18 nucleotide [mM]
FIGURE 1 1 : (A) Dependence of base C8-H resonance of ATP on ATP concentration. (B) Dependence of low-field imidazole proton resonance of His'" on ATP concentration. (C) Dependence of C2-H imidazole resonance of His"* on ATP concentration. (D) Dependence of an unassigned C,-H resonance on ATP (+) and AMP (0) concentration. Data from the Figure 9 experiment. [AKEc] = 2.8 mM in each case except for the upper curve in panel D, where [AKEc] = 2.7 mM.

7466
base C2-H resonance originating from the Akl.AP5A.MgZ+ complex corresponds to the ATP-Mg2+-site adenine resonance. This was considered to be a remote possibility only, since this C2-H resonance of the AK1.AP5A.Mg2+ complex and the corresponding proton of the AK,.AMP complex displayed chemical shift values which were extraordinarily low field and very similar to each other (see Table I). Anyhow, comparison of our present experiments with the experiments on the APSA.Mg2+ complex of porcine adenylate kinase strengthens our earlier case, namely, that the ATP.Mg2+ site of the AP5A.Mg2+ complex is not close to His36.
Since we were not able to observe any intermolecular NOE in the single-substrate complexes (AKsAMP, AK-ATP, or AK.ATP.Mg2+) in the aromatic spectral region either with the porcine or with the E. coli adenylate kinase, we conclude that the combination of correlation time and distance effects allows observation only in the active complex of enzyme and nucleotide as mimicked by the AKEc.AP5A.Mg2+ complex. In earlier papers [reviewed in Mildvan (1989)], this statement was corroborated for the AMP complexes. The transferred NOE that was claimed to be observed to the C2-H resonance of ATP.Mg2+ in the presence of rabbit and porcine adenylate kinase on irradiation of a resonance assigned to the imidazole C2-H resonance of His36 was always reported in experiments using a 5-IO-fold excess of nucleotide [reviewed in Mildvan ( 1989)].
The determination of the ATP.Mg2+ site in AKEc has an- other very important consequence: Comparison of the "G- loop" region of AKEc.AP5A.Mg2+ (Muller & Schulz, 1988) or AK,.AP5A.Mg2+ (Egner et al., 1987) with the ATP-Mg2+ site as suggested by us shows extreme structural homology to the corresportding loop region of the oncogene product p21. GTP.Mg2+ complex as determined recently (Pai et al., 1989), Le., the peptide chain structure of the first approximately 23 amino acid residues of either protein, and the relative location of the nucleotide triphosphate is virtually identical. This could mean that the structural motif involved in the abstraction of the terminal phosphoryl group from the nucleoside tri- phosphate is identical in both proteins, thus giving rise to a very similar phosphoryl-transfer mechanism. This is in accord with the observation that this sequence motif appears in many nucleotide triphosphate hydrolyzing proteins [e.g., Moller and Amons (1983)].
Although the ATP.Mg*+ site is now clearly defined in the E. coli and in the yeast adenylate kinase (Muller & Schulz, 1989), the location of the AMP site in these complexes remains a mystery. From the near identity of the chemical shift of the AMP-site adenine C2-H resonance in the AKI-AP5A-Mg2+, the AKEc.AP5A.Mg2+, and the AKy.AP5A.Mg2+ (Vetter et al, unpublished experiments) complexes, it follows that the microsurroundings of these protons must be extremely similar. A point to consider is also the fact that the AMP site is not clearly defined in the AKy.AP5A.Mg2+ crystal (Egner et al., 1988).
The structural changes induced in the enzyme by binding of the substrates have to be judged from a qualiative point of view only, since no information on the teritary structure of the protein in solution is available and the number of sequence- specific resonance assignments is still very limited. On one hand, observation of the chemical shift change of the unas- signed C,-H resonance at 5.37 ppm on titration of the enzyme with AMP and ATP could well suggest the induction of similar structural changes around this residue on occupation of the AMP and ATP site. This view is supported by the fact that the chemical shift change of this resonance continues in the
Biochemistry, Vol. 29, No. 32, 1990 Vetter et al.
same direction for the AMP titration above stoichiometric amounts, i.e., when AMP is supposed to occupy the ATP site, whereas the chemical shift change stops at stoichiometric amounts of substrate and enzyme for the ATP titration (Figure 11D). On the other hand, there are other explanations for this phenomenon, and as the chemical shift change observed for the His"2 imidazole proton resonance exemplifies (Figures 8B and 1 IC), it is not an observation pertaining to all the ob- servable resonances in the spectrum.
It is evident from a comparison of spectra of the E. coli enzyme in the presence and in the absence of any of the substrates or AP5A.Mg2+ that the complexes yield an improved spectral resolution as compared to the free enzyme. The same observation was done before with the porcine adenylate kinase. A possible explanation for this effect would be the postulation of multiple structures in the absence of substrates and the formation of a single energetically favorable structure in the presence of substrates. This explanation would well fit into the general picture suggested by the postulated induced-fit mechanism for kinases (Jencks, 1975).
During the review procedure for the current paper, we discovered a serious error in our previous publication on the nucleotide complexes of porcine AK, (Rosch et al., 1989). In this previous publication, we reported detection of a cross peak between the low-field C2-H resonance of bound AP5A-Mg2+ and a peak in the imidazole C2-H resonance region of the spectrum. In an attempt to accommodate earlier data [see Mildvan (1989)] at least partially, we assigned this latter peak to the C2-H of the imidazole ring of His36. In the light of more recent experiments with porcine and yeast adenylate kinase performed under optimized experimental conditions (Vetter et al., unpublished results), this assignment is no longer tenable. Instead, the cross peak originates from the exchange of the two adenosine moieties of bound AP5A-Mg2+, and thus, the unknown peak represents the B-site adenosine C2-H rather than the His36 imidazole C2-H. These expkrimental data will be presented shortly. Consequently, these results in combi- nation with the ones presented in the current paper do not support many of the earlier experiments reviewed in Mildvan (1989). In contrast, the current state of our knowledge lends much more support to data from Tian et al. (1988), Muller and Schulz (1988), Egner et al. (1987), and Dreusicke and Schulz (1988).
ACKNOWLEDGMENTS The overproducing E . coli strain was a gift from Dr. A.
Wittinghofer. We thank Dr. Roger S. Goody and Marija Isakov for supplying the AP5A, Birgit Brandmeier for skilled technical assistance, Prof. Georg Schulz, University of Frei- burg, for supplying us with the crystallographic coordinates of the AKEc.AP5A.Mg2+ complex, Prof. Ming-Daw Tsai, The Ohio State University, for helpful discussions and free ex- change of unpublished data, in particular on the role of His36, and Prof. Kenneth C. Holmes for constant support and en- couragement.
Registry No. AK, 9013-02-9; AMP, 61-19-8; ATP.Mg2+, 1476- 84-2; AP5A.Mg2+, 126860-90-0; L-His, 71-00-1; L-Phe, 63-91-2.
REFERENCES Barzu, O., & Michelson, S . (1983) FEBS Lett. 153, 280-284. Berghauser, J., & Schirmer, R. H. (1 978) Biochim. Biophys.
Bock, I., Reinstein, J., Wittinghofer, A., & Rosch, P. (1988)
Brune, M., Schumann, R., & Wittinghofer, A. (1985) Nucleic
Acta 537, 454-463.
J . Mol. Biol. 200, 745-748.
Acids Res. 13, 7 139-7 15 1.

NMR of E. coli Adenylate Kinase Biochemistry, Vol. 29, No. 32, 1990 7467
Moller, W., & Amons, R. (1985) FEBS Lett. 186 ( l ) , 1-7. Muller, C. W., & Schulz, G. E. (1988) J . Mol. Biol. 202,
Nageswara Rao, B. D., & Cohn, M. (1977) Proc. Natl. Acad.
Noda, L. (1973) Enzymes (3rd Ed.) 8 , 279-305. Pai, E. F., Sachsenheimer, W., Schirmer, R. H., & Schulz,
G. E. (1977) J. Mol. Biol. 114, 37-45. Pai, E. F., Kabsch, W., John, J., Wittinghofer, A., & Holmes,
K. C. (1989) Nature 341, 209-214. Piantini, U., Sorensen, 0. W., & Ernst, R. R. (1 982) J . Am.
Chem. SOC. 104, 6800-6801. Ray, B. D., Rosch, P., & Nageswara Rao, B. D. (1988)
Biochemistry 27, 8669-8676. Reinstein, J., Vetter, I. R., Schlichting, I., Rosch, P., Wit-
tinghofer, A., & Goody, R. s. (1990) Biochemistry (first paper of three in this issue).
Rhoads, D. G., & Lowenstein, J . M. (1968) J . Biol. Chem.
Rosch, P., & Gross, K. H. (1985) J. Mol. Biol. 182, 341-345. Rosch, P., Klaus, W., Auer, M., & Goody, R. S. (1989)
Shaka, A. J., & Freeman, R. (1983) J . Magn. Reson. 51,
Smith, G. M., & Mildvqn, A. S. (1982) Biochemistry 21,
Spurgin, P., Tomasselli, A. G., & Schiltz, E. (1 989) Eur. J .
Tian, G., Sanders, C. R., Kishi, F., Nakezawa, A., & Tsai,
Tomasselli, A. G., & Noda, L. H. (1980) Eur. J . Biochem.
Wuthrich, K. (1 986) N M R of Proteins and Nucleic Acids,
909-9 12.
Sci. U.S.A. 74, 5355-5357.
243, 3963-3972.
Biochemistry 28, 43 18-4325.
169-1 73.
61 19-6123.
Biochem. 179, 621-628.
M.-D. (1988) Biochemistry 27, 5544-5552.
103, 481-491.
Wiley, New York.
Dreusicke, D., & Schulz, G. E. (1988) J . Mol. Biol. 203,
Dreusicke, D., Karplus, A. P., & Schulz, G. E. (1988) J . Mol.
Egner, U., Tomasselli, A. G., & Schulz, G. E. (1987) J. Mol.
Ehresman, B., Imbault, P., & Weil, J. H. (1973) Anal. Bio- chem. 54, 454-463.
Feldhaus, P., Frohlich, T., Goody, R. S . , Isakov, M., & Schirmer, R. H. (1975) Eur. J . Biochem. 57, 197-204.
Fry, D. C., Kuby, S . A,, & Mildvan, A. S. (1985) Biochem- istry 24, 4680-4694.
Fry, D. C., Kuby, S . A,, & Mildvan, A. S. (1987) Biochem- istry 26, 1645-1 6 5 5 .
Fry, D. C., Byler, D. M., Susi, H., Brown, E. M., Kuby, S . A., & Mildvan, A. S. (1988) Biochemistry 27, 3588-3598.
Haase, G. H. W., Brune, M., Reinstein, J., Pai, E. F., Pingoud, A., & Wittinghofer, A. (1989) J . Mol. Biol. 207, 151-162.
Hamada, M., Palmierei, R., Russell, G. A., & Kuby, S . A. (1979) Arch. Biochem. Biophys. 195 ( l ) , 155-177.
Jeener, J., Meier, B. H., Bachmann, P., 4 Ernst, R. R. (1979) J . Chem. Phys. 71, 4546-4553.
Jencks, W. P. (1975) Adv. Enzynlol. Relat. Areas Mol. Biol.
Kalbitzer, H. R., Marquetant, R., Rosch, P., & Schirmer, R.
Lienhard, G. E., Secemski, I . I . (1973) J . Biol. Chem. 248,
Macura, S . , Huang, Y., Suter, D., & Ernst, R. R. (1981) J .
Marion, D., & Wuthrich, K. (1983) Biochem. Biophys. Res.
McDonald, G. G., Cohn, M., & Noda, L. (1975) J . Biol.
Mildvan, A. S . (1989) FASEB J . 3 (6), 1705-1714.
102 1-1028.
Biol. 199, 359-37 1.
Biol. 195, 649-658.
43, 219-410.
H. (1982) Eur. J . Biochem. 126, 531-536.
1121-1123.
Magn. Reson. 43, 259-281.
Commun. I 1 3, 967-974.
Chem. 250, 6947-6954.