chendakeo.files.wordpress.com · 16/12/2002 · table of content . acknowledgement p.3 . preface...
TRANSCRIPT

BATI PRIMARY HEALTH CARE PROJECT
Quick Assessment of a Child-to-child
School Health Education Component
By: Keo Chenda Reviewed by: Ponta Laurent
December 2002

TABLE OF CONTENT
ACKNOWLEDGEMENT P.3 PREFACE P.4 ABSTRACT OF THE REPORT P.5 I. INTRODUCTION: P.8 II. OVERALL DESCRIPTION OF THE BATI HEALTH PROGRAM: P.8 III. RESEARCH MANAGEMENT: P.9 3.1 Type of research: P.9 3.2 About questionnaire: P.9 3.3 Objectives of the assessment: P.9 3.4 Sample size and sample sampling : P.10 3.5 Interviewers and their participation in C-t-C program: P.10 3.6 Training and conduction schedule: P.11 3.7 Shortcomings: P.11 IV. DATA MANAGEMENT: P.11 4.1 Cross-checking: P.11 4.2 Database management: P.12 4.3 Data verification: P.12 4.4 Data analysis: P.12 V. STATISTIC COACH: P.12 Example 1: Frequency analysis P.12 Example 2: Cross tabulation analysis P.13 Example 3: Descriptive analysis P.13 Example 4: Multiple response analysis P.14 VI. FINDING AND ANALYSIS: P.15 Section I: General information P.15 Section II: Knowledge of diarrhea and practice P.19 Section III: Oral and dental health care P.24 Section IV: Dengue fever P.26 Section V: Fever P.29 Section VI: Safe water P.31 Section VII: Body hygiene P.33 Section VIII: Knowledge on Child Rights P.36 Section IX: EPI P.38 Section X: Nutrition P.40 Section XI: Basic health understanding and practice P.43 VII. DEDUCTIONS AND RECOMMENDATIONS: P.44 VIII. APPENDIX: P.47 Questionnaire:
Enfants&Développement December 2002
2

ACKNOWLEDGEMENT
We would like to thank all the interviewees and interviewers for their devotion and participation to this survey.
We also would like to dedicate this success to all the community people and especially the grade 4-5 students in the target primary schools for their active involvement in running child-to-child school health activities.
We acknowledge, as well, the fact that the entire survey would never have been made possible without t assistance from these aforementioned people.
Last but not least, on behalf of the Samroang community, we would like to give our whole-heartedly thanks to Madame Danièle Cheysson for her tirelessly and continuously endeavors in her voluntary work for the poor and destitute people particularly children in Cambodia as well as in other countries where E&D is operating.
Enfants&Développement December 2002
3

PREFACE
Intended to evaluate and to envisage potential future development of Child-to-Child health related activities, the Bati Primary Health Care Project, hereinafter BPHCP conducted a quick but comprehensive household survey on Sept 21, 2002 among 112 mothers (interviewees), in 19 villages in Samroang district of Takeo province, whose children are currently in grade 4-5 in targeted schools. 13 interviewers, all of them school masters and school health educators have carried out the survey. The questionnaire includes 11 sections, which comprise 78 questions that aimed at looking into general issues pertinent to health, and eventually children right insight. Data collected were analyzed through a statistic software package, SPSS version 11.0, which allows the results presented in this report to be considered almost 100% free from miscalculation. Readers of this report are recommended to have a look at Chapter V on “Statistic Coach” so as to be able to interpret the results. Nevertheless, we would like to make clear that all the data available in this report came only from the 112 aforementioned mothers in the 19 target villages of Samroang district, Takeo province. Therefore, it does not necessary represent the whole community. Furthermore, it does also not necessary represent the 19 target villages as a whole. The outcomes presented herein intend to examine targeted households health knowledge, attitude and practice regarding general health issues and eventually appreciate the influence of a child-to-child school health education toward children in grade 4 and 5 initiated in February 1999.
Keo Chenda, Date: Dec 09, 2002
Enfants&Développement December 2002
4

ABSTRACT OF THE REPORT
Introduction Intended to evaluate and make future plan to Child-to-Child activities, the BPHCP conducted a quick but comprehensive household survey on Sept 21, 2002 toward 112 mothers, whose children are currently in grade 4-5 in targeted schools, in 19 villages in Samroang district of Takeo province. Already-designed questionnaires were provided to 13 teachers_ who were trained to be interviewers_ for surveying the 112 mothers in order to appreciate their knowledge and practice regarding general health and child right issues. Data obtained were then entered into a statistic software package, SPSS version 11.0 for analysis. Background of BPHCP and Child-to-Child approach Child-to-Child (CTC) is a method applied since 1999 by Enfants&Developpement in 2 districts of Takeo province and extended in 2002 to one district in Kampong Speu province. A project officer is assigned to manage this component toward voluntary young children and schoolteachers. The aim of the program is to improve children’s health knowledge, and thereby their lifestyle habits. The program uses children to disseminate health messages to other children, thus the name child-to-child method. It was expected that children would then spread their knowledge to their peer and families at the village level. The health messages are primarily delivered to core teachers, who then relay us in delivering those messages to their respective pupils in grade 4-5. In each grade, a children’s club is formed by a small group of students. These students then discuss the health topic with the school health educator. Eventually these messages are successively spread from those students toward other children at both schools and village. Objectives of the assessment This household survey looks mainly into impacts and effectiveness of CTC approach being employed by BPHCP to send health messages through children who are in grade 4-5 of 4-target schools_ Phnom Chiso, Om Sophath, Prasat NeangKhmao, and Slarom_ to their peer and their families in the villages. The main objectives of this quick assessment are as follow:
Assess the improvement of knowledge on health and sanitation issues in the target communities,
Appreciate the level of health attitude and practices in the families, as well as in the whole community after several years of operation,
Measure the effort of partners especially children and teachers on disseminating health messages amongst communities,
Weight the pros and cons and effectiveness of running such activities, Conclusion and Recommendation
a. Illiteracy rate among women remains high though many years of development effort made by either government or NGO community. It is recommended that government and NGO community should put more emphasis on informal education such as literacy class so that women as well as men will benefit from this.
b. Poverty still prevails among the rural community even with the fact that government as well
as NGO community has been placing more focus on poverty eradication. Given to this survey, we would recommend that more effort should be made to ensure that people could emerge from poverty line.
Enfants&Développement December 2002
5

c. Most people still rely mainly on subsistence cultivation for supporting their family. They base their survival strategies on agriculture even with the fact that it is not applicable during dry season due to poor irrigation system. Regarding to this, one need to drastically improve irrigation systems and embark on activities leading to the improvement of agricultural production.
d. Girls usually greatly contribute to improve the family living standard. We found out the
more daughters the family has the better the family living standard is. Girls can more easily find job, e.g. factories, to ensure additional income than boys.
e. People generally seem to have a good understanding over diarrhea issues. They know how
to keep or preserve food properly. Anyhow, some families still remain with a sub-standard understanding about this issue. Those families might be facing serious and constant problem regarding diarrhea or food contamination related diseases. A little bit more effort is needed to ensure that as many people as possible understand more about this preventable illness.
f. Boreholes and ponds remain the main sources of drinking water for the community although
water might not be available during dry season. Moreover, failure to boil pond water prior to drink it will post a great vulnerability to diarrhea and other waterborne diseases since the pond is usually used for many purposes such as cleaning cows/ox, irrigating garden, bathing and washing up clothes. Given to this analysis, we recommended that health workers should stress more on the proper and restricted usage of pond water. Also to ensure that common pond will be able to supply water during dry season, some ponds need to be renovated or deepened.
g. In total, there are only 58% of interviewees who report to regularly drink boiled water
whilst another 42% just erratically consume boiled water. This statistic is worrying. People seem to have fragmented understanding on safe water usage leading to bad practice. Education should better stress on the importance of clean water and make people aware of the consequences of unsafe water use .
h. When interviewers checked the water jars at interviewees’ houses, they found that 51.8% of
water jars have no lids or ABATE, larvicide which is normally supplied1 two/three times a year by the Ministry of Health and the Cambodian Red Cross. This also should be an area of concern for health workers because the absence of lids or ABATE could be a conductive condition for dengue mosquitoes to breed and outbreak to occur. Health workers should make sure that lids' usage is promoted and ABATE adequately and freely supplied to community. More awareness raising on dengue fever is needed to prevent children from such a potential lethal disease.
i. Children, health center staff, teachers, and village health volunteer seem to play an active
and effective role in disseminating health messages toward community. However, children and health center staff are the most active agents in spreading health messages to target beneficiaries such as children, classmate, families, and community people as a whole. Child-to-Child approach should be preceded in other catchment areas since it is effective and efficiency.
j. We can confidently assume that most of the interviewees are quite aware of dental hygiene
because 91.1% of cases have heard about it; 94.6% are regularly brushing their teeth with toothpaste; and last but not least 89.3% of cases are brushing teeth correctly. The minimal number of person who do not yet clearly understand or practice oral care should be targeted on during the next education session organized at village level.
1 ABATE is an expensive chemical for a rural Cambodian family
Enfants&Développement December 2002
6

k. According to the above tables, most of the people interviewed comprehend fever issue. 91.1% acknowledge fever as dangerous for children; 70.5% realize that fever could lead to death and 74.1% grasp that they must take children to health center when they got fever.
l. General hygiene should not be a matter of concern according to the findings. Most of the
interviewees know how to keep themselves healthy and actually, it has been noticed during the interview that they are clean in terms of body hygiene, clothes and household environment. They usually bath with soap, and more than that, they usually wash their belongings2 once a week. In addition, the sanitation status in the target villages is far better than in the past. This shows a great success of our health program including Child-to-Child approach.
m. We noticed that some people still lack understanding regarding Child Right issues. For
instance, only 67% mentioned correctly that children are those under the age of 18; 16.1% said that children do not have rights like adults; only 44.6% have accurately replied that there are 4 baskets of child rights, namely right to survival, to development, to participation, and to protection. Peer education on child right issues should be widely introduced into the target villages to raise people and children’s awareness of child rights.
n. 76.8% mentioned correctly the 6 preventable diseases, namely TB, Polio, Tetanus, Measles,
Diphtheria, and Whooping cough; 95.5% said that children should have completed their vaccination before 2 years of age3; 86.6% replied there would be problems if children were not properly vaccinated against these diseases. This illustrates that most of the interviewees are quite aware of EPI issues, although understanding can be better improved. For instance, some said children can be vaccinated at any time possible; others mentioned there would be no problems even if children were not properly vaccinated; surprisingly, 4.5% reported to have never been told about EPI. This is a small but sensitive gap in which we need to make sure that these people will change their attitude toward EPI issues.
o. Surprisingly, through the survey results, we found out that most of the interviewees are
aware of the nutrition issues. 72.3% of interviewees have correctly mentioned the 3 groups of food, which are protection, building, and energy foods; 86.6% are also aware that fruits and vegetable are related to protection; Most of them give vegetable and meat/fish to their children almost everyday. Children and health center staff have greatly contributed to the understanding of people about this issue. It is necessary that we put more focus on strengthening their capacity so that they would be able to do more to help people comprehend nutrition issues.
p. Fever and dengue fever are the most common diseases quoted in target villages whilst
HIV/AIDS ranges third followed by diarrhea. Though 95.5% of the cases prefer health center services, 4.5% other said that they do not like visiting health center because it is more expensive, far away from the community, and the services and quality are not good enough. However, well-off families prefer to visit private clinics or medical practitioners exercising in the villages. The result of cross-tabulation tells us that among the 5 families who do not prefer going to health center, there is one impoverished family, 3 poor families and one family who is above average. This means health center services are not yet fully accessible for the poor and vulnerable people. Given to this situation, government and NGO community need to improve health center services and quality. Further, they need to make sure poor people can offer proper and affordable health services.
2 Like pillow, mat, blanket... 3 The national policy however preconises that children should be fully immunised by the age of 9 month, after receiving the measles vaccination
Enfants&Développement December 2002
7

I. INTRODUCTION: Child-to-Child (CTC) is a method applied since 1999 by Enfants&Developpement in 2 districts of Takeo province and extended in 2002 to one district in Kampong Speu province. A project officer is in charge to manage this component toward voluntary young children and schoolteachers. As this program concentrates on health, so are all the messages firstly taught to teachers and then finally disseminated to children and their peers in the villages. The household survey (HHS) conducted on Sept 21, 2002 with the assistance of 13 interviewers who are schoolteachers and at the same time, our core people that assist us in decoding the primary health care (PHC) messages to their students in grate 4-5. The overall objective of the assessment is to understand as well to evaluate the impacts and effectiveness of the CTC approach so that long-term strategy can be considered. II. OVERALL DESCRIPTION OF THE BATI HEALTH PROGRAM:
The BPHCP is situated in Bati Operational Health District (OD) in the province of Takeo. The town of Bati is situated 30 km. southeast of Phnom Penh on Highway No. 2, which goes from Phnom Penh to Takeo (and eventually Vietnam). The OD of Bati covers most of the Bati Administrative District and some of Samrong Administrative District. This difference occurs because OD’s are based on population numbers and not the traditional administrative system in Cambodia. The population of Bati administrative district, according to the 1998 census, is 118,360 people, of which 56,011 (47%) are male and 62,349 (53%) female. 16,602 (14%) are under 6 years of age. Bati is a poor rural community, with most people relying on cultivating rice as their main form of living. The area is high enough to not be too much affected by flooding but the southern part of the district is susceptible to a lack of rainfall, which hampers rice production. The BPHCP grew out of work that had previously been established in Bati OD by Enfants &Développement, at Samrong, Roveang and Khvav HC’s. This work had established E&D as an
Enfants&Développement December 2002
8

organization with an interest in developing the OD of Bati, in conjunction with the Takeo Provincial Health Department (PHD).
The BPHCP is a 5-year project which aims to improve the health and sanitary conditions amongst the population of Bati OD through the:
1. Training of HC staffs in their appropriate responsibilities in Roveang, Khvav, Daung and
Krang Leav health centers . 2. Training of OD & RH management team in the organization, management and supervision
of the health care system. 3. Clinical skills training of RH staff. 4. Improvement in mother and child health cares within local communities through improved
access to health care services, immunizations and the training of Traditional Birth Attendants (TBA’s).
5. Improvement of the populations’ knowledge of health issues and the promotion of good practice through the training of Village Health Volunteers (VHV’s) and the school health education program.
6. Improvement of the populations’ sanitary conditions with the construction of wells and latrines.
7. Assessment and assistance to the poorest community members, where appropriate. 8. Construction/refurbishment of OD/RH buildings.
III. RESEARCH MANAGEMENT: 3.1 Type of research: Aiming at generating quantitative data rather than qualitative one, we have conducted extensive household survey in 19 target villages in Somroam District of Takeo province in which Bati team has been implementing a primary health care project since 1999. 3.2 About questionnaire: The 19-pages questionnaire comprises 11 sections with include 78 questions. To ensure quality information collection, we have used all types of questions, ranging from open single to multiple answers, as well as yes/no answer. Please, find below the questionnaire summary: (see the complete questionnaire in annex for more comprehension.) Section I: General information 9 quests Section II: Knowledge of diarrhea and practice 12 quests Section III: Oral and dental health care 8 quests Section IV: Dengue fewer 9 quests Section V: Fewer 5 quests Section VI: Safe water 4 quests Section VII: Body hygiene 8 quests Section VIII: Knowledge on Child rights 6 quests Section IX: EPI 6 quests Section X: Nutrition 7 quests Section XI: Basic health understanding and practice 4 quests Total: 11 sections 78 quests 3.3 Objectives of the assessment: This household survey intends to evaluate the impacts and effectiveness of a Child-to-Child approach being employed by E&D to disseminate health messages through children who are in grade 4-5 of the 4-target schools_ Phnom Chiso, Om Sophath, Prasat NeangKhmao, and Slarom_ toward other children and their families.
Enfants&Développement December 2002
9

The main objectives of this quick assessment are as follow: Assess the improvement of knowledge on health and sanitation in the target communities, Appreciate the level of health attitude and practices in the families as well as in the whole
community after several years of operation, Measure the effort of partners especially children and teachers on disseminating health
messages amongst communities, Weight the pros and cons and effectiveness of running such activities,
3.4 Sample size and sample sampling: With limited budget and time constraint, we have made up our mind to select only 112 mothers whose children are in grade 4 and 5 in the target schools4. All the interviewees reside in 19 catchment villages of Samroang district. To eliminate bias of improper selection, we have randomly selected and interviewed the aforementioned 112 mothers in the 19 villages according the pro rata basis. The latter means the number of participant in each respective village has been selected according to the specific percentage of the entire village population_ the families that have children in grade 4 to 5. It has to be noticed that some villages have no children in grade 4-5 in target schools. The table below summarizes the distribution per village: Number of interviewees by villages
Village Frequency Percent Cumulative Percent
Trapang Srong 9 8.0 8.0 Por 5 4.5 12.5 Trapang Ampil 5 4.5 17.0 Beung Kantrong 5 4.5 21.4 Chalot Day 6 5.4 26.8 Kandal 2 1.8 28.6 Dorpor 7 6.3 34.8 Trapang Veng 8 7.1 42.0 Deum Thlork 5 4.5 46.4 Krapang Thnong 3 2.7 49.1 Char 8 7.1 56.3 Phoum Thmey 11 9.8 66.1 Trapang Leav 4 3.6 69.6 Teuk Ambeul 9 8.0 77.7 Trapang Trea 12 10.7 88.4 Tranpang Chouk 4 3.6 92.0 Kok Tarea 5 4.5 96.4 Tranpang Knar 2 1.8 98.2 Roveang 2 1.8 100.0 Total 112 100.0 3.5 Interviewers and their participation in CTC program: 13 schoolteachers from Phnom Chiso, Om Sophath, Prasat NeangKhmao, and Slarom primary schools have been assigned and trained to be interviewers. The primary school teachers we work with are first provided with a training of trainer on health education and child-to-child method. The teachers are requested to introduce the health education session into the grade 4 and 5 curriculum.
4 Child-to-child school health education was conducted toward 1300 children in august 2002
Enfants&Développement December 2002
10
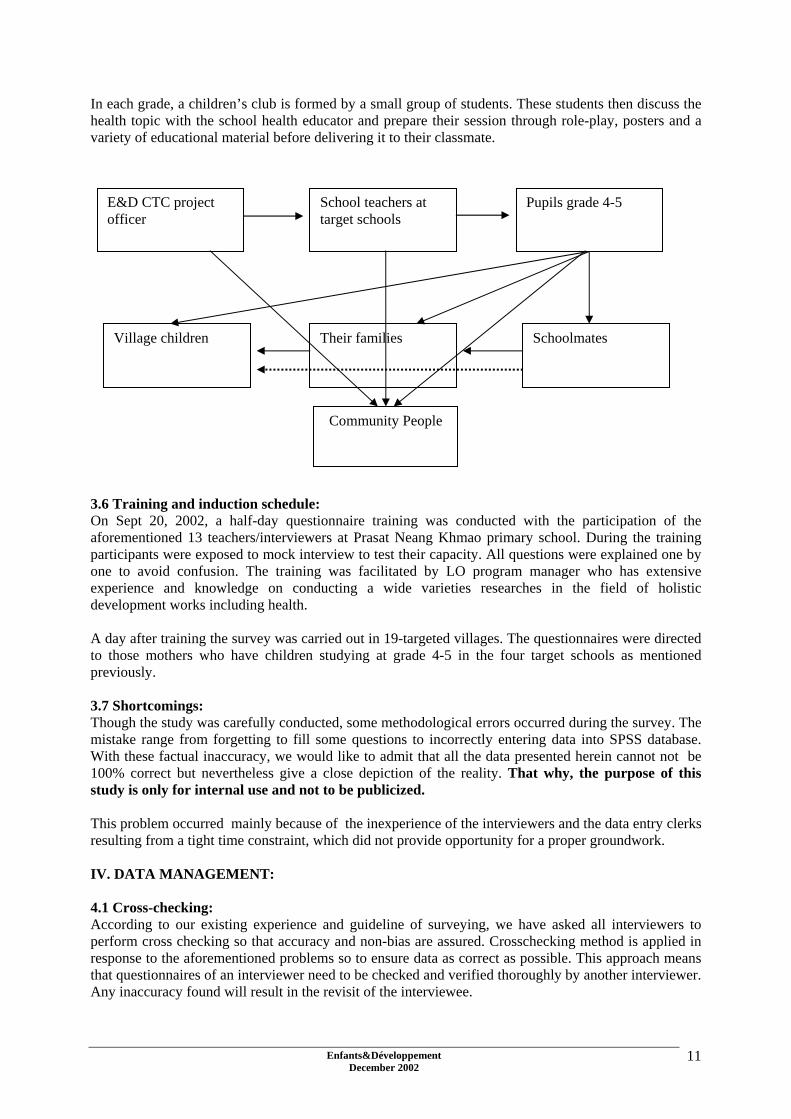
In each grade, a children’s club is formed by a small group of students. These students then discuss the health topic with the school health educator and prepare their session through role-play, posters and a variety of educational material before delivering it to their classmate.
E&D CTC project officer
School teachers at target schools
Pupils grade 4-5
Village children Their families Schoolmates
Community People
3.6 Training and induction schedule: On Sept 20, 2002, a half-day questionnaire training was conducted with the participation of the aforementioned 13 teachers/interviewers at Prasat Neang Khmao primary school. During the training participants were exposed to mock interview to test their capacity. All questions were explained one by one to avoid confusion. The training was facilitated by LO program manager who has extensive experience and knowledge on conducting a wide varieties researches in the field of holistic development works including health. A day after training the survey was carried out in 19-targeted villages. The questionnaires were directed to those mothers who have children studying at grade 4-5 in the four target schools as mentioned previously. 3.7 Shortcomings: Though the study was carefully conducted, some methodological errors occurred during the survey. The mistake range from forgetting to fill some questions to incorrectly entering data into SPSS database. With these factual inaccuracy, we would like to admit that all the data presented herein cannot not be 100% correct but nevertheless give a close depiction of the reality. That why, the purpose of this study is only for internal use and not to be publicized. This problem occurred mainly because of the inexperience of the interviewers and the data entry clerks resulting from a tight time constraint, which did not provide opportunity for a proper groundwork. IV. DATA MANAGEMENT: 4.1 Cross-checking: According to our existing experience and guideline of surveying, we have asked all interviewers to perform cross checking so that accuracy and non-bias are assured. Crosschecking method is applied in response to the aforementioned problems so to ensure data as correct as possible. This approach means that questionnaires of an interviewer need to be checked and verified thoroughly by another interviewer. Any inaccuracy found will result in the revisit of the interviewee.
Enfants&Développement December 2002
11

4.2 Database management: To analyze data, we have used SPSS version 11.0 program for studying the information generated during the household survey. Database for entering data have been set up and reviewed before the end of the survey to run test program. After making sure that all the databases were free from incorrectness, the data entry team has embarked on the process. The team comprised of 3 people_ technical assistant and two data enterers. The process has taken up to around a month to complete since staff need to do other planned activities. 4.3 Data verification: One the data entry process was completed, we perform a last complete checking to ensure the entered data were truthful and correctly recorded, in accordance to the answers in the questionnaires. 4.4 Data analysis: By the end of the data verification, we have embarked on the task of data analysis using SPSS program. Most of the information, presented herein, are the outcomes of analysis through frequency and cross-tabulation analysis. SPSS program enables us to produce tables, and a variety of charts and diagrams to attract as well as retain attention of readers. V. STATISTIC COACH: To facilitate the understanding of the findings, it is recommended that readers have a look at this charter. Since it is only a quick and simple survey, we would like to present the findings issued from basic statistics through a simple analysis such as: frequency, cross- tabulation, multiple answers, and descriptive analysis. Aimed at showing results easy to comprehend, we would like to use one example from each type of analysis for explanation. Example 1: Frequency analysis Frequency analysis is used when researcher only need to know the number of responses made to any particular question.
Note: - In household survey, the terms case and interviewee are used interchangeably. - The statistic sometimes shows frequency or count. This means the same thing that the
number of response made to any specific question. - Valid: means the correct or applicable cases or answers for any specific question.
Table 4: Interviewee’s educational background Frequency Percent Cumulative Percent Valid Never schooling 22 19.6 19.6 Primary school 67 59.8 79.5 Secondary school 21 18.8 98.2 High school 2 1.8 100.0 Total 112 100.0 Table 4 illustrates that 22 out of 112 interviewed cases have never attended school. It could also mean that 19.6% of interviewees (mothers) are illiterate.
Enfants&Développement December 2002
12

Example 2: Cross tabulation analysis This type of analysis is applicable when, analyst wants to know the relationship between two variables (questions) such as the following table. Table 8: Relationship between main source of family income and living standard Family status Total Impoverish Poor Medium Above average Rich
Farming 2 21 59 9 91 Garment factory working 1 1 Brick factory working 1 1 Making business 2 2 4 Animal raising 1 1 2 Cottage industry 1 1 1 3 Construction worker 1 1 2 Casual labor performing 1 1
Main source of family income Others 4 3 7 Total 6 23 67 15 1 112 With the above table, we can extract that there are 6 impoverished families5 out of the total 112 cases. 2 among the 6 are getting their main family income by farming, 1 works in brick factory, 2 are generating their income through making business and only 1 is raising animal for earnings. Moreover, this table shows, as well, that 91 families are generating main income through farming. Example 3: Descriptive analysis This analysis is used to show detailed statistics, which could enable researcher to compare the statistic results of two or more variables. Note:
- N: means number of case or interviewee - Minimum: is the smallest or the least frequency of responses and the Maximum is the other
way round. - Sum: means the total sum of something - Mean or average: is the result of Sum divides by N
Table 25: Comparison between # of people in family, # of brush, and # of tooth brushing time
N Minimum Maximum Sum Mean
# of people in family 112 2 12 722 6.45 # of brush 112 1 10 577 5.15 Frequency of brushing time 112 1 3 199 1.78 This table tells us that the number of people in the family ranges from 2 to 12 persons. All the 112 families comprised of 722 people and the mean/average people per family is 6.45.
5 Poverty criteria were let to the interviewer appreciation
Enfants&Développement December 2002
13
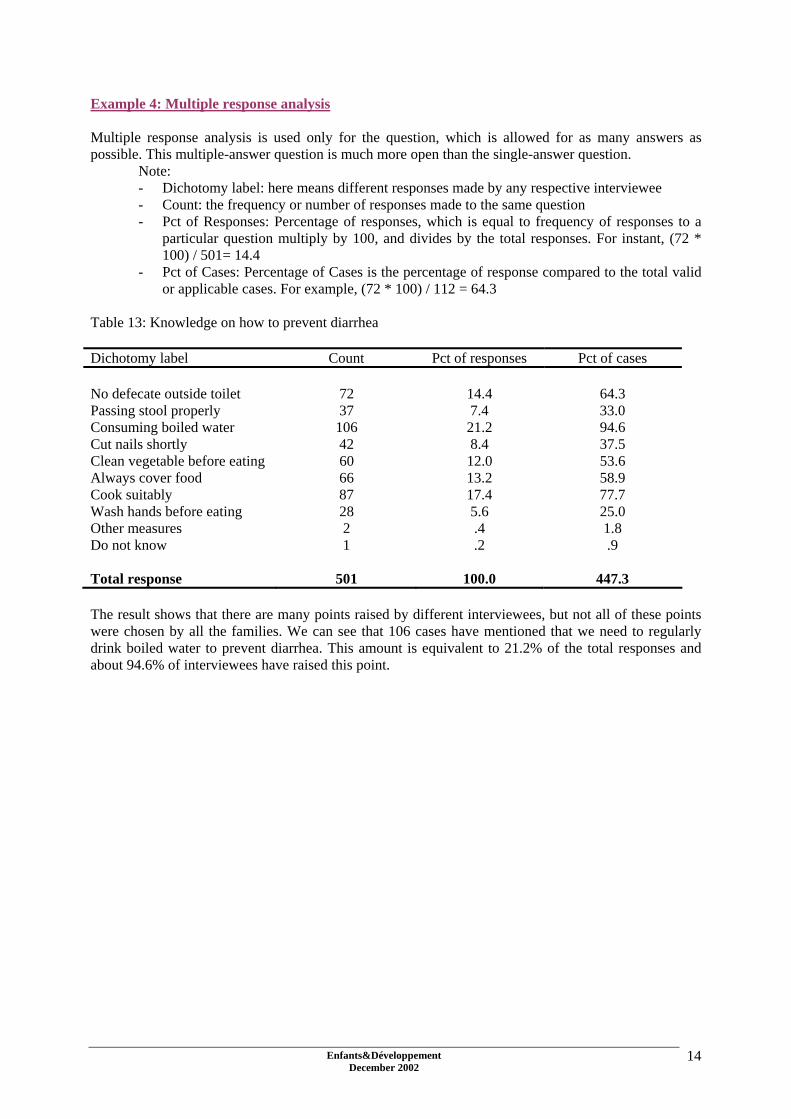
Example 4: Multiple response analysis Multiple response analysis is used only for the question, which is allowed for as many answers as possible. This multiple-answer question is much more open than the single-answer question. Note:
- Dichotomy label: here means different responses made by any respective interviewee - Count: the frequency or number of responses made to the same question - Pct of Responses: Percentage of responses, which is equal to frequency of responses to a
particular question multiply by 100, and divides by the total responses. For instant, (72 * 100) / 501= 14.4
- Pct of Cases: Percentage of Cases is the percentage of response compared to the total valid or applicable cases. For example, (72 * 100) / 112 = 64.3
Table 13: Knowledge on how to prevent diarrhea Dichotomy label Count Pct of responses Pct of cases No defecate outside toilet 72 14.4 64.3 Passing stool properly 37 7.4 33.0 Consuming boiled water 106 21.2 94.6 Cut nails shortly 42 8.4 37.5 Clean vegetable before eating 60 12.0 53.6 Always cover food 66 13.2 58.9 Cook suitably 87 17.4 77.7 Wash hands before eating 28 5.6 25.0 Other measures 2 .4 1.8 Do not know 1 .2 .9 Total response 501 100.0 447.3 The result shows that there are many points raised by different interviewees, but not all of these points were chosen by all the families. We can see that 106 cases have mentioned that we need to regularly drink boiled water to prevent diarrhea. This amount is equivalent to 21.2% of the total responses and about 94.6% of interviewees have raised this point.
Enfants&Développement December 2002
14

VI. FINDING AND ANALYSIS: In this chapter, reader will be presented with results of the survey. If necessary and possible, we will propose a precise and concise analysis on the findings. In some cases, we will analyze the whole section once at the end of each section when the analyze table-by-table is not feasible. Section I: General information Table 1: Interview duration per case Mean 0:33mnMinimum 0:11mnMaximum 1:25mn The interview duration ranges 11mm to 85 mn. The average time for interviewing a family is 33mn. Table 2: Schools interviewees’ children attend Child's school Total Phnom
Chiso Om
Sophath Prasat Nang
Khmao Slaroum
Trapang Srong 9 9 Por 5 5 Trapang Ampil 5 5 Beung Kantrong 5 5 Chalot Day 6 6 Kandal 2 2 Dorpor 3 4 7 Trapang Veng 4 4 8 Deum Thlork 5 5 Krapang Thnong 3 3 Char 8 8 Phoum Thmey 8 3 11 Trapang Leav 4 4 Teuk Ambeul 9 9 Trapang Trea 12 12 Tranpang Chouk 4 4 Kok Tarea 5 5 Tranpang Knar 2 2
Name of village
Roveang 2 2
Total 39 8 24 41 112 Table 3: Age of interviewees
N Minimum Maximum Mean Std. Deviation
Interviewee's ages 112 27 68 43.43 8.414
Enfants&Développement December 2002
15

Table 4: Interviewee’s educational background Frequency Percent National statistic6 Cumulative Percent Valid Never schooling 22 19.6 36.3 19.6 Primary school 67 59.8 51.5 79.5 Secondary school 21 18.8 6.7 98.2 High school 2 1.8 0.0 100.0 Total 112 100.0 In reference to table 4, we noticed that 19.6% of interviewees7 are illiterate whereas another 59.8% was used to attend only primary education. Surprisingly, only 1.8% of interviewees got high school education. This might due to a variety of historitical and socio-economic reasons such as war, poverty, poor access to education, traditions. Table 5: Family status Frequency Percent Cumulative Percent Valid Impoverish 6 5.4 5.4 Poor 23 20.5 25.9 Medium 67 59.8 85.7 Above average 15 13.4 99.1 Rich 1 .9 100.0 Total 112 100.0 25.9% of cases are impoverished families and only 0.9% of the interviewees who are well off. Besides, 59.8% is having medium living standard. Table 6: Relationship between educational background and family status Family status Total Impoverish Poor Medium Above average Rich
Never schooling 1 9 9 3 22 Primary school 2 12 44 8 1 67 Secondary school 2 1 14 4 21
Educational background High school 1 1 2 Total 6 23 67 15 1 112 Though there are many poor people and even with the fact that 79.5% of cases are either illiterate or just got primary education, we noticed in this cross-tabulation analysis that there is no relationship between educational background and family status. For example, also one women interviewed received high school education her family status is poor. 6 Cambodian Health and Demographic Survey , 2000, rural area percentage for female 7 All of them are mother
Enfants&Développement December 2002
16

Table 7: Main source of family income Frequency Percent Cumulative Percent Valid Farming 91 81.3 81.3 Garment factory working 1 .9 82.1 Brick factory working 1 .9 83.0 Making business 4 3.6 86.6 Animal raising 2 1.8 88.4 Cottage industry 3 2.7 91.1 Construction worker 2 1.8 92.9 Casual labor performing 1 .9 93.8 Others 7 6.3 100.0 Total 112 100.0 Being an agrarian country, most of Cambodians are depending on a subsistence agriculture for making their living. The statistics depict that 81.3% of cases are generating main family income through agriculture or farming. Farming here mainly referred to rice cultivation and vegetable growing. It is noted also that most of the Cambodian people living in the countryside do not have main occupation during the dry season. They are likely to depend mostly on farming during the rainy season. Farming is not appropriate during the dry seasons owing to poor irrigation system. Table 8: Relationship between main source of family income and living standard Family status Total Impoverish Poor Medium Above
average Rich
Farming 2 21 59 9 91 Garment factory working 1 1 Brick factory working 1 1 Making business 2 2 4 Animal raising 1 1 2 Cottage industry 1 1 1 3 Construction worker 1 1 2 Casual labor performing 1 1
Main source of family income Others 4 3 7
Total 6 23 67 15 1 112 This table shows that 2 among 91 families generating their main income through farming are impoverished and only 9 families that are above average. Table 9: Statistic of children /girls in burden
N Minimum Maximum Mean Std. Deviation
# of children in burden 112 1 10 4.56 1.844 # of daughter in burden 112 0 6 2.27 1.287
Enfants&Développement December 2002
17

Table 10: Relationship between family status and number of daughter in burden
# of daughter in burden Total 0 1 2 3 4 5 6
Impoverish 2 3 1 6 Poor 3 4 6 7 3 23 Medium 1 15 26 14 5 5 1 67 Above average 1 2 5 4 3 15
Family status Rich 1 1
Total 7 25 37 25 11 6 1 112 This table shows the relationship between the number of daughters in burden and the family living standard. Through this table, we can see there is at least minor positive correlation between the two variables. The more daughters the family has the better the family status. This might be because girls usually contribute more than boys to financially sustain family. Girls can much easily find opportunity to earn additional income, e.g. in garment factories8.
8 Garnemt factories in Cambodia employ roughly 200 000 workers mainly coming form rual poor areas
Enfants&Développement December 2002
18

Section II: Knowledge of diarrhea and practice Table 10: Multiple responses on how to keep food Pct of Pct of Dichotomy label Count Responses Cases In cupboard 64 29.0 58.2 Covered container 38 17.2 34.5 Covered by dish 81 36.7 73.6 Hang in safe place 31 14.0 28.2 On bed without covering 4 1.8 3.6 Others 3 1.4 2.7 Total responses 221 100.0 200.9 64 of out 112 interviewees said that they usually keep food in cupboard. This frequency is equal to 29% of the total responses and also equivalent to 58.2% of the total cases that selected this response. We can advance that people have more understanding on how to preserve food for later consumption. Anyhow, still 3.6% of cases continue to store food on bed without protection. These families might facing serious and constant problem regarding to diarrhea, particularly children. Table 11: Knowledge of diarrhea causes
Frequency Percent Cumulative Percent
Valid Yes 105 93.8 93.8 No 7 6.3 100.0 Total 112 100.0 105 of 112 interviewees said they know the causes of diarrhea whereas 7 others do not know. With this statistic, we could assume that diarrhea education or dissemination have reached and aware 93.8% of the target population. Table 12: Describe the causes of diarrhea Pct of Pct of Dichotomy label Count Responses Cases Defecate outside latrine 48 10.3 45.7 Eating raw vegetable 87 18.8 82.9 Poisonous food 50 10.8 47.6 Drink raw water 93 20.0 88.6 Poor or improper cooked food 63 13.6 60.0 Wash hand improperly 36 7.8 34.3 Eat uncovered food 42 9.1 40.0 Other reasons 3 .6 2.9 Total responses 464 100.0 441.9
Enfants&Développement December 2002
19

Referred to Table 11: only 105 valid cases People seem to be quite aware of the various causes of diarrhea and the main reason mentioned by people are drinking raw or unsafe water and eating raw vegetable. The latter means we can suppose the health messages have reached the community. Table 13: Knowledge on how to prevent diarrhea Pct of Pct of Dichotomy label Count Responses Cases No defecate outside toilet 72 14.4 64.3 Passing stool properly 37 7.4 33.0 Consuming boiled water 106 21.2 94.6 Cut nails shortly 42 8.4 37.5 Clean vegetable before eating 60 12.0 53.6 Always cover food 66 13.2 58.9 Cook suitably 87 17.4 77.7 Wash hands before eating 28 5.6 25.0 Other measures 2 .4 1.8 Do not know 1 .2 .9 Total responses 501 100.0 447.3 When asked on how to prevent diarrhea, most of the interviewees mentioned that consuming boiled or safe water and eating properly cooked food could eventually avoid having diarrhea. Regarding this statistic, most of the interviewees are presumed well aware of diarrhea issues. Table 14: Why diarrhea causes death Pct of Pct of Dichotomy label Count Responses Cases Too much dehydration 102 57.0 91.1 Completely lost of energy 65 36.3 58.0 Other reason 5 2.8 4.5 Don't know 7 3.9 6.3 Total responses 179 100.0 159.8
Enfants&Développement December 2002
20

Table 15: What to do when child get diarrhea Pct of Pct of National9 Dichotomy label Count Responses Cases Statistic More boiled water 81 23.7 73.6 53.1 Take to health center 101 29.5 91.8 20.3 Buy medicine personally 38 11.1 34.5 55.6 Give more food 36 10.5 32.7 Give ORS 44 12.9 40.0 17.0 Drink more coconut juice 31 9.1 28.2 Reduce diet 7 2.0 6.4 Not need to care 1 .3 .9 11.8 To traditional healer 3 .9 2.7 Total responses 342 100.0 310.9 Although many cases are well aware of diarrhea issues, we can observe though this table 15 that 7.3% of interviewers do not positively response to a diarrhea episode. 6.4% of cases reduce diet instead of increasing it, while 0.9% does not seek for care when getting diarrhea. The latter, particularly regarding children can lead to severe dehydration is worrying when correlated with the only 40% of mothers who seem sensibilized to the ORS treatment. Table 16: Main sources of drinking water
Frequency Percent National statistics10 Cumulative Percent
Valid Pond water 36 32.1 30.00* 24.00** 32.1 Rain water 22 19.6 1.0 14.9 51.8 Tube borehole 42 37.5 13.8 11.2 89.3 Open well 12 10.7 24.1 21.7 100.0 Total 112 100.0 * Dry season ** Rainy season Only 37.5% of cases have access to drinkable water through tube borehole, while another 32.1% rely mainly on pond water. Pond water might not be available during dry season11. Moreover, fail to boil pond water prior to drink will post a great vulnerability to waterborne diseases since the pond is usually used for many purposes such as cleaning cows/ox, irrigating garden, bathing, washing...
9 Cambodian Health and Demographic Survey , 2000, rural area data 10 Cambodian Health and Demographic Survey , 2000, rural area data 11 An E&D survey on water accessibility in dry seasson conducted in 2001 in Bati OD has reveled that 40% of familial and collective ponds are waterless in dry season
Enfants&Développement December 2002
21

Relationship between main source of drinking water and drink boiled water
Drink boiled water Total Yes Sometimes
Main source of drinking water Pond water 16 20 36 Referred to table 16, only 36 valid cases being selected for analysis. Though cross-tabulation analysis, we see that only 16 among the 36 cases using pond water as main drinking water source usually boil water before consumption whereas another 20 cases boil water irregularly. Table 17: Regularly drink boiled water
Frequency Percent Cumulative Percent
Valid Sometimes 47 42.0 42.0 Yes 65 58.0 100.0 Total 112 100.0 Only 58% of cases regularly drink boiled water whilst another 42% just sometimes drink boiled water. People seem to still have poor understanding on safe water issues. Emphasis should be put on convincing people of the importance of clean water for a healthy life. Table 18: Check jar if there is lid or ABATE
Frequency Percent Cumulative Percent
Valid Some have some not 50 44.6 44.6 Yes 58 51.8 96.4 No 4 3.6 100.0 Total 112 100.0 When interviewers checked de visu the water jars in interviewees’ yards, they found that only 51.8% of water jars have lids or ABATE12. This also should be a matter of concern because this area is prone to yearly dengue outbreak. Table 19: Attend diarrhea education
Frequency Percent Cumulative Percent
Valid Yes 52 46.4 46.4 No 60 53.6 100.0 Total 112 100.0
12 ABATE, is normaly distributed by MoH and Cambodian Red Cross
Enfants&Développement December 2002
22

When asked if the families have ever attended any education regarding diarrhea issues, we surprisingly noticed only 46.4% positive answers, whereas VHVs were in charge to deliver such messages at village level. It seems according to table 20 and 21 that messages are spread on a more informal way, like household to household. Table 20: Was told about diarrhea
Frequency Percent Cumulative Percent
Valid Yes 98 87.5 87.5 No 14 12.5 100.0 Total 112 100.0 Though most of the interviewers have never attended any diarrhea education, 87.5% of cases have been told about diarrhea by children, HC staff, and others. (Please have a look at table 21) Table 21: Was told about diarrhea by Pct of Pct of Dichotomy label Count Responses Cases By children 90 41.5 91.8 By VHV 28 12.9 28.6 By HC staff 40 18.4 40.8 By E&D staff 6 2.8 6.1 By teacher 23 10.6 23.5 By Neighbors 27 12.4 27.6 By others 3 1.4 3.1 Total responses 217 100.0 221.4 Referred to Table 20, only 98 valid cases Children and HC staff seem to play an active role in disseminating diarrhea-related messages to community people. VHVs and schoolteachers also contribute to the understanding of people.
Enfants&Développement December 2002
23

Section III: Oral and dental health care Table 22: Have heard of dental care
Frequency Percent Cumulative Percent
Valid Yes 102 91.1 91.1 No 10 8.9 100.0 Total 112 100.0 We can confidently assume that most of the interviewees are quite aware of dental care because 91.1% of cases have heard about dental care; 94.6% are regularly brushing their teeth with toothpaste; and last but not least 89.3% of cases are brushing teeth correctly. Table 23: Object used as a brush teeth
Frequency Percent Cumulative Percent
Valid Others 1 .9 .9 Brush with toothpaste 106 94.6 95.5 Only brush 1 .9 96.4 Finger 4 3.6 100.0 Total 112 100.0 Table 24: Method used to brush
Frequency Percent Cumulative Percent
Valid Correctly 100 89.3 89.3 Incorrectly 12 10.7 100.0 Total 112 100.0 According to interviewees’ reply, interviewers have noticed that 12 out of 112 are brushing teeth in an inefficient manner. Table 25: Comparison between # of people in family, # of brush, and # of tooth brushing time
N Minimum Maximum Sum Mean
# of people in family 112 2 12 722 6.45 # of brush 112 1 10 577 5.15
Frequency of brushing time 112 1 3 199 1.78
Enfants&Développement December 2002
24

Table 26: Daily frequency of tooth brushing
Frequency Percent Cumulative Percent
1 25.9 25.9 2 79 70.5 3 3.6 100.0
Valid
Total
29 96.4
4
112 100.0 Only 4 out of 112 interviewees mentioned that she usually brushes teeth 3 times a day. WHO recommends to brush teeth at least 2 times a day. 74 % of person questioned behaves properly regarding oral care. Table 27: Attend dental care education
Frequency Percent Cumulative Percent
Valid No 23 20.5 20.5 Yes 89 79.5 100.0 Total 112 100.0 Dissemination of messages related to dental care seems quite effective with 79.5% of participants receiving them. Table 28: Made aware by Pct of Pct of Dichotomy label Count Responses Cases By children 85 43.4 95.5 By VHV 27 13.8 30.3 By HC staff 38 19.4 42.7 By SC F staff 3 1.5 3.4 By teacher 19 9.7 21.3 By neighbors 19 9.7 21.3 By others 5 2.6 5.6 Total responses 196 100.0 220.2 Referred to Table 27, only 89 valid cases
Enfants&Développement December 2002
25

Section IV: Dengue fewer Table 29: Knowledge of DHF (What is dengue fever?)
Frequency Percent Cumulative Percent
Valid Preventable, spread by dengue mosquito and leading to death
58 51.8 51.8
Normal disease and not serious 1 .9 52.7 Curable disease 47 42.0 94.6 Others 1 .9 95.5 Don't know 5 4.5 100.0 Total 112 100.0 Table 30: Interviewees made aware by Pct of Pct of Dichotomy label Count Responses Cases By children 77 26.6 72.0 By VHV 42 14.5 39.3 By HC staff 72 24.9 67.3 By SC F staff 12 4.2 11.2 By teacher 36 12.5 33.6 By Neighbors 36 12.5 33.6 By others 14 4.8 13.1 Total responses 289 100.0 270.1 Referred to Table 29, only 107 valid cases Table 31: Knowledge on causes of DHF Frequency Percent Cumulative Percent Valid Insect bite 2 1.8 1.8 Dengue mosquito bite 110 98.2 100.0 Total 112 100.0 Table 32: Is DHF a preventable disease
Frequency Percent Cumulative Percent
No 4 3.6 3.6 Yes 105 93.8 97.3 Don't know 3 2.7 100.0
Valid
Total 112 100.0
Enfants&Développement December 2002
26
Table 33: How does the family sleep?
Frequency Percent Cumulative Percent
Valid Always inside net 107 95.5 95.5
Sometime in net 5 4.5 100.0 Total 112 100.0
Table 34: What to do when a child has DHF
Frequency Percent Cumulative Percent
Valid To HC 61 54.5 54.5 To hospital 46 41.1 95.5 To private clinic 1 .9 96.4 To traditional healer 3 2.7 99.1 Buy medicine personally 1 .9 100.0 Total 112 100.0 Table 35: Household yard cleanliness
Frequency Percent Cumulative Percent
Valid Bad 1 .9 .9 Normal 53 47.3 48.2 Good 57 50.9 99.1 Very good 1 .9 100.0 Total 112 100.0 Table 36: Methods the family is using to prevent children from DHF Pct of Pct of Dichotomy label Count Responses Cases Always sleep in net 108 25.1 96.4 Always keep jar clean 60 13.9 53.6 Put ABATE in jar 80 18.6 71.4 Bury and burn all waster 65 15.1 58.0 Keep house and yard clean 58 13.5 51.8 Shun children from dark place 54 12.5 48.2 Others 5 1.2 4.5 Don't know 1 .2 .9 Total responses 431 100.0 384.8 Thanks to the above tables, we realize that most of the interviewees have good understanding, practice and attitude regarding Dengue Hemorrhagic Fever (DHF). For example, (1) 98.2% know exactly the
Enfants&Développement December 2002
27

causes of DHF; (2) 93.8% know that it is preventable disease; (3) 95.5% usually sleep in bed to prevent dengue mosquito from biting; (4) 96.4% know correctly how to do when their children caught dengue fever by referring children to health centers, hospital and private clinic and (5) 99.1% of interviewees’ houses and yards are clean. We can here appreciate the results of the campaigns13 organized since 1998 by all the stakeholders involved in fighting the disease like MoH, NGOs, CNM, media and Cambodian Red Cross. 13 DHF outbreak generally occur on a three years cycle. The last one was in 2001, but MoH has reported in 2002 a high prevalence of DHF nationwide.
Enfants&Développement December 2002
28

Section V: Fever Table 37: Is fever dangerous for children?
Frequency Percent Cumulative Percent
Valid No 8 7.1 7.1 Yes 102 91.1 98.2 Don't know 2 1.8 100.0 Total 112 100.0 Table 38: What danger can it represent
Frequency Percent Cumulative Percent
Valid Convulsion leading to death 79 70.5 70.5 Brain damaging 17 15.2 85.7 Others 5 4.5 90.2 Don't know 11 9.8 100.0 Total 112 100.0 Table 39: What to do when child has fever Pct of Pct of Dichotomy label Count Responses Cases Covered with blanket 20 7.2 17.9 Covered with wet clothe 88 31.7 78.6 Expose child to fan 42 15.1 37.5 Drink more water 34 12.2 30.4 To HC or hospital 83 29.9 74.1 To traditional healer 9 3.2 8.0 Others 1 .4 .9 Don't know 1 .4 .9 Total responses 278 100.0 248.2 Table 40: Was told about fever
Frequency Percent Cumulative Percent
Valid No 9 8.0 8.0 Yes 103 92.0 100.0 Total 112 100.0
Enfants&Développement December 2002
29

Table 41: Was told by Pct of Pct of Dichotomy label Count Responses Cases By children 87 32.2 84.5 By VHV 39 14.4 37.9 By HC staff 60 22.2 58.3 By SC F staff 13 4.8 12.6 By teacher 37 13.7 35.9 By Neighbors 28 10.4 27.2 By others 6 2.2 5.8 Total responses 270 100.0 262.1 Referred to Table 40, only 103 valid cases According to all the above tables, we acknowledge that many people now started to understand more about fever. 91.1% said fever is dangerous for children; 70.5% know that fever could lead to death; 74.1% understand that they should take children to health center when they got fever. Children and health center staff seem to be the agents contributing the most to inform people regarding fever issue. For example, 92% have been told about fever mostly by children and health center staff.
Enfants&Développement December 2002
30

Section VI: Safe water Table 42: Best water sources for daily consumption
.9%
12.5%
.9%
16.1%
12.5%
8.0%
49.1%
Don't know
Pond water
Clear water
Boiled water
Rain water
Open well
Pumping well
Table 43: What will happen if drinking unsafe water? Pct of Pct of Dichotomy label Count Responses Cases Get diarrhea 111 33.2 99.1 Get fever 52 15.6 46.4 Get typhoid 57 17.1 50.9 Have worms and parasite 49 14.7 43.8 Get sick 59 17.7 52.7 Others 6 1.8 .4 Total responses 334 100.0 298.2 Table 44: Was told about safe water
Frequency Percent Cumulative Percent
Valid No 15 13.4 13.4 Yes 97 86.6 100.0 Total 112 100.0
Enfants&Développement December 2002
31

Table 45: Told by Pct of Pct of Dichotomy label Count Responses Cases By children 78 31.3 80.4 By VHV 39 15.7 40.2 By HC staff 60 24.1 61.9 By SC F staff 17 6.8 17.5 By teacher 25 10.0 25.8 By Neighbors 26 10.4 26.8 By others 4 1.6 4.1 Total responses 249 100.0 256.7 Referred to Table 44, only 97 valid cases Statistics inform us that most of people have a good understanding over safe water practice. Most of them know the health consequences of drinking un-boiled water and 49.1% of them have access to drinkable water from pumping wells/boreholes.
Enfants&Développement December 2002
32

Section VII: Body hygiene Table 46: How to ensure good hygiene Pct of Pct of Dichotomy label Count Responses Cases Wash hair with soap or shampoo 84 15.6 75.0 Wash and dry clothes regularly 83 15.4 74.1 Cut nail shortly 57 10.6 50.9 Cut hair shortly 62 11.5 55.4 Brush teeth with toothpaste after meal 79 14.6 70.5 Keep body clean 46 8.5 41.1 Keep house clean 38 7.0 33.9 Eat and drink healthily 67 12.4 59.8 Keep household items clean 22 4.1 19.6 Others 2 .4 1.8 Total responses 540 100.0 482.1 Table 47: Check if Pct of Pct of Dichotomy label Count Responses Cases Short hair 93 20.0 83.0 Short nail 80 17.2 1.4 Clean clothes 73 15.7 65.2 White and healthy teeth 76 16.3 67.9 Clean house 71 15.3 63.4 Clean sleeping materials 57 12.3 50.9 Others 15 3.2 13.4 Total responses 465 100.0 415.2 Table 48: Comparison between frequency of bathing and bath with soap per day
N Minimum Maximum Sum Mean Frequency of bathing 112 1 3 221 1.97 Frequency of bathing with soap 112 0 3 150 1.34
Enfants&Développement December 2002
33
Table 49: How often does the family wash sleeping materials such as mate, net, pillow, and blanket...
Frequency Percent Cumulative Percent Valid Once a week 79 70.5 70.5 Once for every fortnight 16 14.3 84.8 Once a month 8 7.1 92.0 Once every quarter 1 .9 92.9 Other 8 7.1 100.0 Total 112 100.0 Table 50: Was told about sanitation issues
Frequency Percent Cumulative Percent Valid No 18 16.1 16.1 Yes 94 83.9 100.0 Total 112 100.0 Table 51: Was told by Pct of Pct of Dichotomy label Count Responses Cases By children 80 31.7 85.1 By VHV 42 16.7 44.7 By HC staff 62 24.6 66.0 By SC F staff 11 4.4 11.7 By teacher 31 12.3 33.0 By Neighbors 25 9.9 26.6 By others 1 .4 1.1 Total responses 252 100.0 268.1 In reference to Table 50, there are only 94 valid cases Table 52: Opinion on the current village sanitation status compared to the past
Frequency Percent Cumulative Percent
Valid Remain the same 8 7.1 7.1 Better now 102 91.1 98.2 Don't know 2 1.8 100.0 Total 112 100.0 Body and general sanitation should not be a matter of concern according to above statistics. Most of the interviewees know how to keep themselves healthy and actually we noticed during the interview that
Enfants&Développement December 2002
34

they are clean in terms of body hygiene, clothes, household environment, and so on. They usually bath with soap, and more than that, they usually wash their daily household materials such as blanket, pillow cover, mate, net, and more once a week. Moreover, the sanitation status in the target villages is far better than in the past as reported by the people. This shows a great success of our health program especially Child-to-Child approach. Children and health center staff have been playing important and productive roles in disseminating relevant hygiene messages to the community. (Please refer to table 50 and 51 for more information)
Enfants&Développement December 2002
35

Section VIII: Knowledge on Child rights Table 53: What is meant by a child? Frequency Percent Cumulative Percent Valid Individual under 18 75 67.0 67.0 Those need support and care from parents 18 16.1 83.0 Those who need schooling 8 7.1 90.2 Those who need to be cared 7 6.3 96.4 Other 1 .9 97.3 Don't know 3 2.7 100.0 Total 112 100.0 Table 54: Does children have the rights like adults. Frequency Percent Cumulative Percent
No 18 16.1 16.1 Yes 82 73.2 89.3 Don't know 12 10.7 100.0
Valid
Total 112 100.0 Table 55: Know about how many Child Rights' baskets o
Frequency Percent Cumulative Percent
1 Basket 3 2.7 2.7 2 Baskets 7 6.3 8.9 3 Baskets 5 4.5 13.4 4 Baskets 50 44.6 58.0 5 Baskets 1 .9 58.9 6 Baskets 1 .9 59.8 Don't know 45 40.2 100.0
Valid
Total 112 100.0 Only 44.6% of interviewee mentioned correctly that there are 4 baskets of child rights
Enfants&Développement December 2002
36

Table 56: What are those main baskets? Pct of Pct of Dichotomy label Count Responses Cases Right to survival 67 26.7 100.0 Right to protection 59 23.5 88.1 Right to development 59 23.5 88.1 Right to participation 58 23.1 86.6 Others 5 2.0 7.5 Don't know 3 1.2 4.5 Total responses 251 100.0 374.6 In reference to Table 55, there are only 67 valid cases Table 57: Attend child right dissemination
Frequency Percent Cumulative Percent
Valid No 38 33.9 33.9 Yes 74 66.1 100.0 Total 112 100.0 Table 58: Were made aware by Pct of Pct of Dichotomy label Count Responses Cases By children 63 38.0 85.1 By VHV 27 16.3 36.5 By HC staff 22 13.3 29.7 By SC F staff 9 5.4 12.2 By teacher 29 17.5 39.2 By Neighbors 14 8.4 18.9 By others 2 1.2 2.7 Total responses 166 100.0 224.3 In relation to Table 57, there are only 74 valid cases We noticed that some people still do not have enough understanding regarding Child Right issues. For instant, only 67% of cases mentioned correctly that children are those who under the age of 18; 16.1% said that children do not have rights like adults; only 44.6% have accurately replied that there are 4 baskets of child right namely right to survival, to development, to participation, and to expression. More in deep study should be conducted to cross-check this survey's target area and the target villages of the Life Opportunity program that includes child rights community awareness raising through peer education in 8 villages of Samroang district..
Enfants&Développement December 2002
37
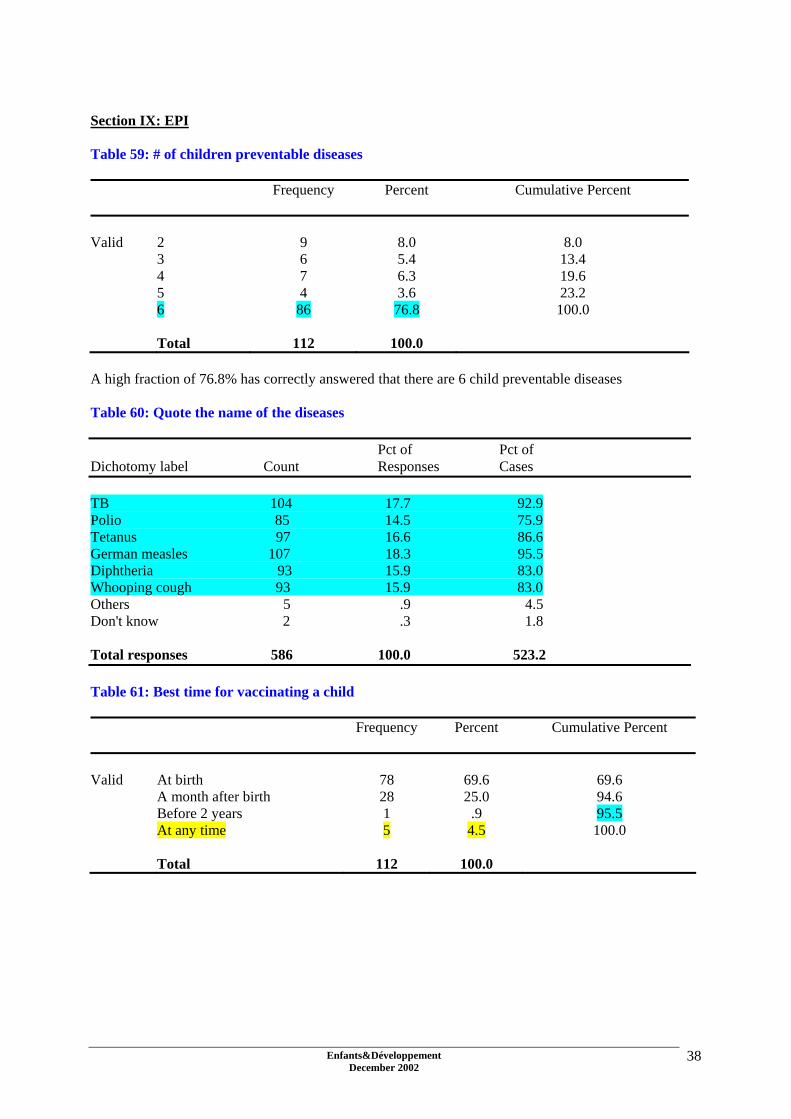
Section IX: EPI Table 59: # of children preventable diseases
Frequency Percent Cumulative Percent
Valid 2 9 8.0 8.0 3 6 5.4 13.4 4 7 6.3 19.6 5 4 3.6 23.2 6 86 76.8 100.0 Total 112 100.0 A high fraction of 76.8% has correctly answered that there are 6 child preventable diseases Table 60: Quote the name of the diseases Pct of Pct of Dichotomy label Count Responses Cases TB 104 17.7 92.9 Polio 85 14.5 75.9 Tetanus 97 16.6 86.6 German measles 107 18.3 95.5 Diphtheria 93 15.9 83.0 Whooping cough 93 15.9 83.0 Others 5 .9 4.5 Don't know 2 .3 1.8 Total responses 586 100.0 523.2 Table 61: Best time for vaccinating a child Frequency Percent Cumulative Percent Valid At birth 78 69.6 69.6 A month after birth 28 25.0 94.6 Before 2 years 1 .9 95.5 At any time 5 4.5 100.0 Total 112 100.0
Enfants&Développement December 2002
38
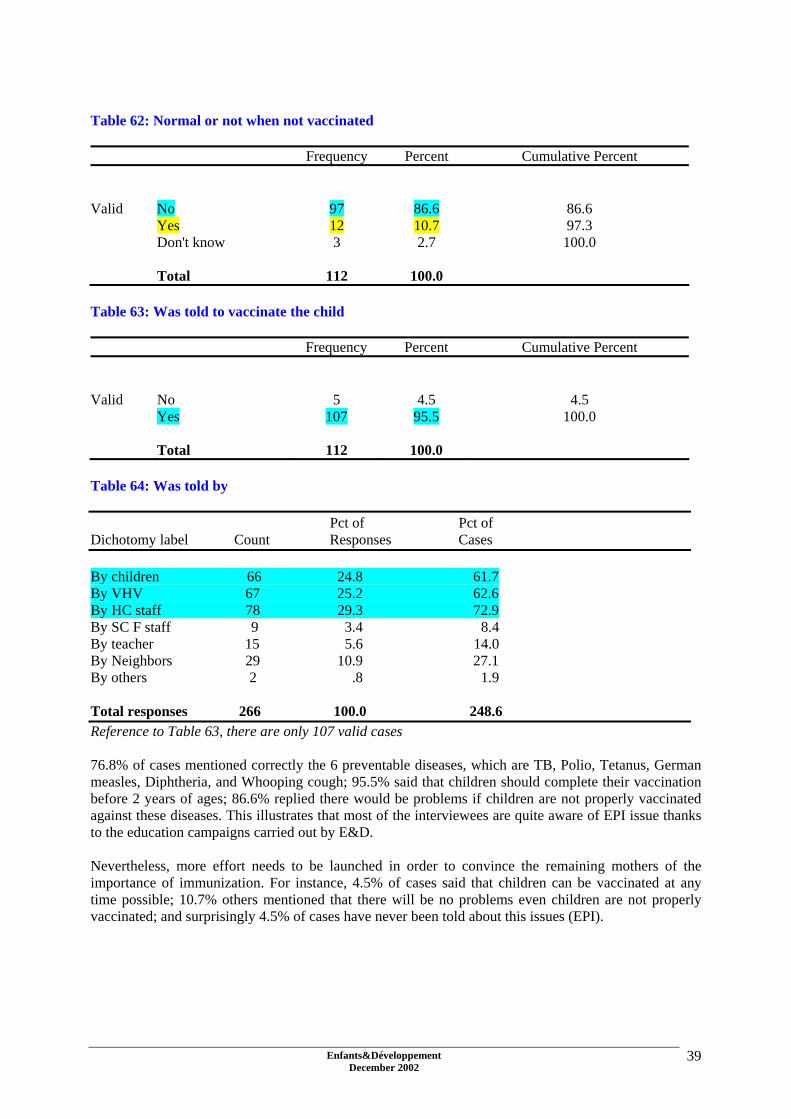
Table 62: Normal or not when not vaccinated Frequency Percent Cumulative Percent Valid No 97 86.6 86.6 Yes 12 10.7 97.3 Don't know 3 2.7 100.0 Total 112 100.0 Table 63: Was told to vaccinate the child Frequency Percent Cumulative Percent Valid No 5 4.5 4.5 Yes 107 95.5 100.0 Total 112 100.0 Table 64: Was told by Pct of Pct of Dichotomy label Count Responses Cases By children 66 24.8 61.7 By VHV 67 25.2 62.6 By HC staff 78 29.3 72.9 By SC F staff 9 3.4 8.4 By teacher 15 5.6 14.0 By Neighbors 29 10.9 27.1 By others 2 .8 1.9 Total responses 266 100.0 248.6 Reference to Table 63, there are only 107 valid cases 76.8% of cases mentioned correctly the 6 preventable diseases, which are TB, Polio, Tetanus, German measles, Diphtheria, and Whooping cough; 95.5% said that children should complete their vaccination before 2 years of ages; 86.6% replied there would be problems if children are not properly vaccinated against these diseases. This illustrates that most of the interviewees are quite aware of EPI issue thanks to the education campaigns carried out by E&D. Nevertheless, more effort needs to be launched in order to convince the remaining mothers of the importance of immunization. For instance, 4.5% of cases said that children can be vaccinated at any time possible; 10.7% others mentioned that there will be no problems even children are not properly vaccinated; and surprisingly 4.5% of cases have never been told about this issues (EPI).
Enfants&Développement December 2002
39

Section X: Nutrition Table 65: Knowledge on number of food groups Frequency Percent Cumulative Percent
1 6 5.4 5.4 2 12 10.7 16.1 3 81 72.3 88.4 4 3 2.7 91.1 5 2 1.8 92.9 Don't know 8 7.1 100.0
Valid
Total 112 100.0 72.3% mentioned correctly that there are 3 groups of food. Table 66: Describe the groups of food Pct of Pct of Dichotomy label Count Responses Cases Building food 96 31.6 85.7 Energy food 97 31.9 86.6 Protection food 84 27.6 75.0 Vit-A rich food 13 4.3 11.6 Protein food 5 1.6 4.5 Others 1 .3 .9 Don't know 8 2.6 7.1 Total responses 304 100.0 271.4 Table 67: Kind of food considered being protection food
Frequency Percent Cumulative Percent
Valid Vegetable 56 50.0 50.0 Fruits 41 36.6 86.6 Meat 6 5.4 92.0 Grains 1 .9 92.9 Don't know 8 7.1 100.0 Total 112 100.0
Enfants&Développement December 2002
40

Table 68: Frequency of giving meat to child
Frequency Percent Cumulative Percent
Valid Every day 73 65.2 65.2 Once a week 22 19.6 84.8 2-3 times a week 16 14.3 99.1 Others 1 .9 100.0 Total 112 100.0 Table 69: Frequency of giving vegetable to children
Frequency Percent Cumulative Percent
Valid Every day 105 93.8 93.8 Once a week 1 .9 94.6 2-3 times a week 5 4.5 99.1 Others 1 .9 100.0 Total 112 100.0 Table 70: Was told about nutrition
Frequency Percent Cumulative Percent
Valid No 26 23.2 23.2 Yes 86 76.8 100.0 Total 112 100.0 Table 71: Was told by Pct of Pct of Dichotomy label Count Responses Cases By children 32 15.0 37.2 By HC staff 45 21.1 52.3 By SC F staff 10 4.7 11.6 By teacher 24 11.3 27.9 By Neighbors 22 10.3 25.6 By others 1 .5 1.2 Total responses 213 100.0 247.7 Referred to Table 70, there are only 86 valid cases
Enfants&Développement December 2002
41

Surprisingly, in the course of the survey result, we discovered that most of the interviewees are aware of the nutrition issues. 72.3% of interviewees have correctly mentioned that there are 3 groups of food, namely protection, building, and energy foods; 86.6% are also aware that fruits and vegetable are protection food; most of children seem to be given vegetable and meat everyday. With the fact that most of the cases understand about nutrition issues, we need to admit that children and health center staff have contributed greatly to this knowledge improvement.
Enfants&Développement December 2002
42

Section XI: Basic health understanding and practice Table 72: Most common diseases in the community
Frequency Percent Cumulative Percent
Valid AIDS/HIV 7 6.3 6.3 Fever 43 38.4 44.6 DHF 60 53.6 98.2 Diarrhea 2 1.8 100.0
Total 112 100.0 Table 73: Do people prefer to go to health center for treatment? Frequency Percent Cumulative Percent Valid No 5 4.5 4.5 Yes 107 95.5 100.0 Total 112 100.0 Table 74: People do not like going to health center because Pct of Pct of Dichotomy label Count Responses Cases Too far 2 28.6 40.0 Expensive 1 14.3 20.0 Poor service and quality 1 14.3 20.0 Have private clinic in village 3 42.9 60.0 Total responses 7 100.0 140.0 Referred to Table 73, only 5 valid cases Table 75: Relationship between People who not want to go to HC and their family status
Family status Total
Impoverish Poor Above average People who do not desire HC 1 3 1 5 Total 1 3 1 5 Referred to Table 74, there are only 5 valid cases
Enfants&Développement December 2002
43
In this section, we have remarked that fever and dengue fever are the most common diseases identified in target villages whilst HIV/AIDS ranges third followed by diarrhea. Though 95.5% of the cases prefer health center services, 4.5% other said that they do not like visiting health center because it is expensive, far away from the community, and the services and quality are not good enough. Nonetheless, well off families prefer to visit private clinics or medical practitioners existing in the villages. The result of cross-tabulation tells us that among the 5 families who do not prefer going to health center, there is one impoverished family, 3 poor families and one family who is above average. VII. DEDUCTION AND RECOMMENDATION:
a. Illiteracy rate among women remains high though many years of development effort made by either government or NGO community. It is recommended that government and NGO community should put more emphasis on informal education such literacy class so that women as well as men will benefit from this.
b. Poverty still prevails among the rural community even with the fact that government as well as
NGO community has been placing more focus on poverty eradication. Given to this survey, we would recommend that more effort should be made to ensure that people can emerge from poverty line.
c. Most people still rely mainly on subsistence cultivation for supporting their family. They base
their survival strategies on agriculture even with the fact that it is not applicable during dry season due to poor irrigation system. Regarding to this, one need to drastically improve irrigation systems and embark on activities leading to the improvement of agricultural production.
d. Girls usually greatly contribute to improve the family living standard. We found out the more
daughters the family has the better the family living standard is. Girls can more easily find job, e.g. factories, to ensure additional income than boys.
e. People generally seem to have a good understanding over diarrhea issues. They know how to
keep or preserve food properly. Anyhow, some families still remain with a sub-standard understanding about this issue. Those families might be facing serious and constant problem regarding diarrhea or food contamination related diseases. A little bit more effort is needed to ensure that as many people as possible understand more about this preventable illness.
f. Boreholes and ponds remain the main sources of drinking water for the community although
water might not be available during dry season. Moreover, failure to boil pond water prior to drink it will post a great vulnerability to diarrhea and other waterborne diseases since the pond is usually used for many purposes such as cleaning cows/ox, irrigating garden, bathing and washing up clothes. Given to this analysis, we recommended that health workers should stress more on the proper and restricted usage of pond water. Also to ensure that common pond will be able to supply water during dry season, some ponds need to be renovated or deepened.
g. In total, there are only 58% of interviewees who report to regularly drink boiled water whilst
another 42% just erratically consume boiled water. This statistic is worrying. People seem to have fragmented understanding on safe water usage leading to bad practice. Education should better stress on the importance of clean water and make people aware of the consequences of unsafe water use .
Enfants&Développement December 2002
44
h. When interviewers checked the water jars at interviewees’ houses, they found that 51.8% of water jars have no lids or ABATE, larvicide which is normally supplied14 two/three times a year by the Ministry of Health and the Cambodian Red Cross. This also should be an area of concern for health workers because the absence of lids or ABATE could be a conductive condition for dengue mosquitoes to breed and outbreak to occur. Health workers should make sure that lids' usage is promoted and ABATE adequately and freely supplied to community. More awareness raising on dengue fever is needed to prevent children from such a potential lethal disease.
i. Children, health center staff, teachers, and village health volunteer seem to play an active and
effective role in disseminating health messages toward community. However, children and health center staff are the most active agents in spreading health messages to target beneficiaries such as children, classmate, families, and community people as a whole. Child-to-Child approach should be preceded in other catchment areas since it is effective and efficiency.
j. We can confidently assume that most of the interviewees are quite aware of dental hygiene
because 91.1% of cases have heard about it; 94.6% are regularly brushing their teeth with toothpaste; and last but not least 89.3% of cases are brushing teeth correctly. The minimal number of person who does not yet clearly understand or practice oral care should be targeted on during the next education session organized at village level.
k. According to the above tables, most of the people interviewed comprehend fever issue. 91.1%
acknowledge fever as dangerous for children; 70.5% realize that fever could lead to death and 74.1% grasp that they must take children to health center when they got fever.
l. General hygiene should not be a matter of concern according to the findings. Most of the
interviewees know how to keep themselves healthy and actually, it has been noticed during the interview that they are clean in terms of body hygiene, clothes and household environment. They usually bath with soap, and more than that, they usually wash their belongings once a week. In addition, the sanitation status in the target villages is far better than in the past. This shows a great success of our health program including Child-to-Child approach.
m. We noticed that some people still lack understanding regarding Child Right issues. For
instance, only 67% mentioned correctly that children are those under the age of 18; 16.1% said that children do not have rights like adults; only 44.6% have accurately replied that there are 4 baskets of child rights, namely right to survival, to development, to participation, and to protection. Peer education on child right issues should be widely introduced into the target villages to raise people and children’s awareness of child rights.
n. 76.8% mentioned correctly the 6 preventable diseases, namely TB, Polio, Tetanus, Measles,
Diphtheria, and Whooping cough; 95.5% said that children should have completed their vaccination before 2 years of age15; 86.6% replied there would be problems if children are not properly vaccinated against these diseases. This illustrates that most of the interviewees are quite aware of EPI issues, although understanding can be better improved. For instance, some said children can be vaccinated at any time possible; others mentioned there will be no problems even if children are not properly vaccinated; surprisingly, 4.5% reported to have never been told about EPI. This is a small but sensitive gap in which we need to make sure that these people will change their attitude toward EPI issues.
o. Surprisingly, through the survey results, we found out that most of the interviewees are aware
of the nutrition issues. 72.3% of interviewees have correctly mentioned the 3 groups of food,
14 ABATE is an expensive chemical for a rural Cambodian family 15 The national policy however preconises that children should be fully immunised by the age of 9 month, after receiving the measles vaccination
Enfants&Développement December 2002
45

which are protection, building, and energy foods; 86.6% are also aware that fruits and vegetable are related to protection; Most of them give vegetable and meat/fish to their children almost everyday. Children and health center staff have greatly contributed to the understanding of people about this issue. It is necessary that we put more focus on strengthening their capacity so that they would be able to do more to help people comprehend nutrition issues.
p. Fever and dengue fever are the most common diseases quoted in target villages whilst
HIV/AIDS ranges third followed by diarrhea. Though 95.5% of the cases prefer health center services, 4.5% other said that they do not like visiting health center because it is more expensive, far away from the community, and the services and quality are not good enough. However, well-off families prefer to visit private clinics or medical practitioners exercising in the villages. The result of cross-tabulation tells us that among the 5 families who do not prefer going to health center, there is one impoverished family, 3 poor families and one family who is above average. This means health center services are not yet fully accessible for the poor and vulnerable people. Given to this situation, government and NGO community need to improve health center services and quality. Further, they need to make sure poor people can offer proper and affordable health services.
Enfants&Développement December 2002
46

VIII. APPENDIX: Questionnaire:
Save the Children France Bati Primary Health Care Project
Small assessment on PHC knowledge and practice
Set off time: .............................. Ending time: ..............................
Note: All notes for interviewers are written in italic form. Therefore, please read quietly and try to remember. a. Please make sure that permission is given prior to the commence of interviewing b. Read the question but do not read the answers c. Please select the best-match answer(s) given below the question according the reply made by interviewee. d. This questionnaire is to be asked a mother whose child(ren) is currently in grade 4-5 e. Please ensure the interviewee over the confidentiality of the given information. f. Please circle all the best-match answer(s)
Section I: General information i.a. Name of village? (Single answer) 1. Trapang Srorng 9. Trapang Veng 17. Veang 2.Trapang Por 10. Doeum Chlork 18. Teuk Ambol 3. Trapang Ampil 11. Krang Thlong 19. Trapang Trea 4. Trapang katron 12. Char 20. Trapang Chhork 5. Chaun Nlourk Dei 13. Thmey 21. Kok Tareav 6. Kandal 14. Khay 22. Trapang Knar 7. Dork Por 15. Vay Chnas 23. Ro Veang 8. Trapang Srorng 16. Krang Leav 24. Prey Chhol i.b. Name of school whose children attend? (Single answer) 1. Phnom Chiso 2. Om Sophat 3. Prasat Nang Khaov 4. Slaroum i.c. Interviewee’s name: ........................................... i.d. Age: .................. i.e. Educational background? (Single answer)
1. never attend school 2. primary school (1-6) 3. secondary school (7-9) 4. high school (10-12)
Enfants&Développement December 2002
47

5. university (above 12) i.f. Family status: (Single answer) please observes and tick!
1. impoverish 2. poor 3. average 4. above average 5. rich
i.g. Main source of family income? (Single answer)
1. farming 2. garment factory working 3. brick factory working 4. making business 5. animal feeding 6. poultry and/or fish raising 7. civil servant 8. police/military 9. cottage industry 10. palm sugar producing 11. construction worker 12. casual labor performing 13. wood cutting 14. fishing 98. others
i.h. Number of children in burden: ....................... i.i. Number of daughter in the burden: .................. Section II: Diarrhea understanding and practise: ii.a. How your food is kept? (Multiple answers are possible)
1. in a cupboard 2. under a covered container 3. covered by dish 4. hang in a safe place 5. keep on bed without covering 6. keep wherever possible (unsafe) 98. others (specify)................................................................................ 99. do not know
ii.b. Do you know the causes of diarrhea?
0. no (if no, to ii.d) 1. yes
ii.c. If yes, what are the causes? (Multiple answers are possible)
1. eating raw vegetables 2. poisonous food 3. drinking raw water 4. defecate outside latrine 5. poor or improper cooking 6. wash hand improperly 7. eating uncovered food
Enfants&Développement December 2002
48

8. eating dirty food or vegetables 98. other (specify)................................................................................... 99. do not know
ii.d. How to prevent diarrhea? (Multiple responses are possible) 1. do not pass stool outside latrine 2. passing stool properly (dig and cover method; cover by ashes and the like) 3. consuming boiled water 4. cut shortly your nails 5. washing vegetable properly in advance 6. always keep food covered or protected 7. cooking suitably 8. washing hands with soap before every meal 9. washing hands with soap after defecating 98. other (specify) ................................................................................ 99. do not know
ii.e. How does diarrhea lead to death? (Multiple responses are possible)
1. too much dehydration 2. patient completely lost energy 98. Other (specify)................................................................................ 99. do not know
ii.f. What do you do when your child have diarrhea? (Multiple responses are possible)
1. offer more boiled water 2. take to health center 3. purchase medicine personally 4. give more food 5. give ORS 6. have him drink more coconut juice 7. reduce number of diet 8. do not need to care 9. taken to traditional healer 98. other (specify).................................................................................. 99. do not know
ii.g. What is the main source of water your family use for drinking? (Single response)
1. open well water 2. pumping well water 3. rain water 4. pond water 5. lake water 6. canal/river water 7. pure drinking water 98. other (specify)..................................................................................
ii.h. Does your family drink boiled water? (Single response)
0. no 1. yes 2. sometime
ii.i. Check water jar if there is any lid or ABATE? (Single response)
0. no 1. yes
Enfants&Développement December 2002
49
2. some have some not ii.j. Have you or your spouse attended any dissemination on diarrhea issue?
0. no 1. yes
ii.k Are you or your spouse told about diarrhea issues? (Single response)
0. no (if no to section III) 1. yes 99. do not know (if don’t know to section III)
ii.l. If yes, who told you or your spouse about that? (Multiple answers are possible)
1. children 2. VHV 3. HC staff 4. SCF staff 5. school teacher 6. neighbors 98. other (specify) .....................................................................
Section III: Oral and Dental Care iii.a. Have you or any of your family members ever heard about dental care?
0. no 1. yes
iii.b. How do you or your family members brush teeth? (Single answer)
1. using finger as a brush 2. using only a brush 3. utilizing brush with toothpaste 4. never brush teeth 98. other (specify) ....................................................................
iii.c. How many member are there in your family? .................................... iii.d. How many brushes are being available in your family?...................... iii.e. Averagely, how many time does each individual member of your family brush a day? ........ iii.f. Had you ever attended any dental care dissemination?
0. no (if no, to section IV) 1. yes
iii.g If yes, who did you know from? (Multiple answers are possible)
1. children 2. VHV 3. HC staff 4. SCF staff 5. school teacher 6. neighbors 98. other (specify) .....................................................................
Section IV: Dengue Hemorrhagic Fever (DHF) iv.a. Do you know what DHF is? (Single answer)
Enfants&Développement December 2002
50

1. a disease that could lead to child’s death 2. contentious disease spread by dengue mosquito 3. a simple and not serious disease 4. an incurable illness 5. Curable illness 98. others (specify) ................................................................... 99. do not know (if don’t know to iv.c)
iv.b. Who have told you about this? (Multiple answers are possible)
1. children 2. VHV 3. HC staff 4. SCF staff 5. school teacher 6. neighbors 98. other (specify) .....................................................................
iv.c. What is the cause of DHF? (Single answer) 1. insect bite
2. dengue mosquito bite 98. other (specify) ..................................................................... 99. do not know
iv.d. Can it be cured? (Single answer)
0. no 1. yes 99. do not know
iv.e. How do you and your family sleep? (Single answer) 1. always inside the bed
2. sometime in bed sometime not 3. never use bed 98. other (specify) ..............................................................................
iv.f. What do you always do when your child have DHF? (Single answer)
1. take to health center 2. take to hospital 3. take to private clinic 4. take to traditional healer 5. purchase medicine personally 6. just not care 98. other (specify).................................................... 99. do not know
iv.g. Please check house and yard if it is: (Single response)
0. bad 1. normal 2. good 3. very good
iv.h. How to prevent your child from this disease? (Multiple answers are possible)
1. always sleep in bed 2. always keep water jar clean 3. put ABATE in very water jar 4. bury or burn all wastes which can enable mosquito to breed
Enfants&Développement December 2002
51
5. keep house and yard clean 6. keep children away from dark place 98. others (specify) ......................................................................... 99. do not know
iv.i. What have your family been doing to prevent this disease? (Multiple answers are possible)
1. always sleep in bed 2. always keep water jar clean 3. put ABATE in very water jar 4. bury or burn all wastes which can enable mosquito to breed 5. keep house and yard clean 6. keep children away from dark place 98. others (specify) ......................................................................... 99. do not know
Section V: Fever v.a. Is fever dangerous to children? (Single response)
0. no (if no to v.c) 1. yes 99. do not know (if don’t know to v.c)
v.b. If yes, how dangerous is it? (Single answer) 1. convulsion then lead to death
2. Brain damage leading to mental problem 98. other (specify) ............................................................................... 99. do not know
v.c. What will you do if your child caught fever? (Multiple answers are possible)
1. cover with blanket 2. have the child naked and cover with wet Krama 3. Expose the child to the electric fan 4. let the child drink lot of water 5. take the child to health center or hospital 6. take the child to traditional healer 98. other (specify) ................................................................................. 99. do not know
v.d. Have you ever been told about fever?
0. no (if no to section VI) 1. yes
v.e. If yes, who have told you? (Multiple answers are possible)
1. children 2. VHV 3. HC staff 4. SCF staff 5. school teacher 6. neighbors 98. other (specify) .....................................................................
Section VI: Clean/safe water vi.a. What is the best water source, you think? (Single answer)
Enfants&Développement December 2002
52
1. pumping well 2. open well 3. rain water 4. boiled water 5. clear water 6. channel water 7. pond water 8. river or lake water 98. other (specify) .................................................................................................. 99. do not know
vi.b. What will happen if we drink unhealthy water? (Multiple answers are possible)
1. get diarrhea 2. get fever 3. get typhoid 4. have worms or parasite 5. get sick 98. other (specify) ................................................................................................. 99. do not know
vi.c. Have you ever been told about clean and safe water?
0. no (if no, to section VII) 1. yes
vi.d. If yes, who have told you? (Multiple answers are possible)
1. children 2. VHV 3. HC staff 4. SCF staff 5. school teacher 6. neighbors 98. other (specify) .....................................................................
Section VII: Personal hygiene vii.a How to keep your self healthy? (Multiple answers are possible)
1. brush or wash hair with soap or shampoo 2. wash and dry clothes regularly 3. cutting nail shortly 4. cutting hair shortly 5. brush teeth with toothpaste after meal 6. always keep yourself clean 7. always keep the house clean 8. eat and drink healthily 9. always keep household items clean 98. other (specify) ....................................................................... 99. do not know
vii.b. Please check whether: (Multiple answers are possible)
1. short hair 2. short nail 3. clothes are clean 4. white and healthy teeth 5. house are clean 6. household items are clean 7. blanket, pillow, mate, net, and bed are clean
Enfants&Développement December 2002
53

98. other stuffs notified (specify)................................................................... vii.c. Averagely, how many times does each member of your family bath a day? .............. vii.d. Averagely, how many times does each member of your family bath with soap or detergence a day? ........................... vii.e. How often do you wash sleeping materials such as: mate, net, pillow cloths, blanket? (Single answer)
1. once a week 2. once for every fortnight 3. once a month 4. once a quarter 5. other (specify)..............................................................................................
vii.f. Have you ever been told about sanitation issues?
0. no (if no, to section VIII) 1. yes
vii.g. If yes, by who? (Multiple answers are possible)
1. children 2. VHV 3. HC staff 4. SCF staff 5. school teacher 6. neighbors 98. other (specify) .....................................................................
vii.h. What do you think about the overall sanitation issues in your entire village? (Single answer)
1. still very poor 2. remain the same 3. better now 99. do not know
Section VIII: Children’s Right Awareness viii.a. What is a child? (Single answer)
1. any individual under 18 2. those who still need support and care from parents 3. those who earn money for the family 4. those who need to go to school 5. the one who need more protection from adult 6. the one who need to be looked after closely 98. other (specify) ........................................................................ 99. do not know
viii.b. Do children have right as adult? (Single answer)
0. no 1. yes 2. do not know
viii.c. How many baskets of right the child have?
1. ............................. 99. do not know (if don’t know to viii.e)
Enfants&Développement December 2002
54

viii.d. What are they? (Multiple answers are possible)
1. right to survival 2. right to protection 3. right to development 4. right to participation 98. other (specify) ........................................................................................... 99. do not know
viii.e. Have you ever attended any child right dissemination?
0. no (if no, to section IX) 1. yes
viii.f. If yes, by who? (Multiple answers are possible)
1. children 2. SCF staff 2. school teacher 3. neighbors 4. VDC/CDC 5. village leaders 98. other (specify) .....................................................................
Section IX: EPI ix.a. How many child preventable diseases? ........................................ ix.b. What are they? (Multiple answers are possible)
1. Tuberculosis 2. Polio 3. Tetanus 4. German Measles 5. Diphtheria 6. Whooping Cough 98. other (specify) .................................................................... 99. do not know
ix.c. What is the best time for having a child vaccinated? (Single answer)
1. at birth 2. one month after birth 3. when a child start working 4. before the age of 2 years 5. at any time 98. other (specify) ................................................................... 99. do not know
ix.d. Is it normal not to vaccinate a child against these preventable diseases? (Single answer)
0. no 1. yes 99. do not know
ix.e. Have you ever been told to vaccinate your child?
0. no (if no, to section X) 1. yes
Enfants&Développement December 2002
55

ix.f. If yes, by who? (Multiple answers are possible)
1. children 2. VHV 3. HC staff 4. SCF staff 5. school teacher 6. neighbors 98. other (specify) .....................................................................
Section X: Nutrition x.a. How many groups of food? .............................. x.b. What are they? (Multiple answers are possible)
1. building food 2. energy food 3. protect food 4. Vit-A rich food 5. Protein food 98. other (specify) ................................................................................ 99. do not know
x.c. What constitute protection food? (Single answer)
1. vegetables 2. fruits 3. meat 4. grains 98. others (specify) ............................................................................. 99. do not know
x.d. How often do you give meat to your child? (Single answer)
1. every day 2. 2-3 times 3. once a week 4. once for a fortnight 5. once a month 98. other (specify) ..............................................................................
x.e. How often do you offer vegetables to your child? (Single answer)
1. every day 2. 2-3 times 3. once a week 4. once for a fortnight 5. once a month 98. other (specify) ..............................................................................
x.f. Have you ever been told about nutrition?
0. no (if no, to section XI) 1. yes
x.g. If yes, by who? (Multiple answers are possible)
1. children 2. VHV
Enfants&Développement December 2002
56

3. HC staff 4. SCF staff 5. school teacher 6. neighbors 98. other (specify) .....................................................................
Section XI: General understanding and practices xi.a. What is the most common disease in your village? (Single answer)
1. AIDS/HIV 2. Fever 3. DHF 4. Cough 5. Typhoid 6. Diarrhea 7. TB 8. Cholera 9. Chickenpox 10. Night blindness 98. other (specify) ........................................................................ 99. do not know
xi.b. In your village, do people like to go health center or not when there is disease? (Single answer)
0. no (if no, to xi.d) 1. yes 99. do not know (if don’t know to xi.d)
xi.c. If no, what are the rationales behind that? (Multiple answers are possible) 1. too far
2. expensive 3. poor service and quality 4. there is private clinic in the village 5. there are traditional healers in the village 6. people prefer home treatment 98. other (specify)......................................................................... 99. do not know
xi.d. Do you have any comment/suggestion/idea or any things to tell us? ................................................................................................................................................................................................................................................................................................................................................................................................................................................ Thank very much for your time with us. All the given information will be kept confidential. Cross checker’s name:.......................................
Interviewer’s name:........................................
Signature: ..........................................................
Signature: .......................................................
Date: ................................................................
Date: ......................................................
Enfants&Développement December 2002
57

Enfants&Développement December 2002
58