of boundary layer heights on short spatial and temporal ... surface and airborne vertical profilers...
TRANSCRIPT
Determination of Planetary Boundary Layer Heights on Short Spatial and Temporal Scales
from Surface and Airborne Vertical Profilers during DISCOVER‐AQ
Ruben Delgado1, Timothy Berkoff1,9, Jaime S. Compton2, Alexandra St Pé3, Barry Baker2, Raymond M. Hoff1, 2, Douglas K Martins4, Anne M. Thompson4, Eun‐Su Yang5,
Sundar A Christopher5, Everette Joseph6, Maria Tzortziou7,9, Laura Landry8, Michael Woodman8, Simone Lolli9, Andrew J. Weinheimer10, Denise D. Montzka10, David J. Knapp10,
Richard A. Ferrare11, Chris A Hostetler11, James Crawford11
1Joint Center for Earth Systems Technology, 2Physics, 3Geography and Environmental Systems,University of Maryland, Baltimore County,
4Pennsylvania State University, 5Earth System Science Center, University of Alabama in Huntsville6Howard University, 7Earth System Science Interdisciplinary Center, University of Maryland,
8Maryland Department of the Environment, 9NASA Goddard Space Flight Center,10National Center for Atmospheric Research, 11NASA Langley Research Center
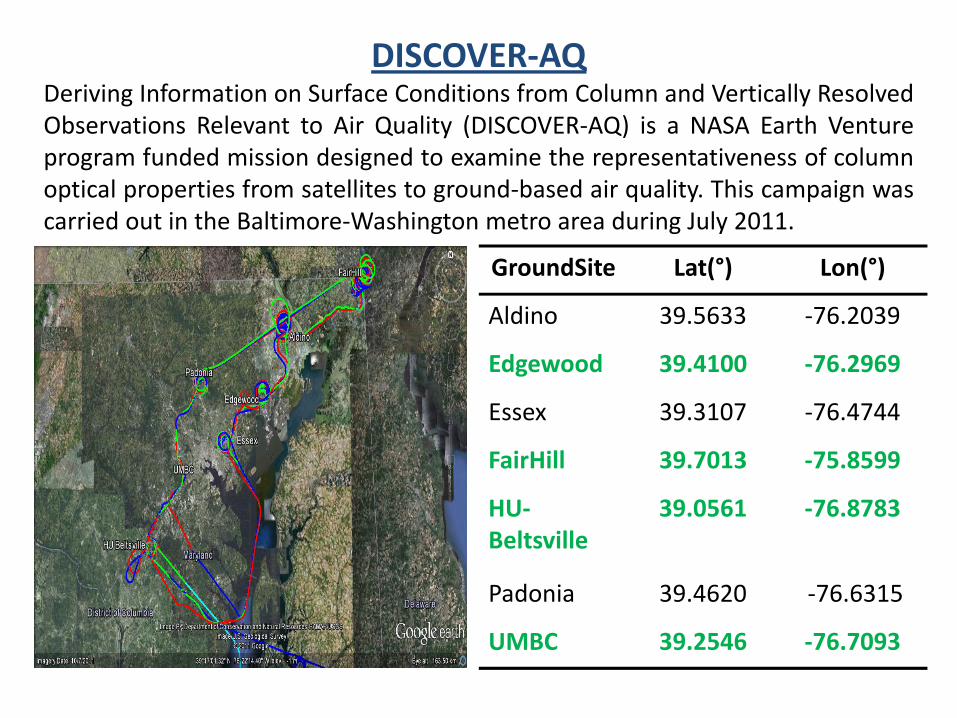
DISCOVER‐AQDeriving Information on Surface Conditions from Column and Vertically ResolvedObservations Relevant to Air Quality (DISCOVER‐AQ) is a NASA Earth Ventureprogram funded mission designed to examine the representativeness of columnoptical properties from satellites to ground‐based air quality. This campaign wascarried out in the Baltimore‐Washington metro area during July 2011.
GroundSite Lat(°) Lon(°)
Aldino 39.5633 ‐76.2039
Edgewood 39.4100 ‐76.2969
Essex 39.3107 ‐76.4744
FairHill 39.7013 ‐75.8599
HU‐Beltsville
39.0561 ‐76.8783
Padonia 39.4620 ‐76.6315
UMBC 39.2546 ‐76.7093

Determination of PBLH
• Comparison of multi‐platforms/methods:
– Radiosondes: Potential Temperature Inversion
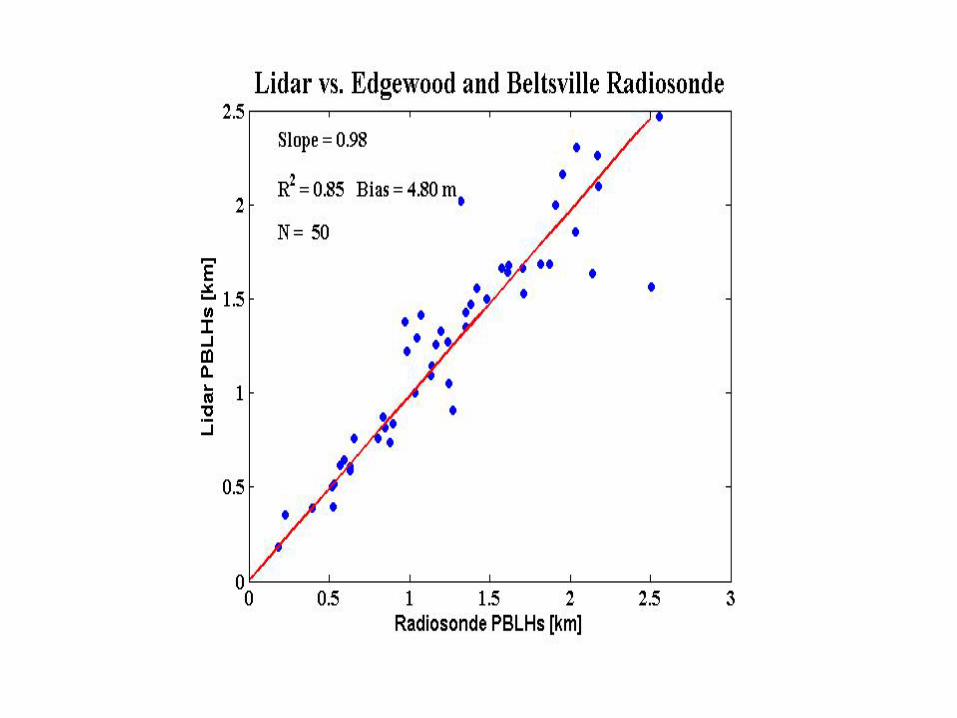
– Lidar: Haar Covariance Wavelet Transform in Aerosol Backscatter
– Wind Profiler: Haar Covariance Wavelet Transform in the SNR
Compton et al.:
“Determining Planetary Boundary Layer Heights with Ground‐based Lidar and Wind profiler on Short Spatial and Temporal Scales”

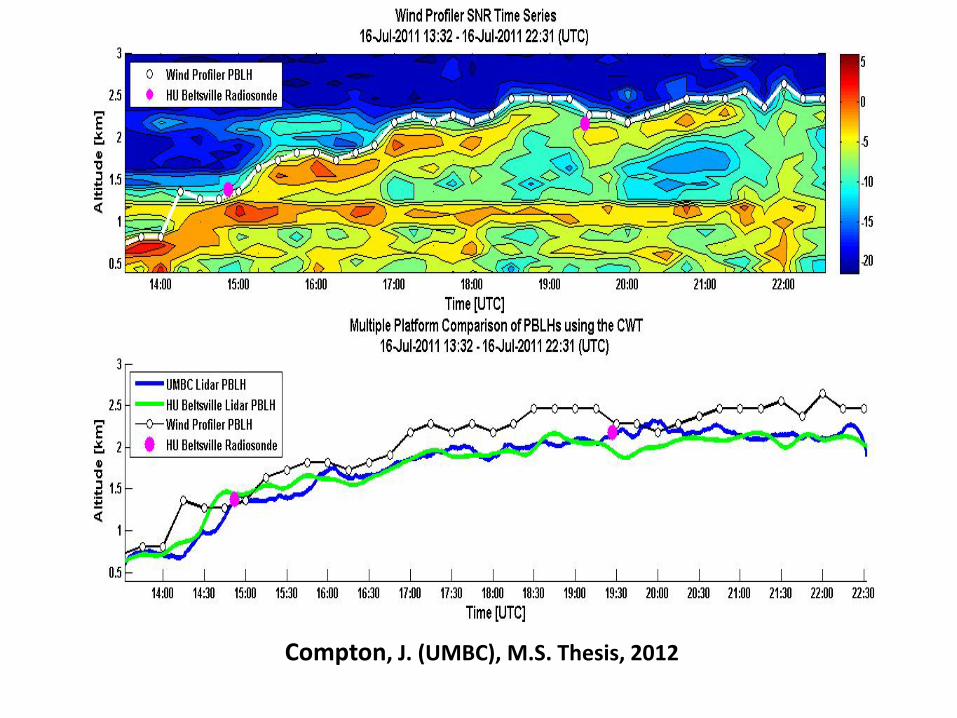
Compton, J. (UMBC), M.S. Thesis, 2012

Daily PBLH Variability
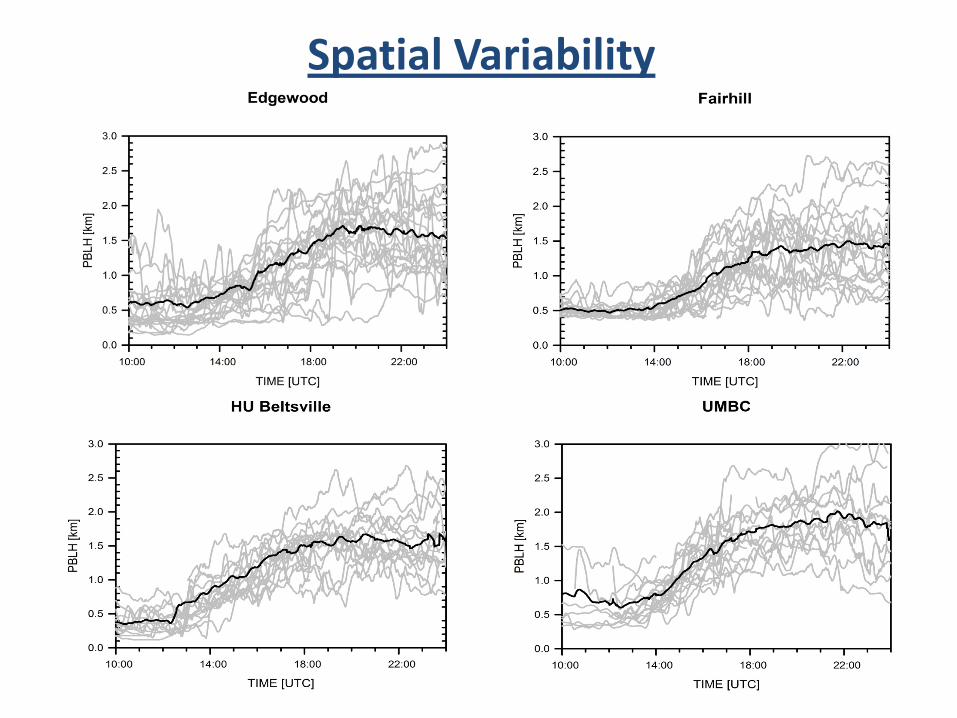
Spatial Variability
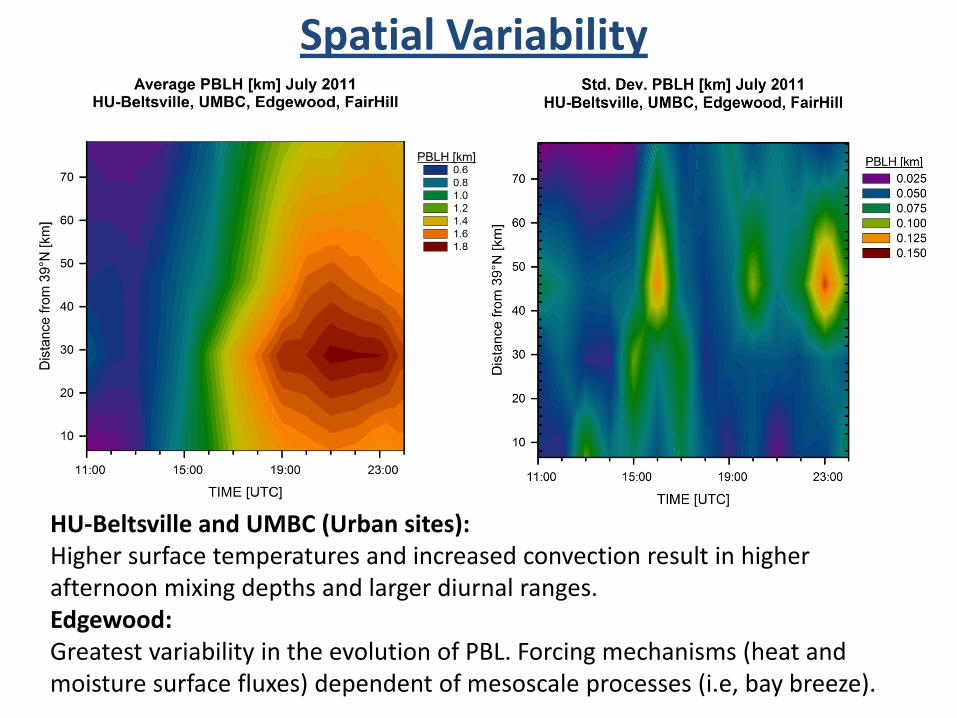
Spatial Variability
HU‐Beltsville and UMBC (Urban sites): Higher surface temperatures and increased convection result in higher afternoon mixing depths and larger diurnal ranges.Edgewood:Greatest variability in the evolution of PBL. Forcing mechanisms (heat and moisture surface fluxes) dependent of mesoscale processes (i.e, bay breeze).
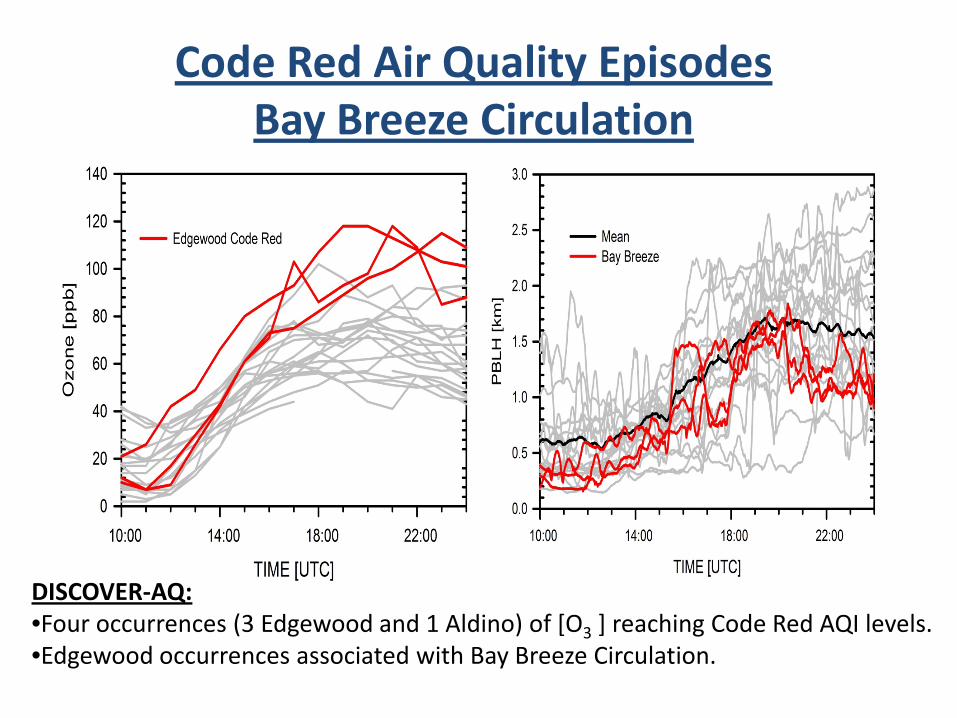
Code Red Air Quality EpisodesBay Breeze Circulation
DISCOVER‐AQ:•Four occurrences (3 Edgewood and 1 Aldino) of [O3 ] reaching Code Red AQI levels.•Edgewood occurrences associated with Bay Breeze Circulation.
More on this topic on tonight poster session:
• Ryan Stauffer:Bay Breeze Impact on Surface Ozone at Edgewood, MD.
• Rich Clark:Air Chemistry Interactions with Mesoscale Sea‐Breeze and Outflow Boundaries in the Edgewood, MD Area.
• Chris Loughner:Evaluation of CMAQ boundary layer processes and air quality over the Chesapeake Bay and Maryland .
Ventilation Coefficients
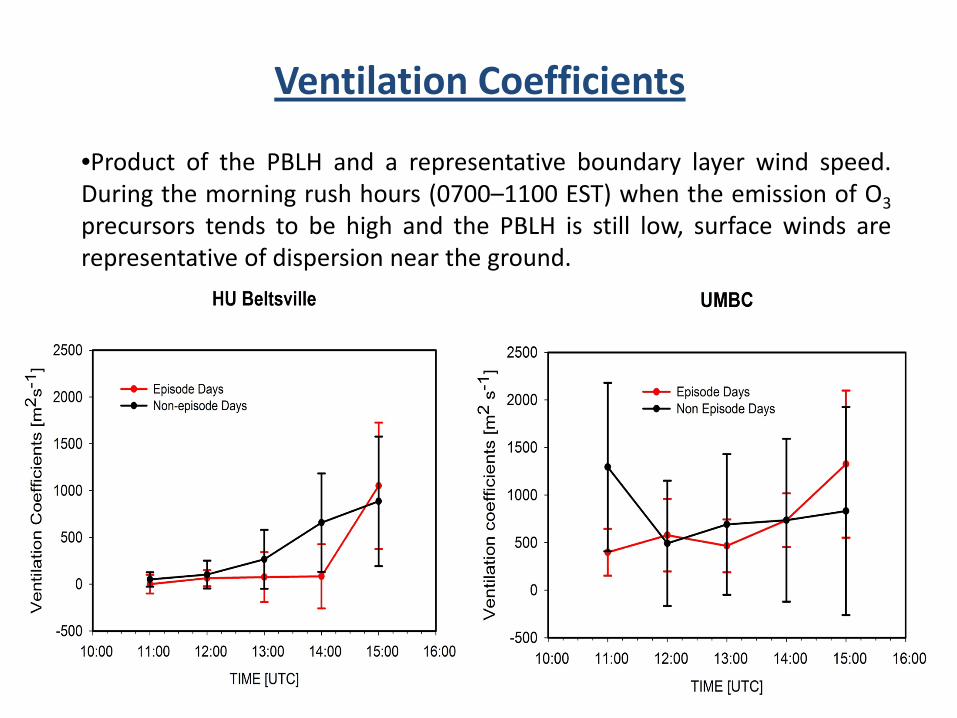
•Product of the PBLH and a representative boundary layer wind speed.During the morning rush hours (0700–1100 EST) when the emission of O3precursors tends to be high and the PBLH is still low, surface winds arerepresentative of dispersion near the ground.
Ventilation Coefficients
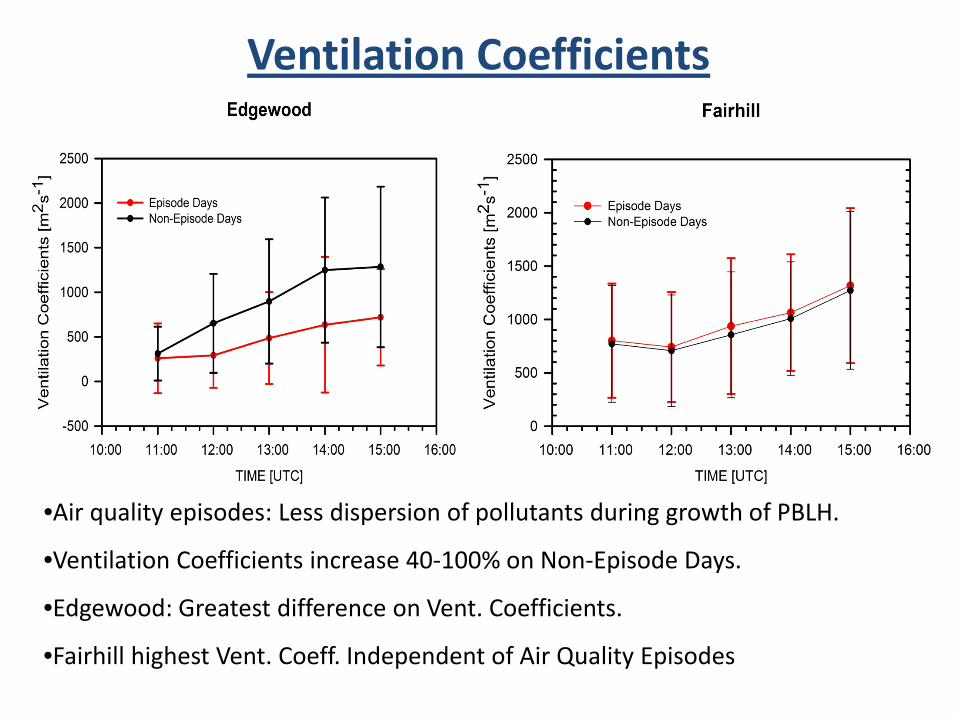
•Air quality episodes: Less dispersion of pollutants during growth of PBLH.
•Ventilation Coefficients increase 40‐100% on Non‐Episode Days.
•Edgewood: Greatest difference on Vent. Coefficients.
•Fairhill highest Vent. Coeff. Independent of Air Quality Episodes

Summary
• Lidar reliable tool for precise monitoring of the daytime development of the PBLH. Dataset would allow proper evaluation of model PBL schemes (assimilation).
• PBLH temporal (hourly/daily) variability within all locations due to synoptic and mesoscale processes.
• Ventilation coefficients increase rapidly after 14:00 UTC and are about 45% greater in non‐episode days dispersing pollutants. Stagnation and shallow PBL on air quality episodes.
• The close proximity of Edgewood and Baltimore to the Chesapeake Bay allows to study possible mechanisms that may control the planetary boundary layer under the marine air incursion and affect the local air quality.
Work in progress• Upcoming releases (PBLH datasets):
‐Lidar latest revision‐next week.‐Vaisala CL51 PBLH‐next week.‐Wind profiler (April‐May 2012).
• Formation of Thermal Internal Boundary Layer (TIBL) and its role in Mid‐Atlantic air quality events.
• Airborne‐Ground‐Model PBL intercomparison.
ACKNOWLEDGEMENTS:Maryland Dept. of the Environment
(Contract # U00P7201032)NOAA CCNY Foundation CREST (Contract # NA06OAR4810162)
DISCOVER‐AQ(NASA Grant: NNX10AR38G)
SigmaSpaceLeosphere
*The statements contained within the manuscript are not the opinions of thefunding agency or the U.S. government, but reflect the author’s opinions.
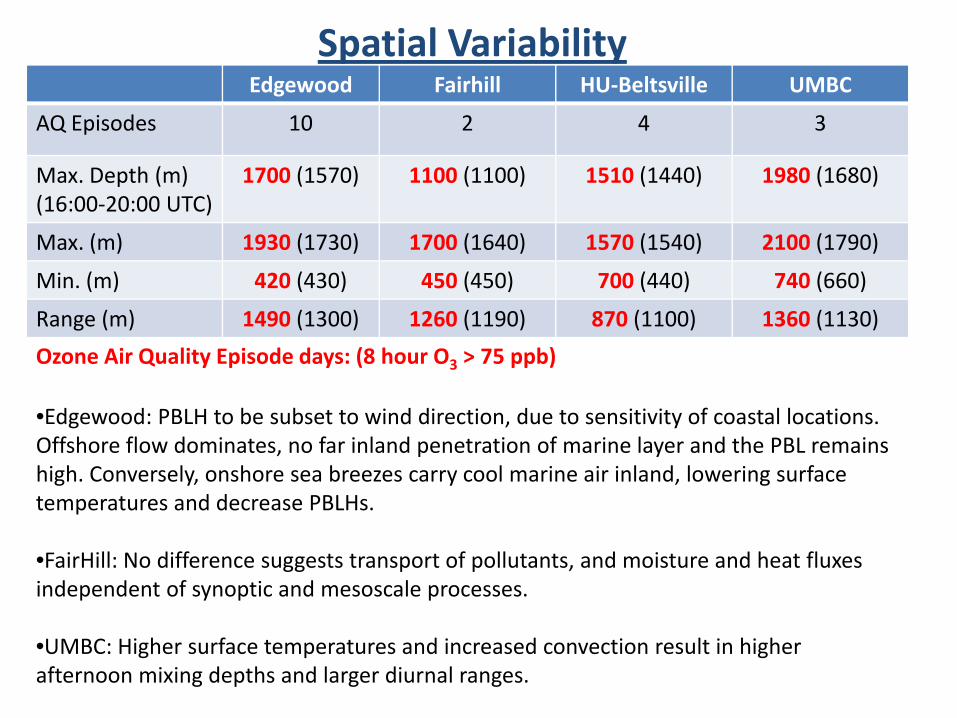
Spatial VariabilityEdgewood Fairhill HU‐Beltsville UMBC
AQ Episodes 10 2 4 3
Max. Depth (m)(16:00‐20:00 UTC)
1700 (1570) 1100 (1100) 1510 (1440) 1980 (1680)
Max. (m) 1930 (1730) 1700 (1640) 1570 (1540) 2100 (1790)
Min. (m) 420 (430) 450 (450) 700 (440) 740 (660)
Range (m) 1490 (1300) 1260 (1190) 870 (1100) 1360 (1130)
Ozone Air Quality Episode days: (8 hour O3 > 75 ppb)
•Edgewood: PBLH to be subset to wind direction, due to sensitivity of coastal locations. Offshore flow dominates, no far inland penetration of marine layer and the PBL remains high. Conversely, onshore sea breezes carry cool marine air inland, lowering surface temperatures and decrease PBLHs.
•FairHill: No difference suggests transport of pollutants, and moisture and heat fluxes independent of synoptic and mesoscale processes.
•UMBC: Higher surface temperatures and increased convection result in higher afternoon mixing depths and larger diurnal ranges.
Planetary Boundary Layer
•The planetary boundary layer height (PBLH) is an importantmeteorological parameter that affects near‐surface atmosphericpollutant concentrations since it determines the volume of air intowhich pollutants and their precursors are emitted.
•This height is also important in determining the relationshipbetween column measures of gases and aerosols and theconcentration measured at the surface, since pollutants arefrequently contained within the PBL.
•Diagnostic variable atmospheric transport and dispersionforecasting models. Without realistic PBLH, models have largeerrors that result in inadequate public protection againstunhealthy air quality.
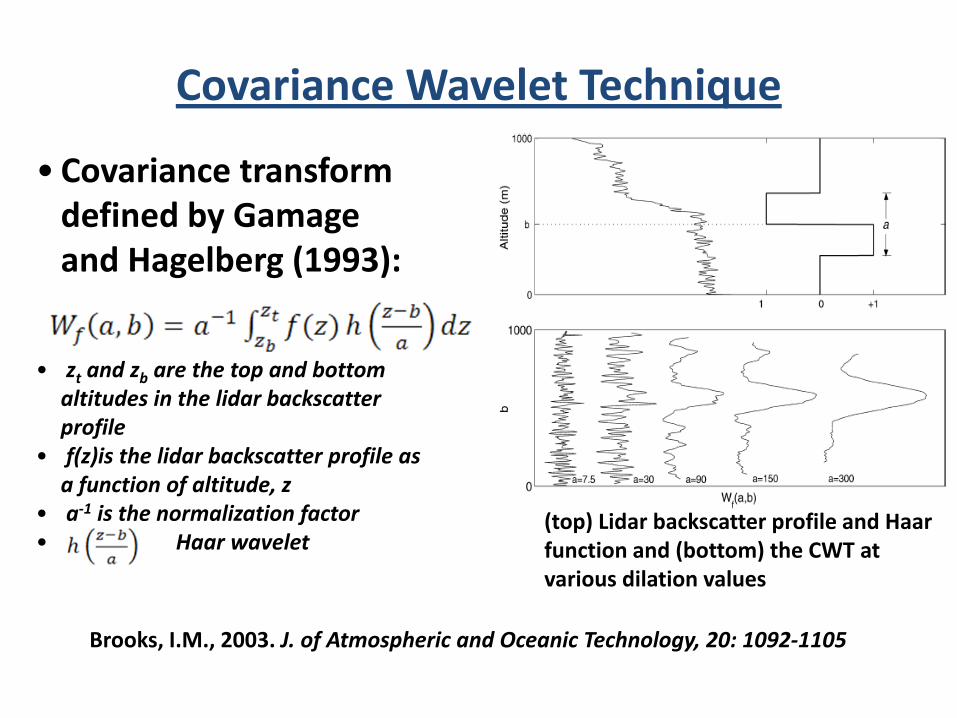
Brooks, I.M., 2003. J. of Atmospheric and Oceanic Technology, 20: 1092‐1105
• Covariance transform defined by Gamageand Hagelberg (1993):
• zt and zb are the top and bottom altitudes in the lidar backscatter profile
• f(z)is the lidar backscatter profile as a function of altitude, z
• a‐1 is the normalization factor• Haar wavelet
(top) Lidar backscatter profile and Haarfunction and (bottom) the CWT at various dilation values
Covariance Wavelet Technique
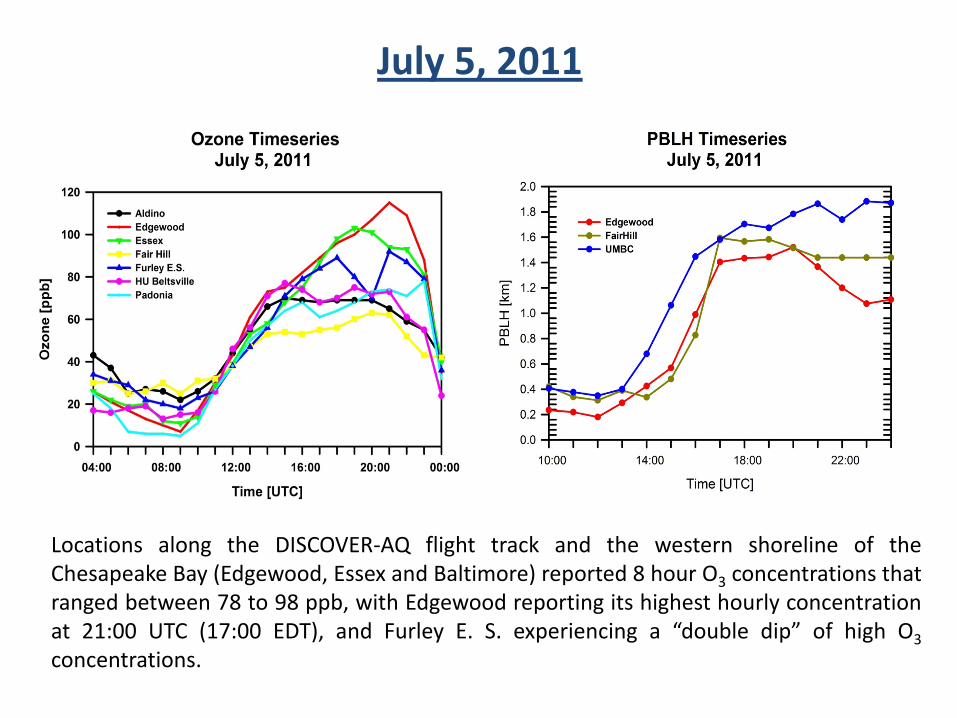
July 5, 2011
Locations along the DISCOVER‐AQ flight track and the western shoreline of theChesapeake Bay (Edgewood, Essex and Baltimore) reported 8 hour O3 concentrations thatranged between 78 to 98 ppb, with Edgewood reporting its highest hourly concentrationat 21:00 UTC (17:00 EDT), and Furley E. S. experiencing a “double dip” of high O3concentrations.
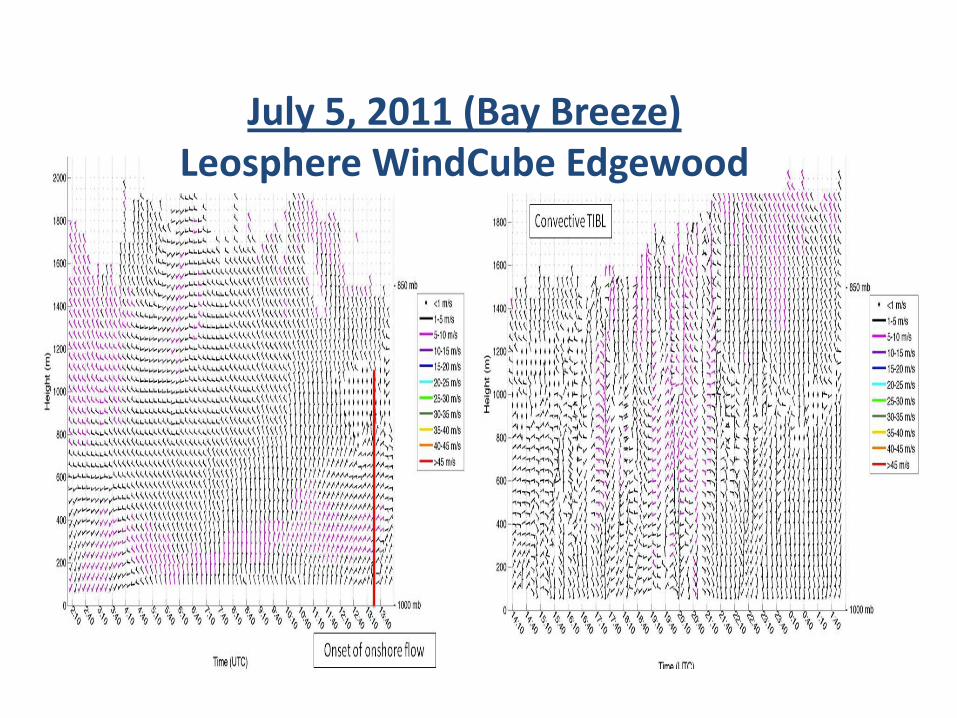
July 5, 2011 (Bay Breeze)Leosphere WindCube Edgewood
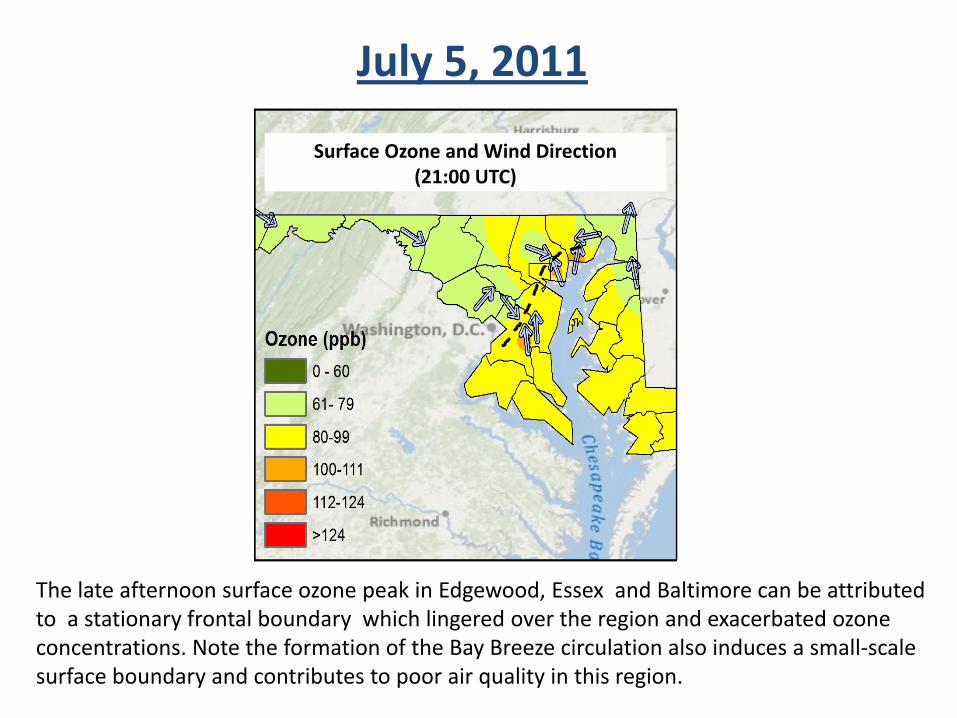
July 5, 2011
Surface Ozone and Wind Direction(21:00 UTC)
The late afternoon surface ozone peak in Edgewood, Essex and Baltimore can be attributed to a stationary frontal boundary which lingered over the region and exacerbated ozone concentrations. Note the formation of the Bay Breeze circulation also induces a small‐scale surface boundary and contributes to poor air quality in this region.
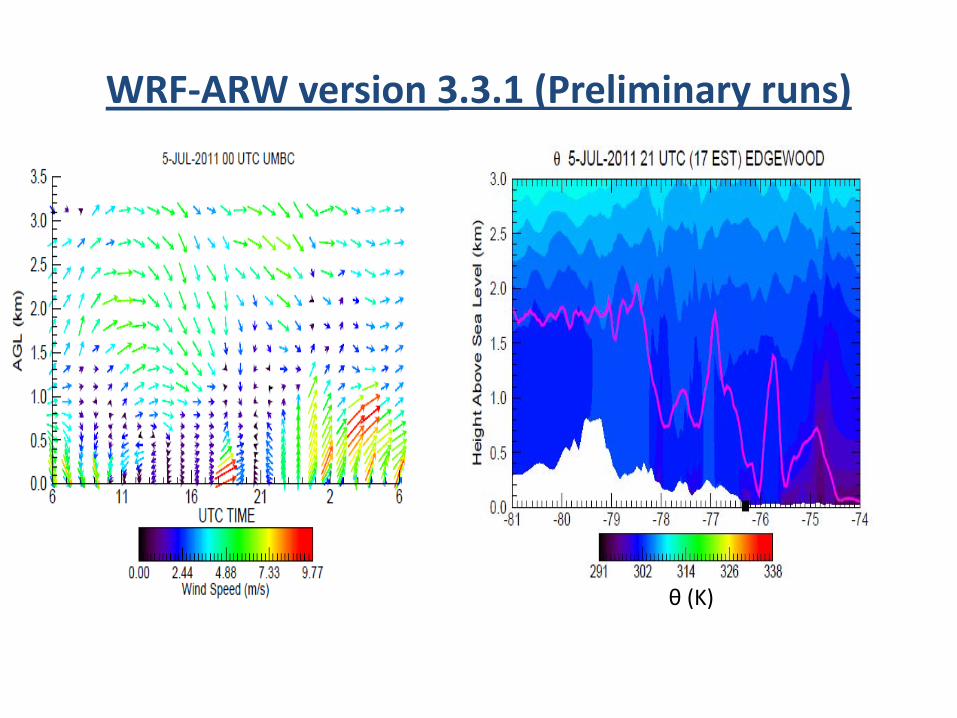
WRF‐ARW version 3.3.1 (Preliminary runs)
θ (K)