of birth outcomes by level of obstetric in finland: a ... · the final study population in the...
TRANSCRIPT

See discussions, stats, and author profiles for this publication at: https://www.researchgate.net/publication/15235581
Birth Outcomes by Level of Obstetric Care in Finland: A Catchment Area
Based Analysis
Article in Journal of Epidemiology & Community Health · September 1994
DOI: 10.1136/jech.48.4.400 · Source: PubMed
CITATIONS
44
3 authors, including:
Some of the authors of this publication are also working on these related projects:
Onko nuorten osallisuudesta koulussa koulupudokkuuden ehkäisijäksi? View project
The Nordic Obstetric Surveillance Study View project
Kirsi Viisainen
The Global Fund to Fight AIDS, Tuberculosis and Malaria
22 PUBLICATIONS 434 CITATIONS
SEE PROFILE
Mika Gissler
National Institute for Health and Welfare, Finland
615 PUBLICATIONS 13,564 CITATIONS
SEE PROFILE
All content following this page was uploaded by Mika Gissler on 10 January 2014.
The user has requested enhancement of the downloaded file.

4Journal of Epidemiology and Community Health 1994;48:400-405
Birth outcomes by level of obstetric care inFinland: a catchment area based analysis
Kirsi Viisainen, Mika Gissler, Elina Hemminki
AbstractStudy objective - To study whether hos-pitals of different levels are equally safeplaces to give birth in a regionalisedsystem of care.Design - This was a population based,cross sectional survey comparing birthoutcomes in nationwide catchment areasof different levels of hospital care. Allwomen and low risk women were ex-amined separately.Setting and subjects - The study popula-tion comprised all women who gavebirth in Finland in 1987-88. The datawere obtained from the Finnish MedicalRegistry, complemented by official data.Main results - No statistically significantdifferences were found in crude or birth-weight specific perinatal mortality ratesbetween the catchment areas, nor did theother outcomes studied favour tertiarycare compared with other levels of carein the area based analysis.Conclusions - In a regionalised system ofbirth care with a proper referral system,small local hospitals are as safe places togive birth as tertiary care hospitals.
(_J Epidemiol Community Health 1994;48:400-405)
Department of PublicHealth University ofHelsinki,Haartmaninkatu 3,00290 Helsinki,FinlandK ViisainenM GisslerE Hemminki
Correspondence to:Dr E Hemminki, Universityof Helsinki
Accepted for publicationDecember 1993
It has been argued that births should be movedaway from small primary level places of care
because these hospitals and maternity centresare unsafe places to give birth.' The questionof safety has been presented as an argument forclosing down small maternity hospitals in var-
ious countries and it has provoked numerous
studies about the relative safety of differentplaces of birth.'The safety of different levels of hospitals
has been examined in studies that compareperinatal outcomes between hospitals. Thesestudies seem to be quite uniform in theirconclusions about the benefits of tertiary care
hospitals with facilities for neonatal intensivecare for low and very low birthweightbabies.2-5 Yet, the benefits of tertiary levelbirth care for normal birthweight babies are
not so clear cut. Studies have indicated thatnormal birthweight babies either tend to dobetter in small primary level hospitals in regio-
4,6nalised systems of care, or as well as intertiary level care.57
Because of medical and self referral of highrisk cases to tertiary level care, hospitals can-
not be directly compared. All comparisons oflevels of hospital care have to deal with theproblem of patient selection, either by medi-cal, social, or geographical reasons or simply
because of women's preference. The mostcommon method for overcoming the selectionbias by medical referral has been to analyseoutcomes in relation to birthweight. Althoughthe use of birthweight specific perinatal mor-tality rates has potential biases,8 these rateshave been used in several studies as indicatorsof quality of birth and pregnancy care."7 Allpotential medical risks, however, cannot bedetected by birthweight alone. Other methodsfor overcoming selection bias are retrospectiverisk scoring9 and limiting the study populationto a low risk group only.'" In this study weused geographical catchment areas rather thanhospital patient populations as the primarybasis of analysis, in order to overcome theproblem of patient selection. In a regionalisedsystem this approach provides a means ofcomparing the performance of the maternitycare system in areas with different first choicelevels of care.
Finland has a regionalised system of obste-tric care. Antenatal care is given in special outof hospital maternity centres run by localmunicipalities. Care is given by public healthnurses and physicians, who are usually generalpractitioners. Suspected high risk pregnanciesare sent for specialist consultation in hospitalantenatal clinics." Virtually all deliveries takeplace in publicly financed hospitals. As a rule,hospitals have geographical catchment areasfor low risk births, although these sometimesoverlap. Thus, women are initially expected todeliver in the hospital within or closest to theirmunicipality, although no official booking isdone. Some municipalities have more than onehospital close by, which gives women the pos-sibility to choose according to preference.Travelling to another part of the country forbirth is rare. Detected high risk cases arereferred for birth to an appropriate level ofcare. This decision is usually made duringpregnancy but referrals during birth also oc-cur.At all levels, births are primarily supervised
by midwives but obstetricians are "in charge"in all other levels, except in community hos-pitals, in which general practitioners haveresponsibility.
All women have access to free antenatal care,and birth in a hospital is heavily subsidised. Asin other countries with regionalised care,several small primary level hospitals haveclosed down their maternity units in the pastdecades. The number of hospitals that providematernity care has fallen from 64 in 197612 to49 in 1991 (unpublished data - Finish MedicalBirth Registry).
400

Birth outcomes by level of obstetric care in Finland
MethodsThe study population comprised all womenwho gave birth in Finland in 1987-88(n = 123 065). Data on births were obtainedfrom the Finnish Medical Birth Registry,which is a computerised database of all birthsthat take place in Finland. These included thelocation of each birth, the place of residence ofthe mother, and the birthweight of all live andstillborn infants over 22 weeks of gestation orover 500 g in weight. This information wascomplemented by information about livebirths, still births, and neonatal deaths (under28 days of age) from the official data for 1987-88. In cases in which there was conflict aboutthe living status of the infant, official data wererelied on, and in cases in which the neonatedied in a hospital that was different to the onethat he or she had been born in, the deathswere attributed to the hospital of birth. Dataon mothers' education were obtained by arecord linkage to the National EducationRegistry. Educational data were only availablefor 1987. (For more details on the FinnishBirth Registry, see'3 4.) Details on the urban-ism of the municipalities was obtained frompublished statistics.'5
Finnish maternity hospitals (n = 53) wereclassified into four mutually exclusive levels ofcare using the official administrative levels as abasis. Information on staffing and equipmentof hospitals was obtained from unpublisheddata collected for a previous survey. 16 Theclassification of one community hospital and oftwo local hospitals was changed because theirstaffing, equipment, and volume of patientsresembled the next higher administrative levelof care more closely than their original classifi-cation. The classification of levels of care wasas follows (table 1).
LEVEL 1AThere were five community hospitals whichhad maternity care facilities for low risk preg-nancies. These facilities are situated in remoteareas and are generally run by general practi-tioners. One of them has a consultant obstetri-cian. There are no special care units forneonates.
LEVEL lBTwenty five of the hospitals were classified asprimary level hospitals. These were 24 localhospitals and one big community hospitalmaternity unit. These are obstetric units led bya consultant obstetrician with no teaching func-tion. These hospitals are equipped mainly for
Table I Characteristics of the maternity units in relation to level of care
Catchment area
Level 3 Level 2 Level lb Level la
No of hospitals 5 18 25 5Staff of maternity units include:
Obstetricians 5 18 25 1Specialising obstetricians 5 9 3 0Other physicians 0 4 10 5
Paediatrician available during delivery 5 18 15 0Average annual number of births per hospital, 3478 1505 614 1131987-88
normal healthy newborns but are able to stabi-lise the condition of sick infants for transport toanother centre. Some units have a paediatricdepartment, some do not. Some have a new-born special care unit for short term surveil-lance. In these hospitals obstetricians aregenerally not on premises during on-callhours.
LEVEL 2Eighteen of the maternity hospitals were classi-fied as secondary level. Sixteen of these areregional hospitals which serve as teaching unitsfor specialisation. Two metropolitan hospitalsthat are administratively local hospitals werealso classified as level 2 because they are teach-ing hospitals and their staffing and equipmentare similar to those in regional hospitals. Level2 hospitals vary in size and equipment, but allhave obstetricians on the premises 24 hours aday and paediatric departments and newbornspecial care units adjacent to them. Some haveintensive care cots for sick newborns.
LEVEL 3Five university teaching hospitals were classi-fied as tertiary care units. These hospitals areamong the largest maternity units in the coun-try and are equipped for neonatal intensivecare. A resident neonatologist is on-call in threeuniversity hospitals, in others there is a residentpaediatrician.
Birth registry data on the residence of themother were used for defining the catchmentareas for each level of care. A first choicehospital of birth care was determined for eachof the 460 Finnish municipalities (the lowestlevel administrative unit). This was a hospital inwhich more than two thirds of all births in thatmunicipality took place in 1987. The births inmunicipalities with the same first choice level ofbirth care were pooled to form four nationwidecatchment areas for different levels of care.There were 56 municipalities with 17 196 births(14% of all births) for which the first choicehospital could not be defined, as births werealmost equally distributed between two or morehospitals of different levels. Births in thesemunicipalities were treated as a separate groupin the analysis (mixed).The coverage of the catchment areas thus
formed was assessed by determining what pro-portion of mothers primarily served by eachlevel of care actually gave birth at that level.All the catchment areas had more than 69% oftheir births in the local level of care (table 2).The best coverage was found in the areasserved primarily by level 3 hospitals and thelowest in areas served by community hospitals(level lb). Level 2 and level lb hospitals hadsimilar coverage rates. There were 1186 births(1%) for which the residence of the motherwas not known. These were excluded, and thusthe final study population in the catchmentarea analysis was 121 879 women who gavebirth.
Eight potentially confounding background
401
Viisainen, Gissler, Hemminki
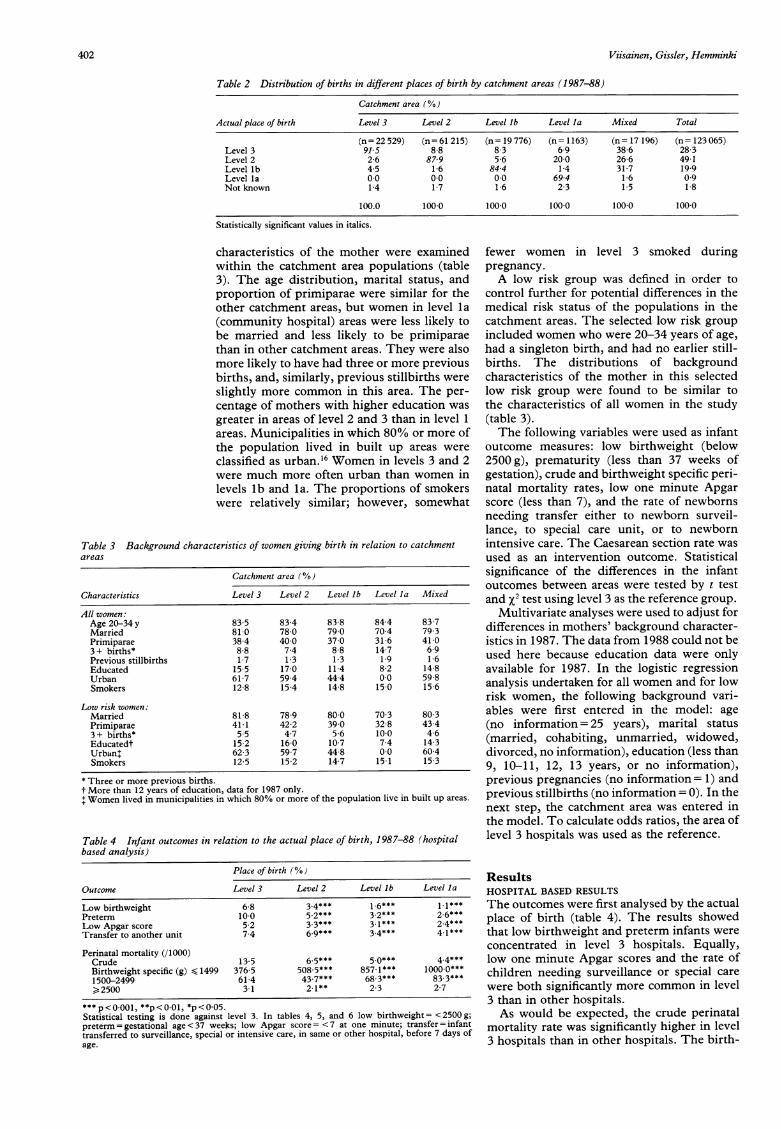
Table 2 Distribution of births in different places of birth by catchment areas (1987-88)
Catchment area (%)
Actual place of birth Level 3 Level 2 Level lb Level la Mixed Total
(n= 22 529) (n= 61 215) (n= 19 776) (n= 1163) (n = 17 196) (n= 123 065)Level 3 915 8.8 8 3 6 9 38-6 28 3Level 2 2 6 87 9 5 6 200 266 491Level lb 45 16 844 14 317 199Level Ia 00 00 00 694 1 6 09Not known 14 17 16 23 15 18
100.0 100 0 100 0 100 0 100 0 100 0
Statistically significant values in italics.
characteristics of the mother were examinedwithin the catchment area populations (table3). The age distribution, marital status, andproportion of primiparae were similar for theother catchment areas, but women in level la(community hospital) areas were less likely tobe married and less likely to be primiparaethan in other catchment areas. They were alsomore likely to have had three or more previousbirths, and, similarly, previous stillbirths wereslightly more common in this area. The per-centage of mothers with higher education wasgreater in areas of level 2 and 3 than in level 1areas. Municipalities in which 80% or more ofthe population lived in built up areas wereclassified as urban."6 Women in levels 3 and 2were much more often urban than women inlevels lb and la. The proportions of smokerswere relatively similar; however, somewhat
Table 3 Background characteristics of women giving birth in relation to catchmentareas
Catchmtient area (O/}
Characteristics Level 3 Level 2 Level lb Level la Mixed
All womten:Age 20-34 y 83 5 83 4 83 8 84 4 83 7Married 81 0 78 0 79 0 70 4 79-3Primiparae 38 4 40 0 37 0 31 6 41 03+ births* 88 74 88 147 69Previous stillbirths 17 13 13 19 16Educated 155 170 114 82 148Urban 61 7 59 4 44 4 0.0 59-8Smokers 12 8 15 4 148 15 0 15 6
Low risk wotmien:Married 81 8 78-9 80 0 70 3 80 3Primiparae 41 1 42 2 39 0 32 8 43 43+ births* 55 47 56 100 46Educatedt 15 2 160 107 74 14 3Urban' 62 3 59 7 44 8 0.0 60 4Smokers 12 5 15 2 14 7 15 1 15 3
* Three or more previous births.t More than 12 years of education, data for 1987 only.+ Women lived in municipalities in which 80% or more of the population live in built up areas.
Table 4 Infant outcomes in relation to the actual place of birth, 1987-88 (hospitalbased analysis)
Place of birth (%)
Outcome Level 3 Level 2 Level lb Level la
Low birthweight 6 8 3.4*** 16*** 1 1***Preterm 100 5.2*** 3.2*** 2 6***Low Apgar score 5 2 3.3*** 3l1*** 2.4***Transfer to another unit 7 4 6 9*** 3.4*** 4 1***
Perinatal mortality (/1000)Crude 13 5 6 5*** 5 0*** 44***Birthweight specific (g) s1499 376 5 508 5*** 857.1*** 1000 0***1500-2499 614 437*** 68.3*** 83.3***2500 31 21** 23 27
*** p<0.001, **p<001, *p<005.Statistical testing is done against level 3. In tables 4, 5, and 6 low birthweight= <2500 g;preterm = gestational age < 37 weeks; low Apgar score = <7 at one minute; transfer = infanttransferred to surveillance, special or intensive care, in same or other hospital, before 7 days ofage.
fewer women in level 3 smoked duringpregnancy.A low risk group was defined in order to
control further for potential differences in themedical risk status of the populations in thecatchment areas. The selected low risk groupincluded women who were 20-34 years of age,had a singleton birth, and had no earlier still-births. The distributions of backgroundcharacteristics of the mother in this selectedlow risk group were found to be similar tothe characteristics of all women in the study(table 3).The following variables were used as infant
outcome measures: low birthweight (below2500 g), prematurity (less than 37 weeks ofgestation), crude and birthweight specific peri-natal mortality rates, low one minute Apgarscore (less than 7), and the rate of newbornsneeding transfer either to newborn surveil-lance, to special care unit, or to newbornintensive care. The Caesarean section rate wasused as an intervention outcome. Statisticalsignificance of the differences in the infantoutcomes between areas were tested by t test
and x2 test using level 3 as the reference group.Multivariate analyses were used to adjust for
differences in mothers' background character-istics in 1987. The data from 1988 could not beused here because education data were onlyavailable for 1987. In the logistic regressionanalysis undertaken for all women and for lowrisk women, the following background vari-ables were first entered in the model: age(no information= 25 years), marital status
(married, cohabiting, unmarried, widowed,divorced, no information), education (less than9, 10-11, 12, 13 years, or no information),previous pregnancies (no information= 1) andprevious stillbirths (no information = 0). In thenext step, the catchment area was entered inthe model. To calculate odds ratios, the area oflevel 3 hospitals was used as the reference.
ResultsHOSPITAL BASED RESULTSThe outcomes were first analysed by the actualplace of birth (table 4). The results showedthat low birthweight and preterm infants were
concentrated in level 3 hospitals. Equally,low one minute Apgar scores and the rate ofchildren needing surveillance or special care
were both significantly more common in level3 than in other hospitals.As would be expected, the crude perinatal
mortality rate was significantly higher in level3 hospitals than in other hospitals. The birth-
402

Birth outcomes by level of obstetric care in Finland
Table 5 Infant outcomes and Caesarean sections in relation to catchment areas,1987-88
Catchment areas (%)
Outcomes Level 3 Level 2 Level lb Level la Mixed
All births:Low birthweight 4-1 3-9 3-8 3-2 4-2Preterrn 67 5 8*** 6-0** 4-6** 6-5Low Apgar score 4 0 3.7** 3-8 3-7 3-7Transfer to other unit 6-0 6-7*** 5.7 5-7 5-4Caesarean births 12-9 14-2*** 16-3*** 13-0 15-8
Perinatal mortalityCrude 90 84 93 77 7-8Birthweight specific (g)< 1499 508 4 426-4 438-6 571-4 391 31500-2400 56-0 52-7 66-2 33-3 45 32500 2-5 24 27 27 1*9
Low risk pregnancies:Low birthweight 3-0 2-8 2.6* 2-2 3-2Preterm 5-2 4-6*** 4-6** 4 0 5-3Low Apgar score 3-8 3-3** 3-6 3-3 3-5Transfer to other unit 5-1 5-9*** 4-9 5-6 4-5Caesarean births 119 12.6** 14.7*** 13-1 14.3***
Perinatal mortality (/1000):Crude 7-6 6-7 7-5 7-3 7-1Birthweight specific (g)< 1499 536-8 410 4 478-7 600-0 438-11500-2499 70 0 57-3 85-2 62-5 56-0,2500 26 23 25 22 1.9
p<0-001, ** p<O.Ol, * p< 0.5.See footnotes table 3.
weight specific mortality rates, however,showed that very low birthweight newborns( < 1499 g) had a better rate of survival in level3 hospitals but for low birthweight infants(1500-2499g) level 2 hospitals had a lowermortality rate than level 3. For normal birth-weight infants, perinatal mortality was lowestin level 2 hospitals and highest in level 3hospitals.
CATCHMENT AREA BASED RESULTS, ALL WOMENIn the catchment area based analyses, theinfant outcomes showed few differencesbetween the catchment areas of different hos-pital levels (table 5). The proportions of lowbirthweight infants were similar in all areas.There were significantly more preterm babiesin areas of level 3 hospitals than in other areas.There were also significantly more infants withlow Apgar scores in level 3 than in level 2areas. Yet, in areas with level 2 care, newbornswere more often transfered than in areas oflevel 3 care.
Crude perinatal mortality rates showed no
statistically significant differences between thecatchment areas of different levels of care. Thiswas also true for birthweight specific perinatalmortality rates. Some variation was found inCaesarean section rates between the areas. Cae-sarean sections were significantly more com-
mon in catchment areas of level b and 2 than inareas of level 3.
When adjustment was done for mothers'background characteristics the resultsremained similar (table 6). Only the differencein rates of low one minute Apgar scoresbecame more significant between levels 3 andlb.
CATCHMENT AREA BASED RESULTS, LOW RISKWOMENWhen analysis was done using a selected lowrisk group of women, the overall rates of lowbirthweight, preterm infants, low Apgarscores, and infants needing transfer were lowerthan for all women, yet the differencessbetween the areas stayed similar (table 5). Ascould be expected, crude perinatal mortalityrates for the low risk group were lower than forall births across the catchment areas. Dif-ferences in birthweight specific mortality ratesbetween areas for the low risk womenremained in the same proportions as for allwomen. Some of the birthweight specific mor-tality rates were higher, however, for the lowrisk group than for all women. There werefewer Caesarean sections in each catchmentarea, but no difference emerged in the distri-bution of Caesarean births between areas incomparison with all births. Adjustment fordifferences in the mother's background char-acteristics did not change the outcomes for lowrisk women (adjusted data not shown).
DiscussionThe study results show that there were no
striking differences in birth outcomes in dif-ferent regions of Finland with a different levelof first choice maternity hospital. This indi-cates that in a system of regionalised care,infants have a similar rate of survival and theircondition is similar whether their mother re-
sides in an area primarily served by a smalllocal birth unit or in one served by a universityteaching hospital. A functioning referral sys-
tem seems to ascertain that detected high riskpregnant women are sent to the appropriatelevel of care. In Finland the detection rate alsoseems high - the numbers of low birthweightinfants born in level la and lb hospitals are
small.Earlier comparative studies between birth
care in different levels of hospitals have shownthat the smallest babies do better in tertiarycare but normal birthweight babies benefitfrom care in smaller hospitals.46 In our hos-pital based analysis, the survival rate for very
low and low birthweight infants was clearlybest in tertiary care hospitals, but in the nor-
Table 6 Odds ratios (95% CI) of infant outcomes (all births) in relation to catchment areas after adjustment fordifferences in mother's background characteristics in 1987, logistic regression analysis
Catchment areas
Outcomes Level 3 Level 2 Level lb Level la Mixed
Low birthweight 1 0 0 90 (0-81, 1-01) 0-92 (0 80, 1-06) 0-65 (0-38, 1-10) 0-99 (0-86, 1-14)Preterm 1-0 0-81 (0 74, 0-89) 0-85 (0-76, 0-95) 0 53 (0-34, 0 83) 0-97 (0-86, 1-09)Low Apgar score 1-0 0-83 (0-74, 0-92) 0-87(0 75, 1-00) 0 75 (0-46, 1-22) 0-84 (0-76, 0 98)Transfer to other unit 1-0 1-17(1-06, 1-28) 0-91 (0-81, 1-02) 0-75 (0-50, 1-12) 0-87(0-76, 0-98)Crude perinatal mortality (/1000) 1-0 0-92(0-72, 1-16) 1-02(0-76, 1-36) 0-58(0-18, 1-86) 0-96(0-71, 1-30)
The statistically significant (5% level of significance) differences of odds ratios between the level studied and level 3 are in italics.
403

Viisainen, Gissler, Hemminki
mal birthweight group the difference for thebenefit of the smallest hospitals was not asclear as has been found in some earlierstudies.45 Level 2 hospitals, however, had asignificantly better perinatal mortality ratethan level 3 hospitals.
In the area based analysis, crude and birth-weight specific perinatal mortality ratesshowed no statistically significant differencebetween catchment areas of different levels ofhospitals. It is interesting to note that level 2areas had better survival rates for all birth-weight groups than level 3 areas, although thedifferences were not significant.Although most outcomes were very similar
across the catchment areas, in the area servedby level 3 hospitals, newboms were more likelyto be preterm and to have low birthweight. Thismight reflect a more active policy of inductionor performing Caesarean sections before termin level 3 hospitals. The active policy may bedue to differences in opinions or to securityoffered by the availability of high quality inten-sive newborn care in level 3 hospitals. Yet, theCaesarean section rates were higher for areasserved by primary level hospitals (level lb).The differences in Caesarean section ratesbetween catchment areas might indicate dif-ferences in local practice styles. A recent areabased study of Caesarean rates in Finlandshowed great variation between hospitals of thesame level of care (E. Hemminki, unpublisheddata).The higher rate of preterm births in catch-
ment areas served by level 3 hospitals may alsobe due to population differences in the dif-ferent catchment areas, although table 3 doesnot suggest this. Our previous analyses fromFinland have shown that premature birth isrelated to marital status, age, education, parity,and smoking. 417 But there may have beenpopulation differences in risk factors notmeasured in this study - for example, workconditions.This study, like others needing a large num-
ber of births, is limited by the restrictions of aready registry database. In general, the validityof the data of the Finnish Medical BirthRegistry has been shown to be good.'8 Thevariables used in this study were chosen bytheir shown validity, which limited the num-ber of variables that could be used for out-comes. Because of poor validity, diagnosescould not be used for determining the morbid-ity of the mother or infant. Even though it isknowrn that the 5-minute Apgar score is abetter predictor of the infant's condition, onlythe 1-minute score could be used in this study.Five minute scores were lacking for 20% of thenewborn infants and the internal validity studyshowed them to be less accurately reported inthe registry than 1-minute scores.'9 Also,medical procedures, other than Caesarean sec-tions, were too poorly recorded to be used inthis study. The distribution of lethal congen-ital malformations between the areas could notbe verified from the registry, but according toan earlier, Swedish, area based study theycould be expected to be equally distributedacross the catchment areas.19
The problem of selection bias is pertinent tothe comparison of birth outcomes in differenthospitals. In this area based analysis, bothmedical referrals and self selecting patientswere classified as births in the first choice levelof care of their community. In Finland, selfselection is a problem in some municipalitieswhere two or more maternity units are avail-able within a similar distance. In this analysisthese municipalities could not be assigned aprimary choice hospital and were thus treatedseparately. In the pooled catchment areas selfselection was probably the cause of 7% ofwomen not giving birth in tertiary care hos-pitals where that level was the first choice forbirth care in their municipality. The propor-tion of women self selecting to other levels ofcare cannot be defined for catchment areas oflevels 1 and 2.The rate of tertiary care births varied from
92%-7% across the areas, yet crude and birth-weight specific perinatal mortality rates werevery similar in the areas. This shows a trueegalitarian situation between the areas in termsof safety despite the differences in the organi-sation of birth care. Similarly, in The Nether-lands no relation could be shown betweenthe regional percentage of hospital deliveriesand the regional perinatal mortality rates.20Canada, provinces with high and low rates ofdeliveries in small hospitals had similar pat-terns of perinatal mortality rates.7
In conclusion, this study concurs withothers and indicates that "safety" cannot beused as a basis for centralising birth care inlarge level 3 facilities. In this regionalisedsystem areas served by small units had survivaland morbidity rates equal to areas served bylarge university hospitals, from the very lowbirthweight to normal birthweight infants.The importance of regionalisation for thesafety of small hospitals is pertinent: in a studydescribing a non-regionalised system whereadequate referral was lacking, higher mortalitywas shown for high risk normal birthweightbabies in primary level than in tertiary levelcare.9When safety alone cannot be used as the
determining factor in deciding whether to cen-tralise, other factors such as economy andpreferences of the families are important. Inthe economic analysis not only the direct costsof care but also the expenses (monetary andother costs) to the family should be con-sidered. The care should not only be safe andeconomical but also convenient for the family.So far the preferences of families have beenpoorly examined and seldom implementedinto birth care policy.
1 Campbell R, MacFarlane A. Where to be born? The debateand the evidence. Oxford: National Perinatal Epidemi-ology Unit, 1987.
2 Paneth N, Kiely JL, Wallenstein S, et al. Newborn inten-sive care and neonatal mortality in low birth weightinfants: a population study. N Engl J Med 1982;307:149-55.
3 Gortmaker S, Sobol A, Clark C, et al. The survival of verylow birth weight babies by level of hospital of birth: apopulation study of perinatal systems of four states. AmJObstet Gynecol 1985;152:517-24.
4 Hemminki E. Perinatal mortality distributed by type ofhospital in the central hospital district of Helsinki, Fin-land. Scand J Soc Med 1985;13:113-18.
5 Lumley J. The safety of small maternity hospitals in Vic-
404

Birth outcomes by level of obstetric care in Finland
toria 1982-84. Community Health Studies 1988;XII:386-93.
6 Rosenblatt RA, Reinken J, Shoemack P. Is obstetrics safe insmall hospitals? Evidence from New Zealand's regiona-lised perinatal system. Lancet 1985;ii:429-32.
7 Fallis G, Dunn E, Hilditch J. Small hospital obstetrics, issmall beautiful? The Journal of Rural Health 1988;4:101-17.
8 Campbell R, MacFarlane A. Place of delivery: a review.Br Obstet Gynaecol 1986;93:675-83.
9 Berg CJ, Druschel CM, McGarthy BJ, LaVoie M, FloydRL. Neonatal mortality in normal birth weight babies:does the level of hospital care make a difference? AmObstet Gynecol 1989;61:86-91.
10 Albers LL, Savitz DA. Hospital setting for birth and use ofmedical procedures in low risk women. Nurs Midwifery1991 ;36:327-33.
11 Hemminki E, Malin M, Kojo-Austin H. Prenatal care inFinland: from primary to tertiary health care? IntHealth Serv 1990;20:221-32.
12 Hemminki E. Obstetric practice in Finland, 1950-1980.Changes in technology and its relation to health. MedCare 1983;21:1131-43.
13 Hemminki E, Teperi J, Tuominen K. Need for and influ-
ence of feedback from the Finnish birth register to data-providers. Quality Assurance in Health Care 1992;4:133-9.
14 Hemminki E, Merilainen J, Malin M, Rahkonen 0, Teperi J.Mother's education and perinatal problems. A nationwidestudy in Finland. Int I Epidemiol 1992;21:720-4.
15 Statistics Finland. Statistical yearbook of Finland 1992.VaPK, Helsinki 1992.
16 Stephenson PA. International differences in the use of obstetri-cal interventions. Copenhagen: WHO Regional office forEurope, 1992. Eur/ICP/MCH 112.
17 Manderbacka K, Merilainen J, Hemminki E, Rahkamo 0,
Teperi J. Marital status as a predictor of perinatal outcome.Journal of Marriage and the Family 1992;54:508-515.
18 Teperi J. A multi-method approach to the assessment of dataquality in the Finnish Medical Birth Registry.Epidemiol Community Health 1993;47:242-7.
19 Eksmyr R. Two geographically defined populations withdifferent organization of medical care. Cause specific ana-lysis of early neonatal deaths. Acta Paediatr Scand 1986;75: 10-16.
20 Treffers PE, Laan R. Regional perinatal mortality and re-gional hospitalization at delivery in the Netherlands. BrObstet Gynaecol 1986;93:690-93.
405
View publication statsView publication stats