of a.ntimony and tellurium. bric~ norman clarkdigitool.library.mcgill.ca/thesisfile118853.pdf......
TRANSCRIPT

BETA RAY SPECTRA OF NEUTRON DEFICIENT ISOTOPES
OF A.NTIMONY AND TELLURIUM.
Bric~ Norman Clark
A thesis submitted to the Faculty of
Graduate Studies and Research of McGill University
in partial fulfillment of the requirements for the
degree of Doctor of Philosophy.
Radiation Laboratory,
McGill University.
August, 1951.

TABLE OF CONTENTS
Page No •
.lCKN'ovri..El)GMENTS • • . • • • • • • • • • • • • • • • • • • • • • • • • • • • • • 1
SUMMA.R.Y •••••••••• _. ••••••• ~ ••••••••••••••••••• • • 11
INTRoDUCTION •••••••
Previous Work
THE ORY
• • • • • • • • • • • • • • • • • • • • • • • • • • • • •
• • • • • • • • • • • • • • • • • • • • • • • • • • • • •
1
2
1. Neutrino Hypothesis ••••••••••••••••••••••• 5
2. Fermi Theory •••••••••••••••••••••••••••••• 6
3. Forbidden Spectra ••••••••••••••••••••••••• 8
4. FT values . . . . . . . . . . . . . . . . . . . . . . . . . . . . . . . ~ . 10
METHODS OF OBSERVATION
1. Beta Rays . . . . . . . . . . . . . . . . . . . . . . . . . . . . . . . . . 11
2 • Gamma Rays • . . . • • . . . • • • • . • • . .. . . . . . . . • • . . • • . • 13
1. Spectrometer • • • • • • • • • • • • • • • • • • • • • • • • • • • • • • • 14
2. Current Regulator •••••••••••••••••••••••••• 14
3. Deteotors ••••••••••••••••••••••••••••••••••
4. Formvar Windows • • • • • • • • • • • • • • • • • • • • • • • • • • • •
15
16
5. Cyclotron Magnet Field ••••••••••••••••••••• 17
6. Aligilment • • • • • • • • • • • • • • • • • • • • • • • • • • • • • • • • • • 17
7. Calibration of the Instrument • • • • • • • • • • • • • • 18
8. Chemis try . . . . . . . . . . . . . . . . . • . . . . . . . . . . . . . . . . 18
MEASUREMENTS AND DISCUSSION
1. Measurements on Tel17 • • • • • • • • • • • • • • • • • • • • • •
2. :Measurements on TellS ••••••••••••••••••••••
3. Observations on sbllS • • • • • • • • • • • • • • • • • • • • • •
CONCLUSIONS • • • • • • • • • • • • • • • • • • • • • • • • • • • • • • • • • • • • • BIBLIOGRJ.PHY ............ ' ....................... .
21
24
27
32
33

(i)
ACKNOWLEDGMENTS
The writer wishes to tbank Professer J.S.
Foster, Director of the Radiation Laboratory, for
his interest and helpfûl conversations tbroughout
this work.
The writer is also indebted to his fellow
members in the Radiation Laboratory who showed ao
much co-operation. In particular, tbanks are due to
Dr. A.L. Thompson for se veral helpful discussions
with regard to the chemistry of this work, and to
Mr. Allen Johnson for doing sQ.me of the calibration
rune. Mr. Stanley Doig and,other members of the
shop have always been most co-operative, as bas Mr.
Robert Lorimer, who bas done any glassblowing
associated with this wor~~

(ii)
With the aid of a thin lens spectrometer of
~ 118 ( ) resolution 1.7~ the beta spectra of 51sb 3.5 minutes ,
52Tell7 (70 minutes) and 52Tell6 (3 hours) were examined.
The activity of Sb118 with an end point of 2.65 Mev was
shown to be of a forbidden nature. However, attempts to
straighten the Fermi plot by corrections have to date
been unsuccessful. The 70 minute Te1l 7, not previously
reported, was shown to bave an end point of 2.00 Mev and
the mass was identified by observing the growth and decay
of a known conversion line from its daughter, Sbll7• The
new 3 hour Te116 bas a beta end point of 2.51 Mev, and
its mass is 116, as shown by the known 1.45 Mev positron
end point of its daughter, sb116•

l.
INTRODUCTION
The energies available in the McGill cyclotron
enable one to investigate by means of (p,xn) reactions,
neutron deficient isotopes lying far below the line of
stability of the elements. This thesis is concerned
with investigations of (p,xn) reactions on antimony.
The tellurium activities resulting from bom
bardment of antimony were separated chemically and
studied by gross decay, aluminium absorption, and
finally by means of a thin lens beta-ray spectrometer.
Two new tellurium activities were round and in-
vestigated, • third half life of 30 minutes was observed
in chemically separated tellurium and again in an un
separated sample of antimony bombarded in the cyclotron.
However, this latter activity has not been investigated
further.
52Tell7 was observed to have a halt life of 70
minutes and its maas was identified by observing growth
and subsequent decay of a known 50sbll7 conversion line.
Tell7 emits positrons and bas an end point of 2.00 Mev.
No conversioh lines have been observed, nor as yet have
radiator experimenta been performed to look for higher
energy gammas. High energy gammas are :expected since
gross decay behind a lead absorber 1.5 mm. thick, in an
apparatus which effectively eliminates annihilation
radiation, yielded a 70 minute half life.

2.
Another new tellurium isotope, Tellô, bas been 1
round to have a half life of 3 hours and to emit positrons
with an end point of 2.51 Mev. Its mass was assigned by
the fact that a continuum having a similar end point to
Sbllô was observed and also from considerations of the
yield for various bombarding energies. A 92.1 Kev gamma
ray bas also been observed with TellS. Another continuum
believed to be due to camplex decay in Sb116, with an
end point of 0.54 Mev, was observed. However, the
assignment of this 0.54 Mev end point is not definite.
Since the known 6 day TellS decays by K capture
and is known to produc'e.sb118 (3.5 minutes) it provides
an excellent means of investigating the short lived
SbllS in a beta-ray speotrometer. This was dona and its
positron continuum was seen to bave an end point of 2.65
Mev, oonsiderably lower than the 3.1 Mev reported by
Linder and Perlman {2). A Fermi plot of this continuum
deviates from linearity at both high and low energies
and is thus seen to be of a forbidden nature. Efforts
to straighten the ourve by corrections applicable for
ebange of spin 2 and change of parity, and also one for
change of spin 3 and no change of parity, failed. As yet
further corrections have not been tried.
PREVIOUS WORK
In the acoompanying historical account no treat
ment is given Te116 and Te117, since they have never been
reported. Linder and Perlman (2) mentioned a 2.5 hour
positron activity but oould give no maas assignment nor

end point value. Some attention, however, haa been
given the maas aaaignments of Te118, sbll7 and Sb116
,
aince the masa aaaignmenta in this present work depend
a great deal on their accuracy.
J.R. Riaser et al (1), by bombarding indium
with alpha particles, obtained a half life in antimony
of 3.6 minutes which they identified as Sb118 • Linder
and Perlman (2), bombarding antimony wi th 200 Mev ,
deuterons, obaerved a aix day activity accompanied by
positrons which they ahowed to be due to a 3.5 minute
àntimony daughter. The positron end point they ob
served to be 3.1 Mev, both by absorption in beryllium
and alao from the end point on an energy distribution
curve taken with a low resolution beta-ray spectrometer.
They also observed some gamma ray activity which, they
postulated, was due to the 3.5 minute antimony.
The maas assignment of Sbll8 waa made from the
fact that 40 Mev deuterons on antimony produced the six
day tellurium isotope, but in a. yield 1/40 that of an
accompanying 4.5 day tellurium activity, thus indicating
the six day activity is a lower mass than the 4.5 day one.
40 Mev is too small to form 116 and probably even 117.
Further, by bombarding 95% pure Sn120 with 18 Mev
deuterons, the 39 hour daughter of the 4.5 day tellurium
was identified as Sb119 • Thus the 4.5 day tellurium is
shown to be Te119 and the 6 day activity, since it can•t
be Te117, must be TellS and its 3.5 minute daughter is
therefore Sbll8.

4.
J.J. Livingood and G.T. Seaborg (3} reported 117
a 3 hour half 1ife of antimony which was probably Sb
but reported nothing further on it. Coleman and Pool (4),
by the use of a pair of X-Ray cameras in conjunction with
X-ray decay curves, observed antimony activities of 2.8
hours, 5.1 bours and 39 hours from the bombardment of
tin by deuteroQs. The maas assignments of antimony 117,
118 and 119 respectively were done by relative abun
dances and due to the large number of tin isotopes were
open to same question. But by means of the X-Ray camera
both the 2.8 hour activity and the 39 hour activity were
shown to be K capture. The 2.8 hour activity has also a
conversion 1ine at 0.46 Mev, whi1e no electrons or gamma
rays at all were round with the 39 hour activity. The
5.1 hour activity, which decays by K capture, showed a
0.20 Mev conversion line and a 1.5 Mev gamma ray.
G. Timmer (5) bombarded In115 with alpha particles
producing Sb118 , 117 and 116, which he examined in a bata
ray spectrometer. Conversion lines of a 156 Kev gamma
ray showed a half life of 2.8 hours. Those of a 260 Kev
gamma showed a 5.1 hour half lite and a positron continuum
with an end point of 1.45 Mev bad a half life of one hour.
By bombarding stacked foils in the cyclotron and
later analysing them in the beta-ray spectrometer, excit
ation curves were obtained for all tbree activities, thus
establisbing the masses as sbll8_ 5.1 hours, sbll7_2.8 hours
and Sbll6_ 1 hour. The ~bll8 and 119 resulta are thus in -

5.
agreement with those of Coleman and Pool. In an
earlier paper Timmer (5) also reported the existence
or an approximately 700 Kev gamma ray accompanying
the Sb116•
'l'HE ORY
1. NEUTRINO HYPOTBESIS
The tact that in bata decay electro~s or con
tinuously varying energies are observed was very dis
turbing to physicists, as up until the observation of
this phenomenum all nuclear processes were sharply
monochromatic.
In cases where the difference in energy between
the initial and final nucleus is known this difference
corresponds to the maximum energy or the continuum. How
ever, calorimetrie experimenta proved that the mean
energy of the emitted betas corresponded more nearly to
the average energy of the continuum than to the maximum,
and since radioactive nuclei.:. have a de.finite mass and
energy state, the law of conservation of energy seemed to
be contradicted.
To preserve the law of conservation of energy and
satisfy other difficulties with regard to spin and
statistics, Pauli postulated that a particle of approx1-
mately zero mass, following Fermi statistics and having a
spin 1/2, was also emitted in bata decay. Thus, considering

6.
nucleL composed of only protons and neutrons, when an
electron is emitted we have a neutron changing into a
proton plus an electron and a neutrino which can carry
off the missing energy. Because of its having no maas
nor charge the neutrino is practically impossible to
observe.
2. FERMI TBEORY
Fermi (6) developed ·Pauli 1 s hypothesis by
considering the neutrons and protons as simply different
states of a particle call~d the nucleon, and by assuming
an interaction term between these nucleons and a virtual
.field of the beta particle and the neutrino, he obtained
the following energy distribution function for beta
particles&
P{W) dW : g2 2 2
3 _,f 3 1 M 1 F (Z,W) p(W0 -W) W dW 211" c
(1)
P(W) dW : probability per unit time for the
emission of a beta partlcle ln the energy range W to W+dW,
g = Fermi constant,
fM/~ matrlx element for the transition,
F(Z,W) = Fermi functlon whlch allows for the effect of
the nuclear coulomb field,
p = momentum of the beta particle in units of mc.,
W = energy of the beta particle ln mc2 unlts, in
cluding the rest maas of the electron,

7.
W = maximum energy of the emitted betas (ino
cluding rest mass,
~ = Plank's constant divided by 2~,
C = velocity of light.
In a magnetic beta-ray spectrometer, the number
of electrons measured on any current setting divided by
the momentum at that setting is proportional to the
number of particlès emitted per unit momentum interval.
Therefore Equation (l) can be written more suitably as
(2)
where p is the momentum of the emitted particle and all
other units are as previously defined. From Equation (2)
we can see that a plot of
li!!:;, versus W
should gi ve a straight line if we assume J !4/2 is indepen-
dent of energy. This procedure is known as a Fermi or
Kurie plot. For the great majority of beta spectra in
vestigated to date the Fermi plot is a straight line
which intercepta the energy axis at the maximum energy
of the beta continuum. Thanks to recent investigations
(7}{8) it now appears that this line is straight dawn to
very low energies. If the decay is complex--that is, if
more than one continuum is present--the plot will depart
from linearity. However, by suitable subtraction--that
is, by allowing for the fact that the square root of the
8.
number is plotted--such curves can often be resolved
into two or more straight lines.
When making a Fermi plot the value of the
Fermi function must be determined for the particular
z considered as a function of energy. This is a very
difficult calculation since a gamma function is in
volved for which no adequate tables are available. One
therefore has recourse to approximation. I.Feister (22),
at the Computation Laboratory of the National Bureau
of Standards, has calculaied the Fermi function for all
Z•s. Pending publication of the entire work he has
published an evaluation of some approximations to the
Fermi function. The Bethe and Bacher (23) approximation
for Z in this region of the periodic table is accurate
to 0.45%, and for energies above 1.5 Mev .is accurate to
within 0.05%. This approximation is therefore adequate
and is the one used in this work.
3. FORBIDDEN SPECTRA
Aside .from these complex spectra, some spectra
are found which are known to be simple and yet a straight
line Fermi plot is not obtained. This lack of linearlty
is due to the tact that in these particular cases fM/ 2 is
not independant of energy, and auch spectra are classified
as forbidden.
Fermi, when consldering the interaction between
nucleons, electron and neutrino, assumed a simple inter -
action term. It has been shown that there are only five
9.
possible types of interaction which satisfy the neceaaary
invariant conditions, and '.f'cr all:owe<f spèetr,a : these all
give the aame energy distribution. However, the differ
ent matrix elements obtained from the varioua types of
forces conaidered,place conditions upon the change of
spin and parity of a particular beta transition. For
example, the scalar interaction requirea that in an al
lowed be ta transition no change in spin or pari ty be
allowed. Ho~e~er, since all possible types of forces
do give the correct distribution, a atudy of these allow
ed spectra is lesa likely to lead to knowledge of the
interaction forces than is the study of forbidden spectra.
E.J. Konopinski and G.E. Uhlenbeck (9) have
considered the theory of forbidden spectra, as bas also
Gruelling (10). They bave obtained theoretical correction
factors for varying changea of spin and parity wbich
would be expected for eaoh type of possible force. When
the suitable correction is applied to the Fermi funotion
of a forbidden apectrum the Fermi plot will yield a
straigbt line. c.s. Wu (ll) has listed eleven forbidden
spectra which bave been straigbtened by the first for
hidden tensor or axial vector correction for a spin
change of two. Since these two forces are the only ones
which permit a first forbidden apectrum to have a spin
change of two and the theoretical corr-ection has straight
ened the Fermi plots, i t se ems that one of the se types
of force will form at least part of the correct interaction

10.
term. Konopinski (12) bas given an excellent review
of this theory and has listed the corrections ap
plicable to first or second forbidden spectra.
4. FT VALUES
If Equation {1) is integrated over all values
of energy, and aga in assuming 1 M/ 2 inde pendent of
energy, one can obtain an expression for the mean life
given in Equation {3).
1 y (3)
where Y = the me.an life of a nucleus undergoing beta decay.
If instead of the mean life, one uses the half
life,T, and writes F for the term under the integral sign,
one oan write ~his equation as
(4)
K = a constant.
By the use of approximations for F, values for FT can be
oomputed and have been tabulated for most known radio
active nuclei;> and it bas been round possible by this
means to classify beta transitions.
Thus FT values of 1000 to 5000 are considered
super-allowed, those from 104 to 106 are considered
allowed. Groupings of first forbidden, etc., have FT
values or the order 100 times larger than the next lower

11.
state. However such classification of nucleii by this
method, due to uncertainties in values of the matrix
element, are quite sketchy and do not definitely establish
the order of any particular beta transition. A recent
review has been given on FT values by E. Feinberg and G.
Trigg (13), and A.M. Feingold (14) has given a compre
hensive table of FT values of known radioactive isotopes.
METHODS OF OBSERVATiON
1. BETA RAYS
One may observe the half life of bata particles
with a thin window Geiger counter, and by taking obser
vations with the counter behind various thicknesses of
absorbing material (generally aluminium) determine the
maximum energy of the bata particles. This is usually
done by analysing the resulting curve with techniques
developed either by Feat~er (15), or by Bleuler and
Zuenti (16). The absorption technique bas the advantage
of speed and only a weak source is required. However, if
there is more than one continuum or soma conversion linas
only the maximum energy will be obtained with any degree
of reliability.
If larger amounts of activity are available one
may, at the sacrifice of being able to observe only a much
smaller solid angle of the activity, resolve more complex
radiations by a magnetic bata-ray spectrameter.

12.
Speotrometers oonsiat normally of two types:
the lens type and the 180 degreé foousaing type. A lena
type utilizea the faot that the magnetio field along the
axis of a aolenoid ooil doea for electrons what an
optioal lens does for light. It foousses them on its
axis and shows ohromatio aberration, thus fooussing the
electrons at different spots aooording to energy. A
detecter plaoed on the axis will register electrons only
of a partioular energy and by varying the magnetic field
it will register relative intensities of electrons of
various energies, or more partioularly momenta, as a
funotion of magnetio field. The 180 degree type, hist
orioally the older instrument, utilizes the faot that
mono-kinetio electrons travelling in a oirotilar orbit
will be fooussed on a spot, provided· their angle of di
vergence from the source is not large. By varying the
magnetio field electrons of various energies may be
focussed on the detecter, or the magnetic field may be
left constant and the detecter moved. A photographie
plate can be used to deteot all .energies at once. This
latter means is very useful for aoourate observation of
the energies of conversion linas.
In any beta ray speotrometer work, and particu
larly when very low energies are oonsidered, a number of
precautions in preparation of sources should be observed.
These eonsist mainly in seeing that an electron loses as
little energy as possible in travelling through matter.

13.
Some. considerations are: (1) to use carrier free sources
wherever possible, if not possible, as little carrier as
is practical; (2) how the activity is applied to the
source, evaporating from a liquid solution often produces
crystals which vary widely in thickness; and (3) the
amount and atomic weight of whatever source backing is
used should be low in order to reduce back-scattering to
a minimum •
.. Gamma rays can be measured direètl:y- by absorption,
or by using a radiator and analysing the resulting electrons
by aluminium absorption techniques. Considerably greater
accuracy can be obtained by means of the beta spectro-
meter or spectrograph. If the gamma rays are of low or
moderate energy and the source has a sufficiently high
atomic number, one can observe directly internal conversion
lines which, with a knowledge of the various X-ray levels,
gives very accurate values for gamma ray energies. These
linas also provide an excellent means or getting half-life
measurements since all radiation is thus known to be due
to one isotope. If no internal conversion lines are ob-
served there remains the possibility of using a radiator.
The activity is then placed in a capsule of material of
low Z, of such thickness that no beta rays can penetrate
it, then a thin piece of radiating material is placed on
top of it. Gamma rays penetrating the capsule will knock

14.
out electrons from the various shells of the radiating
material, the electrons will be observed and, with a
knowledge of the electron energy levels of the radiator
atoms, the gamma ray energies may be determined.
APPAIU.TUS
The beta-ray spectrometer used in this work is
of the thin lens 'type 'a.escribed by Deut~ch, Elliott and
Evans (18), designed and constructed at tne Chalk River
Laboratories of the National Research Council and es-
tablished in this laboratory througb the efforts of Dr.
J .L. Wolfson- (19). · Some modifications to the current
regulation were made by Dr. G.D. Douglas (20), and Dr.
J. Moon (21) rewound the colla. For deta11ed descriptions
of the apparatus the reader is referred to these authors.
A photograph of the instrument is included in Figure 1.
The colla are wound with 4140 turns of rectangular
wire 0.200tt x 0.050", insu].ated with Q;F Formex in four
rough1y equal sections. Between each section is a 0.046u
sheet or copper with tabs projecting through the brasa
wal1s of the magnet spool to the water coo1ing coi1s
wound on the outside or the spool.
2. CURRENT REGUUTOR
The power supply consista of a 20 horsepower,
200 volt, 3 phase, 1200 r.p.m. induction motor coup1ed

15.
direct1y to a 12 horsepower DC motor used as a generator.
The current regulation is provided by two circuits. A
full wave rectifier power supp1y utilizing two type 866
mercury vapor tubes supplies the exciting field of the
generator. This is placed in series with a bank of five
6A3 triodes in parallel. An amplified error voltage is
applied to the grids of these tubes in such a way as to
reduce the error.
A. second f'eed back loop of eight 6.&S7 triodes
in parallel is in series with the magnet coil, and the ,,
same error voltage is applied to the grids of these tubes.
Since the eight 6!87 can carry only two amperes they are
paralleled by a variable resistance which can be used to
carry currents over two amperes.
3. DETECTORS
The Geiger counters previously used on the
spectrometer had a rather poor slope. Since glass counters
were being prepared in the laboratory, giving plateaus lOO
volts w1de and with a slope of 1%, it was decided to
adapt this type for the spectrometer.
The counter is prepared from a glass tube with
the anode formed by painting silver on the inside walls.
The glass walls of the tube are uniform and merely slide
into a heavy brasa block containing 0-Rings for a vacuum
seal. On the face of the block is screwed a brass plate
in which is the hole for the counter window. If one desires

16.
to vary the aize of the window it is only necessary to
change this plate for one with a suitably sized hole.
Since silver is highly photo sensitive the counter was
painted with glyptal to make it light tight. This ar
rangement can be sean in the photograph of the spectro
meter in Figure 1.
Used in this mannar the counter gave a plateau
at least 100 volts wide, with a slope of from 5% to 10%.
A counter filling of 6 to 7 cm. of argon and 0.5 to 1 om.
of ethylene in normal operation lasted only from one to
two months, after which refilling restored it.
4. FORMVAR WINDOWS
The counter window is 3/16tt in diameter oovered
with a formvar film which needed no further support. To
make the formvar films, formvar is dissolved in ethylene
dichloride and a drop of the solution dropped on a dish
of water. If one is careful of the concentration of the
solution the drop will spread over the surface giving a
thin film wbich can be picked up on any suitable frame.
However, ethylene dichloride does not distribute itself
readily or uniformly over water and it was more convenient
to place the drop in the corner of a square dish•and to
help the spreading by drawing a wire through the drop as
it started to spread. Thus a large thin surface is ob
tained from which one can pick the more uniform section.
A film of 26 auch layera can pass 7 Kev electrons and, on

17.
a·3/16" diameter window, broke at a pressure gradient
of 24 cm. of Hg. In normal use at 6 to 10 cm. of Hg
no abnormal drift in counter characteristics is observed.
5. CYCLOTRON MAGNET FIELD
The instrument is lined up along the magnetic
meridian so that only the vertical field of the earth
bas any serious effect on the focussing property of the
spectrometer. The vertical field is neutralized by a
set of neutralizing coils. The field of the cyclotron
magnet has an appreciable affect on the spectrometer,
giving a field about 3/5 that of the vertical field of
the earth. By a system of trial and error with a
Thorium B source, a degaussing current was found which
gave Thorium F line widths ldentical to those obtained
with the magnet off, and Thorium Aline widths only
slightly wider. Thus for energies above approximately
100 Kev the spectrometer can be operated with the
cyclotron magnet on.
6. A.LIGNMENT
The instrument was lined up mechanically by means
of the six setscrews on the side of the coil, so that the
axis of the brasa pipe was lined up on the axis of the
magnet coil as accurately as possible. This was done by
means of the dial indicator of a type used in a machine
shop, set on an arro so as to indicate distances from the

18.
outside edge of the coil to various spots along the
brasa pipe. Once lined up by this means the instru
ment was very close to aotual alignment. The final
adjustments were made by adjusting the source bolder
and observing the line widths of the various thorium
linas. This proved somewhat tedious and an arrange
ment for moving the counter, which could be moved
without disturbing the vacuum or the source, would be
much fas ter.
7. CA.LIBRA.TION OF THE INSTRUMENT
. '•
The instrument was cali br a ted on thé Thorium F
line using the value of G. Lindstrom (26). The Thorium
L Line was measured to be 2605., differing from Lind
strom•s value of 2607.18 by 0.1%. Agreement on the
1.331 Mev gamma ray of Co60 was satisfactory, considering
the uncertainty in allowing for the uranium radiator
tbickness.
8. CHEMISTRY
The antimony was normal1y bombarded as a powder
he1d in a small thin-walled aluminium tube. When small
lumps of antimony were bombarded they were ground to
powder form before the chemistry was per~ormed. The
cbemical separation of tellurium is essentia1ly tbat used
by Linder and Perlman (24). The chemistry consista of the

1:9.
following steps:
l. The antimony is dissolved in hot hydro
fluoric acid with concentrated nitric acid added drop
wise until solution is complete.
2. The solution is evaporated to dryness at
low beat and under reduced pressures. Care must be ·
used in this evaporation process since if the precipi
tate is heated to much an insoluble precipitate is
formed.
3. fhe precipitate is dissolved in 3 N hydro
cn.loric ac id.
4. Tellurium carrier is added as a soluble
chloride.
5. so2 is bubbled into the solution for ten
minutes and the precipitate of tellurium is centrifuged
out.
The tellurium carrier was in a standard solution
and the amount of carrier added was determined by the
number of drops used. l- 2 mg. of carrier w~re used in
most sources. The tellurium activity is then transferred
to the spectrometer source mounting by evaporating it on
from a nitric acid solution.
The source backing was of three types, Mica of
about 5 mg./cm.2 was used on the Sb118 source. Fine glass
of the order of 1 mg./cm~ or less was used in the study
of the other continua.··. Since the half lives are
relatively short for any particular source, either the

20.
conversion lines or the continuum was studied.
When conversion lines were the chief interest a
metallic foil of columbium of 2.5 mg./cm. 2 was
used. Columbium has a high Z but it is impervious
to nitrio acid and simplified grounding of the
sources.
21.
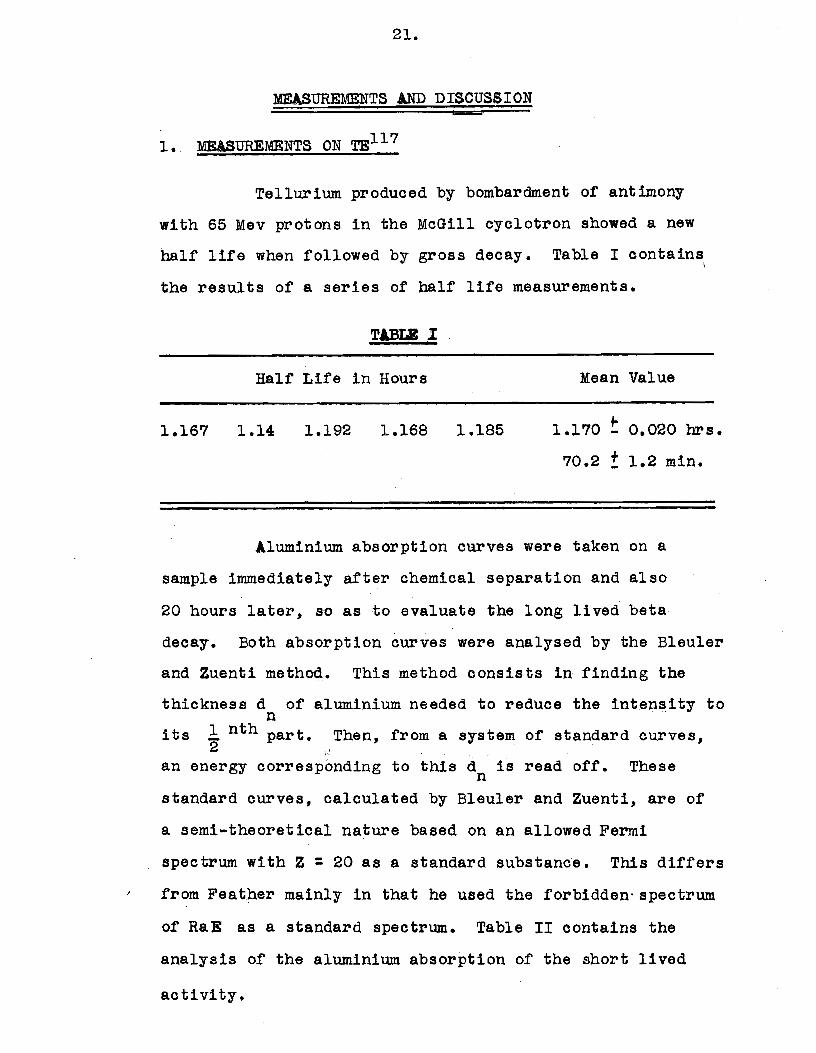
MEASUREMENTS AND DISCUSSION
1. MEASUREMENTS ON TE11 7
Tellurium produced by bo.mbardment o~ antimony
with 65 Mev protons in the McGill cyclotron showed a new
half life when followed by gross decay. Table I contains
the resulta of a series of half life measurements.
Hal~ Life in Hours Mean Value
1.167 1.14 1.192 1.168 1.185 ,.
1.170 - 0.020 brs.
70.2 ! 1.2 min.
Aluminium absorption curves were taken on a
sample immediately after chemical separation and also
20 hours later, so as to evaluate the long lived beta
decay. Both absorption curves were analysed by the Bleuler
and Zuenti method. This method consista in finding the
thickness d of aluminium needed to reduce the intensity to n ..
its l nth part. Then, from a system of standard curves, 2
an energy corresponding to this d is read off. These n
standard curves, calculated by Bleuler and Zuenti, are of
a semi-theoretical nature based on an allowed Fermi
spectrum with Z :: 20 as a standard substance. This differa
from Feather mainly in that he used the forbidden· spectrum
of RaB as a standard spectrum. Table II contains the
analysis of the aluminium absorption of the short lived
activity.

22.
TA.B.ΠII
Counts/200 Thickness dn Energy n sec. Mg./cm.2 mm. Mev.
0 41.80
1 20.90 140 0.518 2.30
2 10.45 276 1.022 2.05
3 4.23 363 1.345 1.80
4 2.61 436 1.614 1.90
5 1.30 500 1.851 1.98
Mean Value 2.00 ~ 0.19 Mev.
 te1lurium source examined in the thin lens
spectrometer showed a number of conversion linas. Table III
contains those of interest here.
H Gauss cm.
1268
1412
TABLE III
Energy Kev.
125.8
151.0
Sn Binding Energies Kev.
t 29.18 K
+ 4.3 L
Energy Kev.
155.0
155.3
Timmer, whose re.sul ts were mentioned previously, • 1
reported a 156 ~ev gamma-ray of Sb117 • ~he half life of
the Hf = 1268 line was therefore followed, and it was ob
served to grow and then decay with a half life of 2.8 hours.
Now a daughter activity follows the decay law
(6)

23.
where A o • activity of parent substance at t - 0 ' -1 t = time,
)1 = decay
;12 • decay
Now sin ce in this
approaches
constant of
constant of
case ).1 >-\ ;l A o
2 l
parent, and
daughter.
for t large, this equation
(7)
Subtracting Equation (6) from Equation (7) gives
~11 = (8)
If the growth curve were plotted on semi-log
paper it would approach a straight line which could be
projeoted back through t = 0, thus obtaining a plot of
Equàtion (7). If now the ordinates of the original curve
are subtracted from those of the straight line another
straight line should result. This line would represent
Equation (8), from which the half life of the parent
oould be determined. This analysis was performed on two
auch growth curves, one of which is given in Figure .3.
Each gave a parent activity of 1.17 hours and a daughter
activity of 2.8 hours.
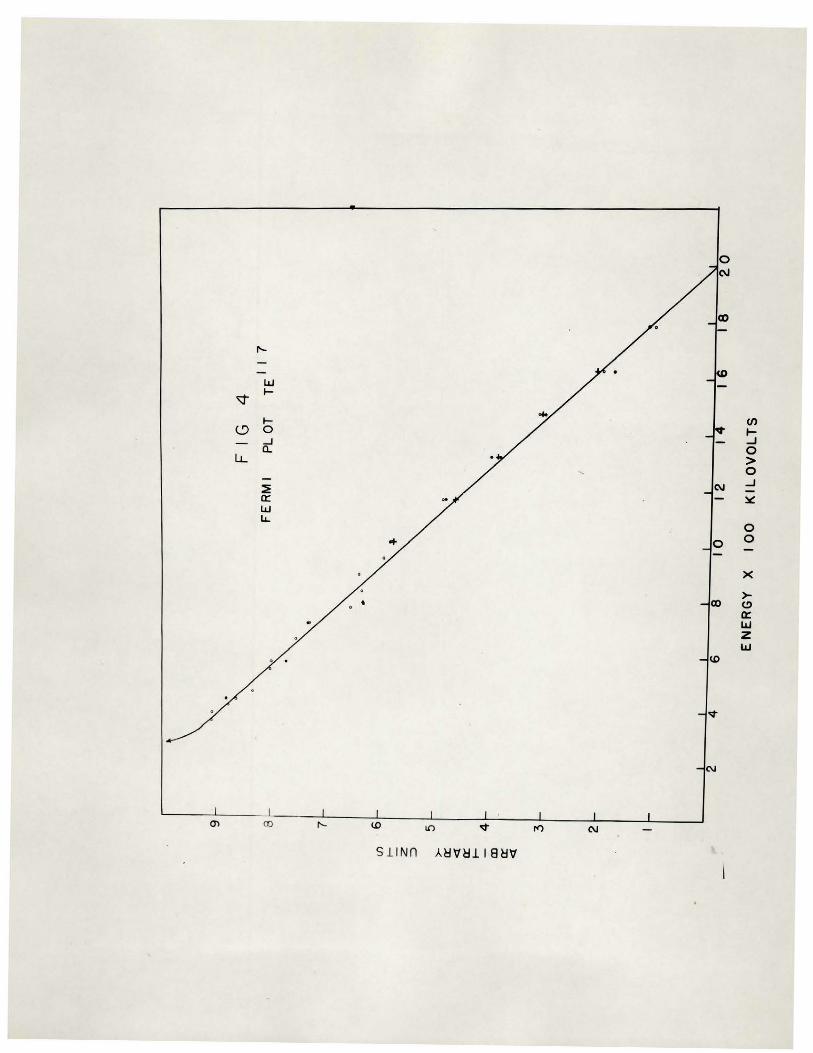
Table IV contains the end point measurements . for three Fermi plots of the positron continuum.
TABLE IV
Energy in Mev. Mean Value
1.98 1.99 2.02 2~00 '!:. 0.021

24.
Figure 4 is a composite plot of the three Fermi
plots normalizeà at an energy value of E = 1.47 Mev. In
all these plots there was evidence of a higher energy
continuum of low intensity due to Tellurium 116. Utilizing
the few points between 2 and 2.5 Mev on the Fermi plot,
plus the knowledge of the end point, this activity was de
termined and subtracted giving the activity due only to
Tell7. Figure 4 contains the curves atter these sub
tractions.
2. MElSUREMÈNTS ON TE116
In a spectrometer source obtained from a 65 Mev
bombardment, a line was observed at Hf = 863 gauss cm.,
which showed a 2.9 hour half life with no growth observed
at all. This line was observed to be lesa intense than the
one at ~ = 1268, due to s~17, by a ratio of 3 to 1. How-/
ever, a source from a 75 Mev bombardment showed this 863
line to be larger by a ratio of 2 to 1. These resulta are
shown in Figure 5. The resulta of a series of half life
measurements on this line are given in Table v.
TABIB V
Ralf Life in Hours Mean Value
2.900 2.900 2.900 2.833 2.883 :!' 0.030
This half lite is remarkably close. to that for
Sb117 • However no growtb at all was observed on this line,

25.
while on the same spectrometer sources growth was ob-117 served on the Sb line, so this is quite obviously
not due to the same isotope. Further, K-L differences
·give better agreement for tellurium than for antimony,
as shown in Table VI.
T.A.BΠVI
H Energy Sb Binding Energy En er gy Deviation Gauss cm. Kev. Kev. Kev. ~
863.5 61.86 -t 30.46 K 92.32
1039.4 87.50 + 4. 70 L 92.20 0.1
Sn Binding Energz
863.5 61.86 + 29.18 K 91.04
1039.4 87.50 _,. 4.47 L 91.97 1.0
A Fermi plot of a source prepared from a 75 Mev
bombardment is given in Figure 6. This plot shows com
plexity. The end point values obtained.are listed in
Table VII.
T~LE VII
Energy in Mev.
0.54 1.47 2.51
Timmer' s re sul ts, mentioned previously, gi ve,,an
end point of 1.45 Mev for Sb116 • The 1.47 Mev end point
is thus in agreement with his results. Also, since the

26.
yield or this isotope goes up by a factor of six in relation
ship to Tell7 when the bambarding energy is increased from
65 to 75 Mev, it is apparent tbat the mass of this isotope
is less tban 117. This isotope was observable in spectro
meter sources from 65 Mev bo.mbardments. One would not
expect it, therefore, to be of maas 115 since to obtain this
at least a (p,7n) reaction is required and from resulta on
Te117, a (p,5n) reaction which does not appear at 50 Mev,
this is not sufficient energy.
From these considerations and the agreement in end
point energies, it seems apparent that this isotope is
Te116
• Wb.en the momentum distribution was calculated from
the three straight lines of the Fermi plot and the areas
measured it was found that the area under the 2.51 Mev
distribution was twice the sum.·of the other two areas.
This may be explained by the .t'act that from the time the
~ellurium was separated until counting started was forty
minutes. This is insufficient time for the antimony
products to have reached equilibrium with the parent
activity. Another possibility is that Sb116 also decays
by K capture. -._If this latter possibility is so it bas not
been observed as yet.
There is a possibility also that 0.540 Mev is
due to Sb116, since hard gamma rays are reported for Sb116
by Timmer at a value of about 700 Kev. He gave no
specifie value and it may be possible that the gamma
energy is a little higher. Thus one might obtain a 900
Kev in cascade with the 0.54 Mev beta. Since Timmer bas
published no Fermi plot, but only his momentum distribution,

27.
it appears tbat he achieved his end point byexamination
of this distribution. In this case he would mias the
0.540 continuum and therefore the possibility of it being
due to Sb116 still remains. Using a radiator in the
spectrometer to examine the gamma rays accompanying this
decay is desirable. However, as yet this bas not been
done. Since the 2.51 Mev end point is one of high
energy and of atrong 1ntens1ty, it ia not possible that
this one could be missed by Timmer and it is therefore
due to the TellS isotope.
It might be mentioned here that at 70 Mev a
tbirty minute activity bas been observed by gross decay
in low intensity in chemiea~ly separated tellurium. No
further work bas yet been done on this.
3. OBSERVATIONS ON SBll8
In the activities atudied by gross decay the
short lived activities tailed off into a six day back
ground. This activity is due to a six day TellS isotope
decaying by K êapture to SbllS whicb bas a half life of
3.5 minutes and a beta end point of 3.1 Mev, as reported
by Linder and Perlman (2). We have here a means ot
studying Sb118 in a beta spectrometer, since with a Te118
source SbllS bas effectively a six day half life. Te118
and all other tellurium activities present in a sample two
days old decay by K capture, and Sbll8 will be the only
positron continuum present.

28.
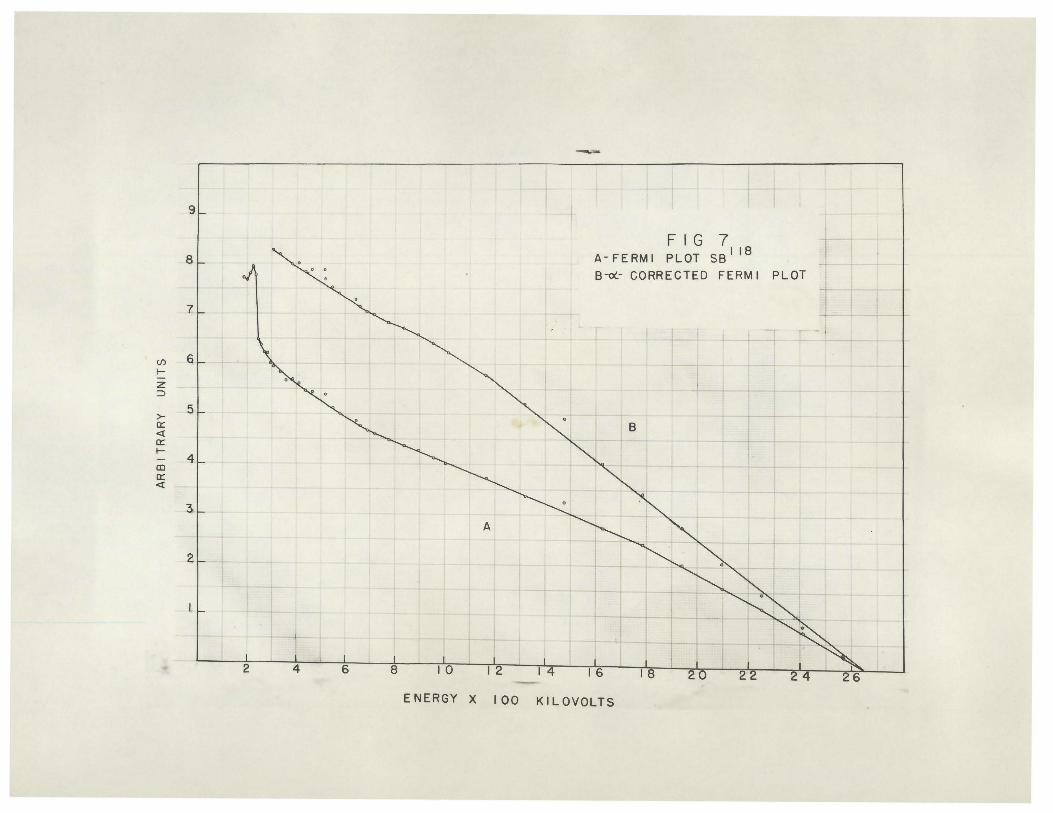
A tellurium source was prepared from an antimony
block bombarded for six hours at 50 Mev. The Fermi plot
of the spectrum given in Figure 7 gives an end point of
2.65 t 0.01 Mev but is not the type expected of an allowed
transition.
Each point on this curve, with the exception of
two at the very highest energy, representa a count of
8000 or higher. Statistical fluctuations are therefore
small. Further, in a study of a short lived activity
obtained from bombarding an antimony block, degraded protons
raised the six day activity to appreciable proportions.
This activity was evaluated for energies up to 1 Mev and
this same curvature was obtained for the Fermi plot.
This spectrum seems to be of a forbidden type,
similar to that for 91 as given by Langer and Priee (17).
In her review of beta spectra previously mentioned, c.s. Wu
lista eleven spectra, all of which are of this type and
can be straightened by multiplying the Fermi function by~
of Equation ( 9-).
2 2 o(_: (W -1 )+(W -W) 0
(9)
All terms are as previously defined.
This correction is one for first forbidden spectra
with a spin change of two and change of parity, which is
only possible for tensor or axial vector forces. This
correction was applied to the spectrum of Sbll8 and, as
shown in Figure 7, for energies down to l Mev the curve is
straightened out. However, for energies below 1 Mev the
curve drops off appreciably.

29.
E. Feinberg and G. Trigg (13), in a recent
review of ft values, pointed out that for nuclei:: of
even atomic weight a group of eight nuclei. with log
(ft) values in the vicinity of 4.4 (allowed), six of
these lie in the very near vicinity of Z : 50. In
cluded in this group is Sbl18. A.M. Feingo1d ( 14),
in his table of log ft values, listed the value for
SbllS as 4.7. This value, based on measurements of
Linder and Perlman, predicts an allowed (unfavored)
type of transition. Further, Shull and Feinberg (25)
point out that for nucleL. satisfying the o<:..-type of
eQrrection (W 2- 1 ) ft is of the order of 1010• This
value for SblÎS is approximately 3 x 10⁶, which is
quite low.
The deviation at low energies could bardly
be due to source thickness sincê 1 Mev is relatively
high energy for such affects, besides the fact that
affects of source thickness would give excess electrons
rather than too few. It is therefore concluded that
the Cl\. -type correction is not sui table for this case.
E.J. Konopinski, in his review article
previously mentioned, in discussing the first order
corrections, points out that for Z larger than Z , c
given by Equation (10),
where oe:..: 1/137 fine structure constant,
(10)

30.
R = nuclear radius in units h/mc,
A = atomic number
and W0
: end point energy (including rest mass) in
units mc2 •
All first order corrections except the oC-type become
independant of energy and the Fermi plot is therefore a
straight line. This is due to the fact that in the cor-
rection factor a term c~i>2 becomes of a dominant
magnitude.
In this case Z0
= 15. The one second order
correction term unaffected by this term was also tried,
but it gave an even poorer fit than did theo( correction.
It seems that Z in this case is not sufficiently greater
than Z0
to nullify the other corrections and therefore
some of the other first order corrections should be tried.
The type of forbidden spectrum most often ob
served is that of the o(-type. This spectrum is not of
this type., nor is 1 t expected to be second forbidden
because of its small f t•. value which, in fact, is even
small for first forbidden spectra. Since 50sn118 is seen
to have even Z and even neutron population one would ex
pect tt to have zero spin. 51sb118, which decays to
sn118 if it is to be first forbidden would then be 50 ' expected to have a spin change 1 ~ 0 or lesa .likely 0 _,..o.
There bave been a number of conversion lines
observed which, sine~ they show appreciable decay in a
few days, are due to either Tell9, TellS or their
antimony daughters. However, their intensity is low and

31.
with the high positron continuum their half lives and
energies are not precise1y determined.
Table VIII contains the more certain of these
1ines, with the more intense ones marked with an *•
TABLE VIII
H Gauss cm.
479.7 * 800.
959.
1242. * 1385.
1530.
1796. * 1960.
2040.
Energy Kev.
19.85
53.54
75.4
121.3
148.
176.
231.2
260.
285.

32.
CONCLUSIONS
A 0.54 Mev beta continuum was observed but as
yet bas not been assigned, other than that it is due to
Tell6 or Sbll6. There is evidence that Te117 emits a
hard gamma ray. Lead absorption experimenta are inadequate
for resolving it due to the presence of a large number of
gamma rays of other isotopes. Further work of the nature
ot radiator experimenta and observation of conversion lines
with a helical baffle in the spectrometer seems advisable.
Te117 was observed, its half lite measured and
its maas determined by observing the growth and sÛbsequent
decay of the known 126 Kev conversion line of Sb117 • The
end point of its positron continuum was shown to be 2.00 Mev.
A;Lso Tell6 was observed to have a half life of
2.9 hours. Its maas was established by the observation of
the end point of the positron continuum of its daughter
activity, Sb116 • The end point of the Tell6 positron
continuum was measured to be 2.51 Mev.
Opportunity was taken to observe the short lived
daughter of TellS. TellS decays by K capture and has a half
life of six days. It was therefore possible to observe
Sb118 in the beta spectrameter. The end point of the latter
was determined to be 2.65 Mev. Attempts to straighten its
Fermi plot, which has the appearance of a torbidden spectrum,
have so far been unsuccesstul. From the negative resulta of
attempts to straighten it, from considerations of expected
spin changes, and from its small FT value, it is now expected
to be of a first forbidden type with spin change 1-..,.o.

33.
BIBLIOG&lPHY
(l) Hisser, Lark, Horowitz and Smith. Pbys. Rev. 57,
355. (1940).
(2) M. Linder and I. Perlman. Phys. Rev. 73, 1124. (1948).
(3) J.J. Livingood and G.T. Seaborg. Phys. Rev. 55,
414. (1939).
(4) K.D. Coleman and M.L. Pool. Pbys. Rev. 72,
1070. (1947).
(5) G.J. Temmer. Phys. Rev. 75, 146A and 76, 424. (1949).
(6) E. Fermi. Zeits. r. Physik. 88, 161. (1934).
(7)
(8)
( 9)
(10)
(11)
(12)
(13)
R.D. Albert and c.s.wu. Phys. Rev. 74, 847. (1948).
C.S.Wu and R.D. Albert. Phys. Rev. 75, 315. (1949).
E.J'. Konopinski and G.E. Uhlenbeck. Phys. Rev. 60,
E. Greulling •. Phys. Rev. 61, 568.
c.s. Wu. Rev. Mod. Phys. 22, 386. j
308. (1941).
(1942).
(1950).
E.J. Konopinski. Re,'v. Mod. Phys. 15, 209. (1943). . 1
E. Feinberg and G. Trigg. Rev. Mod. Phys. 22,
399. ( 1950).
(14) A.M. Feingold. Rev. Mod. Phys. 23, 10. (1951).
(15) Feather. Proc. Camb. Phil. Soc. 34, 599. (1938).
(16) Bleuler and Zuenti. He1vitica Physic Acta XIX,
375. (1946)
(17) L.M. Langer and H.C. Priee. Phys. Rev. 75, 1109. (1949).
(18) M. Deutsch, L.G. Elliott and R.D. Evans. Rev. Sei. Inst.
15, 178. (1944).

34.
BIBLIQGRAPHY (Cont 1 d.)
(19) J.L. Wolf' son. Ph.D. The sis (1948).
(20) D.G. Douglas. Ph.D. The sis (1949).
(21) J.H. Moon. Ph.D. Thesis (1950).
(22) I. Falster. Phys. Rev. 78, 375. (1950).
(23) H.A. Bethe and R.F. Bacher. Rev. Mod. Phys.
194 • ( 1936 ) •
(24) M. Linder. u.c.R.L. 432, 52-3.
8,
(25) Shull and Feinberg. Phys. Rev. 75, 1768. (1949).
(26) G. Lindstrom. Phys. Rev. 83, 465. (1951).

. 1
w r<( _J
CL

0
0
....
"" ... 0
C\1
"" t!) > a: ::;)
u... 0
•o )-cr 0
"" x 0 0
/ 0
0

!'(')
(.!)
u..
0 0
01
- ~ 3S 1 SlNOO~
Y' 0
1 (fi
a: :::;)
0
1 :I:
0
,....
0
,...._
w '\t
1-
1- en (.9 0 1-
....J ~ 0 Cl.. > LL. 0
~ ~
a:: ~ w lL.
0 ... 0
x >-(!)
a:: w z w

0 IX)
0 CD
0 N

w
lO w .....
..... 0
<...9 ...J (/) Q..
.... LL ..J
0 :ii > a:: 0 w ..J u... -
~
0 0
x
>-(!)
0::: 1.1.1 z 1.1.1
S!INO A~\1~118~\1
(/)
tz :::>
>c::r:: <l c::r:: t-
ID c::r:: <l
8
7
FIG 7 j A-FERMI PLOT SB
118
S-oc- CORRECTED FERM 1 PLOT 1
-r-
I
- 1
~
A
ENERGY X lOO KILOVOLTS
0 0 c z -t Cf)
x
0 0 0
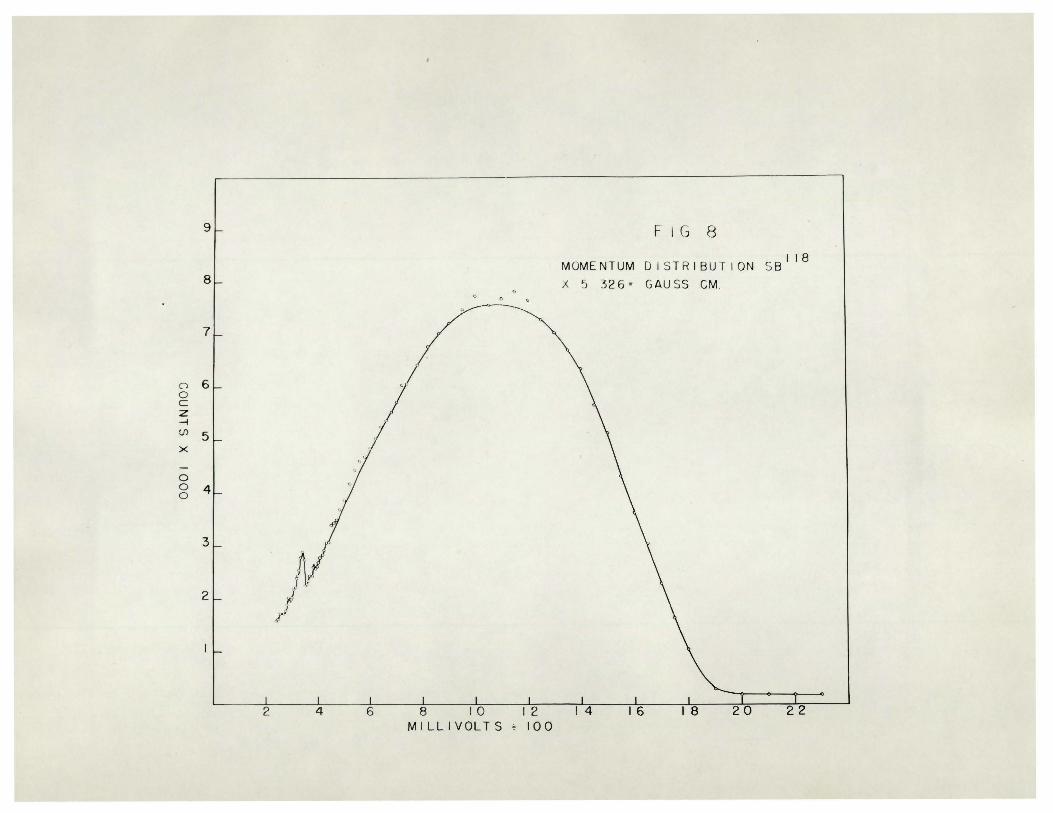
F I(.J 8
MOME NTUM D ISTRI BUT ION SB 1 IS ~ 5 32 6= GAUSS CM.
20 --22


z 0
.... Q.
0 ~ 4D en CD
<.!) c CD en
2 LL. :l
+ z!! .... .... j -CD "" "" :l en .... .... ~ c
1 1 1
c CD \,)
0
/ .-------·::------;00--------o.
0~0 1 0 __ _L_ _ _jllll - 1
0
· ~3-s 1 S!N no ~
0 0
... 01
2 \,)
' 0 2
~
90 z '10 ({r)
0 ( (J .. )
'fO
'1
'1
~
_3
10/o
0
-10%
JO%
0 Eo=3mc 2
-10%
-20%
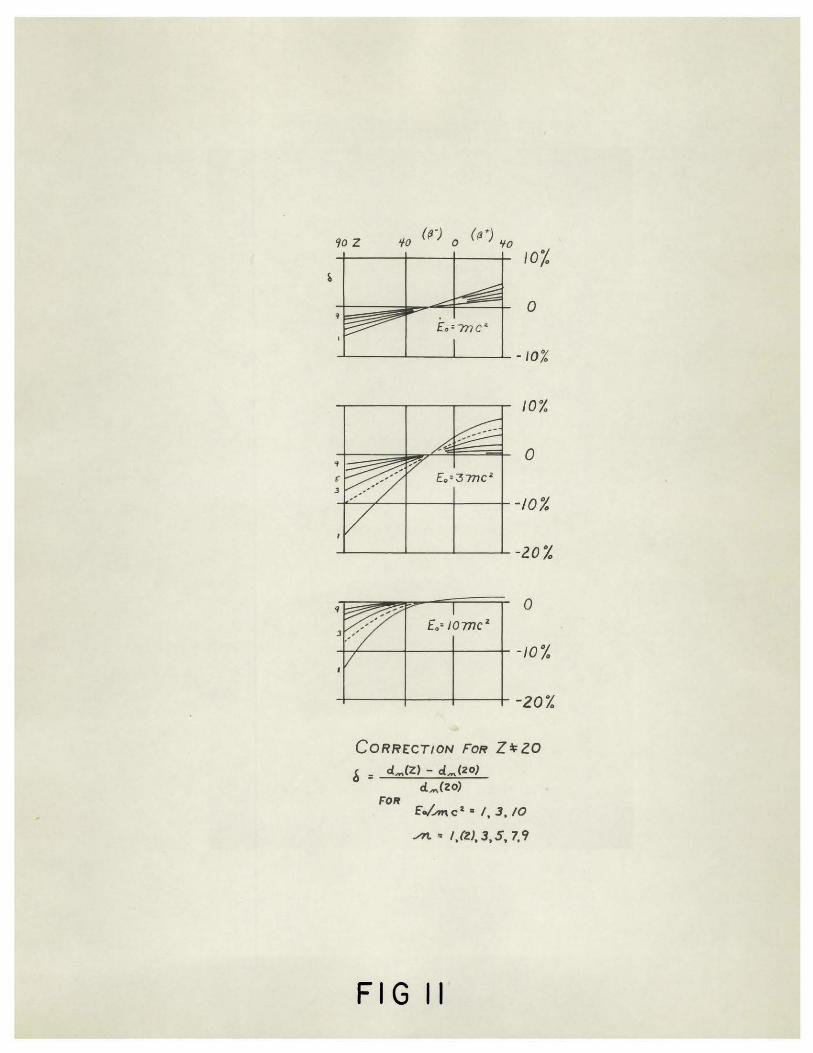
CoRRrcT/ON FoR z~zo ~ = d,.,(Z) - cL,... (zo)
dA\(ZO) FOit
f"./AI'\c 1 • 1, 3,10
At,. l,fZJ,3,5, 7,9
F 1 G Il