oecd fruit and vegetables scheme · 2019-06-07 · the oecd fruit and vegetables scheme organised...
TRANSCRIPT


OECD Fruit and Vegetables Scheme
Proceedings of the
18th Meeting of the Heads of National Inspection Services
May 9-11, 2018 Seville, Spain
Organised by
OECD
Hosted by
Spanish Ministry of Economy, Industry and Competitiveness
ORGANISATION FOR ECONOMIC CO-OPERATION AND DEVELOPMENT ORGANISATION DE COOPÉRATION ET DÉVELOPPEMENT ÉCONOMIQUE


18TH OECD MEETING OF THE HEADS OF NATIONAL INSPECTION SERVICES │ 3
FOREWORD
The OECD Fruit and Vegetables Scheme organised the 18th OECD Meeting of the Heads of National Inspection Services in Seville, Spain, on 9-11 May 2018, on the invitation of the Spanish Ministry of Economy, Industry and Competitiveness. The Meeting was attended by 34 delegates from 18 Scheme's participating countries as well as one Observer country. The Secretariat of the FAO/WHO Codex Alimentarius Commission was also represented.
The objective of the Meeting of the Heads of National Inspection Services is to facilitate discussions between inspection services on major developments and challenges in the fruit and vegetables sector and quality inspection system. It is also a good possibility for the countries to provide an update on the latest developments in inspection techniques and tools, and to harmonise the application of OECD quality standards.
The Meeting focused on inspection systems, traceability, internet sales of fruit and vegetables, new greenhouse technologies, organic produce, fruit and vegetables pests and citrus markets and trends. Spain gave an overview of their national quality inspection systems. Spain also organised a technical visit to see Peach and nectarine production and inspection.
The debates took place at the Chamber of commerce of Seville.

4 │

18TH OECD MEETING OF THE HEADS OF NATIONAL INSPECTION SERVICES │ 5
EXECUTIVE SUMMARY
The Spanish Ministry of Economy, Industry and Competitiveness hosted the 18th OECD Meeting of the Heads of National Inspection Services in Seville, Spain, on 9-11 May 2018. 34 delegates from 18 Scheme's participating countries as well as one Observer country attended the meeting. The Secretariat of the FAO/WHO Codex Alimentarius Commission was also represented.
The Meeting discussed the Spanish fruit and vegetables sector presented by Subdirección General de Frutas y hortalizas y Vitivinicultura Ministerio de Agricultura y Pesca, Alimentación y Medio Ambiente and the Spanish Inspection System provided by Subdirección General de Inspección, Certificación y Asistencia Técnica de Comercio Exterior.
Delegates also listened to a very interesting presentation by ANIA on new trends and technology for the microbiological control of fruit and vegetables. AINIA is a technology centre established in 1987 as a non-profit organisation. ANIA develops tools to anticipate on risks and focused on their work on risks that may affect fruit and vegetables in the future.
The Spanish private sector made a very comprehensive presentation on the citrus sector and the trends and challenges.
Delegates were also updated on organic fruit and vegetables markets, trends and challenges in Spain as well as on strategies applied in Spain to fight against fungi in the fruit and vegetable production.
Delegates also got a detailed insight into new greenhouse technologies.
Participating Countries also discussed several challenges being faced by inspection services amongst participating countries. In particular they discussed the challenges of conformity checks for fruit and vegetables internet sales (distant selling), the feasibility for OECD to develop operating rules to address internet sales and the other issues that should be considered along with internet sales. Delegates also discussed traceability issues and shared experiences on actions taken at national levels to tackle this challenge.
Spain organised a field trip to visit peaches and nectarines harvest sites as well as packinghouses. Delegates welcomed the opportunity to witness first-hand the production cycle of peaches in Spain. The Andalucía region has unique climate conditions that require extreme attention to water and nutrients of the soil. Therefore, farmers need to make the most of their land using state of the art knowledge and technology.
The recommendations of the Heads of National Inspection Services will be submitted to the 2018 77th Plenary Meeting for discussion.

6 │ 18TH OECD MEETING OF THE HEADS OF NATIONAL INSPECTION SERVICES
TABLE OF CONTENTS
EXECUTIVE SUMMARY ................................................................................................................... 5 OPENING ADDRESSES ...................................................................................................................... 8 SECTION I. PRESENTATIONS OF OTHER ORGANISATIONS .............................................. 14
INFORMATION ON RECENT ACTIVITIES OF THE CODEX ALIMENTARIUS COMMISSION ON THE STANDARDIZATION OF FRESH FRUITS AND VEGETABLES ..... 15
Presentation by Ms. Lingping Lingping Zhang, Codex Secretariat ................................................ 16
SECTION II. FRUIT SECTOR IN SPAIN ....................................................................................... 20 SPANISH FRESH FRUIT AND VEGETABLES SECTOR ............................................................. 21
Presentation by Ms Leonor de Castro, Ministerio de Agricultura y Pesca, Alimentación y Medio Ambiente ............................................................................................................................. 22
SPANISH CITRUS INDUSTRY – PRODUCTION, CHALLENGES AND PERSPECTIVES. ..... 31 Presentation by Ms Immaculada Sanfeliu Felui, Comité de Gestión de Cítricos, Spain ................ 32
SECTION III. STRUCTURE AND ACTIVITIES OF INSPECTION IN COUNTRIES ............. 42 SPANISH FRESH FRUIT AND VEGETABLES CONTROL SYSTEM ........................................ 43
Presentation by Ms Maria de Armas, Ministry of Economic Affairs and Competitiveness .......... 44
SECTION IV. FOCUS ON ORGANIC MARKETS ........................................................................ 54 ORGANIC FRUIT & VEGETABLES SALES. MARKETS, TRENDS AND CHALLENGES. ..... 55
Presentation by Mr José Miguel González Otero, Ministerio de Agricultura y Pesca, Alimentación y Medio Ambiente ................................................................................................... 56
SECTION V. FIELD TRIP ................................................................................................................. 62 SUMMARY OF DISCUSSIONS ON THE FIELD (PEACHES AND NECTARINES) .................. 63
Discussants: Primor Fruit company, RKGROWERS, Associafruit, Spain .................................... 63 SUMMARY OF DISCUSSIONS AT THE PACKING HOUSE ...................................................... 64
Discussants: Primor Fruit company, RKGROWERS, Associafruit, Spain .................................... 64
SECTION VI. NEW TECHNOLOGIES FOR FRUIT AND VEGETABLES PRODUCTION AND INSPECTION ............................................................................................................................. 65
NEW GREENHOUSE TECHNOLOGIES ........................................................................................ 66 Presentation by Pr Hasan Silleli, University of Ankara, Turkey .................................................... 67
NEW MICROBIOLOGICAL ANALYSIS IN FRESH FRUITS AND VEGETABLES .................. 79 Presentation by Ms Amparo de Benito, AINIA .............................................................................. 80
SECTION VII. CHALLENGES FOR INSPECTION SERVICES ................................................. 89 TRACEABILITY ............................................................................................................................... 90
Presentation by the OECD Secretariat ............................................................................................ 91
18TH OECD MEETING OF THE HEADS OF NATIONAL INSPECTION SERVICES │ 7
CONFORMITY CHECKS FOR INTERNET SALES OF FRUIT AND VEGETABLES ............... 93 Presentation by the OECD Secretariat ............................................................................................ 94
SECTION VIII. PHYTOSANITARY AND HEALTH RISKS ....................................................... 98 STRATEGIES AGAINST FUNGI IN THE FRUIT AND VEGETABLE PRODUCTION ............. 99
Presentation by Mr Fernando J. Gonzalez, Frutaria SAT, Spain .................................................. 101
FINAL DISCUSSION AND CONCLUSION .................................................................................. 104 ANNEX I. SOME PHOTOS OF THE EVENT ............................................................................... 105 ANNEX II. DRAFT AGENDA ......................................................................................................... 111 ANNEX III. LIST OF PARTICIPANTS ......................................................................................... 114

8 │ 18TH OECD MEETING OF THE HEADS OF NATIONAL INSPECTION SERVICES
OPENING ADDRESSES
The 18th Meeting of the Heads of National Inspection Services was hosted by the Chamber of Commerce of Seville and locally organised by the Seville Centres of SOIVRE, the Inspection Body of the Territorial and Regional Directorate of Trade, under the coordination of the Deputy Directorate of Inspection Certification and Technical Assistance for Foreign Trade, Ministry of Economic Affairs and Competitiveness.
Presentations on this section :
• Opening address 1 by the President of the Chamber of Commerce of Seville
• Opening address 2 by the Regional Trade Director in Andalucía - ICEX (Director of the SOIVRE Centres in Seville)

OPENING ADDRESSES │ 9
Opening address 1
by Mr Francisco Herrero León, President of the Chamber of Commerce of Seville
Dear delegates of the OECD Scheme of Fruits and Vegetables, ladies and gentlemen.
It is an honour for me, as President of the Chamber of Commerce, to host the OECD Heads of Inspection Services Meeting in our home.
One of the most important activities that we have entrusted the Chambers of Commerce is the promotion of the export activity of Spanish companies; therefore, it is a pleasure to receive the Scheme of the OECD Fruits and Vegetables in the Chamber of Commerce of Seville, which contributes to trade facilitation.
I know that the Spanish Administration, in this case the Ministry of Economy, Industry and Competitiveness, and specifically our friends from the Territorial Directorate of Commerce, and the Subdireccion General de Inspección in Madrid, work to facilitate commercial operations, energizing them, promoting them and reinforcing them. Our house is always open to them, and more in this case, for an aim linked to our own objectives as Chamber of Commerce.
When they explained to me exactly what this forum consists of: progress in the standardization of fruits and vegetables, and in the interpretation of these rules, to achieve a common language among operators in order that distance is not an impediment for commercial operations to occur without problems, I was told that commercial quality standards are a common language for international trade, and that it is a way of communicating between the contracting parties of the commercial operation, thus an essential language. But, they also told me how having a good dictionary is essential for having a good language. And they tell me that you are in charge of editing those dictionaries with their interpretative brochures of the norms.
And, although you will already know, let me remind you of the importance of your meticulous and detailed work, since thanks to the development and elaboration of interpretive brochures and inspection guides, the international trade of fruits and vegetables is enormously possible. Can you imagine the international fruit trade without rules and without regulations? It would be chaotic without a doubt.
According to data from the Ministry of Economy, Industry and Competitiveness of Spain, agricultural food exports accounted for EUR 44 542 million in 2016, that is, they accounted for 17.5% of total exports. Within agri-food exports, fruit and vegetable exports accounted for 22.5%. These data speak for themselves about the great importance of the foreign sector of fruits and vegetables for the Spanish economy. Therefore what you are going to decide here is undoubtedly important at the level of the different sectors involved and many decisions are translated into business figures.
I reiterate my welcome and I trust that you will work well and at ease in our house, that these days is yours as well.

10 │ 18TH OECD MEETING OF THE HEADS OF NATIONAL INSPECTION SERVICES
by Mr Francisco Herrero León, President of the Cámara de Comercio de Sevilla
Estimados delegados del Esquema de la OCDE de Frutas y Hortalizas, señoras y señores.
Es un honor para mí, como Presidente de la Cámara de Comercio , el acoger en nuestra casa el Foro de encuentro de los Jefes de los Servicios de Inspección de la OCDE.
Una de las actividades más importantes que tenemos encomendadas las Cámaras de Comercio es el fomento de la actividad exportadora de las empresas españolas, por ello, es un placer recibir al Esquema de la OCDE Frutas y Hortalizas en la Cámara de Comercio de Sevilla, que tanto contribuye a la facilitación del comercio.
Me consta que la Administración española , en este caso el Ministerio de Economía, Industria y Competitividad, y en concreto nuestros amigos de la Dirección Territorial de Comercio, y de la Subdireccion General de Inspección en Madrid, trabajan en post de facilitar las operaciones comerciales, en dinamizarlas, promoverlas y en reforzarlas. Siempre nuestra casa está abierta para ellos, y más en este caso, para un objetivo tan ligado a nuestros propios objetivos como Cámara de Comercio.
Cuando me han explicado en qué consiste exactamente este foro: el progresar en la normalización de las frutas y hortalizas, y en la interpretación de estas normas, para lograr un lenguaje común entre operadores con la finalidad de que la distancia no sea un impedimento para que las operaciones comerciales se produzcan sin problemas, me comentaban que las normas de calidad comercial son un lenguaje común, para el comercio internacional, y que es una manera de comunicarse entre las partes contratantes de la operación comercial, un lenguaje imprescindible. Pero, me comentaban, que tan importante como el lenguaje es tener un buen diccionario. Y me dicen que Ustedes se encargan de editar esos diccionarios con sus folletos interpretativos de las normas.
Y, aunque ya ustedes lo sabrán déjenme recordarles la importancia de su trabajo minucioso y detallado, ya que gracias al desarrollo y la elaboración de folletos interpretativos y guías de inspección, se hace posible enormemente el comercio internacional de frutas y hortalizas. ¿Imaginan el comercio internacional de frutas sin normas y sin reglas? Sería caótico sin duda.
Según datos del Ministerio de Economía, Industria y Competitividad de España, las exportaciones agroalimentarias supusieron en 2016 fueron de 44.542 millones de euros, es decir, representaron el 17.5% de las exportaciones totales. Dentro de las exportaciones agroalimentarias, las exportaciones de fruta y hortalizas significaron el 22,5%. Los datos hablan por sí solos sobre la gran importancia que tiene el sector exterior de frutas y hortalizas para la economía española. Por lo tanto lo que Vds van a decidir aquí sin duda tiene trascendencia a nivel de los distintos sectores implicados y muchas decisiones se traducen en cifras de negocio.
Reitero mi bienvenida y confío que van a trabajar bien y a gusto en nuestra casa, que estos días es la suya.

OPENING ADDRESSES │ 11
Opening address 2
by José Álvarez Calderón, Regional Trade Director in Andalucía - ICEX
Mr Alvarez Calderon (ICEX) took the floor to welcome delegates. He expressed his satisfaction for having the meeting in Andalusia. He stressed the importance of Spain as a major producer and exporter of fresh fruit and vegetables. Indeed, Andalusia is leader in the production of fresh produce. Their exports target not only the EU but also third countries. As an example, he mentioned that Spain exported EUR 8 300 million of fruits in 2017. He also reminded delegates that Spain is committed to the work of the Scheme and that, back in 2013, the photos for the peach brochure were taken here in Seville. To conclude he wished all delegates a fruitful meeting and unforgettable stay in Seville.

12 │ 18TH OECD MEETING OF THE HEADS OF NATIONAL INSPECTION SERVICES

18TH OECD MEETING OF THE HEADS OF NATIONAL INSPECTION SERVICES │ 13
Section summaries

14 │ 18TH OECD MEETING OF THE HEADS OF NATIONAL INSPECTION SERVICES
SECTION I PRESENTATION OF OTHER ORGANISATIONS
The first section is intended to summarise the latest developments in the Fruit and Vegetables quality inspection systems and standardisation activities at the international level. The representative of the WHO/FAO Codex Alimentarius Commission introduced their activities and the latest developments in their programmes of work.
Presentations in the Section:
• Information on recent activities of the Codex Alimentarius Commission on the Standardization of Fresh Fruits and Vegetables

SECTION I. PRESENTATIONS BY OTHER ORGANISATIONS │ 15
Information on recent activities of the Codex Alimentarius Commission on the standardization of fresh fruits and vegetables
by Ms. Lingping Lingping Zhang, Codex Secretariat
Abstract
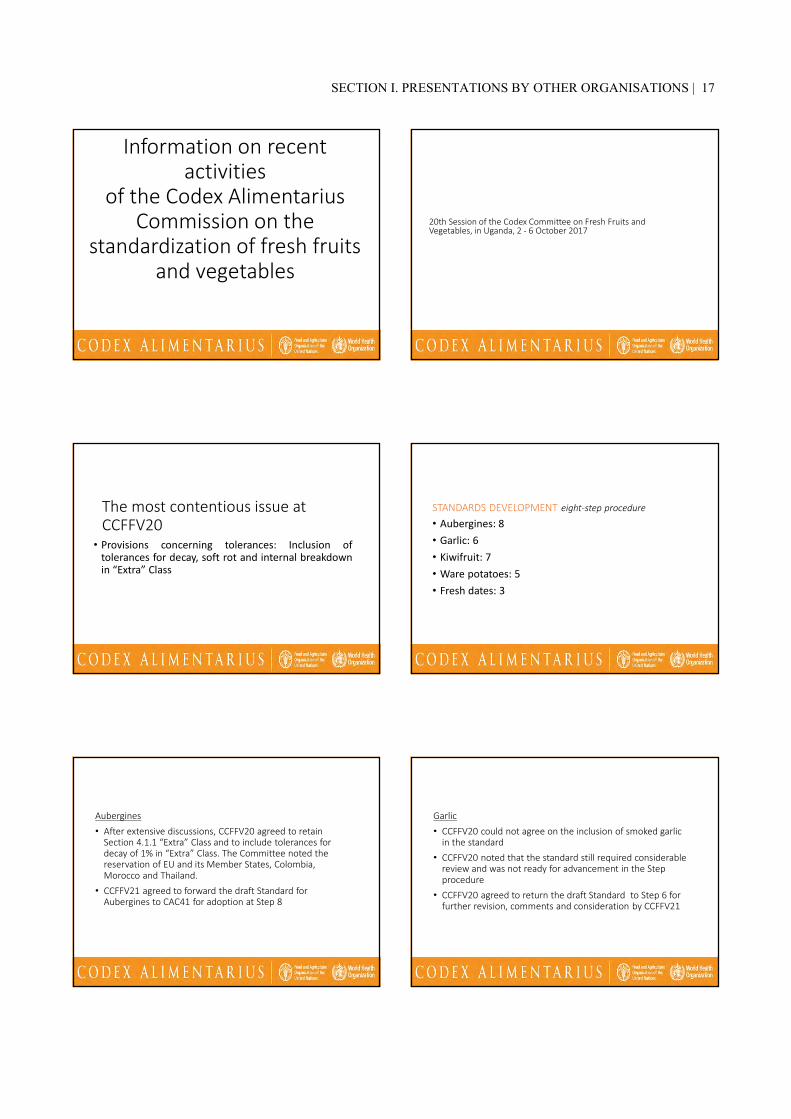
Ms. Lingping Zhang from CODEX thanked OECD for the invitation and provided delegates a brief summary of current activities of the CODEX Secretariat; in particular on the outcome of the 20th Session of the Codex Committee on Fresh Fruits and Vegetables held in Uganda on 2-6 October 2017. CODEX also informed delegates of the status of the aubergines, kiwi, garlic, ware potatoes and fresh dates standards. The aubergine standard has been put forward for adoption at step 8, while the other standards is currently at steps 7, 6, 5 and 3 respectively. New work is under development for yam, onions and shallots, and berry fruits.
On other issues, CODEX will be further discussing the glossary of terms associated with the proposed standard layout as well as other terms used in Codex standards for fresh fruits and vegetables. The exact time and venue of the next 21st Session of the Codex Committee on Fresh Fruits and Vegetables will be announced in due course.

16 │ 18TH OECD MEETING OF THE HEADS OF NATIONAL INSPECTION SERVICES
Information on recent activities of the Codex Alimentarius Commission on the standardization of fresh fruits and vegetables
Presentation by Ms. Lingping Lingping Zhang, Codex Secretariat
Information on recent activities
of the Codex Alimentarius Commission on the
standardization of fresh fruits and vegetables
20th Session of the Codex Committee on Fresh Fruits and Vegetables, in Uganda, 2 - 6 October 2017
The most contentious issue at CCFFV20
• Provisions concerning tolerances: Inclusion oftolerances for decay, soft rot and internal breakdownin “Extra” Class
STANDARDS DEVELOPMENT eight-step procedure
• Aubergines: 8• Garlic: 6• Kiwifruit: 7• Ware potatoes: 5• Fresh dates: 3
Aubergines• After extensive discussions, CCFFV20 agreed to retain
Section 4.1.1 “Extra” Class and to include tolerances for decay of 1% in “Extra” Class. The Committee noted the reservation of EU and its Member States, Colombia, Morocco and Thailand.
• CCFFV21 agreed to forward the draft Standard for Aubergines to CAC41 for adoption at Step 8
Garlic• CCFFV20 could not agree on the inclusion of smoked garlic
in the standard• CCFFV20 noted that the standard still required considerable
review and was not ready for advancement in the Step procedure
• CCFFV20 agreed to return the draft Standard to Step 6 for further revision, comments and consideration by CCFFV21
SECTION I. PRESENTATIONS BY OTHER ORGANISATIONS | 17

Kiwifruit• CCFFV20 could not agree on the allowance for tolerance for
decay, soft rot and internal breakdown in Class I and “Extra” Class
• CCFFV20 agreed to hold the standard at Step 7 and that no further comments would be requested nor discussion on the standard would be held at its next session with the exception of the discussion on tolerances for decay, soft rot and internal breakdown
Ware potatoesCCFFV20 agreed although some issues needed to be further discussed, especially minimum requirements and Table of tolerances, substantial progress had been made on the standard; therefore, the document was ready to progress in the Step Procedure.CCFFV20 agreed to forward the proposed draft Standard to CAC for adoption at Step 5
Fresh datesCCFFV20 agreed although some issues needed to be further discussed, especially minimum requirements and Table of tolerances, substantial progress had been made on the standard; therefore, the document was ready to progress in the Step Procedure.CCFFV20 agreed to return the proposed draft Standard to Step 3, for further revision and consideration by CCFFV21
NEW WORK ON STANDARD DEVELOPMENT
CCFFV21 agreed to recommend approval of three proposals on new work i.e. yam, onions and shallots, and berry fruits.
SUPPORTING DOCUMENT FOR STANDARD DEVELOPMENTProposed Standard Layout for Codex Standards for Fresh Fruits and Vegetables:
CCFFV20 noted that the layout was a guidance document to facilitate development and discussion of standards for fresh fruits and vegetables, and did not have any status in Codex (i.e. it was not a Codex text) and thus did not require approval or adoption by CAC but only the agreement of CCFFV.
SUPPORTING DOCUMENT FOR STANDARD DEVELOPMENT
Glossary of Terms:
CCFFV20 agreed to further develop the discussion paper onglossary of terms associated with the proposed standard layout as well as other terms used in Codex standards for fresh fruits and vegetables for consideration at CCFFV21.
18 | 18TH OECD MEETING OF THE HEADS OF NATIONAL INSPECTION SERVICES

OTHERS• Revision of the meeting interval for CCFFV: every 12 months• Post-harvest treatment for fresh fruits and vegetables for referral to
CCFA• Use of effective communicative tools and quality of the simultaneous
translation
The exact time and venue of CCFFV21 would be determined in due course
YT(1
END
SECTION I. PRESENTATIONS BY OTHER ORGANISATIONS | 19

20 │ 18TH OECD MEETING OF THE HEADS OF NATIONAL INSPECTION SERVICES
SECTION II FRUIT SECTOR IN SPAIN
The aim of this section is to leave the host the opportunity to widely present its fruit and vegetables sector.
Presentations in the Section:
• Spanish fresh fruit and vegetables sector
• Spanish Citrus industry – Production, challenges and perspectives

SECTION II. FRUIT SECTOR IN SPAIN │ 21
Spanish fresh fruits and vegetables sector
by Ms Leonor de Castro, Subdirección General de Frutas y Hortalizas y Vitivinicultura, Dirección General de Producciones y Mercados Agrarios, Ministerio de Agricultura y
Pesca, Alimentación y Medio Ambiente
Abstract
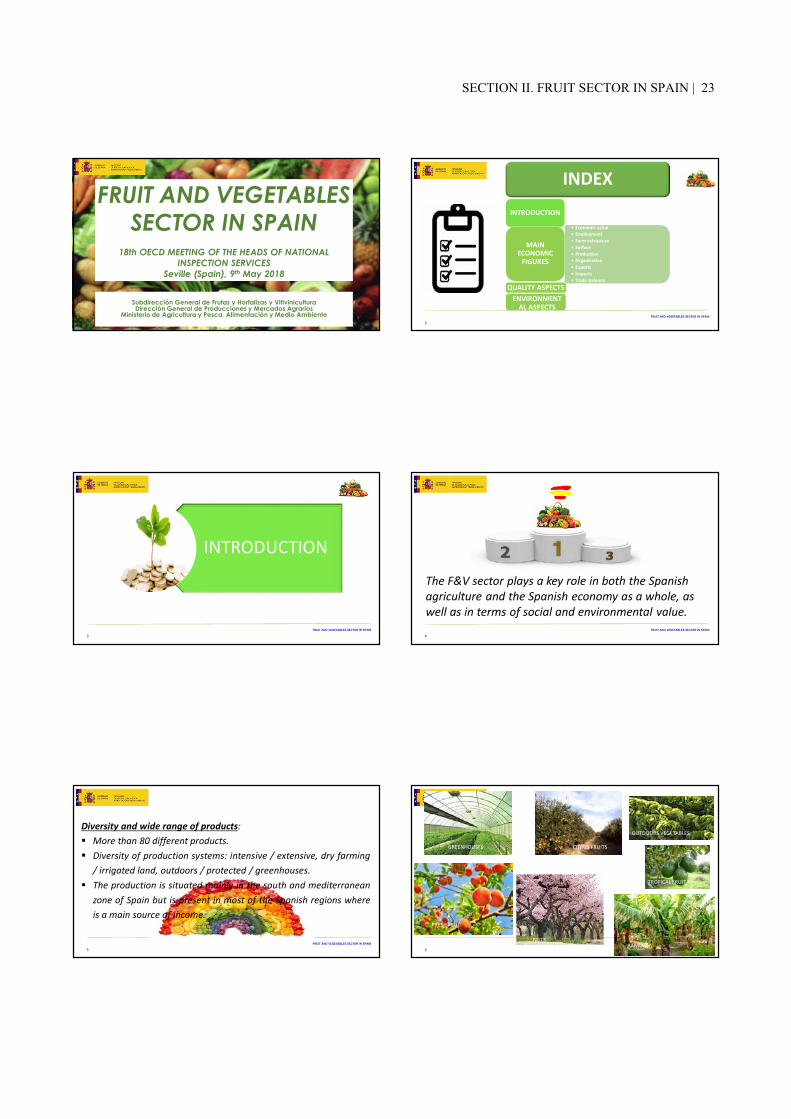
The fruit and vegetables sector plays a key role in both the Spanish agriculture and the Spanish economy as a whole, as well as in terms of social and environmental value.
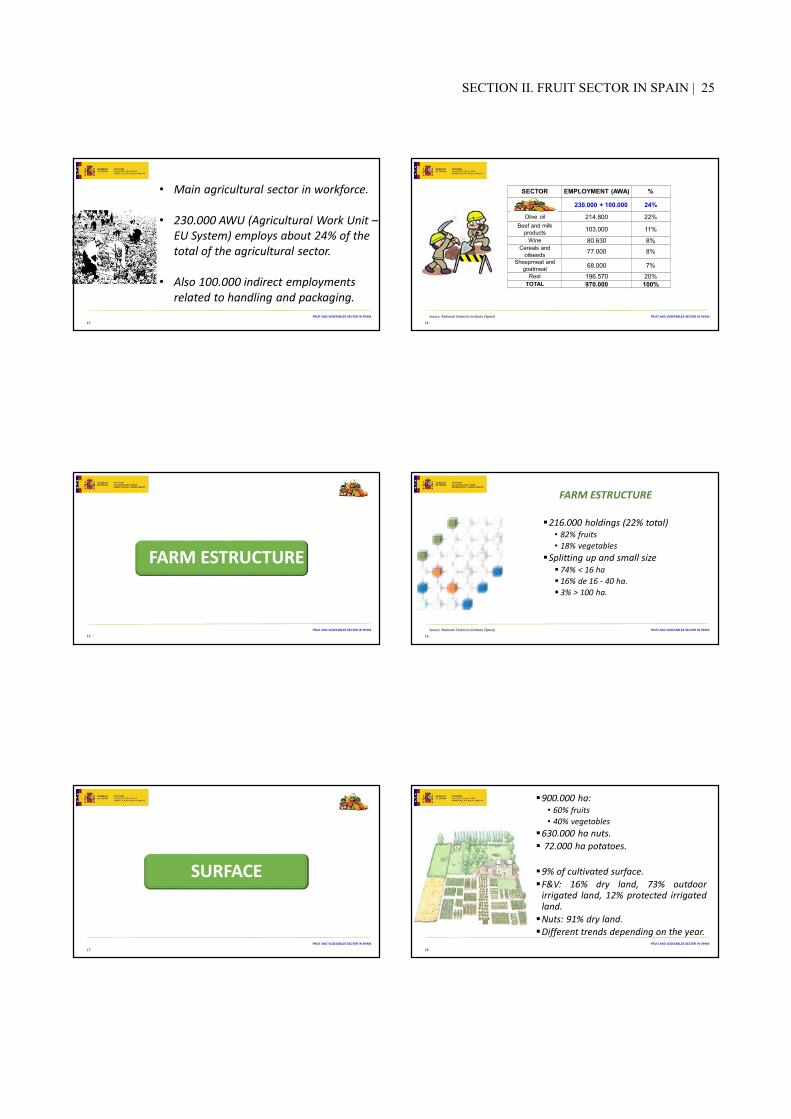
Spain produces more than 80 different products. Production uses a wide variety of systems: intensive, extensive, dry farming, irrigated land, outdoors, protected, and greenhouses. Production is located mainly in the south and Mediterranean zones of Spain but can be found in most of the Spanish regions where is a main source of income, generating 100 000 indirect employments related to handling and packaging.
In 2017, production amounted to EUR 14 500 million, with 50% coming from crop production. The sector is continuously increasing its economic value, and Spain is the main fruit and vegetables producer of the European Union and the 5th worldwide (in terms of value).
Around 50% of production is exported, but in some particular cases even more than 70% are destined to foreign markets. The main products that are exported are vegetables from greenhouses (tomatoes, pepper and cucumber), citrus fruit, peaches and nectarines. From exports, 93% go to the EU market (Germany, France, United Kingdom and the Netherlands).
Imports are modest, but with an increasing trend. Nowadays, 45% of imports have EU origin (France and Portugal mainly) and 55% come from third countries (Morocco, USA, Mercosur). The main imported products are potatoes, tomatoes, green beans, banana, pineapple and kiwifruit.
Farm structure in Spain has a total of 216 000 holdings of which 82% focus on fruits and 18% on vegetables. Amongst farms, 74% have less than 16 ha, 16% go from 16 - 40 ha, and only 3% possess more than 100 ha.
In 2016, a total of 896 518 ha were dedicated to the cultivation of citrus fruit, tropical fruit, fresh fruit, table grape sand bananas. Integrated Production covers 119 763 ha (8% of F&V Surface) distributed as follows: Fresh fruit 41%, Citrus fruit 29%, Tropical fruit 18%, Vegetables 11%, Nuts 8%, and Bananas 3%. Another important aspect of the Spanish fruit and vegetable sector is a positive trend on Organic Farming. Currently, 120 694 ha (8% of F&V Surface) are devoted to organic production, distributed as follows: Nuts 78%, Vegetables 10%, Citrus fruit 6%, Fresh fruit 4%, Tropical fruit 2%, and Bananas 2%.
It is also worth highlighting that in Spain, producer members are obliged to market their entire production through the Producers Organisations (POs). Indeed, 50% of production is marketed through POs.

22 │ 18TH OECD MEETING OF THE HEADS OF NATIONAL INSPECTION SERVICES
Spanish fresh fruits and vegetables sector
Presentation by Ms Leonor de Castro, Subdirección General de Frutas y Hortalizas y Vitivinicultura, Dirección General de Producciones y Mercados Agrarios, Ministerio de
Agricultura y Pesca, Alimentación y Medio Ambiente
FRUIT AND VEGETABLES SECTOR IN SPAIN
1
FRUIT AND VEGETABLES SECTOR IN SPAIN
18th OECD MEETING OF THE HEADS OF NATIONAL INSPECTION SERVICES
Seville (Spain), 9th May 2018
Subdirección General de Frutas y Hortalizas y VitiviniculturaDirección General de Producciones y Mercados Agrarios
Ministerio de Agricultura y Pesca, Alimentación y Medio Ambiente FRUIT AND VEGETABLES SECTOR IN SPAIN
2
INDEXINTRODUCTION
• Economic value• Employment• Farm estructure• Surface• Production• Organisation• Exports• Imports• Trade balance
MAIN ECONOMIC
FIGURES
QUALITY ASPECTSENVIRONMENT
AL ASPECTS
FRUIT AND VEGETABLES SECTOR IN SPAIN
3
INTRODUCTION
FRUIT AND VEGETABLES SECTOR IN SPAIN
4
The F&V sector plays a key role in both the Spanish agriculture and the Spanish economy as a whole, as well as in terms of social and environmental value.
FRUIT AND VEGETABLES SECTOR IN SPAIN
5
Diversity and wide range of products:More than 80 different products.Diversity of production systems: intensive / extensive, dry farming/ irrigated land, outdoors / protected / greenhouses.The production is situated mainly in the south and mediterraneanzone of Spain but is present in most of the Spanish regions whereis a main source of income.
FRUIT AND VEGETABLES SECTOR IN SPAIN
6
GREENHOUSES CITRUS FRUITS
FRESH FRUIT
NUTS
TROPICAL FRUIT
BANANA
OUTDOORS VEGETABLES
SECTION II. FRUIT SECTOR IN SPAIN | 23

FRUIT AND VEGETABLES SECTOR IN SPAIN
7
MAIN ECONOMIC
FIGURESFRUIT AND VEGETABLES SECTOR IN SPAIN
8
ECONOMIC VALUE
FRUIT AND VEGETABLES SECTOR IN SPAIN
9
14.500 M€ in 201750% of Crop Production
30% of Agricultural Production (including crop and animal production)
FRUIT AND VEGETABLES SECTOR IN SPAIN
10
Fuente: SG Estadística, MAPAMA y Eurostat
-
2,000
4,000
6,000
8,000
10,000
12,000
14,000
16,000
2010 2011 2012 2013 2014 2015 2016 2017
EVOLUTION OF THE F&V PRODUCTION IN SPAIN (M€)
Vegetables Potatoes Fruits TOTAL
FRUIT AND VEGETABLES SECTOR IN SPAIN
11
With an increasing economic value, SPAIN is the main F&V producer of the European Union and the 5th worldwide (in terms of value).
SPAIN 19%
ITALY 18%
NETHERLANDS16%FRANCE 15%
GERMANY 10%
RESTO 22%
RANKING OF EU MAIN MSs F&V PRODUCERS (value)
TOTAL VALUE UE (2016): 73.386 M€
FRUIT AND VEGETABLES SECTOR IN SPAIN
12
EMPLOYMENT
24 | 18TH OECD MEETING OF THE HEADS OF NATIONAL INSPECTION SERVICES
FRUIT AND VEGETABLES SECTOR IN SPAIN
13
• Main agricultural sector in workforce.
• 230.000 AWU (Agricultural Work Unit –EU System) employs about 24% of the total of the agricultural sector.
• Also 100.000 indirect employments related to handling and packaging.
FRUIT AND VEGETABLES SECTOR IN SPAIN
14
SECTOR EMPLOYMENT (AWA) %FRUTAS Y
HORTALIZAS 230.000 + 100.000 24%
Olive oil 214.800 22%Beef and milk
products 103.000 11%Wine 80.630 8%
Cereals and oilseeds 77.000 8%
Sheepmeat and goatmeat 68.000 7%
Rest 196.570 20%TOTAL 970.000 100%
Source: National Statistics Institute (Spain)
FRUIT AND VEGETABLES SECTOR IN SPAIN
15
FARM ESTRUCTURE
FRUIT AND VEGETABLES SECTOR IN SPAIN
16
216.000 holdings (22% total)• 82% fruits• 18% vegetables
Splitting up and small size74% < 16 ha16% de 16 - 40 ha.3% > 100 ha.
FARM ESTRUCTURE
Source: National Statistics Institute (Spain)
FRUIT AND VEGETABLES SECTOR IN SPAIN
17
SURFACE
FRUIT AND VEGETABLES SECTOR IN SPAIN
18
900.000 ha:• 60% fruits• 40% vegetables
630.000 ha nuts.72.000 ha potatoes.
9% of cultivated surface.F&V: 16% dry land, 73% outdoorirrigated land, 12% protected irrigatedland.Nuts: 91% dry land.Different trends depending on the year.
SECTION II. FRUIT SECTOR IN SPAIN | 25

FRUIT AND VEGETABLES SECTOR IN SPAIN
19Fuente: Anuario de Estadística MAPAMA
2010 2011 2012 2013 2014 2015 2016
Vegetables 363.729 351.145 348.359 348.853 346.262 347.824 359.868
Citrus fruit 319.163 317.605 311.542 306.303 301.124 298.724 295.331
Fresh fruit 198.118 200.673 200.376 200.168 201.640 201.481 201.316
Tropical fruit 18.990 19.106 19.121 19.833 20.101 19.698 17.456
Table grapes 16.226 15.175 14.548 13.742 14.403 14.034 13.507
Banana 9.117 9.144 9.144 9.131 9.130 9.100 9.040
Total 925.343 912.848 903.090 898.030 892.660 890.861 896.518
Nuts 646.026 631.033 630.106 636.148 630.674 657.611 697.736
Potatoes 77.622 79.865 72.023 71.100 76.100 72.100 73.200
TOTAL 1.648.991 1.623.746 1.605.219 1.605.278 1.599.434 1.620.572 1.667.454
SURFACE (has)
FRUIT AND VEGETABLES SECTOR IN SPAIN
20
PRODUCTION
FRUIT AND VEGETABLES SECTOR IN SPAIN
21
Around 27 million tonnes per year.
52% vegetables, 40% fruits, 8% potaoes.
Spain is the main EU F&V producer accountingwith 26% of the total production.
Spain is the 5th main world producer with 3%of world production (after China, India, USAand Turkey).
PRODUCTION
FRUIT AND VEGETABLES SECTOR IN SPAIN
22Fuente: Anuario de Estadística MAPAMA
2011 2012 2013 2014 2015 2016 % 16 / 15
% 16 /11-15
Vegetables 12.972.604 13.282.939 13.201.085 14.174.385 14.337.646 14.943.484 4% 10%Potatoes 2.455.100 2.200.800 2.199.600 2.544.000 2.245.600 2.244.335 0% -4%Citrus fruit 5.736.197 5.567.672 6.330.040 7.047.335 5.970.493 7.085.819 19% 16%Non citrus fruit 2.928.782 2.552.100 2.669.840 3.100.332 3.000.617 2.854.690 -5% 0’2%
Tropical fruit 225.278 178.139 149.956 169.324 164.988 183.521 11% 3%
Table grapes 241.209 254.258 232.965 280.670 251.786 271.602 8% 8%
Banana 346.500 371.200 361.000 363.602 381.983 421.675 10% 16%Nuts 452.410 441.576 386.219 450.504 445.511 438.579 -2% 1%
TOTAL 25.358.080 24.848.684 25.530.705 28.130.152 26.798.624 28.443.705 6% 9%
PRODUCTION (tonnes)
FRUIT AND VEGETABLES SECTOR IN SPAIN
23Fuente: Anuario de Estadística MAPAMA
PRODUCTION
VEGETABLES 52%
POTATOS 9%
CITRUS FRUIT 24%
FRESH FRUIT11%
TROPICAL FRUIT 1%
TABLE GRAPES 1% BANANAS 1%NUTS 2%
MAIN GROUP OF PRODUCTS (%)
Average 2012-2016
FRUIT AND VEGETABLES SECTOR IN SPAIN
24
GEOGRAPHIC DISTRIBUTION OF F&V PRODUCTION (volume)
26 | 18TH OECD MEETING OF THE HEADS OF NATIONAL INSPECTION SERVICES

FRUIT AND VEGETABLES SECTOR IN SPAIN
25
ORGANISATION
FRUIT AND VEGETABLES SECTOR IN SPAIN
26
568 recognised for the F&V sector (EUregulation).
Objectives: concentration of supply,adaptation of production to demand,optimising production costs.
Producer members are obliged to market theirentire production through the PO.
50% of production is marketed through POs.
FRUIT AND VEGETABLES SECTOR IN SPAIN
27
640 633 639 608598 596 596 585 574 569 568
0
50
100
150
200
250
300
350
400
450
500
550
600
650
2007 2008 2009 2010 2011 2012 2013 2014 2015 2016 2017
0%
10%
20%
30%
40%
50%
60%
70%
2007 2008 2009 2010 2011 2012 2013 2014 2015 2016
PRODUCTION MARKETED BY POs
NUMBER OF PRODUCER ORGANISATIONS
FRUIT AND VEGETABLES SECTOR IN SPAIN
28
EXTERNAL TRADE
FRUIT AND VEGETABLES SECTOR IN SPAIN
29
F&V is one of the maineconomic sectors in thetotal spanish exports .
F&V is the agri – food andfisheries spanish exportsleader.
FRUIT AND VEGETABLES SECTOR IN SPAIN
30
0 5,000 10,000 15,000 20,000 25,000 30,000 35,000 40,000 45,000
MELTING AND STEEL PRODUCTS
TEXTILE
FRUIT AND VEGETABLES
FUELS
CHEMICAL
MOTOR VEHICLES
MAIN SPANISH EXPORTS BY SECTOR (million €)
SECTION II. FRUIT SECTOR IN SPAIN | 27

FRUIT AND VEGETABLES SECTOR IN SPAIN
31
Spain is the main EU exporter and the 3rd world exporter(after China and USA).
Positive trend.
Around 50% of production is exported; more than 70% incertain products such as vegetables from greenhouse,lettuce or lemon.
Main exported product: vegetables from greenhouse(tomatoes, pepper and cucumber), citrus fruit, peachesand nectarines.
EXPORTS
FRUIT AND VEGETABLES SECTOR IN SPAIN
32Fuente: DATACOMEX
EXPORTS
9,649
14,327
6,000
9,000
12,000
15,000
2011 2012 2013 2014 2015 2016 2017
VALUE OF F&V EXPORTS (millIon de €)
FRUIT AND VEGETABLES SECTOR IN SPAIN
33
93% of destination of exports arethe EU market (Germany, France,United Kigdom and theNetherlands)
EXPORTS
FRUIT AND VEGETABLES SECTOR IN SPAIN
34
Average volume (EU): 12,6 million t
EXPORTS
INTRA-EU; 93%
F&V EXPORTS BY DESTINATION (volumen t)
26%
19%
13%
8%
34%
0%
5%
10%
15%
20%
25%
30%
35%
40%
0
500,000
1,000,000
1,500,000
2,000,000
2,500,000
3,000,000
3,500,000
4,000,000
4,500,000
GERMANY FRANCE UNITEDKINGDOM
NETHERLANDS REST
F&V EXPORTS TO EU INTERNAL MARKET BY MEMBER STATES
Volume (t) %
FRUIT AND VEGETABLES SECTOR IN SPAIN
35
Imports are less important tan exports.
Incresing trend.
45% of imports have EU origin (France and Portugalmainly) and 55% third countries (Morocco, USA,Mercosur).
Main imported products: potatoes, tomatoes, greenbeans, banana, pineapple and kiwifruit.
IMPORTS
FRUIT AND VEGETABLES SECTOR IN SPAIN
36
IMPORTS
2,444
4,008
-
1,000
2,000
3,000
4,000
2011 2012 2013 2014 2015 2016 2017
VALUE OF F&V IMPORTS (millIon de €)
28 | 18TH OECD MEETING OF THE HEADS OF NATIONAL INSPECTION SERVICES
FRUIT AND VEGETABLES SECTOR IN SPAIN
37
Average of total imports: 3,4 milion t
IMPORTS
INTRA-UE, 55%
F&V IMPORTS BY ORIGIN (volume t)
26%
11%
5% 4%
9% 8%6% 4% 3% 3%
20%
0%
5%
10%
15%
20%
25%
30%
0
200,000
400,000
600,000
800,000
1,000,000
F&V IMPORTS BY ORIGIN
Volume (t) %
FRUIT AND VEGETABLES SECTOR IN SPAIN
38
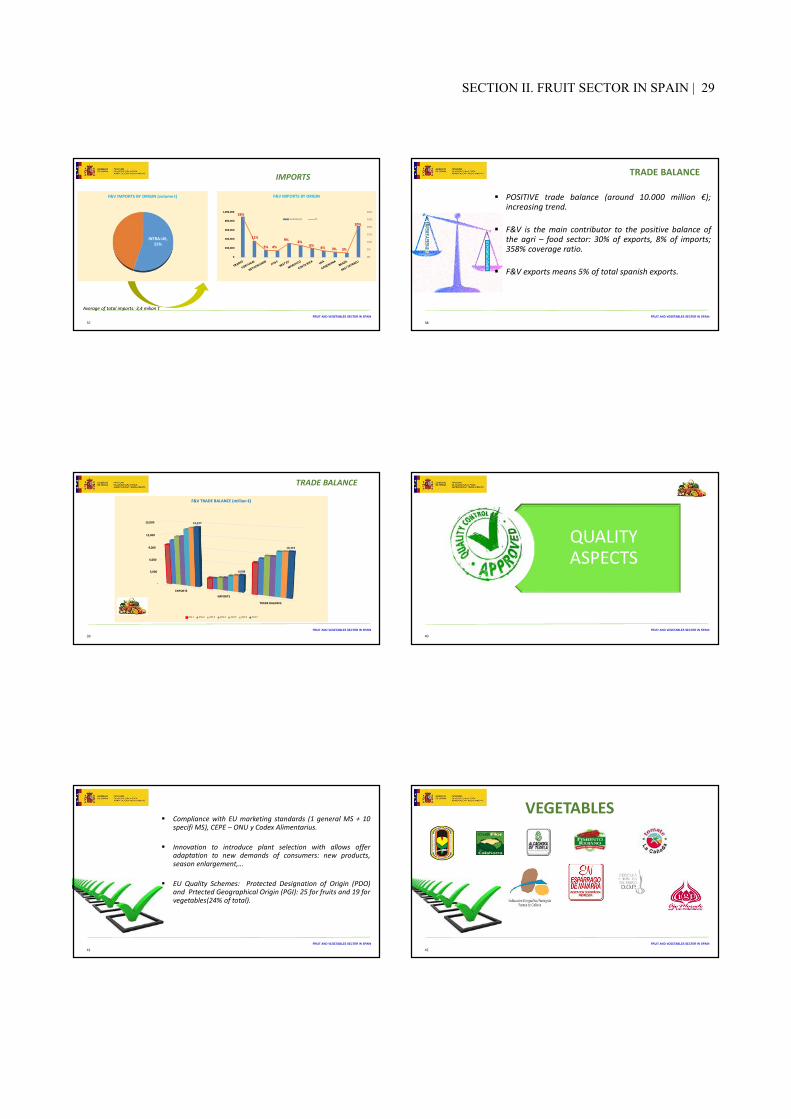
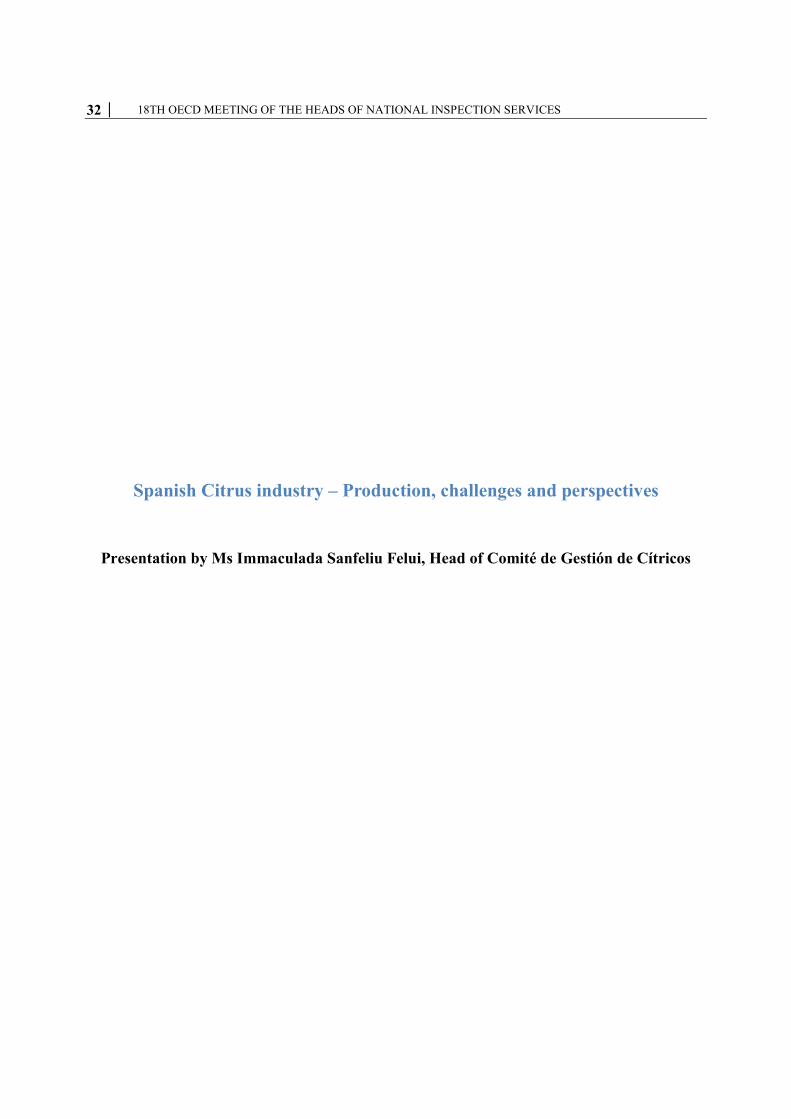
POSITIVE trade balance (around 10.000 million €);increasing trend.
F&V is the main contributor to the positive balance ofthe agri – food sector: 30% of exports, 8% of imports;358% coverage ratio.
F&V exports means 5% of total spanish exports.
TRADE BALANCE
FRUIT AND VEGETABLES SECTOR IN SPAIN
39
TRADE BALANCE
-
3,000
6,000
9,000
12,000
15,000
EXPORTS
IMPORTS
TRADE BALANCE
14,327
4,008
10,319
F&V TRADE BALANCE (million €)
2011 2012 2013 2014 2015 2016 2017
FRUIT AND VEGETABLES SECTOR IN SPAIN
40
QUALITY ASPECTS
FRUIT AND VEGETABLES SECTOR IN SPAIN
41
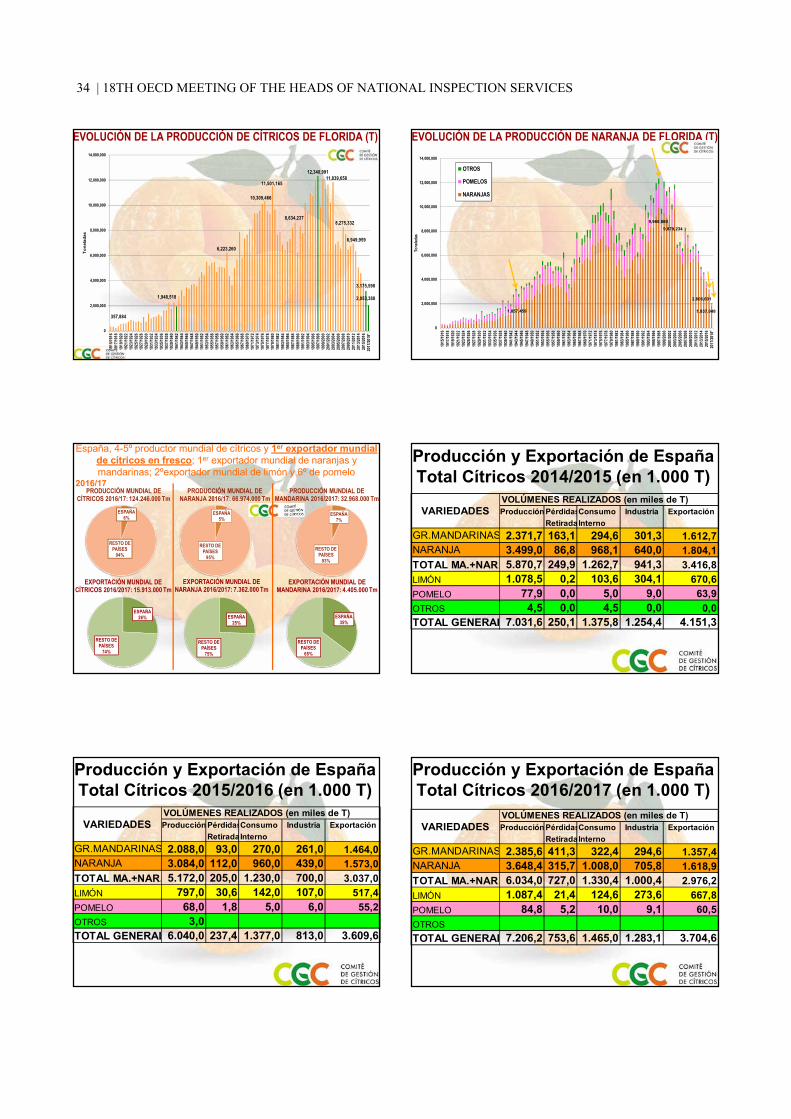
Compliance with EU marketing standards (1 general MS + 10specifi MS), CEPE – ONU y Codex Alimentarius.
Innovation to introduce plant selection with allows offeradaptation to new demands of consumers: new products,season enlargement,…
EU Quality Schemes: Protected Designation of Origin (PDO)and Prtected Geographical Origin (PGI): 25 for fruits and 19 forvegetables(24% of total).
FRUIT AND VEGETABLES SECTOR IN SPAIN
42
VEGETABLES
SECTION II. FRUIT SECTOR IN SPAIN | 29

FRUIT AND VEGETABLES SECTOR IN SPAIN
43
FRUITS
FRUIT AND VEGETABLES SECTOR IN SPAIN
44
ENVIRONMENTAL ASPECTS
FRUIT AND VEGETABLES SECTOR IN SPAIN
45
INTEGRATED PRODUCTION: 119.763 Ha (8% of F&V Surface) distributed as follows:Fresh fruit 41%Citrus fruit 29%Tropical fruit 18%Vegetables 11%Nuts 8%Banana 3%
ORGANIC FARMING: 120.694 Ha (8% of F&V Surface) distributed as follows:Nuts 78%Vegetables 10%Citrus fruit 6%Fresh fruit 4%Tropical fruit 2%Banana 2%
POSITIVE TREND
FRUIT AND VEGETABLES SECTOR IN SPAIN
46
ENVIRONMENTALLY FRIENDLY PRODUCTION
0%
2%
4%
6%
8%
10%
12%
14%
16%
18%
VEGETABLES CITRUS FRUIT FRESH FRUIT TROPICAL FRUIT BANANA NUTS
% INTEGRATED PRODUCTION / total % ORGANIC FARMING / total
Surface
47
THANK YOU VERY MUCH FOR YOUR
ATTENTIONS.G DE FRUTAS Y HORTALIZAS Y VITIVINICULTURAC/ Almagro, 33, 6ª planta. MADRIDTf: 913476718 E-mail: [email protected]
30 | 18TH OECD MEETING OF THE HEADS OF NATIONAL INSPECTION SERVICES

SECTION II. FRUIT SECTOR IN SPAIN │ 31
Spanish Citrus industry – Production, challenges and perspectives
by Ms Immaculada Sanfeliu Felui, Head of Comité de Gestión de Cítricos
Abstract
In 2017 the world produced 124.25 million tonnes of citrus. From those, 54% were oranges, 26% tangerines, 13% lemons and 7% grapefruit.
In terms of producing countries, China has the lead generating 27% of all citrus production, followed by Brazil (14%), India (8%) and Spain (6%). This said, the last forecast for 2018 warned of a 21% fall in production with respect to the previous year. Pests and adverse climate situations have contributed to the production shortage around the globe.
Although Spain is the 4th or 5th global producer, it is the first exporter of oranges and tangerines worldwide. Exporting on average 3 704 000 tonnes in 2017 and dedicating a total of 299 518 ha to cultivate citrus. From those, 50% are used for oranges, 37% to tangerines, and 13% to lemons.
Inside Spain, Valencia produces 54% of all Spanish citrus production, followed by Andalusia (28%), Murcia (14%), Cataluña (4%) and the rest in Baleares and other regions.
In the case of the European Union, Spain supplies 80% of tangerines and 69% of oranges making it the largest supplier of citrus to the continent. The main destination markets are Germany (28%), France (23%), The UK (9%) and the Netherlands (6%).
Outside the EU, Spain’s main destination markets are Switzerland, the US and Canada. The key months for exports go from November to February every year
In monetary terms, citrus exports amounted to EUR 3 181 million last year.
32 │ 18TH OECD MEETING OF THE HEADS OF NATIONAL INSPECTION SERVICES
Spanish Citrus industry – Production, challenges and perspectives
Presentation by Ms Immaculada Sanfeliu Felui, Head of Comité de Gestión de Cítricos
Inmaculada Sanfeliu Feliu
Jornada cítricosInnovagri
24 de abril de 2018Autoridad Portuaria de Valencia
Salón de ActosAvda. Muelle del Turia s/n. Valencia.
LA CITRICULTURA EN ESPAÑAPROBLEMÁTICA, RETOS Y PERSPECTIVAS
47,133.2
58,891.7
84,209.1
95,563.5
131,707.7130,947.0
124,246
0
20,000
40,000
60,000
80,000
100,000
120,000
140,000
Media1979/19801988/1989
ó 1980-1989
Media1989/19901998/1999
ó 1990-1999
Media1969/19701978/1979
ó 1970-1979
1999/20002000/2001
2001/20022002/2003
2003/20042004/2005
2005/20062006/2007
2007/20082008/2009
2009/2010
en 1.000 Tm
2010/20112011/2012
2012/20132013/2014
2014/20152015/2016
2016/2017
PRODUCCIÓN MUNDIAL DE CÍTRICOS
PRODUCCIÓN MUNDIAL DE CÍTRICOS POR PRODUCTO
NARANJA54%
67-72 Mill TmMANDARINA
26%33-38 Mill Tm
LIMÓN13%
15-16 Mill Tm
POMELO7%
8-9 Mill Tm
PRODUCCIÓN MUNDIAL DE CÍTRICOS POR PRODUCTO.
CAMPAÑA 2016/2017 124,25 Millones de Tm
China; 32,71 Mill. T; 26%
Países Mediterráneos
(CLAM); 25,22 Mill. T; 20%
India; 9,76 Mill. T;
8%EEUU;
7,83 Mill. T; 6%
Mexico ; 6,63 Mill. T;
5%Irán; 4,07 Mill. T;
3%
Pakistan ; 1,91 Mill. T;
2%
Indonesia; 1,58 Mill. T;
1%
Japón; 1,14 Mill. T;
1%
Tailandia; 1,10 Mill. Tn;
1%
Otros HemisferioNorte;5,
91 Mill. Tn; 5% Brasil; 16,55 Mill. T; 13%
Argentina; 2,80 Mill. T;
2%
Sudáfrica; 2,41 Mill. T;
2%
Perú; 1,11 Mill. T;
1%Otros Hemisferio Sur; 3,52 Mill. T;
3%
Producción Mundial de Cítricos 2016/2017:124,25 Millones T
HEMISFERIO SUR (< 1/3) 26,40 Mill. T
HEMISFERIO NORTE (> 2/3) 97,85 Mill. T
PRODUCCIÓN MUNDIAL DE CÍTRICOS 2016/2017: 124,25 Millones deT27% CHINA, 20% PAÍSES MEDITERRÁNEOS, 14% BRASIL, 8% INDIA
PRODUCCIÓN MUNDIAL DE CÍTRICOS 2016/2017: 124,25 Millones deT27% CHINA, 14% BRASIL, 8% INDIA, 6% ESPAÑA, 6% EE.UU., 5% MÉXICO
China27%
España6%
Egipto4%
Turquía3%Italia
3%Marruecos2%
India8%
USA6%
Mexico 5%
Otros Hemisferio
Norte15%
Brazil14%
Argentina2%
Sudáfrica2%
Otros Hemisferio Sur
4%
HEMISFERIO SUR (< 1/3) 26,40 Mill. T
HEMISFERIO NORTE (> 2/3) 97,85 Mill. T
EVOLUCIÓN DE LA PRODUCCIÓN DE CÍTRICOS DE EE.UU.Previsión de cosecha EE.UU. 2017/2018: 6,16 Mill. Tm, reducción 21% respecto a 2016/2017
SECTION II. FRUIT SECTOR IN SPAIN | 33
EVOLUCIÓN DE LA PRODUCCIÓN DE CÍTRICOS DE FLORIDA (T)
357,884
1,948,518
6,223,260
10,309,466
11,501,165
8,634,237
12,340,99111,839,658
8,275,332
6,949,959
3,175,598
2,053,388
0
2,000,000
4,000,000
6,000,000
8,000,000
10,000,000
12,000,000
14,000,000
1915
/1916
1917
/1918
1919
/1920
1921
/1922
1923
/1924
1925
/1926
1927
/1928
1929
/1930
1931
/1932
1933
/1934
1935
/1936
1937
/1938
1939
/1940
1941
/1942
1943
/1944
1945
/1946
1947
/1948
1949
/1950
1951
/1952
1953
/1954
1955
/1956
1957
/1958
1959
/1960
1961
/1962
1963
/1964
1965
/1966
1967
/1968
1969
/1970
1971
/1972
1973
/1974
1975
/1976
1977
/1978
1979
/1980
1981
/1982
1983
/1984
1985
/1986
1987
/1988
1989
/1990
1991
/1992
1993
/1994
1995
/1996
1997
/1998
1999
/2000
2001
/2002
2003
/2004
2005
/2006
2007
/2008
2009
/2010
2011
/2012
2013
/2014
2015
/2016
2017
/2018
*
Tone
lada
s
EVOLUCIÓN DE LA PRODUCCIÓN DE NARANJA DE FLORIDA (T)
1,857,459
9,960,8809,879,234
2,806,601
1,837,048
0
2,000,000
4,000,000
6,000,000
8,000,000
10,000,000
12,000,000
14,000,000
1915
/1916
1917
/1918
1919
/1920
1921
/1922
1923
/1924
1925
/1926
1927
/1928
1929
/1930
1931
/1932
1933
/1934
1935
/1936
1937
/1938
1939
/1940
1941
/1942
1943
/1944
1945
/1946
1947
/1948
1949
/1950
1951
/1952
1953
/1954
1955
/1956
1957
/1958
1959
/1960
1961
/1962
1963
/1964
1965
/1966
1967
/1968
1969
/1970
1971
/1972
1973
/1974
1975
/1976
1977
/1978
1979
/1980
1981
/1982
1983
/1984
1985
/1986
1987
/1988
1989
/1990
1991
/1992
1993
/1994
1995
/1996
1997
/1998
1999
/2000
2001
/2002
2003
/2004
2005
/2006
2007
/2008
2009
/2010
2011
/2012
2013
/2014
2015
/2016
2017
/2018
*
Tone
ladas
OTROS
POMELOS
NARANJAS
España, 4-5º productor mundial de cítricos y 1er exportador mundial de cítricos en fresco; 1er exportador mundial de naranjas y mandarinas; 2ºexportador mundial de limón y 6º de pomelo
2016/17
ESPAÑA6%
RESTO DE PAÍSES
94%
PRODUCCIÓN MUNDIAL DE CÍTRICOS 2016/17: 124.246.000 Tm
ESPAÑA26%
RESTO DE PAÍSES
74%
EXPORTACIÓN MUNDIAL DE CÍTRICOS 2016/2017: 15.913.000 Tm
ESPAÑA5%
RESTO DE PAÍSES
95%
PRODUCCIÓN MUNDIAL DE NARANJA 2016/17: 66.974.000 Tm
ESPAÑA25%
RESTO DE PAÍSES
75%
EXPORTACIÓN MUNDIAL DE NARANJA 2016/2017: 7.362.000 Tm
ESPAÑA7%
RESTO DE PAÍSES
93%
PRODUCCIÓN MUNDIAL DE MANDARINA 2016/2017: 32.968.000 Tm
ESPAÑA35%
RESTO DE PAÍSES
65%
EXPORTACIÓN MUNDIAL DE MANDARINA 2016/2017: 4.405.000 Tm
Producción y Exportación de EspañaTotal Cítricos 2014/2015 (en 1.000 T)
VOLÚMENES REALIZADOS (en miles de T)PérdidasConsumoRetiradaInterno
GR.MANDARINAS 2.371,7 163,1 294,6 301,3 1.612,7NARANJA 3.499,0 86,8 968,1 640,0 1.804,1TOTAL MA.+NAR. 5.870,7 249,9 1.262,7 941,3 3.416,8LIMÓN 1.078,5 0,2 103,6 304,1 670,6POMELO 77,9 0,0 5,0 9,0 63,9OTROS 4,5 0,0 4,5 0,0 0,0TOTAL GENERAL 7.031,6 250,1 1.375,8 1.254,4 4.151,3
Industria ExportaciónVARIEDADES Producción
Producción y Exportación de EspañaTotal Cítricos 2015/2016 (en 1.000 T)
VOLÚMENES REALIZADOS (en miles de T)PérdidasConsumoRetiradaInterno
GR.MANDARINAS 2.088,0 93,0 270,0 261,0 1.464,0NARANJA 3.084,0 112,0 960,0 439,0 1.573,0TOTAL MA.+NAR. 5.172,0 205,0 1.230,0 700,0 3.037,0LIMÓN 797,0 30,6 142,0 107,0 517,4POMELO 68,0 1,8 5,0 6,0 55,2OTROS 3,0TOTAL GENERAL 6.040,0 237,4 1.377,0 813,0 3.609,6
Industria ExportaciónVARIEDADES Producción
Producción y Exportación de EspañaTotal Cítricos 2016/2017 (en 1.000 T)
VOLÚMENES REALIZADOS (en miles de T)PérdidasConsumoRetiradaInterno
GR.MANDARINAS 2.385,6 411,3 322,4 294,6 1.357,4NARANJA 3.648,4 315,7 1.008,0 705,8 1.618,9TOTAL MA.+NAR. 6.034,0 727,0 1.330,4 1.000,4 2.976,2LIMÓN 1.087,4 21,4 124,6 273,6 667,8POMELO 84,8 5,2 10,0 9,1 60,5OTROSTOTAL GENERAL 7.206,2 753,6 1.465,0 1.283,1 3.704,6
Industria ExportaciónVARIEDADES Producción
34 | 18TH OECD MEETING OF THE HEADS OF NATIONAL INSPECTION SERVICES

3,510.63,867.0
4,543.04,246.0
4,862.94,876.3
4,704.1
5,290.1
4,601.45,128.4
4,679.34,474.8
5,885.5
4,999.7
5,770.05,511.9
5,750.75,935.2
6,280.66,181.3
5,226.0
6,815.4
5,374.8
6,614.1
5,347.6
6,627.0
7,501.3
6,800.77,240.8
7,031.66,040.0
7,206.2
6,231.3
0.0
1,000.0
2,000.0
3,000.0
4,000.0
5,000.0
6,000.0
7,000.0
8,000.0ESPAÑA: EVOLUCIÓN PRODUCCIÓN CÍTRICOS
Campaña 2011/12, Campaña Récord en Producción
en 1.000 Tm
EXPORTACIÓN DE CÍTRICOS DE ESPAÑA ( T )
1,742,622
2,354,6262,579,761
3,177,3093,246,357
3,300,7113,562,980
3,224,868
3,610,4073,369,673
3,644,0003,760,2003,861,700
3,760,500
4.151.300
3,609,6003,704,600
0
500,000
1,000,000
1,500,000
2,000,000
2,500,000
3,000,000
3,500,000
4,000,000
4,500,000
en T
Campaña 14/15 Campaña Récord de Exportación
ENCUESTA SOBRE SUPERFICIES Y RENDIMIENTOS DE CULTIVOS EN ESPAÑA (ESYRCE)
RESULTADOS 2004-2016 (Ha)ENCUESTA SOBRE SUPERFICIES Y RENDIMIENTOS DE CULTIVOS EN ESPAÑA (ESYRCE)
RESULTADOS 2004-2017 (ha)Superficie (ha) AñoCultivos y cubiertas del suelo 2004 2005 2006 2007 2008 2009 2010 2011 2012 2013 2014 2015 2016 20170a Frutales citricos 305.954 306.557 320.530 332.796 332.626 320.778 314.575 311.584 305.954 303.028 299.478 299.518 297.535 297.0160A010 NARANJO 150.094 148.493 159.805 165.103 166.671 159.395 157.623 159.231 157.592 155.830 152.183 148.777 145.818 144.7060A020 MANDARINO 109.786 113.355 117.209 122.554 120.695 117.545 115.101 112.593 109.386 107.783 107.761 110.177 109.040 107.2490A030 LIMONERO 44.465 42.905 41.573 43.264 43.233 41.816 39.750 38.220 37.068 37.068 36.980 38.105 40.191 41.8230A040 POMELO 1.042 1.029 1.061 1.190 1.432 1.450 1.509 1.290 1.325 1.435 1.466 1.555 1.525 1.8140A050 NARANJO AMARGO 179 66 40 25 48 65 65 64 99 348 120 239 230 2750A060 OTROS CITRICOS 387 710 843 661 547 508 527 186 484 563 968 665 731 1.149
ESPAÑA: SUPERFICIE CITRÍCOLA
NARANJO50%MANDARI
NO37%
LIMONERO13%
POMELO0%
NARANJO AMARGO
0%
OTROS CÍTRICOS
0%
Fuente: Encuesta sobre Superficies y Rendimientos 2015, ESYRCE 2015. Ministerio de Agricultura, Alimentación y Medio Ambiente.
ESPAÑA: ZONAS DE PRODUCCIÓN CITRÍCOLA
CC.AA.SUP (ha)
Com. Valenciana 162.093Andalucía 82.772Murcia 41.078Cataluña 11.157Baleares 1.050Otras CC.AA. 1.368TOTAL 299.518
Com. Valenciana
54%Andalucía
28%
Murcia14%
Cataluña4%
Baleares0%
Otras CCAA
0%
Fuente: Encuesta sobre Superficies y Rendimientos 2015, ESYRCE 2015. Ministerio de Agricultura, Alimentación y Medio Ambiente.
SECTION II. FRUIT SECTOR IN SPAIN | 35

ESPAÑA: ZONAS DE PRODUCCIÓN DE NARANJA
CC.AA.SUP (ha)
Com. Valenciana 73.775Andalucía 60.471Murcia 11.284Cataluña 1.700Baleares 521Otras CC.AA. 1.026TOTAL 148.777
Com. Valenciana
50%
Andalucía41%
Murcia7%
Cataluña1%
Baleares0%
Otras CCAA
1%
Fuente: Encuesta sobre Superficies y Rendimientos 2015, ESYRCE 2015. Ministerio de Agricultura, Alimentación y Medio Ambiente.
ESPAÑA: ZONAS DE PRODUCCIÓN DE MANDARINA
CC.AA.SUP (ha)
Com. Valenciana 77.541Andalucía 16.537Murcia 6.664Cataluña 9.310Baleares 111Otras CC.AA. 14
TOTAL 110.177
Com. Valenciana
70%
Andalucía15%
Murcia6%
Cataluña9%
Baleares0%
Otras CCAA
0%
Fuente: Encuesta sobre Superficies y Rendimientos 2015, ESYRCE 2015. Ministerio de Agricultura, Alimentación y Medio Ambiente.
ESPAÑA: ZONAS DE PRODUCCIÓN DE LIMÓN
CC.AA.SUP (ha)
Com. Valenciana 9.678Andalucía 5.087Murcia 22.608Cataluña 12Baleares 418Otras CC.AA. 302TOTAL 38.105
Com. Valenciana
26%
Andalucía13%Murcia
59%
Cataluña0%
Baleares1%
Otras CCAA
1%
Fuente: Encuesta sobre Superficies y Rendimientos 2015, ESYRCE 2015. Ministerio de Agricultura, Alimentación y Medio Ambiente.
4,151,300
0
500,000
1,000,000
1,500,000
2,000,000
2,500,000
3,000,000
3,500,000
4,000,000
4,500,000
1849
1890
1897
1900
1903
1906
1909
1912
1915
1918
1921
1924
1927
1930
1933
1936
/3719
39/40
1942
/4319
45/46
1949
/5019
52/53
1955
/5619
58/59
1961
/6219
64/65
1967
/6819
70/71
1973
/7419
76/77
1981
/8219
84/85
1987
/8819
90/91
1993
/9419
96/97
1999
/0020
02/03
2005
/0620
08/09
2011
/1220
14/15to
nelad
as
Campaña Récord de Exportación, Campaña 2014/2015 con 4.151.300 Tm
exportadas
EXPORTACIÓN DE CÍTRICOS DE ESPAÑA (1849-2016/17)
EXPORTACIÓN DE CÍTRICOS DE ESPAÑA ( T )
1,742,622
2,354,6262,579,761
3,177,3093,246,357
3,300,7113,562,980
3,224,868
3,610,4073,369,673
3,644,0003,760,2003,861,700
3,760,500
4.151.300
3,609,6003,704,600
0
500,000
1,000,000
1,500,000
2,000,000
2,500,000
3,000,000
3,500,000
4,000,000
4,500,000
en T
Campaña 14/15 Campaña Récord de ExportaciónProducción y Exportación de EspañaTotal Cítricos 2014/2015 (en 1.000 T)
VOLÚMENES REALIZADOS (en miles de T)PérdidasConsumoRetiradaInterno
GR.MANDARINAS 2.371,7 163,1 294,6 301,3 1.612,7NARANJA 3.499,0 86,8 968,1 640,0 1.804,1TOTAL MA.+NAR. 5.870,7 249,9 1.262,7 941,3 3.416,8LIMÓN 1.078,5 0,2 103,6 304,1 670,6POMELO 77,9 0,0 5,0 9,0 63,9OTROS 4,5 0,0 4,5 0,0 0,0TOTAL GENERAL 7.031,6 250,1 1.375,8 1.254,4 4.151,3
Industria ExportaciónVARIEDADES Producción
36 | 18TH OECD MEETING OF THE HEADS OF NATIONAL INSPECTION SERVICES

Producción y Exportación de EspañaGrupo Mandarinas 2014/2015
(en 1.000 T)VOLÚMENES REALIZADOS (en miles de T)
PérdidasConsumoRetiradaInterno
Satsuma 222,3 59,0 65,0 36,0 62,3Clementina 1.550,9 56,8 178,6 210,0 1.105,5MonrealFortuna y Otras 129,7 11,7 10,0 14,0 94,0WilkingNova 180,5 28,9 33,0 28,0 90,6Diversas(Ortanique y 288,3 6,7 8,0 13,3 260,3TOTALGRUPO MANDARINA
Producción Industria ExportaciónVARIEDADES
2.371,7 1.612,7301,3294,6163,1
Producción y Export.Naranjas 2014/15VOLÚMENES REALIZADOS (en miles de T)
PérdidasConsumoRetiradaInterno
Navelina/Nável 1.322,1 34,7 390,0 150,0 747,4Salustiana 261,8 17,6 50,0 65,0 129,2ShamoutiVarias Blancas FinasBlanca ComúnMoro-TaroccoMaltesaSanguinelliWashington SanguinaVarias Sanguinas FinasSanguina ComúnVerna Sanguina y Ot 10,0 0,1 0,0 0,0 9,9Otras NaranjasNavelate/Lanelate 1.347,7 14,2 363,1 285,0 685,4Valencia Late 545,9 9,7 165,0 140,0 231,2Amargas 11,5 10,5 0,0 0,0 1,0TOTAL NARANJAS 3.499,0 86,8 968,1 640,0 1.804,1
Producción Industria ExportaciónVARIEDADES
EN NARANJAS, EN GENERAL, Y EN NAVELS, EN PARTICULAR, ESPAÑA ES IRREMPLAZABLE
ESPAÑA32%
3.914.200 Tm
GRECIA8%TURQUÍA
11%
ITALIA15%
MARRUECOS8%
EGIPTO21%
OTROS MEDITERRÁ-
NEOS6%
PRODUCCIÓN DE NARANJAS DEL MEDITERRÁNEO 2013/2014: 12.638.000 Tm
ESPAÑA44%
2.997.900 Tm
GRECIA12%
TURQUÍA14%
ITALIA4%
MARRUECOS6%
EGIPTO21%
OTROS MEDITERRÁ-
NEOS1%
PRODUCCIÓN DE NAVELS DEL MEDITERRÁNEO 2013/2014: 7.085.500 Tm
ESPAÑA46%
1.561.200 Tm
GRECIA10%
TURQUÍA10%
ITALIA3%
MARRUECOS3%
EGIPTO30%
OTROS MEDITERRÁ-
NEOS2%
EXPORTACIÓN DE NARANJAS DEL MEDITERRÁNEO 2013/2014: 3.663.500 Tm
ESPAÑA55%
1.247.600 Tm
GRECIA13%
TURQUÍA9%
ITALIA1%
MARRUECOS0%
EGIPTO26%
OTROS MEDITERRÁ-
NEOS0%
EXPORTACIÓN DE NAVELS DEL MEDITERRÁNEO 2013/2014: 2.423.900 Tm
EN NARANJAS Y MANDARINAS, ESPAÑA ES UN PROVEEDOR IRREMPLAZABLE DE LA UE-27
ESPAÑA80%
1.362.900 Tm
GRECIA3%
TURQUÍA3%
ITALIA3%
MARRUECOS6%
EGIPTO0%
OTROS PAISES
MEDITERRÁ-NEOS
5%
CAMPAÑA 2013-2014: MANDARINAS MEDITERRÁNEAS
EXPORTADAS A LA UE-28: 1.718.200 Tm
ESPAÑA69%
1.405.100 Tm
GRECIA13%
TURQUÍA1%
ITALIA4%
MARRUECOS3% EGIPTO
8%
OTROS PAÍSES
MEDITERRÁ-NEOS
2%
CAMPAÑA 2013-2014: NARANJAS MEDITERRÁNEAS
EXPORTADAS A LA UE-28: 2.043.500 Tm
Exportación Cítricos de España 2014/2015 (en 1.000 T) TOTAL TOTAL TOTAL TOTAL TOTAL UE15 UE13 UE28 EUROPA EXPORTAD
OCCIDEN
GR.MANDARINA1.245,9 242,3 1.488,2 39,5 1.527,8 50,0 13,6 21,3 1.612,7NARANJA 1.488,3 191,9 1.680,2 42,3 1.722,6 12,3 7,5 61,7 1.804,1GR.MAND+NAR 2.734,2 434,2 3.168,4 81,8 3.250,4 62,3 21,1 83,0 3.416,8LIMÓN 490,1 125,6 615,7 10,6 626,4 16,0 6,9 21,3 670,6POMELO 48,7 13,1 61,8 0,5 62,3 0,1 0,2 1,3 63,9TOTAL GENERA3.273,0 572,9 3.845,9 92,9 3.939,1 78,4 28,2 105,6 4.151,3
AMÉRICA DEL NO
RTEEURO
PA ORIEN
T. NO UE
RESTO DEL M
UNDOVARIEDADES
NORU
EGA
+SUIZA
+ANDO
R.+ISL
ESPAÑA: EXPORTACIÓN DE CÍTRICOS (en tn)Año 2007 2008 2009 2010 2011 2012 2013 2014 2015 2016
EXPORTACIÓN DE CÍTRICOS DE ESPAÑA
3.684.322 3.213.302 3.506.873 3.271.281 3.615.348 3.906.772 3.973.889 3.881.950 4.166.525 3.624.801
PRINCIPALES PAÍSES A LOS QUE EXPORTA ESPAÑAAño 2007 2008 2009 2010 2011 2012 2013 2014 2015 2016
Alemania 870.192 814.400 807.234 834.778 877.932 944.565 992.193 961.225 1.063.036 975.839Francia 808.303 718.941 888.128 729.296 736.459 819.584 801.387 804.982 860.946 787.282Reino Unido 297.496 245.346 256.279 258.884 300.233 293.622 290.366 307.807 324.718 312.808Países Bajos 281.156 233.220 242.330 238.327 260.820 263.660 274.166 264.614 265.550 247.736Polonia 283.952 247.584 246.583 261.183 288.439 300.268 314.673 270.757 270.384 226.759Italia 171.024 153.308 260.936 116.537 217.270 269.817 296.878 264.431 347.242 188.055Bélgica 122.697 116.920 116.349 121.860 122.725 131.652 118.413 113.234 118.728 112.155Suecia 78.903 78.918 79.512 112.047 95.431 99.636 100.243 81.474 94.199 86.026República Checa 110.245 83.478 82.629 82.078 93.400 102.331 98.868 91.164 105.649 82.839Austria 52.656 49.498 55.923 54.414 75.923 63.402 66.446 60.294 64.115 60.618Suiza 67.582 58.781 69.930 60.663 53.594 57.130 57.194 57.432 62.622 57.282Portugal 32.348 25.560 28.307 30.535 37.338 28.637 41.511 54.665 46.186 49.816Dinamarca 53.686 44.264 46.535 44.925 54.804 56.998 57.339 48.299 51.059 47.028Noruega 46.482 40.825 41.733 41.688 40.860 41.810 45.344 41.111 40.928 40.460Finlandia 28.806 29.365 25.453 31.390 26.588 27.586 32.713 29.746 29.720 34.301OTROS 378.792 272.891 259.013 252.675 333.535 406.073 386.156 430.720 421.441 315.794
SECTION II. FRUIT SECTOR IN SPAIN | 37

ESPAÑA: EXPORTACIÓN DE CÍTRICOS (en participación %)Año 2007 2008 2009 2010 2011 2012 2013 2014 2015 2016
EXPORTACIÓN DE CÍTRICOS DE ESPAÑA
100 100 100 100 100 100 100 100 100 100
PRINCIPALES PAÍSES A LOS QUE EXPORTA ESPAÑAAño 2007 2008 2009 2010 2011 2012 2013 2014 2015 2016
Alemania 22,5 23,5 24,2 25,5 24,8 24,2 25,8 24,9 26,2 27,9Francia 23,6 24 23 23,7 21,3 21,8 21,1 21,7 21,6 22,5Reino Unido 8,3 8 8 8 8,6 7,8 7,9 8,9 8,5 9Países Bajos 7,7 7,5 7,4 7,5 7,1 6,7 6,8 6,5 6,1 6,3Polonia 6,5 7 6,1 6,8 6,6 6,4 6,5 5,9 5,4 5,2Italia 4,6 4,8 7,2 3,7 5,4 6,6 6,7 6,1 7,4 4,9Bélgica 4,1 4,5 4,5 4,1 3,7 3,6 3,3 3,2 3,2 3,3Suecia 2 2,2 2,1 2,9 2,4 2,4 2,2 1,9 2 2,1República Checa 2,5 2,3 2,2 2,1 2,2 2,2 2,2 1,9 2,1 2Suiza 2,2 2,1 2,3 2 1,7 1,7 1,7 1,7 1,8 1,9Austria 1,4 1,5 1,6 1,7 2,6 1,9 1,8 2,1 1,8 1,9Dinamarca 1,4 1,3 1,4 1,3 1,5 1,6 1,4 1,3 1,2 1,2Noruega 1,3 1,2 1,3 1,2 1,2 1,2 1,3 1,2 1,1 1,2Portugal 0,7 0,7 0,8 0,8 0,7 0,6 0,8 0,9 0,8 1Canadá 0,4 0,2 0,1 0,2 0,4 0,7 0,4 1,5 1,2 1OTROS 10,6 8,8 7,6 8 9,5 10,2 9,9 9,8 9,5 8,2
EXPORTACION TOTAL DE CÍTRICOS DE ESPAÑA 2016/2017en Tn CLAUS./
SAT. G.CLEM. COM/WILK FORTUNAS TOTAL
MANDARINAS TOTAL
NARANJASTOTAL
LIMONESTOTAL
POMELOTOTAL
CITRICOS CAMP.15/16 DIFEREN
ALEMANIA 11.479 261.058 41.526 53.341 367.404 415.037 175.107 17.764 975.312 977.365 -2.053FRANCIA 2.585 178.125 29.516 44.749 254.975 377.482 118.150 14.300 764.907 795.660 -30.753REINO UNIDO 15.944 80.227 12.212 41.254 149.637 101.268 68.558 3.773 323.236 298.765 24.471ITALIA 299 48.831 6.376 9.673 65.179 135.137 66.842 2.967 270.125 200.649 69.476PAISES BAJOS 4.127 45.117 7.235 15.753 72.232 140.216 25.441 3.389 241.278 245.347 -4.069POLONIA 390 68.370 15.331 15.056 99.147 72.103 53.822 5.094 230.166 215.690 14.476BELGICA/LUXE 2.930 28.693 1.205 8.479 41.307 53.005 13.285 843 108.440 115.438 -6.998SUECIA 7.748 17.958 2.841 4.340 32.887 40.167 12.377 639 86.070 82.390 3.680REP CHECA 3.829 24.867 3.275 5.119 37.090 21.925 14.744 1.431 75.190 86.789 -11.599AUSTRIA 7.444 11.050 5.290 2.230 26.014 23.178 14.769 1.391 65.352 57.272 8.080PORTUGAL 2 12.508 3.306 1.296 17.112 30.847 12.424 1.054 61.437 45.768 15.669DINAMARCA 94 19.624 577 895 21.190 19.117 5.928 791 47.026 45.836 1.190FINLANDIA 4.829 16.298 525 1.266 22.918 7.438 3.633 37 34.026 30.501 3.525HUNGRIA 64 5.433 2.401 2.735 10.633 5.485 7.306 1.357 24.781 19.949 4.832IRLANDA 503 5.122 991 916 7.532 8.670 3.848 952 21.002 19.857 1.145RUMANIA 65 3.029 574 290 3.958 7.171 8.479 324 19.932 18.351 1.581LITUANIA 341 7.036 1.113 1.266 9.756 4.300 5.031 267 19.354 20.845 -1.491ESLOVAQUIA 981 6.252 941 1.523 9.697 4.087 4.399 646 18.829 24.258 -5.429ESLOVENIA 31 3.755 490 170 4.446 7.337 2.967 51 14.801 13.358 1.443LETONIA 249 8.540 282 767 9.838 1.416 2.519 463 14.236 16.835 -2.599OTROS 360 6.079 291 1.146 7.876 8.738 7.279 471 24.364 24.247 117TOTAL U.E. 64.294 857.972136.298 212.264 1.270.828 1.484.124 626.908 58.004 3.439.864 3.355.170TOTAL P.TERC. 1.877 68.949 0 15.701 86.527 134.745 40.926 2.534 264.732 254.450TOTAL 66.171 926.921136.298 227.965 1.357.355 1.618.869 667.834 60.538 3.704.596 3.609.620CAMP.15/16 69.698 1.041.943183.657 168.713 1.464.011 1.572.987 517.475 55.147 3.609.620
Exportación de Cítricos de España por País Tercero y Variedad 14/15 (en T)en Tm CLAUSE SATSUMG.CLEMENARANJ LIMÓN POMELO TOTAL CAM 13/14VARIACI
SUIZA 1.338 23.175 26.609 8.674 354 60.150 57.738 2.412CANADÁ 6 17.493 12.242 11.110 129 40.980 38.123 2.857ESTADOS UNIDOS 32.520 4.865 37.385 42.193 -4.808NORUEGA 21 14.397 14.758 1.639 63 30.878 39.115 -8.237ARGELIA 2.655 17.305 1.240 21.200 30.444 -9.244ÉMIRATOSÁRABES 6.200 10.620 3.126 158 20.104 18.800 1.304
BRASIL 4.903 11.849 1.780 263 18.795 16.010 2.785ARABIA SAUDÍ 2.130 7.337 3.049 111 12.627 17.225 -4.598BIELORRUSIA 24 7.789 2.304 1.101 66 11.284 14.223 -2.939UCRANIA 23 3.209 1.078 1.275 113 5.698 7.208 -1.510HONG KONG 491 2.058 1.971 53 4.573 2.240 2.333SERBIA 590 1.354 2.238 30 4.212 2.722 1.490KAZAJISTÁN 1.657 229 2.121 28 4.035 1.390 2.645MOLDAVIA 40 1.843 880 956 44 3.763 2.048 1.715JORDANIA 78 268 3.195 3.541 449 3.092CHINA 56 2.959 200 95 3.310 1.141 2.169MALASIA 171 1.288 1.150 23 2.632 2.481 151COREA DEL SUR 10 2.200 2.210 1.203 1.007SUDÁFRICA 603 266 487 286 1.642 861 781MACEDONIA 30 512 1.004 25 1.571 215 1.356OTROS 27 24 3.026 7.599 3.692 314 14.682 70.644 -55.962TOTAL 54 1.449 123.026 123.715 54.873 2.155 305.272
CAMPAÑA 13/14 62 5.039 149.282 155.962 54.908 1.220 366.473
EXPORTACION DE CÍTRICOS DE ESPAÑA A PAÍSES TERCEROS 2016/2017en Tn SATSUMA G.CLEMEN NARANJAS LIMONES POMELOS TOTAL CAMP.15/16 DIFERENCIASUIZA 1.755 22.044 25.782 9.048 346 58.975 57.701 1.274CANADA 12.713 12.947 7.715 384 33.766 27.705 6.061NORUEGA 10.152 13.343 1.960 4 25.459 32.712 -7.253EEUU 16.910 5.263 22.173 25.100 -2.927EMIRATOS A.U 3.276 15.309 1.811 109 20.505 18.150 2.355CHINA 1.154 18.403 6 146 19.709 12.868 6.841ARABIA SAUDI 2.541 16.107 406 1 19.055 13.170 5.885BRASIL 4.644 12.324 1.709 252 18.929 20.345 -1.416BIELORRUSIA 4.275 1.253 1.010 12 6.550 6.325 225ARGENTINA 159 2.614 2.814 519 6.106 3.131 2.975MALASIA 273 1.950 1.357 1 3.581 1.473 2.108COREA DEL SU 2.651 2.651 2.299 352MOLDAVIA 27 860 639 935 99 2.560 2.221 339SUDAFRICA 884 812 144 411 2.251 1.493 758UCRANIA 42 1.006 173 672 50 1.943 2.871 -928SERBIA 363 902 598 1.863 2.147 -284SINGAPUR 281 612 884 45 1.822 1.322 500HONG KONG 164 580 624 19 1.387 2.666 -1.279BAHREIN 133 954 158 7 1.252 428 824COSTA RICA 446 729 45 11 1.231 847 384OTROS 1 2.372 6.661 3.767 118 12.964 19.476 -6.512TOTAL 1.825 84.650 134.745 40.926 2.534 264.732
CAMP.15/16 1.893 105.657 117.061 26.848 2.905 254.450DIFERENCIA -68 -21.007 17.684 14.078 -371 10.282
EXPORTACIÓN DE CÍTRICOS DE ESPAÑA A PAÍSES TERCEROS A 15-04-2018 (en Tn)
SATSUMA G.CLEMEN. NARANJAS LIMONES POMELOS TOTAL CAMP.16/17 DIFERENCIASUIZA 1.212 24.434 20.045 6.443 603 52.737 49.504 3.233CANADA 3 14.568 20.214 11.366 637 46.788 28.981 17.807NORUEGA 9 16.709 14.758 1.705 126 33.307 22.911 10.396CHINA 750 21.704 4 19 22.477 16.644 5.833BRASIL 4.726 14.852 1.813 264 21.655 18.224 3.431EEUU 15.454 3.724 19.178 20.903 -1.725EMIRATOS A.U 1 3.226 6.438 481 1 10.147 17.481 -7.334ARABIA SAUDI 2.907 6.259 195 9.361 14.598 -5.237ARGENTINA 181 5.385 341 268 6.175 6.106 69SUDAFRICA 1.240 768 248 493 2.749 2.251 498COREA DEL SU 2.588 2.588 2.211 377BIELORRUSIA 1.704 836 22 7 2.569 5.698 -3.129QATAR 463 1.625 241 5 2.334 865 1.469UCRANIA 10 1.000 312 28 3 1.353 1.837 -484MOLDAVIA 32 638 433 116 19 1.238 1.864 -626MALASIA 337 596 271 1.204 2.993 -1.789COSTA RICA 490 592 9 10 1.101 1.141 -40URUGUAY 74 585 295 40 994 668 326SINGAPUR 330 518 81 22 951 1.710 -759OMAN 142 652 30 2 826 398 428OTROS 43 3.268 4.551 896 185 8.943 12.048 -3.105 TOTAL 1.310 92.641 123.711 28.309 2.704 248.675CAMP.16/17 1.876 84.119 107.454 33.207 2.380 229.036 DIFERENCIA -566 8.522 16.257 -4.898 324 19.639
3,2707,7114,7485,5268,574
15,84714,377
26,34734,067
45,326
79,35878,978
45,73154,043
69,16461,709
63,68876,717
47,84355,910
45,078
60,71247,56046,976
40,54732,520
23,41716,910
0
14,674
1,003 19
0 0
8
2
16,188
324 62
0
0
0
59 17
19,882
0
46
0
0
22 00
0
0
0
716
1,307
21 5,884857
631 357
4,816
12,601
8,195
8,6624,491
19,8036,685
3,934
8536,779
15,407
141
3,299
605
909
1,577 409
1,646
4,865
1,683
5,263
0
20,000
40,000
60,000
80,000
100,000
120,000
EXPORTACIONES ESPAÑOLAS DE CÍTRICOS A EE.UU. ( en T )
LIMÓN
NARANJA
MANDARINA
(*) Campañas1990/91, 1998/99 & 2006/07: Helada en California
(*) Campaña 2001/02: Embargo a las clementinas de España en EE.UU. desde el 30 de Noviembre de 2001. El embargo a las clementinas de España se levantó el 6 de Octubre de 2002
38 | 18TH OECD MEETING OF THE HEADS OF NATIONAL INSPECTION SERVICES

ESPAÑA: Producción de Cítricos 1991/92-2016/17 (en 1.000 T)
Efectos del frío Enero-Marzo 05
91/92 92/93 93/94 94/95 95/96 96/97 97/98 98/99 99/00 00/01 01/02 02/03 03/04 04/05 05/06 06/07 07/08 08/09 09/10 10/11 11/12 12/13 13/14 14/15 15/16 16/17CLAUSELLINA/SATSUMA/MONREAL
406 373 408 365 303 248 355 281 299 300 285 265 257 254 168 280 158 212 164 173 138 180 193 222 187 208CLEMENTINA/CLEMENVILLA O NOVA/HERNANDINA
871 1.027 1.047 1.255 1.139 985 1.402 1.081 1.286 1.223 1.275 1.447 1.461 1.812 1.467 1.860 1.607 1.666 1495 1720 1.788 1.489 1.628 1.731 1.502 1.660TANGERINA/KARA/FORTUNA
66 121 134 171 241 274 342 393 457 297 218 296 357 435 309 361 313 341 341 397 578 505 384 418 399 517TOTAL PETITS FRUITS1.342 1.521 1.589 1.791 1.683 1.507 2.099 1.754 2.042 1.819 1.778 2.009 2.075 2.500 1.945 2.501 2.077 2.219 2.001 2.290 2.503 2.174 2.204 2.372 2.088 2.385NAVEL- NAVELINA/SALUSTIANA/VALENCIA-OTRAS2.721 2.990 2.407 2.739 2.528 2.274 2.772 2.387 2.805 2.703 2.924 2.931 3.100 2.832 2.295 3.393 2.702 3.462 2.622 3.345 3.888 3.723 3.906 3.489 3.067 3.640SANGUINAS/SANGUINELLI
15 13 10 8 8 8 14 5 6 6 5 4 2 3 2 3 2 5 0 0 0 0 9 10 7 8TOTAL ORANGES2.748 3.002 2.417 2.747 2.535 2.282 2.786 2.392 2.811 2.709 2.929 2.935 3.103 2.835 2.297 3.397 2.704 3.466 2.622 3.345 3.888 3.723 3.914 3.499 3.074 3.648TOTAL CITRONS
589 737 570 563 433 666 968 827 893 938 1.018 962 1.071 810 951 879 550 883 673 927 1.051 840 1.057 1.079 797 1.087TOTAL GRAPEFRUITS
25 30 26 28 29 20 32 27 23 25 26 29 33 36 33 39 43 46 52 65 59 64 59 78 68 85TOTAL AGRUMES4.704 5.290 4.601 5.128 4.679 4.475 5.886 5.000 5.770 5.491 5.751 5.935 6.281 6.181 5.226 6.815 5.375 6.614 5.348 6.627 7.501 6.801 7.241 7.032 6.027 7.206
PLANTONES Y PATRONES CERTIFICADOS DE CÍTRICOS COMERCIALIZADOS EN ESPAÑA
(en miles de plantas)VARIEDADES 1.999* 2.000* 2.001* 2.002* 2.003 2.004 2.005 2.006 2.007 2.008 2.009 2.010 2.011 2.012 2.013 2.014 2.015 2.016Naranjos 2.424 2.448 1.775 1.919 2.667 2.855 4.171 4.468 2.462 2.407 2.040 1.808 1.685 1.584 1.637 1.423 1.224 1.477Pomelos 33 49 35 55 73 63 92 77 94 42 54 33 32 43 54 53 40 54Mandarinos 3.613 3.322 3.903 3.137 3.733 3.005 2.333 1.302 807 848 732 1.033 1.274 1.658 1.636 1.373 1.255 1.511Limas 4 2 2 1 4 3 6 7 4 8 9 9 12 19 24 30 57 48Limoneros 546 620 661 399 354 326 209 181 138 166 195 272 335 319 492 617 552 880TOTAL PLANTONES 6.622 6.441 6.376 5.511 6.831 6.252 6.811 6.036 3.505 3.472 3.030 3.154 3.338 3.623 3.843 3.496 3.128 3.972
TOTAL PATR. 515 119 228 60 107 138 59 38 23 32 14 53 52 277 389 215 388 837TOTAL PL. Y PATR. 7.137 6.560 6.604 5.571 6.938 6.390 6.870 6.074 3.527 3.503 3.044 3.207 3.391 3.900 4.232 3.710 3.516 4.809
*Sin datos Cataluña
PLANTONES Y PATRONES CERTIFICADOS DE CÍTRICOS COMERCIALIZADOS EN ESPAÑA
1972-2016 (44 años)183.504.719 árboles
0
1
2
3
4
5
6
7
8
9
1.97
21.
973
1.97
41.
975
1.97
61.
977
1.97
81.
979
1.98
01.
981
1.98
21.
983
1.98
41.
985
1.98
61.
987
1.98
81.
989
1.99
01.
991
1.99
21.
993
1.99
41.
995
1.99
61.
997*
1.99
8*1.
999*
2.00
0*2.
001*
2.00
2*2.
003
2.00
42.
005
2.00
62.
007
2.00
82.
009
2.01
02.
011
2.01
22.
013
2.01
42.
015
2.01
6
Mill
ones
de
árbo
les
* Sin datos Cataluña
PLANTONES Y PATRONES CERTIFICADOS DE CÍTRICOS COMERCIALIZADOS EN ESPAÑA
* Sin datos Cataluña
0
1,000,000
2,000,000
3,000,000
4,000,000
5,000,000
6,000,000
7,000,000
8,000,000
9,000,000
1.97
21.
973
1.97
41.
975
1.97
61.
977
1.97
81.
979
1.98
01.
981
1.98
21.
983
1.98
41.
985
1.98
61.
987
1.98
81.
989
1.99
01.
991
1.99
21.
993
1.99
41.
995
1.99
61.
997*
1.99
8*1.
999*
2.00
0*2.
001*
2.00
2*2.
003
2.00
42.
005
2.00
62.
007
2.00
82.
009
2.01
02.
011
2.01
22.
013
2.01
42.
015
2.01
6
Mile
s de
pla
ntas Patrones
LimonerosLimasMandarinosPomelosNaranjos
COMPARATIVA BALANCE 2016/17 Y AFORO 2017/18 DE CÍTRICOS EN ESPAÑA (en T)
BALANCE 2016/17
AFORO 2017/18
VARIACIÓN %
MANDARINAS 2.385.478 1.946.239 -18,4%
NARANJA DULCE 3.648.485 3.242.140 -11,1%
NARANJA AMARGA 0 0
LIMONES 985.429 957.546 -2,8%POMELOS Y OTROS CÍTRICOS 84.867 85.357 0,6%
TOTAL CÍTRICOS 7.104.259 6.231.282 -12,3%Fuente: Consejerías de Agricultura de las Comunidades Autónomas productoras de cítricos.
COMPARATIVA BALANCE 2016/17 Y AFORO 2017/18 DE CÍTRICOS EN LA COMUNIDAD VALENCIANA (en T)
BALANCE 2016/2017 AFORO 2017/2018 VARIACIÓN %Satsumas tempranas 103.682 68.352 -34,1 %Satsumas tardías 85.484 61.762 -27,8 %SUBGRUPO SATSUMAS 189.166 130.114 -31,2 %
Clementinas tempranas 257.544 197.404 -23,4 %Clementinas media temporada 861.664 592.765 -31,2 %Clementinas tardías 73.992 53.443 -27,8 %SUBGRUPO CLEMENTINAS 1.193.200 843.612 -29,3 %SUBGRUPO MANDARINOS E HÍBRIDOS 391.051 371.718 -4,9 %
TOTAL MANDARINAS 1.773.417 1.345.444 -24,1 %Navel tempranas 718.246 515.276 -28,3 %Navel media temporada 137.444 118.807 -13,6 %Navel tardías 689.077 609.275 -11,6 %SUBGRUPO NAVEL 1.544.767 1.243.358 -19,5 %
Blancas tempranas 64.190 44.947 -30 %Blancas tardías 236.856 233.775 -1,3 %SUBGRUPO BLANCAS 301.046 278.722 -7,4 %SUBGRUPO SANGUINAS 7.848 4.626 -41,1 %
TOTAL NARANJA DULCE 1.853.661 1.526.706 -17,6 %Limón Verna 87.542 44.918 -48,7 %Limón Fino 206.332 201.232 -2,5 %TOTAL LIMONES 293.874 246.150 -16,2 %TOTAL POMELOS 22.261 25.684 15,4 %TOTAL CÍTRICOS 3.943.213 3.143.984 -20,3 %
SECTION II. FRUIT SECTOR IN SPAIN | 39

Calendario de las Exportaciones de España (en 1.000 T)
CAMPAÑAS
Sept/Oct. Nov. Dic. Enero Febr Marzo Abril Mayo Junio Julio/
Agost TOTAL
GRUPOMANDARINAS
2014/15 228 315 369 277 186 124 67 36 10 3 1.6132015/16 212 298 338 248 167 116 54 25 3 3 1.4642016/17 199 321 319 224 147 91 39 13 1 2 1.3572017/18 212 304 321 211 137
NARANJAS 2014/15 55 163 219 243 258 288 254 180 84 60 1.8042015/16 51 192 242 228 229 228 190 117 55 40 1.5732016/17 56 181 225 228 214 246 191 142 76 59 1.6192017/18 61 162 220 216 204
LIMONES
2014/15 70 54 74 61 60 68 68 72 68 78 6712015/16 57 41 59 50 59 63 58 55 35 40 5172016/17 64 50 69 66 68 77 70 72 67 66 6702017/18 72 60 72 60 58
TOTAL GENERAL
2014/15 358 538 669 589 511 489 398 294 164 142 4.1512015/16 327 538 646 534 464 414 308 201 94 83 3.6102016/17 324 560 619 528 438 426 306 230 145 129 3.7072017/18 351 532 618 494 406
ESPAÑA: CALENDARIO DE EXPORTACIÓN DEL GRUPO MANDARINAS 1998/99-2016/17 (en T)
0
50,000
100,000
150,000
200,000
250,000
300,000
350,000
400,000
450,000
SEP/OCT NOV. DEC. ENERO FEBRERO MARZO ABRIL MAYO JUNIO JUL/AGO
98/99
99/00
00/01
01/02
02/03
03/04
04/05
05/06
06/07
07/08
08/09
09/10
10/11
11/12
12/13
13/14
14/15
15/16
16/17
ESPAÑA: CALENDARIO DE EXPORTACIÓN DE NARANJAS 1998/99-2016/17 (en T)
0
50,000
100,000
150,000
200,000
250,000
300,000
350,000
SEPT/OCT NOV. DICIEMBR. ENERO FEBRERO MARZO ABRIL MAYO JUNIO JUL/AGO
98/99
99/00
00/01
01/02
02/03
03/04
04/05
05/06
06/07
07/08
08/09
09/10
10/11
11/12
12/13
13/14
14/15
15/16
16/17
ESPAÑA: CALENDARIO DE EXPORTACIÓN DE MANDARINAS + NARANJAS 1998/99-2016/17 (en T)
0
100,000
200,000
300,000
400,000
500,000
600,000
700,000
SEPT/OCT NOV. DICIEMB ENERO FEBR MARZO ABRIL MAYO JUNIO JUL/AGO
98/99
99/00
00/01
01/02
02/03
03/04
04/05
05/06
06/07
07/08
08/09
09/10
10/11
11/12
12/13
13/14
14/15
15/16
16/17
1.5391.560
1.8111.8561.7821.6781.679
1.8811.8481.8591.9491.969
2.1092.1642.039
2.2572.1392.132
-
500
1.000
1.500
2.000
2.500
2000 2001 2002 2003 20042005 2006 2007 2008 2009 2010 2011 2012 2013 2014 2015 2016 2017
Millo
nes d
e eur
os
EXPORTACIÓN DE CÍTRICOS DE ESPAÑA EN VALOR
CATALUÑA COMUNIDAD VALENCIANA ANDALUCIA MURCIA OTROS
-
500
1.000
1.500
2.000
2.500
3.000
3.500
2000 2001 2002 2003 2004 2005 2006 2007 2008 2009 2010 2011 2012 2013 2014 2015 2016 2017
Millo
nes d
e eur
os
EXPORTACIÓN DE CÍTRICOS DE ESPAÑA EN VALOR
CATALUÑA COMUNIDAD VALENCIANA ANDALUCIA MURCIA OTROS
2.5652.318
2.627 2.638 2.585
2.2912.497
2.709
2.3832.551 2.457
2.7112.898 2.902
2.7092.869
2.539 2.519
-
500
1.000
1.500
2.000
2.500
3.000
3.500
2000 2001 2002 2003 2004 2005 2006 2007 2008 2009 2010 2011 2012 2013 2014 2015 2016 2017
Miles
de to
nelad
as
EXPORTACIÓN DE CÍTRICOS DE ESPAÑA EN PESO
CATALUÑA COMUNIDAD VALENCIANA ANDALUCIA MURCIA OTROS
-
500
1.000
1.500
2.000
2.500
3.000
3.500
4.000
4.500
2000 2001 2002 2003 2004 2005 2006 2007 2008 2009 2010 2011 2012 2013 2014 2015 2016 2017
Mile
s de
tone
ladas
EXPORTACIÓN DE CÍTRICOS DE ESPAÑA EN PESO
CATALUÑA COMUNIDAD VALENCIANA ANDALUCIA MURCIA OTROS
40 | 18TH OECD MEETING OF THE HEADS OF NATIONAL INSPECTION SERVICES
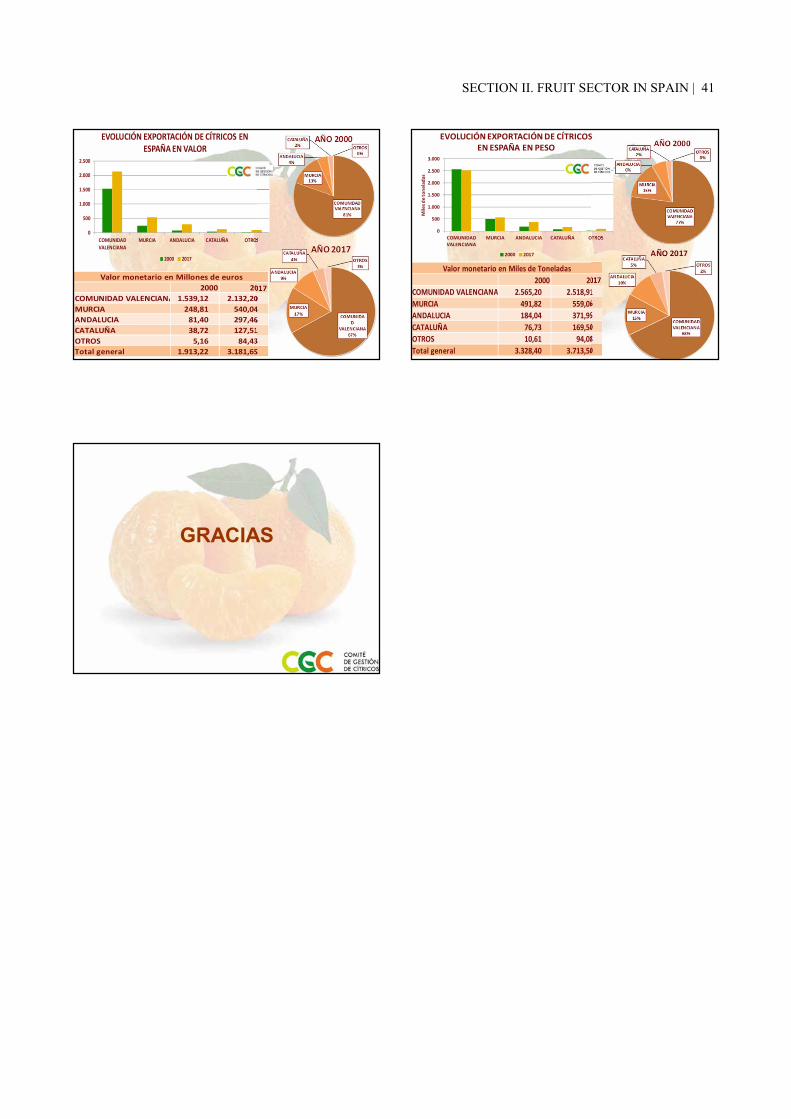
0
500
1.000
1.500
2.000
2.500
COMUNIDAD VALENCIANA
MURCIA ANDALUCIA CATALUÑA OTROS
EVOLUCIÓN EXPORTACIÓN DE CÍTRICOS EN ESPAÑA EN VALOR
2000 2017
2000 2017COMUNIDAD VALENCIANA 1.539,12 2.132,20 MURCIA 248,81 540,04 ANDALUCIA 81,40 297,46 CATALUÑA 38,72 127,51 OTROS 5,16 84,43 Total general 1.913,22 3.181,65
Valor monetario en Millones de euros
0
500
1.000
1.500
2.000
2.500
3.000
COMUNIDAD VALENCIANA
MURCIA ANDALUCIA CATALUÑA OTROS
Mile
s de t
onel
adas
EVOLUCIÓN EXPORTACIÓN DE CÍTRICOS EN ESPAÑA EN PESO
2000 2017
2000 2017COMUNIDAD VALENCIANA 2.565,20 2.518,91 MURCIA 491,82 559,06 ANDALUCIA 184,04 371,95 CATALUÑA 76,73 169,50 OTROS 10,61 94,08 Total general 3.328,40 3.713,50
Valor monetario en Miles de Toneladas
GRACIAS
SECTION II. FRUIT SECTOR IN SPAIN | 41

42 │ 18TH OECD MEETING OF THE HEADS OF NATIONAL INSPECTION SERVICES
SECTION III STRUCTURE AND ACTIVITIES OF INSPECTION IN COUNTRIES
The section is intended to provide an overview of the national Fruit and Vegetables quality inspection systems in some of the Scheme participating countries. Spain, the host of the HNIS meeting, gave a comprehensive overview of their national system.
Presentations in the Section:
• Spanish fresh fruit and vegetables control system
SECTION III. STRUCTURE AND ACTIVITIES OF INSPECTION IN COUNTRIES │ 43
Spanish fresh fruit and vegetables control system
by Ms Maria de Armas, Ministry of Economic Affairs and Competitiveness
Abstract
Ms de Armas provided a comprehensive summary of the Spanish fruit and vegetables national inspections system, outlining the competent authorities' role, the various national provisions, conformity controls according to the European Commission’s Implementing Regulation (EU) No 543/2011, as well as their software support tools.
Spain is integrated by 17 Autonomous Communities and two Autonomous Cities; it is one of the most decentralized countries in Europe. Accordingly, conformity controls are shared by the Central Administration, the SOIVRE Inspection body and the Regional Administrations of 17 Autonomous Communities that rely on Regional Ministries of Agriculture and Regional Ministries of Health and Consumption to ensure compliance.
The SOIVRE inspection body is the coordinating authority. The General Directorate of Trade Policy and Competitiveness is the single, competent authority responsible for coordination in the area of checks on conformity to marketing standards (R EU no 543/2011). SOIVRE carries out conformity controls on FFV at EU internal market level (expeditions to EU Member states), at export level (to third countries) and at import level (from third countries).
The inspection bodies of the Autonomous Communities carry out conformity controls: at the expedition and distribution levels, i.e. at producers and packers and wholesalers (Regular controls by the Regional Ministries of Agriculture); and at the retailer level (occasional controls by the Regional Ministries of Health and Consumption and the Municipalities). Spain has also regional collaboration agreements (CCAA) that help handle in a timely and efficient manner the huge number of inspections.
The SOIVRE Inspection Body has its headquarters in Madrid and possesses 31 offices spread along the Spanish territory, mainly at the so-called “Border facilities for Goods and Foods Control”. SOIVRE has also inspectors working as commercial counsellors abroad. SOIVRE counts with 50 inspectors and 84 technical inspectors. SOIVRE also counts with laboratory analysts, administrative and support staff that complete their human resources.
The Spanish traders database cover four types of traders: packers, wholesalers at origin, wholesalers at destination, and importers.
The Spanish risk analysis system, which classifies traders as well as the dedicated software support tools, for example the Integrated Inspection System (ESTACICE), a risk analysis application (GARFYH), a database with specific standards or relevant legislation (LEGISLA) and a database of statistics (Datacomex).

44 │ 18TH OECD MEETING OF THE HEADS OF NATIONAL INSPECTION SERVICES
Spanish fresh fruit and vegetables control system
Presentation by Ms Maria de Armas, Ministry of Economic Affairs and Competitiveness

SECRETARÍA DE ESTADO DE
COMERCIO D. G. Política Comercial y
Competitividad
QUALITY CONTROLS OF FRESH FRUIT & VEGETABLES IN SPAIN
18th OECD MEETING OF THE HEADS OF NATIONAL INSPECTION SERVICES
Seville, May 2018María de Armas Jaraquemada
SECRETARÍA DE ESTADO DE
COMERCIO D. G. Política Comercial y
Competitividad
Table of contents1. Fresh fruit and vegetables production and trade in
Spain.2. Conformity controls organization.3. SOIVRE Inspection body.4. Conformity controls according Commission
Implementing Regulation (EU) No 543/2011.5. Software support tools.
SECRETARÍA DE ESTADO DE
COMERCIO D. G. Política Comercial y
Competitividad
1. FRESH FRUIT AND VEGETABLESPRODUCTION AND TRADE IN SPAIN
Spanish FFV production and trade
Spain is the largest exporter of FFV of the EU, and the third exporter of the world after China and USA
In terms of value Spain is the the main F&V producer of the European Union and the 5th worldwide
Spanish FFV production and trade Spanish annual FFV production is around 26.000.000 tons,which is concentrated in the river valleys, the Mediterraneancoast and the Canary Islands.
Citrus fruit: Comunidad Valenciana, Andalucía and Región de Murcia.
Vegetables: Andalucía, Región de Murcia and C. Valenciana.
Tomatoes: Almería, C. Valenciana, Región deMurcia and Canary Islands.
Peaches and nectarines: Seville, Región deMurcia, Valencia and Cataluña.
Apples and pears: Cataluña and Aragón.
Tropical fruit: Málaga and Canary Islands.
Spanish FFV production and trade
• Citrus fruit 3.624• Peach/Nectarine 800• Watermelon/melon
637• Strawberry 583 • Apple/pear 187• Bananas 104• Table grapes 291• Persimmon 183• Total 7.482
• Tomato 907• Lettuce 815• Sweet pepper 737• Cucumber 633• Onion 357• Potato 283• Carrot and roots 89• Garlic 163• Total 6.004
Exports & expeditions 2017 (thousand tons)
SECTION III. STRUCTURE AND ACTIVITIES OF INSPECTION IN COUNTRIES | 45
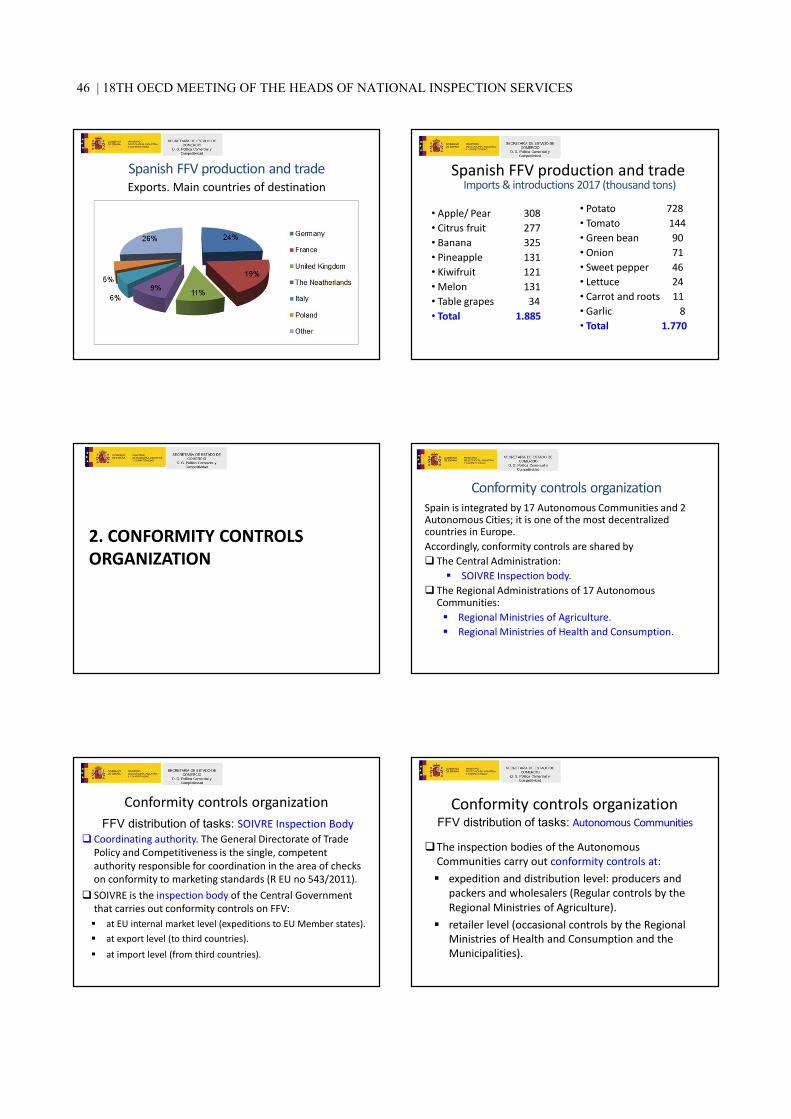
Exports. Main countries of destinationSpanish FFV production and trade Spanish FFV production and trade
• Apple/ Pear 308• Citrus fruit 277• Banana 325• Pineapple 131• Kiwifruit 121• Melon 131• Table grapes 34• Total 1.885
• Potato 728• Tomato 144• Green bean 90• Onion 71• Sweet pepper 46• Lettuce 24• Carrot and roots 11• Garlic 8• Total 1.770
Imports & introductions 2017 (thousand tons)
2. CONFORMITY CONTROLSORGANIZATION
Spain is integrated by 17 Autonomous Communities and 2 Autonomous Cities; it is one of the most decentralized countries in Europe.Accordingly, conformity controls are shared by
The Central Administration:SOIVRE Inspection body.
The Regional Administrations of 17 Autonomous Communities:
Regional Ministries of Agriculture.Regional Ministries of Health and Consumption.
Conformity controls organization
Conformity controls organization
Coordinating authority. The General Directorate of Trade Policy and Competitiveness is the single, competent authority responsible for coordination in the area of checks on conformity to marketing standards (R EU no 543/2011).SOIVRE is the inspection body of the Central Government that carries out conformity controls on FFV:
at EU internal market level (expeditions to EU Member states).at export level (to third countries).at import level (from third countries).
FFV distribution of tasks: SOIVRE Inspection BodyConformity controls organization
The inspection bodies of the AutonomousCommunities carry out conformity controls at:
expedition and distribution level: producers and packers and wholesalers (Regular controls by the Regional Ministries of Agriculture).retailer level (occasional controls by the Regional Ministries of Health and Consumption and the Municipalities).
FFV distribution of tasks: Autonomous Communities
46 | 18TH OECD MEETING OF THE HEADS OF NATIONAL INSPECTION SERVICES

Expeditions to the EU and exports to third countries were 13.400.000 tons in 2017.Imports from third countries were 3.650.000 tons in 2017.That means near 33.500 tons to control every day(1.675 trucks).
Work to doConformity controls organization Conformity controls organization
This work is not possible to be done without:A risk analysis that can help to reduce the physical controls. A prioritization of controls at origin (aiming controls togrowers/packers and wholesalers, at the beginning ofthe commercial chain).A coordination with the regional inspection bodies where mixed competences exist (expeditions –Collaborating Agreements).
Work to do
Conformity controls organization
There are three of them between the Ministry of Economy, Industry and Competitiveness and the Regional Ministries of Agriculture of:
Andalucía (2003) it affects 829 traders.C. Valenciana (2002) it affects 735 traders.R. de Murcia (2002) it affects 405 traders.
Total number of registered traders 2.542.
Collaborating agreements with CCAAConformity controls organization
The core element of these agreements is a Monitoring Committee, aiming to harmonize:
Control procedures of traders.Implementation of the risk analysis.Annual program of work.Traders data base maintenance.Sanctioning procedure.Sharing of traders to be controlled.Approved traders.Statistical information.
Contents of the collaborating agreements
3.- SOIVRE INSPECTION BODY
SOIVRE Inspection Body
Headquarters in Madrid:Deputy Directorate of Inspection, Certification and Technical Assistance for Foreign Trade.31 offices spread along the Spanish territory, mainlyat the so called “Border facilities for Goods andFoods Control”.SOIVRE inspectors working as commercialcounsellors abroad (Paris, Düsseldorf, London,Brussels, Roma, Warsaw, Beijing, Washington,Mexico, Brasilia, Rabat).
SOIVRE structure
SECTION III. STRUCTURE AND ACTIVITIES OF INSPECTION IN COUNTRIES | 47

SECRETARÍA DE ESTADO DE
COMERCIO D. G. Comercio e Inversiones
SOIVRE Inspection Body31 SOIVRE offices
SOIVRE Inspection Body
State Secretary for Trade
General Directorate for Trade Policy and Competitiveness
SOIVRE (Territorial and Provincial Trade
Directorates)
Deputy Directorate of, Inspection, Certification and Technical Assistance
for Foreign Trade
Hierarchic relationships
SOIVRE Inspection Body SOIVRE Inspection Body
Technical staff:Inspectors 50Technical inspectors 84
Both of them are civil servants with a university degreeand that have passed public examinations.
Laboratory analysts, administrative and support staffcomplete the human resources.
SOIVRE staff
SOIVRE Inspection Body
COMMERCIAL QUALITY:Fresh fruits and vegetables, fishery products,olive oil, honey, poultry meat, eggs.
SAFETY OF INDUSTRIAL PRODUCTS.CITES (Administrative authority).Other:
Hemp seeds control.Organic produce.
SOIVRE is a multidisciplinary inspection bodySOIVRE is a multidisciplinary inspection body
4. CONFORMITY CONTROLS OF FFVACCORDING COMMISSION IMPLEMENTINGREGULATION (EU) NO 543/2011
48 | 18TH OECD MEETING OF THE HEADS OF NATIONAL INSPECTION SERVICES
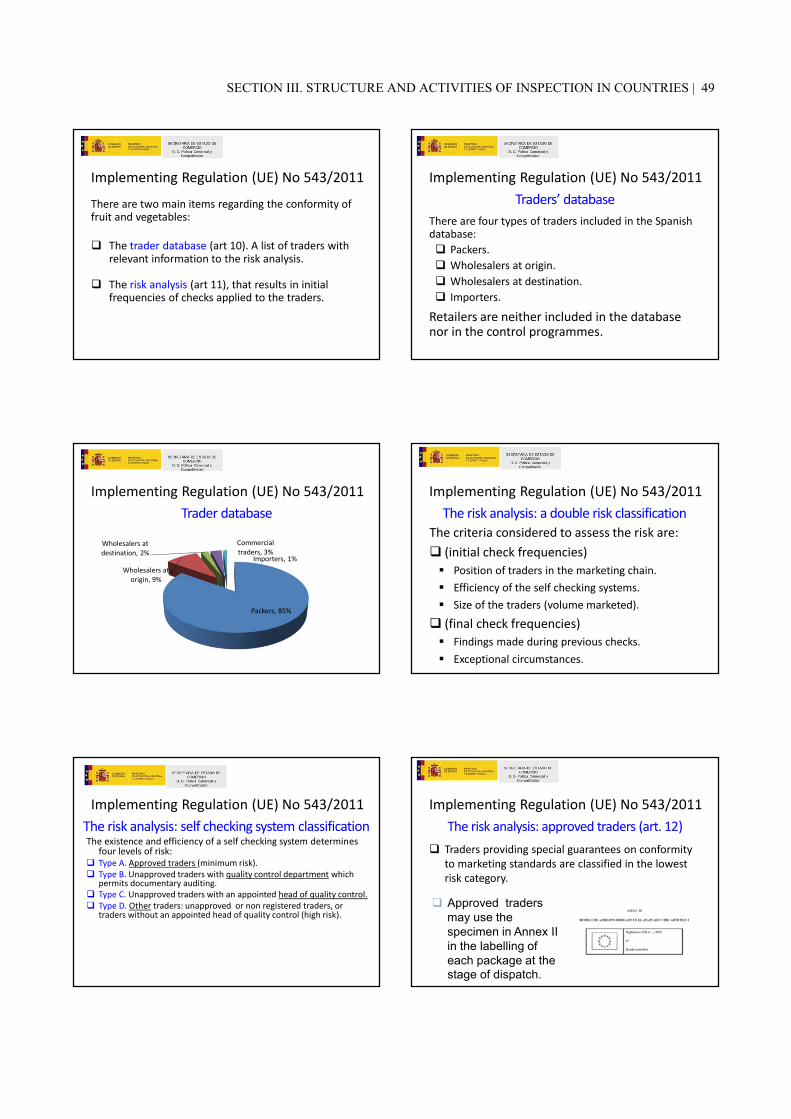
Implementing Regulation (UE) No 543/2011There are two main items regarding the conformity of fruit and vegetables:
The trader database (art 10). A list of traders with relevant information to the risk analysis.
The risk analysis (art 11), that results in initial frequencies of checks applied to the traders.
Implementing Regulation (UE) No 543/2011
There are four types of traders included in the Spanish database:
Packers.Wholesalers at origin.Wholesalers at destination.Importers.
Retailers are neither included in the database nor in the control programmes.
Traders’ database
Implementing Regulation (UE) No 543/2011
Packers, 85%
Wholesalers at origin, 9%
Wholesalers at destination, 2%
Commercial traders, 3%
Importers, 1%
Trader databaseImplementing Regulation (UE) No 543/2011
The criteria considered to assess the risk are:(initial check frequencies)
Position of traders in the marketing chain.Efficiency of the self checking systems.Size of the traders (volume marketed).
(final check frequencies)Findings made during previous checks.Exceptional circumstances.
The risk analysis: a double risk classification
Implementing Regulation (UE) No 543/2011
The existence and efficiency of a self checking system determines four levels of risk:Type A. Approved traders (minimum risk).Type B. Unapproved traders with quality control department which permits documentary auditing. Type C. Unapproved traders with an appointed head of quality control.Type D. Other traders: unapproved or non registered traders, ortraders without an appointed head of quality control (high risk).
The risk analysis: self checking system classificationImplementing Regulation (UE) No 543/2011
Traders providing special guarantees on conformity to marketing standards are classified in the lowest risk category.
The risk analysis: approved traders (art. 12)
Approved tradersmay use thespecimen in Annex IIin the labelling ofeach package at thestage of dispatch.
SECTION III. STRUCTURE AND ACTIVITIES OF INSPECTION IN COUNTRIES | 49
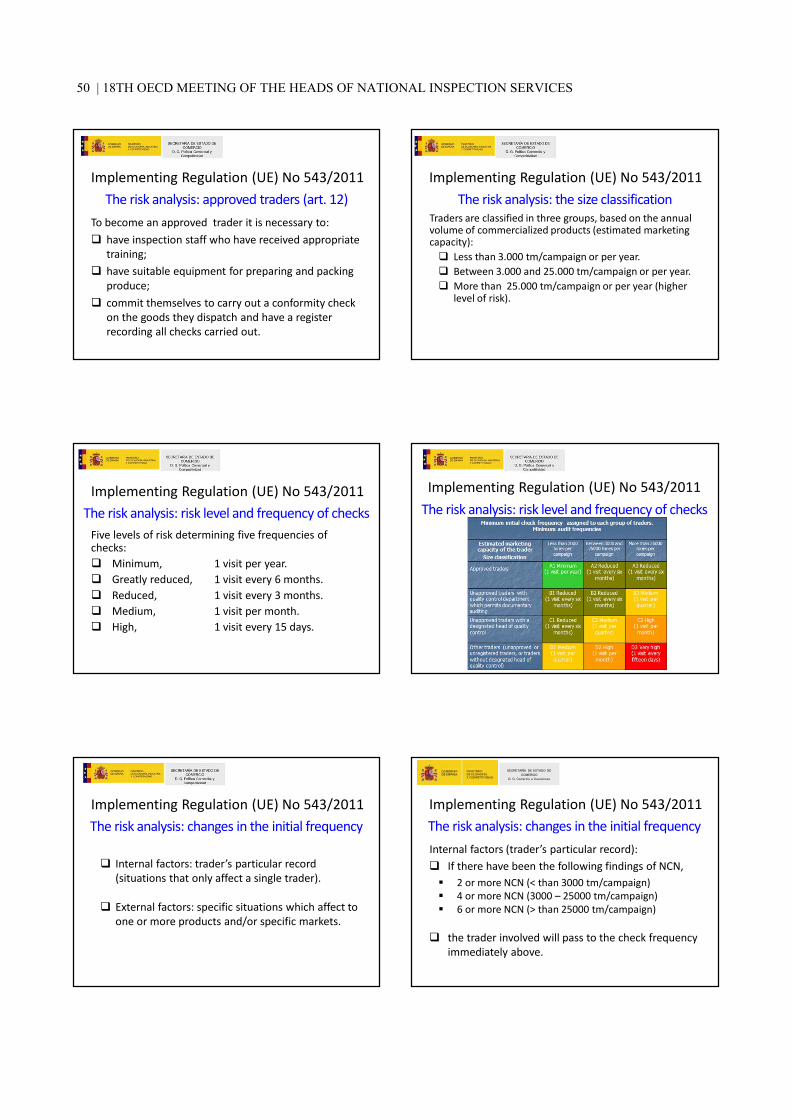
Implementing Regulation (UE) No 543/2011
To become an approved trader it is necessary to:have inspection staff who have received appropriate training; have suitable equipment for preparing and packing produce; commit themselves to carry out a conformity checkon the goods they dispatch and have a register recording all checks carried out.
The risk analysis: approved traders (art. 12)Implementing Regulation (UE) No 543/2011
Traders are classified in three groups, based on the annual volume of commercialized products (estimated marketing capacity):
Less than 3.000 tm/campaign or per year.Between 3.000 and 25.000 tm/campaign or per year.More than 25.000 tm/campaign or per year (higher level of risk).
The risk analysis: the size classification
Implementing Regulation (UE) No 543/2011
Five levels of risk determining five frequencies of checks:
Minimum, 1 visit per year.Greatly reduced, 1 visit every 6 months.Reduced, 1 visit every 3 months.Medium, 1 visit per month.High, 1 visit every 15 days.
The risk analysis: risk level and frequency of checks
Implementing Regulation (UE) No 543/2011The risk analysis: risk level and frequency of checks
Implementing Regulation (UE) No 543/2011
Internal factors: trader’s particular record (situations that only affect a single trader).
External factors: specific situations which affect toone or more products and/or specific markets.
The risk analysis: changes in the initial frequency
SECRETARÍA DE ESTADO DE
COMERCIO D. G. Comercio e Inversiones
Implementing Regulation (UE) No 543/2011
Internal factors (trader’s particular record):If there have been the following findings of NCN,
2 or more NCN (< than 3000 tm/campaign)4 or more NCN (3000 – 25000 tm/campaign)6 or more NCN (> than 25000 tm/campaign)
the trader involved will pass to the check frequency immediately above.
The risk analysis: changes in the initial frequency
50 | 18TH OECD MEETING OF THE HEADS OF NATIONAL INSPECTION SERVICES

Implementing Regulation (UE) No 543/2011
External factors that affect the produce:Initial or closing periods of the campaignSpecific problems related to a product or to a specific origin (pesticides, negative publicity campaigns, etc.)Adverse climatic circumstances in origin (frosts, intenserains, heat waves, etc.) Pest and diseases which seriously affect the qualitySerious problems at the destination markets (oversupplying, decline in consumption, etc.)Problems with transport and/or distribution (strikes…)
The risk analysis: changes in the initial frequencyImplementing Regulation (UE) No 543/2011
The trader will return to the previous initial frequency:automatically, when 3 or more conformity checks without negative results have occurred, orthrough a motivated decision by the competent inspection body:
at an individual or collective level, or when the marketing campaign has been concluded.
The risk analysis: return to the initial frequency
Implementing Regulation (UE) No 543/2011
The conformity certificate is compulsory for customs clearance,both for import and export from/to third countries.
But it is not possible to check every consignment for conformity.
As a general rule, the basic check frequency is:
Conformity controls at export and import level
Import ExportMinimum %
of conformity checks (physical)
80 % 50 %
Implementing Regulation (UE) No 543/2011
The initial minimum frequency of physical controls is based on thetype of trader according to its self checking quality system:
Conformity controls at export level
Minimum % of consignments for conformity checks (physical)
Frequency of visits allocated to the trader
Type A (Approved traders)
Types B, C, D(Unapproved traders)
MinimumGreatly reducedReduced
60% 70%
Medium High 70% 100%
Implementing Regulation (UE) No 543/2011
The final frequency of physical controls is based on the type of product:
Conformity controls at export level
Minimum % of consignments for conformity checks (physical)
High perishable Perishable Less perishable
Products with specificmarketing standard 90% 70% 60%Products with general marketing standard 80% 60% 50%
Implementing Regulation (UE) No 543/2011
The criteria to asses the risk include the country of origin andthe type of product.
Regarding the country of origin, the existence of a conformity certificate issued by a third country where the conformity checks have been approved by the Commission (art. 15), is a factor that reduces the risk of non conformity.
Conformity controls at import level
Approved country + certificate Other
Minimum % of conformitychecks (physical) 80 % 100 %
SECTION III. STRUCTURE AND ACTIVITIES OF INSPECTION IN COUNTRIES | 51

Implementing Regulation (UE) No 543/2011
The final frequency of physical controls is based on the type of product:
Conformity controls at import level
Minimum % of consignments for conformity checks (physical)
High perishable Perishable Less perishable
Products with specificmarketing standard 95% 85% 75%Products with general marketing standard 85% 75% 55%
5. SOFTWARE SUPPORT TOOLS
Software support toolsThe Inspectors’ Desk
Software support toolsIntegrated Inspection System ESTACICE
Software support toolsGARFYH: the Risk Analysis application
Software support tools
A database of specific legislation, standards, instructions, newsletters, campaigns reports
LEGISLA
52 | 18TH OECD MEETING OF THE HEADS OF NATIONAL INSPECTION SERVICES

Software support toolsDatacomex
A tool for statistics
Software support toolsNon conformity notifications
Software support toolsInspectors’ forum
Thank you very much for your attention.
SECTION III. STRUCTURE AND ACTIVITIES OF INSPECTION IN COUNTRIES | 53

54 │ 18TH OECD MEETING OF THE HEADS OF NATIONAL INSPECTION SERVICES
SECTION IV FOCUS ON ORGANIC MARKETS
In this section, the representative of the Ministry of Agriculture and Fisheries, Food and Environment gave an overview of the organic market in Span and abroad.
Presentations in the Section:
• Organic fruit & vegetables sales. Markets, trends and challenges

SECTION IV. FOCUS ON ORGANIC MARKETS │ 55
Organic fruit & vegetables sales. Markets, trends and challenge
by Mr José Miguel González Otero, Ministerio de Agricultura y Pesca, Alimentación y Medio Ambiente
Abstract
The evolution of the area used for organic farming in Spain went from less than 500 000 ha in 2001 to up to 2 018 802 ha in 2016, with more than 40 000 operators. 48% of organic production is concentrated in the Andalusia region. The number of organic fruit and vegetables industries grew more than 50% in the 2012-16 period. The trend worldwide is even higher, with subtropical fruits increasing an astonishing 700% in the 2004-16 period
According to some estimates the expenditure on organic fruit and vegetable in Spain would have increased between 2016 and 2017 by 12-16%, confirming a growing demand for organic products.
The current legal framework spans Council Regulation (EC) Nº 834/2007, Commission Regulation (EC) Nº 889/2008 and Commission Regulation (EC) Nº 1235/2008. Organic farming is also subject to horizontal legislation on agriculture and food (E.U and national). However, new legislation is expected to come into force in 2021.
83% of the world’s organic vegetables are grown in 10 countries. Mexico leads the group with 97 149 ha cultivated, representing 22.21% of the world’s total cultivation areas. Things change if we focus on temperate-zone fruits. In this case, 81.5% of the world’s organic production is grown in 10 countries: China, Italy, Poland, Turkey, France, USA, Bulgaria, Germany, Romania and Spain. In the case of fruits, China holds the biggest share with 38.44% of the total world’s cultivation areas.
As regards trade alone, in Spain exports of organic fruit and vegetable (fresh and processed) represent around 40% of the estimated overall organic products export (the value of the organic products export in 2016 accounted for around EUR 891 million). Import of organic fruit and vegetable (fresh and processed) represent around 20% of the estimated overall organic products import (the value of the organic products import in 2016 accounted for around EUR 560 million).
Value for money is important for the organic food consumer but less important than for the non-organic food consumer. Although quality has a price, there is always a threshold, which varies across countries. Price is also a very important factor in the purchasing decision, but in the case of organic products, it is not necessarily the largest challenge to rising consumption. Another important bottleneck in Spain is, for instance, one the different access model for organic food vis-à-vis to food distribution systems and the sales structures, compared with non-organic food. This makes it difficult for the organic product to be at the disposal of consumers on all supermarket shelves, which is an obstacle to create economies of scale that reduce production unit costs.
This said, there are new channels for purchasing food, for example internet has become a new trend. There is also a growing number of “convinced” organic food consumers. The average per capita yearly expenditure on organic products is around EUR 53.7 at EU level. Still, there are countries like Switzerland that already spend EUR 262/year, or Denmark where expenditure is around EUR 191.

56 │ 18TH OECD MEETING OF THE HEADS OF NATIONAL INSPECTION SERVICES
Organic fruit & vegetables sales. Markets, trends and challenge
Presentation by Mr José Miguel González Otero, Ministerio de Agricultura y Pesca, Alimentación y Medio Ambiente

ORGANIC FRUIT AND VEGETABLE SALES. QUALITY BEFORE PRICE? MARKETS, TRENDS AND CHALLENGES
18th OECD MEETING OF HEADS OF NATIONAL INSPECTION SERVICES11 May 2018, Seville, Spain
José Miguel González OteroSub-directorate general of Differentiated Quality and Organic Farming
Directorate General of the Food Industry
Ministry of Agriculture and Fisheries, Food and Environment
A quick glance of the
Spanish organic
farming.
THE EVOLUTION OF THE AREA UNDER ORGANIC FARMING IN SPAIN
• 2016: 2,018,802 ha
THE EVOLUTION OF THE NUMBER OF OPERATORS INVOLVED IN ORGANIC PRODUCTION IN SPAIN
• 2016: More tan 40,000 operators
DISTRIBUTION BY AUTONOMOUS COMMUNITIESPROCESSORS OF ORGANIC PLANT PRODUCTS
SECTION IV. FOCUS ON ORGANIC MARKETS | 57

ORGANIC FARMING, A PRODUCTION SUBJECT TO REGULATION AND CONTROL.
• Current legal framework:
Council Regulation (EC) Nº 834/2007Commission Regulation (EC) Nº 889/2008Commission Regulation (EC) Nº 1235/2008
• Also subject to horizontal legislation on agriculture and food (E.U and national).
• Art 27 R (EC) Nº 834/2007 establish that MM SS shall set up a system of controls and designate one or more competent authorities responsible forcontrols…Also art. 27 establish that the competent authority may confer its control competences to one or more control authorities; or delegate control tasks to one or more control bodies…
• New Regulation in few weeks: It shall apply from 1 January 2021.
CANTABRIAGALICIA
CASTILLA Y LEÓN
EXTREMADURA
ANDALUCIA
MURCIA
ARAGÓN
NAVARRA
LA RIOJA
PAÍS VASCO
CASTILLA LA MANCHA
ASTURIAS
MADRID
CATALUÑA
BALEARESC.VALENCIANA
CANARIAS
THE IMPLEMENTATION OF ART. 27 R(EC) 834/2007 IN SPAIN
-CCAA delegado control en OOCC-CCAA conferido control en AACC-CCAA con sistema mixto oocc+aacc-CCAA la misma autoridad competente ejerce el control
THE PRODUCTION OF ORGANIC FRUIT AND VEGETABLE IN SPAIN
PRODUCT LINES 2012 2016 % ∆2016/2012
VEGETABLES AND PATATOES
Area (hectares) 8,240 17,652 114.22%
Production (Metric tons) 187,123 294,500 57.38%
FRUIT OF ALL KINDS (DRIED FRUIT INCLUDED)
Area (ha) 111,594 155,308 39.17%
Production (MT) 236,122 253,101 7.19%
TOTALArea (ha) 119,834 172,960 44.33%
Production (MT) 423,245 547,601 29.38%
Source: MAPAMA
MAIN ORGANIC VEGETABLES IN SPAIN (2016)
ORGANIC VEGETABLES AREA PRODUCTION(Hectares) (Metric tons)
Fresh pea 2,837 3,181Cauliflower, cabbages and broccoli 1,682 35,269Fresh tomatoes 1,526 54,577Garlic 789 9,142Lettuce 766 5,602Peppers 746 37,337Asparagus 686 5,602Melons 598 13,049Other organic vegetables 8,022 130,741
TOTAL ORGANIC VEGETABLES 17,652 294,500
Source: MAPAMA
MAIN ORGANIC FRUITS IN SPAIN (2016)
ORGANIC FRUITS SUPERFICIE PRODUCTION(Hectares) (Metric tons)
Dried fruit 135,660 33,315Citrus 10,183 142,418Pome and stone fruits 5,648 40,680Subtropical fruits 2,912 27,349Strawberries and other berries 905 9,159
TOTAL ORGANIC FRUITS 155,308 253,101
Source: MAPAMA
THE STRUCTURE OF COMPANIES AND FRUIT AND VEGETABLE PLANTS DEDICATED TO HANDLING AND MARKETING OF ORGANIC FRUIT AND VEGETABLE IN
SPAIN HAS INCREASED SIGNIFICANTLY.
2012 2016 % ∆2016/2012
Number of organic fruit and vegetable industries
1,321 2,065 56.32%
Organic fruit and vegetable production (MT)
423,245 547,601 29.38%
Average production per industry (MT)
320,4 265,2 -17.23%
Source: MAPAMA
58 | 18TH OECD MEETING OF THE HEADS OF NATIONAL INSPECTION SERVICES

EVOLUTION OF THE VALUE OF THE SPANISH ORGANIC PRODUCTION AT SOURCE
Value at source (EUR Million) 2016 2015 2014 2013 ∆/∇ 2016/2015 (%)
O.P. Plant Origin 1,388.2 1,358.2 990.4 906.9 2.2%
O.P. Animal Origin 319.5 260.8 211.7 138.9 22.5%
Total value (EUR Million) 1,707.7 1,619.0 1.202.1 1,045.8 5,.%
Source: MAPAMA
Just a quick glance
abroad…
THE AREA USED TO PRODUCE FRUITS AND VEGETABLES HAS GROWN SIGNIFICANTLY IN
THE WORLDThousands of
hectares VEGETABLES TEMPERATE ZONE FRUITS
SUBTROPICAL FRUITS CITRUS
2004 105,2 97,2 40,5 28,5
2008 210,0 101,7 138,1 49,8
2012 237,8 165,4 220,9 57,0
2016 437,4 254,6 356,1 90,7
% ∆2016/2004 315.78% 161.93% 779.26% 218.25%
Source: MAPAMA
THE ORGANIC FRUIT AND VEGETABLE PRODUCTION IN THE E.U.(2016)
Hectares % ∆ /2015
TOTAL ORGANIC AREA OF FRUIT AND VEGETABLESVegetables, potatoes and strawberries 211,000 21%
All kinds of fruits 432,500 13%TOTAL 643,500 17%
Organic area used to produce vegetables, potatoes and strawberries.Potatoes 26,900 5%Strawberries 3,100 7%Leaf, steam and fruit vegetables 181,000 22%
TOTAL 211,000 21%Organic area of all kind of fruits
Dried fruit 234,000 22%Citrus 48,400 15%Berries 32,900 7%Other fruits 117,200 3%
TOTAL 432,500 13%Source: Agence BIO FRANCE
THE 83% OF THE WORLD’S ORGANIC VEGETABLES ARE GROWN IN 10 COUNTRIES
MAIN PRODUCERSAREA % AREA/ OVER
THE WORLD'S TOTAL(2016) (Hectares)
1. Mexico 97,149 22.21%
2. USA 64,461 14.74%
3. China 63,334 14.48%
4. Italy 43,648 9.98%
5. Egypt 25,379 5.80%
6. France 18,064 4.13%
7. Spain 17,296 3.95%
8. Canada 13,230 3.02%
9. Germany 12,399 2.83%
10. Poland 8,071 1.85%
Other countries 74,412 17.01%
TOTAL 437,443 100.00%
Source: FIBL & IFOAM
Mexico USA China Italy
Egypt France Spain Canada
Germany Poland Other countries
THE 81.5% OF THE WORLD’S ORGANIC TEMPERATE-ZONE FRUITS ARE GROWN IN 10
COUNTRIES
MAIN PRODUCERSAREA % AREA/
OVER THE WORLD'S
TOTAL(2016) (Hectares)
1. China 97.880 38.44%2. Italy 22,378 8.79%3. Poland 18,616 7.31%4. Turkey 16,260 6.39%5. France 13,540 5.32%6. USA 11,670 4.58%7. Bulgaria 7,659 3.01%8. Germany 7,472 2.93%9. Romania 6,354 2.50%
10. Spain 5,648 2.22%Other countries 47,123 18.51%
TOTAL 254,600 100.00%
Source: FIBL & IFOAM
China Italy Poland Turkey
France USA Bulgaria Germany
Romania Spain Other countries
SECTION IV. FOCUS ON ORGANIC MARKETS | 59

MAIN PRODUCERSAREA % AREA/
OVER THE WORLD'S
TOTAL(2016) (Hectares)
1. Italy 36,125 39.83%2. China 14,403 15.88%3. Mexico 12,570 13.86%4. Spain 10,183 11.23%5. USA 4,919 5.42%6. Ghana 4,105 4.53%7. Morocco 1,526 1.68%8. Greece 1,570 1.73%9. Egypt 1,190 1.31%
10. Argentina 1,010 1.11%Other countries 3,093 3.41%
TOTAL 90,694 100.00%
Source: FIBL & IFOAM
THE 95.4% OF THE WORLD’S ORGANIC CITRUS ARE GROWN IN 10 COUNTRIES
And what about
market?
SPECIFIC WEIGHT OF THE ORGANIC FRUIT AND VEGETABLE IN THE ORGANIC SHOPPING BASKET VERSUS NON ORGANIC CONSUMPTION
PRODUCT LINES CONSIDERED (SPAIN)
% of the quota in the Spanish organic shopping basket
% of the quota in the Spanish non organic
shopping basket
1. Vegetables, potatoes, potatoproducts 15% - 18% 10% - 12%
2. Fruits and derivative products 14% - 17% 9% - 11%
3. Dried fruits 3% - 5% 1% - 2%
Other products of plant origin4. Cereals, rice and derivative products 11% - 14% 9% - 12%
5. Oils and fats 7% - 10% 2% - 3%
6. Wines and beers 8% - 10% 2% -5%
7. Legumes and legume preserves 1% - 3% 1% - 2%
Source: MAPAMA
ACCORDING TO SOME ESTIMATES THE EXPENDITURE FOR ORGANIC FRUIT AND VEGETABLE
IN SPAIN WOULD HAVE INCREASED BETWEEN 2016 AND 2017 BY 12-16%
EXPENDITURE IN ORGANIC FRUIT AND VEGETABLE 2016 2017 (*) % ∆
2017/2016(EUR million per year)Vegetable, potatoes and potato products 311 360/370 15% - 19%
All kind of fruits and derivative produts 186 195/205 7% - 10%
TOTAL 497 555/575 12% - 16%
Source: MAPAMA(2016) and experts consulted (2017)
(*) Estimated.
ORGANIC FRUIT AND VEGETABLE HAVE A HIGH SHARE IN THE ORGANIC SHOPPING BASKETS OF THE MAIN
WORLD MARKETS
ORGANIC PRODUCTS WORLD MARKET % of the quota of the organic shopping baskettPRODUCT LINES
1. Fresh fruit and vegetables and derivatives 20% - 25%
2. Meat and meat products 15% - 20%
3. Milk and dairy products 12% - 18%
4. Cereals and cereal products 10% - 15%
5. Baby food 8% - 12%
Rest of organic food and drinks 15% - 25%
TOTAL 80% - 120%Source: MAPAMA
SPANISH ORGANIC FRUIT AND VEGETABLE FOREIGN TRADE
• The export of organic fruit and vegetable (fresh and processed) representaround 40% of the estimated overall organic products export (the value of theorganic products export in 2016 accounted for around 891 EUR million).
• The import of organic fruit and vegetable (fresh and processed) representaround 20% of the estimated overall organic products import (the value of theorganic products import in 2016 accounted for around 560 EUR million).
• The organic fruit and vegetable trade balance is positive (around 240 EUR million). This represents 2% of the overall external trade balance of the entiretrade on non organic fruit and vegetable.
60 | 18TH OECD MEETING OF THE HEADS OF NATIONAL INSPECTION SERVICES

PRIORITY IN THE REASONS OF PURCHASE
% of responses in consultations to non
organic buyers
% of responses in consultations to organic
buyers
1. Value for money 65% - 75% 55% - 65%
2. Proximity 60% - 70% 80% - 90%
3. Quality and freshness 55% - 60% 80% - 90%
4. Cleanliness and general apperance of the shop 50% - 55% 40% - 50%
5. Possibility of doing the entire purchase at the same establisment 45% - 50% 30% - 40%
6. Varied and flexible offer 45% - 50% 20% - 30%
7. Reliability and variability of the trademarks 45% - 50% 70% -80%
8. Parking availability / acces 35% - 45% 20% - 30%
9.Offers, promotions,customer cards… 25% - 35% 10% - 15%
10. Organic products offer 10% - 20% 100%
QUALITY BEFORE PRICE?
• Value for money is important for the organic food consumer but lessimportant than for the non-organic food consumer.
• Quality has a price, but also a treshold that vary with countries.
• Price is a very important factor in the purchasing decision, but in the case of organic products it is not necessarily the largest challenge to risingconsumption.
• There are other important bottlenecks. In Spain, for instance, one of them isthe different acces model for organic food vis-à-vis to food distributionsystem and the sales structures, compared with non organic food.
• It make it difficult for the organic product to be at the disposal of consumerson all supermarket shelves, which is an obstacle to create ecomies of scalethat reduce production unit costs.
• But a hypothetical balance of prices with non organic food will never happenbecause organic food production is a very demanding model.
MARKET STUDIES INDICATE THAT THE PRODUCTION AND THE FRUIT AND VEGETABLE CONSUMPTION IN THE WORLD WILL GROW BETWEEN 10-15%
IN THE COMING YEARS DUE TO SEVERAL FACTORS:
• 10% Increase of consumption in consolidated markets.
• 5% Increase of consumption in emergingmarkets.
• Incorporation into O.F. of huge food-production multinationals.
• Organic fruit and vegetables available in all major retailers, including the leadingchains.
• The consolidation and expansión of thee-commerce.
• The optimization of the knowledge onO.F. aimed to demand and consumptionand buying behavior.
• The growth in vegetarian, vegan and flexitarian habits.
• The growth in consumer demand forfresh products, “natural products”, “local products”.
• The increase on the concers about thesustainability of food production.
• A huge variety of alternatives for theorganic products: fresh product, preserves, juices, frozen food, babyfood, ready-made meal…
• Changes in household structure.
TRENDS AND CHALLENGESWE ALSO SHOULD TAKE INTO ACCOUNT:
• Just in the E.U. the 7% of the total agricultural land is already organic.
• The 1.1% of the global agricultural landis already organic (Liechtentein 30,2%, Austria 21.3% and Sweden 16.9% (2015).
• The value of the global organic foodmarket in 2015 was 7d billion euros approx.
• Changes in the on-premises channel.
• New ways of purchasing food.
• The proven resilience of the “convinced”organic food consumer.
• The organic spend per capita in the E.U is around €53.7. In Spain is around €36
.• But in Switzerland is already €262/year;
in Denmark €191 and in Sweden€177/year (2015).
Thank you for your [email protected]
http://www.mapama.gob.es/es/alimentacion/temas/produccion-ecologica/
SECTION IV. FOCUS ON ORGANIC MARKETS | 61
62 │ 18TH OECD MEETING OF THE HEADS OF NATIONAL INSPECTION SERVICES
SECTION V FIELD TRIP
This section summarises the discussions that took place during the field trip.
During the field trip delegates met with representatives of several actors of the peach and nectarine sector.
• Mr José Rodriguez, CEO of Sintesis (Primor Fruit)
• Mr Christophe Bouchet, responsible for the growing (orchard) at Primor Fruit
• Mr Gianpietro Lingua and Mr Gabriel Canevello, RKGROWERS, an Italian export company that trades Primor Fruit’s production in Italy Piedmont region.
• Mr Luis Marin, Director of Associafruit, association of fruit producers.
Delegates visited Primor Fruit company. Primor Fruit started its activities at the late 60’s when a French family began cultivating new varieties of peaches near Seville. Primor Fruit S.A. was funded in 1976 and is specialised in precocious stone fruit production. Since 2015 Primor Fruit S.A has been a member of SAT SINTESIS, an important organisation of producers that commercialises the product of Primor Fruit and of four other producers.
Discussions took place at:
• fields of peaches and nectarines -Primor Fruit company - Pedro Espiga field
• packhouse - Primor Fruit company - Pedro Espiga.

SECTION V. FIELD TRIP │ 63
Fields of peaches and nectarines - Primor Fruit company - Pedro Espiga field
Discussant: Mr Christophe Bouchet
Abstract
The “Pedro Espiga” field is a plantation of peaches and nectarines and covers 350 ha close to the river Guadalquivir.
Mr Christophe Bouchet explained the challenges of the production of peaches in Andalusia. Primor Fruit introduced the production of peaches for the first time in Andalusia in the 1960’s. Cultivation is a challenge as growing peaches is very complicated. The major criteria for choosing a variety is its ability to adapt to the local conditions. Then come major criteria to meet the demand: colour, flavour and taste.
Mr Bouchet shared the grower’s point of view about organic versus integrated agriculture. The grower is trying to take account of the environment conditions: sparing water, maintaining biodiversity. The point is to find a compromise between treatments for the good of both plant and environment. Most of the time it is challenging to meet both needs simultaneously.
Mr Bouchet also talked about irrigation and management of weeds. Primor Fruit used to apply flowed irrigation. Nowadays they apply drip irrigation. Behind this is the balance between herbicides and fungicides. Weeds can help maintaining diversity and monitoring the soil’s nitrogen contents. So, an option is to reduce herbicides. However, when weeds are too high they favour mould development. Therefore, growers have to find the right balance between herbicide and fungicide when managing weeds. Taking account of the advantages and inconvenient of weeds for peach production helps finding compromise. There are alternate ways for getting rid of weeds: mechanic cut, which nonetheless implies to revise the whole production system, or plastic covers, which are bad for environment.
Delegates then visited the field and shared experiences with the hosting team on the growing techniques and the inspection challenges for peaches and nectarines.

64 │ 18TH OECD MEETING OF THE HEADS OF NATIONAL INSPECTION SERVICES
Packhouse - Primor Fruit company - Pedro Espiga
Discussant: Mr Gianpietro Lingua
Abstract
Mr Gianpietro Lingua guided the visit of the Primor Fuit packinghouse. The facilities cover 50 000 m2 and is dedicated to nectarines, peaches and oranges. Delegates could witness all steps of the treatment: arrival, sampling (size, BRICS, temperature and pressure), washing, sorting, packaging and loading.
Mr Lingua explained the practices regarding grading: products in Class I should show no defect; Class II products go to domestic market; and products graded in a different Class go to the processing supply chain.

SECTION VI. NEW TECHNOLOGIES FOR FRUIT AND VEGETABLES PRODUCTION AND INSPECTION │ 65
SECTION VI NEW TECHNOLOGIES FOR FRUIT AND VEGETABLES PRODUCTION
AND INSPECTION
In this section, invited experts introduce or raise awareness on new trends and technologies in the fruit and vegetables sector, for consideration of the heads of national inspection services.
Presentations in the Section:
• New greenhouse technologies
• New microbiological analysis in fresh fruits and vegetables
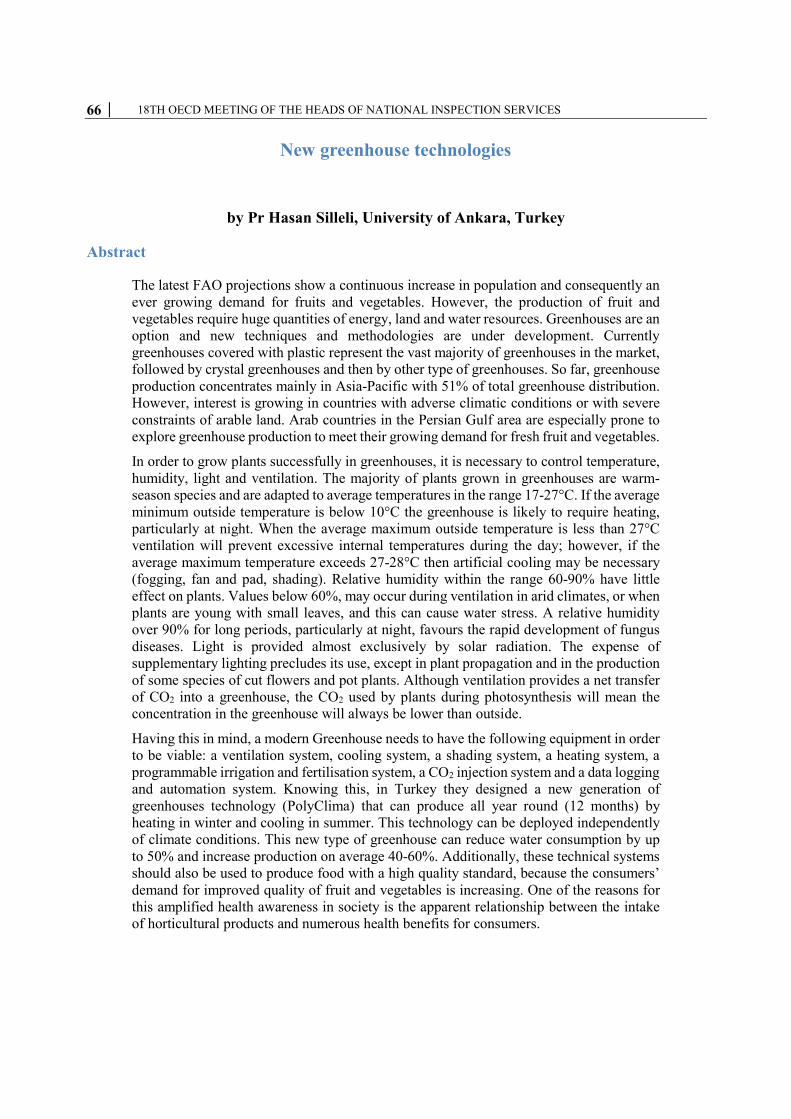
66 │ 18TH OECD MEETING OF THE HEADS OF NATIONAL INSPECTION SERVICES
New greenhouse technologies
by Pr Hasan Silleli, University of Ankara, Turkey
Abstract
The latest FAO projections show a continuous increase in population and consequently an ever growing demand for fruits and vegetables. However, the production of fruit and vegetables require huge quantities of energy, land and water resources. Greenhouses are an option and new techniques and methodologies are under development. Currently greenhouses covered with plastic represent the vast majority of greenhouses in the market, followed by crystal greenhouses and then by other type of greenhouses. So far, greenhouse production concentrates mainly in Asia-Pacific with 51% of total greenhouse distribution. However, interest is growing in countries with adverse climatic conditions or with severe constraints of arable land. Arab countries in the Persian Gulf area are especially prone to explore greenhouse production to meet their growing demand for fresh fruit and vegetables.
In order to grow plants successfully in greenhouses, it is necessary to control temperature, humidity, light and ventilation. The majority of plants grown in greenhouses are warm-season species and are adapted to average temperatures in the range 17-27°C. If the average minimum outside temperature is below 10°C the greenhouse is likely to require heating, particularly at night. When the average maximum outside temperature is less than 27°C ventilation will prevent excessive internal temperatures during the day; however, if the average maximum temperature exceeds 27-28°C then artificial cooling may be necessary (fogging, fan and pad, shading). Relative humidity within the range 60-90% have little effect on plants. Values below 60%, may occur during ventilation in arid climates, or when plants are young with small leaves, and this can cause water stress. A relative humidity over 90% for long periods, particularly at night, favours the rapid development of fungus diseases. Light is provided almost exclusively by solar radiation. The expense of supplementary lighting precludes its use, except in plant propagation and in the production of some species of cut flowers and pot plants. Although ventilation provides a net transfer of CO2 into a greenhouse, the CO2 used by plants during photosynthesis will mean the concentration in the greenhouse will always be lower than outside.
Having this in mind, a modern Greenhouse needs to have the following equipment in order to be viable: a ventilation system, cooling system, a shading system, a heating system, a programmable irrigation and fertilisation system, a CO2 injection system and a data logging and automation system. Knowing this, in Turkey they designed a new generation of greenhouses technology (PolyClima) that can produce all year round (12 months) by heating in winter and cooling in summer. This technology can be deployed independently of climate conditions. This new type of greenhouse can reduce water consumption by up to 50% and increase production on average 40-60%. Additionally, these technical systems should also be used to produce food with a high quality standard, because the consumers’ demand for improved quality of fruit and vegetables is increasing. One of the reasons for this amplified health awareness in society is the apparent relationship between the intake of horticultural products and numerous health benefits for consumers.

SECTION VI. NEW TECHNOLOGIES FOR FRUIT AND VEGETABLES PRODUCTION AND INSPECTION │ 67
New greenhouse technologies
Presentation by Pr Hasan Silleli, University of Ankara, Turkey

Greenhouse Technologies
Semi-closed greenhouses
POLYCLIMA Prof.Dr.Hasan SİLLELİ
University of Ankara Faculty of Agriculture
Agricultural Machinery and Tech. Eng. Dept.
Outline• Section1
Overview of world greenhouses• Section 2
Overview of Turkish greenhouses• Section 3
Greenhouse environment• Section 4
Semi-closed greenhouses and some examplesfor new Polyclima technic
Almeria1
Almerian greenhouses are clearly a popular topic with satellite images takers: Nasa have also highlighted the area
"The sunny south of Spain offers more to the national economy than simply tourism. Over the past 50 years, the small coastal plain (campo), some 30 kilometers southwest of the city of Almería, has been intensively
developed for agriculture. An estimated 20,000 hecatres of extra-early market produce is grown in greenhouses in the Campo de Dalías, and it accounts for over $1.5 billion in economic activity. The area has a dry, mild,
Mediterranean climate and is further sheltered on the north by the Sierra de Gador mountains. With just slightly more than 200 millimeters of annual precipitation to support crop growth, the area also relies on groundwater
fed by small stream aquifers from the mountains to the north."
The World Consumption of Fruit and Vegetable1969-2049
Total Consumption of Fruit and Vegetable Population Consumption per Person
Source: faostat.org, expert calculations
ProductiveSafeTraceablity
Energy Reserves, World Population, Food Production
Customer and market demands are overshadowed by the future production conditionsespecially in greenhouses. Among other things, the production processes in terms of fruit and vegetables require high amounts of energy for heating/cooling and freshwater for irrigation, where these traded goods are the most cost-intensive resources in greenhouse production due to the increase in fossil fuel and freshwater prices
Source: PCA.org
68 | 18TH OECD MEETING OF THE HEADS OF NATIONAL INSPECTION SERVICES
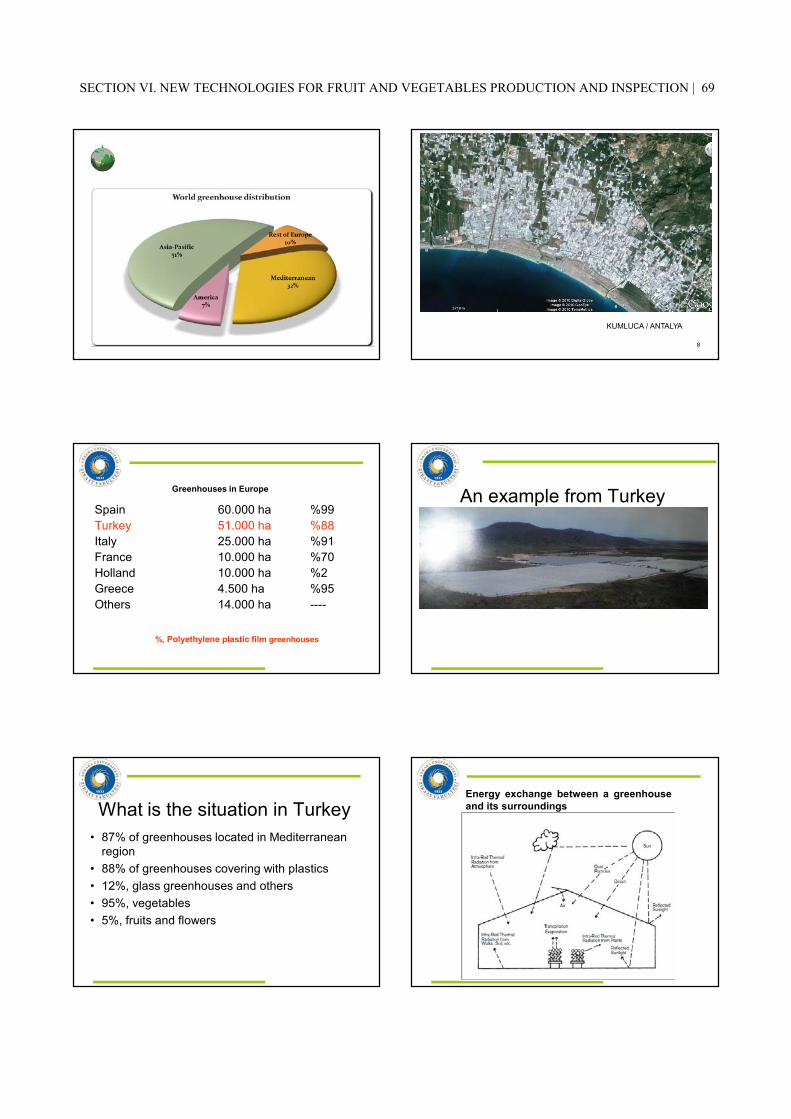
Dünya’da Seracılık
8
KUMLUCA / ANTALYA
Greenhouses in Europe
Spain 60.000 ha %99Turkey 51.000 ha %88Italy 25.000 ha %91France 10.000 ha %70Holland 10.000 ha %2Greece 4.500 ha %95Others 14.000 ha ----
%, Polyethylene plastic film greenhouses
An example from Turkey
What is the situation in Turkey• 87% of greenhouses located in Mediterranean
region• 88% of greenhouses covering with plastics• 12%, glass greenhouses and others• 95%, vegetables• 5%, fruits and flowers
Energy exchange between a greenhouseand its surroundings
SECTION VI. NEW TECHNOLOGIES FOR FRUIT AND VEGETABLES PRODUCTION AND INSPECTION | 69

Factors that can affect a greenhouse environment
Greenhouses provide higher than ambient average temperatures and protectplants from the effects of wind and rain, however in order to grow plantssuccessfully,it is generally necessary to modify the naturally created internal climate.Temperature is the most important variable of the greenhouse climate that can becontrolled.• The majority of plants grown in greenhouses are warm-season species and are
adapted to average temperatures in the range 17-27°C,• with approximate lower and upper temperature limits of 10 and 35°C• If the average minimum outside temperature is below 10°C the greenhouse
is likely to require heating, particularly at night.
•When the average maximum outside temperature is less than 27°Cventilation will prevent excessive internal temperatures during the day;however, if the average maximum temperature exceeds 27-28°C then artificialcooling may be necessary (foging, fan and pad, shading).• The maximum greenhouse temperature should not exceed 30-35°C forprolonged periods.
•The second important variable of the greenhouse climate is humidity, whichhas traditionally been expressed in terms of relative humidity. Relativehumidity within the range 60-90% have little effect on plants.
•Values below 60%, may occur during ventilation in arid climates, or whenplants are young with small leaves, and this can cause water stress. Seriousproblems can occur if the relative humidity exceeds 90% for long periods,particularly at night as this favors the rapid development of fungus diseasese.g. Botrytis cinerea
•Light or more specifically, photosynthetically active radiation (PAR) is anessential requirement for greenhouse crop production, but it is providedalmost exclusively by solar radiation. The expense of supplementarylighting precludes its use except in plant propagation where plant densitiescan be very high, and in the production of some species of cut flowers andpot plants.
•Although ventilation provides a net transfer of CO2 into a greenhouse, theCO2 used by plants during photosynthesis will mean the concentration inthe greenhouse will always be lower than outside. In well ventilatedgreenhouses when the insolation is high, concentrations of 200 μmol mol-1have been recorded compared to 360 μmol mol-1 in the externalatmosphere.
Greenhouse types in respect to intention of usage
Commercial greenhouses, Seed and seedling greenhouses,
Protect-rehabilitation and demonstration greenhouses,Research and Development greenhouses.
Growing method• In soil• Hydrophonic
Caner YILMAZ –Ziraat Mühendis
95% of modern greenhousesuse hydroponic system
70 | 18TH OECD MEETING OF THE HEADS OF NATIONAL INSPECTION SERVICES
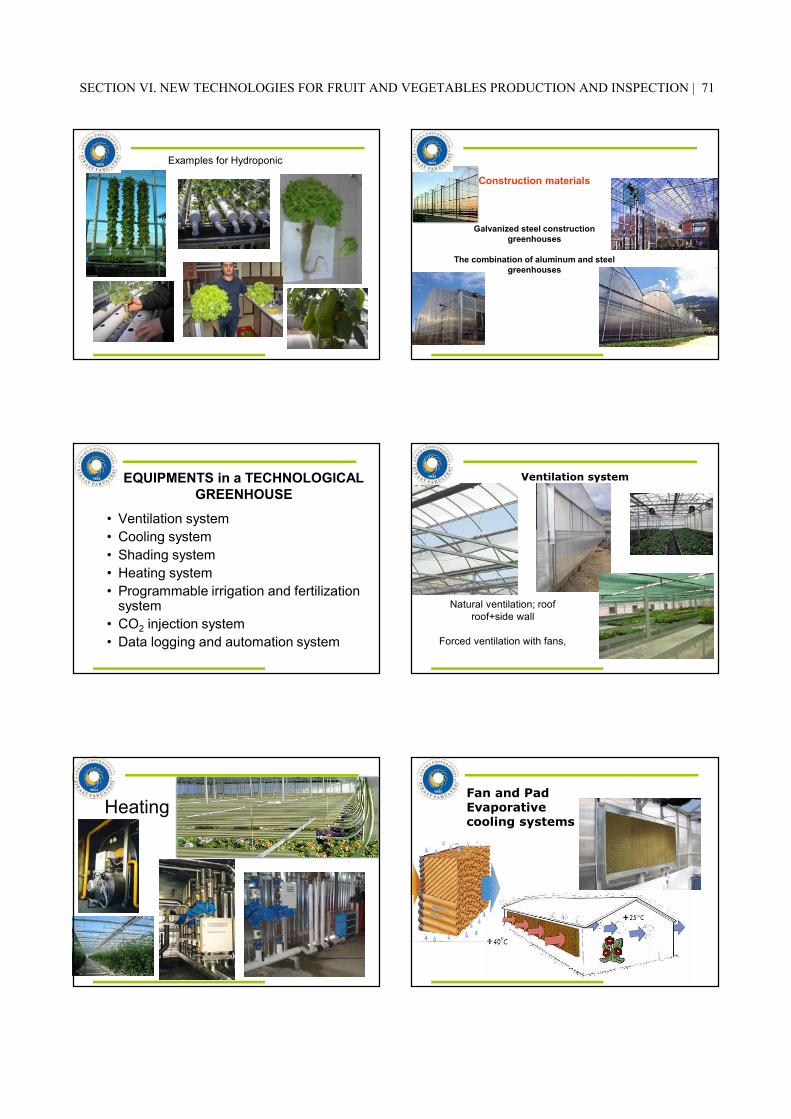
Examples for Hydroponic
Construction materials
Galvanized steel construction greenhouses
The combination of aluminum and steel greenhouses
EQUIPMENTS in a TECHNOLOGICAL GREENHOUSE
• Ventilation system• Cooling system• Shading system• Heating system• Programmable irrigation and fertilization
system• CO2 injection system• Data logging and automation system
Natural ventilation; roofroof+side wall
Forced ventilation with fans,
Ventilation system
HeatingFan and PadEvaporativecooling systems
39
SECTION VI. NEW TECHNOLOGIES FOR FRUIT AND VEGETABLES PRODUCTION AND INSPECTION | 71

Not more than 30 m
Misting/Fogging
Shading systemsInternal, external and thermal shading
Irrigation and Fertilization
CO2 injection
Although ventilation provides a net transferof CO2 into a greenhouse, the CO2 used byplants during photosynthesis will mean theconcentration in the greenhouse will alwaysbe lower than outside. In well ventilatedgreenhouses when the insolation is high,concentrations of 200 μmol mol-1 havebeen recorded compared to 360 μmol mol-1in the external atmosphere.
Input,water,nutritions, energy,light, CO2.
Output,O2
waterOrganic compound
PHOTOSYNTHESİSULTRA SENSITIVE IN-LINE FERTIGATION UNIT WITH MECHANICAL
MEMBRANE DOSAGE POMP
72 | 18TH OECD MEETING OF THE HEADS OF NATIONAL INSPECTION SERVICES

Plant weighing scale and measuring unit for drainage of irrigation water Artificial lighting
INFORMATION-COMUNICATION AND CONTROL
Temperature (°C)
Relative Humidity (%)
Insolation (W/m2)
Consentration of CO2 (ppm)
Parameters that should be controlled in greenhouse
Internal and external sensorsfor controlling GH
Temperature sensorsRHT sensor
Wind speed and directionRain sensorPyronometerPAR sensor Soil moisture
CO2 concentration Transpiration,Wet sensor
AnemometerEC and pH sensor
Greenhouse and control engineering 58
SECTION VI. NEW TECHNOLOGIES FOR FRUIT AND VEGETABLES PRODUCTION AND INSPECTION | 73
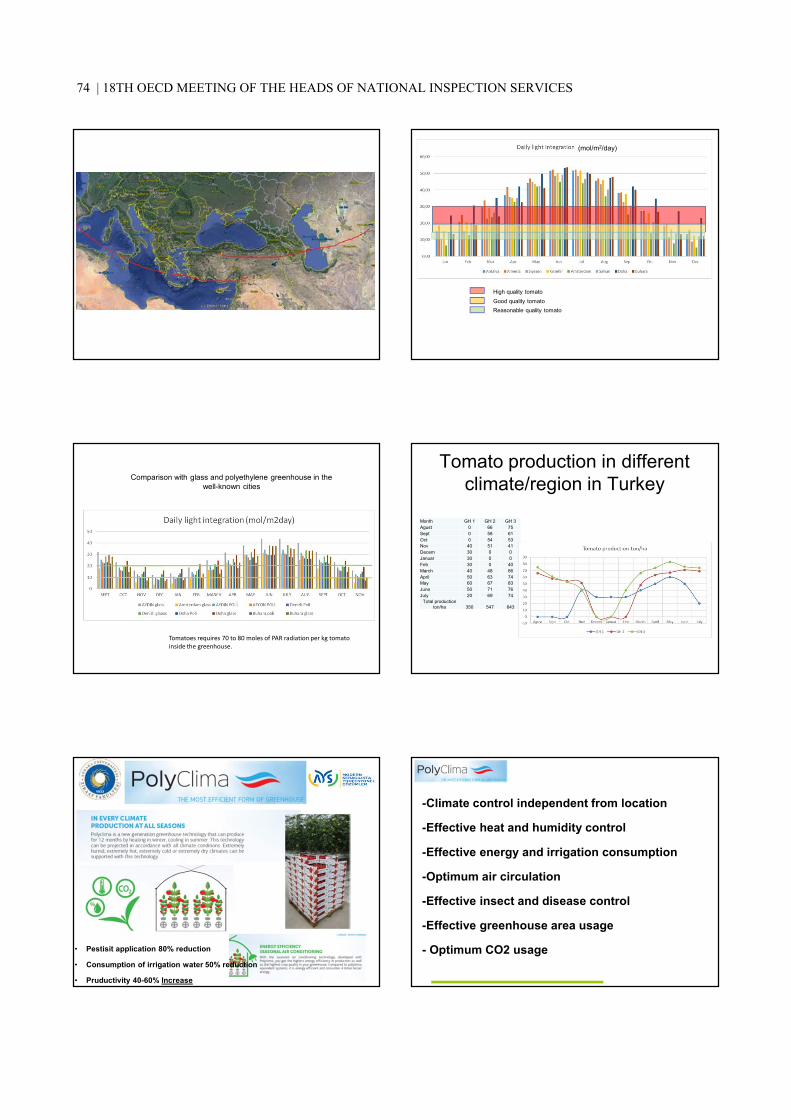
Reasonable quality tomatoGood quality tomatoHigh quality tomato
(mol/m2/day)
Comparison with glass and polyethylene greenhouse in the well-known cities
Tomatoes requires 70 to 80 moles of PAR radiation per kg tomato inside the greenhouse.
Tomato production in different climate/region in Turkey
Month GH 1 GH 2 GH 3Agust 0 66 75Sept 0 58 61Oct 0 54 53Nov 40 51 41Decem 30 0 0Januar 30 0 0Feb 30 0 40March 40 48 66April 50 63 74May 60 67 83June 50 71 76July 20 69 74
Total production ton/ha 350 547 643
• Pestisit application 80% reduction
• Consumption of irrigation water 50% reduction
• Pruductivity 40-60% Increase
-Climate control independent from location
-Effective heat and humidity control
-Effective energy and irrigation consumption
-Optimum air circulation
-Effective insect and disease control
-Effective greenhouse area usage
- Optimum CO2 usage
46
74 | 18TH OECD MEETING OF THE HEADS OF NATIONAL INSPECTION SERVICES

Semi-closed greenhouse and Polyclima technic
IN EXTREMELY HUMID CONDITIONSCAPABLE TO MOISTURE CONTROL
Equipments in SC-Greenhouse
SECTION VI. NEW TECHNOLOGIES FOR FRUIT AND VEGETABLES PRODUCTION AND INSPECTION | 75

AHU
1-FC Plug FAN2-Heat exchanger3-Heated&Cooled air4-Dehumidification collectiochannel
10-12 times should be changedthe whole greenhouse air.
Cooling e Mersin
First Polyclima in Azerbaijan First section was built as 5 ha
76 | 18TH OECD MEETING OF THE HEADS OF NATIONAL INSPECTION SERVICES
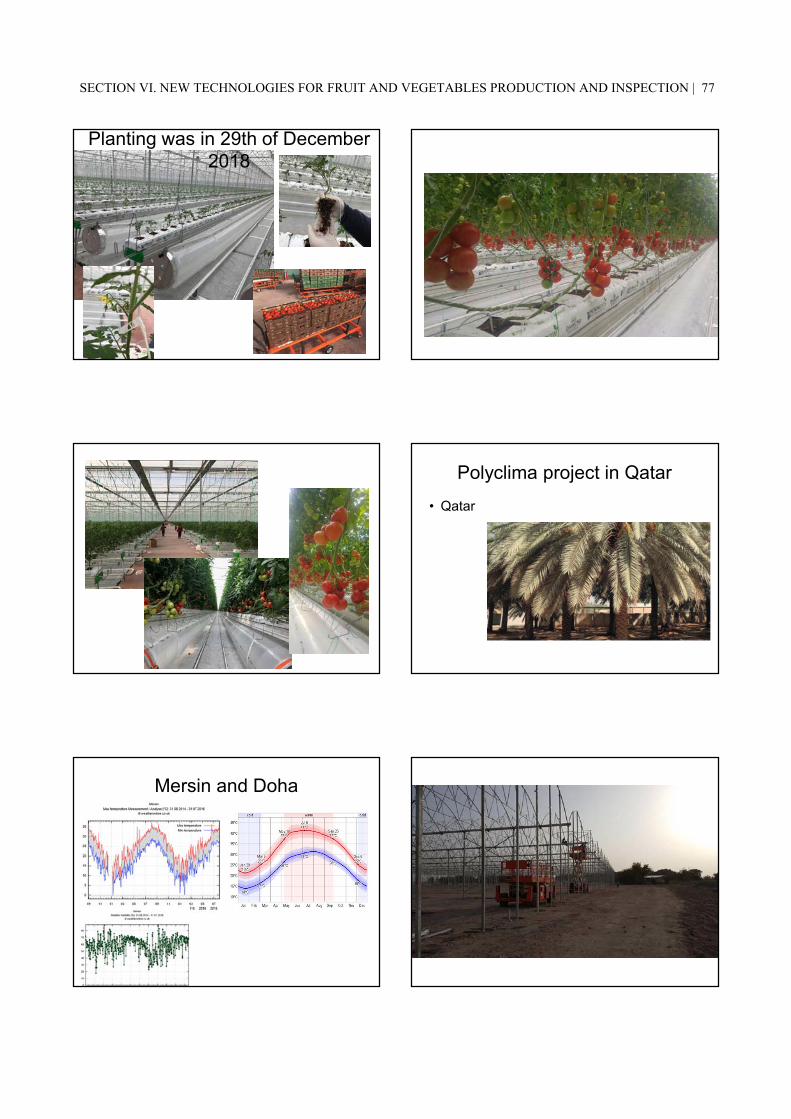
Planting was in 29th of December 2018
Polyclima project in Qatar• Qatar
Mersin and Doha
SECTION VI. NEW TECHNOLOGIES FOR FRUIT AND VEGETABLES PRODUCTION AND INSPECTION | 77

Estimation for labor cost and electricty for Qatar
1st year 2nd year 3th year
Production (kg/m2) 35 45 52
Labor cost (USD/kg) 0,79 0,61 0,53
Electricity (USD/kg) 0,47 0,37 0,32
Total cost (USD/kg) 1,26 0,98 0,85
Thanks
78 | 18TH OECD MEETING OF THE HEADS OF NATIONAL INSPECTION SERVICES

SECTION VI. NEW TECHNOLOGIES FOR FRUIT AND VEGETABLES PRODUCTION AND INSPECTION │ 79
New microbiological analysis in fresh fruits and vegetables
by Ms Amparo de Benito, AINIA
Abstract
Ms. Amparo de Benito, after presenting AINIA, provided a presentation on new microbiological analysis in fresh fruits and vegetables. Her presentation gave a comprehensive overview of microbiological criteria in fruits and vegetables, relevant European legislation, risk analysis, and detailed explanations of methodologies for analysis.
AINIA is a non-profit organisation with more than 25 years of experience in research, development and innovation. One of its core areas of expertise is the microbiological analysis in fresh fruits and vegetables. Methods can be divided into quantitative and qualitative.
Quantitative methods include count by MPN (most probable number). In this method, each dilution is planted in three or five tubes, the count is obtained by the number of positive tubes and the results are interpreted using conversion tables. There is also a MPN automated method. It is based on MPN, but with automated reading by fluorescence. Another interesting quantitative method is the “Flow Cytometry”. This method detects and quantifies the cells in a sample, measures optical properties, for example light emitted by fluorochromes and light scattered by particles of the flow, and can differentiate cells by size and complexity.
On qualitative methods, immunoassays (ELISA) is based on the antigen-antibody reaction. It is generally used as a second antibody. We also have recognition by phage, based on the specific recognition by phage. The methodology needs confirmation phase (presence). We also have genetic testing (PCR real time) based on the specific detection of DNA. After a detection phase of enrichment, it requires a confirmation phase (presence). It does not differentiate DNA from non-viable cells.

80 │ 18TH OECD MEETING OF THE HEADS OF NATIONAL INSPECTION SERVICES
New microbiological analysis in fresh fruits and vegetables
Presentation by Ms Amparo de Benito, AINIA

www.ainia.es 1
New microbiological analysis in fresh fruits and vegetables
Amparo de Benito Laboratorio de Bioensayos
09th July 2018
www.ainia.es 2
www.ainia.es 3
Organizational Model
ENGINEERING AND PROCESSES
NEW PRODUCTS
INSTRUMENT & AUTOMATICS
PACKAGING
BIOASSAYS
CHEMICAL ANALYSIS
ENVIRONMENT, BIOENERGY
ICT
FOOD LEGISLATION
TECHNOLOGY TRANSFER
R&D
TECH
NO
LOG
ICAL
ASS
ISTA
NCE
ANAL
YTIC
AL S
ERVI
CES
INDU
STRI
AL S
ERVI
CES
TRAI
NIN
G
BUSINESS UNITSGENERAL MANAGEMENT
DEP
AR
TAM
ENTS
CON
SUM
OLA
B
www.ainia.es 4
Governing bodies
Our governing bodies have high representation of the food industry
730Associated companies
27Members
General Assembly Governing Council
www.ainia.es 5
Our specialties
• Food & Health• Food quality & Safety• Design and Industrial Production• Sustainability, environment• Consumer
• Food technology• Biotechnology• Nanotechnology• Electronics and communications• Chemical Technologies• Environmental and energetic technologies• Packaging technologies
Priority lines Know how
Sectors
Food
Energy
Packaging
Chemistry
Cosmetics
Pharma
www.ainia.es 6
Infraestructures
More than 13.000 m2 of facilities for the development of our research activity, with a value above 30 M €
- 8 laboratories- 12 pilot plants- Classrooms- Research area- Industrial supercritical plant- Consumolab Madrid and Valencia
SECTION VI. NEW TECHNOLOGIES FOR FRUIT AND VEGETABLES PRODUCTION AND INSPECTION | 81

www.ainia.es 7
Infraestructures
Laboratories
www.ainia.es 8
InfraestructuresPilot plants
Unit Operations New products Culture of microalgae Microencapsulation
www.ainia.es 9
> Microbiological AnalysisR&D:Set up and validation of new analytical methods.
Accreditated laboratory ISO 17025:Food pathogens (rapid methods and culture)Moulds, yeasts, fungusVirus (norovirus, hep-A)AllergensSurface analysisIdentification of microorganisms (Maldi-tof, rep-PCR)
Spanish representative in ISO/CEN Food Microbiology Commite
www.ainia.es 10
> Antimicrobial strategiesAntimicrobial
materials BiofilmsInactivation technologies
Novel inhibitors
0
1000
1500
2000
2500
3000
3500
4000
4500
5000
5
7
90
0.1
0.2
0.3
0.4
0.5
0.6
0.7
0.8
0.9
1
rate
(lo
g (c
fu/g
)/d
ays
Aditive (ppm)
temperature
Response Surface for Listeria monocytogenes at different levels of preservative and temperatures
Development of predictive models and quantitative risk assessment In situ diagnosis of
contamination
www.ainia.es 11
Microbiological criteria in fruits and vegetables. European Legislation
Other criteria. Risk analysis
Methodology for analysis:
• ISO standards• Use of alternative methods
www.ainia.es 12
The Regulation 2073/2005 of the EU,and amendments, establishes:
• The microbiological criteria in certainfoods
•This criteria should form an integralpart of the implementation of HACCP-based procedures and other hygienecontrol measures
Introduction:
82 | 18TH OECD MEETING OF THE HEADS OF NATIONAL INSPECTION SERVICES

www.ainia.es 13
The regulation 2073/2005 is divided in three chapters:
Chapter 1. Food safety criteria (are applicable throughout theshelf-life of the product, introduce new concepts such as microbialgrowth prediction).
Chapter 2. Process hygiene criteria.Meat and productsMilk and dairy productsEgg productsFishery productsVegetables, fruits and products
Chapter 3. Rules for sampling and preparation of test samples.
www.ainia.es 14
• Precut Fruits and Vegetables(Ready to eat)
• Non-pasteurized fruit andvegetable juices (Ready to eat)
• Sprouted seeds (Ready to eat)
•Sprouts (Untreated)
Salmonella
Listeria monocytogenes
E. coli (processcriteria)
Microbiological criteria in Regulation 2073/2005 :
SalmonellaListeria monocytogenes
Shiga toxin-producing E. coli (STEC) O157, O26, O111, O103, O145 and O104:H4
www.ainia.es 15
Microbiological criteria in Regulation 2073/2005 :
www.ainia.es 16
Microbiological criteria in Regulation 2073/2005 :
Samples shall be taken from processing areas and equipmentused in food production, when such sampling is necessary forensuring that the criteria are met. In that sampling the ISOstandard 18593 shall be used as a reference method.
Food business operators manufacturing ready-to-eat foods, whichmay pose a Listeria monocytogenes risk for public health, shallsample the processing areas and equipment for Listeriamonocytogenes as part of their sampling scheme.
www.ainia.es 17
Identification of other microbiological hazards
Regulations, collection of microbiological standards for each type of product, recommendations…
RASFF (Rapid Alert System for food and feed) http://ec.europa.eu/food/food/rapidalert/index_en.htm
References and scientific articles in specialized databases. http://www.sciencedirect.com /
Experience in terms of microbiological hazards for each type of product.
www.ainia.es 18
Main food-borne outbreaks in the EU
www.efsa.europa.eu EU summary report on zoonoses, zoonotic agents and food-borne outbreaks, 2014 (EFSA Journal 2015; 13 (12)
SECTION VI. NEW TECHNOLOGIES FOR FRUIT AND VEGETABLES PRODUCTION AND INSPECTION | 83

www.ainia.es 19
> Food-borne outbreaks caused by viruses
www.efsa.europa.eu EU summary report on zoonoses, zoonotic agents and food-borne outbreaks, 2014 (EFSA Journal 2015; 13 (12)
www.ainia.es 20
Selection o finform atio nsources
Se lection o finform atio nsources
•Determination of objectives and scope
•Selection of sources (website, journals,etc…)
Search andanalyzingsignals
Search andanalyzingsignals
•Selection of key words
•Sistematic search.
ainia searchengine
ainia searchengine
Methodology used in ainia:
www.ainia.es 21
•Revision by an expert of theoutcomes of the authomatic search
•Study by the expert of the possiblescenarios
SignalsfilteringSignalsfiltering
Developm entandassessm ent ofscenarios
Developm entandassessm ent ofscenarios
Identification of potencial risks
Methodology:
www.ainia.es 22
31%
23%8%
16%
3%
3%
2% 14%
Salmonella spp Listeria monocytogenes Virus Hepatitis A Norovirus GI y GIIE.coli 0157 (STEC) Bacillus cereus Capylobacter otros
31%
23%8%
16%
3%
3%
2% 14%
Salmonella spp Listeria monocytogenes Virus Hepatitis A Norovirus GI y GIIE.coli 0157 (STEC) Bacillus cereus Capylobacter otros
31%
23%8%
16%
3%
3%
2% 14%
Salmonella spp Listeria monocytogenes Virus Hepatitis A Norovirus GI y GIIE.coli 0157 (STEC) Bacillus cereus Capylobacter otros
Identification of other microbiological hazardsData extracted from Food alert for fruits and vegetables
www.ainia.es 23
Analytical methods
www.ainia.es 24
Microbiological criteria in Regulation 2073/2005 :
84 | 18TH OECD MEETING OF THE HEADS OF NATIONAL INSPECTION SERVICES

www.ainia.es 25
ISO Standards revised by UE Mandate M 381:Standard Publication
date
ISO 18465:2017 Microbiology of the food chain -- Quantitative determination of emetic toxin (cereulide) using LC-MS/MS 2017-1
ISO 6579-1:2017 Microbiology of the food chain -- Horizontal method for the detection, enumeration and serotyping of Salmonella --Part 1: Detection of Salmonella spp. 2017-2
ISO 16654:2001/Amd 1:2017 Annex B: Result of interlaboratory studies. Microbiology of food and animal feeding stuffs -- Horizontal method for the detection of Escherichia coli O157 2017-3
ISO 10273:2017 Microbiology of the food chain -- Horizontal method for the detection of pathogenic Yersinia enterocolitica 2017-3
ISO 15216-1:2017 Microbiology of the food chain -- Horizontal method for determination of hepatitis A virus and norovirus using real-time RT-PCR -- Part 1: Method for quantification 2017-3
ISO 22964:2017 Microbiology of the food chain -- Horizontal method for the detection of Cronobacter spp. 2017-4
ISO 11290-1:2017 Microbiology of the food chain -- Horizontal method for the detection and enumeration of Listeria monocytogenes and of Listeria spp. -- Part 1: Detection method 2017-5
ISO 11290-2:2017 Microbiology of the food chain -- Horizontal method for the detection and enumeration of Listeria monocytogenes and of Listeria spp. -- Part 2: Enumeration method 2017-5
ISO 10272-1:2017 Microbiology of the food chain -- Horizontal method for detection and enumeration of Campylobacter spp. -- Part 1: Detection method 2017-6
ISO 10272-2:2017 Microbiology of the food chain -- Horizontal method for detection and enumeration of Campylobacter spp. -- Part 2: Colony-count technique 2017-6
ISO 19343:2017 Microbiology of the food chain -- Detection and quantification of histamine in fish and fishery products -- HPLC method 2017-6
ISO 21528-1:2017 Microbiology of the food chain -- Horizontal method for the detection and enumeration of Enterobacteriaceae --Part 1: Detection of Enterobacteriaceae 2017-6
ISO 21528-1:2017 Microbiology of the food chain -- Horizontal method for the detection and enumeration of Enterobacteriaceae --Part 2: Colony-count technique 2017-6
ISO 19020:2017 Microbiology of the food chain -- Horizontal method for the immunoenzymatic detection of staphylococcal enterotoxins in foodstuffs 2017-6
ISO 21872-1:2017 Microbiology of the food chain -- Horizontal method for the determination of Vibrio spp. -- Part 1: Detection of potentially enteropathogenic Vibrio parahaemolyticus, Vibrio cholerae and Vibrio vulnificus 2017-6
www.ainia.es 26
Main changes in the ISO standards
Scope and type of standard: Full standards (instead of TS),horizontal application (for human consumption, feeding of animals,enviromental samples and in same cases primary production..)
Procedures: Shorten incubation times, more flexible temperature forincubation (harmonization with US methods), refrigeration betweenstages…
Validation of standard by ILS
Culture media performance
www.ainia.es 27
Validation of standard by ILSThe new standards include an anex with the results of the validation of the
method with the data LOD50, sensibility, specificity, reproducibility,
repetibility in several food and environmental samples.
www.ainia.es 28
Normas EN-UNE revisadas por mandato de la UE:
• Performance data for culture media: productivity, specificity,…
www.ainia.es 29
Alternative methods
www.ainia.es 30
• Regulation EU 2073/2005
• If the food business operator wishes to useanalytical methods other than those validatedand certified as described before, themethods shall be validated according tointernationally accepted protocols andtheir use authorised by the competentauthority.
SECTION VI. NEW TECHNOLOGIES FOR FRUIT AND VEGETABLES PRODUCTION AND INSPECTION | 85

www.ainia.es 31
• Certification AFNOR http://www.afnor-validation.org/
• Certificacion AOAChttp://www.aoac.org/
• Certification MicroValhttp://www.microval.org/
• Certification NMKLhttp://www.nmkl.org/index.php/en/
www.ainia.es 32
> analysis techniques: quantitative methods. Chromogenic Selective media.
Rapid 'L.mono AgarDifferential method in 24h +confirmation) Rapid E.coli2 Agar ( E.coli Beta-
Glucoronidase + and coliforms)
www.ainia.es 33
> analysis techniques: quantitative methods
Count by MPN (most probable number)
Each dilution isplanted in 3 or 5 tubes, the count isobtained by thenumber of + tubes.
Conversion Tables.
Limits:
< 3MPN/g
< 5MPN/g
www.ainia.es 34
> analysis techniques: quantitative methods
MPN automated
-It is based on MPN, but with automatedreading by fluorescence.
Reading Station
www.ainia.es 35
> analysis techniques: quantitative methods
Flow Cytometry -Detects and quantifies the cells in a sample.
-Measured optical properties: light emitted by fluorochromes and light scattered by particles of the flow.
-Differenciates cells by size and complexity also viability.
-High sensitivity.
www.ainia.es 36
> analysis techniques: quantitative methods
Other methods
-PETRI-FILM (3M), It isbased on dehydrated rehydrate sheets by inoculating the sample.
-(Biocontrol SimPlateSystem), Plate with 84 wells, number of positive will be converted tovalues of MPN. Reading by fluorescence.
Direct measurement
Indirect measurement
-Impedance It is based on thedetection of environmental electricalchanges due to microbialmetabolism. Modify the electricalconductivity of the substrate and vary the impedance.
86 | 18TH OECD MEETING OF THE HEADS OF NATIONAL INSPECTION SERVICES

www.ainia.es 37
> analysis techniques: quantitative methods
Bioluminescence -Systems based on the determination of ATP, related to the bioluminescence, and with the amount of organic remains.
www.ainia.es 38
Analysis TechniquesQualitative Methods
www.ainia.es 39
25g sample
PEPTONE WATER(225ml)
Homogenize2 min
YES Not RESULT:
Absence of Salmonella I
n 25g
CONFIRMATION
INCUBATION:37±1ºC; 24±6H
PRE-enrichment
1ml 0.1Ml
10 mlMKTTn broth
10 mlRAPPAPORT-VASSILIADIS-soy broth
INCUBATION:37±1ºC; 24±3H INCUBATION:41±0.5ºC; 24±3H
XLD ASAP
INCUBATION:37±1ºC; 24±3H
TYPICAL COLONIES?
XLD ASAP• Magenta color• Black center
• Lightly transparent red zone
XLD ASAP
Miniaturized system identification (API 20E) + lactose (kligler OR TSI). Serologic tests
Investigation of Salmonella (ISO 6759)
> Analysis Techniques: Qualitative method
www.ainia.es 40
> Analysis Techniques: Qualitative Methods
Immunoassays (ELISA)-It is based on the antigen-antibody reaction. It is generally used a second antibody.
-After detection phase of enrichment.
-Need confirmation phase (presence)
-High specificity.
-System 3M-TECRA (1-2 days)
-System TRANSIA-Plate (Biocontrol) (1-2 days, 93 wells)
-Lives (BIOMÉRIEUX): ELF(Elisa+fluorescence) and inmunoconcentracion (30 samples, 16-24h).
www.ainia.es 41
> Analysis Techniques: Qualitative Methods
Recognition by phage -It is based on the specific recognition by phage.
-After detection phase of enrichment.
-Need confirmation phase (Presence)
-High specificity andsensitivity.
-Lives UP (BIOMÉRIEUX): Phage recombinant protein derived from the fibers of the tail of the bacteriophage linked to fluorescence. (30 samples, 18-24h).
-Immunochromatography (lateral flow): Displays spread by capillary action toward the area of recognition. Bands of color.
www.ainia.es 42
> Analysis Techniques: Qualitative Methods
Genetic testing (PCR real time)-It is based on the specific detection of DNA.After detection phase of enrichment.
-Need confirmation phase (presence). It does not difference DNA from non-viable cells.
-High specificity and sensitivity.
SECTION VI. NEW TECHNOLOGIES FOR FRUIT AND VEGETABLES PRODUCTION AND INSPECTION | 87

www.ainia.es 43
> Analysis Techniques: Qualitative Methods
Genetic testing (PCR real time)-Different business solutions: main differences are probes used and type of thermal cycler.
- System BAX (ThermoFisher)-> Sybr Green (probe)
- Applied Biosystem ->Taqman And Microseq (Probes)
- IQ-CHECK (Biorad) -> Molecular Beacons (Probes)
- Gene-up (Biomerieux)-> Probes FRET
-Digital PCR. Nanofluidico chip. Absolute Quantification
- QuantStudio ThermoFisher (3D)
- AutoDG System and QX200 System (Bio-rad)
www.ainia.es 44
> Analysis Techniques: Qualitative Methods
Genetic testing (RT-PCR)
Norovirus Hepatitis A
-It is based on the specific detection of RNA.
-Step: Copy of RNA to cDNA.
-It is used for the detection of virus.
-It will not be possible to establish viability(infective load)
-High specificity and sensitivity.
www.ainia.es 45
Thank you for your atention
Amparo de Benito [email protected]
88 | 18TH OECD MEETING OF THE HEADS OF NATIONAL INSPECTION SERVICES

SECTION VII. CHALLENGES FOR INSPECTION SERVICES │ 89
SECTION VII CHALLENGES FOR INSPECTION SERVICES
In this section, speakers from participating countries, observer counties or observer organisations share their experience on some key issues for the fruit and vegetables inspection services. The OECD Secretariat presented two key challenges on behalf of experts who could not attend.
Presentations in the Section:
• Traceability
• Conformity checks for internet sales of fruit and vegetables
90 │ 18TH OECD MEETING OF THE HEADS OF NATIONAL INSPECTION SERVICES
Traceability
by the OECD Secretariat, on behalf of the dedicated sub-working group
Abstract
The Secretariat presented on behalf of the Sub-working Group a report on the status of the traceability work. The Secretariat reminded delegates that during the 76th Plenary Meeting of the OECD Fruit and Vegetables the sub-working group presented document TAD/CA/FVS(20217)6 which was a TRACEABILITY CHECK LIST. The main idea of the list is to help inspectors and traders to focus on the traceability issues at every production and marketing stage. The list points out what should be verified at every inspection stage so as to check if the information about the country of origin is available and reliable and if the lot is traceable. The Plenary Meeting agreed that it would be useful to elaborate on the check-list to get also guidelines.
The sub-working group on traceability plans to transform the list into guidelines keeping in mind suggestions by delegates. This is the list of suggestions:
● There should be more descriptions and explanations especially regards the origin of the product.
● More description on how to check the origin of the produce.
● What should be done if an inspector finds out the lack of the origin (no country of origin/ not reliable information about it).
● How the laboratory analysis can be use in case of the verification of the country of origin – put more explanations about the isotopic methods.
● Using codes GNN, GLN (GS1 codes) – more explanations about the legality of the codes. (If traders can use the code instead of full name and address of the producer or maybe codes can be given only additionally. This should be clarified in the guideline and accepted by all members of the OECD Scheme).
The idea is not to replace the check-list. It may be rearranged and use as the annex to the guideline.

SECTION VII. CHALLENGES FOR INSPECTION SERVICES │ 91
Traceability
Presentation by OECD Secretariat, on behalf of the dedicated sub-working group

OECD FRUIT AND VEGETABLES SCHEME
OECD Trade and Agriculture DirectorateCodes and Schemes 2018
ITEM 14 – TRACEABILITYUPDATE BY THE SUB-WORKING GROUP FOR DISCUSSION AND RECOMMENDATION
TRACEABILITY
Background - for information onlyThe OECD Fruit and Vegetables Scheme organised the 16th OECD Meeting of the Heads of National Inspection Services1 in Warsaw, Poland on 20-23 May 2014, at the invitation of the Chief Inspector of Agriculture and Food Quality in Poland.
During the Meeting, delegates discussed traceability issues. Member countries shared their practice and gave an overview on the implementation of different traceability systems. In general, traceability has two levels; an electronic system and visual control. Traceability in the internal market is relatively easy. However at the export stage, when products are repackaged, resorted or re-graded, it is difficult to maintain traceability. In this case, it is the responsibility of the trader/packer to maintain the correct traceability documentation from the exporting country and therefore maintain traceability. At the import stage the importer should request the correct documentation from the exporter in order to ensure traceability. Nevertheless, enormous challenges arise from traceability.
Therefore, the Heads of National Inspection Services suggested that the topic is discussed at OECD level. 2
TRACEABILITY
Background - for information onlyThe 73rd Plenary Meeting of the OECD Fruit and Vegetables Scheme agreed to set up a Sub-Working Group to discuss traceability (December 2014). The Secretariat is the Convenor. Hungary, Poland, France, Kenya work on traceability.
At the 76th Plenary Meeting of the OECD Fruit and Vegetables (December 2017) Poland introduced the Progress report on Traceability [TAD/CA/FVS(2017)6]. The Plenary Meeting clarified that the status of the document is currently a check-list but that it would be useful to elaborate on it to get also guidelines. The Plenary Meeting agreed more time is needed to elaborate on the document. The Sub-Working Group on Traceability will continue developing the document and will submit a revised version to the Working Group Meeting to be held back-to-back to the harmonisation meeting hosted by the Netherlands in June 2018 with the view to submit a proposal for approval at the 2018 Plenary Meeting. 3
TRACEABILITY
Background - for information onlyDuring the 76th Plenary Meeting of the OECD Fruit and Vegetables in 2017 the sub-working group presented document TAD/CA/FVS(20217)6 which is TRACEABILITY CHECK LIST. The main idea of the list is to help inspectors and traders to be focus on the traceability issues at every production and marketing stage.
The list signals (points out) what should be verified at every inspection stage so as to check if the information about the country of origin is available and reliable and if the lot is traceable.
Discussion resultsThe Plenary Meeting agreed that it would be useful to elaborate on the check-list to get also guidelines.The sub-working group plans to transform the list into the guideline keeping in mind the delegates suggestions.
4
TRACEABILITY
Delegates suggestions:There should be more descriptions and explanations especially as regards main aspect which is the origin of the product.
More description how to check origin of the produce.
What should be done if inspector finds out the lack of the origin (no country of origin/ not reliable information about it).
How the laboratory analysis can be use in case of the verification of the country of origin – put more explanations about the isotopic methods.
Using codes GNN, GLN (GS1 codes) – more explanations about the legality of the codes. (If trader can use the code instead of full name and address of the producer or maybe codes can be given only additionally. This should be explain in the guideline and accepted by all members of the OECD Scheme).
The idea is also don’t remove the check-list. It may be rearranged and use as the annex to the guideline.
5
92 | 18TH OECD MEETING OF THE HEADS OF NATIONAL INSPECTION SERVICES

SECTION VII. CHALLENGES FOR INSPECTION SERVICES │ 93
Conformity checks for internet sales of fruit and vegetables
by the OECD Secretariat, on behalf of the dedicated sub-working group
Abstract
At the 17th OECD Meeting of Heads of National Inspection Services that took place in Rome in 2016, inspectors from EU member countries stressed that a growing number of internet sales of fruit and vegetables do not comply with this regulation. This lack of compliance poses several problems, including unfair competition, and risk for consumers and plants, as traceability and quality controls are not guaranteed. Authorities are confronted by new challenges in applying traditional controls to on-line sales. For example, online platforms do not provide physical addresses of their warehouses
In 2017 the OECD Fruit and Vegetables Scheme set a sub-working group to explore the feasibility of developing guidelines or standards that could help address the challenges posed by internet sales of fruit and vegetables.
Consequently, the Secretariat circulated a questionnaire amongst participating countries in 2017 trying to identify existing regulations and major challenges faced by the inspections services of participating countries. The major challenges reported by participating countries were:
i. the physical detection of the consignment/traceability
ii. biosecurity/phytosanitary non-compliance
iii. non declaration of consignment at port of entry
iv. knowing the companies being active in internet sales of fruit and vegetables
v. knowing where the deliveries are generated and the goods are picked and packed
vi. knowing where the contract is concluded (article 5 of 543/2011)
vii. knowing whether produce delivered directly to the final consumer by subscribing a box scheme is covered by the term “online sale”
viii. enforcing that the online offer is exactly providing the information (produce, country of origin, and where applicable quality class and variety/commercial type
ix. enforcing that produce is labelled correctly and that invoices and accompanying documents indicate this information
x. being aware that online traders are fighting for very weak regulations in saying that it is too complicate to update databases for online sales in a timely and precise manner, amongst others.

94 │ 18TH OECD MEETING OF THE HEADS OF NATIONAL INSPECTION SERVICES
Conformity checks for internet sales of fruit and vegetables
Presentation by the OECD Secretariat, on behalf of the dedicated sub-working group

INTERNET SALES
18th OECD Meeting of Heads of National Inspection ServicesSeville, Spain
2
Internet Sales
Background
• Internet sales discussed at the 17th HNIS in Rome Italy (October 2016)
• Secretariat circulated a Questionnaire amongst Member countries in 2017
(Answers were provided by: Finland, Germany, Israel, Italy, Kenya, New Zealand, Poland, and Switzerland)
• The 2017 Plenary Meeting agreed to set-up a Sub-Working Group (SWG). Members of the SWG are: Belgium, France, Germany, Kenya, the Netherlands and Spain.
3
Challenges
• The physical detection of the consignment / traceability.• Biosecurity/Phytosanitary non compliance • Non declaration of consignment at port of entry• Knowing the companies being active in internet sales of
fruit and vegetables;• Knowing where the deliveries are generated and the
goods are picked and packed;• Knowing where the contract is concluded (article 5 of
543/2011);• Knowing whether produce delivered directly to the final
consumer by subscribing a box scheme is covered by the term “online sale”.
4
Challenges
• Ordering via internet – the authority must provide financial means for purchases and provide a delivery address which is not the official address;
• Enforcing that the online offer is exactly providing the information (produce, country of origin, and where applicable quality class and variety/commercial type;
• Enforcing that produce is labelled correctly and that invoices and accompanying documents indicate this information;
• Being aware that online traders are fighting for very weak regulations in saying that it is too complicate to update databases for online sales in a timely and precise manner
5
New Trends in Food Consumption
According to Food Business News these are the news trends fueling fruit and vegetables sales
• On-line grocery shopping
• Meal kit delivery
• Community supported agriculture programs
• Special diets and superfood claims
• Exotic flavor profiles
According to a report by Rabobank (2015), “Wanted: ‘E-daptable’ Fresh Produce Suppliers”
While total retail sales are stagnant, online grocery sales in western Europe are expected to double in the coming five years. Looking further ahead, Rabobank expects that, in 2030, the share of online grocery shopping in total grocery shopping will be as high as 25 percent.
According to the Nielsen Perishables Group (2015), over 1 billion consumers are willing to buy groceries online 6
SECTION VII. CHALLENGES FOR INSPECTION SERVICES | 95
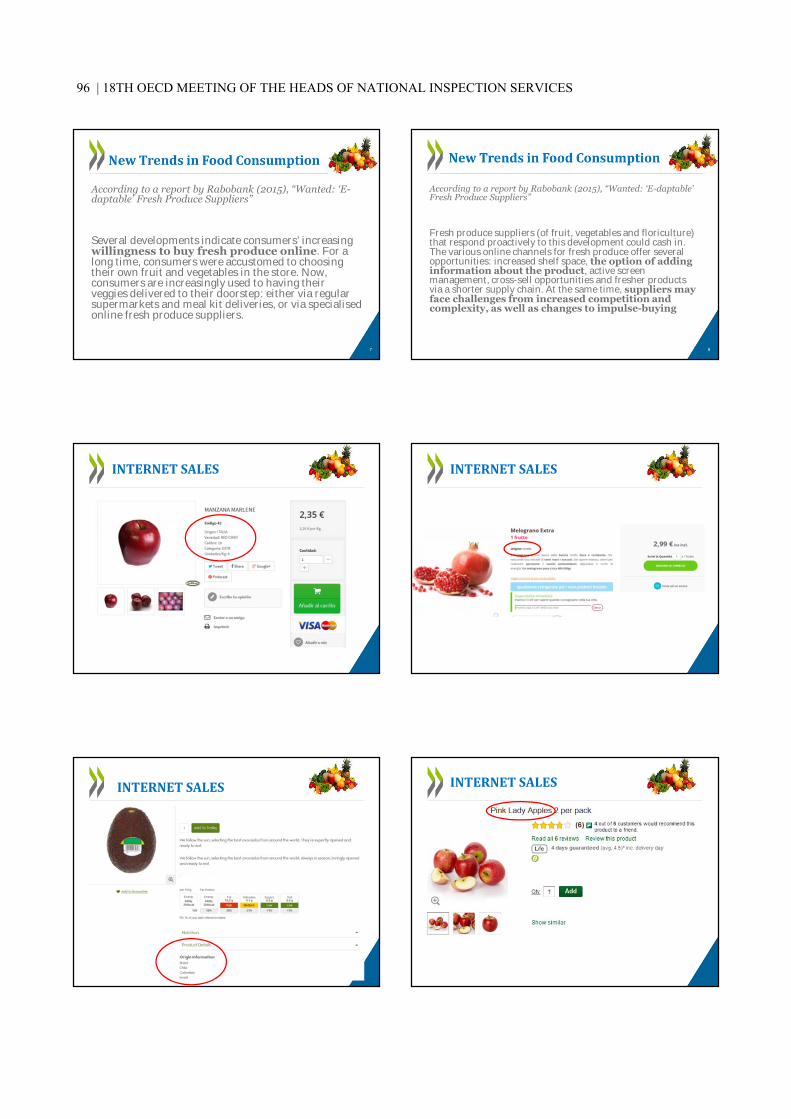
According to a report by Rabobank (2015), “Wanted: ‘E-daptable’ Fresh Produce Suppliers”
Several developments indicate consumers’ increasing willingness to buy fresh produce online. For a long time, consumers were accustomed to choosing their own fruit and vegetables in the store. Now, consumers are increasingly used to having their veggies delivered to their doorstep: either via regular supermarkets and meal kit deliveries, or via specialisedonline fresh produce suppliers.
7
According to a report by Rabobank (2015), “Wanted: ‘E-daptable’ Fresh Produce Suppliers”
Fresh produce suppliers (of fruit, vegetables and floriculture) that respond proactively to this development could cash in. The various online channels for fresh produce offer several opportunities: increased shelf space, the option of adding information about the product, active screen management, cross-sell opportunities and fresher products via a shorter supply chain. At the same time, suppliers may face challenges from increased competition and complexity, as well as changes to impulse-buying
8
INTERNET SALES INTERNET SALES
INTERNET SALES INTERNET SALES
96 | 18TH OECD MEETING OF THE HEADS OF NATIONAL INSPECTION SERVICES
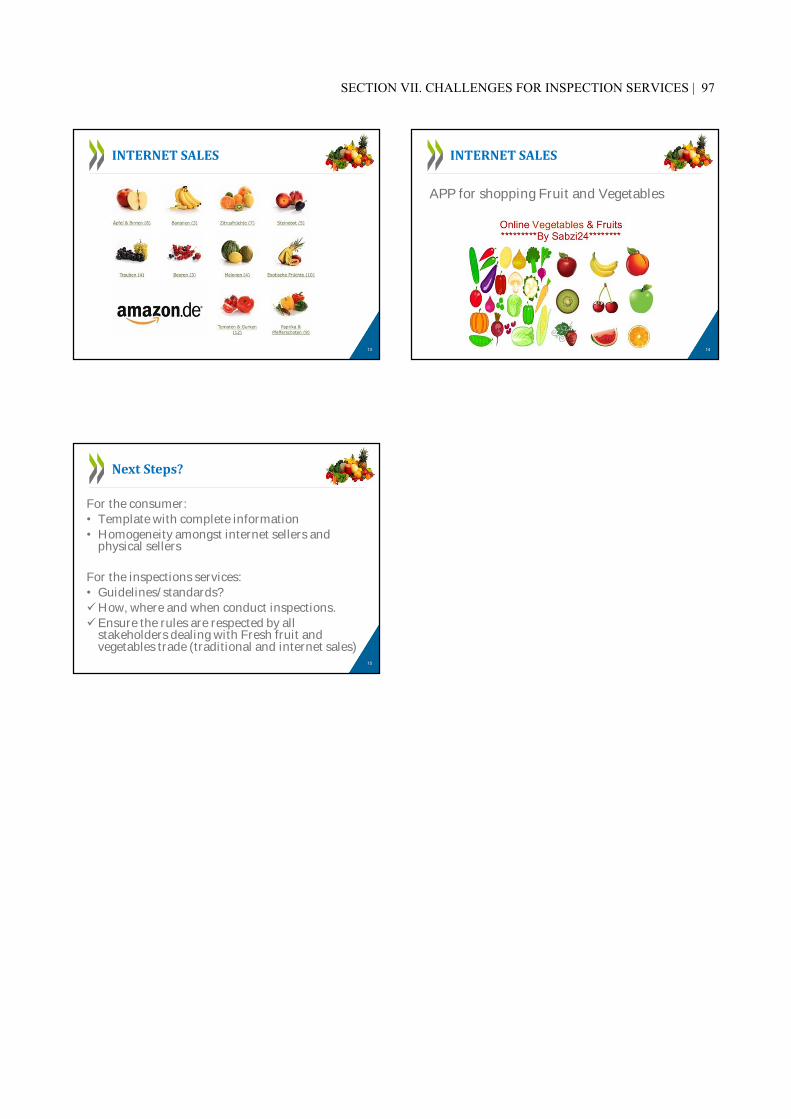
13
INTERNET SALES
APP for shopping Fruit and Vegetables
14
INTERNET SALES
For the consumer:• Template with complete information• Homogeneity amongst internet sellers and
physical sellers
For the inspections services:• Guidelines/standards?
How, where and when conduct inspections.Ensure the rules are respected by allstakeholders dealing with Fresh fruit and vegetables trade (traditional and internet sales)
15
Next Steps?
SECTION VII. CHALLENGES FOR INSPECTION SERVICES | 97

98 │ 18TH OECD MEETING OF THE HEADS OF NATIONAL INSPECTION SERVICES
SECTION VIII PHYTOSANITARY AND HEALTH RISKS
This section is intended to provide an overview on possible new challenges that could be addressed by the Scheme, for consideration of the Heads of National Inspection Services. Spain invited an expert from FRUTARIA, who shared the Group’s experience in fight against pests.
Presentations in the Section:
• Strategies against fungi in the fruit and vegetable production
SECTION VIII. PHYTOSANITARY AND HEALTH RISKS │ 99
Strategies against fungi in the fruit and vegetable production
by Mr Fernando J. Gonzalez, Frutaria SAT, Spain
Abstract
Mr Fernando González gave a brief overview of FRUTARIA and noted some challenges faced by the group regarding pests. The Frutaria group is a fruit and vegetable organisation that manages plantations in three areas of the Iberian peninsula:
‒ North (provinces of Zaragoza and Navarra)
‒ West (province of Badajoz)
‒ South (provinces of Sevilla and Huelva)
The group has on average 100 million kg of stone fruit, citrus fruit, grapes and pip fruit marketed annually.
Mr Gonzalez then shared with delegates one of the main challenges dealing with fresh fruit and vegetables, botrytis. Botrytis, a fungus called grey mold, is always ready to eat our fruits and is a real headache for the berries producers in Huelva. Grey mold is the cause of significant losses, not only in field but, what is worse, in supermarkets and customers’ households too. The usual wet conditions in Huelva winters help Botrytis infections and make its control a challenge for this industry.
A different issue is the stone fruit growing in the Guadalquivir Valley, this product if harvested in late spring where climate conditions are usually drier. Stone fruits mainly grow in the low valley because farmers seek the warm climate that allows to pick early varieties in late April and May. At that time those fruits, especially peaches, nectarines and late Saturn peaches find good markets. Although early varieties of peaches and nectarines are less liable to chilling injury, these fruits rarely are sold out of Europe. Only fruits picked in early June are sometimes sent overseas. As you know, chilling injury is the name for internal damages that stone fruits show caused by low conservation temperatures that usually are near 0ºC. Those damages are more likely if fruits are kept at low temperatures for more time so they are more likely in overseas transport.
Andalucía exported 433 000 tonnes (t) of peaches to EU-27 and only 20 000 t to countries outside the European Union in 2017. 1 460 000 t of nectarines to EU-27 and only 143 000 t to other countries in 2017. Only 69 000 t of plums to EU-27 and 30 000 t outside.
Another problem is Monilia, that affects some fruits from time to time. Lately a fungicide called Scholar, which active substance is Fludioxonil, has been allowed to be sprayed on these fruits after harvest and it has turned out to be an effective controller of that fungus. Curiously there is no postharvest fungicide authorised for berries. You only can spray fungicides on strawberries before picking them. Although you can spray a few days after picking, fungicides would have better effects if they could be applied at packinghouses.
Mr Gonzalez also explained that nowadays large chain stores are really concerned about pesticide residues. They are in a dominant position over farmers and have required by contract to respect a maximum number of pesticides found in fruit and vegetables and, what is worse from his point of view, a level below a 50% of established MRLs for each pesticide found. That policy compels farmers to repeat several times the same fungicide treatment

100 │ 18TH OECD MEETING OF THE HEADS OF NATIONAL INSPECTION SERVICES
and to make treatments with less dosage than what is recommended to control the fungus. In his opinion this policy will lead to develop resistant strains of fungi or pests. The effect will be the same that would happen if people always took the same antibiotic at half dosage, and this will certainly lead to bigger problems than the ones this policy is trying to prevent.
Mr Gonzalez also gave a brief overview of the challenges faced by citrus producers. Citrus are produced mainly in Huelva, Sevilla and Cordoba. 4 117 000 t of citrus fruits are exported from Andalucía: 82 % to EU-27 countries.
The main products of this group are oranges and mandarins, representing 39% and 33% respectively of total citrus exports in 2017. Lemons, that are grown mainly in Almería and Málaga were 17% percent of Andalusian citrus industry exports. This said, fungi is a serious problem because most of citrus are picked in autumn and winter in an area with a wet climate at that time.
Fortunately, postharvest fungicides are allowed in citrus industry and they can be applied in different ways and times. All fungicides used for citrus act on the skin surface of fruits. That is why you need to treat them before 24 hours after picking. Fungi need a route of entry to infect citrus fruits. Those gateways are the micro bounds that the picking processes make on the skin of fruits. When spores or hyphae find a micro bound they start to grow and come into the skin. Growth rates depend of several factors, being temperature the most important. When fungi are well implanted into the fruit you cannot do anything to kill them. The most important fungi related with postharvest citrus fruits in Andalucía are Penicillium digitatum and Penicillium Italicum. The last one is even worse than the other because it needs no bound to break into the fruit and, in addition, it can grow at near 0ºC temperatures.

SECTION VIII. PHYTOSANITARY AND HEALTH RISKS │ 101
Strategies against fungi in the fruit and vegetable production
Presentation by Mr Fernando J. Gonzalez, Frutaria SAT, Spain

CENTRAL FRUTARIA Avda. César Augusto, 3, 7º 50.004 Zaragoza // Tfno: 976-469459 • Fax: 976-442312 // [email protected] // www.frutaria.com
UNIDAD DE MADURACIÓN DE FRUTA
CENTRAL FRUTARIA Avda. César Augusto, 3, 7º 50.004 Zaragoza // Tfno: 976-469459 • Fax: 976-442312 // [email protected] // www.frutaria.com
Unidad para la Maduración de Fruta UMF
• La función de esta unidad es obtener fruta que esté lista para comer partiendo de fruta que esté en el estado de madurez de recolección.
2
• Las propiedades organolépticas de la fruta: sabor, aroma, color de la piel, color de la pulpa y azúcar son óptimas en un estado de madurez que no permite su conservación a largo plazo, ni laselección y el envasado mecánicos.
• Los frutos climatéricos aceleran su maduración cuando se someten a la acción del etileno.
• La UMF consiste en un recinto aislado en el que la fruta se sometea una determinada concentración e etileno en unas condicionesambientales que favorecen el efecto de este gas, haciendo que laevolución hacia un estado de madurez más avanzado sea lo másrápido posible. Tanto la concentración deseable de etileno en el airecomo los parámetros de temperatura y humedad se estableceránen el correspondiente documento técnico.
CENTRAL FRUTARIA Avda. César Augusto, 3, 7º 50.004 Zaragoza // Tfno: 976-469459 • Fax: 976-442312 // [email protected] // www.frutaria.com
Especies susceptibles de ser maduradas en la UMF
3
Peras Melocotones Nectarinas Paraguayos
Ciruelas Plumcots Sweet Iridis
CENTRAL FRUTARIA Avda. César Augusto, 3, 7º 50.004 Zaragoza // Tfno: 976-469459 • Fax: 976-442312 // [email protected] // www.frutaria.com4
En el mercado existen proveedores capaces de suministrar recintos en los que los parámetros relacionados con la maduración se regulan. El más frecuente es el recinto para madurar plátanos
(Ripening room)
CENTRAL FRUTARIA Avda. César Augusto, 3, 7º 50.004 Zaragoza // Tfno: 976-469459 • Fax: 976-442312 // [email protected] // www.frutaria.com5
Para iniciar el camino en la maduración de fruta vamos a construir un recinto apropiado sirviéndonos de un contenedor frigorífico
Estos dispositivos son capaces de mantener unas condiciones constantes de temperatura y humedad ambiental, y si se pone su dispositivo de ventilación al 0% son totalmente estancos. Quedando garantizado que no haya perdidas de etileno
CENTRAL FRUTARIA Avda. César Augusto, 3, 7º 50.004 Zaragoza // Tfno: 976-469459 • Fax: 976-442312 // [email protected] // www.frutaria.com6
Puesta en servicio de la UMF
El suministro de energía se hace a través de una toma de fuerza tres fases + neutro como la de la parte superior de la imagen
Entrada de gas al contenedor Detalle de la entrada de gas y de la tubería para realizar la medición de la concentración de etileno en el interior del contenedor
Equipo para medir la concentración de etilenoBomba de aspiración GASTEC GV-100Ampollas GASTEC 172L (50-100 ppm)
102 | 18TH OECD MEETING OF THE HEADS OF NATIONAL INSPECTION SERVICES

CENTRAL FRUTARIA Avda. César Augusto, 3, 7º 50.004 Zaragoza // Tfno: 976-469459 • Fax: 976-442312 // [email protected] // www.frutaria.com
Botrytis in Strawberries
7 CENTRAL FRUTARIA Avda. César Augusto, 3, 7º 50.004 Zaragoza // Tfno: 976-469459 • Fax: 976-442312 // [email protected] // www.frutaria.com
Botrytis in Pears and Raspberries
8
CENTRAL FRUTARIA Avda. César Augusto, 3, 7º 50.004 Zaragoza // Tfno: 976-469459 • Fax: 976-442312 // [email protected] // www.frutaria.com
Penicillium in citrus fruit
9 CENTRAL FRUTARIA Avda. César Augusto, 3, 7º 50.004 Zaragoza // Tfno: 976-469459 • Fax: 976-442312 // [email protected] // www.frutaria.com
Monilinia in Peaches and Nectarines
10
CENTRAL FRUTARIA Avda. César Augusto, 3, 7º 50.004 Zaragoza // Tfno: 976-469459 • Fax: 976-442312 // [email protected] // www.frutaria.com
Fruit respiration
11 CENTRAL FRUTARIA Avda. César Augusto, 3, 7º 50.004 Zaragoza // Tfno: 976-469459 • Fax: 976-442312 // [email protected] // www.frutaria.com12
Ripening room
SECTION VIII. PHYTOSANITARY AND HEALTH RISKS | 103

104 │ 18TH OECD MEETING OF THE HEADS OF NATIONAL INSPECTION SERVICES
FINAL DISCUSSION AND CONCLUSION
The discussions have been very fruitful and have raised a series of challenges that Inspection Services of participating countries are facing. In particular, delegates agreed that internet sales of fruit and vegetables are growing and the lack of clear policies and regulations on how to address them is having a detrimental effect on the market and on the consumer. The OECD Scheme should increase its efforts to address this challenge and provide inspectors and consumers with adequate tools to deal in a fair and transparent way with sales of fruit and vegetables on-line.
Delegates also greed on the need to clarify and attain a common understanding on how to deal with traceability.
Dr Brambila (OECD Secretariat) took the floor and thanked Spain on behalf of all delegates for their hospitality and the excellent organisation of the meeting. Ms Maria de Armas (Spain) thanked all delegates for their participation at the meeting. She noted that the success of the meeting was in large part due to the quality of the various presentations and the interventions and discussions led by highly experienced and skilled delegates.
Proposal of the Heads of National Inspection Services to the 2018 Plenary Meeting: ● The role of the OECD in internet sales of fruit and vegetables should be:
o For the consumer: Template with complete information Homogeneity amongst internet sellers and physical sellers
o For the inspections services: Guidelines/standards? How, where and when to conduct inspections. Ensure the rules are respected by all stakeholders dealing with
Fresh fruit and vegetables trade (traditional and internet sales)
● The role of the OECD on traceability: OECD already has a Sub-working Group on tolerances. Discussions should continue in order to enable participating countries to reach an agreement that facilitates common understanding on the application and use of traceability. Draft guidelines and a checklist will be presented at the next Plenary Meeting for discussion and possible approval.

ANNEX I. SOME PHOTOS OF THE EVENT │ 105
ANNEX I SOME PHOTOS OF THE EVENT
Figure 1. Delegates standing next to the President Chamber of Commerce of Seville, at the Chamber of Commerce premises (with courtesy of the Chamber of Commerce of Seville)

106 │ 18TH OECD MEETING OF THE HEADS OF NATIONAL INSPECTION SERVICES
Figure 2. Introduction to the “Pedro Espiga” field by the representatives of Primor Fruit
Figure 3. View of Pedro Espiga field, with the irrigation system
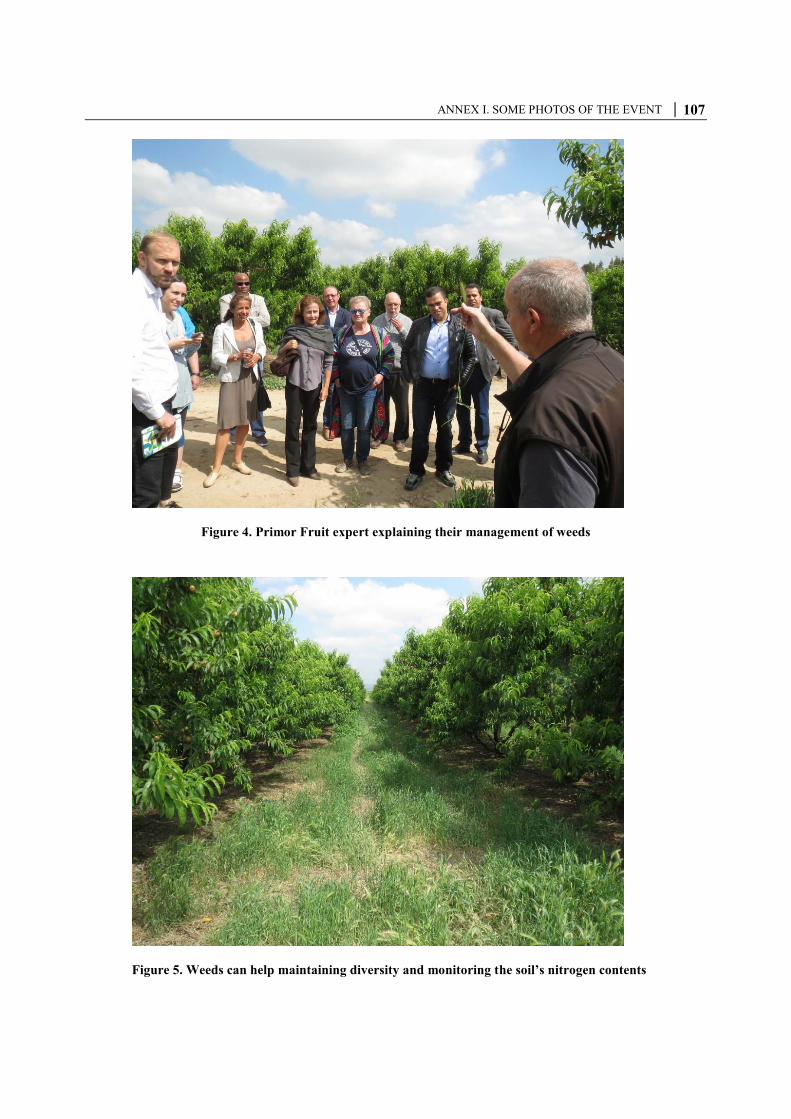
ANNEX I. SOME PHOTOS OF THE EVENT │ 107
Figure 4. Primor Fruit expert explaining their management of weeds
Figure 5. Weeds can help maintaining diversity and monitoring the soil’s nitrogen contents

108 │ 18TH OECD MEETING OF THE HEADS OF NATIONAL INSPECTION SERVICES
Figure 6. Discussion on fruit quality
Figure 7. Primor Fruit expert sizing the furuit
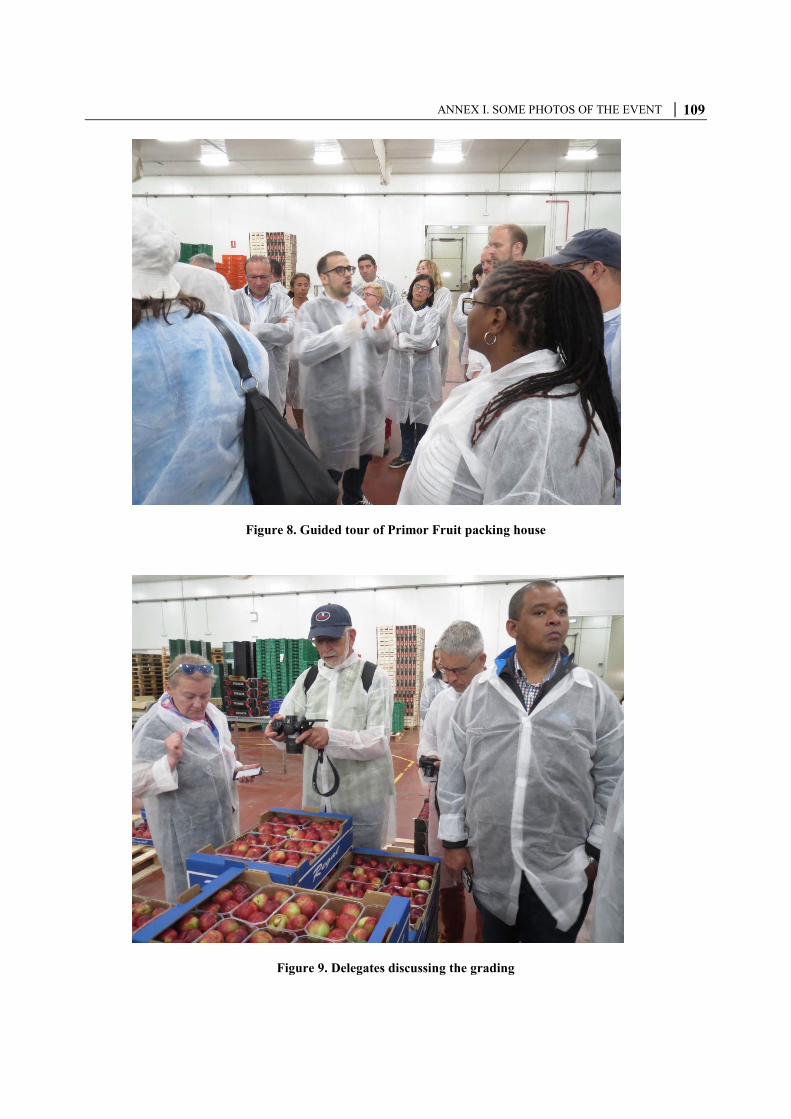
ANNEX I. SOME PHOTOS OF THE EVENT │ 109
Figure 8. Guided tour of Primor Fruit packing house
Figure 9. Delegates discussing the grading

110 │ 18TH OECD MEETING OF THE HEADS OF NATIONAL INSPECTION SERVICES
ANNEX II. DRAFT AGENDA │ 111
ANNEX II. DRAFT AGENDA 18TH MEETING OF THE HEADS OF NATIONAL INSPECTION
SERVICES
9-11 May 2018 Chamber of Commerce of Seville, Seville, Spain
WEDNESDAY 9 MAY 2018, 9:30-12:30
9:30
1. Working Group Meeting on Berry Fruit, Root Vegetables and Passion Fruit
Rapporteurs: Slovakia and Kenya.
For discussion and recommendation
12:30
Lunch Break
13:00
2. Registration and welcome coffee
13:30
3. Opening of the meeting Welcome by Dirección General de Política Comercial y Competitividad
13:40
4. OECD Secretariat Opening statement by the Secretariat. 13:50
5. Presentations by international organisations (EC, UNECE, CODEX)
14:20
6. Presentation on Spain’s Fresh Fruit and Vegetables Sector By Subdirección General de Frutas y hortalizas y Vitivinicultura Ministerio de Agricultura y Pesca, Alimentación y Medio Ambiente.

112 │ 18TH OECD MEETING OF THE HEADS OF NATIONAL INSPECTION SERVICES
15:00
7. Presentation on Spain’s Fresh Fruit and Vegetables Control System By Subdirección General de Inspección, Certificación y Asistencia Técnica de Comercio Exterior.
15:30
Coffee Break
15:45
8. Presentation by main supermarket chains in Spain.
16:20
9. AINIA. New trends and technology for the microbiological control of fruit and vegetables.
AINIA is a technology centre established in 1987 as a non-profit organisation. With more than 25 years of experience in research, development and innovation, AINIA works to motivate the competitiveness of companies through innovation.
17:00
End of Session THURSDAY 10 MAY 2018, 9:30 - 17:30
9:30
10. Technical Visit and lunch Asociafruit
Peaches and Nectarines. Variety UFO- Paraguayo.
21:00
21:00 Welcome Dinner Hosted by Spain1 FRIDAY 11 MAY 2018, 9:00-13:30
9:00
11. Organic fruit and vegetables sales. Quality before price? Markets, trends and challenges
Presentation by Spain
For discussion and recommendation
1 The dinner will take place at 21:00 at Fundación CajaSol, Pl. de S. Francisco, 1, 41004 Sevilla

ANNEX II. DRAFT AGENDA │ 113
9:40
12. New Greenhouse Technologies Presentation by Prof. Silleli. (Ankara University).
For information and discussion
10:20
13. Conformity checks for internet sales of fruit and vegetables The Sub-Working Group will discuss potential challenges related to internet sales of F &V
For discussion and recommendation
11:00
Coffee Break
11:20
14. Traceability The Sub-working Group will provide an update on the traceability work.
For discussion and recommendation
12:00
15. New Horizontal Work The OECD Secretariat will discuss potential new horizontal work that could be developed by the OECD Fruit and Vegetables Scheme.
For discussion and recommendation
12:30
16. Priority list Delegates and the OECD Secretariat will discuss the current situation of the priority list, the rules to add or delete items and next steps.
For discussion and recommendation
13:00
17. Other Business • Upcoming Harmonisation meetings (the Netherlands and Slovakia),
• Upcoming joint workshops,
• Next Peer Review,
• Potential New Member countries. For information and discussion

114 │ 18TH OECD MEETING OF THE HEADS OF NATIONAL INSPECTION SERVICES
ANNEX III. PARTICIPANT LIST
18TH MEETING OF THE HEADS OF NATIONAL INSPECTION SERVICES
9-11 May 2018 Chamber of Commerce of Seville, Seville, Spain
Austria/Autriche
Mr. Günter JESSL Coordinator; Sub-Division II/7 – Fruit, Vegetables, Wine, Specialised Crops, Marketing Standards Federal Ministry for Sustainability and Tourism Stubenring 1 A-1010 Vienna Austria Tel: +43 1 71100 602745 Fax: +43 1 71100-602891 Email: [email protected]
Belgium/Belgique
Mr. Guy LAMBRECHTS Senior Expert Market and Agrifood Supply Chain Ministry of Agriculture and Fisheries Koning Albert II Laan 30 1030 Brussels Belgium Tel: +32 473 925 624 Email: [email protected]
Brazil/Brésil
Mr. Fernando Augusto Pereira MENDES Federal Agricultural Inspector Sanitary Inspection on Agriculture and Livestock Ministry of Agriculture Livestock and Food Supply Setor Administrativo Federal Sul, Bloco "D" Anexo do MAPA, Sala 424-B Brasilia/DF, 70.043-900 Brazil Tel: +55 061 3218 2829 Email: [email protected]

ANNEX III. LIST OF PARTICIPANTS │ 115
Brazil/Brésil (Continued
Ms. Fatima Chieppe PARIZZI Coordenadora Geral de Qualidade Vegetal – CGQV Departamento de Inspeção de Produtos de Origem Vegetal - DIPOV Ministry Of Agriculture, Livestock And Food Supply Secretaria de Defesa Agropecuária - SDA Setor Administrativo Federal Sul, Bloco "D" Anexo do MAPA, Sala 338 B 70043900 Brasilia/DF, 70.043-900 Brazil Tel: +55 61 3218 3249 Email: [email protected]
Finland/Finlande
Ms. Niina MATILAINEN Senior Inspector Finnish Food Safety Authority Evira Mustialankatu 3 Fl - 00790 Helsinki Finland Tel: +358.400.706.173 Fax: +358.000.000.000 Email: [email protected]
Italy/Italie
Dr. Carla MAGAROTTO National Expert AgeControl S.P.A INSPECTION SERVICE MANAGING AND SUPPORT 00166 Rome Via Morgagni n.30A 00161 Rome Italy Tel: +39.348.39.09.278 Fax: +39(06) 3989 4325 Email: [email protected]
Dr. Antonio FALLACARA Dipartimento delle Politiche Europee e Internazionali e dello Sviluppo Rurale Ministry of Agriculture, Food and Forestry Policies Direzione Generale delle Politiche Internazionali Ufficio PIUE V - Ortofrutta VIA XX SETTEMBRE 20 00187 Rome Italy Tel: +390646654004 Email: [email protected]

116 │ 18TH OECD MEETING OF THE HEADS OF NATIONAL INSPECTION SERVICES
Kenya
Mr. Josiah SYANDA Regional Manager Plant Inspection Unit - JKIA Kenya Plant Health Inspectorate Service (KEPHIS) PO Box 49592 Nairobi 00100 Kenya Tel: +254 709 89 1000 Email: [email protected]
Morocco/Maroc
M. Abdelillah LABIED Regional Director Direction Régionale Sud Agadir Etablissement Autonome de Contrôle et de Coordination des Exportations (EACCE) Zi. Tassila. N-E 23. Dcheira. Prefecture Inzegane Ait Melloul. Agadir 80000 Agadir Morocco Tel: +212618532303 Fax: +212528338914 Email: [email protected]
Mr. Mohamed LEMOUDDEN
EACCE’s Delegate in Marrakesh Etablissement Autonome de Contrôle et de Coordination des Exportations (EACCE) Résidence Lazrak - Av. Abdelkrim El Khattabi Gueliz Marrakech Morocco Tel: +212618532310 Fax: +212 6 18 53 23 10 Email: [email protected]
Netherlands/Pays-Bas
Mr. Jean CROMBACH Technical Director KCB (Kwaliteits-Controle-Bureau) Kwaliteits-Controle-Bureau (KCB) Louis Pasteurlaan 6 2719 EE Zoetermeer Netherlands Tel: +31 (0) 6 103 22 958 Fax: +31 70 30 88001 Email: [email protected]

ANNEX III. LIST OF PARTICIPANTS │ 117
Netherlands/Pays-Bas (Continued)
Mr. Fred JACOBS Specialist Quality affairs Quality Inspection Bureau (KCB) 2700 AK Zoetermeer Netherlands Tel: +31 651 421 229 Fax: +31 88 308 8201 Email: [email protected]
Poland/Pologne
Ms. Dorota BALINSKA-HAJDUK Head of Quality Control Department Agricultural and Food Quality Inspection Wspolna 30 Str. 00-930 Warsaw Poland Tel: +48 22 623 29 13 Fax: +48 22 623 29 96 Email: [email protected]
Mr. Grzegorz SOBCZYNSKI Chief Specialist Office of Competition and Consumer Protection 00-950 Warsaw Poland Tel: =48 22 5560318 Email: [email protected]
Slovak Republic/ République slovaque
Dr. Viera BARICICOVA Senior Adviser crop production Ministry of Agriculture and Rural Development Dobrovicova 12 812 66 Bratislava Slovak Republic Tel: +421 2 59 266 342 Email: [email protected]

118 │ 18TH OECD MEETING OF THE HEADS OF NATIONAL INSPECTION SERVICES
Slovak Republic/ République slovaque (Continued)
South Africa/Afrique du Sud
Spain/Espagne
Ms. Kristína GENDOVA RUZSIKOVA Senior Adviser Foreign Coordination Department Ministry of Agriculture and Rural Development of the Slovak Republic Dobrovicová 12 812 66 Bratislava Slovak Republic
Tel: +421 2 59 266 276 Email: [email protected]
Mr. Cyril JULIUS Chief Operations Officer Perishable Products Export Control Board (PPECB) 45 Silwerboom Avenue Plattekloof 7506 Cape Town South Africa
Tel: +27 21 930 11 34 Email: [email protected]
Ms. Sinovuyo MATAI Perishable Products Export Control Board (PPECB) 45 Silwerboom Avenue Plattekloof 7506 Cape Town South Africa
Tel: +27 21 930 11 34 Email: [email protected]
Ms. Maria DE ARMAS Head of Service of Technical Assistance Deputy Directorate General of Inspection, Certification and Technical Assistance for Foreign Trade Ministry of Economic Affairs and Competitiveness Paseo de la Castellana 162 Madrid Spain
Tel: +91 3497285 Email: [email protected]; [email protected]
Mr Francisco Herrero León President of the Chamber of Commerce of Seville Cámara de Comercio de Sevilla Plaza de la Contratación, 8 41004 Sevilla, Spain
Tel: +91 955 110 898

ANNEX III. LIST OF PARTICIPANTS │ 119
Spain/Espagne (continued)
Mr José Álvarez Calderon Director Territorial Sevilla 41013 Sevilla Andalucia Tel: +34 954298070 Fax 00 34 954232138 Email: [email protected]
Ms Leonor de Castro Subdirección General de Frutas y Hortalizas y Vitivinicultura Dirección General de Producciones y Mercados Agrarios Ministerio de Agricultura y Pesca, Alimentación y Medio Ambiente C/ Almagro, 33, 6ª planta. 28010 Madrid Tel: +34 913 4767 18 Fax 00 34 91 347 67 20 Email: [email protected]
Ms Immaculada Sanfeliu Felui Head of Comité de Gestión de Cítricos c/ Monjas de Santa Catalina, 8, 4ª 46002 Valencia - España Tel: 963 52 11 02 Fax: 963 51 07 18 Email: [email protected]
Ms Amparo de Benito AINIA (centro tecnológico. Soluciones para tu innovación) Laboratorio de Bioensayos Tel. +34 610790922 Email : [email protected]
Mr José Miguel González Otero Sub-directorate general of Differentiated Quality and Organic Farming Directorate General of the Food Industry Ministry of Agriculture and Fisheries, Food and Environment Ministerio de Agricultura y Pesca, Alimentación y Medio Ambiente. Paseo de la Infanta Isabel, 1. Desp. T-9 28071-Madrid Tel. +91 347 52 96 Email: [email protected]

120 │ 18TH OECD MEETING OF THE HEADS OF NATIONAL INSPECTION SERVICES
Spain/Espagne (continued)
Mr Fernando J. Gonzalez Technical Management Frutaria SAT 9413 Calle Nueva, s/n° 21850 Villarrasa (Huelva) Tel: +34 959 181 527 Mobile: +34 606 440 083 Email: [email protected]
Sweden/Suède
Ms. Anna LINDGREN Policy Analyst Swedish Board of Agriculture Jordbruksverket 551 82 Jönköping Sweden Tel: +46 36 15 50 61 Email: [email protected]
Switzerland/Suisse
Ms. Petra SIEGHART Head Dept. Food Safety Qualiservice GmbH Belpstrasse 26, Postfach 3001 Berne Switzerland Tel: +41-31-385-36-91 Fax: +41-31-385-36-99 Email: [email protected]
Turkey/Turquie
Mr. Ahmet Yavuzhan ERDEM Head of Department Directorate General of Product Safety and Inspection Ministry of Economy Ekonomi Bakanligi 2180. Sokak Sogutozu Cankaya/Ankara Turkey Tel: 00 90 204 89 01 Email: [email protected]

ANNEX III. LIST OF PARTICIPANTS │ 121
Turkey/Turquie (continued)
Mr. Selahattin Murat SEYHAN Product Inspector Directorate General of Product Safety and Inspection Ministry of Economy Guney Anadolu Bolge Mudurlugu Cakmak Caddesi Bugdayci Apt Mersin Turkey Tel: +90 324 237 62 31
Observer Countries
Namibia/Namibie
Mr. Titus NUUYOMA Manager: Horticultural and Agronomic Inspectorate Agro Marketing and Trade Agency (AMTA) P.Box 350 Windhoek Namibia Tel: +264 61 2023319 Email: [email protected]
Observer Organisatons
Codex Alimentarius Commission (International Food Standards) (FAO/WHO)/Codex Alimentarius Commission (Normes alimentaires internationales) (FAO/OMC)
Ms. Lingping LINGPING ZHANG Food Standards Officer Joint FAO/WHO Food Standards Programme Viale delle Terme di Caracalla Rome Italy Tel: +39 06570 53218 Email: [email protected]
OECD Secretariat
OECD/OCDE
Mr. Jose BRAMBILA-MACIAS Programme Manager TAD/COD OECD Marshall Building 5063 2 rue André-Pascal 75016 Paris France Tel: +(33-1) 45 24 15 40 Email: [email protected]
122 │ 18TH OECD MEETING OF THE HEADS OF NATIONAL INSPECTION SERVICES
OECD/OCDE (Continued)
Mme Marie RUSSEL Senior Programme Officer TAD/COD OECD Marshall Building 5063 2 rue André-Pascal 75016 Paris France Tel: +(33-1) 45 24 85 09 Email: [email protected]
Expert
Professor Hasan SILLELI Researcher University of Ankara Ankara Universitesi Ziraat Fakultesi Tarim Makinalari ve Tekn. Muhendisligi Bolumu 06130 Aydinlikevler-Ankara Turkey Tel: +90(312)5961580 Fax: +90(312)3183888 Email: [email protected]