˘ˇˆ˙˝˛˚˜˘ˇˆ˙˝˛˚˜ ˚!"#$% vehicle makers are challenged by chinese automakers...
TRANSCRIPT

���������� ��� ���� ��������
����� ����� �!"#$%���
0%
1%
2%
3%
4%
5%
6%
7%
0
10
20
30
40
50
60
70
2009 2010 2011 2012 2013 2014 2015 2016
(1,000 units)
�4%
�2%
0%
2%
4%
6%
8%
10%
� 20
� 10
0
10
20
30
40
50
2009 2010 2011 2012 2013 2014 2015 2016
(1,000 units)
0%
2%
4%
6%
8%
10%
12%
0
2
4
6
8
10
12
2009 2010 2011 2012 2013 2014 2015 2016
(1,000 units)
0%
1%
2%
3%
4%
5%
6%
7%
8%
0
100
200
300
400
500
600
700
800
2009 2010 2011 2012 2013 2014 2015 2016
(Units)
Commercial Vehicle Strategy in the Mekong Region:
Demand Is Expected to Expand upon the
Implementation of AEC
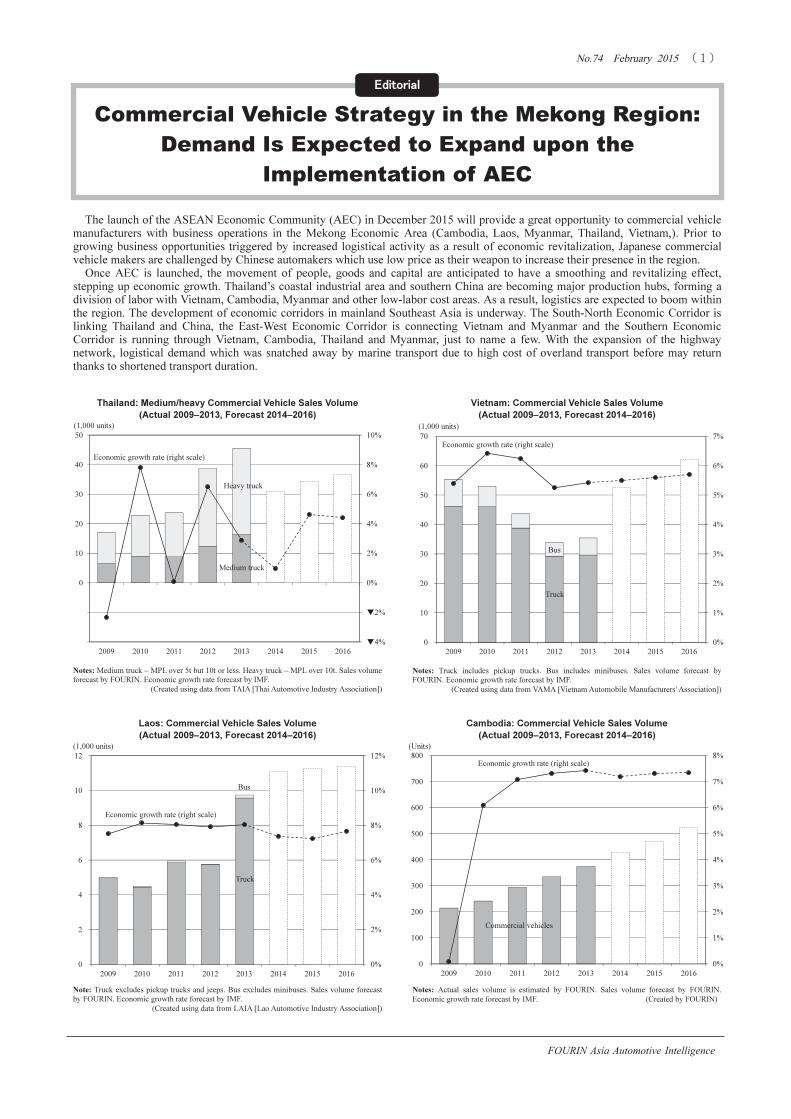
The launch of the ASEAN Economic Community (AEC) in December 2015 will provide a great opportunity to commercial vehicle
manufacturers with business operations in the Mekong Economic Area (Cambodia, Laos, Myanmar, Thailand, Vietnam,). Prior to
growing business opportunities triggered by increased logistical activity as a result of economic revitalization, Japanese commercial
vehicle makers are challenged by Chinese automakers which use low price as their weapon to increase their presence in the region.
Once AEC is launched, the movement of people, goods and capital are anticipated to have a smoothing and revitalizing effect,
stepping up economic growth. Thailand’s coastal industrial area and southern China are becoming major production hubs, forming a
division of labor with Vietnam, Cambodia, Myanmar and other low-labor cost areas. As a result, logistics are expected to boom within
the region. The development of economic corridors in mainland Southeast Asia is underway. The South-North Economic Corridor is
linking Thailand and China, the East-West Economic Corridor is connecting Vietnam and Myanmar and the Southern Economic
Corridor is running through Vietnam, Cambodia, Thailand and Myanmar, just to name a few. With the expansion of the highway
network, logistical demand which was snatched away by marine transport due to high cost of overland transport before may return
thanks to shortened transport duration.
��������
Thailand: Medium/heavy Commercial Vehicle Sales Volume
(Actual 2009–2013, Forecast 2014–2016)
Vietnam: Commercial Vehicle Sales Volume
(Actual 2009–2013, Forecast 2014–2016)
Laos: Commercial Vehicle Sales Volume
(Actual 2009–2013, Forecast 2014–2016)
Cambodia: Commercial Vehicle Sales Volume
(Actual 2009–2013, Forecast 2014–2016)
Medium truck
Heavy truck
Notes: Medium truck – MPL over 5t but 10t or less. Heavy truck – MPL over 10t. Sales volume
forecast by FOURIN. Economic growth rate forecast by IMF.
(Created using data from TAIA [Thai Automotive Industry Association])
Economic growth rate (right scale)
Truck
Bus
Economic growth rate (right scale)
Notes: Truck includes pickup trucks. Bus includes minibuses. Sales volume forecast by
FOURIN. Economic growth rate forecast by IMF.
(Created using data from VAMA [Vietnam Automobile Manufacturers' Association])
Note: Truck excludes pickup trucks and jeeps. Bus excludes minibuses. Sales volume forecast
by FOURIN. Economic growth rate forecast by IMF.
(Created using data from LAIA [Lao Automotive Industry Association])
Truck
Bus
Economic growth rate (right scale)
Economic growth rate (right scale)
Notes: Actual sales volume is estimated by FOURIN. Sales volume forecast by FOURIN.
Economic growth rate forecast by IMF. (Created by FOURIN)
Commercial vehicles
���������� ��� ���� ��������
����� ����� �!"#$%���
0
20
40
60
80
100
120
140
160
0
200
400
600
800
1,000
1,200
1,400
1,600
2009 2010 2011 2012 2013 2014 2015 2016 2017 2018 2019
(1,000 units)(Billion USD)
Myanmar
Cambodia
Laos
Vietnam
Thailand
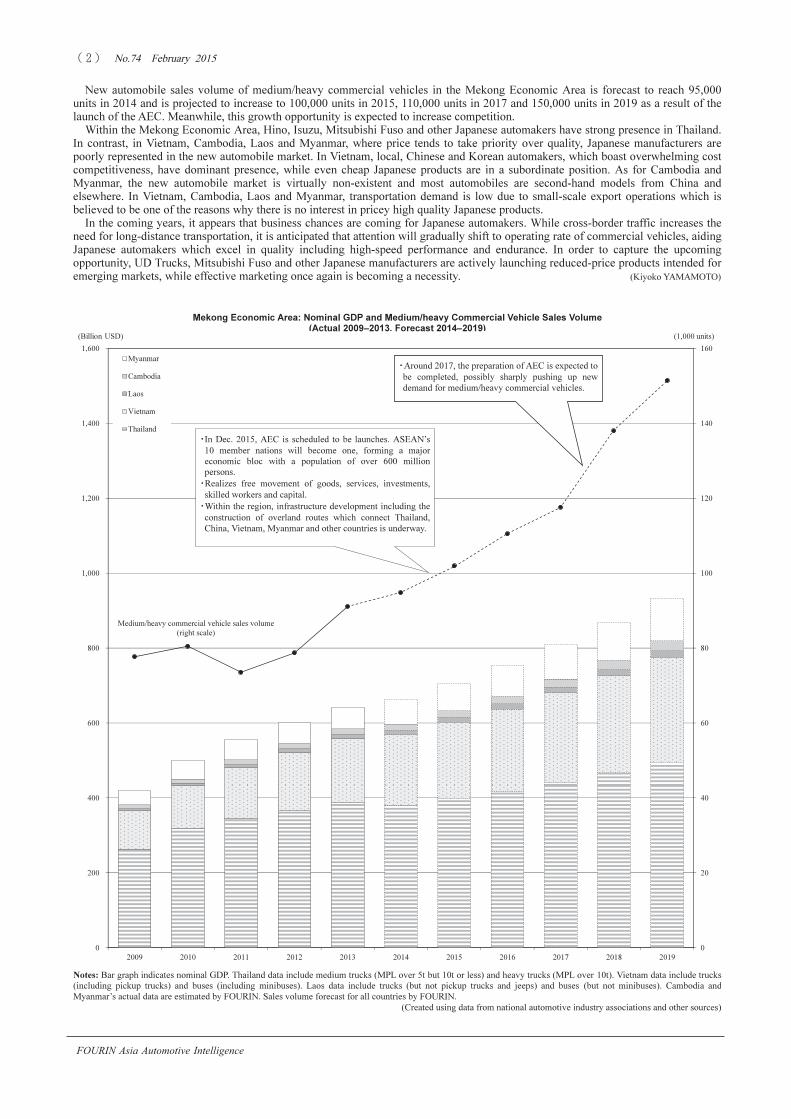
New automobile sales volume of medium/heavy commercial vehicles in the Mekong Economic Area is forecast to reach 95,000
units in 2014 and is projected to increase to 100,000 units in 2015, 110,000 units in 2017 and 150,000 units in 2019 as a result of the
launch of the AEC. Meanwhile, this growth opportunity is expected to increase competition.
Within the Mekong Economic Area, Hino, Isuzu, Mitsubishi Fuso and other Japanese automakers have strong presence in Thailand.
In contrast, in Vietnam, Cambodia, Laos and Myanmar, where price tends to take priority over quality, Japanese manufacturers are
poorly represented in the new automobile market. In Vietnam, local, Chinese and Korean automakers, which boast overwhelming cost
competitiveness, have dominant presence, while even cheap Japanese products are in a subordinate position. As for Cambodia and
Myanmar, the new automobile market is virtually non-existent and most automobiles are second-hand models from China and
elsewhere. In Vietnam, Cambodia, Laos and Myanmar, transportation demand is low due to small-scale export operations which is
believed to be one of the reasons why there is no interest in pricey high quality Japanese products.
In the coming years, it appears that business chances are coming for Japanese automakers. While cross-border traffic increases the
need for long-distance transportation, it is anticipated that attention will gradually shift to operating rate of commercial vehicles, aiding
Japanese automakers which excel in quality including high-speed performance and endurance. In order to capture the upcoming
opportunity, UD Trucks, Mitsubishi Fuso and other Japanese manufacturers are actively launching reduced-price products intended for
emerging markets, while effective marketing once again is becoming a necessity. (Kiyoko YAMAMOTO)
Mekong Economic Area: Nominal GDP and Medium/heavy Commercial Vehicle Sales Volume
(Actual 2009–2013, Forecast 2014–2019)
Medium/heavy commercial vehicle sales volume
(right scale)
�In Dec. 2015, AEC is scheduled to be launches. ASEAN’s
10 member nations will become one, forming a major
economic bloc with a population of over 600 million
persons.
�Realizes free movement of goods, services, investments,
skilled workers and capital.
�Within the region, infrastructure development including the
construction of overland routes which connect Thailand,
China, Vietnam, Myanmar and other countries is underway.
�Around 2017, the preparation of AEC is expected to
be completed, possibly sharply pushing up new
demand for medium/heavy commercial vehicles.�
Notes: Bar graph indicates nominal GDP. Thailand data include medium trucks (MPL over 5t but 10t or less) and heavy trucks (MPL over 10t). Vietnam data include trucks
(including pickup trucks) and buses (including minibuses). Laos data include trucks (but not pickup trucks and jeeps) and buses (but not minibuses). Cambodia and
Myanmar’s actual data are estimated by FOURIN. Sales volume forecast for all countries by FOURIN.
(Created using data from national automotive industry associations and other sources)

���������� ��� ���� ��������
����� ����� �!"#$%���
Note: Indicates major border areas with mutual vehicle entry points.
(Created using documents of the GMS-CBTA [Greater Mekong Subregion Cross-Border Transport Agreement] and other sources)
Mekong Economic Area: Major Border Areas with Mutual Vehicle Entry Points
Jun. 2012: Thailand and Cambodia agreed to allow
mutual entry at Aranyaprathet on the Thai side and at
Poipet on the Cambodian side. Trucks and buses
can now travel between Bangkok and Siem Reap,
and between Bangkok and Phnom Penh.�
Mutual entry was allowed at five locations
along the Vietnam-Cambodia border including
between Cambodia’s Bavet and Vietnam’s
Moc Bai as of 2013.�
2005: Laos and Vietnam concluded an
agreement to regarding the trial
implementation of single-stop inspection (SSI)
at Lao-Bao on the Laotian side and at
Dansavanh on the Vietnamese side. As a
result, customs time dropped from 90 minutes
to 29 minutes.�
Aug. 2012: At three locations, trucks and
buses are now allowed to make mutual entry
along the Vietnam–China border. As a result,
cargo can moved from Hanoi toward
Guangzhou and elsewhere without having to
be reloaded.�
May 2013: China and Laos agreed to
increase mutual-entry quota for trucks
and buses to 20,000 units each.
Implemented in 2013.�
The East-West Economic Corridor is a trunk
road that crosses Vietnam, Laos and Thailand.
Although triple license is necessary when
three countries are crossed, it was limited to
traffic area between Vietnam’s Danang and
Thailand’s Khon Kaen as of 2012.�
Northern Economic Corridor
Western Economic Corridor
South-North Economic Corridor
Eastern Economic Corridor
Central Economic Corridor
Southern Coastal Economic
Corridor
Southern Economic Corridor
East-West Economic Corridor
North-East Economic Corridor

���������� ��� ���� ��������
����� ����� �!"#$%���
FOURIN Asia Automotive Intelligence
Proton Interview:
Launches the Iriz Powered by New VVT Engine;
Aims to Revive Sales by Stressing Safety
10%
15%
20%
25%
30%
0
50
100
150
200
2009 2010 2011 2012 2013 2014
Market share (right scale)
Passenger car
sales volume
(left scale)
MPV etc.
(1,000 units)
Malaysia’s national car maker Proton is
aiming to strengthen product
competitiveness, improve sales and
aftersales service network productivity
and enhance marketing in pursuit of
reviving share. Looking at products, the
in-house developed new hatchback Iriz
designed new models. After the launch of
the Prevé sedan in 2012, the Suprima S
hatchback was released in August 2013.
Meanwhile, in response to consumer
needs, Proton is forging ties with other
companies to be able to offer a wider
range of automobiles and powertrains.
went on sale in September 2014. With
enhanced safety, the Iriz is expected to
reclaim share. In addition, built on the
Iriz’s platform, the B segment’s lineup is
planned to be revamped and expanded. In
the C segment, Proton has expanded
product lineup with the launch of in-house
(Created using data from MAA)
Proton: Automobile Sales Volume by Type and Market Share in
Malaysia (2009–2014)
Proton: Automobile Production Volume Composition
by Model in Malaysia (2014)
(Created using data from MAA/Malaysian Automotive Association)
Proton: Automobile Sales Volume by Type in Malaysia (2009–2014)
(Created using data from MAA)
Proton: Automobile Production Volume by Model in Malaysia (2009–2014)
(Created using data from MAA)
Saga
49.7%
Persona
20.9%
Exora
11.2%
Prevé
8.3%
Iriz
7.4%
Others
2.5%
(Units)
Type 2009 2010 2011 2012 2013 2014 Year-on-year
Passenger car 129,293 130,173 137,535 117,004 115,770 100,431 ▼13.2%
MPV 18,451 26,787 21,064 24,113 22,983 15,352 ▼33.2%
Van - - 2 3 - - -
Pickup truck 287 314 56 1 - - -
Automobile sales volume 148,031 157,274 158,657 141,121 138,753 115,783 ▼16.6%
Automobile market share 27.6% 26.0% 26.4% 22.5% 21.2% 17.4% ▼3.8pp
(Units)
Platform Model 2009 2010 2011 2012 2013 2014
Period-on-
period
Saga (second-gen) 69,164 72,252 78,732 70,025 70,025 55,613 ▼20.6%
Persona 44,071 49,884 47,370 28,831 17,032 23,352 37.1%
Iriz - - - - - 8,272 -
Satria Neo�
4,301 4,921 2,865 414 1,916 596 ▼68.9%
Gen.2 3,051 4,248 981 1,148 1,489 245 ▼83.5%
Savvy 4,586 2,751 887 - - - -
Waja 3,139 5,304 1,462 - - - -
Exora 23,224 28,074 23,644 30,711 24,376 12,506 ▼48.7%
Prevé - - - 26,303 18,403 9,282 ▼49.6%
Suprima S - - - - 4,289 712 ▼83.4%
Inspira - 2,144 10,288 3,980 2,552 1,262 ▼50.5%
Others 2,445 1,030 - - - - -
Automobile production total 153,981 170,608 166,229 161,412 140,082 111,840 ▼20.2%
In-house developed
C segment
In-house developed
B segment
Mitsubishi Lancer etc.

���������� ��� ���� ��������
����� ����� �!"#$%���
FOURIN Asia Automotive Intelligence
Searching for ways to revive sales as
domestic demand falls below 20 percent
In the Malaysian vehicle market,
where the two national automakers
Proton and Perodua have a commanding
presence, non-national competitors are
enhancing product lineup in recent years
in an aim to capture a stable demand of
600,000–700,000 units annually. As a
result, Proton’s market share has dropped
over 10 percentage points in the past 10
years. In 2014, market share fell below
20 percent, continuing to face severe
market conditions.
Seeing the urgent need of rebuilding
“effective implementation of integrated
marketing.” More concretely, in order to
improve product competitiveness, the
automaker has been focusing on areas
such as quality, pricing, safety and fuel
efficiency. Regarding the Iriz, the results
of these efforts have come to fruition.
However, in order to make sure that
consumers recognize these positive
results, it is necessary to implement
effective marketing. As for the
automaker’s sales and aftersales service
network which covers nearly all of
Malaysia, Proton intends to efficiently
locate dealerships, improve product
production and sales, Proton put forth a
five-year business plan set in 2013 in an
effort to revive share at home and seize
growth opportunities overseas. Although
the actual target figures of this five-year
plan are not revealed, in November 2014
FOURIN interviewed Proton’s General
Manager of Corporate Strategy Yusri
Yusuf who said that “In general, the plan
remains. Nonetheless, we have some
reviews on several target settings…”
Mr. Yusri explained that the present
business policy is concentrating on three
areas namely “product range,”
“strengthening network efficiency” and
Q: I would like you to explain the 5-year Business Plan.
A: In general, the plan remains. Nonetheless we have some reviews on
several target settings to align with the progression of market condition,
both in domestic and international markets. This review will cover
both operational aspects as well as the business approach in order to
enable us attaining the targets set.
A: At the same time, we will continue to pursue our intention in
maximizing the potentials of the existing product range and powertrain
family, especially in terms of fuel efficiency, performance and the
overall package. These activities are spearheaded by Research &
Development team based in Shah Alam and supported by Lotus
Engineering team in the United Kingdom.
A: In terms of manufacturing, our aim is to optimize the available
production capacities at our plants in Shah Alam and Tanjung Malim,
covering the complete manufacturing processes of iron casting,
machining, engine assembly, body assembly, stamping, hot press
forming, painting and vehicle assembly, supported by quality
management, logistics and supply chain management.
Q: What is your strategy to revive market share?
A: Long-term strategies are set to align with the vision and mission of the
company. In order to enable the trajectory towards achieving those
targets, specific focus areas have been identified which include:
A: 1. Enhancing product range and aligning to consumers’ expectations,
particularly in the aspects of quality, features and price positioning.
A: 2. Strengthening network efficiency in terms of coverage and productivity
of sales and after-sale services. From the vast number of outlets in the
country, we are more looking at how to leverage on the coverage and
improving our operations, such as product knowledge, soft-skills,
customer service level etc. These areas will eventually be measured in
the aspects of customer satisfaction level, covering products, sales and
services.
A: 3. Effective implementation of integrated marketing programs is also
an important area to enable our effort to communicate our strengths and
product benefits, and more importantly relaying the useful information
to our consumers.
Q: Would you tell me your product strategy and plan? You have just
launched the Iriz. And you are working on the Irox, aren’t you?
A: Today we have our own platforms as the base for models in the B
segment and C segment. The Proton Iriz which was launched in
September 2014 has received commendable feedback from the market
and recently awarded with pinnacle recognitions of Maybank-NST Car
of The Year 2014 in two categories, namely Compact Hatchback and
People’s Choice Award. We will now work on how to maximize the
Iriz platform to push into other variants.
A: Other active models of Saga, Persona, Exora, Prevé and Suprima S
continue to provide significant contributions towards fulfilling market
requirements, both in domestic and export markets. We will continue
working on these models to enhance them and put better proposition.
This is our focus for now.
�PROTON Centre of Excellence�
Interview with Perusahaan Otomobil Nasional Sdn. Bhd. (PROTON�
General Manager, Corporate Strategy Mr. Yusri Yusuf
On November 20, 2014, at PROTON Centre of Excellence (main office) in Shah Alam, Selangor, Malaysia
Proton: Aiming to Revive Share Centered on Products, Network and Marketing
���������� ��� ���� ��������
����� ����� �!"#$%���
FOURIN Asia Automotive Intelligence
knowledge of sales staff, advance
aftersales service techniques and boost
customer satisfaction.
New Iriz is to become the core platform
of the next-gen B segment
In order to revive market share, the
most important thing is to improve
product competitiveness. For Proton,
which is looking for growth
opportunities in export markets, it is
indispensable to strengthen and expand
its lineup through in-house development.
Accordingly, new model development in
the core B and C segment is underway.
However, with an annual production
scale of some 150,000 units, Proton is
unable to independently develop various
lineups. As a result, the automaker
intends to continue partnership and
cooperation with other manufacturers in
the areas of automobiles and
powertrains.
In September 2014, Proton began
sales of the new hatchback Iriz in
Malaysia. The Iriz is the first model
which is fitted with the Campro series’
VVT engine (1.3L/1.6L) and also
features electronic stability control and
other vehicle dynamics control
technologies. In an effort to strengthen
vehicle body structure, Proton
introduced hot-pressed parts and
high-strength steel, earning the five stars
on the ASEAN NCAP’s collision safety
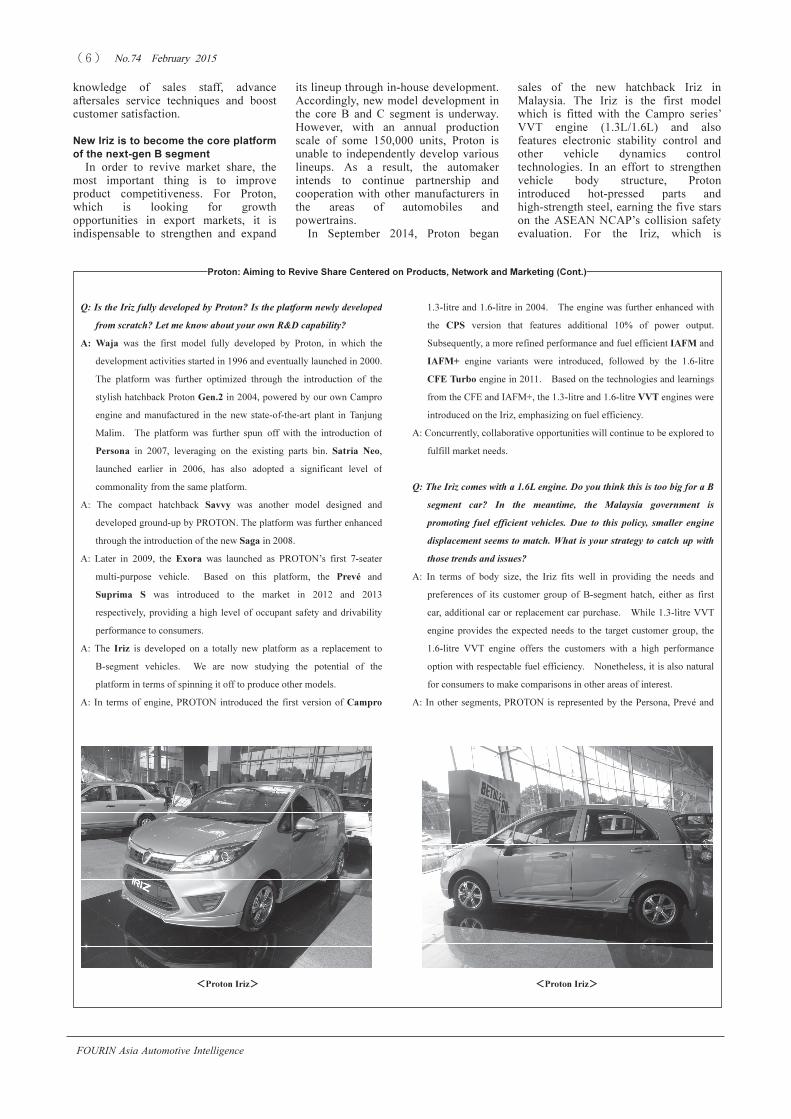
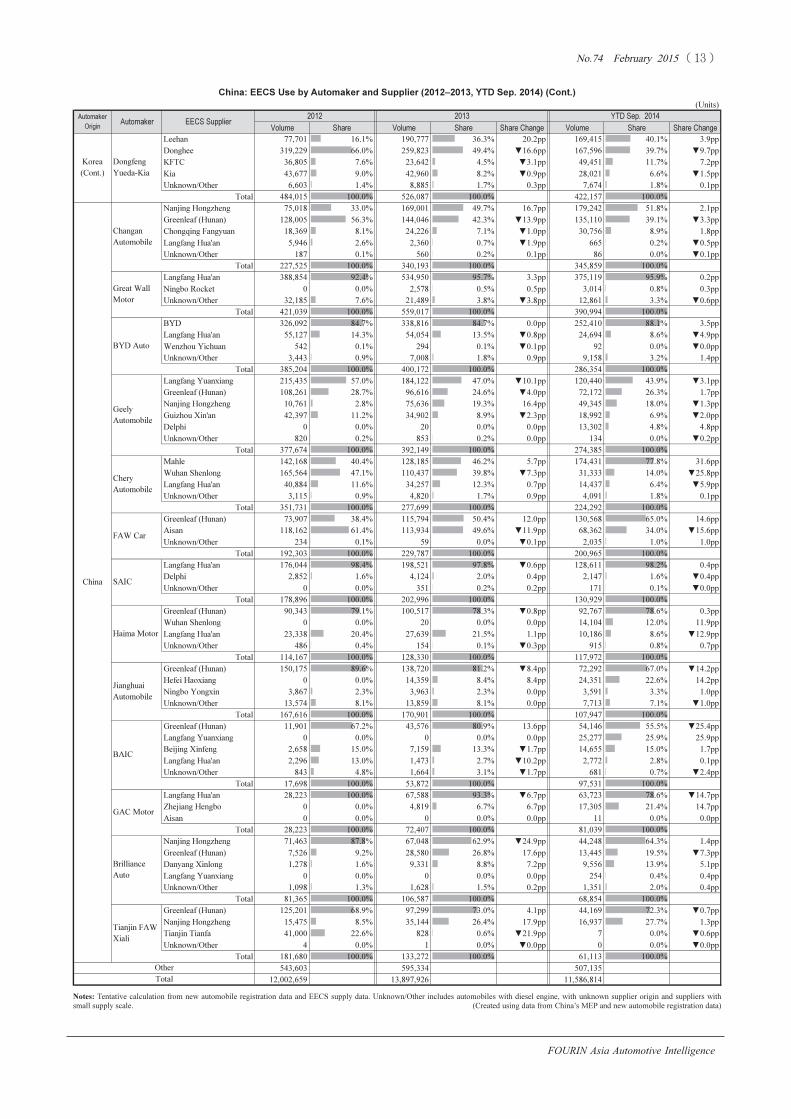
evaluation. For the Iriz, which is
�Proton Iriz�
Q: Is the Iriz fully developed by Proton? Is the platform newly developed
from scratch? Let me know about your own R&D capability?
A: Waja was the first model fully developed by Proton, in which the
development activities started in 1996 and eventually launched in 2000.
The platform was further optimized through the introduction of the
stylish hatchback Proton Gen.2 in 2004, powered by our own Campro
engine and manufactured in the new state-of-the-art plant in Tanjung
Malim. The platform was further spun�off with the introduction of
Persona in 2007, leveraging on the existing parts bin. Satria Neo,
launched earlier in 2006, has also adopted a significant level of
commonality from the same platform.
A: The compact hatchback Savvy was another model designed and
developed ground-up by PROTON. The platform was further enhanced
through the introduction of the new Saga in 2008.
A: Later in 2009, the Exora was launched as PROTON’s first 7-seater
multi-purpose vehicle. Based on this platform, the Prevé and
Suprima S was introduced to the market in 2012 and 2013
respectively, providing a high level of occupant safety and drivability
performance to consumers.
A: The Iriz is developed on a totally new platform as a replacement to
B-segment vehicles. We are now studying the potential of the
platform in terms of spinning it off to produce other models.
A: In terms of engine, PROTON introduced the first version of Campro
1.3-litre and 1.6-litre in 2004. The engine was further enhanced with
the CPS version that features additional 10% of power output.
Subsequently, a more refined performance and fuel efficient IAFM and
IAFM+ engine variants were introduced, followed by the 1.6-litre
CFE Turbo engine in 2011. Based on the technologies and learnings
from the CFE and IAFM+, the 1.3-litre and 1.6-litre VVT engines were
introduced on the Iriz, emphasizing on fuel efficiency.
A: Concurrently, collaborative opportunities will continue to be explored to
fulfill market needs.
Q: The Iriz comes with a 1.6L engine. Do you think this is too big for a B
segment car? In the meantime, the Malaysia government is
promoting fuel efficient vehicles. Due to this policy, smaller engine
displacement seems to match. What is your strategy to catch up with
those trends and issues?
A: In terms of body size, the Iriz fits well in providing the needs and
preferences of its customer group of B-segment hatch, either as first
car, additional car or replacement car purchase. While 1.3-litre VVT
engine provides the expected needs to the target customer group, the
1.6-litre VVT engine offers the customers with a high performance
option with respectable fuel efficiency. Nonetheless, it is also natural
for consumers to make comparisons in other areas of interest.
A: In other segments, PROTON is represented by the Persona, Prevé and
�Proton Iriz�
Proton: Aiming to Revive Share Centered on Products, Network and Marketing (Cont.)�

���������� ��� ���� ��������
����� ����� �!"#$%���
FOURIN Asia Automotive Intelligence
anticipated to have a leading role in
reviving share, improved safety
performance is lending a special appeal.
With a base price of 42,438 MYR, it is
set nearly on the same level as its rival
the Perodua Myvi (1.3L only).
The Iriz platform is used as the
platform of new in-house designed B
segment cars and models are to be
positioned as the successors of the
Savvy/Saga series. Proton intends to
maximize the use of the Iriz platform by
launching two variant models or more in
the future. Based on this platform,
product lineup in the B segment is
planned to be revamped and expanded.
According to local media sources, the
next-gen Saga (small sedan) seems to be
built on this platform.
As for the EEV (Energy Efficient
Vehicle) policy, which is introduced by
the Malaysian government, Perodua’s first
EEV-compliant model the Axia small
hatchback was released in September
2014, while Proton is yet to launch its
own EEV product. Proton considers the
EEV policy very important, and so the
automaker is focusing on powertrain
improvement, as well as conducting EV
and HEV product development and
marketing research in cooperation with
major suppliers. Although Mr. Yusri
declined to confirm it, local media
sources say that Proton may enter the EV
or HEV market in the second half of
2016 or later. (Toru NAKATA)
�Proton Iriz�
Suprima S as well as the Exora, in which these models have different
sets of competition and expectations in the market.
Q: What is sales target for the Iriz? Do you disclose this kind of figures?
A: It is always natural for any company to achieve the best results possible.
Q: I find the design of the Iriz iimpressive. What are the features of the
Iriz?
A: The Iriz is designed with emphasis on style and comfort, equipped with
various advanced features.
A: On top of its various features on convenience and practicality, the Iriz
has the highest level of occupant safety in its class, awarded with the
5-star ASEAN NCAP safety rating. On top of its reinforced safety
structure built with ultra-high strength steel (UHSS) and hot-press
forming (HPF) components, the Iriz is equipped with Vehicle Dynamic
Control system that provides a complete package of active safety, as
well as various features on passive safety. The new VVT engine and
superb ride-and-handling characteristics further enhance the overall
performance of the vehicle.
A: With these product strengths, effective marketing activities will enable
us to provide the right message and confidence to people.
Q: When did you start working on hot press and safety features?
A: PROTON started hot press forming production since 2012 for the
Prevé, followed by the Suprima S and now the Iriz. The technology is
adopted from a renowned origin from Europe and operated by our
subsidiary, Miyazu (Malaysia).
Q: Let me know about your R&D activity.
A: We have about 800 engineers & technical staff in R&D, mainly to cover
core areas from product planning, right down to design, vehicle
engineering, powertrain, engineering services and prototyping,
homologation and testing. In addition to our R&D center in Malaysia,
we also work together with Lotus Engineering in the UK especially in
their areas of expertise such as chassis and powertrain development.
Lotus has about 1,500 employees.
Q: What is your intention regarding the EEV policy?
A: EEV is a very important policy for PROTON as well as for the local
automotive industry. We have been working hard towards complying
with EEV requirements, particularly in the areas of engine (turbo and
non-turbo), transmission (manual, automatic and CVT) and vehicle
engineering.
Q: Let me know about your HEV and EV strategy. I thought your initial
plan was to launch EV and/or HEV by 2014-2015.
A: We are still in the research stage and at the same time, assessing all
requirements towards commercialization.
A: We are also assessing the infrastructure requirements with various parties
involved and will continue to monitor the dynamic of EV and hybrid
requirements by consumers.
Q: Are the EV and hybrid systems fully developed by Proton?
A: We have a dedicated in-house team who are also working closely with
key component suppliers. The important aspects are integration
activities to ensure consumers’ expectations are met, technically and
commercially.
Q: What is your perspective of the EV market in Malaysia?
A: The development of EV is important to PROTON and the local industry,
both in terms of vehicle and infrastructure. Our aim is to ensure that
customers’ expectations are fulfilled in all aspects, especially on
technical reliability and commercial viability.
(FOURIN)
Proton: Aiming to Revive Share Centered on Products, Network and Marketing (Cont.)�

���������� ��� ���� ��������
����� ����� �!"#$%���
FOURIN Asia Automotive Intelligence
Proton: Overview of Main Products (As of Dec. 2014)
Proton: Overview of the New Hatchback Iriz
MT CVT MT CVT MT CVT MT CVT
Price (MYR) 42,888 45,888 46,888 49,888 53,888 56,888 59,888 62,888
Occupant capacity (seating)
Length×width×height
Wheelbase
Ground clearance
Truck capacity
Engine
Maximum output
Maximum torque
Transmission 5-speed MT CVT 5-speed MT CVT 5-speed MT CVT 5-speed MT CVT
Vehicle body weight 1,130kg 1,150kg 1,138kg 1,158kg 1,150kg 1,170kg 1,165kg 1,185kg
Maximum speed 165km/h 160km/h 165km/h 160km/h 175km/h 170km/h 175km/h 170km/h
Minimum turning radius
Steering
Suspension
Brake
Keyless entry
Push-button start
Vehicle dynamics control (VDC)
Seatbelt pretensioner
Airbag
Parking assist
Collision safety evaluation
Infotainment
5 persons
Inline-4 1,597cc VVT gasolineInline-4 1,332cc VVT gasoline
3,920×1,722×1,554mm
Radio/CD, MP3 player, USB, AUX port, Bluetooth 6.2-inch LCD, DVD player, DSP, USB, AUX port, Bluetooth, Wi-Fi
1.6L1.3L
ExecutiveStandardExecutiveStandard
215L/270L
No
Front: Ventilated disc. Rear: Leading/trailing drum brake
5 stars (ASEAN NCAP)
No
Parking space displayed on monitor
(rearview camera + reverse sensor)
Yes
ABS with EBD, brake assist (BA), electronic stability control (ESC), traction control (TC), hill-hold assist (HHA)
6 airbags
(front, side, curtain)
YesNo
2,555mm
155mm
Front only
70kW (5,750rpm) 80kW (5,750rpm)
120Nm (4,000rpm) 150Nm (4,000rpm)
Electronic power steering (EPS)
5.0m
Yes
Front: Mcpherson strut / stabilizer bar. Rear: Torsion beam axle.
Model Type Model Source Market Launch Length Engine Transmission Base Price (MYR) Notes
Saga
(second-gen)
B segment,
sedan
In-house
development
Jan. 2008 4,278mm IAFM 1.3L/1.6L
5-speed MT,
CVT
33,488
Saga SE (launched in Jul. 2009), Saga
FLX (Jul. 2011), Saga FLX SE (Nov.
2011), Saga SV value edition (Jun.
2013), etc.
Iriz
B segment,
hatchback
In-house
development
Sep. 2014 3,920mm VVT 1.3L/1.6L
5-speed MT,
CVT
42,438
Rival model is the Perodua Myvi
among others. Apparently, it will be
exported to Europe and elsewhere.
Persona
B segment,
sedan
In-house
development
Aug. 2007 4,477mm IAFM 1.6L MT, AT 45,021
Sedan version of the Gen.2 which
was launched in 2004.
Satria Neo
B segment,
hatchback
In-house
development
2006 3,898mm CPS 1.6L MT, AT 50,515
The Waja and Gen.2 shares parts, but
their platform is different.
Prevé
C segment,
sedan
In-house
development
Apr. 2012 4,543mm
IAFM+ 1.6L,
CFE 1.6L
5-speed MT,
CVT (6-speed),
CVT (7-speed)
58,531
Developed based on the Exora.
Adopted hot-press parts to improve
body strength. Development cost was
540 million MYR.
Suprima S
C segment,
hatchback
In-house
development
Aug. 2013 4,436mm CFE 1.6L CVT 76,398
Variant model of the Prevé.
Apparently, development cost was
200 million MYR. Received five stars
on the ASEAN NCAP.
Inspira
C segment,
sedan
Mitsubishi
Lancer
Nov. 2010 4,570mm MIVEC 1.8L/2.0L
5-speed MT,
CVT
78,566
Positioned as the successor model of
the Waja.
Perdana
(second-gen)
D segment,
sedan
Honda Accord Dec. 2013 N.A. 2.0L/2.4L 5-speed AT N.A.
Began to be supplied as government
vehicle at the end of 2013. Not to be
sold to general customers.
Manufactured by Honda's plant.
Exora
C segment,
MPV
In-house
development
Apr. 2009 4,592mm
CPS 1.6L,
CFE 1.6L
5-speed MT,
CVT
59,995.5
Achieved local content of 90 percent.
Also has a luxury version called
Exora Prime.

���������� ��� ���� ��������
����� ����� �!"#$%���
FOURIN Asia Automotive Intelligence
Proton: In-house Development of Automobiles and Engines
(Created using Proton’s PR materials and FOURIN interview)
B segment
C segment
Platform
sharing
VariantGen.2 is the first model fitted with the in-
house developed Campro engine (Since the
Gen.2, all in-house developed models are
powered by the Campro engine)
2011: Production discontinuedWaja Campro
(2006)
Platform
extension
Savvy's sedan version
2010: Production discontinued
Plans to launch
variant modelsSavvy/Saga platform is planned to be used
for the Iriz series
2011: Sales discontinued in Malaysia
Gen.2's sedan version
Proton's first in-house developed MPV
Variant
Variant
Switch to Iriz platform?
Waja
(2000)
Gen.2
(2004)
Persona
(2007)
Savvy
(2005)
New Saga
(2008)
Iriz
(2014)
New models
(2015 or after)
Exora
(2009)
Prevé
(2012)
Suprima S
(2013)
Campro
series
engine
Exora was the first model fitted with CFE.
Preve and Suprima S also equipped with the
same engine.
Improved output
10 percent
Improved fuel
efficiency
Improved fuel
efficiency
Converted to turbo
Saga FLX was the first model fitted with IAFM+.
Preve also equipped with the same engine.
Iriz was the first model fitted with
VVT. Planned to be used for
additional models.
Waja was the first model fitted with CPS.
As of 2014, Exora and Satria Neo were equipped with CPS.
Compatible with 5-speed MT/
4-speed AT.
Available in 1.3L/1.6L.
Compatible with 5-speed MT/CVT.
Available in 1.6L only.
Combined with CVT.
Available in 1.3L/1.6L.
Compatible with 5-speed MT/CVT.
Waja was the first model fitted with IAFM.
As of 2014, Persona was equipped with IAFM.
Gen.2 was the first model fitted with the in-house developed
Campro engine . The Waja and Satria Neo were equipped
with the same engine. 2010: Discontinued use.
Campro
(2004)
IAFM
(2007)
CFE
(2011)
CPS
(2007)
IAFM+
(2007)
VVT
(2014)
Includes technology and knowhow from IAFM+ and CFE.

���������� ��� ���� ��������
����� ����� �!"#$%����
FOURIN Asia Automotive Intelligence
EECS Use in China:
Stricter Emission Regulations Force Weaker Suppliers
to Exit the Market
Beijing launched China 5 emission
standards that regulate passenger vehicle
emissions in March 2013 ahead of its
nationwide introduction in January 2018.
The evaporative emission control system
(EECS), a device which prevents the
emission of gasoline vapor into the
atmosphere, will become subject to
regulation with the introduction of China
5 emission standards.
FOURIN has compiled a list of
emission standard-compliant
automobiles announced by China’s
Ministry of Environmental Protection
with VW, GM and Ford. Meanwhile,
Mahle, Delphi and other Western
suppliers are engaged in securing new
orders in an effort to boost share. As for,
Japanese components makers, they
continue to supply affiliated Japanese
automakers. In the next fuel efficiency
regulation, which is currently under
review, on-board refueling vapor
recovery (ORVR) system is scheduled to
be introduced. After the launch of the
ORVR system, more suppliers are
forecast to drop out while competition is
expected to intensify.
and combined it with new passenger
vehicle registration data to create a
database on EECS use broken down to
supplier. As for Chinese suppliers, which
account for over half of all EECS supply,
some manufacturers exited the market
due to lack of technology needed for
switching from China 4 to China 5
emission standards, resulting in a drop in
Chinese share. Under these
circumstances, the largest local supplier
Langfang Hua’an Automotive
Equipment is maintaining share by
stepping up technological cooperation
China: EECS Volume by Supplier Origin and Supplier (2012–2013, YTD Sep. 2014)
Notes: Tentative calculation from new automobile registration data and EECS supply data. Unknown includes automobiles with diesel engine and with unknown supplier origin. Utility vehicles are not
included. (Created using data from China’s MEP [Ministry of Environmental Protection] and new automobile registration data)
� (Created using data from table below) (Created using data from table below)
China: EECS Share by Supplier Origin (2012–2013, YTD Sep. 2014) China: EECS Share by Supplier (2012–2013, YTD Sep. 2014)
(Units)
Volume Share Volume Share Share Change Volume Share Share Change
China 6,534,203 54.4% 7,810,257 56.2% 1.8pp 6,339,374 54.7% ▼1.5pp
Japan 2,035,068 17.0% 2,298,707 16.5% ▼0.4pp 1,855,618 16.0% ▼0.5pp
EU 1,640,908 13.7% 1,589,227 11.4% ▼2.2pp 1,522,593 13.1% 1.7pp
Korea 1,169,995 9.7% 1,433,251 10.3% 0.6pp 1,175,129 10.1% ▼0.2pp
US 473,108 3.9% 612,931 4.4% 0.5pp 588,306 5.1% 0.7pp
Unknown 149,377 1.2% 153,553 1.1% ▼0.1pp 105,794 0.9% ▼0.2pp
Langfang Hua'an 3,737,237 31.1% 4,752,547 34.2% 3.1pp 3,948,991 34.1% ▼0.1pp
Mahle 1,363,515 11.4% 1,317,212 9.5% ▼1.9pp 1,309,159 11.3% 1.8pp
Greenleaf (Hunan) 991,569 8.3% 1,066,638 7.7% ▼0.6pp 863,189 7.4% ▼0.2pp
Aisan 790,155 6.6% 879,555 6.3% ▼0.3pp 717,949 6.2% ▼0.1pp
KFTC 620,862 5.2% 792,802 5.7% 0.5pp 702,013 6.1% 0.4pp
Roki 661,210 5.5% 828,043 6.0% 0.4pp 688,661 5.9% ▼0.0pp
Delphi 455,148 3.8% 608,274 4.4% 0.6pp 588,187 5.1% 0.7pp
Futaba 439,073 3.7% 494,432 3.6% ▼0.1pp 394,791 3.4% ▼0.2pp
Other 2,943,890 24.5% 3,158,423 22.7% ▼1.8pp 2,373,874 20.5% ▼2.2pp
12,002,659 100.0% 13,897,926 100.0% 11,586,814 100.0%Total
2012 2013 YTD Sep. 2014
Mak
er O
rigin
Supplier
3.9% 4.4% US 5.1%
9.7% 10.3% Korea 10.1%
13.7% 11.4%EU 13.1%
17.0%16.5%
Japan 16.0%
54.4%56.2%
China 54.7%
0%
10%
20%
30%
40%
50%
60%
70%
80%
90%
100%
2012 2013 YTD Sep. 2014
24.5%22.7%
Other 20.5%
3.7%
3.6%
Futaba 3.4%
3.8%4.4%
Delphi 5.1%
5.5%6.0%
Roki 5.9%
5.2% 5.7%KFTC 6.1%
6.6% 6.3%Aisan 6.2%
8.3%7.7% Greenleaf
(Hunan) 7.4%
11.4%
9.5%Mahle 11.3%
31.1%34.2%
Langfang
Hua'an 34.1%
0%
10%
20%
30%
40%
50%
60%
70%
80%
90%
100%
2012 2013 YTD Sep. 2014

���������� ��� ���� ��������
����� ����� �!"#$%����
FOURIN Asia Automotive Intelligence
Stepped up emission regulations force
Chinese suppliers to drop out of
competition
FOURIN has compiled a list of
automobiles which comply with China 3,
China 4 and China 5 emission regulations
announced by China’s Ministry of
Environmental Protection to produce a
database on supplier-specific EECS use.
Based on a list of over 110,000 models,
with the introduction of China 5 emission
effective volume and butane working
capacity (BWC) of EECS charcoal
canisters as well as added BWC
inspection to production consistency
inspection. After the introduction of China
6 emission regulations, which is currently
under study, ORVR system, a device
which collects fuel vapors during fueling,
is planned to be added to the list of
inspection items, which is expected to
force even more suppliers out of business.
regulations, while foreign EECS suppliers
are maintaining their existing clientele,
smaller Chinese manufacturers are
dropping out of competition, increasing
supplier concentration. Since 2014, when
the certification of China 5-compliant
models began, the products of 16 Chinese
suppliers passed new emission regulations
out of over 40 companies, allowing them
to supply EECS to automakers. China 5
certification brought about the testing of
China: EECS Use by Automaker and Supplier (2012–2013, YTD Sep. 2014)
China: EECS Use by Supplier and Emission Standard Level
Notes: Created based on MEP7’s official announcements of emission regulation-compliant gasoline-powered light automobiles until Sep. 30, 2014. Each model designation is counted as one model.
Covers light automobiles with GVW of 3,500kg or less. If the EECS maker is an automaker, then it is supposed that the automaker assembles canisters and other procured parts in house.
(Created using data from China’s MEP)
Notes: Tentative calculation from new automobile registration data and EECS supply data. Unknown/Other includes automobiles with diesel engine, with unknown supplier origin and suppliers with
small supply scale. � � � � � � � � � � � � � � � � � � � � � � � � � � � � � � � � � � � � � � � � � � (Created using data from China’s MEP and new automobile registration data)
Supplier Origin Supplier China 3 China 4 China 5 Supplier Origin Supplier China 3 China 4 China 5
Greenleaf (Hunan) High-Tech Materials 11,241 19,651 2,654 Mahle 663 1,674 774
Langfang Hua'an Automotive Equipment 4,475 8,275 1,670 Kayser 109 78 60
Nanjing Hongzheng Electromechanical Manufacturing 1,947 4,052 1,488 Dayco 298 256 52
Langfang Yuanxiang Automobile Fittings 1,272 4,949 643 Daimler 18 90 36
Xiamen Sentec E&E 807 1,531 285 VW 255 317 0
Wuhan Shenlong Automobile Plastic Products 2,620 3,777 270 BMW 5 0 0
BYD 90 436 249 Hutchinson 8 7 0
Ningbo Rocket Automobile Parts 0 1,220 190 Total 1,356 2,422 922
Chongqing Fangyuan Industry & Trade 7,463 10,136 140 Aisan 519 880 333
Liuzhou Shunzeer Auto Parts 0 2,282 98 Roki 253 378 241
Ningbo Yongxin Auto Components Manufacturing 543 514 76 Futaba 103 162 116
Guizhou Xin'an Aviation Machinery 85 906 56 Denso 76 73 36
Beijing Xinfeng Tianji Science & Technology 0 36 38 Toyo Roki 13 0 0
Zhejiang Hengbo Filter 0 479 34 Total 964 1,493 726
Shanghai Lianyi Automobile Tractor Industry & Trade 23 72 14 KFTC 285 325 277
Hefei Haoxiang Automobile Parts 0 386 12 Leehan 8 158 123
Nanjing Zhongshan Automobile Matching Parts Factory 834 1,804 0 Donghee 4 48 0
Tianjin Tianfa Automobile Fittings 157 24 0 Kia 86 16 0
Tianjin Shenzhou Auto Parts 46 312 0 Hyundai 33 0 0
Huanghua Xiangyu Auto Parts 83 232 0 Total 416 547 400
Shanghai Dazhong Lianxiang Automotive Components 47 22 0 Delphi 122 264 221
Chongqing Oubiao Science & Technology 0 168 0 Visteon 23 79 0
Other 1,388 1,722 0 Total 145 343 221
Total 33,121 62,986 7,917 36,002 67,791 10,186
(Number of models)
China
Total
EU
US
Korea
Japan
(Units)
Volume Share Volume Share Share Change Volume Share Share Change
Langfang Hua'an 1,202,714 95.2% 1,435,964 96.5% 1.3pp 1,251,316 97.9% 1.4pp
Dayco 21,987 1.7% 20,771 1.4% ▼0.3pp 14,236 1.1% ▼0.3pp
Unknown/Other 38,536 3.1% 30,553 2.1% ▼1.0pp 12,023 0.9% ▼1.1pp
Total 1,263,237 100.0% 1,487,288 100.0% 1,277,575 100.0%
Langfang Hua'an 1,020,017 80.3% 1,391,006 94.4% 14.1pp 1,252,597 97.2% 2.8pp
Mahle 176,934 13.9% 62,170 4.2% ▼9.7pp 34,642 2.7% ▼1.5pp
Kayser 20,932 1.6% 799 0.1% ▼1.6pp 125 0.0% ▼0.0pp
Visteon 17,960 1.4% 4,657 0.3% ▼1.1pp 119 0.0% ▼0.3pp
Unknown/Other 33,965 2.7% 14,967 1.0% ▼1.7pp 1,623 0.1% ▼0.9pp
Total 1,269,808 100.0% 1,473,599 100.0% 1,289,106 100.0%
Mahle 261,666 62.0% 332,230 63.4% 1.5pp 445,506 88.4% 24.9pp
Wuhan Shenlong 144,314 34.2% 171,230 32.7% ▼1.5pp 44,105 8.7% ▼24.0pp
Unknown/Other 16,285 3.9% 20,155 3.8% ▼0.0pp 14,498 2.9% ▼1.0pp
Total 422,265 100.0% 523,615 100.0% 504,109 100.0%
Kayser 98,318 72.2% 120,686 61.6% ▼10.5pp 99,009 50.9% ▼10.8pp
Delphi 37,903 27.8% 75,091 38.4% 10.5pp 95,511 49.1% 10.7pp
Unknown/Other 34 0.0% 23 0.0% ▼0.0pp 52 0.0% 0.0pp
Total 136,255 100.0% 195,800 100.0% 194,572 100.0%
Daimler 93,287 100.0% 110,862 100.0% 0.0pp 91,347 86.5% ▼13.5pp
Mahle 0 0.0% 0 0.0% 0.0pp 12,220 11.6% 11.6pp
Kayser 0 0.0% 0 0.0% 0.0pp 2,028 1.9% 1.9pp
Unknown/Other 2 0.0% 2 0.0% ▼0.0pp 9 0.0% 0.0pp
Total 93,289 100.0% 110,864 100.0% 105,604 100.0%
Mahle 7,055 99.9% 6,894 99.1% ▼0.8pp 4,872 97.5% ▼1.7pp
Unknown/Other 4 0.1% 61 0.9% 0.8pp 127 2.5% 1.7pp
Total 7,059 100.0% 6,955 100.0% 4,999 100.0%
GAC Fiat Zhejiang Hengbo 4,791 100.0% 39,453 100.0% 0.0pp 45,420 100.0% 0.0pp
Automaker
Origin
Automaker EECS Supplier
Fujian Benz
Shanghai
VW
FAW-VW
Dongfeng
Peugeot
Citroën
Brilliance
BMW
Beijing Benz
EU
2012 2013 YTD Sep. 2014

���������� ��� ���� ��������
����� ����� �!"#$%����
FOURIN Asia Automotive Intelligence
China’s Hua’an dominates the market
while Mahle strengthens sales promotion
In China’s EECS sector, since Chinese
suppliers supply not only Chinese
automakers, but also Western manufacturers,
Chinese share exceeds 50 percent. Of which,
the two largest Chinese suppliers Langfang
Hua’an and Greenleaf (Hunan) High-Tech
Materials supply EECS to over 90 percent
of new Shanghai VW and FAW-VW
models, over 40 percent of new Shanghai
GM models and over 60 percent of new
Ford models, controlling a dominant market
position. Out of China’s newly-registered
automobile volume of 13.9 million units,
4.75 million units are supplied by Langfang
Hua’an distantly followed by German
component maker Mahle with over 3
million units.
As for supply relations, taking advantage
of the introduction of China 5 emission
standards, Mahle charged ahead in the
Chinese market supplying not only Western
automakers, but also Japan’s Nissan and
China’s Jiangling, Great Wall and Chery. In
contrast, the three major Japanese suppliers
Aisan, Futaba and Roki supply only
Japanese automakers as before. As a result,
they cannot enjoy the benefits of a larger
clientele base and as Japanese automakers
are struggling with sluggish sales, Japanese
suppliers inevitably face declining market
share. (Jincheng ZHOU)
China: EECS Use by Automaker and Supplier (2012–2013, YTD Sep. 2014) (Cont.)�
Notes: Tentative calculation from new automobile registration data and EECS supply data. Unknown/Other includes automobiles with diesel engine, with unknown supplier origin and suppliers with
small supply scale.� � � � � � � � � � � � � � � � � � � � � � � � � � � � � � � � � � � � � � � � � � (Created using data from China’s MEP and new automobile registration data)
(Units)
Volume Share Volume Share Share Change Volume Share Share Change
Langfang Hua'an 555,589 44.9% 575,675 40.2% ▼4.7pp 423,725 37.0% ▼3.3pp
Mahle 392,882 31.8% 443,081 31.0% ▼0.8pp 351,913 30.7% ▼0.3pp
Delphi 211,110 17.1% 284,358 19.9% 2.8pp 244,273 21.3% 1.4pp
KFTC 77,486 6.3% 127,421 8.9% 2.6pp 125,719 11.0% 2.1pp
Kayser 0 0.0% 0 0.0% 0.0pp 855 0.1% 0.1pp
Unknown/Other 4 0.0% 76 0.0% 0.0pp 16 0.0% ▼0.0pp
Total 1,237,071 100.0% 1,430,611 100.0% 1,146,501 100.0%
Greenleaf (Hunan) 88,823 84.2% 84,651 83.8% ▼0.4pp 46,380 55.7% ▼28.1pp
Liuzhou Shunzeer 0 0.0% 0 0.0% 0.0pp 22,999 27.6% 27.6pp
Shanghai Lianyi 16,611 15.8% 16,342 16.2% 0.4pp 13,929 16.7% 0.5pp
Unknown/Other 10 0.0% 5 0.0% ▼0.0pp 3 0.0% ▼0.0pp
Total 105,444 100.0% 100,998 100.0% 83,311 100.0%
Langfang Hua'an 189,900 47.1% 385,863 59.1% 12.0pp 378,626 64.8% 5.7pp
Xiamen Sentec 151,430 37.6% 165,507 25.4% ▼12.2pp 96,761 16.6% ▼8.8pp
Delphi 6,429 1.6% 52,232 8.0% 6.4pp 61,951 10.6% 2.6pp
Aisan 52,205 13.0% 48,948 7.5% ▼5.5pp 46,714 8.0% 0.5pp
Unknown/Other 3,007 0.7% 37 0.0% ▼0.7pp 5 0.0% ▼0.0pp
Total 402,971 100.0% 652,587 100.0% 584,057 100.0%
Aisan 348,246 70.7% 417,383 81.2% 10.5pp 354,337 86.7% 5.5pp
Denso 144,616 29.3% 96,671 18.8% ▼10.5pp 54,215 13.3% ▼5.5pp
Unknown/Other 3 0.0% 2 0.0% ▼0.0pp 2 0.0% 0.0pp
Total 492,865 100.0% 514,056 100.0% 408,554 100.0%
GAC Toyota Aisan 261,671 100.0% 293,963 100.0% 0.0pp 246,885 100.0% 0.0pp
Roki 379,033 50.3% 510,092 60.3% 9.9pp 400,668 59.2% ▼1.0pp
Mahle 373,859 49.7% 336,386 39.7% ▼9.9pp 272,270 40.2% 0.5pp
Greenleaf (Hunan) 0 0.0% 0 0.0% 0.0pp 3,465 0.5% 0.5pp
Unknown/Other 15 0.0% 134 0.0% 0.0pp 149 0.0% 0.0pp
Total 752,907 100.0% 846,612 100.0% 676,552 100.0%
Xiamen Sentec 27,064 52.1% 30,285 56.5% 4.4pp 21,285 55.8% ▼0.7pp
Roki 15,495 29.8% 16,010 29.9% 0.0pp 13,720 36.0% 6.1pp
Mahle 8,210 15.8% 6,732 12.6% ▼3.3pp 2,887 7.6% ▼5.0pp
Unknown/Other 1,142 2.2% 581 1.1% ▼1.1pp 232 0.6% ▼0.5pp
Total 51,911 100.0% 53,608 100.0% 38,124 100.0%
Dongfeng Honda Futaba 269,738 100.0% 304,015 100.0% 0.0pp 235,575 100.0% 0.0pp
Roki 165,223 49.4% 216,537 57.0% 7.6pp 199,056 62.4% 5.4pp
Futaba 169,262 50.6% 163,673 43.0% ▼7.6pp 120,182 37.6% ▼5.4pp
Unknown/Other 4 0.0% 8 0.0% 0.0pp 0 0.0% ▼0.0pp
Total 334,489 100.0% 380,218 100.0% 319,238 100.0%
Greenleaf (Hunan) 74,072 95.5% 77,436 98.8% 3.3pp 51,974 79.6% ▼19.2pp
Langfang Yuanxiang 3,133 4.0% 767 1.0% ▼3.1pp 13,097 20.0% 19.1pp
Roki 364 0.5% 188 0.2% ▼0.2pp 254 0.4% 0.1pp
Unknown/Other 24 0.0% 5 0.0% ▼0.0pp 3 0.0% ▼0.0pp
Total 77,593 100.0% 78,396 100.0% 65,328 100.0%
Greenleaf (Hunan) 75,832 42.9% 80,474 55.7% 12.8pp 67,022 53.3% ▼2.4pp
Roki 96,606 54.6% 61,496 42.5% ▼12.1pp 56,308 44.8% 2.2pp
Unknown/Other 4,525 2.6% 2,607 1.8% ▼0.8pp 2,436 1.9% 0.1pp
Total 176,963 100.0% 144,577 100.0% 125,766 100.0%
Greenleaf (Hunan) 0 0.0% 14,715 24.0% 24.0pp 54,750 76.7% 52.7pp
Xiamen Sentec 69,184 94.3% 44,516 72.7% ▼21.6pp 15,902 22.3% ▼50.4pp
Aisan 4,189 5.7% 1,998 3.3% ▼2.4pp 744 1.0% ▼2.2pp
Total 73,373 100.0% 61,229 100.0% 71,396 100.0%
Futaba 73 1.7% 26,739 100.0% 98.3pp 39,032 98.7% ▼1.3pp
Aisan 4,218 98.3% 0 0.0% ▼98.3pp 503 1.3% 1.3pp
Unknown/Other 2 0.0% 0 0.0% ▼0.0pp 1 0.0% 0.0pp
Total 4,293 100.0% 26,739 100.0% 39,536 100.0%
KFTC 506,571 62.4% 641,739 65.2% 2.8pp 526,843 65.3% 0.1pp
Delphi 196,837 24.2% 192,444 19.6% ▼4.7pp 171,000 21.2% 1.6pp
Leehan 108,515 13.4% 146,884 14.9% 1.6pp 108,084 13.4% ▼1.5pp
Unknown/Other 4 0.0% 2,873 0.3% 0.3pp 1,153 0.1% ▼0.1pp
Total 811,927 100.0% 983,940 100.0% 807,080 100.0%
Korea
US
Japan
Dongfeng
Nissan
Zhengzhou
Nissan
Guangqi
Honda
Changhe
Suzuki
Changan
Suzuki
Changan
Mazda
Shanghai GM
SAIC-GM-
Wuling
Changan Ford
FAW Toyota
Automaker
Origin
Automaker EECS Supplier
2012
GAC
Mitsubishi
Beijing
Hyundai
2013 YTD Sep. 2014
���������� ��� ���� ��������
����� ����� �!"#$%����
FOURIN Asia Automotive Intelligence
China: EECS Use by Automaker and Supplier (2012–2013, YTD Sep. 2014) (Cont.)�
Notes: Tentative calculation from new automobile registration data and EECS supply data. Unknown/Other includes automobiles with diesel engine, with unknown supplier origin and suppliers with
small supply scale. � � � � � � � � � � � � � � � � � � � � � � � � � � � � � � � � � � � � � � � � � � (Created using data from China’s MEP and new automobile registration data)
(Units)
Volume Share Volume Share Share Change Volume Share Share Change
Leehan 77,701 16.1% 190,777 36.3% 20.2pp 169,415 40.1% 3.9pp
Donghee 319,229 66.0% 259,823 49.4% ▼16.6pp 167,596 39.7% ▼9.7pp
KFTC 36,805 7.6% 23,642 4.5% ▼3.1pp 49,451 11.7% 7.2pp
Kia 43,677 9.0% 42,960 8.2% ▼0.9pp 28,021 6.6% ▼1.5pp
Unknown/Other 6,603 1.4% 8,885 1.7% 0.3pp 7,674 1.8% 0.1pp
Total 484,015 100.0% 526,087 100.0% 422,157 100.0%
Nanjing Hongzheng 75,018 33.0% 169,001 49.7% 16.7pp 179,242 51.8% 2.1pp
Greenleaf (Hunan) 128,005 56.3% 144,046 42.3% ▼13.9pp 135,110 39.1% ▼3.3pp
Chongqing Fangyuan 18,369 8.1% 24,226 7.1% ▼1.0pp 30,756 8.9% 1.8pp
Langfang Hua'an 5,946 2.6% 2,360 0.7% ▼1.9pp 665 0.2% ▼0.5pp
Unknown/Other 187 0.1% 560 0.2% 0.1pp 86 0.0% ▼0.1pp
Total 227,525 100.0% 340,193 100.0% 345,859 100.0%
Langfang Hua'an 388,854 92.4% 534,950 95.7% 3.3pp 375,119 95.9% 0.2pp
Ningbo Rocket 0 0.0% 2,578 0.5% 0.5pp 3,014 0.8% 0.3pp
Unknown/Other 32,185 7.6% 21,489 3.8% ▼3.8pp 12,861 3.3% ▼0.6pp
Total 421,039 100.0% 559,017 100.0% 390,994 100.0%
BYD 326,092 84.7% 338,816 84.7% 0.0pp 252,410 88.1% 3.5pp
Langfang Hua'an 55,127 14.3% 54,054 13.5% ▼0.8pp 24,694 8.6% ▼4.9pp
Wenzhou Yichuan 542 0.1% 294 0.1% ▼0.1pp 92 0.0% ▼0.0pp
Unknown/Other 3,443 0.9% 7,008 1.8% 0.9pp 9,158 3.2% 1.4pp
Total 385,204 100.0% 400,172 100.0% 286,354 100.0%
Langfang Yuanxiang 215,435 57.0% 184,122 47.0% ▼10.1pp 120,440 43.9% ▼3.1pp
Greenleaf (Hunan) 108,261 28.7% 96,616 24.6% ▼4.0pp 72,172 26.3% 1.7pp
Nanjing Hongzheng 10,761 2.8% 75,636 19.3% 16.4pp 49,345 18.0% ▼1.3pp
Guizhou Xin'an 42,397 11.2% 34,902 8.9% ▼2.3pp 18,992 6.9% ▼2.0pp
Delphi 0 0.0% 20 0.0% 0.0pp 13,302 4.8% 4.8pp
Unknown/Other 820 0.2% 853 0.2% 0.0pp 134 0.0% ▼0.2pp
Total 377,674 100.0% 392,149 100.0% 274,385 100.0%
Mahle 142,168 40.4% 128,185 46.2% 5.7pp 174,431 77.8% 31.6pp
Wuhan Shenlong 165,564 47.1% 110,437 39.8% ▼7.3pp 31,333 14.0% ▼25.8pp
Langfang Hua'an 40,884 11.6% 34,257 12.3% 0.7pp 14,437 6.4% ▼5.9pp
Unknown/Other 3,115 0.9% 4,820 1.7% 0.9pp 4,091 1.8% 0.1pp
Total 351,731 100.0% 277,699 100.0% 224,292 100.0%
Greenleaf (Hunan) 73,907 38.4% 115,794 50.4% 12.0pp 130,568 65.0% 14.6pp
Aisan 118,162 61.4% 113,934 49.6% ▼11.9pp 68,362 34.0% ▼15.6pp
Unknown/Other 234 0.1% 59 0.0% ▼0.1pp 2,035 1.0% 1.0pp
Total 192,303 100.0% 229,787 100.0% 200,965 100.0%
Langfang Hua'an 176,044 98.4% 198,521 97.8% ▼0.6pp 128,611 98.2% 0.4pp
Delphi 2,852 1.6% 4,124 2.0% 0.4pp 2,147 1.6% ▼0.4pp
Unknown/Other 0 0.0% 351 0.2% 0.2pp 171 0.1% ▼0.0pp
Total 178,896 100.0% 202,996 100.0% 130,929 100.0%
Greenleaf (Hunan) 90,343 79.1% 100,517 78.3% ▼0.8pp 92,767 78.6% 0.3pp
Wuhan Shenlong 0 0.0% 20 0.0% 0.0pp 14,104 12.0% 11.9pp
Langfang Hua'an 23,338 20.4% 27,639 21.5% 1.1pp 10,186 8.6% ▼12.9pp
Unknown/Other 486 0.4% 154 0.1% ▼0.3pp 915 0.8% 0.7pp
Total 114,167 100.0% 128,330 100.0% 117,972 100.0%
Greenleaf (Hunan) 150,175 89.6% 138,720 81.2% ▼8.4pp 72,292 67.0% ▼14.2pp
Hefei Haoxiang 0 0.0% 14,359 8.4% 8.4pp 24,351 22.6% 14.2pp
Ningbo Yongxin 3,867 2.3% 3,963 2.3% 0.0pp 3,591 3.3% 1.0pp
Unknown/Other 13,574 8.1% 13,859 8.1% 0.0pp 7,713 7.1% ▼1.0pp
Total 167,616 100.0% 170,901 100.0% 107,947 100.0%
Greenleaf (Hunan) 11,901 67.2% 43,576 80.9% 13.6pp 54,146 55.5% ▼25.4pp
Langfang Yuanxiang 0 0.0% 0 0.0% 0.0pp 25,277 25.9% 25.9pp
Beijing Xinfeng 2,658 15.0% 7,159 13.3% ▼1.7pp 14,655 15.0% 1.7pp
Langfang Hua'an 2,296 13.0% 1,473 2.7% ▼10.2pp 2,772 2.8% 0.1pp
Unknown/Other 843 4.8% 1,664 3.1% ▼1.7pp 681 0.7% ▼2.4pp
Total 17,698 100.0% 53,872 100.0% 97,531 100.0%
Langfang Hua'an 28,223 100.0% 67,588 93.3% ▼6.7pp 63,723 78.6% ▼14.7pp
Zhejiang Hengbo 0 0.0% 4,819 6.7% 6.7pp 17,305 21.4% 14.7pp
Aisan 0 0.0% 0 0.0% 0.0pp 11 0.0% 0.0pp
Total 28,223 100.0% 72,407 100.0% 81,039 100.0%
Nanjing Hongzheng 71,463 87.8% 67,048 62.9% ▼24.9pp 44,248 64.3% 1.4pp
Greenleaf (Hunan) 7,526 9.2% 28,580 26.8% 17.6pp 13,445 19.5% ▼7.3pp
Danyang Xinlong 1,278 1.6% 9,331 8.8% 7.2pp 9,556 13.9% 5.1pp
Langfang Yuanxiang 0 0.0% 0 0.0% 0.0pp 254 0.4% 0.4pp
Unknown/Other 1,098 1.3% 1,628 1.5% 0.2pp 1,351 2.0% 0.4pp
Total 81,365 100.0% 106,587 100.0% 68,854 100.0%
Greenleaf (Hunan) 125,201 68.9% 97,299 73.0% 4.1pp 44,169 72.3% ▼0.7pp
Nanjing Hongzheng 15,475 8.5% 35,144 26.4% 17.9pp 16,937 27.7% 1.3pp
Tianjin Tianfa 41,000 22.6% 828 0.6% ▼21.9pp 7 0.0% ▼0.6pp
Unknown/Other 4 0.0% 1 0.0% ▼0.0pp 0 0.0% ▼0.0pp
Total 181,680 100.0% 133,272 100.0% 61,113 100.0%
543,603 595,334 507,135
12,002,659 13,897,926 11,586,814
Korea
(Cont.)
China
Total
Other
Haima Motor
Chery
Automobile
Jianghuai
Automobile
GAC Motor
Brilliance
Auto
BAIC
Great Wall
Motor
BYD Auto
Geely
Automobile
Dongfeng
Yueda-Kia
SAIC
FAW Car
Tianjin FAW
Xiali
Automaker
Origin
EECS Supplier
2012
Changan
Automobile
Automaker
2013 YTD Sep. 2014

���������� ��� ���� ��������
����� ����� �!"#$%����
FOURIN Asia Automotive Intelligence
China: China 5-compliant EECS Supply to Top 40 Automakers
Note: Each model designation is counted as one model. (Created using data from China’s MEP)
Shanghai V
W
FA
W-V
W
Dongfe
ng
Peugeot C
itroën
Brilliance B
MW
Beijin
g B
enz
Fujian B
enz
GA
C F
iat
Shanghai G
M
SA
IC
-G
M-W
uling
Changan F
ord
FA
W T
oyota
GA
C T
oyota
Dongfeng N
issan
Zhengzhou N
issan
Do
ng
fen
g H
on
da
Guangqi H
onda
Changhe S
uzuki
Changan S
uzuki
Changan M
azda
GA
C M
itsubis
hi
195 3 2 68 32
505 250 80 33
49
14 20
106
18
4
Total 505 250 49 18 80 305 33 3 14 2 68 52
Mahle (Shanghai) 42 149 73
Mahle (Import) 18 42 68
Mahle (China) 14 79
Mahle (Japan)
Total 42 149 18 14 0 79 115 68
Kayser (Import) 53 4
Kayser (Changchun) 5
Total 53 4 5
Dayco Dayco (Italy) 52
Daimler Daimler (Import) 36
Total 52 42 149 53 58 14 84 115 68
Aisan (Tianjin) 9 163 29 25
Aisan (Import) 34 18
Aisan (Foshan) 35
Total 9 197 82 25
Roki Roki (Suzhou) 108 12 40 68 15
Futaba (Dongguan) 69 32
Futaba (Import) 24
Futaba (Japan) 2
Total 69 32 26
Denso Denso (Tianjin) 36
Total 9 233 82 108 12 69 72 68 25 41
KFTC (Beijing) 107
KFTC (Import) 32
Total 139
(Leehan (Suzhou)
Leehan (Import)
Total
Total 139
Delphi (Shanghai) 81
Delphi (Import) 61 6
Delphi (Luxemburg)
Delphi (India) 6
Delphi (Mexico) 2
Total 61 83 12
557 292 198 114 58 14 18 386 305 54 233 82 226 94 69 72 2 136 77 41
Zhejiang Hengbo Filter
Hefei Haoxiang Automobile Parts
Shanghai Lianyi Automobile Tractor Industry & Trade
Chongqing Fangyuan Industry & Trade
Liuzhou Shunzeer Auto Parts
Guizhou Xin'an Aviation Machinery
Beijing Xinfeng Tianji Science & Technology
Ningbo Yongxin Auto Components Manufacturing
Nanjing Hongzheng Electromechanical Manufacturing
Wuhan Shenlong Automobile Plastic Products
Xiamen Sentec E&E
BYD
Ningbo Rocket Automobile Parts
China
EU
Mahle
Kayser
Total
Japan
Aisan
Futaba
Korea
KFTC
Leehan
US Delphi
Greenleaf (Hunan) High-Tech Materials
Langfang Hua'an Automotive Equipment
Langfang Yuanxiang Automobile Fittings
Supplier O
rig
in
Supplier
EU US Japan

���������� ��� ���� ��������
����� ����� �!"#$%����
FOURIN Asia Automotive Intelligence
China: China 5-compliant EECS Supply to Top 40 Automakers (Cont.)�
Note: Each model designation is counted as one model. (Created using data from China’s MEP)
Beijin
g H
yu
nd
ai
Do
ngfe
ng
Yue
da
-K
ia
SA
IC
FA
W C
ar
Ha
ima M
oto
r
Tia
njin F
AW
Xia
li
Don
gfe
ng
Pa
sse
ng
er
Cha
ng
an
Au
tom
ob
ile
Jia
ng
ling
Mo
tors
BA
IC
Beiq
i F
oto
n
Gre
at W
all M
oto
r
BY
D
Geely
Au
tom
ob
ile
Ch
ery
Au
tom
ob
ile
Jia
nghu
ai
Au
tom
ob
ile
Sou
th E
ast
(F
ujian
) M
oto
r
GA
C M
oto
r
Brillian
ce
Auto
Lifa
n A
uto
mob
ile
45 75 5 792 73 144 423 16 521 2,394
118 41 4 8 19 502 46 48 1,654
9 206 668 589 10 1,482
6 672 3 681
58 173 280
217 251
249 249
190 190
115 1 116
106
56 56
54 54
46 46
16 34
20 20
4
Total 118 45 116 18 58 1,113 8 146 196 692 249 1,819 219 36 217 64 1,111 13 7,617
Mahle (Shanghai) 40 42 76 422
Mahle (Import) 128
Mahle (China) 93
Mahle (Japan) 1 1
Total 1 40 42 76 644
Kayser (Import) 57
Kayser (Changchun) 5
Total 62
Dayco Dayco (Italy) 52
Daimler Daimler (Import) 36
Total 1 40 42 76 794
Aisan (Tianjin) 226
Aisan (Import) 14 66
Aisan (Foshan) 35
Total 14 327
Roki Roki (Suzhou) 243
Futaba (Dongguan) 101
Futaba (Import) 24
Futaba (Japan) 2
Total 127
Denso Denso (Tianjin) 36
Total 14 733
KFTC (Beijing) 73 16 196
KFTC (Import) 61 93
Total 134 16 289
(Leehan (Suzhou) 103 103
Leehan (Import) 24 24
Total 24 103 127
Total 158 119 416
Delphi (Shanghai) 28 26 135
Delphi (Import) 67
Delphi (Luxemburg) 16 16
Delphi (India) 6
Delphi (Mexico) 2
Total 28 26 16 226
186 119 144 60 116 18 58 1,113 48 146 196 734 249 1,835 295 36 217 64 1,111 13 9,786
US Delphi
Total
Korea
KFTC
Leehan
Japan
Aisan
Futaba
Shanghai Lianyi Automobile Tractor Industry & Trade
EU
Mahle
Kayser
Ningbo Yongxin Auto Components Manufacturing
Zhejiang Hengbo Filter
Hefei Haoxiang Automobile Parts
Liuzhou Shunzeer Auto Parts
Guizhou Xin'an Aviation Machinery
Beijing Xinfeng Tianji Science & Technology
BYD
Ningbo Rocket Automobile Parts
Chongqing Fangyuan Industry & Trade
Nanjing Hongzheng Electromechanical Manufacturing
Langfang Yuanxiang Automobile Fittings
Wuhan Shenlong Automobile Plastic Products
Xiamen Sentec E&E
China
Total
China
Greenleaf (Hunan) High-Tech Materials
Langfang Hua'an Automotive Equipment
Sup
plie
r O
rig
in
Supplier
Korea

���������� ��� ���� ��������
����� ����� �!"#$%����
FOURIN Asia Automotive Intelligence
China MPV Market:
Chinese Low-price Business-oriented
Models Dominate the Market
�150%
�120%
�90%
�60%
�30%
0%
30%
60%
90%
120%
150%
0
500
1,000
1,500
2,000
2,500
3,000
3,500
4,000
4,500
5,000
2003 2004 2005 2006 2007 2008 2009 2010 2011 2012 2013 YTD
Nov. 2013
YTD
Nov. 2014
(1,000 units)
MPV C-MPV B-MPV
China’s MPV market (including
B-MPVs and C-MPVs) increased 8.8
percent in the first 11 months of 2014 to 3
million units (factory shipment data).
Compared to 2013’s 4.9 percent growth
rate, 2014’s increase is high. Looking at
data by segment, while B-MPVs went up
only by a single digit, C-MPVs rose 33.5
percent, registering the highest growth by
surpassing even SUV growth of 32.7
percent. MPVs went up 19.1 percent,
becoming the third growth segment after
C-MPVs and SUVs. In the second half of
2014, while economic downturn slowed
down passenger vehicle sales, the MPV
automakers which use low cost as their
weapon of choice. Since foreign
automakers are unable to compete with
Chinese manufacturers due to low product
price, they focus on the launch of
high-end models; however, their market
share remains well below 10 percent.
Among foreign automakers, only US
manufacturers realized positive growth
thanks to brisk sales of GM’s high-end
business model the Buick GL8. However,
the family-oriented MPV market is
anticipated to expand, prompting Honda
and Toyota among others to step up local
product launches.
market, whose products are intended for
both business and family use greatly
expanded compared to other segments,
drawing attention as a segment that is
anticipated to see further demand in the
future.
Looking at data by brand origin,
Chinese share stood at 89.9 percent in the
first 11 months of 2014, nearly
monopolizing the MPV market. B-MPVs,
which are sold for an entry price of
around 50,000 CNY and intended for
business use, account for 77.3 percent of
the MPV market, highlighting the
overwhelming domination of Chinese
China: MPV Factory Shipment Volume by Segment (2003–2013, YTD Nov. 2013/2014)
China: MPV Factory Shipment Volume by Segment (2003–2013, YTD Nov. 2013/2014)
(Created using data from CAAM)
Since 2008, demand expanded in the suburbs primarily aiding the growth of
B-MPVs; however, starting from 2012, MPV growth rate became the highest, factory
shipment volume going up 27.3 percent in 2013. Meanwhile, in YTD Nov. 2014,
C-MPVs went up 33.5 percent driven by the launch of the Baojun 730 in Jul. 2014.�
Following the implementation of the “Vehicles to the Countryside”
policy in 2008, factory shipment volume of B-MPVs spiked in 2009.
China: Passenger Vehicle Factory Shipment Volume by Segment (2003–2013, YTD Nov. 2013/2014)
(Created using data from CAAM)
(Created using data from CAAM [China Association of Automobile Manufacturers])
B-MPV
C-MPV
MPV
Growth rate(right scale)
Factory shipment
volume
(left scale)
(Units)
Segment 2003 2004 2005 2006 2007 2008 2009 2010 2011 2012 2013
Year-on-
year
Share
YTD Nov.
2013
YTD Nov.
2014
Period-on-
period
Share
MPV 67,979 91,594 118,780 144,512 180,242 158,841 187,060 278,502 315,677 327,989 417,643 27.3% 13.6% 370,520 441,321 19.1% 14.7%
C-MPV 34,899 27,204 28,839 37,680 86,077 97,471 135,165 217,523 223,496 219,474 193,825 ▼11.7% 6.3% 181,341 242,097 33.5% 8.1%
B-MPV 732,235 779,518 873,177 965,764 1,040,401 1,130,216 2,070,250 2,642,455 2,369,013 2,374,856 2,453,732 3.3% 80.1% 2,208,627 2,321,208 5.1% 77.3%
Total 835,113 898,316 1,020,796 1,147,956 1,306,720 1,386,528 2,392,475 3,138,480 2,908,186 2,922,319 3,065,200 4.9% 100.0% 2,760,488 3,004,626 8.8% 100.0%
(Units)
Segment 2003 2004 2005 2006 2007 2008 2009 2010 2011 2012 2013
Year-on-
year
Share
YTD Nov.
2013
YTD Nov.
2014
Period-
on-period
Share
E2 57,578 54,945 83,331 122,854 162,147 169,291 184,586 117,561 271,698 320,468 361,912 12.9% 2.0% 333,243 383,056 14.9% 2.2%
E1 8,173 15,841 17,152 28,685 40,352 41,956 73,537 116,567 186,370 189,872 259,589 36.7% 1.4% 236,567 266,757 12.8% 1.5%
D 428,895 411,511 516,874 733,753 935,562 965,586 1,226,179 1,459,635 1,526,908 1,652,842 1,911,863 15.7% 10.7% 1,738,381 1,820,283 4.7% 10.3%
C 687,607 876,356 1,076,680 1,597,470 2,266,169 2,476,574 3,960,278 4,982,370 5,339,622 5,845,878 6,903,222 18.1% 38.5% 6,333,065 6,649,399 5.0% 37.7%
B 624,120 686,601 801,173 1,010,773 937,533 946,896 1,373,342 1,848,060 2,019,192 2,052,588 1,977,499 ▼3.7% 11.0% 1,666,405 1,640,457 ▼1.6% 9.3%
A 133,318 172,645 269,990 294,748 291,362 320,636 464,852 607,778 547,477 468,356 406,821 ▼13.1% 2.3% 368,671 272,747 ▼26.0% 1.5%
Sports 0 0 3,550 3,670 2,143 1,743 1,027 939 126 0 0 - 0.0% 0 0 - 0.0%
MPV 67,979 91,594 118,780 144,512 180,242 158,841 187,060 278,502 315,677 327,989 417,643 27.3% 2.3% 370,520 441,321 19.1% 2.5%
C-MPV 34,899 27,204 28,839 37,680 86,077 97,471 135,165 217,523 223,496 219,474 193,825 ▼11.7% 1.1% 181,341 242,097 33.5% 1.4%
B-MPV 732,235 779,518 873,177 965,764 1,040,401 1,130,216 2,070,250 2,642,455 2,369,013 2,374,856 2,453,732 3.3% 13.7% 2,208,627 2,321,208 5.1% 13.2%
SUV 74,703 128,190 191,252 235,510 355,545 446,399 655,039 1,165,885 1,459,435 2,042,917 3,042,752 48.9% 17.0% 2,713,962 3,602,349 32.7% 20.4%
Total 2,849,507 3,244,405 3,980,798 5,175,419 6,297,533 6,755,609 10,331,315 13,437,275 14,259,014 15,495,240 17,928,858 15.7% 100.0% 16,150,782 17,639,674 9.2% 100.0%

���������� ��� ���� ��������
����� ����� �!"#$%����
FOURIN Asia Automotive Intelligence
Wuling Hongguang
Wuling Rongguang
Wuling Sunshine
Fengxing
Honor
Changan Star II
Baojun 730
Sokon K Series
Buick GL8
Sokon Fengguang
Weiwang M20
Refine
Weiwang 306
Wagon R+
Livina
Lifan Fengshun
Jinbei minibuses
New Changan Star
Ouliwei
Golf Touran
Changan Star I
Taurus
Odyssey
Succe
Sokon C Series
Starlight 4500
Weiwang 205
Furuida
Xenia M80
NV200
0
5
10
15
20
25
30
35
2,300 2,500 2,700 2,900 3,100 3,300 3,500
(Wheelbase: mm)
(Price: 1,000 CNY)
The MPV market began to see rapid
growth in 2008 when China’s “Vehicles
to the Countryside” policy was
implemented which supported vehicle
dissemination in rural areas with
incentives. As a result, especially
business-type B-MPVs realized drastic
sales increase. These models have an
entry price of 50,000 CNY or less and are
used for cargo transport or as company
vehicles. In the B-MPV segment,
SAIC-GM-Wuling’s Wuling brand enjoys
the highest share. In the first 11 months of
2014, the top three models were those of
the Wuling brand. The best-selling model
Wuling Hongguang succeeded in
capturing strong demand thanks to its low
price and family-oriented design concept.
While in the past B-MPV models were
intended primarily for business use and
had a typical box-like design, the
Hongguang’s design resembles to that of a
passenger vehicle with an aim to capture
demand of family vehicle buyers.
SAIC-GM-Wuling released its seven-seat
/ three-row C-MPV the Baojun 730 in
recent years. BAIC opened a flagship
store on a Chinese online retail website
Tmall.com, selling limited-edition models
and offering special discounts among
other activities in an aim to explore new
sales opportunities.
In contrast to active product launches
by Chinese automakers, foreign entry
into the MPV market is lagging behind.
Since low-price models dominate the
market, there is little demand for
relatively expensive family-oriented
MPVs. The best-selling model among
foreign products is GM’s Buick GL8
whose entry price is set at a high level of
289,900 CNY and is sold as a high-end
business-use model. The GL8 succeeded
in capturing demand from corporate users
who have a taste for high-end products.
The model was ninth based on data of the
first 11 months of 2014, having a
50,000-unit lead on the Honda Odyssey
which is also sold for over 200,000 CNY.
As for Japanese models, although
Changan Suzuki’s Beidouxing and
Dongfeng Nissan’s Livina ranked 14th
July 2014, expanding its product lineup
from FR-layout models to FF-layout
products. With an entry price of 69,800
CNY, the Baojun 730 is somewhat more
expensive than most B-MPV models.
However, it has superior cost performance
considering that it has fuel consumption
of 7.1L/100km which is on par with that
of the segment-leader Hongguang and is
equipped with electronic stability control
(ESC). In the first four months after its
launch, the Baojun sold 89,000 units, over
30,000 units more than Nissan’s global
strategic model Livina in the same
C-MPV segment. Since Changan
Automobile, which has a rich lineup of
B-MPV products, made a late start in
launching family-use models, the
automaker dropped behind compared to
SAIC-GM-Wuling. Changan Automobile’s
Honor model, which was designed based
on the same business/family dual-use
concept as the Hongguang, sold some
500,000 units less than the Hongguang.
Meanwhile, BAIC is boosting its share by
emphasizing online sales promotion in
China: Product Structure and Price Range Distribution of the MPV Market (YTD Nov. 2014, Top 30 Models)
Main foreign models are located far away
from the product concentration area due to
their high price. Although they have few
rivals, their sales volume is also low.�
Product concentration area within the MPV
market. Especially, products in the
2,500–2,700mm / 50,000 CNY area sell
well. Includes some high-end models, but
they are foreign brands.�
Notes: Includes B-MPV and C-MPV models. Size of the bubbles is in proportion to sales volume. Grey bubbles indicate Chinese models. Dotted bubbles indicate foreign models. Fengxing is
represented by Lingzhi V3. Sokon K Series is represented by new K7. Sokon Fengguang is represented by Fengguang 360. Entry price of some models are from autohome.com.cn.
(Created using data from company PR materials and CAAM)

���������� ��� ���� ��������
����� ����� �!"#$%����
FOURIN Asia Automotive Intelligence
and 15th, they are low-price models sold
for less than 100,000 CNY. Guangqi
Honda’s Odyssey with an entry price of
229,800 CNY was 23rd while GAC
Toyota’s E’Z with an entry price of
152,800 CNY stood at 32nd place,
indicating that models sold for over
100,000 CNY are fighting an uphill battle.
Although low-price business-oriented
models maintain an overwhelming share in
the MPV market, some Chinese
manufacturers are strengthening
development of medium/high-end models
sold for 100,000 CNY or more. Brilliance
Auto announced the Huasong high-end
MPV model in July 2014. The Huasong’s
product power is enhanced by BMW’s
2.0L turbocharged engine. After UK van
maker LDV’s purchase by SAIC Group in
2009, SAIC Commercial Vehicle began
manufacturing products based on
technology from UK van maker LDV,
reviving the Maxus high-end commercial
vehicle brand and starting full-scale
production of Maxus brand products from
2012. The launch of the Maxus brand is
intended to compete with foreign
automakers in the high-end MPV market.
Meanwhile, family-oriented MPVs, which
resemble in design to passenger cars, began
to alter the market by capturing share from
business-use MPVs. This change is seen as
a business opportunity for Japanese
automakers which have rich experience in
family-use MPV development. Upcoming
challenges for Japanese automakers are the
launch of new models tailored to local
needs and the establishment of brand
image of MPV models. (Takaharu HIRANO)
China: MPV Factory Shipment Volume of Top 50 Models by Automaker and Segment (2012–2013, YTD Nov. 2013/2014)
Notes: Includes B-MPV and C-MPV models. Entry price of some models are from autohome.com.cn. (Created using data from CAAM)
(Units)
Ranking
Brand
Origin
Manufacturer Segment Model Price 2012 2013
Year-on-
year
Share
YTD Nov.
2013
YTD Nov.
2014
Period-on-
period
Share
1 China SAIC-GM-Wuling B-MPV Wuling Hongguang 43.8-56.8 316,237 530,050 67.6% 17.3% 454,476 674,119 48.3% 22.4%
2 China SAIC-GM-Wuling B-MPV Wuling Rongguang 40.3-57.8 372,099 339,295 ▼8.8% 11.1% 321,931 328,676 2.1% 10.9%
3 China SAIC-GM-Wuling B-MPV Wuling Sunshine 29.8-48.0 523,841 455,718 ▼13.0% 14.9% 428,005 288,110 ▼32.7% 9.6%
4 China Dongfeng Liuzhou MPV Fengxing 56.9-173.9 136,501 180,189 32.0% 5.9% 163,018 219,212 34.5% 7.3%
5 China Changan Automobile B-MPV Honor 39.8-66.9 88,757 106,061 19.5% 3.5% 95,227 131,550 38.1% 4.4%
6 China Changan Automobile B-MPV Changan star II 31.9-46.8 130,445 129,415 ▼0.8% 4.2% 118,208 128,894 9.0% 4.3%
7 China SAIC-GM-Wuling C-MPV Baojun 730 69.8-89.8 0 0 - 0.0% 0 88,617 - 2.9%
8 China Dongfeng Sokon B-MPV K Series 25.9-36.9 202,991 135,279 ▼33.4% 4.4% 122,415 82,029 ▼33.0% 2.7%
9 US Shanghai GM Norsom MPV Buick GL8 289.9-399.9 64,001 70,191 9.7% 2.3% 68,372 75,100 9.8% 2.5%
10 China Dongfeng Sokon B-MPV Fengguang 44.9-70 0 31,652 - 1.0% 24,054 72,159 3.0-fold 2.4%
11 China BAIC Yinxiang B-MPV Weiwang M20 43.8-63.8 0 15,373 - 0.5% 8,082 67,679 8.4-fold 2.3%
12 China Jianghuai Automobile MPV Refine 85.0-213.9 53,988 54,153 0.3% 1.8% 48,711 67,462 38.5% 2.2%
13 China BAIC Motor B-MPV Weiwang 306 36.8-46.8 46,368 85,275 83.9% 2.8% 73,309 66,219 ▼9.7% 2.2%
14 Japan Changhe Suzuki B-MPV Beidouxing 32.0-49.0 70,886 71,735 1.2% 2.3% 63,172 54,668 ▼13.5% 1.8%
15 Japan Dongfeng Nissan C-MPV Livina 85.8-107.2 3,895 64,813 16.6-fold 2.1% 63,295 52,625 ▼16.9% 1.8%
16 China Lifan Passenger B-MPV Lifan Fengshun 32.8-49.4 26,515 51,843 95.5% 1.7% 45,049 52,218 15.9% 1.7%
17 China Brilliance Jinbei B-MPV Jinbei utility vehicles N.A. 43,019 36,919 ▼14.2% 1.2% 31,736 46,692 47.1% 1.6%
18 China Changan Automobile B-MPV New Changan Star 38.9-43.8 9,575 31,549 3.3-fold 1.0% 30,544 43,146 41.3% 1.4%
19 China Changan Automobile B-MPV Ouliwei 39.8-60.9 0 22,181 - 0.7% 17,956 41,276 2.3-fold 1.4%
20 EU Shanghai VW C-MPV Golf Touran 149.8-206.8 36,044 35,310 ▼2.0% 1.2% 34,712 32,549 ▼6.2% 1.1%
21 China Changan Automobile B-MPV Changan Star I 25.0-43.8 146,333 52,933 ▼63.8% 1.7% 50,633 29,700 ▼41.3% 1.0%
22 China Changan Automobile B-MPV Taurus 45.9-58.9 100,084 57,450 ▼42.6% 1.9% 54,359 27,995 ▼48.5% 0.9%
23 Japan Guangqi Honda MPV Odyssey 229.8-299.8 20,900 27,277 30.5% 0.9% 22,875 25,696 12.3% 0.9%
24 China Zhengzhou Nissan C-MPV Succe 64.8-115.8 25,157 31,432 24.9% 1.0% 29,348 24,924 ▼15.1% 0.8%
25 China Dongfeng Sokon B-MPV C Series 48.8-51.8 0 24,808 - 0.8% 21,956 21,164 ▼3.6% 0.7%
26 China Changan Automobile B-MPV Starlight 4500 50.9-58.8 42,490 28,174 ▼33.7% 0.9% 27,565 20,803 ▼24.5% 0.7%
27 China BAIC Yinxiang B-MPV Weiwang 205 29.8-40.8 0 34,521 - 1.1% 26,873 20,224 ▼24.7% 0.7%
28 China Changhe Automobile B-MPV Furuida 28.8-47.8 24,224 11,383 ▼53.0% 0.4% 10,959 19,153 74.8% 0.6%
29 China FAW Jilin B-MPV Xenia M80 55.9-63.9 41,270 40,424 ▼2.0% 1.3% 36,654 17,127 ▼53.3% 0.6%
30 Japan Zhengzhou Nissan C-MPV NV200 104.8-139.8 14,958 17,639 17.9% 0.6% 15,887 16,840 6.0% 0.6%
31 China FAW Jilin B-MPV Jiabao 43.9-52.9 49,672 39,544 ▼20.4% 1.3% 35,329 16,586 ▼53.1% 0.6%
32 Japan GAC Toyota C-MPV E'Z 152.8-189.8 17,286 17,088 ▼1.1% 0.6% 16,282 15,578 ▼4.3% 0.5%
33 China Brilliance Jinbei MPV Granse 149.8-271.8 16,798 18,573 10.6% 0.6% 16,529 12,960 ▼21.6% 0.4%
34 China Chery Automobile B-MPV Karry Yoyo 36.9-55.9 15,841 20,350 28.5% 0.7% 18,596 12,904 ▼30.6% 0.4%
35 Korea Dongfeng Yueda-Kia C-MPV Soul 103.8-127.8 10,825 10,004 ▼7.6% 0.3% 8,935 8,561 ▼4.2% 0.3%
36 China GAC Gonow B-MPV Gonow Xinglang 45.8-69.8 0 2,804 - 0.1% 893 7,348 8.2-fold 0.2%
37 Japan Dongfeng Honda MPV Elysion 283.8-335.8 6,866 12,510 82.2% 0.4% 11,388 7,168 ▼37.1% 0.2%
38 China Beijing Automobile Works B-MPV BAIC utility vehicles N.A. 4,690 5,281 12.6% 0.2% 5,169 6,783 31.2% 0.2%
39 China NLM Motor B-MPV Qiteng M70 35.9-45.9 0 0 - 0.0% 0 6,749 - 0.2%
40 EU Fujian Benz MPV Vito 33.9-38.9 3,388 5,904 74.3% 0.2% 5,244 6,064 15.6% 0.2%
41 China Beiqi Foton MPV MP-X 95.8-160.0 4,374 6,484 48.2% 0.2% 5,667 6,041 6.6% 0.2%
42 China BYD Auto MPV M6 103.9-192.5 1,134 6,521 5.8-fold 0.2% 5,984 5,799 ▼3.1% 0.2%
43 China Chery Automobile B-MPV Karry Youya 42.9-59.9 3,462 6,672 92.7% 0.2% 6,083 4,797 ▼21.1% 0.2%
44 China Changhe Automobile B-MPV Furuida M50 48.9-51.9 0 0 - 0.0% 0 4,673 - 0.2%
45 EU Fujian Benz MPV Viano 41.9-68.9 3,263 4,169 27.8% 0.1% 3,769 3,438 ▼8.8% 0.1%
46 China Haima (Zhengzhou) B-MPV Fstar 39.8-50.8 35,099 18,242 ▼48.0% 0.6% 16,427 3,409 ▼79.2% 0.1%
47 Japan FAW Car MPV Mazda 8 219.8-249.8 2,859 5,897 2.1-fold 0.2% 5,246 3,408 ▼35.0% 0.1%
48 China GAC Gonow B-MPV Gonow Xingwang 25.9-29.8 8,314 8,679 4.4% 0.3% 6,066 3,326 ▼45.2% 0.1%
49 China BAIC Motor B-MPV Weiwang M20 46.8-62.8 0 15,373 - 0.5% 0 2,996 - 0.1%
50 China SAIC Commercial MPV Maxus G10 135.8-170.8 0 0 - 0.0% 0 2,688 - 0.1%
197,870 88,063 ▼55.5% 2.9% 83,500 26,724 ▼68.0% 0.9%
2,922,319 3,065,200 4.9% 100.0% 2,760,488 3,004,626 8.8% 100.0%
Other
Total

���������� ��� ���� ��������
����� ����� �!"#$%����
FOURIN Asia Automotive Intelligence
SAIC-GM-Wuling / Changan Automobile / BAIC: MPV Product Strategy (As of Jan. 2015)
SAIC-GM-Wuling
Changan Automobile
BAIC
Wuling Hongguang
(First-gen Nov. 2010, S model Aug. 2013,
V model Jan. 2015 plan)�
Baojun 730
(Jul. 2014)
�Jointly developed with PATAC (joint venture R&D base
of SAIC and GM).
�Manufactured using GM’s Global Manufacturing System
(GMS). Expected to become a long-selling model due to
low cost and maintenance of standard quality. MR layout.
�Entry price: 29,800 CNY
�Overall fuel consumption: 6.7–6.8L/100km
�Meets China 4 emission standards.
Wuling Sunshine
(First-gen 2002, stretched version 2007,
new version 2010)�
�Developed for family use. Built on a self-developed
FF-layout platform.
�Some grades feature Bosch-made ESP and GPS navigation
system.
�Entry price: 69,800 CNY
�Overall fuel consumption: 7.1–7.6L/100km
�Meets China 4 and China 5 emission standards.�
Complete upgrade of the Wuling Hongguang S
�Developed tailored to user needs. Intended to be used
for business on weekdays and for family outings on
holidays. FR layout.
�Entry price: 43,800 CNY
�Overall fuel consumption: 6.8–7.3L/100km
�Meets China 4 and China 5 emission standards.
Weiwang M20
(Oct. 2013)
Eulove
(Apr. 2013)
Honor
(First-gen Feb. 2012, Minor change Jul. 2014)
Changan Star 2
(First-gen 2007, minor change 2012)
Eulove X6
(2015 plan)
Variant model Eulove X6.
� Built on self-developed multipurpose
vehicle platform.
�FR layout
�Nov. 2014: Launched an upper grade
version called Jinounuo.
�Entry price: 39,800 CNY
�Meets China 4 emission standards.
�Intended for young consumers.
�Designed at the Turin design center in
Italy. Engineers who designed Changan
Suzuki’s Wagon R+ participated in design
work.
�FF layout. Powered by a self-developed
engine called E-Power.
�Jun. 2014: Launched an AT version.
�Entry price: 39,800 CNY
�Meets China 4 emission standards.
Weiwang 205
(Nov. 2012)
Weiwang 306
(Mar. 2011)
Huansu H2
(Jan. 2015 plan)
�1.0L/1.2L/1.3L engine.
�MR layout
�Entry price: 31,800 CNY. Price drops to
29,800 CNY if large quantity is purchased.
�Overall fuel consumption: 7.9L/100km
�Meets China 4 emission standards.
�Intended for family use.
�FR layout
�Price: 44,800 CNY with 1.5L VVT engine.
Approx. 4,000 CNY less than the Changan
Honor which is also powered by a VVT
engine.
�Meets China 4 and China 5 emission
standards.
Based on the Weiwang M20
�Weiwang brand’s second model.
� Powered by 1.0L and 1.3L (stretched
version only).
�MR layout
�Entry price: 29,800 CNY
�Overall fuel consumption: 7.3L/100km
�Meets China 4 emission standards.
Notes: Fuel consumption data and emission standard level information are those of each automaker. Fuel consumption figures of Changan models and BAIC’s Weiwang M20 are yet to be announced.
(Created using company PR materials and various media sources)
�FR layout. 7-seater.
�DVVT engine is combined with a 6-speed AMT.
�1.4L engine combined with five-speed AMT.
�1.0L/1.3L engine. Engine (JL474Q) was
developed based on Suzuki’s G engine.
�MR layout
� Entry price: 31,900 CNY. However,
some dealerships reduce price as low as
27,900 CNY.
�Meets China 3 and China 4 emission
standards.

���������� ��� ���� ��������
����� ����� �!"#$%����
FOURIN Asia Automotive Intelligence
China: MPV Business Trends (As of Jan. 2015)
Automaker Subject Details
Guangqi Honda Launch of New Odyssey
�Aug. 2014: Launched the New Odyssey. Intended for middle income class.
–The New Odyssey is mass manufactured model based on the Concept-M which was exhibited at the Shanghai auto
show in Apr. 2013. Compared to the old model, wheelbase is 70mm longer and height is 125mm higher.
–Sold for 229,800–299,800 CNY. The 2.4L i-VTEC engine is combined with CVT. Idling stop system is standard
equipment. Fuel efficiency is 7.8L/100km in NEDC mode.
Zhengzhou Nissan
Launch of NV200’s CVT
version
�Feb. 2014: Launched the CVT version of the NV200. The HR16D engine is combined with Xtronic CVT. Sold for
114.800–133,900 CNY. Fuel efficiency is 7.1L/100km.
Launch of Succe HR16
�Jul. 2014: Launched the Succe HR16. Sold for 86,800–91,800 CNY. The powertrain consists of Nissan’s H16
engine and JR5 series transmission. Fuel efficiency is 7.0L/100km.
–Built on the Peugeot 307’s platform.
Dongfeng Peugeot
Citroën
MPV production plan
�End of 2016: Chengdu Plant No. 4 is scheduled to be completed where MPVs are planned to be manufactured.
–The facility mainly manufactures SUVs and MPVs.
–The EMP2 modular platform is planned to be introduced. FOURIN predicts that the Citroën C4 Picasso is planned
to be manufactured at the plant.
Fujian Benz
Product plan
�Sales target for 2014 was set at 15,000 units. Plans to shift target focus from business to families.
�Advances the VS20 project that is intended to introduce the new Viano which was already on the market in Europe
as of Nov. 2014. Sales are projected to start in 2015.
Establishment of R&D center
�Mar. 2013: Daimler’s first overseas commercial vehicle R&D center formally began operations.
–Total investment was 500 million CNY. Has a test course and electromagnetic compatibility laboratory among
other facilities. Engaged in design, finished vehicle testing, parts measurement and other activities. Data are
shared with Daimler’s main R&D center.
Changan
Automobile
Product plan
�Jun. 2014: According to Yang Dayong, the deputy general manager of Changan Commercial Vehicle Business
Division, the division plans to launch a variant MPV model of the Eulove with longer wheelbase and seven seats.
–Jun. 2014: Launched the Eulove’s AMT version. Also had plans to release the 1.0L turbo engine version in the
second half of 2014.
–Nov. 2014: Unveiled the Eulove X6, a variant SUV model built on the Eulove’s platform at the Guangzhou auto
show. Planned to be manufactured at the Nanjing plant.
�Nov. 2014: Launched the Jinounuo. Sold for 58,900–66.900 CNY. Intended for suburban users for both business
and family purposes.
�The Eulove was designed by both Chinese and Western designers. Overall fuel consumption is 6.4L/100km.
Production capacity
�As of Nov. 2014: Annual production capacity of the Eulove and Honor stood at 80,000 units and 150,000 units
respectively.
BAIC
Launch plan of first MPV model
�Jan. 2015: Plans to launch its first SUV model the Huansu H2.
–The Huansu H2 was developed based on the Weiwang M20. Measures 4,520mm in length. The 1.5L engine is
combined with a 6-speed AMT. Came off the line at BAIC’s Xinan plant in Dec. 2014.
–Dec. 2014: According to local media sources, development of the Huansu H2 took two years.
Sales plan of Weiwang brand
�Oct. 2014: Sales target of the Weiwang brand was set at 200,000 units for 2014 and at 300,000 units for 2015. In
2015, full-model change of the Weiwang M20 and Weiwang 306 is planned.
�Oct. 2014: By the end of the year, the sales network is planned to be expanded to 300 first-grade dealers, 700
satellite stores and 1,000 stores with other affiliations.
�The Weiwang M20, which was launched in Oct. 2013, received electric power steering.
Online sales promotion of
Weiwang brand
�Dec. 2014: In order to commemorate the sale of the 300,000th Weiwang brand model, BAIC put on sale one unit of
a special edition model on online retail website Tmall.com.
–Oct. 2014: According to the company, BAIC opened a flagship store on Tmall.com on Sep. 19, 2014 and sold 215
units in the first month.
�Sep. 2014: According to a company announcement, BAIC began special sales for a limited time on online retail site
Yiche.com from Jul. 2014. Within 40 days, approx. 5,000 units of the Weiwang brand was sold on Yiche.com.
SAIC-GM-Wuling
Launch of Wuling Zhengcheng
�Dec. 2014: Launched its first MPV model called Zhengcheng under the Wuling brand.
–The nine-seater MPV, measures 5,090mm in height and has a wheelbase of 3,205mm. The 1.8L engine is
combined with a five-speed MT. A seven-seater version with a 1.5L engine was simultaneously launched.
–According to local media sources, the MPV version was launched due to apparently strong demand for automobiles
which can be used for both cargo and passenger transport. The decision is based on the automaker’s own research.
Launch of Wuling Hongguang
in India
�2013: Launched as the Chevrolet Enjoy in India. SAIC-GM-Wuling’s development team tailored the model to local
market needs. Converted to right-hand-drive use. Made available for both gasoline and diesel use.
Launch plan of Wuling
Hongguang V
�Early 2015: The Wuling Hongguang V is scheduled to be launched. Intended for business use. Available in both
diesel and gasoline versions.
Launch of Baojun 730
�Jul. 2014: Launched the Baojun 730. The seven-seater C–MPV is built on a self-developed FF-layout platform.
–Sales target for 2014 was set at 120,000 units. (Factory shipment volume of YTD Nov. 2014 was 89,000 units
according to data by China Association of Automobile Manufacturers).
–Added the ESP-equipped version (entry price 75,800 CNY) and the ESP / GPS-equipped version (82,800 CNY) in
Nov. 2014. Both powered by a 1.5L engine. The luxury version with 1.8L VVT-i Tech engine (89.800 CNY) was
released in Jan. 2015.
–Baojun’s first SUV brand, which is scheduled to be launched in 2015, will be built on the Baojun 730’s platform.
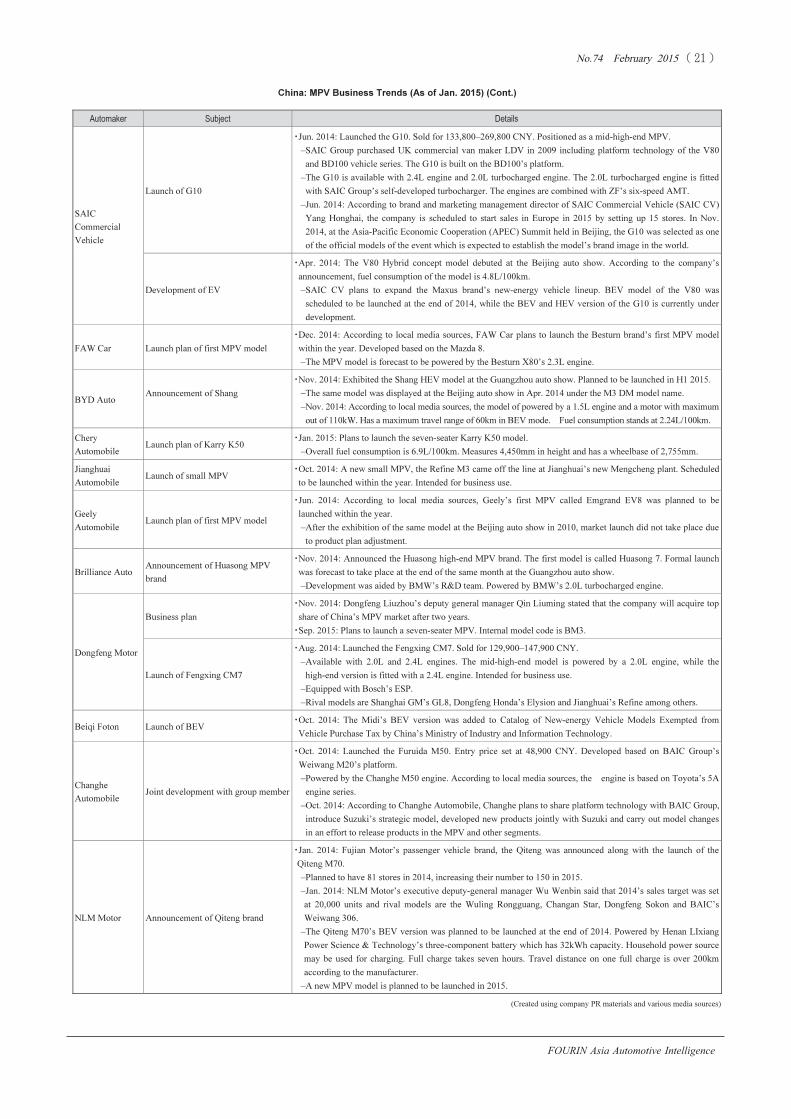
���������� ��� ���� ��������
����� ����� �!"#$%����
FOURIN Asia Automotive Intelligence
China: MPV Business Trends (As of Jan. 2015) (Cont.)�
Automaker Subject Details
SAIC
Commercial
Vehicle
Launch of G10
�Jun. 2014: Launched the G10. Sold for 133,800–269,800 CNY. Positioned as a mid-high-end MPV.
–SAIC Group purchased UK commercial van maker LDV in 2009 including platform technology of the V80
and BD100 vehicle series. The G10 is built on the BD100’s platform.
–The G10 is available with 2.4L engine and 2.0L turbocharged engine. The 2.0L turbocharged engine is fitted
with SAIC Group’s self-developed turbocharger. The engines are combined with ZF’s six-speed AMT.
–Jun. 2014: According to brand and marketing management director of SAIC Commercial Vehicle (SAIC CV)
Yang Honghai, the company is scheduled to start sales in Europe in 2015 by setting up 15 stores. In Nov.
2014, at the Asia-Pacific Economic Cooperation (APEC) Summit held in Beijing, the G10 was selected as one
of the official models of the event which is expected to establish the model’s brand image in the world.
Development of EV
�Apr. 2014: The V80 Hybrid concept model debuted at the Beijing auto show. According to the company’s
announcement, fuel consumption of the model is 4.8L/100km.
–SAIC CV plans to expand the Maxus brand’s new-energy vehicle lineup. BEV model of the V80 was
scheduled to be launched at the end of 2014, while the BEV and HEV version of the G10 is currently under
development.
FAW Car Launch plan of first MPV model
�Dec. 2014: According to local media sources, FAW Car plans to launch the Besturn brand’s first MPV model
within the year. Developed based on the Mazda 8.
–The MPV model is forecast to be powered by the Besturn X80’s 2.3L engine.
BYD Auto
Announcement of Shang
�Nov. 2014: Exhibited the Shang HEV model at the Guangzhou auto show. Planned to be launched in H1 2015.
–The same model was displayed at the Beijing auto show in Apr. 2014 under the M3 DM model name.
–Nov. 2014: According to local media sources, the model of powered by a 1.5L engine and a motor with maximum
out of 110kW. Has a maximum travel range of 60km in BEV mode. Fuel consumption stands at 2.24L/100km.
Chery
Automobile
Launch plan of Karry K50
�Jan. 2015: Plans to launch the seven-seater Karry K50 model.
–Overall fuel consumption is 6.9L/100km. Measures 4,450mm in height and has a wheelbase of 2,755mm.
Jianghuai
Automobile
Launch of small MPV
�Oct. 2014: A new small MPV, the Refine M3 came off the line at Jianghuai’s new Mengcheng plant. Scheduled
to be launched within the year. Intended for business use.
Geely
Automobile
Launch plan of first MPV model
�Jun. 2014: According to local media sources, Geely’s first MPV called Emgrand EV8 was planned to be
launched within the year.
–After the exhibition of the same model at the Beijing auto show in 2010, market launch did not take place due
to product plan adjustment.
Brilliance Auto
Announcement of Huasong MPV
brand
�Nov. 2014: Announced the Huasong high-end MPV brand. The first model is called Huasong 7. Formal launch
was forecast to take place at the end of the same month at the Guangzhou auto show.
–Development was aided by BMW’s R&D team. Powered by BMW’s 2.0L turbocharged engine.
Dongfeng Motor
Business plan
�Nov. 2014: Dongfeng Liuzhou’s deputy general manager Qin Liuming stated that the company will acquire top
share of China’s MPV market after two years.
�Sep. 2015: Plans to launch a seven-seater MPV. Internal model code is BM3.
Launch of Fengxing CM7
�Aug. 2014: Launched the Fengxing CM7. Sold for 129,900–147,900 CNY.
–Available with 2.0L and 2.4L engines. The mid-high-end model is powered by a 2.0L engine, while the
high-end version is fitted with a 2.4L engine. Intended for business use.
–Equipped with Bosch’s ESP.
–Rival models are Shanghai GM’s GL8, Dongfeng Honda’s Elysion and Jianghuai’s Refine among others.
Beiqi Foton Launch of BEV
�Oct. 2014: The Midi’s BEV version was added to Catalog of New-energy Vehicle Models Exempted from
Vehicle Purchase Tax by China’s Ministry of Industry and Information Technology.
Changhe
Automobile
Joint development with group member
�Oct. 2014: Launched the Furuida M50. Entry price set at 48,900 CNY. Developed based on BAIC Group’s
Weiwang M20’s platform.
–Powered by the Changhe M50 engine. According to local media sources, the engine is based on Toyota’s 5A
engine series.
–Oct. 2014: According to Changhe Automobile, Changhe plans to share platform technology with BAIC Group,
introduce Suzuki’s strategic model, developed new products jointly with Suzuki and carry out model changes
in an effort to release products in the MPV and other segments.
NLM Motor Announcement of Qiteng brand
�Jan. 2014: Fujian Motor’s passenger vehicle brand, the Qiteng was announced along with the launch of the
Qiteng M70.
–Planned to have 81 stores in 2014, increasing their number to 150 in 2015.
–Jan. 2014: NLM Motor’s executive deputy-general manager Wu Wenbin said that 2014’s sales target was set
at 20,000 units and rival models are the Wuling Rongguang, Changan Star, Dongfeng Sokon and BAIC’s
Weiwang 306.
–The Qiteng M70’s BEV version was planned to be launched at the end of 2014. Powered by Henan LIxiang
Power Science & Technology’s three-component battery which has 32kWh capacity. Household power source
may be used for charging. Full charge takes seven hours. Travel distance on one full charge is over 200km
according to the manufacturer.
–A new MPV model is planned to be launched in 2015.
(Created using company PR materials and various media sources)
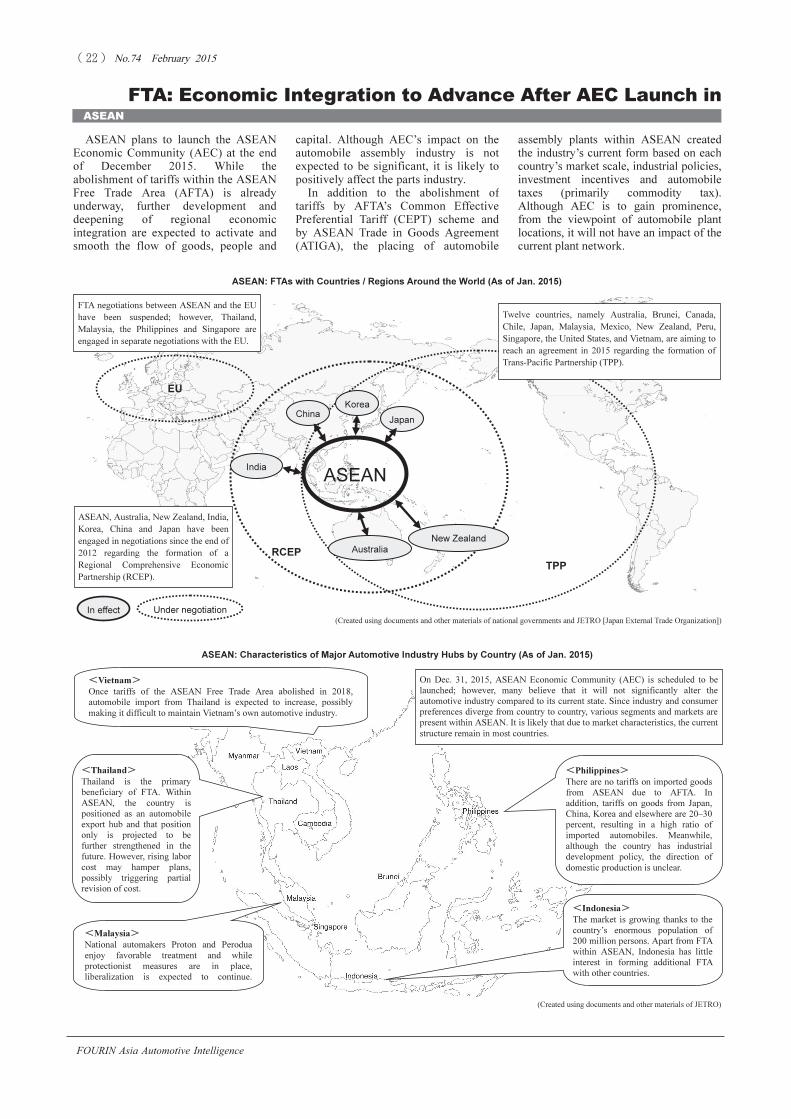
���������� ��� ���� ��������
����� ����� �!"#$%����
FOURIN Asia Automotive Intelligence
RCEP
ASEAN plans to launch the ASEAN
Economic Community (AEC) at the end
of December 2015. While the
abolishment of tariffs within the ASEAN
Free Trade Area (AFTA) is already
underway, further development and
deepening of regional economic
integration are expected to activate and
smooth the flow of goods, people and
� � � FTA: Economic Integration to Advance After AEC Launch in
ASEAN
assembly plants within ASEAN created
the industry’s current form based on each
country’s market scale, industrial policies,
investment incentives and automobile
taxes (primarily commodity tax).
Although AEC is to gain prominence,
from the viewpoint of automobile plant
locations, it will not have an impact of the
current plant network.
capital. Although AEC’s impact on the
automobile assembly industry is not
expected to be significant, it is likely to
positively affect the parts industry.
In addition to the abolishment of
tariffs by AFTA’s Common Effective
Preferential Tariff (CEPT) scheme and
by ASEAN Trade in Goods Agreement
(ATIGA), the placing of automobile
ASEAN: FTAs with Countries / Regions Around the World (As of Jan. 2015)
� � � � � � � � � � � � � � � � � � (Created using documents and other materials of JETRO)
�
�
�
�
�
�
�
�
TPP
(Created using documents and other materials of national governments and JETRO [Japan External Trade Organization])
ASEAN: Characteristics of Major Automotive Industry Hubs by Country (As of Jan. 2015)
FTA negotiations between ASEAN and the EU
have been suspended; however, Thailand,
Malaysia, the Philippines and Singapore are
engaged in separate negotiations with the EU.�
In effect Under negotiation
ASEAN
Japan
China
Twelve countries, namely Australia, Brunei, Canada,
Chile, Japan, Malaysia, Mexico, New Zealand, Peru,
Singapore, the United States, and Vietnam, are aiming to
reach an agreement in 2015 regarding the formation of
Trans-Pacific Partnership (TPP).�
EU
�Vietnam�
Once tariffs of the ASEAN Free Trade Area abolished in 2018,
automobile import from Thailand is expected to increase, possibly
making it difficult to maintain Vietnam’s own automotive industry.�
�Thailand�
Thailand is the primary
beneficiary of FTA. Within
ASEAN, the country is
positioned as an automobile
export hub and that position
only is projected to be
further strengthened in the
future. However, rising labor
cost may hamper plans,
possibly triggering partial
revision of cost.�
�Philippines�
There are no tariffs on imported goods
from ASEAN due to AFTA. In
addition, tariffs on goods from Japan,
China, Korea and elsewhere are 20–30
percent, resulting in a high ratio of
imported automobiles. Meanwhile,
although the country has industrial
development policy, the direction of
domestic production is unclear.
�Indonesia�
The market is growing thanks to the
country’s enormous population of
200 million persons. Apart from FTA
within ASEAN, Indonesia has little
interest in forming additional FTA
with other countries.�
�Malaysia�
National automakers Proton and Perodua
enjoy favorable treatment and while
protectionist measures are in place,
liberalization is expected to continue.
On Dec. 31, 2015, ASEAN Economic Community (AEC) is scheduled to be
launched; however, many believe that it will not significantly alter the
automotive industry compared to its current state. Since industry and consumer
preferences diverge from country to country, various segments and markets are
present within ASEAN. It is likely that due to market characteristics, the current
structure remain in most countries.�
Australia
Korea
ASEAN, Australia, New Zealand, India,
Korea, China and Japan have been
engaged in negotiations since the end of
2012 regarding the formation of a
Regional Comprehensive Economic
Partnership (RCEP).�
India
New Zealand

���������� ��� ���� ��������
����� ����� �!"#$%����
FOURIN Asia Automotive Intelligence
Asia Country Reports
2015, Possibly Triggering Reorganization of Parts Industry
In contrast, AEC is expected to benefit
the automobile parts industry. Within
ASEAN, in line with the advancement of
economic integration, the construction of
trunk roads is underway primarily in the
Mekong region. As a result, it is likely
that the production system will be
restructured with wage differences
among various regions on mind. More
concretely, it is possible that some parts
2018. As a result, product variety of
primarily imported models is expected to
increase in Vietnam, while prices are
projected to decline. This new
environment will bring about severe
conditions for local automobile assembly
bases and will reduce tax revenues as
well as result in trade deficit for the
country, on the other hand, it will benefit
consumers. (Gangbok LEE)
manufacturing processes will be
transferred from Thailand to Vietnam,
Cambodia and Laos, a trend which will
be further aided by AEC.
Looking at the trade environment
apart from AEC, import tariffs on
automobiles from within the region are
scheduled to be abolished in the four
new members of ASEAN (Cambodia,
Laos, Myanmar, Vietnam) in January
FTA: Free Trade Agreement. EPA: Economic Partnership Agreement. CEPA: Comprehensive Economic Partnership Agreement. CECA: Comprehensive Economic Cooperation Agreement. EH: Early
Harvest. (Created using documents of national governments and JETRO, and various media and other sources)
ASEAN: Outline of FTAs (As of Jan. 2015)
Progress
Status
Other Party/ies Name Notes
Progress
Status
Other Party/ies Name Notes
�ASEAN� �Malaysia (cont.)
Activated
ASEAN (all members) AFTA
�Jan. 1993: Activated by the six
advanced members.
�Jan. 2010: ATIGA was launched.
Four new members will abolish
tariffs in 2015.
Activated
(cont.)
Pakistan MPFTA
�Jan. 2006: Activated EH.
�Jan. 2008: Activated MPFTA
(main FTA).
Japan AJCEP �Dec. 2008: Activated. Australia MAFTA �Jan. 2013: Activated.
China ACFTA �Jan. 2005: Activated. New Zealand MNZFTA �Aug. 2010: Activated.
Korea AKFTA �Jun. 2007: Activated. Chile MCFTA �Apr. 2012: Activated.
India AIFTA �Jan. 2010: Activated. Under
negotiations
Turkey MTFTA �May 2010: Began negotiations.
Australia, New Zealand AANZFTA �Jan. 2010: Activated. EU MEUFTA �Dec. 2010: Began negotiations.
Pacific Rim countries(Singapore,
Brunei, Chile, New Zealand, etc.)
Trans-
Pacific SEP
�May 2006: Activated.
Under
consideration
Korea -
�Dec. 2012: Concluded joint
study.
Under
negotiations
ASEAN, Japan, China, Korea,
Australia, New Zealand, India
RECP
(ASEAN+6)
�Nov. 2012: Announced start of
negotiations.
Bangladesh -
�As of 2012: Start of negotiations
under discussion.
Pacific Rim countries(Singapore,
Brunei, Chile, New Zealand, etc.)
TPP �Mar. 2010: Began negotiations. �Philippines
Negotiations
discontinued
EU -
�Mar. 2009: Discontinued
negotiations.
Activated
Japan JPEPA �Dec. 2008: Activated.
China EH �Jan. 2006: Activated.
�Thailand �Vietnam
Activated
Japan JTEPA �Nov. 2007: Activated. Activated Japan JVEPA �Oct. 2009: Activated.
China EH �Oct. 2003: Activated. Concluded
negotiations
Korea KVFTA
�Dec. 2014: Concluded
negotiations. India EH �Sep. 2004: Activated.
Australia TAFTA �Jan. 2005: Activated. Signed Chile VCFTA �Nov. 2011: Signed.
New Zealand TNZCEP �Jul. 2005: Activated. Under
negotiations
EU EVFTA �Jun. 2012: Began negotiations.
Peru TPCEP �Nov. 2011: Activated.
Under
negotiations
India TIFTA
�Jan. 2012: Concluded negotiations of a
comprehensive FTA which covers
goods, services and investment;
however, it is yet to be signed.
Under
consideration
EFTA -
�Jul. 2012: Reached an agreement
to start negotiations.
Chile TCFTA �Apr. 2011: Began negotiations. Russia, Belarus,
Kazakhstan
-
�Aug. 2012: Reached an agreement
to start negotiations.
Negotiations
discontinued
US - �2006: Discontinued negotiations.
EFTA -
�Sep. 2006: Discontinued
negotiations.
�Singapore
Under
consideration
Pakistan -
�As of 2012: Start of negotiations
under discussion.
Activated
Japan JSEPA �Nov. 2002: Activated.
EU -
�As of 2012: Start of negotiations
under discussion.
China CSFTA �Jan. 2009: Activated.
�Indonesia�
Korea KSFTA �Mar. 2006: Activated.
India ISCECA �Aug. 2005: Activated.
Activated
Japan JIEPA �Jul. 2008: Activated.
Australia SAFTA �Jul. 2003: Activated.
China EH �Jul. 2004: Activated.
Under
negotiations
Korea - �Jul. 2012: Began negotiations. New Zealand ANZSCEP �Jan. 2001: Activated.
Pakistan -
�Feb. 2012: Reached agreement on
preferential duties.
Jordan SJFTA �Aug. 2005: Activated.
EFTA - �Jul. 2010: Began negotiations. US USSFTA �Jan. 2004: Activated.
Under
consideration
India -
�Oct. 2011: Began negotiations
toward concluding CEPA.
Panama PSFTA �Jul. 2006: Activated.
Peru PeSFTA �Aug. 2009: Activated.
EU -
�As of 2012: Start of negotiations
under discussion.
EFTA ESFTA �Jan. 2003: Activated.
Signed Costa Rica SCRFTA �Apr. 2010: Signed.
�Malaysia
Concluded
negotiations
GCC GSFTA �Dec. 2008: Reached an agreement.
EU EUSFTA �Dec. 2012: Reached an agreement.
Activated
Japan JMEPA �Jul. 2006: Activated.
�Brunei�
China EH �Mar. 2004: Activated.
India IMCECA �Jul. 2011: Activated. Activated Japan JBEPA �Jul. 2008: Activated.
�

���������� ��� ���� ��������
����� ����� �!"#$%����
FOURIN Asia Automotive Intelligence
Motorcycle sales volume in ten Asian
countries is forecast to increase four
percent in 2014 from the previous year to
over 30 million units. While Vietnam
and Thailand are expected to see
double-digit drop, top-selling India and
Indonesia are seen as drivers of sales.
Overall, Asia is expected to reach a new
historic high.
� � � Motorcycle Market: Sales Up 4 Percent to 30 Mn Units in
Asia 10
Indonesia is forecast to increase 4.2
percent to 8.07 million units, registering
positive growth for the first time since
loan restrictions were enhanced on
motorcycle sales in 2012. Sales were dull
due to supply disruptions as a result of
floods and other causes in the beginning
of 2014; however, volume increased to as
high as over 700,000 units in several
In India, rising purchase willingness
after the inauguration of the new
government is forecast to boost sales 10.7
percent to 15.9 million units in 2014 and
market growth is expected to remain at
8–9 percent, prompting manufacturers to
actively invest in production increase. In
2015, for the first time, sales volume is
projected to surpass 17 million units.
(Created using various media sources)
Country Details
India
The growing middle class, triggered by improving income and employment, and rising purchase willingness after the inauguration of the new government
resulted in double-digit increase since Mar. 2014. Volume is driven by scooter sales. Manufacturers are actively investing in order to boost production. An
average of 8–9 percent increase is expected in the future as well. The strengthening of emission regulations are expected to be postponed to 2016 or after.
Pakistan
Ownership volume stands at 45 units per 1,000 persons which is low even by Asian standard; therefore, potential market growth is high. Local production has
been set up by Honda, Suzuki as well as by Indian, Chinese and other manufacturers. Yamaha plans to start production in 2015 with an annual scale of 40,000
units, which is planned to be increased to 300,000–400,000 units by 2020.
Taiwan
In 2014, the economy changed for the better, improving employment situation which in turn enhances consumer confidence. While ownership volume dropped for
the third consecutive year in 2014 and the motorcycle market appears to be saturated, new motorcycle sales are forecast to slightly increase in 2015.
Korea
There has been active demand for leisure-oriented products in recent years. Market share of Honda, Suzuki, BMW and other imported products is on the rise.
Overall demand is sluggish due to the economic downturn. Sales volume in 2015 is forecast to be on par with that of 2014.
Indonesia
Although rising interest rates and production cost were cause for concern, 2014 sales volume is forecast to exceed 8.01 million units, setting an historic high.
Honda was scheduled to launch a new plant in 2014. Despite the economic downturn, there is strong demand for motorcycles thanks to their low cost and easy
means of transportation. As a result, market expansion is expected to continue in the future as well. Fuel prices were increased in Nov. 2014.
Vietnam
Due to economic downturn and market saturation in cities, sales volume in 2014 declined. The government is aiming to restrict motorcycle ownership volume.
While the economic slowdown is expected to continue in 2015 as well, it appears that there is room for growth in regional markets and for automatic models.
Honda commenced operation of a new plant in Nov. 2014 with annual production capacity of 500,000 units.
Thailand
The market was sluggish in 2014 due to political instability. Although Yamaha and Honda forecast in the beginning of 2014 that full-year volume would reach
1.8 million–1.85 million units, now it is likely that it will drop below 1.7 million units. In 2015, although these are risks, economic recovery is expected to push
up volume to the 1.8 million-unit level.
Philippines
Motorcycle Development Program Participants Association (MDPPA) projects that annual increase between 2013 and 2015 is to reach 10 percent. While
ownership volume is low compared to Vietnam, Indonesia, Malaysia and Thailand, rising income and urbanization are expected to boost volume.
�
Asia (Eight Countries): Motorcycle Market Overview/Projections (2014/2015)
Notes: Vietnam data for 2009–2013 are from Yamaha’s PR materials. Korea data for 2009 is from Honda’s PR materials and for 2010–2013 are from Korea Motorcycle Industry Association (KoMIA).
Forecasts and projections are by FOURIN. (Created using data from national automotive industry associations and other sources)
Asia (10 Countries): Motorcycle Sales Volume by Region and Country (Actual 2009–2013, Forecast 2014, Projection 2015)
Asia (10 Countries): Motorcycle Sales Volume by Country
(Actual 2009–2013, Forecast 2014, Projection 2015)
� (Created using data from national automobile and motorcycle industry associations) � (Created using data from national automobile and motorcycle industry associations)
Asia (Four Countries): Motorcycle Sales Volume by Country
(Actual 2009–2013, Forecast 2014, Projection 2015)
(Units)
Region Country 2009 2010 2011 2012 2013 2014 Year-on-year 2015 Year-on-year
India 8,645,378 11,265,587 13,064,449 13,816,956 14,357,743 15,900,000 10.7% 17,200,000 8.2%
Pakistan 583,582 744,290 827,824 784,431 758,422 708,000 ▼6.6% 740,000 4.5%
Indonesia 5,851,962 7,372,989 8,012,540 7,064,457 7,743,879 8,069,000 4.2% 8,470,000 5.0%
Vietnam 2,745,000 3,070,000 3,562,000 3,109,000 2,793,000 2,430,000 ▼13.0% 2,500,000 2.9%
Thailand 1,535,461 1,845,997 2,007,384 2,130,067 2,004,498 1,740,000 ▼13.2% 1,800,000 3.4%
Philippines 756,227 759,849 731,130 702,599 752,835 828,000 10.0% 915,000 10.5%
Malaysia 433,681 468,175 494,586 537,753 546,719 470,000 ▼14.0% 450,000 ▼4.3%
Singapore 8,958 8,316 8,092 9,923 11,671 8,700 ▼25.5% 9,200 5.7%
Taiwan 478,268 541,485 639,615 606,615 645,439 685,000 6.1% 680,000 ▼0.7%
Korea 83,122 89,228 77,034 75,534 70,196 68,500 ▼2.4% 67,800 ▼1.0%
21,121,639 26,165,916 29,424,654 28,837,335 29,684,402 30,907,200 4.1% 32,832,000 6.2%
South Asia
ASEAN
East Asia
Motorcycle sales total
0
2
4
6
8
10
12
14
16
18
20
India Indonesia Vietnam Thailand
(Million units)
2009 2010 2011 2012 2013 2014 2015
India
Indonesia
Vietnam
Thailand
Other
0
5
10
15
20
25
30
35
2009 2010 2011 2012 2013 2014 2015
(Million units)
21.12
26.17
29.4228.84
29.68
30.91
32.83

���������� ��� ���� ��������
����� ����� �!"#$%����
FOURIN Asia Automotive Intelligence
Asia Country Reports
2014; Volume Is Forecast to Reach 32 Mn Units 2015
months starting from March.
Vietnam is forecast to drop 13 percent
to 2.43 million units. Sales are projected
to stagnate in 2015 as well due to
economic slowdown and market
saturation in cities. However, there is
room for growth for AT and other models,
prompting Honda to enhance supply
structure. In November 2014, a new plant,
set up exclusively for AT models,
Philippines’ Motorcycle Development
Program Participants Association
(MDPPA) projects that annual increase
between 2013 and 2015 is to reach 10
percent. Pakistan is expected to decline
6.6 percent to 708,000 units. Yamaha
predicts growth in Pakistan for 2015 and
is planning to restart local production
with an annual scale of 40,000 units.
(Kiyoko YAMAMOTO)
commenced operation with annual
production capacity of 500,000 units in
anticipation of growing demand.
Elsewhere, Thailand is forecast to
decline 13.2 percent to 1.74 million units
mainly due to political instability.
Economic recovery is expected in 2015,
returning volume to the 1.8 million-unit
level. The Philippines is expected to go up
10 percent to 830,000 units. The
Asia (Eight Countries): Motorcycle Sales Volume by Country (Jan. 2013–Oct. 2014)
Notes: Growth rate of 2014 for India, Indonesia, Thailand, Pakistan and Taiwan is that of YTD Oct. 2014. Growth rate of 2014 for the Philippines, Malaysia and Singapore is that of YTD Sep. 2014.
(Created using data from national automotive industry associations and equivalent organizations)
(Units)
2013 2014 Month-on-month 2013 2014 Month-on-month 2013 2014 Month-on-month
Jan 1,206,937 1,313,796 8.9% 646,082 579,361 ▼ 10.3% 180,256 125,605 ▼ 30.3%
Feb 1,112,289 1,220,012 9.7% 649,434 679,086 4.6% 177,736 150,163 ▼ 15.5%
Mar 1,101,058 1,334,214 21.2% 665,334 725,629 9.1% 191,076 156,029 ▼ 18.3%
Apr 1,168,080 1,304,447 11.7% 658,673 727,790 10.5% 169,033 131,147 ▼ 22.4%
May 1,206,173 1,402,830 16.3% 644,668 739,511 14.7% 189,537 155,814 ▼ 17.8%
Jun 1,116,424 1,261,589 13.0% 659,504 750,829 13.8% 190,336 158,991 ▼ 16.5%
Jul 1,131,992 1,287,462 13.7% 702,423 534,490 ▼ 23.9% 176,863 160,805 ▼ 9.1%
Aug 1,128,598 1,345,506 19.2% 488,983 609,198 24.6% 163,558 143,236 ▼ 12.4%
Sep 1,265,704 1,567,351 23.8% 675,902 706,938 4.6% 151,701 142,816 ▼ 5.9%
Oct 1,516,291 1,461,712 ▼ 3.6% 714,264 675,652 ▼ 5.4% 148,900 135,900 ▼ 8.7%
Nov 1,240,732 - - 687,329 - - 138,750 - -
Dec 1,163,465 - - 551,283 - - 126,752 - -
Total 14,357,743 13,498,919 12.9% 7,743,879 6,728,484 3.4% 2,004,498 1,460,506 ▼ 16.0%
2013 2014 Month-on-month 2013 2014 Month-on-month 2013 2014 Month-on-month
Jan 65,433 66,823 2.1% 47,106 60,409 28.2% 46,054 50,044 8.7%
Feb 61,081 58,645 ▼ 4.0% 56,758 65,539 15.5% 31,237 45,301 45.0%
Mar 70,124 63,526 ▼ 9.4% 61,866 76,509 23.7% 52,502 62,991 20.0%
Apr 62,780 57,678 ▼ 8.1% 50,531 55,413 9.7% 55,467 60,893 9.8%
May 64,543 60,690 ▼ 6.0% 67,508 63,516 ▼ 5.9% 60,363 58,483 ▼ 3.1%
Jun 63,707 57,881 ▼ 9.1% 70,624 68,631 ▼ 2.8% 56,170 56,642 0.8%
Jul 64,762 52,955 ▼ 18.2% 63,534 55,398 ▼ 12.8% 69,997 67,347 ▼ 3.8%
Aug 60,581 52,695 ▼ 13.0% 60,931 62,179 2.0% 67,351 59,401 ▼ 11.8%
Sep 61,697 54,499 ▼ 11.7% 66,686 61,442 ▼ 7.9% 67,401 64,826 ▼ 3.8%
Oct 64,812 59,255 ▼ 8.6% 62,655 N.A. - 55,064 56,202 2.1%
Nov 60,345 - - 68,902 - - 48,369 - -
Dec 58,091 - - 75,734 - - 35,464 - -
Total 757,956 584,647 ▼ 8.6% 752,835 569,036 4.3% 645,439 582,130 3.7%
2013 2014 Month-on-month 2013 2014 Month-on-month 2013 2014 Month-on-month
Jan 51,816 34,230 ▼ 33.9% 945 1,017 7.6% 2,244,629 2,231,285 ▼ 0.6%
Feb 30,706 29,278 ▼ 4.7% 792 729 ▼ 8.0% 2,120,033 2,248,753 6.1%
Mar 43,343 40,946 ▼ 5.5% 1,030 597 ▼ 42.0% 2,186,333 2,460,441 12.5%
Apr 50,366 42,652 ▼ 15.3% 976 576 ▼ 41.0% 2,215,906 2,380,596 7.4%
May 51,815 41,482 ▼ 19.9% 1,028 588 ▼ 42.8% 2,285,635 2,522,914 10.4%
Jun 51,274 40,056 ▼ 21.9% 872 619 ▼ 29.0% 2,208,911 2,395,238 8.4%
Jul 54,133 34,587 ▼ 36.1% 1,128 711 ▼ 37.0% 2,264,832 2,193,755 ▼ 3.1%
Aug 39,302 38,486 ▼ 2.1% 936 689 ▼ 26.4% 2,010,240 2,311,390 15.0%
Sep 42,593 37,473 ▼ 12.0% 974 862 ▼ 11.5% 2,332,658 2,636,207 13.0%
Oct 45,418 N.A. - 953 N.A. - 2,608,357 2,388,721 ▼ 8.4%
Nov 44,058 - - 937 - - 2,289,422 - 0.0%
Dec 41,895 - - 1,079 - - 2,053,763 - -
Total 546,719 339,190 ▼ 18.3% 11,650 6,388 ▼ 26.4% 26,820,719 23,769,300 5.7%
Malaysia Singapore Asia (Eight Countries) Total
India Indonesia Thailand
Pakistan Philippines Taiwan

���������� ��� ���� ��������
����� ����� �!"#$%����
FOURIN Asia Automotive Intelligence
Locally Made Imported
FAW-VWFAW 60%, VW 30%,
Audi 10%Jan. 1999
FAW 60%, VW 30%, Audi
10%� VW, Audi Audi
Shanghai VW SAIC 50%, VW 50% Jul. 2000SAIC 50%, VW 30%,
Shanghai VW 20%� Škoda, VW
Nov. 2002 VW 100% �
VW, Škoda, SEAT,
Lamborghini,
Bentley, Bugatti
Oct. 2005 Porsche 100% � Porsche
Dongfeng Citroën May. 2012 Citroën
Dongfeng Peugeot May. 2012 Peugeot
Changan PSAChangan 50%,
PSA 50%Aug. 2013 � DS DS
Mar. 2006 � Citroën, Peugeot
Brilliance BMWBrilliance 50%,
BMW 50%May. 2003 � BMW, Zinoro
Sep. 2005 BMW 100% �Rolls-Royce, MINI,
BMW
Beijing BenzBAIC 51%,
Daimler 49%Dec. 2012 BAIC 49%, Daimler 51% � Benz
Sep. 2005Daimler 51%, Insight Legend
49%� Benz, SMART
GAC Fiat GAC 50%, Fiat 50%2015
(assumed)
GAC 50%, Fiat 50%
(assumed)�
Fiat, Jeep,
ChryslerFiat, Jeep, Chrysler
Aug. 2004 Ferrari, Poly Technology �Ferrari,
Maserati
Jun. 2010
Shanghai Geely Zhaoyuan
International Investment
100%
� Volvo
Aug. 2008 Volvo 100% � Volvo
Automaker
Volkswagen (China) Sales Co., Ltd.
VW
PSA
BMW
Fiat
Shanghai Volkswagen Sales Co., Ltd.
Zhongjia Automobile Manufacture (Shanghai)
Co., Ltd.
BMW China Automotive Trading Ltd.
Beijing Mercedes-Benz Sales Service Co., Ltd.
Sales
Headquarters
Volvo
Brands Handled
Established
�
Indep.
Corp.
Sales Department/Company
(Sales Headquarters)
FAW-VW Sales Co., Ltd.
Porsche (China) Automobile Sales Co., Ltd.
GAC Fiat Sales Co., Ltd.
(tentative name)
Changan Peugeot Citroen Automobile Co., Ltd.
Sales Branch Co.
BMW Brilliance Automotive Ltd. Sales Dep't.
Ferrari Maserati Cars International Trading
(Shanghai) Co., Ltd.
Volvo Car Sales (Shanghai) Co., Ltd.
Ownership
Peugeot Citroën (China) Automotive Trade Co.,
Dongfeng (DFG) 50%,
PSA 50%
Ownership
Dongfeng Peugeot
Citroën
Mercedes-Benz (China) Automotive Sales Co.,
Ltd.
Daimler
Zhejiang Haoqing Automobile Manufacturing
(Consignment production for Geely)
Automobile sales companies are set up
by automakers as independent corporations
in an effort to expand sales activity.
Although an in-house sales department can
function as a sales company, the true goal
of setting up a sales company for handling
locally-made automobiles in China is to
avoid taxes and to circumvent the
automobile manufacturing sector’s 50
� � � Automaker Sales Companies: Confrontation with Dealers Is
China
time of factory shipment, so
automaker-owned sales companies are
useful for selling products at a low price to
sales companies in an effort to reduce
taxes. For this reason, most Chinese
automakers have sales companies in order
to avoid high taxes. As for foreign
automakers, the emphasis is not on
reducing the tax burden with the
percent foreign ownership ceiling by
foreign automakers. Meanwhile, import
sales companies are set up to supply
imported automobiles and manage
dealerships based on the “Administration
of Automobile Brand Sales Implementing
Procedures” (Procedures) regulation which
was implemented in April 2005.
In China, consumption tax is paid at the
Notes: Created with focus on foreign automakers. Chery and BYD included for reference.
(Created using company PR materials, data from China’s SAIC [State Administration of Industry and Commerce] and various media sources)
China: Automobile Sales Divisions / Companies of Main Automakers (As of Jan. 2015)�
(Created using regulation called “Administration of Automobile Brand Sales Implementing Procedures” and various media sources)
Automaker
China: Automobile Distribution System
Locally-made automobile
Pattern 1� � � � � � � � � � � Pattern 2
Imported automobile
Investment Investment
Automaker/
General Distributor
Dealer
Regulation
“Administration of
Automobile Brand Sales
Implementing Procedures”
Actual System
Sales Sales Sales
Consumer
Sales
Issue
�Sales companies which represent the
automakers set high sales targets for
dealers. During sluggish market
growth, dealer inventory increases and
even if prices are lowered sales targets
are not met, worsening cash flow and
earnings of dealers.
Automakers’ response
�BMW: Began providing subsidies to
dealers from 2012. Agreed to pay 5.1
billion CNY as subsidy to dealers in
Jan. 2015.
�Audi: Paid 2.05 billion CNY as subsidy
to dealers in Dec. 2014.
�Daimler: Paid 1 billion CNY as subsidy
to dealers in Dec. 2014.
�Toyota: Announced to pay 3.3 billion
CNY as subsidy in Jan. 2015.
Sales company
China headquarters/
Sales company
Locally-made automobile
Dealer
Consumer
Imported automobile

���������� ��� ���� ��������
����� ����� �!"#$%����
FOURIN Asia Automotive Intelligence
Asia Country Reports
Becoming Apparent; Regulations Force Strategy Revision
establishment of a sales company, but on
gaining majority control of sales activities.
While foreign automakers can only set up
joint ventures in China and with no higher
stake than 50 percent, the same regulation
does not apply to automobile sales
companies, enabling foreign automakers to
have majority control of local automobile
sales. Although SAIC and FAW have
majority control of their respective sales
was dull in 2014. It is said that 70 percent
of dealers were in the red, prompting
them to demand higher commission from
automakers. Since the revised version of
the Procedures, which is currently under
final adjustment, is amending the current
automaker-dealer relationship, it is likely
that business strategies of sales companies
will also change in the coming years.
(Jincheng ZHOU)
companies with their foreign partners,
Germany’s Daimler holds 51 percent stake
in its joint venture sales company with
listed Chinese automaker BAIC Motor. In
exchange, BAIC Motor has an equity
share of 51 percent in their joint venture
automaker. In fact, having majority share
in an operation is a typical practice by
listed Chinese automakers.
Meanwhile, China’s automobile market
China: Automobile Sales Departments / Companies of Main Automakers (As of Jan. 2015) (Cont.)�
Notes: Created with focus on foreign automakers. Chery and BYD included for reference.
(Created using company PR materials, data from China’s SAIC [State Administration of Industry and Commerce] and various media sources)
Locally Made Imported
GM Shanghai GM SAIC 50%, GM 50% Dec. 2011 SAIC 51%, GM 49% �
Buick,
Chevrolet,
Cadillac, Sail
Buick, Chevrolet,
Cadillac
Changan Ford Changan 50%, Ford 50% Jun. 2003 � Ford
Oct. 1995 Ford 100% � Ford, Lincoln
Tianjin FAW
Toyota
FAW 20%, Tianjin FAW Xiali
30%, Toyota 50%
Sichuan FAW
Toyota
FAW 50%, Toyota 50%
GAC Toyota GAC 50%, Toyota 50% Sep. 2004 � Toyota, Leahead
Jul. 2001 Toyota 100% � Lexus, Toyota
Dongfeng Nissan
Dongfeng (DFG) 50%,
Nissan 50%
Dec. 2012 Dongfeng (DFL) 100% � Nissan, Venucia
Zhengzhou Nissan
Dongfeng (DFAC) 51%,
Dongfeng (DFL) 28.7%,
Nissan 20.3%
Jan. 2007 Zhengzhou Nissan 100% �Dongfeng,
Nissan
Feb. 2004 Nissan 100% � Nissan , Infiniti
Guangqi Honda GAC 50%, Honda 50% Jul. 1998 � Honda, Everus
Dongfeng Honda
Dongfeng (DFG) 50%,
Honda 50%
Jul. 2003 � Honda, Ciimo
Jan. 2004 Honda 100% � Acura, Honda
May. 1998 FAW 10%, FAW Car 90% �Besturn,
Hongqi
Mar. 2005
FAW 4%, FAW Car 56%,
Mazda 40%
� Mazda
Changan Mazda Changan 50%, Mazda 50% Dec. 2012 � Mazda
Jan. 2005 Mazda 100% � Mazda
Changan Suzuki Changan 50%, Suzuki 50%
2013
restructured
� Suzuki
Oct. 2004 Suzuki 100% � Suzuki
GAC Mitsubishi
GAC 50%, Mitsubishi 33%,
Mitsubishi Corp. 17%
May. 2012 � Mitsubishi
South East (Fujian)
Motor
Fujian Motor 50%, China
Motor 25%, Mitsubishi 25%
Nov. 1995 �Mitsubishi,
Soueast
Feb. 2009 � Mitsubishi
Beijing Hyundai BAIC 50%, Hyundai 50% Oct. 2002 � Hyundai
Dongfeng Yueda-
Kia
Dongfeng (DFG) 25%, Yueda
Investment 35%, Kia 50%
Nov. 2002 � Kia
Sep. 2004
Hyundai 50%, Mobis 20%,
Kia 30%
� Hyundai, Kia
Chery
Chery Honding 41%,
others 59%
Aug. 2000 Chery 100% � Chery, Karry
Kaiyi
Anhui Jiangbei Development
15%, Chery Commercial
Vehicles (Anhui) 5%, Wuhu
Construction Investment 35%
Mar. 2014 Kaiyi 100� � Kaiyi
Qoros Chery 50%, Israel Group 50% Dec. 2007 � Qoros
BYD BYD BYD etc. Mar. 2004 BYD etc. � BYDBYD Auto Sales Co., Ltd.
Chery
Anhui Chery Automobile Sales Co.,
Ltd.
Kaiyi Automobile Sales Co., Ltd.
Sales department
Hyundai
Sales department
Sales department
Hyundai Motor ( China) Investment
Co., Ltd.
Mitsubishi
Sales department
Sales department
Mitsubishi Motor Sales �China� Co.,
Ltd.
Mazda Motor (China) Co., Ltd.
Suzuki
Sales department
Suzuki Motor (China) Investment Co.,
Ltd.
Mazda
FAW Car
(licensed
technology)
FAW 53%, others 47%
FAW Car Sales Co., Ltd.
FAW Mazda Motor Sales Co., Ltd.
Changan Mazda Automobile Co., Ltd.
Sales Branch Office
Honda
Sales headquarters
Sales department
Honda Motor (China) Investment Co.,
Ltd.
Nissan
Dongfeng Nissan Automobile Sales Co.,
Ltd.
Zhengzhou Nissan Automobile Sales
Co., Ltd.
Nissan (China) Investment Co., Ltd.
Toyota, Ranz
Sales headquarters
Toyota Motor (China) Investment Co.,
Ltd.
Ford
Changan Ford Motor Co., Ltd. Sales
Branch Co.
Ford Motor China Ltd.
Toyota
FAW Toyota Motor Sales Co., Ltd. Sep. 2003
FAW 38%, Toyota 32%,
Tianjin FAW Toyota 25%,
Sichuan FAW Toyota 5%
�
Ownership
Indep.
Corp.
Brands Handled
SAIC General Motors Sales Co., Ltd.
Automaker Ownership
Sales Department/Company
(Sales Headquarters)
Established

���������� ��� ���� ��������
����� ����� �!"#$%����
FOURIN Asia Automotive Intelligence
520.9
822.5
975.1
780.7
824.9
�20%
�10%
0%
10%
20%
30%
40%
50%
60%
70%
80%
0
100
200
300
400
500
600
700
800
900
1,000
2009 2010 2011 2012 2013
(1,000 units)
As air pollution worsens in China, the
country is stepping up environmental
measures on motor vehicles as well as on
non-road mobile machinery (NRMM)
such as boring, construction,
agricultural, forestry, fishery and
loading/unloading machines. In May
2014, China’s Ministry of Environment
Protection announced a measure called
“Limits and Measurement Methods of
Exhaust Pollutants from Diesel Engines
of NRMMry (China III, IV),” which
� � Non-road Mobile Machinery: Existing Products Are Fitted with
China
emission regulations, becoming major
source of pollution in cities which carry
out major infrastructure projects. As a
result, China’s national and local
environment agencies are requesting the
study of pollution conditions and testing
of treatment systems.
With the introduction of the
“Regulation on Air Pollution Prevention
in Main Regions (12th Five-year Plan)”
measure in October 2012, the
government already began the reduction
outlined the implementation of China 3
emission regulations from October 2014
and China 4 emission standards from
around 2018.
By making the development and
application of emission purification
technology on NRMM mandatory, many
medium and small manufacturers which
do not own such technology are expected
to exit the market or merge with other
companies. Meanwhile, most existing
NRMM only comply with China 1 and 2
China: Sales Volume of Main Construction Industry Products (2009–2013)
Notes: CO – carbon monoxide. HC – hydrocarbon. NOx – nitrogen oxide. PM – particulate matter. While the China 2 emission regulation set separate standard values for HC and NOx of diesel engines
with 18kWh and higher rated output, China 3 emission regulation set an upper limit for the combined total of the two substances. (Created using PR materials of MEP and AQSIQ)
China: Sales Volume of Construction Machinery
(2009–2013)
(Created using table above)
China: Emission Regulation Standards of Diesel Engine-powered Non-road Mobile Machinery
China: Emission Regulation Standards of Diesel Engines of Non-road Mobile Machinery (China 1–4)
Notes: According to the “Limits and Measurement Methods of Exhaust Pollutants from Diesel Engines of Non-road Mobile Machinery (China III, IV)” measure “non-road mobile machinery” are boring
machines, construction machines, agricultural machines, forestry machines, fishery machines, loading/unloading machines, snow removers, ground-handling equipment, air compressors, generators and
water pumps among others.
Main points of the regulation: �From Oct. 1, 2014: All newly-approved diesel engines of non-road mobile machinery must comply with China 3 emission regulations. �From Oct. 1, 2015: Production
and sales of all China 2-compliant diesel engines of non-road mobile machinery must be discontinued, and all diesel engines of non-road mobile machinery manufactured and sold must comply with
China 3 emission regulations. �From Apr. 1, 2016: Production, import and sales of China 2-compliant diesel engine-powered non-road mobile machinery must be discontinued, realizing full
compliance with China 3 emission regulations.
(Created using PR materials of China’s MEP [Ministry of Environment Protection] and AQSIQ [General Administration of Quality Supervision, Inspection and Quarantine])
Sales volume
(left scale)
Growth rate
(right scale)
Note: *Includes products with rated output of 73.5kW and higher.
(Created using data from China Construction Machinery Industry Yearbook)
CO HC NOx
HC+NOx
PM
130≤Pmax≤560 5.0 1.3 9.2 - 0.54
75≤Pmax�130 5.0 1.3 9.2 - 0.7
37≤Pmax�75 6.5 1.3 9.2 - 0.85
18≤Pmax�37 8.4 2.1 10.8 - 1.0
8≤Pmax�18 8.4 - - 12.9 -
0�Pmax�8 12.3 - - 18.4 -
130≤Pmax≤560 3.5 1.0 6.0 - 0.2
75≤Pmax�130 5.0 1.0 7.0 - 0.3
37≤Pmax�75 5.0 1.3 7.0 - 0.4
18≤Pmax�37 5.5 1.5 8.0 - 0.8
8≤Pmax�18 6.6 - - 9.5 0.8
0�Pmax�8 8.0 - - 10.5 1.0
China 1
Regulation
Level
Rated Output
(Pmax
) (kW)
Required Emission Gas Values (g/kWh)
China 2
CO HC NOx
HC+NOx
PM
560�Pmax 3.5 - - 6.4 0.2
130≤Pmax≤560 3.5 - - 4.0 0.2
75≤Pmax�130 5.0 - - 4.0 0.3
37≤Pmax�75 5.0 - - 4.7 0.4
Pmax�37 5.5 - - 7.5 0.6
560�Pmax 3.5 0.40 3.5 - 0.1
130≤Pmax≤560 3.5 0.19 2.0 - 0.025
75≤Pmax�130 5.0 0.19 3.3 - 0.025
56≤Pmax�75 5.0 0.19 3.3 - 0.025
37≤Pmax�56 5.0 - - 4.7 0.025
Pmax�37 5.5 - - 7.5 0.6
Regulation
Level
Rated Output
(Pmax
) (kW)
Required Emission Gas Values (g/kWh)
China 3
China 4
Type 2009 2010 2011 2012 2013
Year-on-
year
Excavator 101,559 179,296 193,891 130,624 126,296 ▼3.3%
Loader 149,355 228,219 258,901 181,522 188,405 3.8%
Bulldozer* 8,599 13,911 13,115 10,169 9,561 ▼6.0%
Grader 3,608 4,531 5,259 4,347 4,017 ▼7.6%
Road roller 19,852 26,281 22,217 13,782 15,726 14.1%
Road paving machine 1,678 3,019 3,386 2,179 2,066 ▼5.2%
Crane 57,794 78,543 88,455 72,877 81,573 11.9%
Forklift 138,908 232,389 313,847 291,333 328,764 12.8%
Mobile concrete pump 5,186 6,959 10,762 11,246 6,992 ▼37.8%
Mobile concrete mixer machine 4,949 5,977 6,897 7,075 7,740 9.4%
Concrete mixer truck 23,539 35,386 46,370 44,646 45,799 2.6%
Concrete pump truck 5,880 7,964 12,030 10,866 7,966 ▼26.7%
Total 520,907 822,475 975,130 780,666 824,905 5.7%
(Units)
Regulation Level Regulation Name Code Issuing Authority Date Announced Date Implemented
China 1 Oct. 2007
China 2 Oct. 2009
China 3 Oct. 2014
China 4 2018 (projection)
Limits and Measurement Methods of Exhaust Pollutants from
Diesel Engines of Non-road Mobile Machinery (China I, II)
GB 20891-2007 Apr. 2007
Limits and Measurement Methods of Exhaust Pollutants from
Diesel Engines of Non-road Mobile Machinery (China III, IV)
GB 20891-2014 May 2014
MEP, AQSIQ
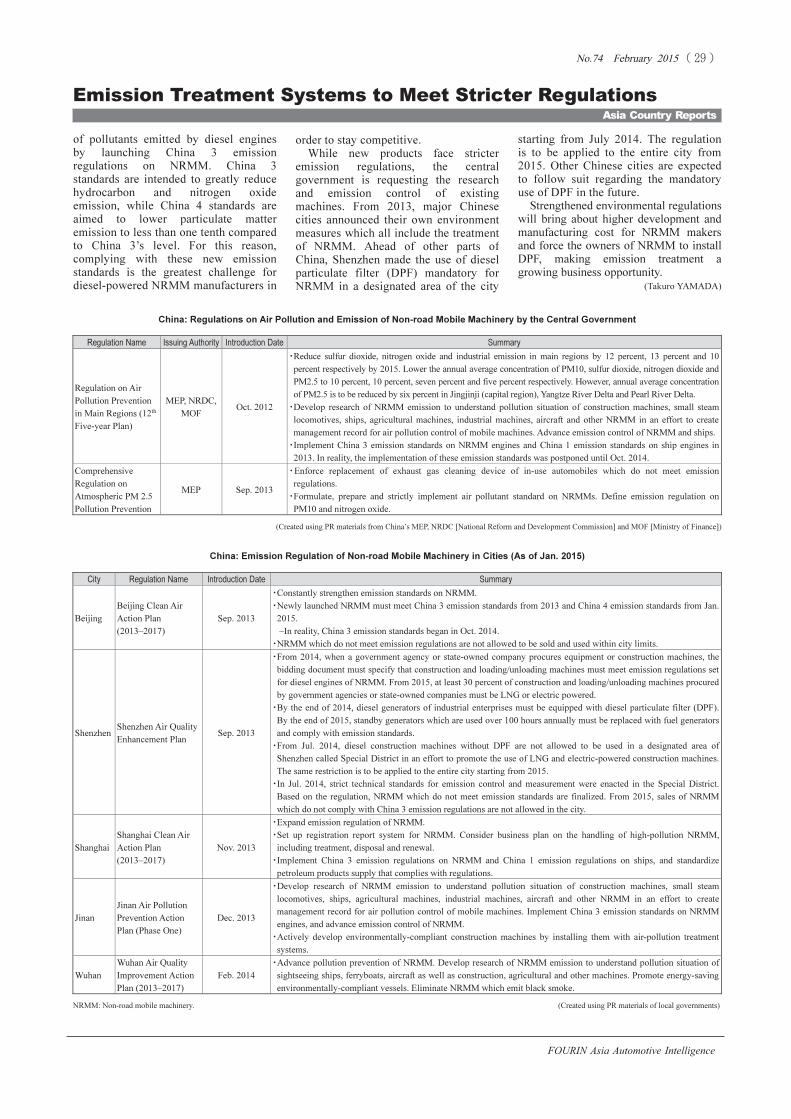
���������� ��� ���� ��������
����� ����� �!"#$%����
FOURIN Asia Automotive Intelligence
City Regulation Name Introduction Date Summary
Beijing
Beijing Clean Air
Action Plan
(2013–2017)
Sep. 2013
�Constantly strengthen emission standards on NRMM.
�Newly launched NRMM must meet China 3 emission standards from 2013 and China 4 emission standards from Jan.
2015.
–In reality, China 3 emission standards began in Oct. 2014.
�NRMM which do not meet emission regulations are not allowed to be sold and used within city limits.
Shenzhen
Shenzhen Air Quality
Enhancement Plan
Sep. 2013
�From 2014, when a government agency or state-owned company procures equipment or construction machines, the
bidding document must specify that construction and loading/unloading machines must meet emission regulations set
for diesel engines of NRMM. From 2015, at least 30 percent of construction and loading/unloading machines procured
by government agencies or state-owned companies must be LNG or electric powered.
�By the end of 2014, diesel generators of industrial enterprises must be equipped with diesel particulate filter (DPF).
By the end of 2015, standby generators which are used over 100 hours annually must be replaced with fuel generators
and comply with emission standards.
�From Jul. 2014, diesel construction machines without DPF are not allowed to be used in a designated area of
Shenzhen called Special District in an effort to promote the use of LNG and electric-powered construction machines.
The same restriction is to be applied to the entire city starting from 2015.
�In Jul. 2014, strict technical standards for emission control and measurement were enacted in the Special District.
Based on the regulation, NRMM which do not meet emission standards are finalized. From 2015, sales of NRMM
which do not comply with China 3 emission regulations are not allowed in the city.
Shanghai
Shanghai Clean Air
Action Plan
(2013–2017)
Nov. 2013
�Expand emission regulation of NRMM.
�Set up registration report system for NRMM. Consider business plan on the handling of high-pollution NRMM,
including treatment, disposal and renewal.
�Implement China 3 emission regulations on NRMM and China 1 emission regulations on ships, and standardize
petroleum products supply that complies with regulations.
Jinan
Jinan Air Pollution
Prevention Action
Plan (Phase One)
Dec. 2013
�Develop research of NRMM emission to understand pollution situation of construction machines, small steam
locomotives, ships, agricultural machines, industrial machines, aircraft and other NRMM in an effort to create
management record for air pollution control of mobile machines. Implement China 3 emission standards on NRMM
engines, and advance emission control of NRMM.
�Actively develop environmentally-compliant construction machines by installing them with air-pollution treatment
systems.�
Wuhan
Wuhan Air Quality
Improvement Action
Plan (2013–2017)
Feb. 2014
�Advance pollution prevention of NRMM. Develop research of NRMM emission to understand pollution situation of
sightseeing ships, ferryboats, aircraft as well as construction, agricultural and other machines. Promote energy-saving
environmentally-compliant vessels. Eliminate NRMM which emit black smoke.
Regulation Name Issuing Authority Introduction Date Summary
Regulation on Air
Pollution Prevention
in Main Regions (12th
Five-year Plan)
MEP, NRDC,
MOF
Oct. 2012
�Reduce sulfur dioxide, nitrogen oxide and industrial emission in main regions by 12 percent, 13 percent and 10
percent respectively by 2015. Lower the annual average concentration of PM10, sulfur dioxide, nitrogen dioxide and
PM2.5 to 10 percent, 10 percent, seven percent and five percent respectively. However, annual average concentration
of PM2.5 is to be reduced by six percent in Jingjinji (capital region), Yangtze River Delta and Pearl River Delta.
�Develop research of NRMM emission to understand pollution situation of construction machines, small steam
locomotives, ships, agricultural machines, industrial machines, aircraft and other NRMM in an effort to create
management record for air pollution control of mobile machines. Advance emission control of NRMM and ships.
�Implement China 3 emission standards on NRMM engines and China 1 emission standards on ship engines in
2013. In reality, the implementation of these emission standards was postponed until Oct. 2014.
Comprehensive
Regulation on
Atmospheric PM 2.5
Pollution Prevention
MEP Sep. 2013
�Enforce replacement of exhaust gas cleaning device of in-use automobiles which do not meet emission
regulations.
�Formulate, prepare and strictly implement air pollutant standard on NRMMs. Define emission regulation on
PM10 and nitrogen oxide.
Asia Country Reports
Emission Treatment Systems to Meet Stricter Regulations
of pollutants emitted by diesel engines
by launching China 3 emission
regulations on NRMM. China 3
standards are intended to greatly reduce
hydrocarbon and nitrogen oxide
emission, while China 4 standards are
aimed to lower particulate matter
emission to less than one tenth compared
to China 3’s level. For this reason,
complying with these new emission
standards is the greatest challenge for
diesel-powered NRMM manufacturers in
starting from July 2014. The regulation
is to be applied to the entire city from
2015. Other Chinese cities are expected
to follow suit regarding the mandatory
use of DPF in the future.
Strengthened environmental regulations
will bring about higher development and
manufacturing cost for NRMM makers
and force the owners of NRMM to install
DPF, making emission treatment a
growing business opportunity.
(Takuro YAMADA)
order to stay competitive.
While new products face stricter
emission regulations, the central
government is requesting the research
and emission control of existing
machines. From 2013, major Chinese
cities announced their own environment
measures which all include the treatment
of NRMM. Ahead of other parts of
China, Shenzhen made the use of diesel
particulate filter (DPF) mandatory for
NRMM in a designated area of the city
NRMM: Non-road mobile machinery. (Created using PR materials of local governments)
China: Emission Regulation of Non-road Mobile Machinery in Cities (As of Jan. 2015)
China: Regulations on Air Pollution and Emission of Non-road Mobile Machinery by the Central Government
(Created using PR materials from China’s MEP, NRDC [National Reform and Development Commission] and MOF [Ministry of Finance])
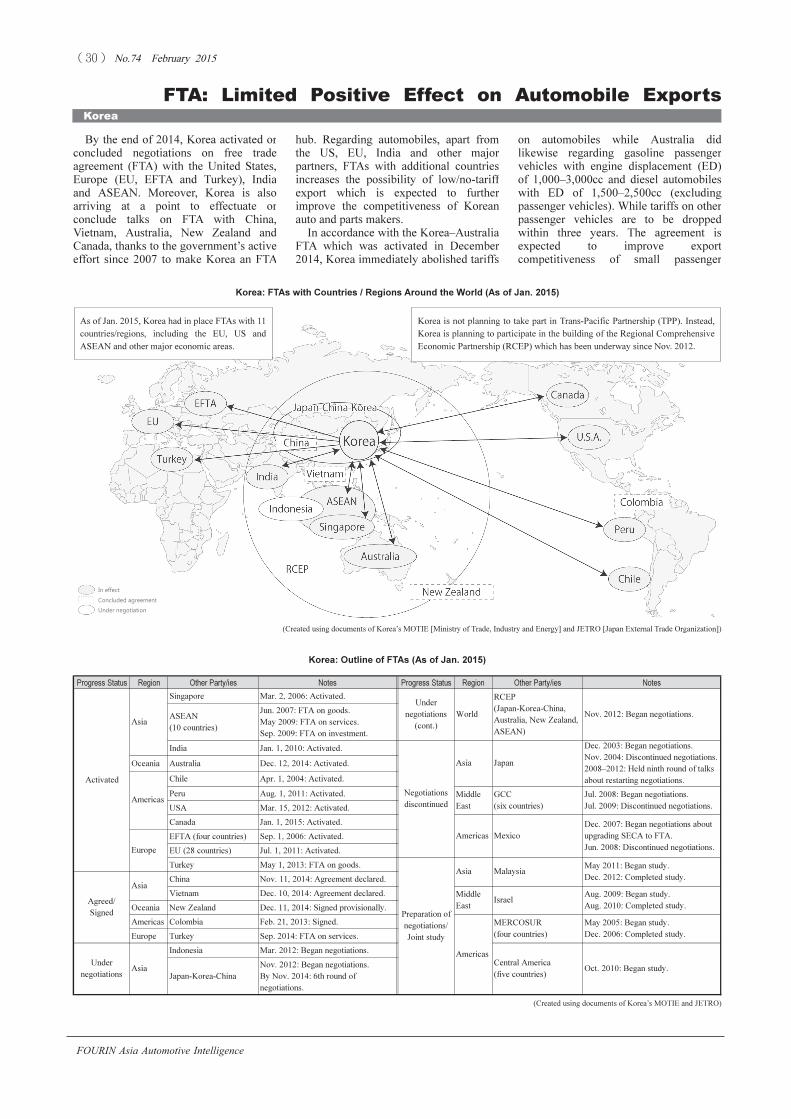
���������� ��� ���� ��������
����� ����� �!"#$%����
FOURIN Asia Automotive Intelligence
By the end of 2014, Korea activated or
concluded negotiations on free trade
agreement (FTA) with the United States,
Europe (EU, EFTA and Turkey), India
and ASEAN. Moreover, Korea is also
arriving at a point to effectuate or
conclude talks on FTA with China,
Vietnam, Australia, New Zealand and
Canada, thanks to the government’s active
effort since 2007 to make Korea an FTA
� � � � FTA: Limited Positive Effect on Automobile Exports
Korea
on automobiles while Australia did
likewise regarding gasoline passenger
vehicles with engine displacement (ED)
of 1,000–3,000cc and diesel automobiles
with ED of 1,500–2,500cc (excluding
passenger vehicles). While tariffs on other
passenger vehicles are to be dropped
within three years. The agreement is
expected to improve export
competitiveness of small passenger
hub. Regarding automobiles, apart from
the US, EU, India and other major
partners, FTAs with additional countries
increases the possibility of low/no-tariff
export which is expected to further
improve the competitiveness of Korean
auto and parts makers.
In accordance with the Korea–Australia
FTA which was activated in December
2014, Korea immediately abolished tariffs
Korea: Outline of FTAs (As of Jan. 2015)
(Created using documents of Korea’s MOTIE and JETRO)
Korea: FTAs with Countries / Regions Around the World (As of Jan. 2015)
(Created using documents of Korea’s MOTIE [Ministry of Trade, Industry and Energy] and JETRO [Japan External Trade Organization])
As of Jan. 2015, Korea had in place FTAs with 11
countries/regions, including the EU, US and
ASEAN and other major economic areas.�
Korea is not planning to take part in Trans-Pacific Partnership (TPP). Instead,
Korea is planning to participate in the building of the Regional Comprehensive
Economic Partnership (RCEP) which has been underway since Nov. 2012.�
Concluded agreement
Progress Status Region Other Party/ies Notes Progress Status Region Other Party/ies Notes
Singapore Mar. 2, 2006: Activated.
ASEAN
(10 countries)
Jun. 2007: FTA on goods.
May 2009: FTA on services.
Sep. 2009: FTA on investment.
India Jan. 1, 2010: Activated.
Oceania Australia Dec. 12, 2014: Activated.
Chile Apr. 1, 2004: Activated.
Peru Aug. 1, 2011: Activated.
USA Mar. 15, 2012: Activated.
Canada Jan. 1, 2015: Activated.
EFTA (four countries) Sep. 1, 2006: Activated.
EU (28 countries) Jul. 1, 2011: Activated.
Turkey May 1, 2013: FTA on goods.
China Nov. 11, 2014: Agreement declared.
Vietnam Dec. 10, 2014: Agreement declared.
Oceania New Zealand Dec. 11, 2014: Signed provisionally.
Americas Colombia Feb. 21, 2013: Signed.
Europe Turkey Sep. 2014: FTA on services.
Indonesia Mar. 2012: Began negotiations.
Japan-Korea-China
Nov. 2012: Began negotiations.
By Nov. 2014: 6th round of
negotiations.
Asia
Under
negotiations
Agreed/
Signed
Oct. 2010: Began study.
Americas
Preparation of
negotiations/
Joint study
Asia
Asia
Central America
(five countries)
Israel
Middle
East
Activated
MERCOSUR
(four countries)
May 2005: Began study.
Dec. 2006: Completed study.
Jul. 2008: Began negotiations.
Jul. 2009: Discontinued negotiations.
Aug. 2009: Began study.
Aug. 2010: Completed study.
Asia
Americas
Europe
Negotiations
discontinued
Americas
Under
negotiations
(cont.)
World
Middle
East
May 2011: Began study.
Dec. 2012: Completed study.
Nov. 2012: Began negotiations.
Dec. 2003: Began negotiations.
Nov. 2004: Discontinued negotiations.
2008–2012: Held ninth round of talks
about restarting negotiations.
JapanAsia
Mexico
RCEP
(Japan-Korea-China,
Australia, New Zealand,
ASEAN)
GCC
(six countries)
Malaysia
Dec. 2007: Began negotiations about
upgrading SECA to FTA.
Jun. 2008: Discontinued negotiations.
Under negotiation
In effect

���������� ��� ���� ��������
����� ����� �!"#$%����
FOURIN Asia Automotive Intelligence
Asia Country Reports
Despite Conclusion/Launch of Numerous Agreements
vehicles made by Hyundai, GM Korea
and other Korean automakers.
The Korea–Canada FTA which was put
into effect in January 2015, calls for
immediate abolishment of tariffs on
automobiles by Korea. On the other hand,
Canada is to drop tariffs on gasoline
automobiles with ED of 1,500–3,000cc
within three years and on gasoline
automobiles with ED of over 3,000cc
Vietnam, which is undergoing economic
development including infrastructure
investment, rising demand for trucks is
expected to increase commercial vehicle
export from Korea. In contrast, the
Korea–China FTA, which has been
drawing the most attention, excluded
automobiles, meaning that the FTA will
not affect the Korean automotive industry.
(Gangbok LEE)
immediately. However, since the highest
demand in Canada is for 3,000cc or
smaller automobiles, the FTA is expected
to have limited benefit until 2018.
Korea also concluded negotiations with
China and New Zealand in November
2014 and with Vietnam in December of
the same year. Vietnam is to abolish
tariffs within 10 years on cargo vehicles
with maximum payload of 5–20 tons. In
�Activated�
�Korea–Turkey FTA
�Overview�
�Jun. 2008–May 2009: The two countries held non-official joint FTA research.
Apr. 2010: Negotiations began. Mar. 2012: Reached agreement. Aug. 2012:
Signed basic and trade agreement. May 2013: Activated. Jul. 2014: Reached
agreement on services and investment. Sep. 2014: Tentative signature of
services and investment agreement.
�After the activation of FTA, both countries aim to abolish tariffs on nearly all
items within 10 years. Korea is to abolish tariffs on 92.2 percent of all items,
while Turkey is to cancel tariffs on 89.8 percent of all items.
�Tariffs are to be abolished on all goods including automobiles, steel and TV
sets within seven years.
�Automobile-related items�
�Turkey is to abolish tariff (10 percent) on medium/large passenger vehicles
with ED over 2,500cc gradually within five years and on diesel automobiles
with ED of 1,600–2,000cc as well as on small automobiles with ED of 1,600cc
or less gradually within seven years.
�Korea–Australia FTA
�Overview�
�May 2007–Oct. 2007: The two countries held non-official joint FTA research.
May 2009: Negotiations began. Dec. 2013: Reached agreement. Apr. 2014:
Signed agreement. Dec. 2014: Activated.
�After the activation of FTA, both countries aim to abolish tariffs on nearly all
items within 10 years. Korea is to abolish tariffs on 99.4 percent of all items
within 10 years, while Australia is to cancel tariffs on 99.4 percent of all items
within five years.
�Automobile-related items�
�Australia is to abolish tariffs on gasoline passenger vehicles with ED of
1,000–3,000cc, on diesel automobiles with ED of 1,500–2,500cc (excluding
passenger vehicles) and on diesel cargo vehicles with GVW of five tons or less
immediately. Moreover, Australia is to abolish tariffs on gasoline passenger
vehicles of ED of over 3,000cc, on diesel passenger vehicles with ED of
1,500cc or above and on diesel automobiles with ED of below 1,500cc
(excluding passenger vehicles) within three years.
�To abolish tariff on nearly all auto parts (5 percent) within three years and on
tires (five percent) immediately.
�Korea–Canada FTA
�Outline�
�Jul. 2005: Began negotiations. By Nov. 2013: Held 13 rounds of negotiations.
Mar. 2014: Reached agreement. Sep. 2014: Signed agreement. Jan. 2015:
Activated.
�Aims for advanced liberalization in a wide range of areas including goods,
services, investment and government procurement.
�After the activation of FTA, both countries aim to abolish tariffs on nearly all
items within 10 years. Both Korea and Canada are to abolish tariffs on 97.5
percent of all items within 10 years.
�Automobile-related items�
�Canada is to abolish tariff on gasoline automobiles with ED of 1,500–3,000cc
(6.1 percent) within three years and on gasoline automobiles with ED of over
3,000cc (6.1 percent) immediately. Regarding auto parts (six percent), tariff
abolished immediately on some items and to be canceled on all items within
three years. Regarding tires (seven percent), tariff is to be abolished within five
years.
�Reached Agreement�
�Korea–Colombia FTA
�Overview�
�Mar. 2009–Aug. 2009: The two countries held non-official joint FTA research.
Dec. 2009: Negotiations began. Jun. 2012: Reached agreement. Feb. 2013:
Signed agreement. Apr. 2014: Korea ratified the agreement.
�After the activation of FTA, both countries aim to abolish tariffs on nearly all
items within 10 years. Korea is to abolish tariffs on 96.1 percent of all items
within 10 years, while Colombia is to cancel tariffs on 96.7 percent of all items
within 10 years.
�Automobile-related items�
�Colombia is to abolish tariff on small gasoline vehicles with ED of 1,500cc or
below and on gasoline/diesel SUVs (4X4) with ED of 1,500–3,000cc (35
percent) immediately. Regarding gasoline passenger vehicles with ED of
1,500–3,000cc and SUVs (4X4) with ED of over 3,000cc, tariffs are to be
canceled within ten years.
�Regarding auto parts (5–15 percent) and tires (15 percent), tariffs are to be
abolished within five years.
�Korea–China FTA
�Outline�
�2005–2010: The two countries held joint FTA research. May 2012: Negotiations
began. Nov. 2014: Reached agreement.
�After the activation of FTA, both countries aim to abolish tariffs on at least 90
percent of all items. China is to abolish tariffs on 91 percent of all items and
cancel 85 percent of tariffs in terms of value within 20 years, while Korea is to
cancel tariffs on 92 percent of all items and cancel 91 percent of tariffs in terms
of value within 20 years.
�Abolishing tariffs on farm and marine products was a major issue during
negotiations, while the automotive sector was not even included among items
discussed.
�Korea–Vietnam FTA
�Outline�
�Aug. 2012: Negotiations began. Dec. 2014: Reached agreement.
�Based on 2012 import value, the two countries agreed that Korea liberalize
trade 94.7 percent (+3pp) and Vietnam liberalize trade 92.2 percent (+6pp).
–Korea is to abolish tariffs 91.7 percent in terms of total import value within
10 years.
–Vietnam is to abolish tariffs 86.2 percent in terms of total import value within
15 years.
�Automobile-related items�
�Regarding passenger vehicles with ED of 3,000cc or above and cargo vehicles
with MPL of 5–20 tons, Vietnam is to abolish tariffs within 10 years. As for
auto parts, tariffs are to be canceled within three years.
�Korea–New Zealand FTA
�Outline�
� 2007–2008: The two countries held joint FTA research. Jun. 2009:
Negotiations began. Nov. 2014: Reached agreement. Dec. 2014: Tentatively
signed agreement.
�After the activation of FTA, Korea and New Zealand aim to abolish tariffs on
nearly all items within 15 and seven years respectively.
�Automobile-related items�
�Regarding cargo vehicles, New Zealand is to abolish tariffs within three years.
As for auto parts, tariffs are to be abolished within seven years. Passenger
vehicles were not included among items discussed.
(Created using documents of Korea’s MOTIE and various media sources)
Korea: Recent FTA Developments (Since 2013)
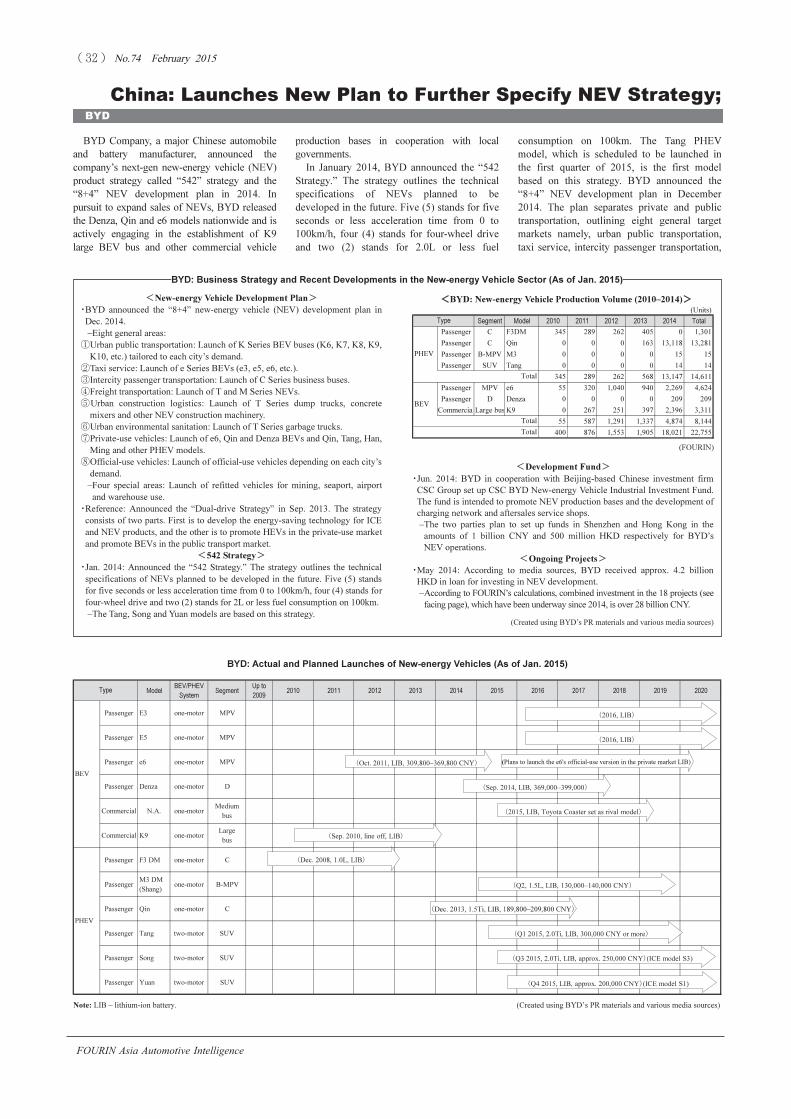
���������� ��� ���� ��������
����� ����� �!"#$%����
FOURIN Asia Automotive Intelligence
Model
BEV/PHEV
System
Segment
Up to
2009
2010 2011 2012 2013 2014 2015 2016 2017 2018 2019 2020
Passenger E3 one-motor MPV
Passenger E5 one-motor MPV
Passenger e6 one-motor MPV
Passenger Denza one-motor D
Commercial N.A. one-motor
Medium
bus
Commercial K9 one-motor
Large
bus
Passenger F3 DM one-motor C
Passenger
M3 DM
(Shang)
one-motor B-MPV
Passenger Qin one-motor C
Passenger Tang two-motor SUV
Passenger Song two-motor SUV
Passenger Yuan two-motor SUV
BEV
PHEV
Type
�2016, LIB�
�Oct. 2011, LIB, 309,800–369,800 CNY�
�Q2, 1.5L, LIB, 130,000–140,000 CNY�
�Q1 2015, 2.0Ti, LIB, 300,000 CNY or more�
�2016, LIB�
�Dec. 2008, 1.0L, LIB�
�Q3 2015, 2.0Ti, LIB, approx. 250,000 CNY�(ICE model S3)
�Q4 2015, LIB, approx. 200,000 CNY�(ICE model S1)
�Sep. 2010, line off, LIB�
�Sep. 2014, LIB, 369,000–399,000�
�2015, LIB, Toyota Coaster set as rival model�
� � China: Launches New Plan to Further Specify NEV Strategy;
BYD
BYD Company, a major Chinese automobile
and battery manufacturer, announced the
company’s next-gen new-energy vehicle (NEV)
product strategy called “542” strategy and the
“8+4” NEV development plan in 2014. In
pursuit to expand sales of NEVs, BYD released
the Denza, Qin and e6 models nationwide and is
actively engaging in the establishment of K9
large BEV bus and other commercial vehicle
consumption on 100km. The Tang PHEV
model, which is scheduled to be launched in
the first quarter of 2015, is the first model
based on this strategy. BYD announced the
“8+4” NEV development plan in December
2014. The plan separates private and public
transportation, outlining eight general target
markets namely, urban public transportation,
taxi service, intercity passenger transportation,
production bases in cooperation with local
governments.
In January 2014, BYD announced the “542
Strategy.” The strategy outlines the technical
specifications of NEVs planned to be
developed in the future. Five (5) stands for five
seconds or less acceleration time from 0 to
100km/h, four (4) stands for four-wheel drive
and two (2) stands for 2.0L or less fuel
Note: LIB – lithium-ion battery. (Created using BYD’s PR materials and various media sources)
BYD: Business Strategy and Recent Developments in the New-energy Vehicle Sector (As of Jan. 2015)
�New-energy Vehicle Development Plan�
�BYD announced the “8+4” new-energy vehicle (NEV) development plan in
Dec. 2014.
–Eight general areas:
�Urban public transportation: Launch of K Series BEV buses (K6, K7, K8, K9,
K10, etc.) tailored to each city’s demand.
�Taxi service: Launch of e Series BEVs (e3, e5, e6, etc.).
�Intercity passenger transportation: Launch of C Series business buses.
�Freight transportation: Launch of T and M Series NEVs.
�Urban construction logistics: Launch of T Series dump trucks, concrete
mixers and other NEV construction machinery.
�Urban environmental sanitation: Launch of T Series garbage trucks.
�Private-use vehicles: Launch of e6, Qin and Denza BEVs and Qin, Tang, Han,
Ming and other PHEV models.
Official-use vehicles: Launch of official-use vehicles depending on each city’s
demand.
–Four special areas: Launch of refitted vehicles for mining, seaport, airport
and warehouse use.
�Reference: Announced the “Dual-drive Strategy” in Sep. 2013. The strategy
consists of two parts. First is to develop the energy-saving technology for ICE
and NEV products, and the other is to promote HEVs in the private-use market
and promote BEVs in the public transport market.
�542 Strategy�
�Jan. 2014: Announced the “542 Strategy.” The strategy outlines the technical
specifications of NEVs planned to be developed in the future. Five (5) stands
for five seconds or less acceleration time from 0 to 100km/h, four (4) stands for
four-wheel drive and two (2) stands for 2L or less fuel consumption on 100km.
–The Tang, Song and Yuan models are based on this strategy.
�Development Fund�
�Jun. 2014: BYD in cooperation with Beijing-based Chinese investment firm
CSC Group set up CSC BYD New-energy Vehicle Industrial Investment Fund.
The fund is intended to promote NEV production bases and the development of
charging network and aftersales service shops.
–The two parties plan to set up funds in Shenzhen and Hong Kong in the
amounts of 1 billion CNY and 500 million HKD respectively for BYD’s
NEV operations.
�Ongoing Projects�
�May 2014: According to media sources, BYD received approx. 4.2 billion
HKD in loan for investing in NEV development.
–According to FOURIN’s calculations, combined investment in the 18 projects (see
facing page), which have been underway since 2014, is over 28 billion CNY.
BYD: Actual and Planned Launches of New-energy Vehicles (As of Jan. 2015)
�BYD: New-energy Vehicle Production Volume (2010–2014)�
(FOURIN)
(Created using BYD’s PR materials and various media sources)
(Units)
Segment Model 2010 2011 2012 2013 2014 Total
Passenger C F3DM 345 289 262 405 0 1,301
Passenger C Qin 0 0 0 163 13,118 13,281
Passenger B-MPV M3 0 0 0 0 15 15
Passenger SUV Tang 0 0 0 0 14 14
345 289 262 568 13,147 14,611
Passenger MPV e6 55 320 1,040 940 2,269 4,624
Passenger D Denza 0 0 0 0 209 209
CommercialLarge bus K9 0 267 251 397 2,396 3,311
55 587 1,291 1,337 4,874 8,144
400 876 1,553 1,905 18,021 22,755Total
Type
PHEV
Total
BEV
Total
(Plans to launch the e6's official-use version in the private market LIB)
�Dec. 2013, 1.5Ti, LIB, 189,800–209,800 CNY�

���������� ��� ���� ��������
����� ����� �!"#$%����
FOURIN Asia Automotive Intelligence
Asia Company Reports
Sets Up Plants in Cooperation with Local Governments
freight transportation, urban construction
logistics, urban environmental sanitation,
private-use vehicles and official-use vehicles.
The plan also indicates four special areas for
refitted vehicles namely mining, seaport, airport
and warehouse logistics.
In order to protect local business interests,
some local governments do not provide
subsidies to non-local companies. For this
reason, BYD is setting up local manufacturing
bases to acquire local subsidies with the ultimate
goal of boosting market share. Since 2014, BYD
has engaged in 12 major projects in Tianjin,
Hangzhou, Wuhan, Nanjing and elsewhere.
Since BYD has been receiving back-to-back
orders for the Qin PHEV car and K9 BEV bus,
the Huizhou battery plant with an annual
production capacity of 1.6GWh is unable to keep
up with demand. For this reason, BYD plans to
boost annual production capacity to 8GWh at its
Shenzhen plant with operation start scheduled to
start in 2015, increasing combined capacity of
traction motors to 10GWh. In order to meet
growing production scale of NEVs, production
capacity expansion of plug-in hybrid systems
and other NEV parts is underway at BYD’s
Shenzhen base. (Yixian WANG)
BYD: Production Bases of New-energy Operations (As of Jan. 2015)
●Automobile mfg base� ★R&D base� ▲Export base� ■Auto parts mfg base ○Raw materials
�Location: Dalian, Liaoning
�Products: BEV buses
�APC: 1,000 units
�SOP: Dec. 2014
�Investment: 760 million CNY
�Site/building area: 220,000/138,000m²
�Location: Guangzhou, Guangdong
�Products: BEV buses, LNG buses, PHEV buses,
medium buses and related parts
�APC: 5,000 units (phase one)
�SOP: Sep. 2015 (phase one, plan)
�Investment: 3 billion CNY
�Location: Wuhan, Hubei
�Products: Large, medium and small BEV buses,
NEV for construction logistics (dump
truck, concrete mixer trucks, etc.)
�APC: 1,000 units (BEV buses) →3,000 units (BEV
buses) + 2,000 units (NEV for construction
logistics) →3,000 units (BEV buses) + 5,000
units (NEV for construction logistics)
�SOP: 2015 (phase one, plan)
�Investment: 3 billion CNY
�Location: Campinas, São Paulo, Brazil
�Products: BEV buses
�APC: 500–1,000 units
�SOP: 2015 (plan)
�Investment: 200 million BRL (approx. 230 million
CNY)
�Site area: 32,000m²
�Location: Lanzhou, Gansu
�Products: BEV buses
�Investment: 2.5 billion CNY
�Notes: Signed agreement about the establishment of
a production plant with the government of
Lanzhou New Area in Apr. 2013. No word
on further progress as of Jan. 2015.
(Created using BYD’s PR materials and various media sources)
�Location: Shangluo, Shaanxi
�Products: Electrolytes for batteries
�APC: 12,000 tons
�Investment: 600 million CNY
�Site area: 40,000m²
�Note: SOP has yet to be announced.
�Location: Shangluo, Shaanxi
�Products: Anode materials for batteries
�APC: 5,400 tons
�Investment: 142.8 million CNY
�Site area: Approx. 13,000m²
�Note: SOP has yet to be announced.
�Location: California, USA
�Products: BEV buses
�APC: 50–100 units (2014)→500 units (2015)
�SOP: Apr. 2014
�Note: The US plant is intended to be used to supply
the North American market as well.
�Location: Huizhou and Shenzhen, Guangdong
�Products: Batteries
�APC: 1.6GWh→3.1GWh→10GWh
�SOP: 2009→Sep. 2014 →2015 (plan)
�Notes: In Shenzhen, APC is to reach 8GWh (25,000
BEV buses or 600,000 PHEV passenger
vehicles) in 2015.
�Location: Nanjing, Jiangsu
�Products: BEV buses
�APC: 1,000 units→5,000 units (two shifts)
�SOP: End of 2015 (phase one, plan)
�Investment: 3 billion CNY
�Site/building area: 184,000/150,000m²
�Location: Hangzhou, Zhejiang
�Products: BEV buses
�APC: 2,000 units→3,000 units
�SOP: Q1 2015 (phase one, plan), Q1 2016 (phase
two, plan)
�Investment: 1.5 billion CNY
�Location: Qingdao, Shandong
�Products: BEV passenger vehicles, medium/small
BEV buses, logistical vehicles, batteries,
motors, electronic control and other parts
�APC: 1,000 units (BEV buses)→3,000 units→5,000
units
�SOP: 2017 (phase three, plan)
�Investment: 3 billion CNY
�Location: Baotou, Inner Mongolia
�Products: Mining BEV
�APC: 2,000 units→5,000 units
�Construction start: Apr. 2015 (phase one, plan)
�SOP: 2015 (phase one, plan)
�Investment: 2.5 billion CNY
�Site area: 543,000m²
�Location: Xi’an, Shaanxi
�Products: PHEV (Qin, Yuan, Song, etc.), BEV (Qin,
Surui)
�APC: 200,000 units (PHEV), 100,000 units (BEV)
�SOP: Sep. 2014
�Location: Tianjin
�Products: BEV buses
�APC: 10,000 units (phase one + phase two)
�SOP: Jun. 2015 (phase one, plan), Jan. 2017 (phase
two, plan)
�Investment: 1.3 billion CNY
�Building area: 200,000m²
�Location: Chengde, Hebei
�Products: BEV buses (K9, K8, K7, etc.), motors,
electronic control and other parts
�APC: 5,000 units (phase one + phase two + phase three)
�SOP: End of 2015 (phase one, plan)
�Investment: 2 billion CNY
�Location: Changsha, Hunan
�Products: BEV buses
�APC: 1,500 units→3,000 units
�SOP: Sep. 2012 (phase one), 2014 (expanded)
�Investment: Over 5 billion CNY
�Location: Shenzhen, Guangdong
�Products (APC): plug-in hybrid systems (50,000 sets),
traction motors (100,000 units),
motor control systems (100,000
units), battery management systems
(100,000 units)
�SOP: 2015 (plan)
New plant Expanded plant Overseas plant
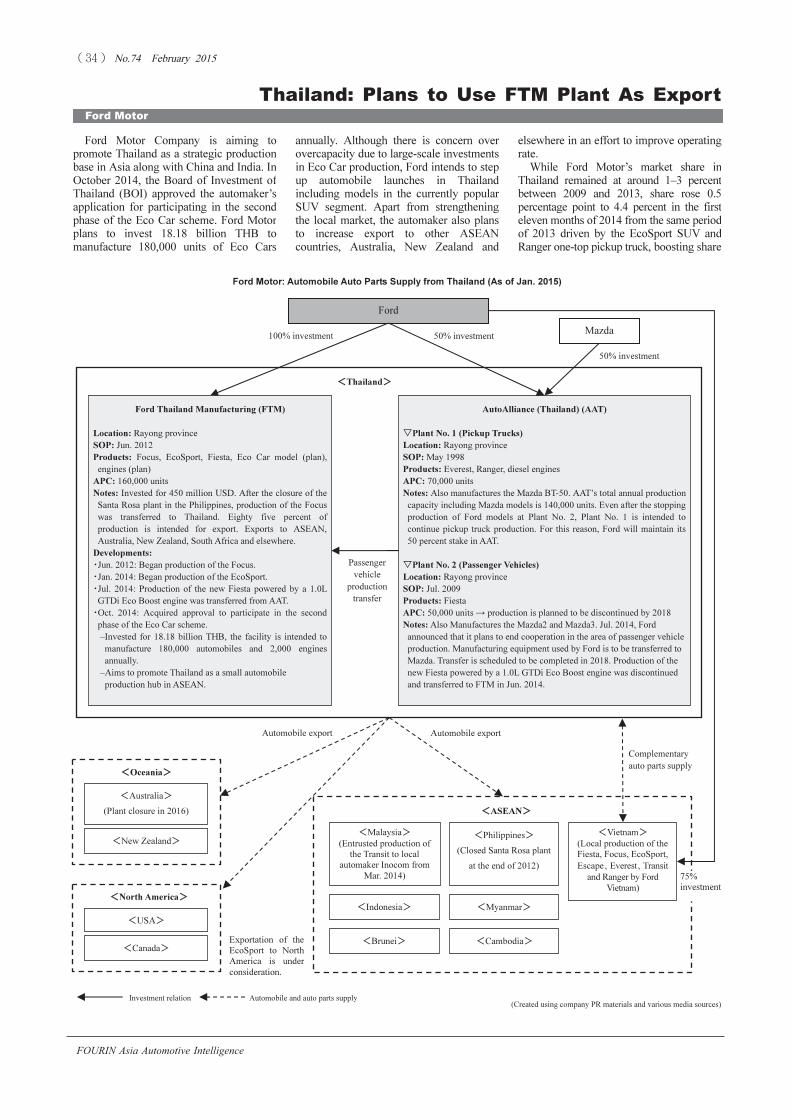
���������� ��� ���� ��������
����� ����� �!"#$%����
FOURIN Asia Automotive Intelligence
Investment relation� � � � � � � � � � � Automobile and auto parts supply
� � � � � � � � � � Thailand: Plans to Use FTM Plant As Export
Ford Motor
Ford Motor Company is aiming to
promote Thailand as a strategic production
base in Asia along with China and India. In
October 2014, the Board of Investment of
Thailand (BOI) approved the automaker’s
application for participating in the second
phase of the Eco Car scheme. Ford Motor
plans to invest 18.18 billion THB to
manufacture 180,000 units of Eco Cars
elsewhere in an effort to improve operating
rate.
While Ford Motor’s market share in
Thailand remained at around 1–3 percent
between 2009 and 2013, share rose 0.5
percentage point to 4.4 percent in the first
eleven months of 2014 from the same period
of 2013 driven by the EcoSport SUV and
Ranger one-top pickup truck, boosting share
annually. Although there is concern over
overcapacity due to large-scale investments
in Eco Car production, Ford intends to step
up automobile launches in Thailand
including models in the currently popular
SUV segment. Apart from strengthening
the local market, the automaker also plans
to increase export to other ASEAN
countries, Australia, New Zealand and
AutoAlliance (Thailand) (AAT)
�Plant No. 1 (Pickup Trucks)
Location: Rayong province
SOP: May 1998
Products: Everest, Ranger, diesel engines
APC: 70,000 units
Notes: Also manufactures the Mazda BT-50. AAT’s total annual production
capacity including Mazda models is 140,000 units. Even after the stopping
production of Ford models at Plant No. 2, Plant No. 1 is intended to
continue pickup truck production. For this reason, Ford will maintain its
50 percent stake in AAT.
�Plant No. 2 (Passenger Vehicles)
Location: Rayong province
SOP: Jul. 2009
Products: Fiesta
APC: 50,000 units → production is planned to be discontinued by 2018
Notes: Also Manufactures the Mazda2 and Mazda3. Jul. 2014, Ford
announced that it plans to end cooperation in the area of passenger vehicle
production. Manufacturing equipment used by Ford is to be transferred to
Mazda. Transfer is scheduled to be completed in 2018. Production of the
new Fiesta powered by a 1.0L GTDi Eco Boost engine was discontinued
and transferred to FTM in Jun. 2014.
�Vietnam�
(Local production of the
Fiesta, Focus, EcoSport,
Escape�Everest�Transit
and Ranger by Ford
Vietnam)
�Philippines�
(Closed Santa Rosa plant
at the end of 2012)
�Myanmar�
�Cambodia�
�Indonesia�
�Thailand�
Automobile export
Complementary
auto parts supply
Passenger
vehicle
production
transfer
Ford
50% investment
�New Zealand�
Mazda
50% investment
100% investment
Ford Thailand Manufacturing (FTM)
Location: Rayong province
SOP: Jun. 2012
Products: Focus, EcoSport, Fiesta, Eco Car model (plan),
engines (plan)
APC: 160,000 units
Notes: Invested for 450 million USD. After the closure of the
Santa Rosa plant in the Philippines, production of the Focus
was transferred to Thailand. Eighty five percent of
production is intended for export. Exports to ASEAN,
Australia, New Zealand, South Africa and elsewhere.
Developments:
�Jun. 2012: Began production of the Focus.
�Jan. 2014: Began production of the EcoSport.
�Jul. 2014: Production of the new Fiesta powered by a 1.0L
GTDi Eco Boost engine was transferred from AAT.
�Oct. 2014: Acquired approval to participate in the second
phase of the Eco Car scheme.
–Invested for 18.18 billion THB, the facility is intended to
manufacture 180,000 automobiles and 2,000 engines
annually.
–Aims to promote Thailand as a small automobile
production hub in ASEAN.
�Australia�
(Plant closure in 2016)
�Brunei�
�Malaysia�
(Entrusted production of
the Transit to local
automaker Inocom from
Mar. 2014)
Automobile export
�Oceania�
�ASEAN�
�Canada�
�USA�
�North America�
(Created using company PR materials and various media sources)
Ford Motor: Automobile Auto Parts Supply from Thailand (As of Jan. 2015)
75%
investment
Exportation of the
EcoSport to North
America is under
consideration.

���������� ��� ���� ��������
����� ����� �!"#$%����
FOURIN Asia Automotive Intelligence
0%
1%
2%
3%
4%
5%
6%
0
10
20
30
40
50
60
2009 2010 2011 2012 2013 2014
(1,000 units)
0%
20%
40%
60%
80%
100%
120%
0
50
100
150
200
250
300
2009 2010 2011 2012 2013 2014
(1,000 units)
(Units)
Model 2009 2010 2011 2012 2013 YTD Nov. 2013 YTD Nov. 2014 Period-on-period
Fiesta - 5,002 17,697 28,645 16,855
Focus 1,025 1,680 2,046 5,335 5,219
Everest 770 965 990 445 479
SUV/PPV Escape 238 553 522 623 358
Territory - 1 1 72 25
One-ton pickup truck Ranger 5,599 5,435 7,944 19,745 28,287 25,879 21,543 ▼16.8%
Total 6,607 6,954 9,457 20,885 29,149 26,683 27,756 4.0%
7,632 13,636 29,200 54,865 51,223 47,032 34,616 ▼26.4%
Market share 1.4% 1.7% 3.7% 3.8% 3.8% 3.9% 4.4% 0.5pp
(Units)
Plant Type Segment 2009 2010 2011 2012 2013 YTD Nov. 2013 YTD Nov. 2014 Period-on-period
1,200cc and below - - - - 1,746 132 3,968 30.1-fold
1,201–1,500cc 4,374 54,366 56,234 76,660 61,052 59,030 23,791 ▼59.7%
1,501–1,800cc - 18,952 33,844 32,559 7,688 7,688 135 ▼98.2%
1,801–2,000cc - - 2,992 1,901 432 432 9,202 21.3-fold
Total 4,374 73,318 93,070 111,120 70,918 67,282 37,096 ▼44.9%
Ford only N.A. N.A. N.A. 55,560 38,540 36,266 13,155 ▼63.7%
One-top pickup truck 79,017 112,078 92,807 125,808 139,811 129,918 121,272 ▼6.7%
PPV 6,611 8,357 7,235 8,464 5,575 5,229 4,029 ▼22.9%
Total 85,628 120,435 100,042 134,272 145,386 135,147 125,301 ▼7.3%
Ford only N.A. N.A. N.A. 74,017 85,120 79,082 86,730 9.7%
Total 90,002 193,753 193,112 245,392 216,304 202,429 162,397 ▼19.8%
Ford only N.A. N.A. N.A. 129,577 123,660 115,348 99,885 ▼13.4%
1,200cc and below - - - - - - 551 -
1,201–1,500cc - - - - - - 22,686 -
1,501–1,800cc - - - 9,494 8,096 7,826 3,437 ▼56.1%
1,801–2,000cc - - - 13,790 24,022 22,964 13,409 ▼41.6%
Total - - - 23,284 32,118 30,790 40,083 30.2%
Automobile production total 90,002 193,753 193,112 268,676 248,422 233,219 202,480 ▼13.2%
(Units)
2009 2010 2011 2012 2013 YTD Nov. 2013 YTD Nov. 2014 Period-on-period
77,590 142,873 130,643 117,138 110,945 101,215 111,657 10.3%
86.2% 73.7% 67.7% 47.7% 51.3% 50.0% 68.8% 18.8pp
- - - 16,397 28,369 27,180 32,204 18.5%
- - - 70.4% 88.3% 88.3% 80.3% ▼8.0pp
Automobile export total 77,590 142,873 130,643 133,535 139,314 128,395 143,861 12.0%
Type
AAT
Export ratio
FTM
Export ratio
Automobile sales total
Plant
AAT
Passenger vehicle
One-top pickup
truck
FTM Passenger vehicle
20,349 6,860 ▼66.3%
Commercial
vehicle
804 6,213 7.7-fold
Passenger
vehicle
Small passenger vehi
Asia Company Reports
Hub of Eco Car Models for ASEAN
despite an overall cooling down of the
market. Although the automaker’s five
percent market goal is set for the short to
medium term, the planned release of the
fully-remodeled Everest in 2015 may enable
Ford Motor to realize its goal.
Ford Motor is currently restructuring its
local production structure in an effort to
use Thailand as a production hub of
one-ton pickup trucks and small
automobiles. The automaker aims to
realize rationalization by dividing
production between AutoAlliance Thailand
(AAT) and Ford Thailand Manufacturing
(FTM). Production of the Fiesta was
transferred from AAT’s Plant No. 2 to
FTM in June 2014 and FTM’s annual
production capacity is planned to be
increased by 50,000 units prior to the start
of Eco Car manufacturing. Ford motor is
also engaged in production localization of
gasoline engines. Localized engines are
intended for the automaker’s Eco Car
project (possibly the next-gen Fiesta or Ka
model); however, the same model is also
planned to be exported primarily to
Indonesia. (Kiyoko YAMAMOTO)
Ford Motor: Automobile Sales Volume by Segment in Thailand (2009–2013, YTD Nov. 2013/2014)�
� (Created using data from TAIA and other sources )
Ford Motor: Automobile Sales Volume by Model in Thailand (2009–2013, YTD Nov. 2013/2014)
Ford Motor: Automobile Export Volume by Plant in Thailand (2009–2013, YTD Nov. 2013/2014)�
Note: AAT’s production volume includes that of Mazda. (Created using data from TAIA )
Note: AAT’s export volume includes that of Mazda. (Created using data from TAIA )
Ford Motor: Automobile Sales Volume and Market Share in Thailand
(Actual 2009–2013, Forecast 2014)
Market share (right scale)
One-ton pickup
truck
Small passenger
vehicles
SUV / PPV
Note: Forecast by FOURIN.
(Created using data from TAIA [Thai Automotive Industry Association])
Ford Motor: Automobile Sales Volume and Export Ratio in Thailand
(Actual 2009–2013, Forecast 2014)
Note: Forecast by FOURIN. (Created using data from TAIA )
����
Export ratio (right scale)
����

���������� ��� ���� ��������
����� ����� �!"#$%����
FOURIN Asia Automotive Intelligence
� � � � � � � � � � ����Thailand: Intends to Create Production
General Motors
General Motors Company intends to
promote Thailand as a production base of
small automobiles for the ASEAN market.
In October 2014, GM acquired approval
from the Board of Investment of Thailand
for participating in the second phase of
the Eco Car scheme. The automaker plans
to invest 13.11 billion THB to set up a
market.
In Rayong province, GM has an annual
production capacity of 180,000
automobiles and 130,000 engines,
manufacturing one-ton pickup trucks,
passenger vehicles as well as 2.5L and 2.8L
diesel engines. Apparently, the automaker’s
passenger vehicle production capacity is
manufacturing base in Rayong province
with an annual production capacity of
158,000 units. While GM currently
manufactures one-ton pickup trucks in
Thailand and exports them to over 60
countries around the world, the automaker
will now also engage in small passenger
vehicle production for the Eco Car
GM: Automobile Production Volume by Model in Thailand (2009–2013, YTD Nov. 2013/2014)
� � (Created using data from TAIA)
GM: Automobile Sales Volume by Model in Thailand (2009–2013, YTD Nov. 2013/2014)
� (Created using data from TAIA)
GM: Automobile Sales Volume Composition
by Type and Model in Thailand (2013)
(Created using GM’s PR materials)
GM: Automobile Sales Volume and Market Share
(Actual 2009–2013, Forecast 2014)
Note: Forecast by FOURIN.
(Created using data from TAIA [Thai Automotive Industry Association])
(Units)
Type Engine Displacement Main Models 2009 2010 2011 2012 2013
YTD Nov.
2013
YTD Nov.
2014
Period-on-
period
1,201–1,500cc Sonic 3,024 5,042 3,830 15,490 14,761 14,137 3,116 ▼78.0%
1,501–1,800cc Sonic, Cruze 2,079 5,319 14,812 10,486 5,105 4,682 2,245 ▼52.1%
1,801–2,000cc Cruze, Captiva 3,180 6,442 5,891 9,911 6,074 5,696 2,429 ▼57.4%
2,001–2,500cc Captiva 931 1,454 4,721 5,825 2,046 1,964 808 ▼58.9%
Total 9,214 18,257 29,254 41,712 27,986 26,479 8,598 ▼67.5%
PPV TrailBlazer - - - 16,242 17,131 16,057 10,023 ▼37.6%
One-ton pickup truck Colorado 28,636 55,938 36,447 66,655 50,382 48,363 33,069 ▼31.6%
Total 28,636 55,938 36,447 82,897 67,513 64,420 43,092 ▼33.1%
37,850 74,195 65,701 124,609 95,499 90,899 51,690 ▼43.1%
Automobile export total 18,535 20,634 17,907 42,780 43,208 40,268 31,880 ▼20.8%
Export ratio 49.0% 27.8% 27.3% 34.3% 45.2% 44.3% 61.7% 17.4pp
Passenger
vehicle
Pickup truck
Automobile production total
(Units)
Model Segment 2009 2010 2011 2012 2013 YTD Nov. 2013 YTD Nov. 2014 Period-on-period
Aveo B 2,940 4,309 8,351 4,400 377
Sonic B - - - 8,256 14,088
Optra C 4,212 3,509 65 4 -
Cruze C - 274 8,296 8,824 4,126
Lumina E 12 1 - - - - - -
Zafira MPV - - - - 26
Spin MPV - - - - 844
Captiva SUV 2,237 4,078 6,095 11,170 6,249
TrailBlazer SUV (PPV) - - - 5,495 6,359
Suburban SUV - - - - -
Colorado One-ton pickup truck 5,710 7,855 8,788 37,306 24,320 22,769 11,699 ▼48.6%
Automobile sales total 15,111 20,026 31,595 75,455 56,389 53,019 23,702 ▼55.3%
Market share 2.8% 2.5% 4.0% 5.3% 4.2% 4.4% 3.0% ▼1.4pp
17,859 6,004 ▼66.4%
674 1,065 58.0%
11,717 4,934 ▼57.9%
Small
passenger
vehicle
25.7%
Medium/large
passenger
vehicle
7.3%
MPV 1.5%
SUV/PPV
22.4%
One-ton
pickup truck
43.1%
Sonic
25.0%
Aveo
0.7%
Cruze
7.3%
Spin
1.5%Trail Blazer
11.3%
Captiva
11.1%
Colorado
43.1%
Passenger
vehicle
Commercial
vehicle
Market share
(right scale)
0%
1%
2%
3%
4%
5%
6%
0
20
40
60
80
100
120
2009 2010 2011 2012 2013 2014
(1,000 units)
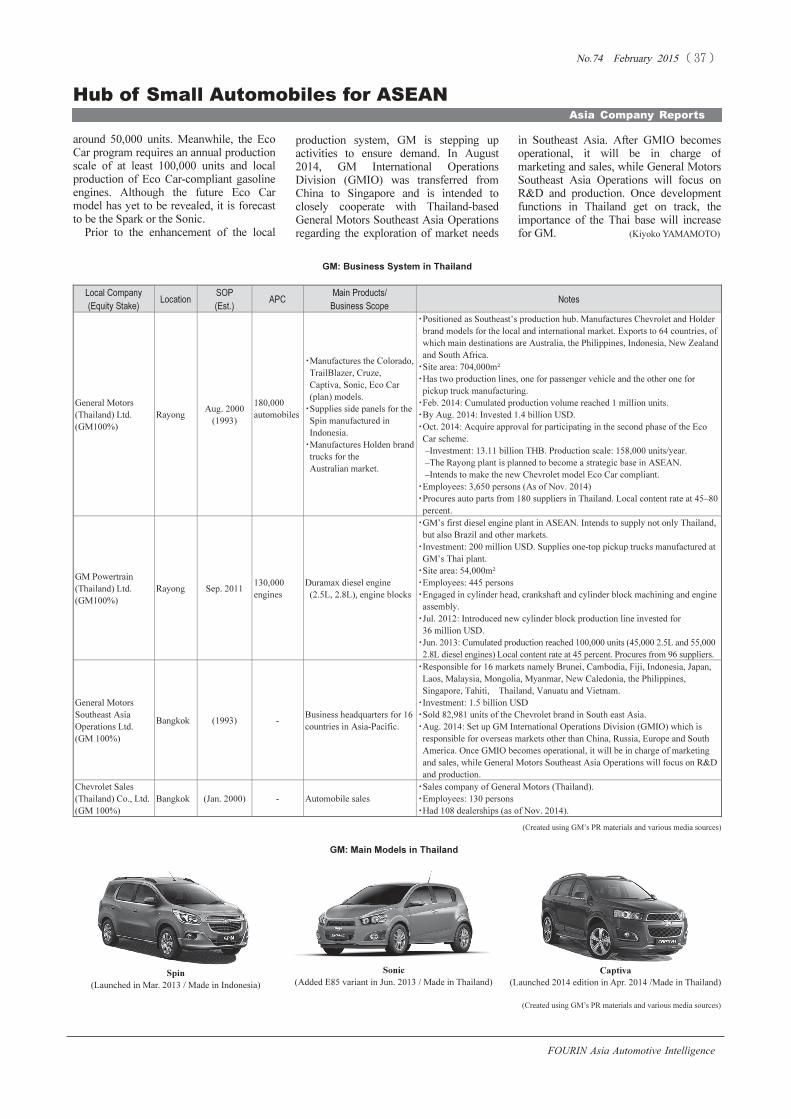
���������� ��� ���� ��������
����� ����� �!"#$%����
FOURIN Asia Automotive Intelligence
Asia Company Reports
Hub of Small Automobiles for ASEAN
around 50,000 units. Meanwhile, the Eco
Car program requires an annual production
scale of at least 100,000 units and local
production of Eco Car-compliant gasoline
engines. Although the future Eco Car
model has yet to be revealed, it is forecast
to be the Spark or the Sonic.
Prior to the enhancement of the local
production system, GM is stepping up
activities to ensure demand. In August
2014, GM International Operations
Division (GMIO) was transferred from
China to Singapore and is intended to
closely cooperate with Thailand-based
General Motors Southeast Asia Operations
regarding the exploration of market needs
in Southeast Asia. After GMIO becomes
operational, it will be in charge of
marketing and sales, while General Motors
Southeast Asia Operations will focus on
R&D and production. Once development
functions in Thailand get on track, the
importance of the Thai base will increase
for GM. (Kiyoko YAMAMOTO)
GM: Business System in Thailand
Local Company
(Equity Stake)
Location
SOP
(Est.)
APC
Main Products/
Business Scope
Notes
General Motors
(Thailand) Ltd.
(GM100%)
Rayong
Aug. 2000
(1993)
180,000
automobiles
�Manufactures the Colorado,
TrailBlazer, Cruze,
Captiva, Sonic, Eco Car
(plan) models.
�Supplies side panels for the
Spin manufactured in
Indonesia.
�Manufactures Holden brand
trucks for the
Australian market.
�Positioned as Southeast’s production hub. Manufactures Chevrolet and Holder
brand models for the local and international market. Exports to 64 countries, of
which main destinations are Australia, the Philippines, Indonesia, New Zealand
and South Africa.
�Site area: 704,000m²
�Has two production lines, one for passenger vehicle and the other one for
pickup truck manufacturing.
�Feb. 2014: Cumulated production volume reached 1 million units.
�By Aug. 2014: Invested 1.4 billion USD.
�Oct. 2014: Acquire approval for participating in the second phase of the Eco
Car scheme.
–Investment: 13.11 billion THB. Production scale: 158,000 units/year.
–The Rayong plant is planned to become a strategic base in ASEAN.
–Intends to make the new Chevrolet model Eco Car compliant.
�Employees: 3,650 persons (As of Nov. 2014)
�Procures auto parts from 180 suppliers in Thailand. Local content rate at 45–80
percent.
GM Powertrain
(Thailand) Ltd.
(GM100%)
Rayong Sep. 2011
130,000
engines
Duramax diesel engine
(2.5L, 2.8L), engine blocks
�GM’s first diesel engine plant in ASEAN. Intends to supply not only Thailand,
but also Brazil and other markets.
�Investment: 200 million USD. Supplies one-top pickup trucks manufactured at
GM’s Thai plant.
�Site area: 54,000m²
�Employees: 445 persons
�Engaged in cylinder head, crankshaft and cylinder block machining and engine
assembly.
�Jul. 2012: Introduced new cylinder block production line invested for
36 million USD.
�Jun. 2013: Cumulated production reached 100,000 units (45,000 2.5L and 55,000
2.8L diesel engines) Local content rate at 45 percent. Procures from 96 suppliers.
General Motors
Southeast Asia
Operations Ltd.
(GM 100%)
Bangkok (1993) -
Business headquarters for 16
countries in Asia-Pacific.
�Responsible for 16 markets namely Brunei, Cambodia, Fiji, Indonesia, Japan,
Laos, Malaysia, Mongolia, Myanmar, New Caledonia, the Philippines,
Singapore, Tahiti, Thailand, Vanuatu and Vietnam.
�Investment: 1.5 billion USD
�Sold 82,981 units of the Chevrolet brand in South east Asia.
�Aug. 2014: Set up GM International Operations Division (GMIO) which is
responsible for overseas markets other than China, Russia, Europe and South
America. Once GMIO becomes operational, it will be in charge of marketing
and sales, while General Motors Southeast Asia Operations will focus on R&D
and production.
Chevrolet Sales
(Thailand) Co., Ltd.
(GM 100%)
Bangkok (Jan. 2000) - Automobile sales
�Sales company of General Motors (Thailand).
�Employees: 130 persons
�Had 108 dealerships (as of Nov. 2014).
�
� � (Created using GM’s PR materials and various media sources)
GM: Main Models in Thailand
� � (Created using GM’s PR materials and various media sources)
Spin
(Launched in Mar. 2013 / Made in Indonesia)
Sonic
(Added E85 variant in Jun. 2013 / Made in Thailand)
Captiva
(Launched 2014 edition in Apr. 2014 /Made in Thailand)

���������� ��� ���� ��������
����� ����� �!"#$%����
FOURIN Asia Automotive Intelligence
8.9
9.69.8
10.2
45.7%
42.5%42.1%
44.0%
0%
10%
20%
30%
40%
50%
0
3
6
9
12
15
2010 2011 2012 2013
(Trillion KRW)
2.33.0
3.7 3.4
44.9%
54.4%
64.0%
66.9%
0%
15%
30%
45%
60%
75%
0
1
2
3
4
5
2010 2011 2012 2013
(Trillion KRW)
� � � � � � � � � China: Production Localization Is Driven by
Korean Battery� Manufacturers
China lowered corporate average fuel
economy (CAFE) limit to 5.0L/100km in
2012 which must be met by 2020 in
response to worsening environmental
pollution and insufficient energy supply.
The government also formulated measures
on subsidies and purchase tax exemption in
an effort to boost energy-saving and
new-energy vehicle (ESV, NEV) use.
Korean battery manufacturers LG Chem,
Samsung SDI and SK Innovation among
others are setting up local manufacturing
bases and forging ties with local partners in
The joint venture received automated
production line and manufacturing
technology from SK Group. Initial
annual production capacity of the plant is
set at 12,000 sets of three-element
lithium-ion batteries (LIBs). In contrast,
Samsung SDI and LG Chem were still at
the plant construction stage as of January
2015. In August 2014, Samsung SDI’s
50 percent-owned local subsidiary began
construction of a plant in Xi’an to
manufacture battery cells. Full operation
is scheduled to begin in October 2015
anticipation of growing demand for
traction batteries, a key component of
ESVs and NEVs. By entering ahead of
other companies, they intend to capture a
significant share of China’s traction battery
market.
Among Korean battery makers, SK
Innovation was the first one to start
traction battery production for NEVs in
China. In July 2014, Beijing BESK
Technology, a tripartite joint venture of
BAIC Group, Beijing Electronics Holding
and SK Innovation, began production.
LG Chem: Sales Revenue in China and Chinese Share
(2010–2013)
Samsung SDI: Sales Revenue in China and Chinese Share
(2010–2013)�
Note: Including non-automotive business. (Created using LG Chem’s annual reports)
Sales revenue in China
(left scale)
Sales revenue in China
(left scale)�
Chinese share(right scale)
Chinese share(right scale)�
Note: Including non-automotive business. (Created using Samsung SDI’s annual reports)
Notes: *1 Sungrow Power Supply manufactures power supply equipment for solar and wind power projects. *2 China New-energy Vehicle, a joint venture between China Chengtong Holdings Group
(logistics company) and Beijing iDrive Auto Technology (engaged in R&D of traction systems for NEVs), was set up in early 2014 to develop, manufacture and sell BEVs for urban logistics.�
(Created using company PR materials and various media sources)
Korean Battery Manufacturers: Major Business Developments in China (As of Jan. 2015)
Manufacturer Subject Details
Samsung
SDI
Establishment of joint venture for
LIB cell manufacturing plant
�Aug. 2014: Samsung Huaxin Power Battery, 50 percent owned by Samsung, began construction of a plant for automotive
LIB manufacturing in Xi’an.
–Invested for 600 million USD. Planned to be built in two phases of which the first phase is to be invested for 299 million USD.
–In the first phase, one battery production line is planned to be set up whose full operation is scheduled to start in Oct. 2015.
Monthly production scale of LIB cells is projected to reach 700,000 units. The second phase is planned to be finished by
2020, increasing LIB cell production scale to 3.6 million units.
Establishment of joint venture for
energy storage business
�Nov. 2014: Signed a contract with Sungrow Power Supply to set up two joint ventures in connection to energy storage
systems. The first one called Samsung Sungrow Energy Storage Battery is to engage in development, production and sales of
energy storage LIB packs for power plants, while the second one called Samsung Sungrow Energy Storage Power Supply is
intended to develop, manufacture and sell converter systems for power plants.
Tie-up with China New-energy
Vehicle
�Feb. 2014: Signed a memorandum of understanding with China New-energy Vehicle regarding the development, production and
sales of logistical vehicles. Samsung SDI will provide LIBs to trucks manufactured by China New-energy Vehicle’s subsidiary.
Traction battery supply to BMW
i3/i8
�Sep. 2014: Import sales began of the BMW i3 BEV and BMW i8 PHEV in China. Both models are powered by Samsung SDI’s LIB.
–The i3’s travel distance on one full charge is 160km. The i8’s fuel consumption is 2.1L on 100km.
LG Chem
Establishment of plant for LIB
cell/pack manufacturing
�Oct. 2014: Held construction start ceremony of an automotive LIB manufacturing base in Nanjing, Jiangsu.
–Invested for approx. 500 million USD, the facility is scheduled to have an annual production capacity in excess of 100,000
units after it formally starts mass production in H2 2016.
Supply contract with SAIC
Group, Qoros Automobile
�Jun. 2014: According to media sources, LG Chem concluded agreements with SAIC Group and Qoros Automobile regarding
the supply of LIBs. LG Chem has also formed deals with Changan Group and Shanghai GM. The four automakers have
ordered over 100,000 LIBs so far.
SK
Innovation
Establishment of plant for
three-element LIB manufacturing
�Jul. 2014: Beijing BESK Technology, a tripartite joint venture of BAIC Group, Beijing Electronics Holding and SK
Innovation, began production.
–The joint venture received automated production line and manufacturing technology from SK Group. Film and
other materials are also supplied by SK Group. Initial annual production capacity of the plant is set at 12,000 sets of
three-element LIBs.
Establishment of plant for
battery material manufacturing
�Feb. 2014: The first phase of SK’s lithium battery cathode material manufacturing base in Chongqing began production.
After the second phase goes on line by 2017, annual production capacity is intended to reach 9,600 tons. SK is aiming to
build up an industrial chain for LIBs in China.
Battery supply to BAIC Beijing
Electric Vehicle
�Dec. 2014: The Beijing ES210 (travel distance on one full charge is 210km) and EV200 (200–260km) BEVs were launched.
Both models are fitted with Beijing BESK Technology’s three-element LIB.
�Apparently, the E150EV also switched to Beijing BESK Technology’s three-element LIB.
�

���������� ��� ���� ��������
����� ����� �!"#$%����
FOURIN Asia Automotive Intelligence
Asia Company Reports
Heavy Profit Dependence on Chinese Market
with an initial monthly production
capacity of 700,000 units. Meanwhile,
LG Chem’s local LIB manufacturing
base is slated to start operation at the end
of 2015.
Korean manufacturers are also
advancing local production of battery
materials in an effort to set up a fully
localized production system from battery
material procurement to battery pack
production. SK Group set up a wholly-
owned battery materials manufacturing
base in Chongqing in December 2011
whose first plant formally began
production in February 2014. By 2017,
the second plant is scheduled to start
operation with an aim to increase
cathode material production for LIBs to
9,600 tons annually.
SK Innovation, which already began
production of battery packs, mainly
supplies BAIC Group. The automaker’s
Beijing brand ES210 and EV200 battery
electric models are powered by SK
Innovation’s LIBs. According to media
sources in June 2014, LG Chem
concluded agreements with SAIC Group
and Qoros Automobile regarding the
supply of LIBs. LG Chem has also
formed deals with Changan Group and
Shanghai GM. The four automakers have
ordered over 100,000 LIBs so far. As for
Samsung SDI, the battery maker plans to
supply LIBs to logistical vehicles made
by China New-energy Vehicle.
Meanwhile, Japanese and Chinese LIB
suppliers are stepping up operations in
China, intensifying competition in
China’s LIB market. (Shiwang LIU)
APC: Annual production capacity. MPC: Monthly production capacity. (Created using company PR materials and various media sources)
Parent Plant
Established
(SOP)
Location Ownership Products Notes
Samsung
SDI
Samsung Huaxin Power
Battery Co., Ltd.
Jun. 2014
(Apr. 2015 forecast)
Xi’an,
Shaanxi
Samsung SDI 50%,
Huaxin Group 35%,
Gaoke Group 15%
LIB cells for EVs
�Investment: 600 million USD
�MPC: 700,000 units (initial)�
→3.6 million units (by 2020)
Samsung Sungrow
(Hefei) Energy Storage
Battery Co., Ltd.
Announced in Nov.
2014
Hefei,
Anhui
Samsung SDI 65%,
Sungrow Power Supply 35%
Energy storage LIB packs
for power plants
Samsung Sungrow
(Hefei) Energy Storage
Power Supply Co., Ltd.
Announced in Nov.
2014
Hefei,
Anhui
Sungrow Power Supply 65%,
Samsung SDI 35%
Converter systems for
power plants
LG Chem
Nanjing LG Chem New
Energy Battery Co., Ltd.
Sep. 2014
Nanjing,
Jiangsu
LG Chem 50%,
Nanjing Xingong Investment
Group/Nanjing Zijin (Xingang)
Special Community for Hi-tech
Entrepreneurships 50%
LIB cells, modules and
packs for EVs
�Investment: 500 million USD
�APC: over 100,000 units
SK
Innovation
SK (Chongqing) Lithium
Ion Battery Materials
Co., Ltd.
Dec. 2011
(Feb. 2014�
Chongqing SK 100%
Cathode materials for
LIBs
�Investment: 100 million USD
�APC: 9,600 tons
Beijing BESK
Technology Co., Ltd.
Dec. 2013
(Jul. 2014)
Beijing
Beijing Electronics Holding 41%,
SK Innovation 40%,
BAIC Group 19%
Three-element LIB packs
for EVs
�Investment: 1 billion CNY
�APC: 12,000 sets (initial)
Korean Battery manufacturers: Main Battery Production Plans in China (As of Jan. 2015)
(Created using company PR materials and various media sources)
BMW
Qoros Automobile
Changan Group
SAIC Group
GM
�EV200�
�E150EV�
Planned to be used by the
company’s electric logistic vehicle
�BMW i3� �BMW i8�
�Volt�
BEV under development
Possibly launched in 2017
Supply of battery module to
BP34 traction battery (2016)
�ES210�
Supply of battery module (cell imported from
Korea) to NV21 traction battery (2016)
Notes: Dotted line: Plan. Solid line: Actual.
Korean Battery manufacturers: Main Supply Relationships in China (As of Jan. 2015)
BAIC BJEV
China New-energy Vehicle

���������� ��� ���� ��������
����� ����� �!"#$%����
FOURIN Asia Automotive Intelligence
Japan: Monthly HEV/PHEV/BEV Passenger Vehicle Sales Volume (Jan.–Oct. 2014)
Sales
October 2014: HEV/PHEV/BEV Passenger Vehicle Sales Volume Down 10.7 Percent to 72,000 Units
�Overall: Sales volume of HEV/PHEVs went down 10.8 percent compared to the same period of 2013 to 70,621 units, BEVs decreased 2.7 percent to 1,312 units.
�Toyota/Lexus: HEV/PHEV sales volume decreased 12.8 percent. Apart from the Prius PHV and Camry, all other Toyota models dropped below the volume of the same month in 2013.
Looking at the Lexus brand, although the CT200h increased and the NX300h added to the total volume, the luxury brand saw an overall drop of 7.2 percent to 2,877, dropping below
the 3,000-unit level for the second consecutive month.
�Honda: HEV/PHEV sales volume decreased 3.8 percent to 16,559 units. The Fit Hybrid declined 31.8 percent, seeing negative growth for the first time since August 2013. Moreover,
the Fit Shuttle Hybrid, Insight and Accord Hybrid all fell by over 40 percent.
Japan: HEV/PHEV/BEV Passenger Vehicle Sales Volume by Brand and Model (Jan.–Oct.�2014)
Notes: Processed based on data independently acquired by FOURIN.�
�HEV/PHEV (Unit: Vehicles)
Brand Model Jan Feb Mar Apr May Jun Jul Aug Sep Oct
Period-on-
period
Nov Dec YTD Total
Period-on-
period
Aqua 22,885 23,973 31,146 13,683 12,138 19,812 23,909 14,543 20,255 18,031 ▼9.8% 200,375 ▼12.4%
Corolla Hybrid 6,241 5,166 6,983 4,917 4,855 5,680 5,924 3,546 5,264 4,502 ▼39.1% 53,078 3.5-fold
Prius incl. Prius α, Prius PHV 20,162 23,501 28,274 8,692 9,788 13,557 16,865 10,675 15,308 13,183 ▼36.9% 160,005 ▼26.0%
Of which Prius α 9,360 10,705 12,309 3,592 4,189 5,185 6,128 4,111 5,585 5,246 ▼38.2% 66,410 ▼25.1%
Of which Prius PHV 337 470 216 69 153 352 667 470 944 583 79.9% 4,261 20.3%
SAI 2,667 2,579 2,963 812 775 972 1,000 712 1,097 918 ▼62.3% 14,495 89.0%
Camry 761 829 1,176 482 453 495 505 349 911 1,102 19.7% 7,063 ▼30.4%
Crown Hybrid 3,916 4,044 5,389 1,828 1,916 2,165 2,440 2,386 3,112 2,598 ▼22.4% 29,794 ▼34.9%
Harrier Hybrid 762 2,204 2,890 1,913 2,108 2,143 2,214 1,303 1,568 1,748 - 18,853 -
Voxy Hybrid - 314 5,444 4,536 4,839 5,187 5,720 2,596 3,489 3,374 - 35,499 -
Noah Hybrid - 247 4,223 3,604 3,600 3,331 3,087 1,650 3,181 2,930 - 25,853 -
Estima Hybrid 698 720 976 647 427 415 411 295 364 437 ▼28.4% 5,390 ▼20.9%
Alphard Hybrid 563 794 994 337 283 343 356 201 373 272 ▼61.1% 4,516 ▼18.3%
Vellfire Hybrid 562 502 720 335 277 256 333 204 290 253 ▼47.3% 3,732 ▼22.1%
Total 59,217 64,873 91,178 41,786 41,459 54,356 62,764 38,460 55,212 49,348 ▼13.1% 558,653 3.3%
CT200h 659 999 1,509 644 676 864 782 491 555 455 73.7% 7,634 43.7%
HS250h 337 364 587 140 122 180 320 191 157 181 ▼21.6% 2,579 ▼50.5%
IS300h 1,137 984 1,280 445 504 393 508 389 394 323 ▼78.3% 6,357 ▼0.2%
GS300h 389 294 420 187 181 258 238 42 258 270 ▼12.9% 2,537 8.2-fold
GS450h 127 104 170 66 86 122 85 18 123 120 ▼32.6% 1,021 ▼46.8%
LS600h 231 229 404 111 132 192 182 158 147 100 ▼59.5% 1,886 ▼56.9%
RX450h 472 472 732 265 276 296 215 136 204 195 ▼49.1% 3,263 ▼22.5%
NX300h - - - - - - - 424 1,231 1,061 - 2,716 -
RC300h - - - - - - - - 9 172 - 181 -
Total 3,352 3,446 5,102 1,858 1,977 2,305 2,330 1,849 3,078 2,877 ▼7.2% 28,174 1.7%
Toyota/Lexus Total 62,569 68,319 96,280 43,644 43,436 56,661 65,094 40,309 58,290 52,225 ▼12.8% 586,827 3.2%
Fit Hybrid 15,631 7,106 18,207 10,890 7,147 8,955 8,869 6,720 9,422 7,213 ▼31.8% 100,160 2.3-fold
Fit Shuttle Hybrid 1,006 1,753 2,654 734 814 873 1,104 883 1,036 874 ▼42.8% 11,731 ▼43.1%
Insight 368 200 201 78 40 34 60 25 60 14 ▼95.9% 1,080 ▼67.5%
Accord Hybrid 1,457 1,208 985 592 535 445 504 321 408 407 ▼81.1% 6,862 ▼2.9%
Of which Accord PHV 24 26 10 8 3 7 4 2 7 7 - 98 -
Vezel Hybrid 4,716 2,406 6,975 6,784 6,802 10,010 9,444 6,076 8,544 5,934 - 67,691 -
CR-Z 100 234 313 68 85 83 39 52 84 86 6.2% 1,144 ▼57.6%
Freed Hybrid 1,809 1,785 2,924 768 1,221 2,477 2,309 1,806 2,856 2,031 11.3% 19,986 ▼5.0%
Freed Spike Hybrid 704 655 532 209 470 - - - - - - 2,570 ▼71.1%
Total 25,791 15,347 32,791 20,123 17,114 22,877 22,329 15,883 22,410 16,559 ▼3.8% 211,224 97.9%
Fuga Hybrid 92 121 128 28 48 51 60 47 54 51 ▼60.2% 680 ▼39.2%
Cima 45 51 96 18 23 38 34 22 40 25 ▼40.5% 392 ▼43.8%
Skyline Hybrid - 1,533 3,097 389 347 386 531 550 497 365 - 7,695 -
Total 137 1,705 3,321 435 418 475 625 619 591 441 2.6-fold 8,767 4.8-fold
Dignity 2 2 4 3 1 1 3 1 - - - 17 ▼43.3%
Outlander PHEV 1,298 1,630 736 226 563 1,300 700 457 1,450 538 ▼3.9% 8,898 38.7%
Total 1,300 1,632 740 229 564 1,301 703 458 1,450 538 ▼4.1% 8,915 38.3%
Mazda Axela 1,220 992 1,403 202 385 436 495 416 453 235 ▼11.7% 6,237 23.4-fold
Subaru XV Hybrid 1,762 1,526 1,966 1,270 1,262 738 606 424 662 335 ▼61.2% 10,551 99.5%
Altis 4 5 4 1 8 12 9 6 7 5 ▼44.4% 61 ▼48.3%
Mebius 28 28 56 12 18 21 20 13 19 14 ▼74.5% 229 ▼39.7%
Total 32 33 60 13 26 33 29 19 26 19 ▼70.3% 290 ▼41.8%
A6 hybrid 9 11 22 9 1 6 1 3 3 3 ▼72.7% 68 ▼76.6%
A8 hybrid 2 1 1 - 2 2 - - 2 1 ▼75.0% 11 ▼89.8%
Q5 hybrid 4 7 8 2 4 3 1 1 - - - 30 ▼72.7%
Total 15 19 31 11 7 11 2 4 5 4 ▼80.0% 109 ▼78.5%
ActiveHybrid 3 37 46 65 18 37 53 22 17 28 21 ▼58.0% 344 ▼60.6%
ActiveHybrid 5 17 23 37 15 20 43 16 14 22 10 ▼72.2% 217 ▼51.5%
ActiveHybrid 7 20 51 93 24 15 30 4 12 15 8 ▼61.9% 272 ▼6.5%
ActiveHybrid X6 - - - - - - - - - - - - -
i8 - - - - - - - 2 1 19 - 22 -
Total 74 120 195 57 72 126 42 45 66 58 ▼45.8% 855 ▼46.9%
E400 22 21 61 8 22 10 - 15 20 9 ▼74.3% 188 ▼11.3%
S400 Hybrid 210 301 418 162 111 202 193 256 491 188 - 2,532 633-fold
Total 232 322 479 170 133 212 193 271 511 197 5.6-fold 2,720 12.6-fold
Cayenne S Hybrid 5 5 12 6 6 7 1 3 2 1 ▼87.5% 48 ▼65.5%
Panamera S Hybrid - - 31 17 4 5 9 10 14 8 100.0% 98 3.1-fold
Total 5 5 43 23 10 12 10 13 16 9 ▼25.0% 146 ▼14.1%
VW Touareg Hybrid 4 4 6 3 3 - 1 2 1 1 ▼87.5% 25 ▼77.1%
Japan HEV/PHEV Passenger Vehicle Sales Total 93,141 90,024 137,315 66,180 63,430 82,882 90,129 58,463 84,481 70,621 ▼10.8% 836,666 20.9%
Period-on-period 74.6% 24.6% 35.8% 23.5% 26.3% 29.6% 24.8% ▼0.3% ▼3.7% ▼10.8% 20.9%
HEV/PHEV Composition Ratio of Passenger Vehicle Market 21.5% 18.4% 20.6% 22.6% 20.8% 21.9% 23.0% 20.8% 19.6% 21.5% 210.6%
�BEV (Unit: Vehicles)
Brand Model Jan Feb Mar Apr May Jun Jul Aug Sep Oct
Period-on-
period
Nov Dec YTD Total
Period-on-
period
Toyota eQ - - - - - - - - - - - - ▼100.0%
Honda Fit EV 4 7 - 3 - - - - - 1 ▼90.0% 15 ▼78.6%
Nissan Leaf 1,241 1,903 1,201 508 743 1,205 1,408 912 1,756 1,098 ▼12.6% 11,975 14.3%
Mitsubishi i-MiEV 55 238 130 18 25 41 102 51 97 102 29.1% 859 ▼36.0%
BMW i3 - 63 5 82 81 110 62 51 53 52 - 559 -
smart fortwo 31 49 30 9 - - 28 56 59 59 29.5-fold 321 2.5-fold
Tesla Model S - - - - - - - 4 38 n.a. - 42 -
1,331 2,260 1,366 620 849 1,356 1,600 1,074 2,003 1,312 ▼2.7% 13,771 14.5%
Period-on-period 8.5% 22.5% 31.5% ▼20.6% 5.3% 19.6% 40.0% 5.5% 19.2% ▼2.7% 14.5%
BEV Composition Ratio of Passenger Vehicle Market 0.3% 0.5% 0.2% 0.2% 0.3% 0.4% 0.4% 0.4% 0.5% 0.4% 3.5%
Daihatsu
Japan BEV Passenger Vehicle Sales Total
Audi
BMW
Mercedes-Benz
Porsche
Toyota
Lexus
Honda
Nissan
Mitsubishi

���������� ��� ���� ��������
����� ����� �!"#$%����
FOURIN Asia Automotive Intelligence
Production/Sales
Japan: Monthly Vehicle Production/Sales Volume of Japanese Automakers (Jan.–Nov. 2014)
Japan: Vehicle Production of Japanese Automakers (Jan.–Nov. 2014)
Japan: Vehicle Sales of Japanese Automakers (Jan.–Nov. 2014)
Japan: Vehicle Production of Japanese Automakers by Type and Growth Rate (Dec. 2012�Nov. 2014)
Japan: Vehicle Sales of Japanese Automakers by Type and Growth Rate (Dec. 2012�Nov.�2014)
Automaker Jan Feb Mar Apr May Jun Jul Aug Sep Oct Nov Dec YTD Total
Daihatsu Motor 61,808 69,602 91,220 50,195 50,647 60,015 48,636 35,593 61,485 48,025 56,499 633,725
Fuji Heavy Industries 14,627 16,501 28,782 7,896 8,947 10,795 14,949 11,113 19,598 11,542 11,578 156,328
Hino Motors 3,617 4,702 9,349 1,951 2,702 4,576 3,970 4,050 7,375 4,114 5,213 51,619
Honda Motor 91,499 85,942 121,756 54,180 53,994 72,913 70,963 52,750 78,465 59,152 51,479 793,093
Isuzu Motors 4,297 5,751 11,888 2,772 4,275 5,617 5,849 5,778 11,071 4,867 5,782 67,947
Mazda Motor 21,978 25,737 34,167 10,874 14,288 14,449 15,465 13,758 21,575 17,404 18,685 208,380
Mitsubishi Fuso Truck and Bus 2,326 3,463 7,410 1,785 2,505 4,058 3,359 3,003 4,147 3,276 3,276 38,608
Mitsubishi Motors 11,822 15,847 20,903 8,427 9,158 10,616 10,070 6,853 14,001 6,636 8,656 122,989
Nissan Motor 70,602 85,195 106,711 41,591 44,484 51,410 58,205 41,440 63,583 42,668 47,648 653,537
Suzuki Motor 63,358 67,285 89,694 59,516 56,760 67,687 65,509 48,165 69,372 58,088 65,678 711,112
Toyota Motor 131,008 159,371 217,522 93,392 98,103 126,068 146,016 93,223 135,869 120,941 117,572 1,439,085
UD Trucks 630 840 1,845 455 721 941 676 727 1,096 915 1,084 9,930
12 Total 477,572 540,236 741,247 333,034 346,584 429,145 443,667 316,453 487,637 377,628 393,150 4,886,353
(Unit: Vehicles)
Automaker Jan Feb Mar Apr May Jun Jul Aug Sep Oct Nov Dec YTD Total
Daihatsu Motor 74,636 74,598 80,270 60,946 63,397 69,573 66,597 48,626 58,454 58,586 57,691 713,374
Fuji Heavy Industries 55,600 49,956 62,069 53,120 55,982 59,924 66,847 45,707 62,382 67,759 57,923 637,269
Hino Motors 12,408 11,846 13,401 11,957 12,211 14,211 15,417 11,775 15,207 15,867 14,814 149,114
Honda Motor 97,145 84,883 95,031 78,809 80,500 87,635 84,898 59,232 76,997 75,994 62,044 883,168
Isuzu Motors 20,461 21,117 24,451 21,580 22,388 23,117 25,250 18,577 24,150 22,829 22,629 246,549
Mazda Motor 81,917 82,757 87,238 76,913 75,933 83,104 83,818 59,651 86,811 81,476 62,492 862,110
Mitsubishi Fuso Truck and Bus 8,977 9,539 9,420 7,603 7,310 8,691 9,678 5,104 9,753 9,415 8,617 94,107
Mitsubishi Motors 45,855 56,110 64,022 55,185 52,257 60,169 62,174 39,081 60,345 49,103 46,655 590,956
Nissan Motor 80,360 87,126 88,754 61,440 62,026 77,865 79,267 61,737 71,134 73,111 62,806 805,626
Suzuki Motor 87,932 83,972 103,068 86,224 89,817 92,842 91,473 74,144 86,000 89,468 87,102 972,042
Toyota Motor 293,737 299,643 310,119 254,896 250,477 278,329 307,356 209,762 297,861 271,285 258,814 3,032,279
UD Trucks 1,775 1,850 1,918 1,811 1,741 1,857 1,967 1,351 1,957 2,043 1,702 19,972
12 Total 860,803 863,397 939,761 770,484 774,039 857,317 894,742 634,747 851,051 816,936 743,289 9,006,566
(Unit: Vehicles)
�80%
�60%
�40%
�20%
0%
20%
40%
60%
80%
100%
120%
140%
160%
180%
0
100
200
300
400
500
600
700
800
900
1,000
1,100
1,200
1,300
Dec Jan Feb Mar Apr May Jun Jul Aug Sep Oct Nov Dec Jan Feb Mar Apr May Jun Jul Aug Sep Oct Nov
2012 2013 2014
(Period-on-period)(1,000 units)
Passenger vehicle Commercial vehicle Growth rate
�100%
�80%
�60%
�40%
�20%
0%
20%
40%
60%
80%
100%
0
100
200
300
400
500
600
700
800
900
1,000
Dec Jan Feb Mar Apr May Jun Jul Aug Sep Oct Nov Dec Jan Feb Mar Apr May Jun Jul Aug Sep Oct Nov
2012 2013 2014
(Period-on-period)(1,000 units)
Passenger vehicle Commercial vehicle Growth rate
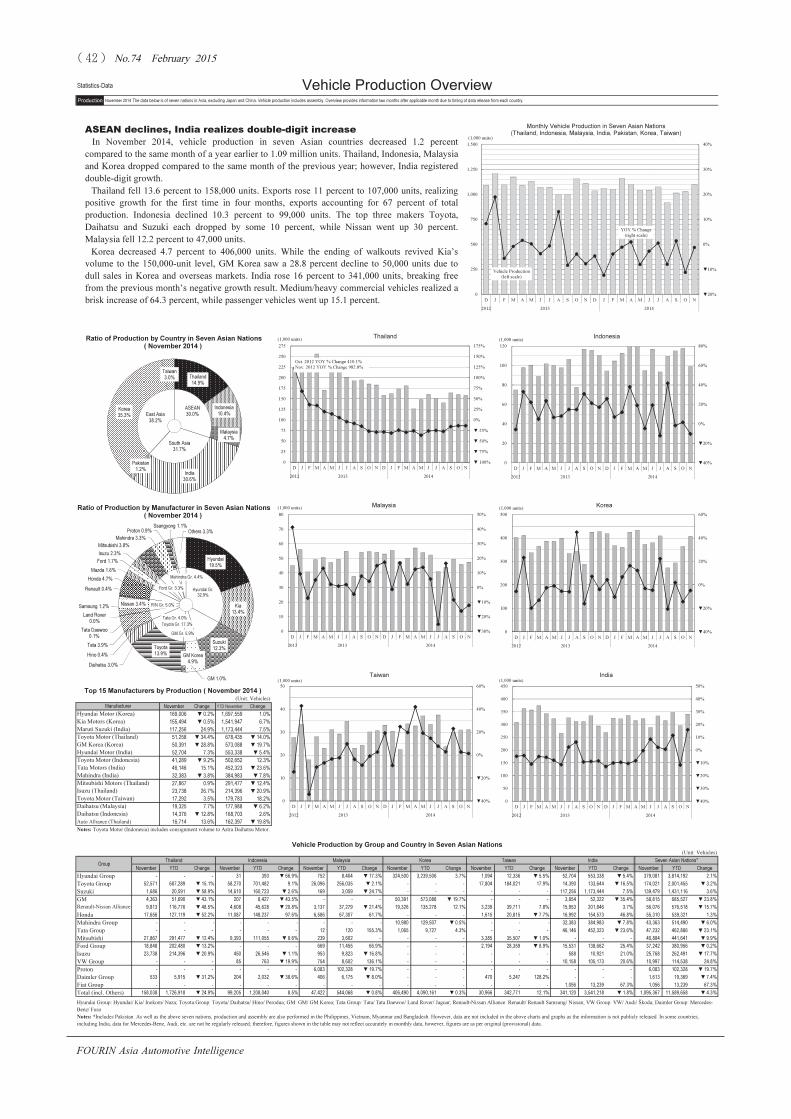
���������� ��� ���� ��������
����� ����� �!"#$%����
Production November 2014 The data below is of seven nations in Asia, excluding Japan and China. Vehicle production includes assembly. Overview provides information two months after applicable month due to timing of data release from each country.
(Unit: Vehicles)
November Change YTD November Change
Hyundai Motor (Korea) 169,006 ▼0.2% 1,697,559 1.0%
Kia Motors (Korea) 155,494 ▼0.5% 1,541,947 6.7%
Maruti Suzuki (India) 117,256 24.9% 1,173,444 7.5%
Toyota Motor (Thailand) 51,258 ▼34.4% 678,435 ▼14.0%
GM Korea (Korea) 50,391 ▼28.8% 573,088 ▼19.7%
Hyundai Motor (India) 52,704 7.3% 553,338 ▼5.4%
Toyota Motor (Indonesia) 41,289 ▼9.2% 502,652 12.3%
Tata Motors (India) 46,146 15.1% 452,323 ▼23.6%
Mahindra (India) 32,383 ▼3.8% 384,983 ▼7.8%
Mitsubishi Motors (Thailand) 27,867 0.9% 291,477 ▼12.4%
Isuzu (Thailand) 23,738 26.7% 214,396 ▼20.9%
Toyota Motor (Taiwan) 17,292 3.5% 179,783 18.2%
Daihatsu (Malaysia) 19,325 7.7% 177,988 ▼6.2%
Daihatsu (Indonesia) 14,376 ▼12.8% 168,703 2.6%
Auto Alliance (Thailand) 16,714 13.6% 162,397 ▼19.8%
Notes: Toyota Motor (Indonesia) includes consignment volume to Astra Daihatsu Motor.
(Unit: Vehicles)
Thailand Indonesia Malaysia Korea Taiwan India Seven Asian Nations*
November YTD Change November YTD Change November YTD Change November YTD Change November YTD Change November YTD Change November YTD Change
Hyundai Group - - - 31 393 ▼66.9% 752 8,404 ▼17.3% 324,500 3,239,506 3.7% 1,094 12,336 ▼5.5% 52,704 553,338 ▼5.4% 379,081 3,814,192 2.1%
Toyota Group 52,571 687,289 ▼15.1% 58,270 701,482 9.1% 26,096 256,035 ▼2.1% - - - 17,804 184,021 17.9% 14,390 133,644 ▼16.5% 174,021 2,001,455 ▼3.2%
Suzuki 1,686 20,591 ▼58.9% 14,610 160,723 ▼2.6% 169 3,059 ▼24.7% - - - - - - 117,256 1,173,444 7.5% 139,479 1,431,116 3.6%
GM 4,363 51,690 ▼43.1% 207 8,427 ▼43.5% - - - 50,391 573,088 ▼19.7% - - - 3,854 52,322 ▼35.4% 58,815 685,527 ▼23.8%
9,813 116,776 ▼48.5% 4,608 45,628 ▼20.8% 3,137 37,279 ▼21.4% 19,326 135,278 12.1% 3,239 39,711 7.8% 15,953 201,846 3.7% 56,076 576,518 ▼15.7%
Honda 17,656 127,119 ▼52.2% 11,087 148,237 97.6% 6,586 67,307 61.7% - - - 1,615 20,815 ▼7.7% 16,992 154,573 46.8% 55,310 539,321 1.3%
Mahindra Group - - - - - - - - - 10,980 129,507 ▼0.5% - - - 32,383 384,983 ▼7.8% 43,363 514,490 ▼6.0%
Tata Group - - - - - - 12 120 155.3% 1,065 9,727 4.3% - - - 46,146 452,323 ▼23.6% 47,232 462,886 ▼23.1%
Mitsubishi 27,867 291,477 ▼12.4% 9,393 111,055 ▼8.6% 239 3,602 - - - - 3,385 35,507 ▼1.0% - - - 40,884 441,641 ▼9.9%
Ford Group 18,848 202,480 ▼13.2% - - - 669 11,455 66.9% - - - 2,194 28,359 ▼8.9% 15,531 138,662 25.4% 37,242 380,956 ▼0.2%
Isuzu 23,738 214,396 ▼20.9% 450 26,546 ▼1.1% 953 9,823 ▼16.8% - - - - - - 588 10,921 21.0% 25,768 262,491 ▼17.7%
VW Group - - - 85 763 ▼19.9% 754 8,602 136.1% - - - - - - 10,158 105,173 20.6% 10,997 114,538 24.8%
Proton - - - - - - 6,083 102,328 ▼19.7% - - - - - - - - - 6,083 102,328 ▼19.7%
Daimler Group 533 5,915 ▼31.2% 204 2,032 ▼38.6% 406 6,175 ▼8.0% - - - 470 5,247 128.2% - - - 1,613 19,369 ▼7.4%
Fiat Group - - - - - - - - - - - - - - - 1,056 13,239 67.3% 1,056 13,239 67.3%
Total (incl. Others) 158,038 1,726,918 ▼24.9% 99,205 1,208,040 8.5% 47,422 544,068 ▼0.8% 406,490 4,090,161 ▼0.3% 30,966 342,771 12.1% 341,120 3,541,218 ▼1.8% 1,095,367 11,589,658 ▼4.3%
Vehicle Production Overview
Ratio of Production by Country in Seven Asian Nations
( November 2014 )
Group
Renault-Nissan Alliance
Hyundai Group: Hyundai/ Kia/ Inokom/ Naza; Toyota Group: Toyota/ Daihatsu/ Hino/ Perodua; GM: GM/ GM Korea; Tata Group: Tata/ Tata Daewoo/ Land Rover/ Jaguar; Renault-Nissan Alliance: Renault/ Renault Samsung/ Nissan; VW Group: VW/ Audi/ Škoda; Daimler Group: Mercedes-
Benz/ Fuso
Notes: *Includes Pakistan. As well as the above seven nations, production and assembly are also performed in the Philippines, Vietnam, Myanmar and Bangladesh. However, data are not included in the above charts and graphs as the information is not publicly released. In some countries,
including India, data for Mercedes-Benz, Audi, etc. are not be regularly released; therefore, figures shown in the table may not reflect accurately in monthly data, however, figures are as per original (provisional) data.
Ratio of Production by Manufacturer in Seven Asian Nations
( November 2014 )
Top 15 Manufacturers by Production ( November 2014 )
Manufacturer
Vehicle Production by Group and Country in Seven Asian Nations
▼40%
▼20%
0%
20%
40%
60%
0
10
20
30
40
50
D J F M A M J J A S O N D J F M A M J J A S O N
2012 2013 2014
(1,000 units)
Taiwan
Vehicle Production
(left scale)
YOY % Change
(right scale)
▼20%
▼10%
0%
10%
20%
30%
40%
0
250
500
750
1,000
1,250
1,500
D J F M A M J J A S O N D J F M A M J J A S O N
2012 2013 2014
(1,000 units)
Monthly Vehicle Production in Seven Asian Nations
(Thailand, Indonesia, Malaysia, India, Pakistan, Korea, Taiwan)
▼ 100%
▼ 75%
▼ 50%
▼ 25%
0%
25%
50%
75%
100%
125%
150%
175%
0
25
50
75
100
125
150
175
200
225
250
275
D J F M A M J J A S O N D J F M A M J J A S O N
2012 2013 2014
(1,000 units)Thailand
ASEAN
30.0%
South Asia
31.7%
East Asia
38.2%
Thailand
14.9%
Indonesia
10.4%
Malaysia
4.7%
India
30.6%
Pakistan
1.2%
Korea
35.3%
Taiwan
3.0%
▼30%
▼20%
▼10%
0%
10%
20%
30%
40%
50%
0
10
20
30
40
50
60
70
80
D J F M A M J J A S O N D J F M A M J J A S O N
2012 2013 2014
(1,000 units)Malaysia
▼40%
▼30%
▼20%
▼10%
0%
10%
20%
30%
40%
50%
0
50
100
150
200
250
300
350
400
450
D J F M A M J J A S O N D J F M A M J J A S O N
2012 2013 2014
(1,000 units)
India
▼40%
▼20%
0%
20%
40%
60%
80%
0
20
40
60
80
100
120
D J F M A M J J A S O N D J F M A M J J A S O N
2012 2013 2014
(1,000 units)
Indonesia
▼40%
▼20%
0%
20%
40%
60%
0
100
200
300
400
500
D J F M A M J J A S O N D J F M A M J J A S O N
2012 2013 2014
(1,000 units)Korea
Oct. 2012 YOY % Change 410.1%
Nov. 2012 YOY % Change 982.8%
Statistics-Data
ASEAN declines, India realizes double-digit increase
In November 2014, vehicle production in seven Asian countries decreased 1.2 percent
compared to the same month of a year earlier to 1.09 million units. Thailand, Indonesia, Malaysia
and Korea dropped compared to the same month of the previous year; however, India registered
double-digit growth.
Thailand fell 13.6 percent to 158,000 units. Exports rose 11 percent to 107,000 units, realizing
positive growth for the first time in four months, exports accounting for 67 percent of total
production. Indonesia declined 10.3 percent to 99,000 units. The top three makers Toyota,
Daihatsu and Suzuki each dropped by some 10 percent, while Nissan went up 30 percent.
Malaysia fell 12.2 percent to 47,000 units.
Korea decreased 4.7 percent to 406,000 units. While the ending of walkouts revived Kia’s
volume to the 150,000-unit level, GM Korea saw a 28.8 percent decline to 50,000 units due to
dull sales in Korea and overseas markets. India rose 16 percent to 341,000 units, breaking free
from the previous month’s negative growth result. Medium/heavy commercial vehicles realized a
brisk increase of 64.3 percent, while passenger vehicles went up 15.1 percent.
Hyundai Gr.
32.9%
GM Gr. 5.9%
Toyota Gr. 17.3%
Tata Gr. 4.0%
R/N Gr. 5.0%
Ford Gr. 3.3%
Mahindra Gr. 4.4%
Hyundai
19.5%
Kia
13.4%
Suzuki
12.3%
GM Korea
4.9%
GM 1.0%
Toyota
13.9%
Daihatsu 3.0%
Hino 0.4%
Tata 3.9%
Tata Daewoo
0.1%
Land Rover
0.0%
Samsung 1.2%Nissan 3.4%
Renault 0.4%
Honda 4.7%
Mazda 1.6%
Ford 1.7%
Isuzu 2.3%
Mitsubishi 3.8%
Mahindra 3.3%
Ssangyong 1.1%
Proton 0.9% Others 3.3%

���������� ��� ���� ��������
����� ����� �!"#$%����
Data printed here are based on preliminary figures. Some totals or year-to-date figures may reflect corrections of past data. November 2014 Sales
(Unit: Vehicles)
November Change YTD November Change
Suzuki (incl. Maruti Suzuki) 117,845 6.7% 1,306,406 4.1%
Toyota/Lexus 101,748 ▼17.8% 1,186,153 ▼7.7%
Hyundai 93,195 1.4% 1,020,140 5.5%
Honda 47,747 25.4% 544,110 9.3%
Kia 48,039 12.2% 463,235 1.4%
Tata 37,602 0.6% 413,532 ▼25.0%
Mahindra 29,878 ▼25.1% 384,918 8.4%
Daihatsu (incl. Perodua) 33,225 3.7% 350,131 ▼0.1%
Nissan/Infiniti 20,559 ▼20.0% 251,082 ▼8.4%
Mitsubishi 15,508 ▼36.8% 225,142 ▼16.0%
Isuzu 17,048 ▼15.5% 206,808 ▼17.9%
Ford 17,102 ▼6.0% 189,705 0.9%
GM Korea 12,353 ▼12.6% 136,847 2.5%
Proton 8,221 ▼11.5% 107,679 ▼17.8%
GM (excl. GM Korea) 7,176 ▼35.2% 92,920 ▼40.0%
(Unit: Vehicles)
November YTD Change November YTD Change November YTD Change November YTD Change November YTD Change November YTD Change November YTD Change
Toyota Group 30,216 304,237 ▼27.9% 45,862 570,114 ▼5.3% 27,687 275,641 3.1% 1,364 11,690 0.1% 12,664 130,646 10.0% 12,175 121,038 ▼10.0% 140,234 1,587,495 ▼6.5%
Hyundai Group 343 4,190 ▼6.5% 681 10,646 ▼27.4% 967 12,411 27.0% 100,225 1,033,068 2.5% 1,221 14,984 6.8% 35,511 378,967 7.8% 141,234 1,483,375 4.2%
Suzuki 1,040 18,309 ▼55.7% 9,703 144,878 ▼2.7% 227 3,924 ▼12.7% - - - 418 5,166 12.8% 100,024 1,054,019 7.8% 117,845 1,306,406 4.1%
Honda 9,605 93,113 ▼53.0% 12,418 154,099 77.5% 6,280 69,215 53.7% 302 3,325 ▼25.9% 1,961 21,059 ▼6.4% 15,263 165,322 61.8% 47,747 544,110 9.3%
Tata Group 79 1,693 ▼36.8% 104 701 - 80 789 ▼16.3% 1,213 12,230 22.1% 50 569 54.2% 37,427 411,297 ▼25.0% 39,033 428,536 ▼24.0%
4,762 53,562 ▼39.5% 4,790 50,166 ▼11.0% 4,112 39,858 ▼15.9% 9,041 75,972 37.0% 3,801 43,578 9.9% 5,242 87,038 ▼2.1% 32,391 362,012 ▼6.0%
Ford Group 5,430 66,143 ▼31.2% 2,320 18,772 ▼3.8% 1,848 23,020 26.2% 654 8,058 21.0% 3,057 36,119 8.9% 5,661 71,568 ▼4.0% 23,740 266,587 ▼2.6%
GM 2,003 23,702 ▼55.3% 644 10,233 ▼28.3% 64 1,706 9.6% 12,390 136,699 2.4% 18 650 80.6% 4,007 52,337 ▼35.5% 19,578 230,243 ▼20.2%
Mitsubishi 5,221 57,602 ▼39.7% 6,573 80,034 ▼5.0% 993 13,154 17.3% - - ▼100.0% 2,437 35,464 ▼3.2% - - - 15,508 225,142 ▼16.0%
Isuzu 12,045 144,640 ▼23.2% 2,331 26,217 ▼9.6% 1,138 10,074 ▼3.9% - - - 143 1,380 55.8% 606 9,939 4.7% 17,048 206,808 ▼17.9%
Daimler Group 996 9,845 ▼4.4% 5,253 55,535 ▼14.7% 927 8,494 17.4% 2,386 32,493 42.7% 2,411 25,038 26.4% - - - 12,927 141,659 6.6%
VW Group 36 428 ▼24.2% 41 320 ▼13.0% 525 10,157 ▼9.3% 5,215 54,006 27.0% 1,596 18,698 30.4% 5,018 54,123 ▼29.7% 12,806 141,529 ▼5.9%
Proton 11 433 ▼30.4% - - - 8,203 107,082 ▼17.7% - - - 8 174 ▼16.7% - - - 8,223 107,695 ▼17.8%
BMW Group 667 7,884 8.2% 211 2,292 3.7% 738 7,711 14.5% 4,321 42,666 16.6% 1,582 15,477 17.1% - - - 7,763 79,743 13.7%
Fiat Group 6 49 36.1% - - - - - - 617 5,801 38.5% 62 551 83.1% 760 11,563 44.0% 1,491 18,461 41.8%
Total (incl. Others) 73,045 792,306 ▼34.9% 91,268 1,130,323 ▼0.1% 55,313 601,805 1.1% 144,740 1,488,245 6.1% 33,958 382,036 12.5% 260,124 2,922,186 ▼2.8% 709,821 7,821,800 ▼3.3%
( November 2014 )
Vehicle Sales Overview
Ratio of Sales by Region and Country in Ten Asian Nations
( November 2014 )
Ratio of Sales by Brand in Ten Asian Nations
Ten Asian Nations
Renault-Nissan Alliance
Hyundai Group: Hyundai/ Kia; Toyota Group: Toyota/ Lexus/Daihatsu/ Hino/Peroduaa; Tata Group: Tata/ Tata Daewoo/ Land Rover/ Jaguar; Renault-Nissan Alliance: Renault/ Samsung/ Nissan/ Inifiniti; GM: GM/Cadillac/ GM Korea (formerly GM Daewoo);Daimler Group: Mercedes-Benz/
Smart/ Fuso; VW Group: VW/ Audi/ Škoda. *Includes other Ford brands, such as Aston Martin and Lincoln.
Notes: Ten Asian Nations cover Thailand, Malaysia, Indonesia, the Philippines, Singapore, Vietnam, Korea, Taiwan, India and Pakistan. From Jan. 2012, Hyundai volume excludes that of Inokom. In some countries, including India, figures for Mercedes-Benz, Audi, etc. are not regularly released;
therefore, may not reflect accurately in monthly data, however, figures are as per original (provisional) data.
Top 15 Selling Brands in Ten Asian Nations ( November 2014 )
Brand
Vehicle Sales by Group and Major Country in Ten Asian Nations
Group
Thailand Indonesia Malaysia Korea Taiwan India
ASEAN
37.0%
South Asia
39.1%
East Asia
23.9%
Thailand
10.1%
Indonesia
14.5%
Malaysia
7.7%
Philippines
2.7%
Singapore
0.5%
Vietnam
1.5%
India
37.4%
Pakistan
1.7%
Korea
19.0%
Taiwan
4.9%
Hyundai Gr. 19.0%
Toyota Gr. 20.3%
Tata Gr. 5.5%
R/N Gr. 4.6%
GM Gr. 2.9%
Ford Gr. 3.4%
Mahindra Gr. 5.7%
Hyundai
13.0%
Kia 5.9%
Suzuki
16.7%
Toyota
15.2%Daihatsu
4.5%
Hino 0.7%
Tata
5.3%
Tata Daewoo
0.1%
Land Rover 0.1%
Honda
7.0%Nissan 3.2%
Samsung 0.9%
Renault 0.5%
GM 1.2%
Daewoo 1.7%
Ford 2.4%
Mazda 1.0%
Mahindra 4.9%
Ssangyong 0.8%
Mitsubishi 2.9%
Isuzu 2.6%
Proton 1.4%
Others
8.0%
▼50%
▼25%
0%
25%
50%
75%
0
10
20
30
40
50
D J F M A M J J A S O N D J F M A M J J A S O N
2012 2013 2014
(1,000 units)Taiwan
Vehicle Sales
(left scale)
YOY % Change
(right scale)
▼20%
▼10%
0%
10%
20%
30%
0
200
400
600
800
1,000
D J F M A M J J A S O N D J F M A M J J A S O N
2012 2013 2014
(1,000 units)
Monthly Vehicle Sales in Ten Asian Nations
▼30%
▼20%
▼10%
0%
10%
20%
30%
40%
0
10
20
30
40
50
60
70
D J F M A M J J A S O N D J F M A M J J A S O N
2012 2013 2014
(1,000 units) Malaysia
▼40%
▼30%
▼20%
▼10%
0%
10%
20%
30%
40%
0
50
100
150
200
250
300
350
400
D J F M A M J J A S O N D J F M A M J J A S O N
2012 2013 2014
(1,000 units)India
▼50%
▼25%
0%
25%
50%
75%
0
25
50
75
100
125
D J F M A M J J A S O N D J F M A M J J A S O N
2012 2013 2014
(1,000 units) Indonesia
▼100%
▼50%
0%
50%
100%
150%
200%
0
25
50
75
100
125
150
D J F M A M J J A S O N D J F M A M J J A S O N
2012 2013 2014
(1,000 units) Thailand
▼40%
▼30%
▼20%
▼10%
0%
10%
20%
30%
0
25
50
75
100
125
150
175
D J F M A M J J A S O N D J F M A M J J A S O N
2012 2013 2014
(1,000 units)Korea
Oct. 2012 YOY % Change 230.5%
Nov. 2012 YOY % Change 473.3%
Statistics-Data
Indonesia reports double-digit decrease, India and Korea realize brisk
increase
In November 2014, vehicle sales in 10 Asian countries were 710,000 units on par with the result
of the same month of a year earlier. Although Thailand and Indonesia fell, their decline was
balanced out by positive growth of India and Korea.
Thailand dropped 21.9 percent to 73,000 units. Passenger vehicles fell 27.7 percent to 29,000
units; however, SUVs increased for the eighth consecutive month. Indonesia decreased 18.4
percent to 91,000 units, dropping below the 100,000-unit level due to the reduction of fuel
subsidies. While many automakers saw decline in sales, Honda went up 29.7 percent to 12,000
units driven by the Mobilio. Malaysia increased 5.9 percent to 55,000 units. Perodua rose 24.4
percent to 19,000 units while Proton, which launched the Iriz in September, dropped 11.3 percent
to 8,203 units.
Korea went up 6.5 percent to 145,000 units. After the normalization of its supply system, Kia
posted double-digit increase, up 14.2 percent to 45,000 units.
India climbed up 6.2 percent to 260,000 units. Driven by smooth sales of the Swift among other
models, Maruti Suzuki reached the 100,000-unit level for the first time in five months, slightly
surpassing Mahindra and Tata Motors which have been experiencing dull growth.

���������� ��� ���� ��������
����� ����� �!"#$%����
FOURIN Asia Automotive Intelligence
Vehicle Production by Country, Type and Brand
Production
(Unit: Vehicles)
Jan. Feb. Mar. Apr. May Jun. Jul. Aug. Sep. Oct. Nov. Dec. YTD Total
Thailand 162,652 173,506 181,334 126,730 148,011 160,452 151,339 140,797 164,299 159,760 158,038 1,726,918
104,729 112,523 123,007 121,114 94,973 116,840 93,610 109,644 115,017 117,378 99,205 1,208,040
Malaysia 55,503 47,680 50,174 57,086 53,856 52,309 41,012 43,784 49,479 45,763 47,422 544,068
Korea 368,228 361,115 425,510 433,799 373,470 380,420 409,252 273,037 294,160 364,680 406,490 4,090,161
Taiwan 30,447 22,488 33,644 32,665 37,094 33,450 37,469 23,714 29,911 30,923 30,966 342,771
India 325,529 322,909 334,449 314,788 322,243 288,978 333,799 314,755 346,579 296,069 341,120 3,541,218
Pakistan 12,617 12,190 13,558 12,436 12,333 11,644 8,644 13,157 14,757 13,020 12,126 136,482
Total 1,059,705 1,052,411 1,161,676 1,098,618 1,041,980 1,044,093 1,075,125 918,888 1,014,202 1,027,593 1,095,367 11,589,658
YOY % Change ▼12.3% ▼3.9% ▼1.1% 1.0% ▼8.0% ▼2.7% 0.5% ▼8.0% 1.4% ▼11.2% ▼1.2% ▼4.3%
1 Hyundai / Inokom 201,976 200,094 232,582 229,567 205,398 213,713 220,897 158,620 164,187 214,368 222,835 2,264,237
2 Toyota 150,788 152,833 159,352 145,083 143,049 158,181 135,720 136,138 147,605 141,507 135,211 1,605,467
3 Kia 138,863 143,804 159,996 165,176 139,466 146,821 169,460 109,942 113,169 107,012 156,246 1,549,955
4 Suzuki / Maruti 132,372 129,191 137,136 129,601 141,086 101,528 129,965 132,743 143,372 114,643 139,479 1,431,116
5 GM Korea 53,524 45,625 61,691 62,622 53,451 54,596 51,400 37,639 46,068 56,081 50,391 573,088
6 Tata 37,915 42,578 46,267 40,990 48,434 53,508 49,524 51,936 54,972 57,887 55,310 539,321
7 Honda 41,931 43,466 41,280 39,754 34,945 38,324 39,532 39,629 44,570 42,746 46,146 452,323
8 Nissan 44,371 46,293 47,813 33,695 39,453 37,728 34,750 33,351 41,377 41,926 40,884 441,641
9 Mitsubishi 39,780 37,105 38,519 29,192 29,038 35,891 39,711 31,584 40,818 36,501 33,444 391,583
10 Mahindra 37,898 37,078 43,208 39,302 34,517 29,312 31,528 29,662 36,701 33,394 32,383 384,983
11 Daihatsu / Perodua 34,678 34,712 33,948 34,104 29,171 30,459 25,826 27,046 32,265 30,781 33,701 346,691
12 Isuzu 22,057 23,526 26,317 18,425 21,081 25,180 26,214 23,578 24,924 25,421 25,768 262,491
13 16,085 15,613 19,220 12,994 16,843 19,071 20,958 18,313 21,573 18,358 19,440 198,468
14 GM 13,461 15,862 17,983 16,008 17,293 17,597 16,564 13,725 15,982 18,348 17,751 180,574
15 Ford 9,893 7,330 11,923 12,495 10,392 7,013 11,274 9,656 14,720 21,256 19,326 135,278
16 Ssangyong 11,668 11,785 13,451 13,644 12,352 12,286 11,406 9,255 10,246 12,434 10,980 129,507
17 Proton 15,509 14,551 14,044 9,255 10,422 9,764 7,713 6,259 7,846 8,652 8,424 112,439
18 Renault Samsung 10,794 6,124 7,965 12,174 12,881 12,509 10,112 8,167 8,125 7,394 6,083 102,328
19 Ashok Leyland 8,113 7,926 9,234 9,595 9,326 9,432 8,358 10,343 10,153 8,723 9,944 101,147
20 VW 7,949 8,060 8,928 6,785 8,073 7,175 7,991 9,424 8,831 7,203 8,175 88,594
21 Renault 4,533 5,659 6,901 8,536 3,984 2,225 4,613 2,466 4,109 3,325 3,306 49,657
22 Hino 4,824 4,677 4,329 3,766 3,488 5,050 3,919 4,130 5,011 4,994 5,109 49,297
23 VECV 3,704 3,695 3,373 3,997 4,107 3,591 3,764 3,248 2,492 2,751 2,863 37,585
24 Force 1,822 2,273 2,362 9,300 1,773 1,936 2,076 1,951 2,486 1,912 2,024 29,915
25 BMW 2,480 1,643 1,747 1,240 1,149 1,022 1,326 1,283 1,545 1,260 1,018 15,713
26 Škoda 1,752 1,576 1,821 1,567 1,232 422 1,071 742 1,016 984 1,056 13,239
27 Mercedes-Benz (LV) 1,085 875 1,278 973 1,397 1,648 1,839 1,216 1,216 612 1,021 13,160
28 Tata Daewoo 832 735 870 1,000 921 649 870 811 986 988 1,065 9,727
Others 9,048 7,722 8,138 7,778 7,258 7,462 6,744 6,031 7,837 6,132 5,984 80,134
Total 1,059,705 1,052,411 1,161,676 1,098,618 1,041,980 1,044,093 1,075,125 918,888 1,014,202 1,027,593 1,095,367 11,589,658
Eco Car 22,985 23,433 24,346 14,739 17,318 17,234 17,763 17,719 21,842 21,467 21,464 220,310
ED�1,200cc 624 1,053 1,343 336 249 363 12 83 195 175 86 4,519
1,200 cc�ED�1,500 cc 18,267 24,920 23,409 20,752 23,562 24,650 23,359 19,270 25,472 27,498 23,634 254,793
1,500 cc�ED�1,800 cc 13,050 13,106 13,765 8,819 8,288 9,899 9,755 10,131 8,885 8,451 10,412 114,561
1,800 cc�ED�2,000 cc 4,763 3,764 4,304 4,110 4,886 4,840 5,111 4,553 5,428 5,774 4,255 51,788
2,000 cc�ED�2,500 cc 4,344 2,128 1,801 1,544 1,454 1,589 1,621 1,519 1,392 1,248 2,928 21,568
Others (incl. unknown) 1,271 1,236 1,129 767 883 835 1,045 902 1,123 905 2,090 12,186
Subtotal 65,304 69,640 70,097 51,067 56,640 59,410 58,666 54,177 64,337 65,518 64,869 679,725
YOY % Change ▼37.3% ▼33.2% ▼40.3% ▼26.6% ▼43.5% ▼38.4% ▼33.2% ▼34.1% ▼27.5% ▼17.9% ▼14.3% ▼32.5%
Off-road - - - - - - - - - - - -
Pickup MPL � 1t - - - - - - - - - - - -
Pickup (S) MPL = 1t 32,699 34,816 35,607 23,916 28,437 33,514 28,583 30,731 32,929 28,345 32,008 341,585
Pickup (D) MPL = 1t 51,821 54,623 60,606 42,589 51,343 56,594 52,672 45,418 55,572 56,258 50,223 577,719
Pickup (PPV) MPL = 1t 10,752 12,517 12,991 7,897 10,624 9,891 9,640 8,942 9,579 7,308 7,990 108,131
Truck MPL � 5t 375 363 444 211 - 43 503 387 419 330 691 3,766
Subtotal 95,647 102,319 109,648 74,613 90,404 100,042 91,398 85,478 98,499 92,241 90,912 1,031,201
YOY % Change ▼25.5% ▼15.7% ▼18.9% ▼23.8% ▼28.9% ▼13.9% ▼16.0% ▼20.3% ▼4.0% ▼10.1% ▼12.9% ▼17.6%
5t � MPL � 10t 250 162 239 72 67 73 288 320 316 305 265 2,357
10t � MPL 1,402 1,330 1,305 903 886 886 925 801 1,060 1,665 1,931 13,094
Bus 49 55 45 75 14 41 62 21 87 31 61 541
Subtotal 1,701 1,547 1,589 1,050 967 1,000 1,275 1,142 1,463 2,001 2,257 15,992
YOY % Change ▼51.5% ▼57.2% ▼56.5% ▼64.0% ▼78.7% ▼77.9% ▼73.3% ▼68.5% ▼58.1% ▼26.1% ▼17.3% ▼60.1%
Total 97,348 103,866 111,237 75,663 91,371 101,042 92,673 86,620 99,962 94,242 93,169 1,047,193
YOY % Change ▼26.2% ▼16.9% ▼19.8% ▼25.0% ▼30.6% ▼16.3% ▼18.4% ▼21.9% ▼5.7% ▼10.5% ▼13.0% ▼18.9%
Total 162,652 173,506 181,334 126,730 148,011 160,452 151,339 140,797 164,299 159,760 158,038 1,726,918
YOY % Change ▼31.1% ▼24.3% ▼29.2% ▼25.6% ▼36.2% ▼26.1% ▼24.9% ▼27.1% ▼15.6% ▼13.7% ▼13.6% ▼24.9%
1 Toyota 69,437 72,491 72,739 57,829 61,069 68,868 57,395 55,560 60,268 51,521 51,258 678,435
2 Mitsubishi 28,129 31,862 32,323 18,025 26,030 24,280 24,922 22,606 27,222 28,211 27,867 291,477
3 Isuzu 17,873 18,491 21,029 13,504 16,532 20,627 21,859 19,085 20,425 21,233 23,738 214,396
4 Honda 11,599 14,010 15,955 14,158 15,390 15,988 14,883 12,025 14,071 17,604 16,714 162,397
5 Nissan 6,907 9,534 9,685 6,450 9,928 10,103 11,750 11,205 16,568 17,333 17,656 127,119
6 AAT (Ford/Mazda) 13,661 14,266 14,900 6,933 7,539 8,556 9,914 10,271 11,574 9,349 9,813 116,776
7 GM 7,615 6,754 7,350 4,144 4,397 5,035 2,284 1,881 3,508 4,359 4,363 51,690
8 Suzuki 2,250 2,217 3,489 3,305 4,204 3,682 4,292 4,489 5,555 4,466 2,134 40,083
9 Ford 2,769 1,650 1,624 692 1,233 1,484 1,841 1,846 2,707 3,059 1,686 20,591
10 Hino 858 585 631 510 629 660 753 712 950 1,253 1,313 8,854
11 BMW 760 714 782 474 485 353 605 467 609 391 551 6,191
12 Mercedes-Benz (LCV) 459 546 417 351 237 482 438 400 516 556 478 4,880
13 Fuso 123 191 258 254 196 174 100 56 62 73 164 1,651
Others 212 195 152 101 142 160 303 194 264 352 303 2,378
Total 162,652 173,506 181,334 126,730 148,011 160,452 151,339 140,797 164,299 159,760 158,038 1,726,918
Th
ailan
d (*
2)
Ty
pe
Bran
d
LCV
Sev
en A
sian
N
atio
ns (*
1)
Co
untry
Passenger Car
Country/ Type/ Brand
MHCV
Co
mm
ercial V
eh
icle
Indonesia
Bran
d
Mazda
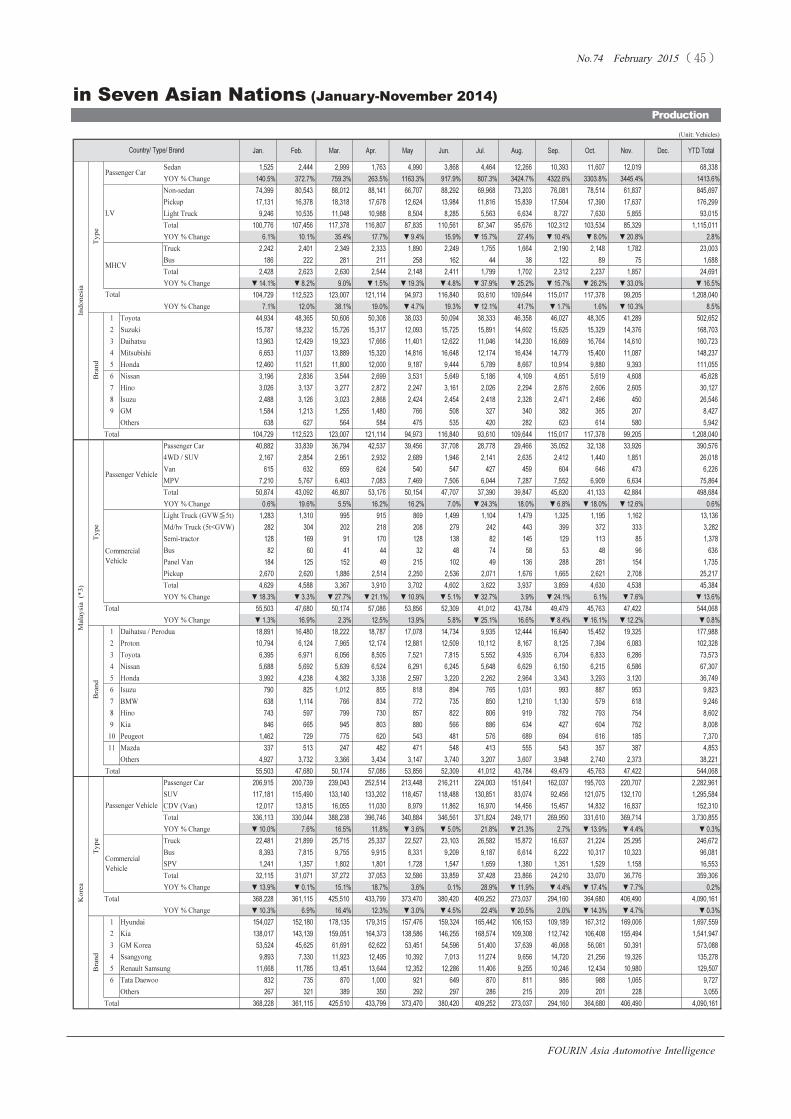
���������� ��� ���� ��������
����� ����� �!"#$%����
FOURIN Asia Automotive Intelligence
Production
in Seven Asian Nations (January-November 2014)
(Unit: Vehicles)
Jan. Feb. Mar. Apr. May Jun. Jul. Aug. Sep. Oct. Nov. Dec. YTD Total
Sedan 1,525 2,444 2,999 1,763 4,990 3,868 4,464 12,266 10,393 11,607 12,019 68,338
YOY % Change 140.5% 372.7% 759.3% 263.5% 1163.3% 917.9% 807.3% 3424.7% 4322.6% 3303.8% 3445.4% 1413.6%
Non-sedan 74,399 80,543 88,012 88,141 66,707 88,292 69,968 73,203 76,081 78,514 61,837 845,697
Pickup 17,131 16,378 18,318 17,678 12,624 13,984 11,816 15,839 17,504 17,390 17,637 176,299
Light Truck 9,246 10,535 11,048 10,988 8,504 8,285 5,563 6,634 8,727 7,630 5,855 93,015
Total 100,776 107,456 117,378 116,807 87,835 110,561 87,347 95,676 102,312 103,534 85,329 1,115,011
YOY % Change 6.1% 10.1% 35.4% 17.7% ▼9.4% 15.9% ▼15.7% 27.4% ▼10.4% ▼8.0% ▼20.8% 2.8%
Truck 2,242 2,401 2,349 2,333 1,890 2,249 1,755 1,664 2,190 2,148 1,782 23,003
Bus 186 222 281 211 258 162 44 38 122 89 75 1,688
Total 2,428 2,623 2,630 2,544 2,148 2,411 1,799 1,702 2,312 2,237 1,857 24,691
YOY % Change ▼14.1% ▼8.2% 9.0% ▼1.5% ▼19.3% ▼4.8% ▼37.9% ▼25.2% ▼15.7% ▼26.2% ▼33.0% ▼16.5%
104,729 112,523 123,007 121,114 94,973 116,840 93,610 109,644 115,017 117,378 99,205 1,208,040
YOY % Change 7.1% 12.0% 38.1% 19.0% ▼4.7% 19.3% ▼12.1% 41.7% ▼1.7% 1.6% ▼10.3% 8.5%
1 Toyota 44,934 48,365 50,606 50,308 38,033 50,094 38,333 46,358 46,027 48,305 41,289 502,652
2 Suzuki 15,787 18,232 15,726 15,317 12,093 15,725 15,891 14,602 15,625 15,329 14,376 168,703
3 Daihatsu 13,963 12,429 19,323 17,666 11,401 12,622 11,046 14,230 16,669 16,764 14,610 160,723
4 Mitsubishi 6,653 11,037 13,889 15,320 14,816 16,648 12,174 16,434 14,779 15,400 11,087 148,237
5 Honda 12,460 11,521 11,800 12,000 9,187 9,444 5,789 8,667 10,914 9,880 9,393 111,055
6 Nissan 3,196 2,836 3,544 2,699 3,531 5,649 5,186 4,109 4,651 5,619 4,608 45,628
7 Hino 3,026 3,137 3,277 2,872 2,247 3,161 2,026 2,294 2,876 2,606 2,605 30,127
8 Isuzu 2,488 3,126 3,023 2,868 2,424 2,454 2,418 2,328 2,471 2,496 450 26,546
9 GM 1,584 1,213 1,255 1,480 766 508 327 340 382 365 207 8,427
Others 638 627 564 584 475 535 420 282 623 614 580 5,942
Total 104,729 112,523 123,007 121,114 94,973 116,840 93,610 109,644 115,017 117,378 99,205 1,208,040
Passenger Car 40,882 33,839 36,794 42,537 39,456 37,708 28,778 29,466 35,052 32,138 33,926 390,576
4WD / SUV 2,167 2,854 2,951 2,932 2,689 1,946 2,141 2,635 2,412 1,440 1,851 26,018
Van 615 632 659 624 540 547 427 459 604 646 473 6,226
MPV 7,210 5,767 6,403 7,083 7,469 7,506 6,044 7,287 7,552 6,909 6,634 75,864
Total 50,874 43,092 46,807 53,176 50,154 47,707 37,390 39,847 45,620 41,133 42,884 498,684
YOY % Change 0.6% 19.6% 5.5% 16.2% 16.2% 7.0% ▼24.3% 18.0% ▼6.8% ▼18.0% ▼12.6% 0.6%
Light Truck (GVW�5t) 1,283 1,310 995 915 869 1,499 1,104 1,479 1,325 1,195 1,162 13,136
Md/hv Truck (5t<GVW) 282 304 202 218 208 279 242 443 399 372 333 3,282
Semi-tractor 128 169 91 170 128 138 82 145 129 113 85 1,378
Bus 82 60 41 44 32 48 74 58 53 48 96 636
Panel Van 184 125 152 49 215 102 49 136 288 281 154 1,735
Pickup 2,670 2,620 1,886 2,514 2,250 2,536 2,071 1,676 1,665 2,621 2,708 25,217
Total 4,629 4,588 3,367 3,910 3,702 4,602 3,622 3,937 3,859 4,630 4,538 45,384
YOY % Change ▼18.3% ▼3.3% ▼27.7% ▼21.1% ▼10.9% ▼5.1% ▼32.7% 3.9% ▼24.1% 6.1% ▼7.6% ▼13.6%
Total 55,503 47,680 50,174 57,086 53,856 52,309 41,012 43,784 49,479 45,763 47,422 544,068
YOY % Change ▼1.3% 16.9% 2.3% 12.5% 13.9% 5.8% ▼25.1% 16.6% ▼8.4% ▼16.1% ▼12.2% ▼0.8%
1 Daihatsu / Perodua 18,891 16,480 18,222 18,787 17,078 14,734 9,935 12,444 16,640 15,452 19,325 177,988
2 Proton 10,794 6,124 7,965 12,174 12,881 12,509 10,112 8,167 8,125 7,394 6,083 102,328
3 Toyota 6,395 6,971 6,056 8,505 7,521 7,815 5,552 4,935 6,704 6,833 6,286 73,573
4 Nissan 5,688 5,692 5,639 6,524 6,291 6,245 5,648 6,629 6,150 6,215 6,586 67,307
5 Honda 3,992 4,238 4,382 3,338 2,597 3,220 2,262 2,964 3,343 3,293 3,120 36,749
6 Isuzu 790 825 1,012 855 818 894 765 1,031 993 887 953 9,823
7 BMW 638 1,114 766 834 772 735 850 1,210 1,130 579 618 9,246
8 Hino 743 597 799 730 857 822 806 919 782 793 754 8,602
9 Kia 846 665 945 803 880 566 886 634 427 604 752 8,008
10 Peugeot 1,462 729 775 620 543 481 576 689 694 616 185 7,370
11 Mazda 337 513 247 482 471 548 413 555 543 357 387 4,853
Others 4,927 3,732 3,366 3,434 3,147 3,740 3,207 3,607 3,948 2,740 2,373 38,221
Total 55,503 47,680 50,174 57,086 53,856 52,309 41,012 43,784 49,479 45,763 47,422 544,068
Passenger Car 206,915 200,739 239,043 252,514 213,448 216,211 224,003 151,641 162,037 195,703 220,707 2,282,961
SUV 117,181 115,490 133,140 133,202 118,457 118,488 130,851 83,074 92,456 121,075 132,170 1,295,584
CDV (Van) 12,017 13,815 16,055 11,030 8,979 11,862 16,970 14,456 15,457 14,832 16,837 152,310
Total 336,113 330,044 388,238 396,746 340,884 346,561 371,824 249,171 269,950 331,610 369,714 3,730,855
YOY % Change ▼10.0% 7.6% 16.5% 11.8% ▼3.6% ▼5.0% 21.8% ▼21.3% 2.7% ▼13.9% ▼4.4% ▼0.3%
Truck 22,481 21,899 25,715 25,337 22,527 23,103 26,582 15,872 16,637 21,224 25,295 246,672
Bus 8,393 7,815 9,755 9,915 8,331 9,209 9,187 6,614 6,222 10,317 10,323 96,081
SPV 1,241 1,357 1,802 1,801 1,728 1,547 1,659 1,380 1,351 1,529 1,158 16,553
Total 32,115 31,071 37,272 37,053 32,586 33,859 37,428 23,866 24,210 33,070 36,776 359,306
YOY % Change ▼13.9% ▼0.1% 15.1% 18.7% 3.6% 0.1% 28.9% ▼11.9% ▼4.4% ▼17.4% ▼7.7% 0.2%
Total 368,228 361,115 425,510 433,799 373,470 380,420 409,252 273,037 294,160 364,680 406,490 4,090,161
YOY % Change ▼10.3% 6.9% 16.4% 12.3% ▼3.0% ▼4.5% 22.4% ▼20.5% 2.0% ▼14.3% ▼4.7% ▼0.3%
1 Hyundai 154,027 152,180 178,135 179,315 157,476 159,324 165,442 106,153 109,189 167,312 169,006 1,697,559
2 Kia 138,017 143,139 159,051 164,373 138,586 146,255 168,574 109,308 112,742 106,408 155,494 1,541,947
3 GM Korea 53,524 45,625 61,691 62,622 53,451 54,596 51,400 37,639 46,068 56,081 50,391 573,088
4 Ssangyong 9,893 7,330 11,923 12,495 10,392 7,013 11,274 9,656 14,720 21,256 19,326 135,278
5 Renault Samsung 11,668 11,785 13,451 13,644 12,352 12,286 11,406 9,255 10,246 12,434 10,980 129,507
6 Tata Daewoo 832 735 870 1,000 921 649 870 811 986 988 1,065 9,727
Others 267 321 389 350 292 297 286 215 209 201 228 3,055
Total 368,228 361,115 425,510 433,799 373,470 380,420 409,252 273,037 294,160 364,680 406,490 4,090,161
Bran
d
Malay
sia (*
3)
Passenger Vehicle
Ty
pe
Commercial
Vehicle
Ko
rea
Ty
pe
Passenger Vehicle
Commercial
Vehicle
Bran
d
Country/ Type/ Brand
Bran
d
LV
MHCV
Total
Typ
e
Passenger Car
In
do
nesia

���������� ��� ���� ��������
����� ����� �!"#$%����
FOURIN Asia Automotive Intelligence
Vehicle Production by Country, Type and Brand in Seven Asian Nations (January-November 2014)
Production
Reference CDV: Car Derived Van D: Double cab ED: Engine Displacement GVW: Gross Vehicle Weight LV: Light Vehicle LCV: Light Commercial Vehicle
MHCV: Medium/Heavy-Duty Commercial Vehicle MPL: Maximum Payload S: Single cab SPV: Special Purpose Vehicle such as ambulance or fire truck PPV: Passenger pickup
vehicle YOY: Year-on-year
*1) Although figures are brand-based production/assembly volumes, some include other brands (refer to country notes).
*2) Mercedes-Benz uses production figures of Thonburi Automotive Assembly which manufactures Mercedes-Benz models. Due to lack of brand-specific data, figures may include production volume of
the Hyundai Sonata which is also made by Thonburi Automotive Assembly.
*3) Hyundai includes Inokom Atos and Matrix.
*4) Production volumes of Eicher Motors and Volvo Auto India have been included in VE Commercial Vehicles, a joint venture between Eicher Motors and Volvo Group since June 2009. However,
Volvo Buses India’s data are not included in VE Commercial Vehicles.
(Unit: Vehicles)
Jan. Feb. Mar. Apr. May Jun. Jul. Aug. Sep. Oct. Nov. Dec. YTD Total
Passenger Vehicle 26,679 19,528 29,856 28,774 32,596 29,288 32,946 21,229 26,122 26,722 26,983 300,723
YOY % Change ▼10.2% 23.8% 21.0% 47.3% 23.1% 17.1% 11.3% 7.3% 29.4% 4.4% 2.9% 14.5%
GVW � 3.5t (LCV) 3,491 2,755 3,556 3,625 4,183 3,832 4,099 2,145 3,420 3,867 3,697 38,670
3.5t � GVW (MHCV) 277 205 232 266 315 330 424 340 369 334 286 3,378
Subtotal 3,768 2,960 3,788 3,891 4,498 4,162 4,523 2,485 3,789 4,201 3,983 42,048
YOY % Change 1.3% 32.0% 9.9% 12.5% ▼3.4% 0.0% ▼12.6% ▼24.0% ▼8.3% ▼6.9% ▼7.6% ▼2.4%
Total 30,447 22,488 33,644 32,665 37,094 33,450 37,469 23,714 29,911 30,923 30,966 342,771
YOY % Change ▼9.0% 24.9% 19.6% 42.1% 19.2% 14.6% 7.7% 2.9% 23.0% 2.7% 1.4% 12.1%
1 Toyota (Kuozui) 14,691 11,641 17,615 17,226 19,790 17,180 19,109 13,222 15,640 16,377 17,292 179,783
2 Nissan (Yulon) 3,037 2,293 4,206 4,197 4,513 3,939 4,602 2,541 3,539 3,605 3,239 39,711
3 Mitsubishi (China Motor) 3,562 2,509 3,258 3,277 3,932 3,627 3,701 1,756 2,917 3,583 3,385 35,507
4 Honda (Taiwan Honda) 2,752 1,408 1,746 1,368 1,815 2,321 2,642 1,288 1,263 2,597 1,615 20,815
5 Ford (Ford Lio Ho) 1,757 1,261 1,880 1,974 2,009 2,000 2,359 1,696 1,922 795 1,775 19,428
6 Hyundai (Sanyang) 1,049 594 983 1,225 1,277 1,215 1,418 870 1,242 1,369 1,094 12,336
7 Mazda (Ford Lio Ho) 1,224 738 1,262 1,016 1,131 874 831 490 781 165 419 8,931
8 Hino (Kuozui) 358 392 451 542 475 572 581 320 533 553 470 5,247
9 Fuso (China Motor) 229 191 238 244 496 411 523 361 503 530 512 4,238
Others 1,788 1,461 2,005 1,596 1,656 1,311 1,703 1,170 1,571 1,349 1,165 16,775
Total 30,447 22,488 33,644 32,665 37,094 33,450 37,469 23,714 29,911 30,923 30,966 342,771
Passenger Car 203,635 199,247 206,578 190,236 202,803 176,911 203,729 195,484 209,043 176,568 209,330 2,173,564
Utility Vehicle 52,403 49,070 51,982 54,181 49,374 45,459 55,820 48,790 60,604 52,686 56,790 577,159
MPV 13,824 13,951 13,783 13,889 16,089 12,563 17,240 14,268 16,397 13,015 15,197 160,216
Subtotal 269,862 262,268 272,343 258,306 268,266 234,933 276,789 258,542 286,044 242,269 281,317 2,910,939
YOY % Change ▼7.0% ▼9.3% ▼6.6% ▼4.1% 5.7% 9.2% 2.8% 1.9% 10.6% ▼12.5% 15.1% ▼0.0%
Truck 34,002 35,769 34,145 31,142 28,352 29,299 31,687 31,096 36,903 32,748 35,233 360,376
Bus 3,243 4,167 4,674 4,572 4,483 4,329 4,154 3,514 3,471 2,487 2,478 41,572
Subtotal 37,245 39,936 38,819 35,714 32,835 33,628 35,841 34,610 40,374 35,235 37,711 401,948
YOY % Change ▼27.3% ▼18.2% ▼28.7% ▼28.3% ▼27.8% ▼1.6% ▼5.5% ▼12.4% 4.2% ▼16.1% 3.7% ▼16.0%
Truck 15,117 17,270 19,519 16,832 16,871 16,404 16,740 17,721 16,692 16,052 18,850 188,068
Bus 3,305 3,435 3,768 3,936 4,271 4,013 4,429 3,882 3,469 2,513 3,242 40,263
Subtotal 18,422 20,705 23,287 20,768 21,142 20,417 21,169 21,603 20,161 18,565 22,092 228,331
YOY % Change ▼11.1% 9.0% ▼14.8% ▼14.6% ▼13.2% 20.5% 8.7% 11.2% 49.1% 14.2% 64.3% 6.3%
Total 55,667 60,641 62,106 56,482 53,977 54,045 57,010 56,213 60,535 53,800 59,803 630,279
YOY % Change ▼22.6% ▼10.6% ▼24.0% ▼23.8% ▼22.7% 5.7% ▼0.7% ▼4.6% 15.8% ▼7.7% 20.0% ▼9.1%
Total 325,529 322,909 334,449 314,788 322,243 288,978 333,799 314,755 346,579 296,069 341,120 3,541,218
YOY % Change ▼10.1% ▼9.5% ▼10.4% ▼8.3% ▼0.4% 8.5% 2.2% 0.7% 11.5% ▼11.7% 16.0% ▼1.8%
1 Suzuki / Maruti 109,310 108,478 108,696 103,438 121,700 79,935 111,183 109,177 116,214 88,057 117,256 1,173,444
2 Hyundai 46,611 47,007 53,406 49,005 46,611 53,100 54,000 51,525 53,703 45,666 52,704 553,338
3 Tata 41,931 43,466 41,280 39,754 34,945 38,324 39,532 39,629 44,570 42,746 46,146 452,323
4 Mahindra 37,898 37,078 43,208 39,302 34,517 29,312 31,528 29,662 36,701 33,394 32,383 384,983
5 Toyota 13,887 13,035 13,424 9,321 13,298 15,569 15,861 14,365 14,240 14,581 16,992 154,573
6 Nissan 15,894 13,472 11,487 12,025 10,858 14,527 17,747 11,699 17,711 14,635 12,664 152,719
7 Ford 12,078 12,135 13,785 7,715 10,486 13,387 14,285 12,128 14,096 13,036 15,531 138,662
8 Honda 11,481 10,039 8,259 8,552 13,526 13,092 13,869 12,423 14,070 13,943 14,390 133,644
9 Ashok Leyland 7,331 7,296 8,420 8,823 8,427 8,553 7,509 9,371 9,316 7,830 9,137 92,013
10 GM 7,949 8,060 8,928 6,785 8,073 7,175 7,991 9,424 8,831 7,203 8,175 88,594
11 VW 6,310 6,584 5,439 3,631 5,259 4,221 5,102 4,038 3,956 3,928 3,854 52,322
12 Renault 4,533 5,659 6,901 8,467 3,881 2,185 4,544 2,363 4,038 3,267 3,289 49,127
13 VECV 3,704 3,695 3,373 3,997 4,107 3,591 3,764 3,248 2,492 2,751 2,863 37,585
14 Force 1,822 2,273 2,362 9,300 1,773 1,936 2,076 1,951 2,486 1,912 2,024 29,915
Others 4,790 4,632 5,481 4,673 4,782 4,071 4,808 3,752 4,155 3,120 3,712 47,976
Total 325,529 322,909 334,449 314,788 322,243 288,978 333,799 314,755 346,579 296,069 341,120 3,541,218
ED�800 cc 3,523 3,836 4,347 4,303 3,561 3,757 2,718 3,701 3,934 3,450 3,119 40,249
800 cc�ED�1,300 cc 1,297 1,335 1,216 1,649 1,660 2,076 1,519 1,868 1,594 1,369 1,206 16,789
1,300 cc�ED�1,600 cc 5,988 5,147 5,917 4,774 5,340 3,804 2,819 5,602 6,936 6,336 6,067 58,730
Subtotal 10,808 10,318 11,480 10,726 10,561 9,637 7,056 11,171 12,464 11,155 10,392 115,768
YOY % Change ▼5.3% 4.0% 1.5% 1.1% ▼16.6% ▼23.4% ▼24.2% 20.5% 39.1% 21.9% 28.7% 2.2%
LCV 1,552 1,575 1,740 1,428 1,489 1,592 1,327 1,561 1,814 1,593 1,447 17,118
Truck 203 237 303 256 253 358 216 374 430 246 227 3,103
Bus 54 60 35 26 30 57 45 51 49 26 60 493
Subtotal 1,809 1,872 2,078 1,710 1,772 2,007 1,588 1,986 2,293 1,865 1,734 20,714
YOY % Change 23.7% 27.7% 21.8% ▼1.7% 2.4% ▼5.7% 1.5% 12.0% 26.8% ▼22.2% 1.6% 6.3%
Total 12,617 12,190 13,558 12,436 12,333 11,644 8,644 13,157 14,757 13,020 12,126 136,482
YOY % Change ▼2.0% 7.1% 4.2% 0.7% ▼14.3% ▼20.8% ▼20.5% 19.1% 37.1% 12.7% 24.0% 2.8%
1 Suzuki 6,330 6,507 7,177 7,433 6,503 7,385 5,428 7,022 7,344 6,412 5,758 73,299
2 Toyota 3,850 3,326 4,077 2,663 3,110 1,132 1,462 3,640 4,896 4,528 4,696 37,380
3 Honda 2,028 1,872 1,884 2,007 2,286 2,622 1,449 2,015 1,972 1,761 1,374 21,270
4 Hino 124 134 183 140 116 138 114 166 173 122 194 1,604
5 Hyundai 81 72 44 33 70 96 79 73 138 80 39 805
6 Land Rover 70 60 79 50 150 90 44 53 64 47 9 716
7 Isuzu 12 48 48 12 60 42 30 84 80 46 30 492
8 UD Trucks 82 128 3 1 1 - - - - - - 215
Others 40 43 63 97 37 139 38 104 90 24 26 701
Total 12,617 12,190 13,558 12,436 12,333 11,644 8,644 13,157 14,757 13,020 12,126 136,482
Ind
ia (*
4)
Pak
istan
Ty
pe
Passenger Car
Commercial
Vehicle
Bran
dT
yp
e
Passenger
Vehicle
Com
mercial V
ehicle
LCV
MHCV
Bran
d
Country/ Type/ Brand
Taiw
an
Typ
e
Commercial
Vehicle
Bran
d

���������� ��� ���� ��������
����� ����� �!"#$%����
FOURIN Asia Automotive Intelligence
Sales
Vehicle Sales by Country, Type and Brand in Ten Asian Nations (January–November 2014)
(Unit: Vehicles)
Jan. Feb. Mar. Apr. May Jun. Jul. Aug. Sep. Oct. Nov. Dec. YTD Total
Thailand 68,509 71,680 83,983 73,260 69,681 73,799 69,527 68,835 69,137 70,850 73,045 792,306
Indonesia 103,497 111,765 113,079 106,811 97,154 110,560 91,393 96,728 102,711 105,357 91,268 1,130,323
Malaysia 50,273 50,718 58,919 58,732 55,939 58,561 60,267 51,125 47,771 54,187 55,313 601,805
Philippines 15,642 16,828 19,173 18,094 19,598 19,622 20,730 19,116 20,924 22,278 21,422 213,427
Singapore 2,688 2,583 3,092 2,637 3,098 3,665 3,962 4,212 4,334 4,547 4,285 39,103
Vietnam 8,900 5,908 9,313 10,116 9,849 10,846 11,172 10,991 12,940 13,305 13,593 116,933
Korea 121,999 121,792 138,247 147,765 137,396 139,864 146,226 123,087 128,446 138,683 144,740 1,488,245
Taiwan 44,301 20,796 34,307 34,235 36,724 40,317 45,140 23,184 34,746 34,328 33,958 382,036
India 269,796 265,731 302,313 236,924 254,939 269,947 247,200 262,388 279,708 273,116 260,124 2,922,186
Pakistan 14,185 13,096 12,567 12,522 12,642 12,560 7,160 12,540 13,155 12,936 12,073 135,436
699,790 680,897 774,993 701,096 697,020 739,741 702,777 672,206 713,872 729,587 709,821 7,821,800
YOY % Change ▼9.9% ▼7.4% ▼8.7% ▼3.6% ▼3.3% 3.5% ▼4.7% 3.5% 0.1% ▼3.3% 0.0% ▼3.3%
1 Toyota / Lexus 121,698 123,698 125,925 104,130 113,140 125,375 109,885 120,565 123,105 121,040 117,845 1,306,406
2 Suzuki / Maruti 108,486 103,313 116,000 109,923 106,474 117,106 107,785 98,796 105,009 111,513 101,748 1,186,153
3 Hyundai 87,449 87,179 94,655 103,699 98,809 96,159 91,384 83,907 85,294 98,410 93,195 1,020,140
4 Tata 44,729 43,414 53,010 42,781 51,662 56,681 50,532 51,608 53,591 48,355 47,747 544,110
5 Honda 37,632 38,126 43,533 43,589 40,956 40,115 46,860 40,492 43,214 40,679 48,039 463,235
6 Kia 36,870 35,487 46,175 35,745 34,521 34,939 35,535 36,565 41,136 38,957 37,602 413,532
7 Mahindra 35,058 34,072 41,650 30,573 31,513 31,620 27,545 27,483 36,066 34,375 26,943 356,898
8 Daihatsu / Perodua 28,317 34,689 32,825 33,395 28,513 32,900 35,416 29,465 28,014 33,372 33,225 350,131
9 Nissan / Infiniti 27,125 18,483 27,352 21,229 22,169 23,483 22,498 20,587 23,416 24,181 20,559 251,082
10 Mitsubishi 22,672 21,505 23,229 21,651 19,639 21,551 22,047 19,291 21,832 16,217 15,508 225,142
11 Isuzu 18,366 18,479 22,556 19,021 19,581 19,588 18,121 18,071 18,413 17,564 17,048 206,808
12 Ford 16,704 14,654 16,661 16,136 17,091 18,819 19,425 17,252 17,743 18,118 17,102 189,705
13 GM 10,944 10,313 13,186 13,164 12,684 12,150 13,314 11,946 13,256 13,537 12,353 136,847
14 GM Korea 9,798 10,744 12,384 10,143 10,226 10,125 11,109 8,666 8,093 8,170 8,221 107,679
15 Proton 10,062 9,336 11,281 8,076 8,076 9,046 8,029 7,512 7,273 7,053 7,176 92,920
16 VW 8,887 7,224 8,260 8,134 7,397 8,866 8,696 8,322 8,911 8,710 8,081 91,488
17 Ashok Leyland 7,041 5,232 7,151 7,694 7,511 7,582 7,680 6,319 7,377 6,616 6,635 76,838
18 Mazda 7,098 6,874 8,871 5,324 5,641 6,670 6,933 7,326 8,058 7,297 6,457 76,549
19 Fuso 6,807 5,577 6,318 7,114 6,083 7,022 7,377 6,862 8,144 8,233 6,819 76,356
20 Hino 6,305 5,551 7,099 6,870 6,300 6,800 6,478 6,275 6,771 6,815 6,766 72,030
21 BMW 4,500 4,821 5,588 6,153 7,400 8,515 6,040 4,741 5,954 7,360 8,568 69,640
22 Ssangyong 6,082 6,902 7,152 6,857 5,292 5,854 3,666 4,838 5,338 6,008 5,886 63,875
23 Mercedes-Benz (LV) 5,487 5,545 5,915 6,056 5,313 5,200 6,074 5,202 5,137 5,485 5,833 61,247
24 Renault 4,357 4,906 6,273 3,992 4,285 4,454 3,699 4,344 4,621 5,019 5,261 51,211
25 Renault Samsung 3,311 4,111 5,475 3,352 3,676 4,326 3,054 3,260 3,619 3,793 3,242 41,219
26 VECV (Eicher) 2,911 2,634 3,095 2,696 2,770 3,467 3,555 3,397 2,982 2,580 3,306 33,393
27 Audi 2,322 2,531 3,839 3,049 3,064 3,474 2,955 2,571 2,781 2,494 2,233 31,313
28 Force 2,003 1,719 2,648 5,611 1,812 1,812 1,977 1,962 2,145 1,639 1,558 24,886
29 Škoda 1,634 1,444 1,642 1,167 1,195 1,272 1,317 1,579 1,936 1,542 1,347 16,075
30 Peugeot 1,453 1,408 1,666 1,062 1,073 1,125 829 1,153 1,007 1,389 853 13,018
31 Fiat 1,066 519 858 915 834 770 1,101 845 973 981 886 9,748
32 Volvo Cars 916 865 810 1,076 923 879 747 866 832 745 893 9,552
33 Inokom 877 677 872 729 778 802 773 719 738 669 962 8,596
34 Mini 477 433 562 478 797 888 719 633 633 1,007 987 7,614
35 Subaru 467 337 600 567 621 756 525 604 626 651 641 6,395
36 Tata Daewoo 562 590 706 567 571 573 524 454 554 616 612 6,329
37 Land Rover 633 592 637 524 602 627 664 529 436 384 496 6,124
38 Porsche 421 259 433 432 580 529 515 711 873 571 650 5,974
39 Chrysler 351 315 433 353 361 427 389 441 575 559 563 4,767
40 UD Trucks 160 274 334 292 332 330 239 272 364 175 157 2,929
41 Naza 188 245 357 306 245 260 226 195 373 183 337 2,915
42 Volvo 222 219 270 170 199 237 194 204 213 174 178 2,280
43 Jaguar 166 146 195 180 243 289 199 128 223 177 181 2,127
44 Scania 81 63 108 120 121 146 144 105 136 158 222 1,404
Others 7,095 5,392 6,404 6,001 5,947 6,132 6,003 5,143 6,087 16,016 24,900 95,120
699,790 680,897 774,993 701,096 697,020 739,741 702,777 672,206 713,872 729,587 709,821 7,821,800
Small Car 22,553 25,206 30,007 25,573 24,848 28,678 25,647 25,641 25,335 24,887 24,630 283,005
Middle Car 1,517 1,501 1,761 2,546 1,899 1,528 1,282 1,644 1,445 1,562 1,337 18,022
Large Car 98 95 112 173 90 26 36 28 24 35 23 740
MPV 1,245 987 1,254 1,513 1,229 1,133 1,010 998 1,452 1,841 1,665 14,327
Unknown 993 1,275 1,679 1,363 1,264 1,569 1,702 1,679 2,057 1,834 1,579 16,994
Subtotal 26,406 29,064 34,813 31,168 29,330 32,934 29,677 29,990 30,313 30,159 29,234 333,088
YOY % Change ▼55.9% ▼54.2% ▼55.8% ▼34.4% ▼44.4% ▼33.7% ▼37.5% ▼41.2% ▼35.9% ▼28.0% ▼27.7% ▼42.6%
4WD 3,326 3,880 4,132 3,825 3,570 3,172 3,095 2,858 2,188 2,140 3,761 35,947
Van 1,317 963 1,211 1,287 1,265 1,383 1,252 1,372 1,325 1,312 1,165 13,852
Pickup MPL � 1t 432 504 484 453 418 510 372 386 387 405 345 4,696
Pickup MPL = 1t 35,080 35,142 40,797 34,383 32,963 33,659 32,899 31,832 32,279 34,220 35,644 378,898
Pickup MPL = 1.5t 75 122 112 71 72 88 120 54 64 80 41 899
Subtotal 40,230 40,611 46,736 40,019 38,288 38,812 37,738 36,502 36,243 38,157 40,956 434,292
YOY % Change ▼35.3% ▼34.8% ▼36.9% ▼31.4% ▼30.1% ▼25.1% ▼18.4% ▼19.7% ▼18.0% ▼12.8% ▼18.4% ▼26.8%
2t � MPL � 4t 748 658 748 684 744 696 898 884 1,068 910 948 8,986
4t � MPL 1,112 1,333 1,657 1,347 1,285 1,336 1,195 1,445 1,496 1,596 1,850 15,652
Subtotal 1,860 1,991 2,405 2,031 2,029 2,032 2,093 2,329 2,564 2,506 2,798 24,638
YOY % Change ▼50.0% ▼51.4% ▼47.1% ▼46.1% ▼52.5% ▼54.5% ▼53.0% ▼38.7% ▼25.2% ▼23.9% ▼0.5% ▼42.2%
Unknown 13 14 29 42 34 21 19 14 17 28 57 288
Subtotal 42,103 42,616 49,170 42,092 40,351 40,865 39,850 38,845 38,824 40,691 43,811 459,218
YOY % Change ▼36.2% ▼35.9% ▼37.5% ▼32.3% ▼31.7% ▼27.5% ▼21.5% ▼21.2% ▼18.5% ▼13.6% ▼17.4% ▼27.9%
68,509 71,680 83,983 73,260 69,681 73,799 69,527 68,835 69,137 70,850 73,045 792,306
YOY % Change ▼45.5% ▼44.8% ▼46.7% ▼33.2% ▼37.7% ▼30.4% ▼29.2% ▼31.4% ▼27.2% ▼20.4% ▼21.9% ▼34.9%
Total
Th
ailan
d (*
2)
Co
mm
ercial V
eh
icle
Ty
pe
Passenger
Vehicle
Truck
LCV
Country/ Type/ Brand
Ten
A
sian
N
atio
ns (*
1)
Co
un
try
Total
Total
Bran
d
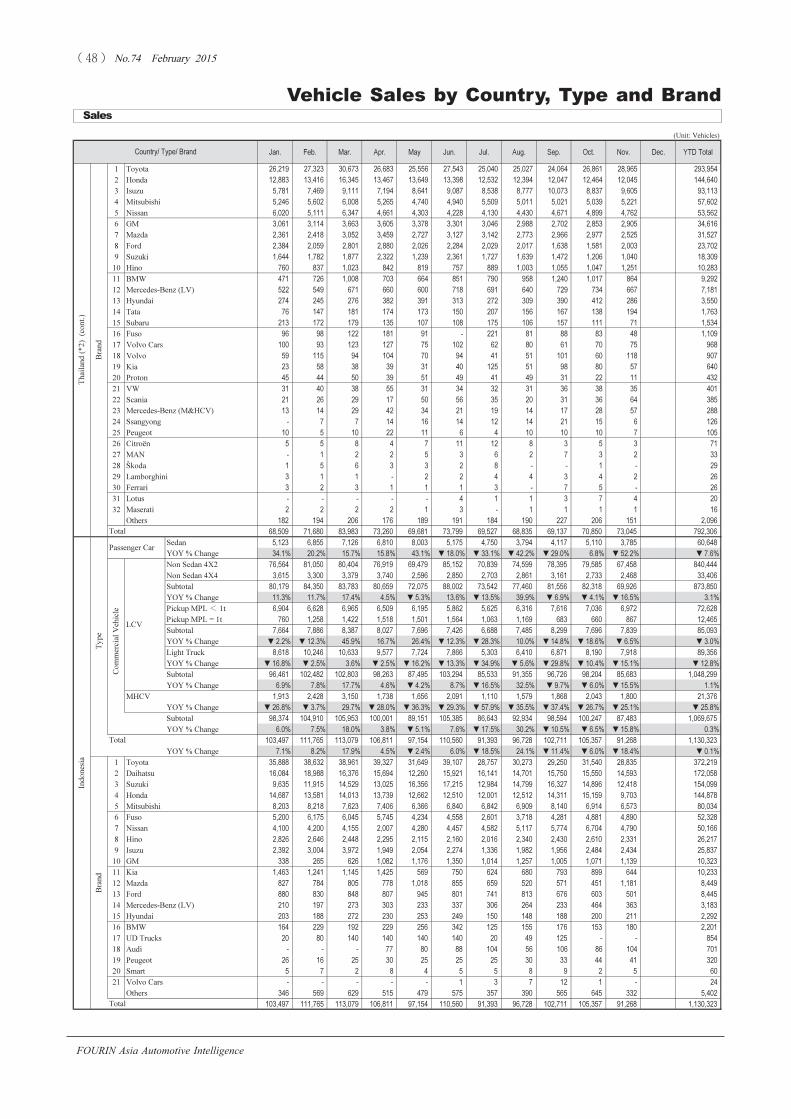
���������� ��� ���� ��������
����� ����� �!"#$%����
FOURIN Asia Automotive Intelligence
Vehicle Sales by Country, Type and Brand
Sales
(Unit: Vehicles)
Jan. Feb. Mar. Apr. May Jun. Jul. Aug. Sep. Oct. Nov. Dec. YTD Total
1 Toyota 26,219 27,323 30,673 26,683 25,556 27,543 25,040 25,027 24,064 26,861 28,965 293,954
2 Honda 12,883 13,416 16,345 13,467 13,649 13,398 12,532 12,394 12,047 12,464 12,045 144,640
3 Isuzu 5,781 7,469 9,111 7,194 8,641 9,087 8,538 8,777 10,073 8,837 9,605 93,113
4 Mitsubishi 5,246 5,602 6,008 5,265 4,740 4,940 5,509 5,011 5,021 5,039 5,221 57,602
5 Nissan 6,020 5,111 6,347 4,661 4,303 4,228 4,130 4,430 4,671 4,899 4,762 53,562
6 GM 3,061 3,114 3,663 3,605 3,378 3,301 3,046 2,988 2,702 2,853 2,905 34,616
7 Mazda 2,361 2,418 3,052 3,459 2,727 3,127 3,142 2,773 2,966 2,977 2,525 31,527
8 Ford 2,384 2,059 2,801 2,880 2,026 2,284 2,029 2,017 1,638 1,581 2,003 23,702
9 Suzuki 1,644 1,782 1,877 2,322 1,239 2,361 1,727 1,639 1,472 1,206 1,040 18,309
10 Hino 760 837 1,023 842 819 757 889 1,003 1,055 1,047 1,251 10,283
11 BMW 471 726 1,008 703 664 851 790 958 1,240 1,017 864 9,292
12 Mercedes-Benz (LV) 522 549 671 660 600 718 691 640 729 734 667 7,181
13 Hyundai 274 245 276 382 391 313 272 309 390 412 286 3,550
14 Tata 76 147 181 174 173 150 207 156 167 138 194 1,763
15 Subaru 213 172 179 135 107 108 175 106 157 111 71 1,534
16 Fuso 96 98 122 181 91 - 221 81 88 83 48 1,109
17 Volvo Cars 100 93 123 127 75 102 62 80 61 70 75 968
18 Volvo 59 115 94 104 70 94 41 51 101 60 118 907
19 Kia 23 58 38 39 31 40 125 51 98 80 57 640
20 Proton 45 44 50 39 51 49 41 49 31 22 11 432
21 VW 31 40 38 55 31 34 32 31 36 38 35 401
22 Scania 21 26 29 17 50 56 35 20 31 36 64 385
23 Mercedes-Benz (M&HCV) 13 14 29 42 34 21 19 14 17 28 57 288
24 Ssangyong - 7 7 14 16 14 12 14 21 15 6 126
25 Peugeot 10 5 10 22 11 6 4 10 10 10 7 105
26 Citroën 5 5 8 4 7 11 12 8 3 5 3 71
27 MAN - 1 2 2 5 3 6 2 7 3 2 33
28 Škoda 1 5 6 3 3 2 8 - - 1 - 29
29 Lamborghini 3 1 1 - 2 2 4 4 3 4 2 26
30 Ferrari 3 2 3 1 1 1 3 - 7 5 - 26
31 Lotus - - - - - 4 1 1 3 7 4 20
32 Maserati 2 2 2 2 1 3 - 1 1 1 1 16
Others 182 194 206 176 189 191 184 190 227 206 151 2,096
68,509 71,680 83,983 73,260 69,681 73,799 69,527 68,835 69,137 70,850 73,045 792,306
Sedan 5,123 6,855 7,126 6,810 8,003 5,175 4,750 3,794 4,117 5,110 3,785 60,648
YOY % Change 34.1% 20.2% 15.7% 15.8% 43.1% ▼18.0% ▼33.1% ▼42.2% ▼29.0% 6.8% ▼52.2% ▼7.6%
Non Sedan 4X2 76,564 81,050 80,404 76,919 69,479 85,152 70,839 74,599 78,395 79,585 67,458 840,444
Non Sedan 4X4 3,615 3,300 3,379 3,740 2,596 2,850 2,703 2,861 3,161 2,733 2,468 33,406
Subtotal 80,179 84,350 83,783 80,659 72,075 88,002 73,542 77,460 81,556 82,318 69,926 873,850
YOY % Change 11.3% 11.7% 17.4% 4.5% ▼5.3% 13.6% ▼13.5% 39.9% ▼6.9% ▼4.1% ▼16.5% 3.1%
Pickup MPL � 1t 6,904 6,628 6,965 6,509 6,195 5,862 5,625 6,316 7,616 7,036 6,972 72,628
Pickup MPL = 1t 760 1,258 1,422 1,518 1,501 1,564 1,063 1,169 683 660 867 12,465
Subtotal 7,664 7,886 8,387 8,027 7,696 7,426 6,688 7,485 8,299 7,696 7,839 85,093
YOY % Change ▼2.2% ▼12.3% 45.9% 16.7% 26.4% ▼12.3% ▼28.3% 10.0% ▼14.8% ▼18.6% ▼6.5% ▼3.0%
Light Truck 8,618 10,246 10,633 9,577 7,724 7,866 5,303 6,410 6,871 8,190 7,918 89,356
YOY % Change ▼16.8% ▼2.5% 3.6% ▼2.5% ▼16.2% ▼13.3% ▼34.9% ▼5.6% ▼29.8% ▼10.4% ▼15.1% ▼12.8%
Subtotal 96,461 102,482 102,803 98,263 87,495 103,294 85,533 91,355 96,726 98,204 85,683 1,048,299
YOY % Change 6.9% 7.8% 17.7% 4.6% ▼4.2% 8.7% ▼16.5% 32.5% ▼9.7% ▼6.0% ▼15.5% 1.1%
MHCV 1,913 2,428 3,150 1,738 1,656 2,091 1,110 1,579 1,868 2,043 1,800 21,376
YOY % Change ▼26.8% ▼3.7% 29.7% ▼28.0% ▼36.3% ▼29.3% ▼57.9% ▼35.5% ▼37.4% ▼26.7% ▼25.1% ▼25.8%
Subtotal 98,374 104,910 105,953 100,001 89,151 105,385 86,643 92,934 98,594 100,247 87,483 1,069,675
YOY % Change 6.0% 7.5% 18.0% 3.8% ▼5.1% 7.6% ▼17.5% 30.2% ▼10.5% ▼6.5% ▼15.8% 0.3%
103,497 111,765 113,079 106,811 97,154 110,560 91,393 96,728 102,711 105,357 91,268 1,130,323
YOY % Change 7.1% 8.2% 17.9% 4.5% ▼2.4% 6.0% ▼18.5% 24.1% ▼11.4% ▼6.0% ▼18.4% ▼0.1%
1 Toyota 35,888 38,632 38,961 39,327 31,649 39,107 28,757 30,273 29,250 31,540 28,835 372,219
2 Daihatsu 16,084 18,988 16,376 15,694 12,260 15,921 16,141 14,701 15,750 15,550 14,593 172,058
3 Suzuki 9,635 11,915 14,529 13,025 16,356 17,215 12,984 14,799 16,327 14,896 12,418 154,099
4 Honda 14,687 13,581 14,013 13,739 12,662 12,510 12,001 12,512 14,311 15,159 9,703 144,878
5 Mitsubishi 8,203 8,218 7,623 7,406 6,366 6,840 6,842 6,909 8,140 6,914 6,573 80,034
6 Fuso 5,200 6,175 6,045 5,745 4,234 4,558 2,601 3,718 4,281 4,881 4,890 52,328
7 Nissan 4,100 4,200 4,155 2,007 4,280 4,457 4,582 5,117 5,774 6,704 4,790 50,166
8 Hino 2,826 2,646 2,448 2,295 2,115 2,160 2,016 2,340 2,430 2,610 2,331 26,217
9 Isuzu 2,392 3,004 3,972 1,949 2,054 2,274 1,336 1,982 1,956 2,484 2,434 25,837
10 GM 338 265 626 1,082 1,176 1,350 1,014 1,257 1,005 1,071 1,139 10,323
11 Kia 1,463 1,241 1,145 1,425 569 750 624 680 793 899 644 10,233
12 Mazda 827 784 805 778 1,018 855 659 520 571 451 1,181 8,449
13 Ford 880 830 848 807 945 801 741 813 676 603 501 8,445
14 Mercedes-Benz (LV) 210 197 273 303 233 337 306 264 233 464 363 3,183
15 Hyundai 203 188 272 230 253 249 150 148 188 200 211 2,292
16 BMW 164 229 192 229 256 342 125 155 176 153 180 2,201
17 UD Trucks 20 80 140 140 140 140 20 49 125 - - 854
18 Audi - - - 77 80 88 104 56 106 86 104 701
19 Peugeot 26 16 25 30 25 25 25 30 33 44 41 320
20 Smart 5 7 2 8 4 5 5 8 9 2 5 60
21 Volvo Cars - - - - - 1 3 7 12 1 - 24
Others 346 569 629 515 479 575 357 390 565 645 332 5,402
103,497 111,765 113,079 106,811 97,154 110,560 91,393 96,728 102,711 105,357 91,268 1,130,323
Co
mm
ercial V
eh
icle
LCV
Total
Bran
dB
ran
d
Country/ Type/ Brand
Th
ailan
d (*
2) (co
nt.)
In
do
nesia
Total
Ty
pe
Passenger Car
Total

���������� ��� ���� ��������
����� ����� �!"#$%����
FOURIN Asia Automotive Intelligence
Sales
in Ten Asian Nations (January–November 2014)
(Unit: Vehicles)
Jan. Feb. Mar. Apr. May Jun. Jul. Aug. Sep. Oct. Nov. Dec. YTD Total
ED � 1,000 cc 32 27 30 34 11 4 9 4 2 7 9 169
1,000 cc�ED�1,300 cc 381 280 534 470 371 258 251 260 301 291 276 3,673
1,300 cc�ED�1,500 cc 4,949 2,703 2,698 5,082 5,652 6,018 5,481 5,904 5,018 5,494 5,529 54,528
1,500 cc�ED�1,800 cc 1,544 1,316 1,653 1,498 1,209 1,427 1,505 1,126 1,085 844 702 13,909
1,800 cc�ED�2,000 cc 1,261 1,295 1,838 1,720 1,500 1,314 1,288 933 1,471 966 1,138 14,724
2,000 cc�ED�2,500 cc 419 362 444 367 316 222 237 237 259 184 29 3,076
2,500 cc�ED 15 10 12 15 14 8 3 6 5 2 9 99
Unknown 27,907 27,931 32,702 30,363 28,910 30,530 32,678 26,057 24,215 30,627 31,524 323,444
Subtotal 36,508 33,924 39,911 39,549 37,983 39,781 41,452 34,527 32,356 38,415 39,216 413,622
YOY % Change ▼5.6% 7.4% 2.8% 16.6% 16.1% 8.0% ▼10.9% ▼0.9% ▼14.1% 4.0% 9.3% 12.2%
4WD/SUV 2,624 2,203 2,901 2,983 2,858 2,487 2,684 2,392 2,422 2,410 2,161 28,125
Van 316 448 585 568 476 612 470 407 391 400 508 5,181
MPV 5,254 9,129 8,725 9,388 8,548 9,018 8,972 7,572 6,228 6,319 6,737 85,890
Total 44,702 45,704 52,122 52,488 49,865 51,898 53,578 44,898 41,397 47,544 48,622 532,818
YOY % Change ▼8.2% 13.1% 3.1% 15.2% 14.9% 9.8% ▼12.2% ▼0.3% ▼14.5% ▼0.8% 6.3% 11.4%
GVW � 5t 660 685 894 843 1,010 926 926 867 843 882 951 9,487
5t � GVW � 11t 38 53 61 45 44 48 53 40 50 91 74 597
11t � GVW � 18t 68 46 33 38 49 52 75 40 76 67 75 619
18t � GVW � 25t 55 74 49 55 40 49 46 50 43 17 35 513
Unknown 329 284 355 351 301 317 294 351 322 325 294 3,523
Subtotal 1,150 1,142 1,392 1,332 1,444 1,392 1,394 1,348 1,334 1,382 1,429 14,739
YOY % Change ▼15.5% 7.5% ▼4.5% ▼19.1% ▼9.5% 0.6% ▼12.2% ▼14.0% ▼7.7% ▼17.2% ▼12.0% ▼0.2%
Semi-tractor 103 168 115 110 132 164 148 86 168 109 189 1,492
Bus 117 80 108 86 69 70 68 46 67 51 92 854
Panel Van 223 299 374 328 342 432 326 307 508 450 354 3,943
Pickup 3,978 3,325 4,808 4,388 4,087 4,605 4,753 4,440 4,297 4,651 4,627 47,959
5,571 5,014 6,797 6,244 6,074 6,663 6,689 6,227 6,374 6,643 6,691 68,987
YOY % Change ▼11.3% 10.4% ▼3.5% ▼6.9% ▼0.2% 5.9% ▼8.9% 8.8% ▼1.0% ▼4.0% 7.8% 8.8%
50,273 50,718 58,919 58,732 55,939 58,561 60,267 51,125 47,771 54,187 55,313 601,805
YOY % Change ▼8.7% 12.8% 2.3% 11.9% 12.7% 9.2% ▼11.9% 0.0% ▼13.1% ▼1.6% 5.9% 10.8%
1 Daihatsu / Perodua 12,182 15,674 16,395 17,669 16,228 16,949 19,245 14,707 12,230 17,780 18,612 177,671
2 Proton 9,735 10,684 12,315 10,091 10,155 10,060 11,045 8,611 8,053 8,130 8,203 107,082
3 Toyota / Lexus 6,687 7,901 10,046 9,282 8,267 9,755 8,412 7,880 7,585 8,064 8,499 92,378
4 Nissan 6,393 4,319 4,915 6,916 7,365 7,295 6,685 6,689 6,170 6,188 6,280 69,215
5 Honda 4,405 3,347 3,875 3,379 3,043 3,416 3,730 3,040 3,371 3,983 4,089 39,678
6 Mitsubishi 1,204 983 1,560 1,271 1,263 1,297 1,376 1,062 1,121 1,024 993 13,154
7 Isuzu 1,122 753 1,049 1,173 1,116 1,307 1,390 1,124 1,183 1,209 1,080 12,506
8 Ford 797 542 918 1,182 1,292 1,063 977 1,014 990 971 768 10,514
9 VW 806 702 939 888 888 882 942 931 885 1,073 1,138 10,074
10 Mazda 923 497 972 916 858 597 1,051 972 860 708 713 9,067
11 Inokom 910 817 977 1,056 619 1,023 823 563 854 658 383 8,683
12 Kia 567 500 668 666 653 670 676 689 693 656 678 7,116
13 BMW 525 523 631 534 545 613 505 504 448 730 724 6,282
14 Hino 633 592 637 524 602 627 664 529 436 384 496 6,124
Others 3,384 2,884 3,022 3,185 3,045 3,007 2,746 2,810 2,892 2,629 2,657 32,261
50,273 50,718 58,919 58,732 55,939 58,561 60,267 51,125 47,771 54,187 55,313 601,805
Passenger Vehicle 5,298 5,620 7,174 6,732 7,507 8,278 8,339 7,975 8,477 8,975 8,040 82,415
YOY % Change 26.4% 21.7% 40.1% 41.0% 44.4% 100.3% 64.6% 55.7% 65.1% 46.5% 46.7% 49.9%
10,344 11,208 11,999 11,362 12,091 11,344 12,391 11,141 12,447 13,303 13,382 131,012
YOY % Change 27.5% 14.1% 18.0% 10.1% 13.4% 12.2% 16.6% 29.9% 29.3% 24.7% 28.2% 20.0%
15,642 16,828 19,173 18,094 19,598 19,622 20,730 19,116 20,924 22,278 21,422 213,427
YOY % Change 27.1% 16.5% 25.4% 19.9% 23.6% 37.8% 32.1% 39.5% 41.7% 32.6% 34.6% 30.1%
1 Toyota / Lexus 7,062 6,926 8,840 8,102 9,132 8,407 10,123 8,728 9,529 10,163 n.a. 87,012
2 Mitsubishi 3,411 4,409 4,345 4,246 4,120 4,535 3,776 4,153 4,155 n.a. n.a. 37,150
3 Honda 1,076 1,277 1,339 1,764 1,711 1,697 1,723 1,565 2,010 1,950 1,924 18,036
4 Ford 916 1,033 1,119 1,086 1,119 1,156 1,012 1,076 1,213 n.a. n.a. 9,730
5 Isuzu 1,055 1,002 1,261 507 934 956 1,353 1,068 1,361 n.a. n.a. 9,497
6 Nissan 531 611 657 687 803 952 828 749 712 n.a. n.a. 6,530
7 Kia 655 584 625 677 662 621 637 649 516 n.a. n.a. 5,626
8 Suzuki 472 478 497 437 492 556 579 520 609 n.a. n.a. 4,640
9 Mazda 204 220 218 207 309 289 340 270 355 n.a. n.a. 2,412
10 Hino 45 50 60 50 59 88 60 60 60 n.a. n.a. 532
Others 215 238 212 331 257 365 299 278 404 10,165 19,498 32,262
15,642 16,828 19,173 18,094 19,598 19,622 20,730 19,116 20,924 22,278 21,422 213,427
Passenger Vehicle 2,090 1,875 1,997 1,792 2,143 2,414 2,278 2,589 2,946 2,775 2,933 25,832
YOY % Change ▼8.7% 38.5% 14.5% ▼6.6% ▼2.0% 9.9% 33.8% 48.2% 50.0% 69.1% 79.7% 37.8%
598 708 1,095 845 955 1,251 1,684 1,623 1,388 1,772 1,352 13,271
YOY % Change 0.5% 87.8% 94.5% 31.0% 55.5% 81.0% 112.9% 146.3% 116.9% 128.4% 108.6% 109.0%
2,688 2,583 3,092 2,637 3,098 3,665 3,962 4,212 4,334 4,547 4,285 39,103
YOY % Change ▼6.8% 49.2% 34.0% 2.8% 10.6% 26.9% 58.9% 75.1% 66.4% 88.1% 87.9% 55.8%
1 Toyota / Lexus 435 513 584 610 684 828 832 972 882 1,090 994 8,424
2 VW 228 315 446 266 319 464 635 575 527 464 455 4,694
3 Nissan 582 356 287 339 306 394 378 316 460 488 422 4,328
4 Fuso 246 330 367 268 269 286 181 370 409 193 243 3,162
5 Isuzu 197 150 169 196 237 248 258 252 158 245 243 2,353
6 Volvo Cars 92 99 160 141 166 195 243 327 266 287 206 2,182
7 Jaguar 69 74 96 65 105 183 200 143 222 273 262 1,692
8 Honda 110 128 103 65 175 166 124 123 119 133 124 1,370
9 Land Rover 52 23 61 36 56 88 129 101 213 237 256 1,252
10 Kia 24 25 70 54 76 94 117 143 165 172 166 1,106
Others 653 570 749 597 705 719 865 890 913 965 914 8,540
2,688 2,583 3,092 2,637 3,098 3,665 3,962 4,212 4,334 4,547 4,285 39,103
Ty
pe
Total
Total
Ph
ilip
pin
es (*
3)
Commercial Vehicle
Total
Ty
pe
Commercial Vehicle
Bran
d
Sin
gapo
re (*
4)
Total
Bran
d
Country/ Type/ Brand
Ty
pe
Passeng
er V
eh
icle
Total
Subtotal
Passenger
Car
Malay
sia
Bran
d
Co
mm
ercial V
eh
icle
Truck
Total

���������� ��� ���� ��������
����� ����� �!"#$%����
FOURIN Asia Automotive Intelligence
Vehicle Sales by Country, Type and Brand
Sales
(Unit: Vehicles)
Jan. Feb. Mar. Apr. May Jun. Jul. Aug. Sep. Oct. Nov. Dec. YTD Total
Passenger Vehicle 3,838 1,895 3,480 3,665 3,592 4,142 4,387 4,054 4,801 4,878 5,006 43,738
YOY % Change 8.3% 32.2% 51.5% 32.6% 30.3% 36.6% 28.2% 44.9% 43.1% 52.3% 34.1% 35.3%
5,062 4,013 5,833 6,451 6,257 6,704 6,785 6,937 8,139 8,427 8,587 73,195
YOY % Change 32.6% 78.7% 9.0% 23.2% 14.9% 28.7% 41.7% 56.2% 59.2% 52.7% 54.4% 38.8%
8,900 5,908 9,313 10,116 9,849 10,846 11,172 10,991 12,940 13,305 13,593 116,933
YOY % Change 20.9% 60.6% 21.8% 26.4% 20.1% 31.6% 36.1% 51.8% 52.8% 52.6% 46.2% 37.5%
1 Toyota 3,145 1,583 2,737 3,019 2,834 3,448 3,785 3,638 3,778 4,190 4,235 36,392
2 Kia 1,178 1,033 1,890 2,047 1,977 2,082 1,652 1,739 2,109 2,060 2,065 19,832
3 Ford 954 650 817 939 932 972 1,307 1,287 1,390 1,538 1,552 12,338
4 GM 627 356 676 615 659 686 642 789 1,133 1,015 1,018 8,216
5 Honda 803 381 559 531 457 507 443 323 769 486 396 5,655
6 Mazda 491 274 431 386 412 465 466 371 445 363 419 4,523
7 Suzuki 102 358 345 317 347 449 322 318 391 424 431 3,804
8 Isuzu 123 103 149 164 184 182 290 313 399 471 569 2,947
9 Mercedes-Benz (LV) 152 126 130 163 121 225 141 288 355 339 363 2,403
Others 1,325 1,044 1,579 1,935 1,926 1,830 2,124 1,925 2,171 2,419 2,545 20,823
8,900 5,908 9,313 10,116 9,849 10,846 11,172 10,991 12,940 13,305 13,593 116,933
Passenger Car 56,873 60,557 66,427 74,589 69,942 64,316 67,600 58,990 60,472 66,031 65,186 710,983
SUV 25,972 24,352 28,551 28,961 28,587 29,397 26,908 22,918 28,040 28,662 31,656 304,004
CDV 3,862 3,809 4,020 4,246 3,952 6,956 12,553 8,173 6,322 6,170 7,032 67,095
Subtotal 86,707 88,718 98,998 107,796 102,481 100,669 107,061 90,081 94,834 100,863 103,874 1,082,082
YOY % Change 4.1% 9.6% 0.9% 10.4% 3.9% 7.4% 0.7% ▼3.4% 10.4% 2.1% 5.4% 4.5%
Import 14,849 13,852 15,733 16,712 15,314 17,803 18,112 16,442 17,027 16,436 16,959 179,239
YOY % Change 20.3% 31.2% 30.4% 25.5% 14.2% 39.2% 21.1% 17.6% 34.4% 16.1% 22.4% 24.4%
Total 101,556 102,570 114,731 124,508 117,795 118,472 125,173 106,523 111,861 117,299 120,833 1,261,321
YOY % Change 6.2% 12.1% 4.2% 12.2% 5.1% 11.2% 3.2% ▼0.7% 13.5% 3.8% 7.5% 6.9%
Truck 14,101 13,416 16,021 16,144 13,810 14,345 15,129 10,971 11,297 14,060 17,071 156,365
Bus 5,346 4,650 6,068 5,640 4,338 5,312 4,507 4,422 4,023 5,983 5,811 56,100
SPV 996 1,156 1,427 1,473 1,453 1,735 1,417 1,171 1,265 1,341 1,025 14,459
Subtotal 20,443 19,222 23,516 23,257 19,601 21,392 21,053 16,564 16,585 21,384 23,907 226,924
YOY % Change ▼5.7% 3.5% 12.0% 9.6% ▼8.1% 3.8% 8.8% 0.4% 4.0% ▼9.7% 2.0% 1.6%
121,999 121,792 138,247 147,765 137,396 139,864 146,226 123,087 128,446 138,683 144,740 1,488,245
YOY % Change 4.0% 10.6% 5.4% 11.8% 3.0% 10.0% 4.0% ▼0.5% 12.2% 1.5% 6.5% 6.1%
1 Hyundai 51,525 51,415 57,829 65,891 59,911 59,915 59,640 48,143 47,789 58,103 55,725 615,886
2 Kia 34,000 35,000 39,005 39,005 36,252 35,502 42,305 36,003 38,605 37,005 44,500 417,182
3 GM Korea 10,873 10,301 13,161 13,086 12,405 12,132 13,307 11,938 13,218 13,507 12,344 136,272
4 Ssangyong 4,500 4,821 5,588 6,153 7,400 8,515 6,040 4,741 5,954 7,360 8,568 69,640
5 Renault Samsung 5,445 5,502 5,850 6,010 5,271 5,157 6,027 5,158 5,094 5,455 5,806 60,775
6 BMW 3,408 3,154 3,511 3,625 3,212 3,358 3,353 3,213 3,303 3,480 3,481 37,098
7 VW 2,773 2,641 2,532 3,310 2,479 2,907 3,349 3,067 3,538 3,511 2,386 32,493
8 Mercedes-Benz (LV) 2,700 2,104 2,255 2,609 2,690 3,010 3,157 2,512 2,289 1,759 2,727 27,812
9 Audi 2,137 2,187 2,457 1,980 2,047 2,728 2,860 2,762 2,349 1,933 2,441 25,881
10 Toyota / Lexus 749 694 1,097 1,144 1,086 1,144 1,073 1,043 1,203 1,093 1,364 11,690
11 Ford 757 558 792 799 671 710 917 626 733 841 654 8,058
12 Mini 469 591 557 654 370 809 569 573 629 638 473 6,332
13 Tata Daewoo 562 590 706 567 571 573 524 454 554 616 612 6,329
14 Honda 301 317 401 302 601 611 495 436 434 793 835 5,526
15 Nissan / Infiniti 345 310 426 344 354 419 379 437 566 552 555 4,687
16 Chrysler 246 154 322 355 361 466 408 422 443 459 485 4,121
17 Land Rover 232 300 332 374 280 283 320 301 317 284 302 3,325
18 Peugeot 148 206 266 330 222 184 315 230 289 248 407 2,845
19 Jaguar 218 180 204 218 231 245 276 272 298 320 311 2,773
20 Volvo Cars 94 159 201 217 237 311 305 157 284 216 212 2,393
21 Volvo Cars 168 175 218 143 148 193 157 172 155 135 116 1,780
Others 349 433 537 649 597 692 450 427 402 375 436 5,347
121,999 121,792 138,247 147,765 137,396 139,864 146,226 123,087 128,446 138,683 144,740 1,488,245
Domestic 17,501 7,617 13,741 13,691 15,348 17,433 20,417 7,720 13,639 14,073 14,329 155,509
Import 5,801 2,917 5,237 5,153 5,310 5,310 5,434 4,196 5,630 5,339 4,745 55,072
Subtotal 23,302 10,534 18,978 18,844 20,658 22,743 25,851 11,916 19,269 19,412 19,074 210,581
YOY % Change 0.8% ▼7.0% 37.6% 20.9% 20.2% 22.1% 15.1% 4.9% 25.0% 3.7% ▼4.1% 12.3%
Domestic 10,120 4,189 6,434 6,250 6,623 7,529 8,760 4,024 5,782 5,555 5,291 70,557
Import 7,196 3,502 5,154 5,641 5,552 6,290 6,769 4,348 5,876 5,779 6,372 62,479
Subtotal 17,316 7,691 11,588 11,891 12,175 13,819 15,529 8,372 11,658 11,334 11,663 133,036
Domestic 2,724 1,735 2,581 2,438 2,176 2,603 2,575 1,919 2,561 2,371 2,127 25,810
Import 265 284 390 328 328 433 370 348 430 368 418 3,962
Subtotal 2,989 2,019 2,971 2,766 2,504 3,036 2,945 2,267 2,991 2,739 2,545 29,772
Domestic 255 241 295 265 348 287 351 296 334 377 331 3,380
Import 129 106 240 173 186 167 232 141 194 212 163 1,943
Subtotal 384 347 535 438 534 454 583 437 528 589 494 5,323
Domestic 136 103 118 106 446 87 102 57 147 108 104 1,514
Import 174 102 117 190 407 178 130 135 153 146 78 1,810
Subtotal 310 205 235 296 853 265 232 192 300 254 182 3,324
Domestic 13,235 6,268 9,428 9,059 9,593 10,506 11,788 6,296 8,824 8,411 7,853 101,261
Import 7,764 3,994 5,901 6,332 6,473 7,068 7,501 4,972 6,653 6,505 7,031 70,194
20,999 10,262 15,329 15,391 16,066 17,574 19,289 11,268 15,477 14,916 14,884 171,455
YOY % Change 7.7% 15.5% 12.1% 16.1% 19.6% 26.0% 10.2% 13.2% 14.4% 10.7% 0.5% 12.8%
44,301 20,796 34,307 34,235 36,724 40,317 45,140 23,184 34,746 34,328 33,958 382,036
YOY % Change 4.0% 2.9% 24.9% 18.7% 19.9% 23.8% 12.9% 8.8% 20.1% 6.6% ▼2.1% 12.5%
Vietn
am
(*
5)
RV
Commercial Vehicle
Country/ Type/ Brand
Ty
pe
Co
mm
ercial V
eh
icle
Domestic
Total
Total
Bran
d
Bus
3.5t�
GVW
Total
Sedan
LCV
GVW�
3.5t
Ko
rea (*
6)
Passen
ger V
eh
icle
Bran
d
Taiw
an
Total
Total
Ty
pe
Truck
3.5t�
GVW
PC
Total
Commercial
Vehicle
(not including
imports)
Ty
pe

���������� ��� ���� ��������
����� ����� �!"#$%����
FOURIN Asia Automotive Intelligence
Sales
in Ten Asian Nations (January–November 2014)
Reference� � � CDV: Car Derived Van� ED: Engine Displacement� GVW: Gross Vehicle Weight� LCV: Light Commercial Vehicle� LV: Light Vehicle� MHCV: Medium/Heavy-Duty Commercial Vehicle
MPL: Maximum Payload PC: Passenger Car SPV: Special Purpose Vehicle such as ambulance or fire truck YOY: Year-on-year
*1) Data type: Thailand and Philippines - retail; Indonesia, Vietnam, Korea, India and Pakistan - wholesale; Singapore, Malaysia and Taiwan - new registration.
*2) Vehicle type classification by TAIA (Thailand Automotive Industry Association). Some EU brands, such as Mercedes-Benz and BMW, whose segmentation is unknown are listed as Unknown.
*3) Mitsubishi brand may include volume of Fuso.
*4) Registration volume of vehicles with COE (Certificate of Entitlement). Includes only MTA (Motor Traders Association) members. Parallel import vehicle registration volume is not included.
*5) Locally-made vehicle wholesale volume of VAMA (Vietnam Automobile Manufacturers' Association) members.
*6) Total of locally-made vehicle wholesale volume and imported passenger vehicle retail volume.
*7) Wholesale volumes of SIAM (Society of Indian Automobile Manufacturers) members. Eicher's sales volume is the sales volume of Eicher brand vehicles of VE Commercial Vehicles, a joint venture
between Eicher Motors and Volvo Group since June 2009.
*8) Locally-made vehicle wholesale volume of PAMA (Pakistan Automotive Manufacturers Association) members.
(Unit: Vehicles)
Jan. Feb. Mar. Apr. May Jun. Jul. Aug. Sep. Oct. Nov. Dec. YTD Total
1 Toyota / Lexus 13,399 6,136 10,805 11,340 12,518 13,365 16,736 5,955 11,475 11,531 12,182 125,442
2 Nissan / Infiniti 5,921 2,265 4,153 4,174 4,063 5,001 5,186 2,089 3,670 3,255 3,801 43,578
3 Mitsubishi 4,279 2,178 3,567 3,285 3,071 3,829 4,388 2,044 3,202 3,083 2,437 35,363
4 Honda 2,671 1,231 1,996 1,923 2,024 2,177 2,428 1,588 1,922 1,917 2,174 22,051
5 Ford 2,464 1,230 1,845 1,208 1,951 2,262 2,932 1,158 1,598 2,450 1,961 21,059
6 Mercedes-Benz (LV) 1,918 1,079 1,696 1,779 1,639 1,774 1,745 1,452 1,891 1,799 1,855 18,627
7 Hyundai 1,522 816 840 1,475 1,512 1,619 1,520 1,150 1,389 1,226 1,110 14,179
8 BMW 2,156 838 1,386 1,388 1,401 1,379 1,720 810 1,140 929 881 14,028
9 Mazda 1,365 603 1,213 1,328 1,190 1,298 1,367 1,155 1,389 1,552 1,486 13,946
10 VW 942 602 1,080 1,185 1,163 1,472 1,017 957 1,485 1,347 847 12,097
11 Suzuki 551 369 612 562 578 766 600 469 550 589 523 6,169
12 Hino 433 367 498 393 516 532 541 451 569 448 418 5,166
13 Fuso 562 375 506 415 432 476 403 407 410 364 546 4,896
14 Volvo Cars 416 309 429 407 466 456 538 436 449 439 463 4,808
15 Audi 451 218 454 380 401 425 415 304 386 356 558 4,348
16 Subaru 597 184 425 417 389 414 452 329 337 417 352 4,313
Others 4,654 1,996 2,802 2,576 3,410 3,072 3,152 2,430 2,884 2,626 2,364 31,966
44,301 20,796 34,307 34,235 36,724 40,317 45,140 23,184 34,746 34,328 33,958 382,036
Passenger Car 160,289 160,718 171,489 135,433 148,577 160,232 137,873 153,758 154,882 159,036 156,445 1,698,732
Utility Vehicle 45,941 43,507 51,414 40,648 44,267 43,849 44,945 46,501 53,003 48,465 41,218 503,758
MPV 13,579 13,524 15,309 12,428 15,109 14,747 16,617 13,656 15,683 13,650 14,775 159,077
Subtotal 219,809 217,749 238,212 188,509 207,953 218,828 199,435 213,915 223,568 221,151 212,438 2,361,567
YOY % Change ▼9.3% ▼3.9% ▼7.3% ▼9.5% 3.2% 11.2% 7.1% 12.6% 3.5% ▼7.5% 5.4% ▼0.2%
LCV 34,218 31,610 40,666 32,986 30,414 32,705 29,966 31,518 37,105 34,099 31,538 366,825
MHCV 15,769 16,372 23,435 15,429 16,572 18,414 17,799 16,955 19,035 17,866 16,148 193,794
Subtotal 49,987 47,982 64,101 48,415 46,986 51,119 47,765 48,473 56,140 51,965 47,686 560,619
YOY % Change ▼20.9% ▼29.8% ▼24.5% ▼14.6% ▼15.3% ▼9.0% ▼13.6% ▼5.6% 8.6% ▼2.9% 9.0% ▼12.5%
269,796 265,731 302,313 236,924 254,939 269,947 247,200 262,388 279,708 273,116 260,124 2,922,186
YOY % Change ▼11.7% ▼9.9% ▼11.6% ▼10.6% ▼0.8% 6.7% 2.3% 8.7% 4.5% ▼6.7% 6.1% ▼2.8%
1 Suzuki / Maruti Suzuki 96,569 99,758 102,269 79,119 90,560 100,964 90,093 98,304 99,290 97,069 100,024 1,054,019
2 Tata 36,657 35,315 45,996 35,533 34,334 34,743 35,256 36,403 40,873 38,760 37,427 411,297
3 Mahindra 33,405 34,005 35,003 35,248 36,205 33,514 29,275 33,750 35,041 38,010 35,511 378,967
4 Hyundai 35,058 34,072 41,650 30,573 31,513 31,620 27,545 27,483 36,066 34,375 26,943 356,898
5 Toyota 15,714 14,543 18,426 11,040 13,362 16,316 15,643 16,758 15,015 13,242 15,263 165,322
6 Honda 10,910 10,100 8,206 7,562 11,831 12,010 11,921 11,215 12,552 12,556 12,175 121,038
7 Ashok Leyland 7,098 6,874 8,871 5,324 5,641 6,670 6,933 7,326 8,058 7,297 6,457 76,549
8 GM 6,706 6,799 6,356 4,833 6,053 7,258 7,592 6,801 6,786 6,723 5,661 71,568
9 Ford 5,557 5,607 6,601 3,210 4,865 5,165 4,720 4,232 4,270 4,103 4,007 52,337
10 Renault 5,183 2,006 7,082 5,301 5,019 4,362 2,901 3,999 4,145 4,106 2,041 46,145
11 VW 3,304 4,101 5,464 3,333 3,650 4,277 3,015 3,235 3,563 3,750 3,201 40,893
12 VECV (Eicher) 4,107 3,511 3,741 3,033 2,657 3,079 3,409 4,007 4,089 4,663 3,846 40,142
13 Nissan 2,322 2,531 3,839 3,049 3,064 3,474 2,955 2,571 2,781 2,494 2,233 31,313
14 Force 2,003 1,719 2,648 5,611 1,812 1,812 1,977 1,962 2,145 1,639 1,558 24,886
15 Škoda 1,412 1,315 1,481 1,014 1,046 1,122 1,124 1,336 1,646 1,313 1,172 13,981
16 Isuzu 1,385 1,302 1,503 828 800 801 718 1,121 989 1,356 760 11,563
17 Fiat 581 415 1,300 900 1,312 1,489 1,035 700 989 612 606 9,939
Others 1,825 1,758 1,877 1,413 1,215 1,271 1,088 1,185 1,410 1,048 1,239 15,329
269,796 265,731 302,313 236,924 254,939 269,947 247,200 262,388 279,708 273,116 260,124 2,922,186
ED�800 cc 3,783 4,030 3,503 4,042 3,813 4,167 2,292 3,435 3,534 3,531 3,226 39,356
800 cc�ED�1,300 cc 1,474 1,392 1,053 1,774 1,533 1,974 1,175 1,612 1,186 1,593 1,407 16,173
1,300 cc�ED�1,600 cc 6,698 5,816 5,767 5,021 5,211 4,172 2,444 5,508 6,444 6,108 5,710 58,899
Subtotal 11,955 11,238 10,323 10,837 10,557 10,313 5,911 10,555 11,164 11,232 10,343 114,428
YOY % Change 3.3% ▼0.9% ▼10.9% 4.4% ▼10.4% ▼10.9% ▼36.4% 10.0% 15.6% 29.3% 22.6% 0.5%
LCV 1,955 1,551 1,946 1,413 1,780 1,768 1,037 1,703 1,529 1,419 1,446 17,547
Truck 221 249 253 224 257 431 174 244 412 248 237 2,950
Bus 54 58 45 48 48 48 38 38 50 37 47 511
Subtotal 2,230 1,858 2,244 1,685 2,085 2,247 1,249 1,985 1,991 1,704 1,730 21,008
YOY % Change 53.7% 18.4% 11.5% ▼7.3% 21.8% ▼7.0% ▼14.0% 17.5% 14.2% 17.8% 27.1% 12.5%
14,185 13,096 12,567 12,522 12,642 12,560 7,160 12,540 13,155 12,936 12,073 135,436
YOY % Change 8.9% 1.4% ▼7.5% 2.6% ▼6.3% ▼10.2% ▼33.3% 11.2% 15.4% 27.6% 23.2% 2.2%
1 Suzuki 7,089 6,941 5,992 7,359 6,993 7,742 4,317 6,510 6,204 6,441 5,984 71,572
2 Toyota 3,992 3,505 4,051 2,854 2,917 1,499 1,106 4,065 4,691 4,425 4,499 37,604
3 Honda 2,600 2,232 1,971 1,950 2,260 2,672 1,505 1,634 1,748 1,735 1,266 21,573
4 Hino 126 143 158 144 130 140 110 110 151 133 150 1,495
5 Land Rover 85 50 55 62 70 112 41 50 150 50 50 775
6 Isuzu 48 48 103 63 116 140 14 36 35 42 35 680
7 Hyundai 178 63 149 24 49 28 5 12 11 8 5 532
8 UD Trucks 18 48 49 12 55 47 24 72 63 44 36 468
Others 49 66 39 54 52 180 38 51 102 58 48 737
14,185 13,096 12,567 12,522 12,642 12,560 7,160 12,540 13,155 12,936 12,073 135,436
Bran
d
Passenger
Vehicle
Total
Pak
istan
(*
8)
Ty
pe
Passenger
Vehicle
Commercial
Vehicle
Bran
d
Total
Total
In
dia (*
7,*
9)
Total
Ty
pe
Taiw
an
(co
nt.)
Commercial
Vehicle
Total
Bran
d
Country/ Type/ Brand