odvice: an ontology-driven visual analytic tool for
TRANSCRIPT
ODVICE: An Ontology-Driven Visual Analytic Tool forInteractive Cohort Extraction
Mohamed [email protected]
IBM T. J. Watson Research CenterYorktown Heights, NY, USA
Zijun [email protected]
IBM T. J. Watson Research CenterYorktown Heights, NY, USA
Prithwish [email protected] T. J. Watson Research Center
Yorktown Heights, NY, USA
James [email protected]
IBM T. J. Watson Research CenterYorktown Heights, NY, USA
Daby [email protected]
IBM T. J. Watson Research CenterYorktown Heights, NY, USA
ABSTRACTIncreased availability of electronic health records (EHR) has enabledresearchers to study various medical questions. Cohort selection forthe hypothesis under investigation is one of the main considerationfor EHR analysis. For uncommon diseases, cohorts extracted fromEHRs contain very limited number of records – hampering therobustness of any analysis. Data augmentation methods have beensuccessfully applied in other domains to address this issue mainlyusing simulated records. In this paper, we present ODVICE, a dataaugmentation framework that leverages the medical concept ontologyto systematically augment records using a novel ontologically guidedMonte-Carlo graph spanning algorithm. The tool allows end users tospecify a small set of interactive controls to control the augmentationprocess. We analyze the importance of ODVICE by conducting studieson MIMIC-III dataset for two learning tasks. Our results demonstratethe predictive performance of ODVICE augmented cohorts, showing⇠ 30% improvement in area under the curve (AUC) over the non-augmented dataset and other data augmentation strategies.
INTRODUCTIONIncreasing adoption of electronic data collection systems forhealthcare is leading to an ever-growing availability of rich,longitudinal records spanning millions of patients and capturingsigni�cant portion of their medical histories. While these data setstypically contain large number of patients, constructing cohorts forpatients with speci�c conditions brings this number down radically,often to numbers that are too small for the application of moderntechniques.
Data augmentation has been used to tackle data scarcityproblems in various tasks such as Natural Language Processing[10] and image classi�cation [9, 12, 14]. However, many of thesemethods revolve around the notion of being able to syntheticallygenerate data by applying various forms of noise or perturbationson the small amount of existing data. Analytical models [8], clinicalwork�ows [15], and deep learning approaches, such as GenerativeAdversarial Networks (GANs) have shown some promise ingenerating synthetic EHR data[1, 2] and medical images [5, 13].These methods require external validation, have a limited ability to
, ,.
model rare events, and may be a source of additional bias. Hence,it is desirable to use real data for augmentation when possible.
There have been a few notable approaches where real datahave been used to augment data. For example, images from anexternal medical data set were used for augmentation by computinga similarity metric between the images and then selecting thetop k most similar images for each image class for inclusion [16].The utility of a public data set designed for generalized skinsegmentation was demonstrated to augment the clinical datafor segmenting healthy and diseased skin and achieve improvedaccuracy[3]. Patient similarity[11, 17] metrics can also be used tosearch for patients similar to the original cohort based on patients’attributes. These methods often lack to take into account thesemantic relationship between diseases the patients have.
In this paper, we expand on the idea of using real data byaugmenting data from patient records that may not belong in theoriginal cohort obtained from a given user query. Beyond the use ofa notion of similarity applied for data augmentation, we propose touse existing medical ontologies to guide the selection of these realdata points outside of the original queried corpus that we believeto be not only close to this original corpus but also semanticallyrelated.
The contribution of our work is fourfold. First, we develop novelalgorithms for �ltering, sampling, and augmenting a subset of EHRdata for a particular cohort using data from real patients foundelsewhere in the EHR. Second, we leverage the graph-structure ofthe given medical ontology to identify data from patients that aresemantically similar. Third, we implement a web-based interface toempower data scientists to quickly and easily navigate the graphicalrelationship of the data, obtain insights related to data quantity anddiversity, and extract a subgraph and its associated data for use inthe augmentation. Fourth, we demonstrate the utility of the realaugmented data to boost the performance of analytic models usinglogistic regression and random forest as show cases for predicting in-hospital mortalities and acute myocardial infarction for rheumaticdisease of heart valve or mitral valve stenosis patients.
METHODSWepresent the proposedODVICE framework for data augmentation.ODVICE uses a medical concept ontology to guide the cohortaugmentation process. The framework is agnostic to the ontologybeing used; however, in the following we use SNOMED CT
, , Mohamed Ghalwash, Zijun Yao, Prithwish Chakrabotry, James Codella, and Daby Sow
ontologywhich is recognized as the recommended clinical referenceterminology for use in clinical information systems [4]. SNOMEDCT can be depicted as a graph of codes representing clinicalterminology used in electronic health records. In a nutshell,ODVICE leverages SNOMED CT for data augmentation bydiscovering medical concepts that are semantically related to theAI task in-hand, and using cohorts of those relevant concepts toexpand any initially pre-selected patient cohort. For example, givena task of detecting the myocardial infraction phenotype for patientsthat have one of the following disorders: mitral valve stenosis(SNOMED CT code 79619009) or rheumatic disease of the heartvalve (SNOMED CT code 16063004), ODVICE allows the user toexpand its data set with patients with conditions that are related toheart diseases by leveraging the graph structure of the SNOMEDCT ontology.
E�ectively, we represent the knowledge graph of SNOMED CTwith a directed acyclic graph with nodes corresponding to medicalconcepts and edges corresponding to ontology relationships. Let Sdenote this graph and let D denote the EHR data set that we haveaccess to for AI modeling purposes. Using S and D, we constructG as a subgraph of S with nodes corresponding to SNOMED CTcodes that are present in D. At each node = 2 G, ODVICE tracksthe following information:
• 2= , the SNOMED code for the node = given obtained from S.• += , the set of all visits E 2 D corresponding to 2= .• ?= , empirical distribution of phenotype occurrences basedon all E 2 += , according to a pre-de�ned set of phenotypes % .
ODVICE takes user inputs to perform the following twooperations:
(1) Data Filtering: ODVICE generates an initial �ltered graphG� based on user inputs consisting of SNOMED CT codesand phenotypes of interest. This step constrains the dataaugmentation search space based on user speci�ed interests.
(2) Data Augmentation: ODVICE generates an augmentedgraph G� within G� according to a sampling procedure thatbene�ts from the underlying graph structure of G� inheritedfrom the original SNOMED CT graph S.
Data FilteringODVICE captures the intent of the end user to �lter out nodes fromG that are deemed not relevant for the analysis. This step constrainsthe analysis to nodes from G that explicitly contain patient visitswith one of the user requested SNOMED CT codes and phenotypes.
Besides G, the user speci�ed disjunctive1 list of SNOMED CTcodes (D and the user speci�ed disjunctive list of phenotypes %D , the�ltering operation also takes two thresholds [D and W?D controllingrespectively the minimal amount of visits by nodes and by speci�cphenotypes that each node of the �ltered graph is required to have.ODVICE iteratively considers every node = 2 G if it has enoughvisits for analysis (i.e with the size of += greater than [D ) and ifat least one of the phenotypes of interest is well represented (i.e.with an occurrence greater than W?D ). Based on these two conditions,nodes and their descendants are selected. We include descendants1While the method described in this paper assumes that end user is specifyingdisjunctions (OR) on SNOMED CT codes and phenotypes, it can be extended toconjunctions and more complex queries.
in the �ltered graph since SNOMED CT guarantees that these nodescontain the medical concepts that specialize the medical conceptsof their parents. With these steps, we are constraining our analysisto weakly connected components of G containing (D and satisfyingall user speci�ed visit & phenotype criteria. The output of this stepis a �ltered graph denoted G� .
Data AugmentationThis method takes as inputs the �ltered graph G� together withuser selected nodes (D . It applies Algorithm 1 to grow (D withinG� by �rst creating the sub-graph from (D within G� that wedenote G(D� , and then collects nodes in G� that have proximityand are similar to the nodes of G(D� . The proximity among nodesis determined by the graph structure of G� . Similarity amongnodes is determine by computing the KL divergence between theempirical distribution of phenotypes of candidate nodes in G(D� andnodes in (D . More speci�cally, ODVICE discovers a candidate node@ 2 G(D� to augment (D if 8= 2 G(D� ,⇡ ! (?= | |?@) < W ! , whereW ! is a similarity threshold set by the user on the ODVICE webinterface and ⇡ ! (·| |·) the KL divergence between distributionsde�ned in the same probability space. A Monte Carlo samplingstep (MCSample(·, ·)) is then applied with sampling rate _ ! todecide how to sample nodes from the candidates discovered by thisaugmentation step. This entire procedure is applied recursively X�times to grow the graph nodes that are in direct proximity to (D bysimply replacing (D with the expanded set of nodes produced bythe previous iteration.
ODVICE INTERFACE
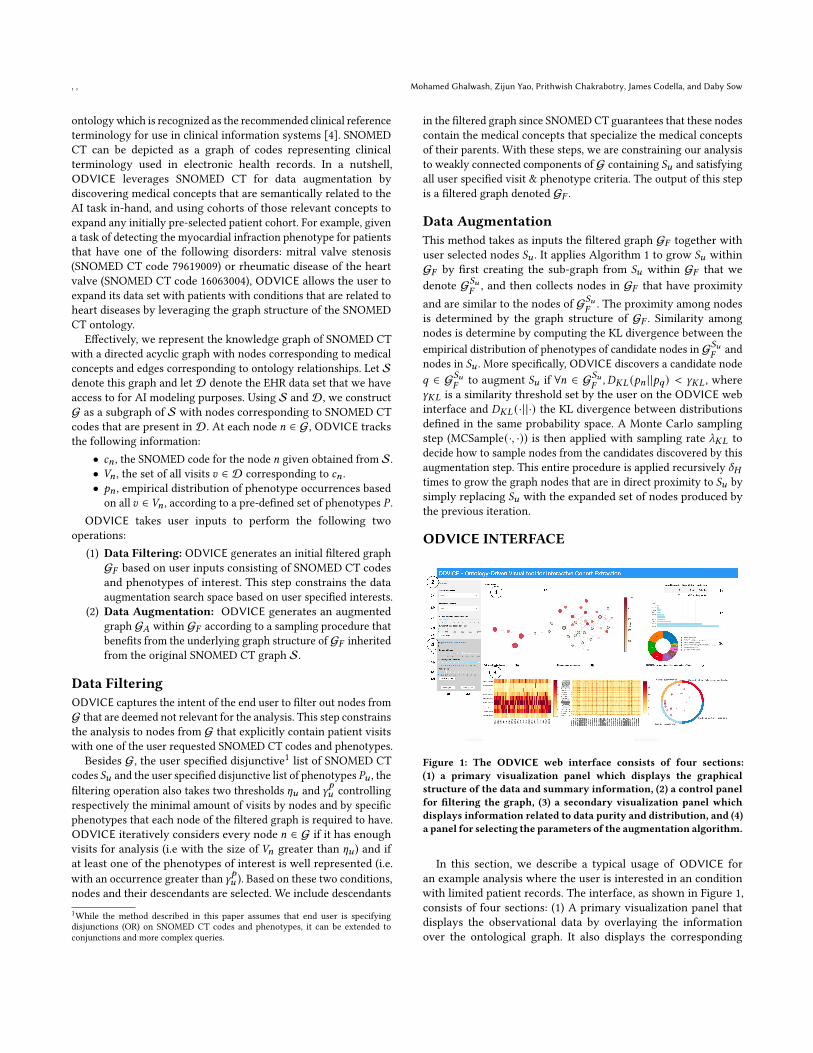
Figure 1: The ODVICE web interface consists of four sections:(1) a primary visualization panel which displays the graphicalstructure of the data and summary information, (2) a control panelfor �ltering the graph, (3) a secondary visualization panel whichdisplays information related to data purity and distribution, and (4)a panel for selecting the parameters of the augmentation algorithm.
In this section, we describe a typical usage of ODVICE foran example analysis where the user is interested in an conditionwith limited patient records. The interface, as shown in Figure 1,consists of four sections: (1) A primary visualization panel thatdisplays the observational data by overlaying the informationover the ontological graph. It also displays the corresponding
ODVICE: An Ontology-Driven Visual Analytic Tool for Interactive Cohort Extraction , ,
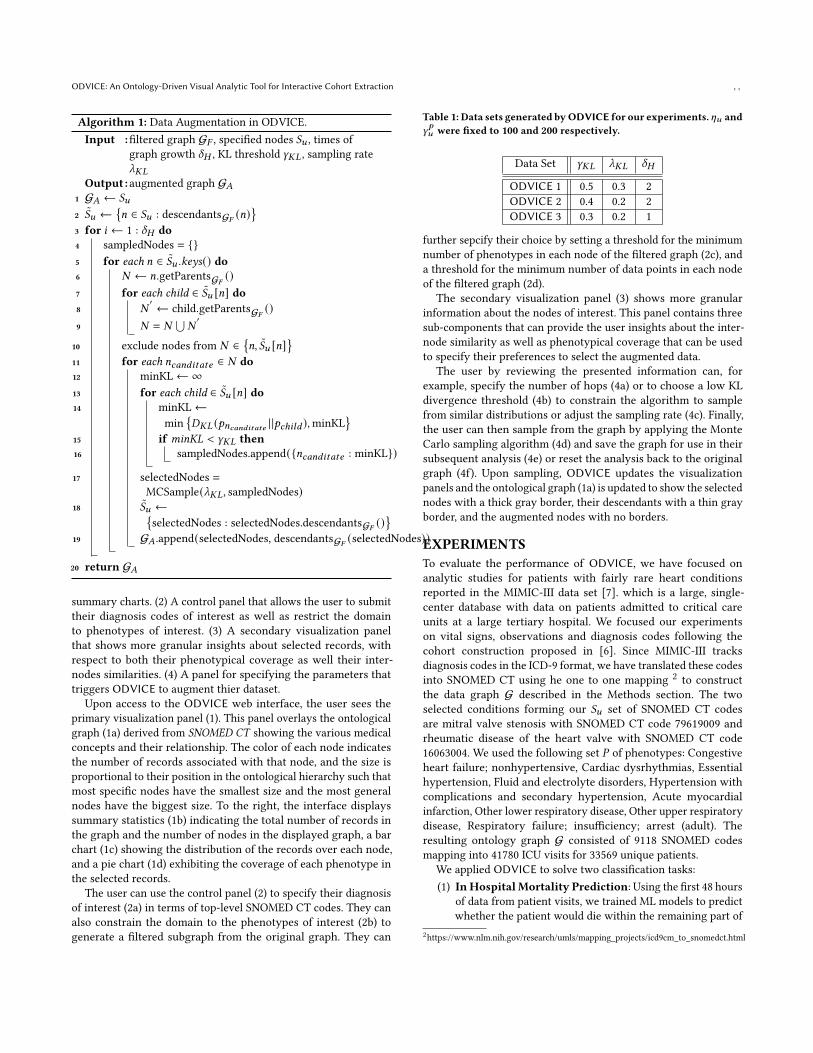
Algorithm 1: Data Augmentation in ODVICE.Input :�ltered graph G� , speci�ed nodes (D , times of
graph growth X� , KL threshold W ! , sampling rate_ !
Output :augmented graph G�1 G� (D2 (̃D
�= 2 (D : descendantsG� (=)
3 for 8 1 : X� do4 sampledNodes = {}5 for each = 2 (̃D .keys() do6 # =.getParentsG�
()7 for each child 2 (̃D [=] do8 #
0 child.getParentsG�()
9 # = #–
#0
10 exclude nodes from # 2�=, (̃D [=]
11 for each =20=38C0C4 2 # do12 minKL 113 for each child 2 (̃D [=] do14 minKL
min�⇡ ! (?=20=38C0C4 | |?2⌘8;3 ),minKL
15 if minKL < W ! then16 sampledNodes.append({=20=38C0C4 : minKL})
17 selectedNodes =MCSample(_ !, sampledNodes)
18 (̃D �selectedNodes : selectedNodes.descendantsG� ()
19 G� .append(selectedNodes, descendantsG� (selectedNodes))
20 return G�
summary charts. (2) A control panel that allows the user to submittheir diagnosis codes of interest as well as restrict the domainto phenotypes of interest. (3) A secondary visualization panelthat shows more granular insights about selected records, withrespect to both their phenotypical coverage as well their inter-nodes similarities. (4) A panel for specifying the parameters thattriggers ODVICE to augment thier dataset.
Upon access to the ODVICE web interface, the user sees theprimary visualization panel (1). This panel overlays the ontologicalgraph (1a) derived from SNOMED CT showing the various medicalconcepts and their relationship. The color of each node indicatesthe number of records associated with that node, and the size isproportional to their position in the ontological hierarchy such thatmost speci�c nodes have the smallest size and the most generalnodes have the biggest size. To the right, the interface displayssummary statistics (1b) indicating the total number of records inthe graph and the number of nodes in the displayed graph, a barchart (1c) showing the distribution of the records over each node,and a pie chart (1d) exhibiting the coverage of each phenotype inthe selected records.
The user can use the control panel (2) to specify their diagnosisof interest (2a) in terms of top-level SNOMED CT codes. They canalso constrain the domain to the phenotypes of interest (2b) togenerate a �ltered subgraph from the original graph. They can
Table 1: Data sets generated byODVICE for our experiments.[D andW?D were �xed to 100 and 200 respectively.
Data Set W ! _ ! X�
ODVICE 1 0.5 0.3 2ODVICE 2 0.4 0.2 2ODVICE 3 0.3 0.2 1
further sepcify their choice by setting a threshold for the minimumnumber of phenotypes in each node of the �ltered graph (2c), anda threshold for the minimum number of data points in each nodeof the �ltered graph (2d).
The secondary visualization panel (3) shows more granularinformation about the nodes of interest. This panel contains threesub-components that can provide the user insights about the inter-node similarity as well as phenotypical coverage that can be usedto specify their preferences to select the augmented data.
The user by reviewing the presented information can, forexample, specify the number of hops (4a) or to choose a low KLdivergence threshold (4b) to constrain the algorithm to samplefrom similar distributions or adjust the sampling rate (4c). Finally,the user can then sample from the graph by applying the MonteCarlo sampling algorithm (4d) and save the graph for use in theirsubsequent analysis (4e) or reset the analysis back to the originalgraph (4f). Upon sampling, ODVICE updates the visualizationpanels and the ontological graph (1a) is updated to show the selectednodes with a thick gray border, their descendants with a thin grayborder, and the augmented nodes with no borders.
EXPERIMENTSTo evaluate the performance of ODVICE, we have focused onanalytic studies for patients with fairly rare heart conditionsreported in the MIMIC-III data set [7]. which is a large, single-center database with data on patients admitted to critical careunits at a large tertiary hospital. We focused our experimentson vital signs, observations and diagnosis codes following thecohort construction proposed in [6]. Since MIMIC-III tracksdiagnosis codes in the ICD-9 format, we have translated these codesinto SNOMED CT using he one to one mapping 2 to constructthe data graph G described in the Methods section. The twoselected conditions forming our (D set of SNOMED CT codesare mitral valve stenosis with SNOMED CT code 79619009 andrheumatic disease of the heart valve with SNOMED CT code16063004. We used the following set % of phenotypes: Congestiveheart failure; nonhypertensive, Cardiac dysrhythmias, Essentialhypertension, Fluid and electrolyte disorders, Hypertension withcomplications and secondary hypertension, Acute myocardialinfarction, Other lower respiratory disease, Other upper respiratorydisease, Respiratory failure; insu�ciency; arrest (adult). Theresulting ontology graph G consisted of 9118 SNOMED codesmapping into 41780 ICU visits for 33569 unique patients.
We applied ODVICE to solve two classi�cation tasks:(1) InHospital Mortality Prediction: Using the �rst 48 hours
of data from patient visits, we trained ML models to predictwhether the patient would die within the remaining part of
2https://www.nlm.nih.gov/research/umls/mapping_projects/icd9cm_to_snomedct.html
, , Mohamed Ghalwash, Zijun Yao, Prithwish Chakrabotry, James Codella, and Daby Sow
her hospital stay. We excluded all visits with less than 48hours of data from this analysis.
(2) Myocardial Infarction Phenotyping: Using all the datafor each patient visits, we developed ML models attemptingto correctly guess the myocardial infarction phenotype.
We compared ODVICE against 4 baseline strategies for datacollection and augmentation:
• Target: Using only the visits from the nodes in (D with oneof the target phenotypes mentioned before.
• Random 1: Augmenting Target with data randomlyselected from G� to produce a data set with 3000 visits.
• Random 2: Augmenting Target with data randomlyselected from G� to produce a data set with 6000 visits.
• Random 3: Augmenting Target with data randomlyselected from G� to produce a data set with 8000 visits.
We also tried various con�guration of ODVICE in our experiments.Table 1 shows the set of parameters used to evaluate ODVICE.We tried 3 di�erent ODVICE augmentation strategies. ODVICE1 produced the largest amount of augmented data as it used thehighest values for W !, _ ! and X� . ODVICE 2 was less aggressive.ODVICE 3 produced the least amounts augmented of data andwas hence more constrained to the phenotypes and SNOMED CTcode used. For each of these tasks, we tried two common machinelearning algorithms: Logistic Regression (LR) and Random Forest(RF). Each learning algorithm was applied using a 3 fold crossvalidation approach. The performance was measured using theArea Under the ROC curve (AUC).
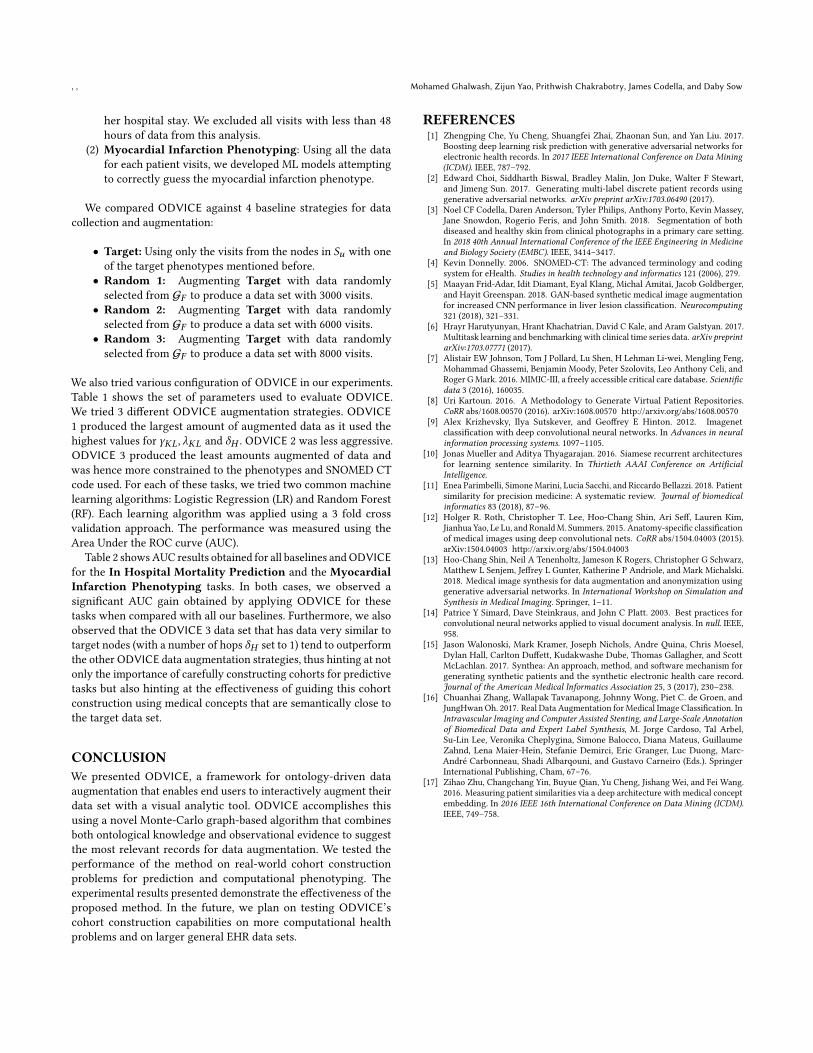
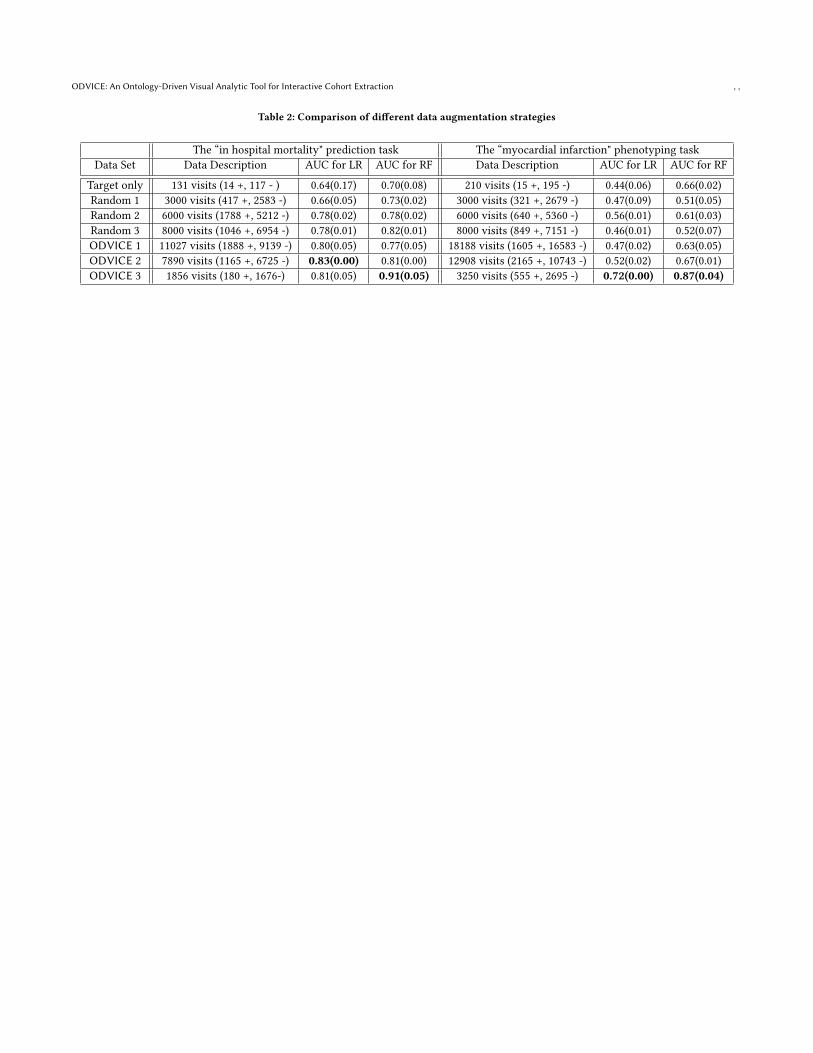
Table 2 showsAUC results obtained for all baselines andODVICEfor the In Hospital Mortality Prediction and the MyocardialInfarction Phenotyping tasks. In both cases, we observed asigni�cant AUC gain obtained by applying ODVICE for thesetasks when compared with all our baselines. Furthermore, we alsoobserved that the ODVICE 3 data set that has data very similar totarget nodes (with a number of hops X� set to 1) tend to outperformthe otherODVICE data augmentation strategies, thus hinting at notonly the importance of carefully constructing cohorts for predictivetasks but also hinting at the e�ectiveness of guiding this cohortconstruction using medical concepts that are semantically close tothe target data set.
CONCLUSIONWe presented ODVICE, a framework for ontology-driven dataaugmentation that enables end users to interactively augment theirdata set with a visual analytic tool. ODVICE accomplishes thisusing a novel Monte-Carlo graph-based algorithm that combinesboth ontological knowledge and observational evidence to suggestthe most relevant records for data augmentation. We tested theperformance of the method on real-world cohort constructionproblems for prediction and computational phenotyping. Theexperimental results presented demonstrate the e�ectiveness of theproposed method. In the future, we plan on testing ODVICE’scohort construction capabilities on more computational healthproblems and on larger general EHR data sets.
REFERENCES[1] Zhengping Che, Yu Cheng, Shuangfei Zhai, Zhaonan Sun, and Yan Liu. 2017.
Boosting deep learning risk prediction with generative adversarial networks forelectronic health records. In 2017 IEEE International Conference on Data Mining(ICDM). IEEE, 787–792.
[2] Edward Choi, Siddharth Biswal, Bradley Malin, Jon Duke, Walter F Stewart,and Jimeng Sun. 2017. Generating multi-label discrete patient records usinggenerative adversarial networks. arXiv preprint arXiv:1703.06490 (2017).
[3] Noel CF Codella, Daren Anderson, Tyler Philips, Anthony Porto, Kevin Massey,Jane Snowdon, Rogerio Feris, and John Smith. 2018. Segmentation of bothdiseased and healthy skin from clinical photographs in a primary care setting.In 2018 40th Annual International Conference of the IEEE Engineering in Medicineand Biology Society (EMBC). IEEE, 3414–3417.
[4] Kevin Donnelly. 2006. SNOMED-CT: The advanced terminology and codingsystem for eHealth. Studies in health technology and informatics 121 (2006), 279.
[5] Maayan Frid-Adar, Idit Diamant, Eyal Klang, Michal Amitai, Jacob Goldberger,and Hayit Greenspan. 2018. GAN-based synthetic medical image augmentationfor increased CNN performance in liver lesion classi�cation. Neurocomputing321 (2018), 321–331.
[6] Hrayr Harutyunyan, Hrant Khachatrian, David C Kale, and Aram Galstyan. 2017.Multitask learning and benchmarkingwith clinical time series data. arXiv preprintarXiv:1703.07771 (2017).
[7] Alistair EW Johnson, Tom J Pollard, Lu Shen, H Lehman Li-wei, Mengling Feng,Mohammad Ghassemi, Benjamin Moody, Peter Szolovits, Leo Anthony Celi, andRoger GMark. 2016. MIMIC-III, a freely accessible critical care database. Scienti�cdata 3 (2016), 160035.
[8] Uri Kartoun. 2016. A Methodology to Generate Virtual Patient Repositories.CoRR abs/1608.00570 (2016). arXiv:1608.00570 http://arxiv.org/abs/1608.00570
[9] Alex Krizhevsky, Ilya Sutskever, and Geo�rey E Hinton. 2012. Imagenetclassi�cation with deep convolutional neural networks. In Advances in neuralinformation processing systems. 1097–1105.
[10] Jonas Mueller and Aditya Thyagarajan. 2016. Siamese recurrent architecturesfor learning sentence similarity. In Thirtieth AAAI Conference on Arti�cialIntelligence.
[11] Enea Parimbelli, SimoneMarini, Lucia Sacchi, and Riccardo Bellazzi. 2018. Patientsimilarity for precision medicine: A systematic review. Journal of biomedicalinformatics 83 (2018), 87–96.
[12] Holger R. Roth, Christopher T. Lee, Hoo-Chang Shin, Ari Se�, Lauren Kim,Jianhua Yao, Le Lu, and RonaldM. Summers. 2015. Anatomy-speci�c classi�cationof medical images using deep convolutional nets. CoRR abs/1504.04003 (2015).arXiv:1504.04003 http://arxiv.org/abs/1504.04003
[13] Hoo-Chang Shin, Neil A Tenenholtz, Jameson K Rogers, Christopher G Schwarz,Matthew L Senjem, Je�rey L Gunter, Katherine P Andriole, and Mark Michalski.2018. Medical image synthesis for data augmentation and anonymization usinggenerative adversarial networks. In International Workshop on Simulation andSynthesis in Medical Imaging. Springer, 1–11.
[14] Patrice Y Simard, Dave Steinkraus, and John C Platt. 2003. Best practices forconvolutional neural networks applied to visual document analysis. In null. IEEE,958.
[15] Jason Walonoski, Mark Kramer, Joseph Nichols, Andre Quina, Chris Moesel,Dylan Hall, Carlton Du�ett, Kudakwashe Dube, Thomas Gallagher, and ScottMcLachlan. 2017. Synthea: An approach, method, and software mechanism forgenerating synthetic patients and the synthetic electronic health care record.Journal of the American Medical Informatics Association 25, 3 (2017), 230–238.
[16] Chuanhai Zhang, Wallapak Tavanapong, Johnny Wong, Piet C. de Groen, andJungHwan Oh. 2017. Real Data Augmentation for Medical Image Classi�cation. InIntravascular Imaging and Computer Assisted Stenting, and Large-Scale Annotationof Biomedical Data and Expert Label Synthesis, M. Jorge Cardoso, Tal Arbel,Su-Lin Lee, Veronika Cheplygina, Simone Balocco, Diana Mateus, GuillaumeZahnd, Lena Maier-Hein, Stefanie Demirci, Eric Granger, Luc Duong, Marc-André Carbonneau, Shadi Albarqouni, and Gustavo Carneiro (Eds.). SpringerInternational Publishing, Cham, 67–76.
[17] Zihao Zhu, Changchang Yin, Buyue Qian, Yu Cheng, Jishang Wei, and Fei Wang.2016. Measuring patient similarities via a deep architecture with medical conceptembedding. In 2016 IEEE 16th International Conference on Data Mining (ICDM).IEEE, 749–758.
ODVICE: An Ontology-Driven Visual Analytic Tool for Interactive Cohort Extraction , ,
Table 2: Comparison of di�erent data augmentation strategies
The “in hospital mortality" prediction task The “myocardial infarction" phenotyping taskData Set Data Description AUC for LR AUC for RF Data Description AUC for LR AUC for RF
Target only 131 visits (14 +, 117 - ) 0.64(0.17) 0.70(0.08) 210 visits (15 +, 195 -) 0.44(0.06) 0.66(0.02)Random 1 3000 visits (417 +, 2583 -) 0.66(0.05) 0.73(0.02) 3000 visits (321 +, 2679 -) 0.47(0.09) 0.51(0.05)Random 2 6000 visits (1788 +, 5212 -) 0.78(0.02) 0.78(0.02) 6000 visits (640 +, 5360 -) 0.56(0.01) 0.61(0.03)Random 3 8000 visits (1046 +, 6954 -) 0.78(0.01) 0.82(0.01) 8000 visits (849 +, 7151 -) 0.46(0.01) 0.52(0.07)ODVICE 1 11027 visits (1888 +, 9139 -) 0.80(0.05) 0.77(0.05) 18188 visits (1605 +, 16583 -) 0.47(0.02) 0.63(0.05)ODVICE 2 7890 visits (1165 +, 6725 -) 0.83(0.00) 0.81(0.00) 12908 visits (2165 +, 10743 -) 0.52(0.02) 0.67(0.01)ODVICE 3 1856 visits (180 +, 1676-) 0.81(0.05) 0.91(0.05) 3250 visits (555 +, 2695 -) 0.72(0.00) 0.87(0.04)