odi - show me the money- opening up big data in finance
DESCRIPTION
Comprehensive Report on the recent performance of three of the largest peers to peers lending platform in the UKTRANSCRIPT
July 2013
1
Show me the Money: Opening up Big Data in Finance
Executive Summary
This report provides the most comprehensive snapshot to date of the £378 million UK peer-to-peer (P2P) lending market from October 2010 to May 2013. Using open data from the three biggest P2P businesses in the UK (Zopa, RateSetter and Funding Circle) the report focuses on the regional geography of lending in the UK and is able to provide a fascinating insight into which regions are net lenders and recipients. It is the first time financial data has been published with an open data certificate.
Key differences in UK regional activity from the report include:
• Scotland, the North East and the North West have similar statistics for £ received per person as the South of the UK. There is substantially more lending in London and the South of the UK, but recipients are evenly distributed across the country.
• Four regions invest more than they receive. All four regions, London, South East, South West and the East of England, lie in the South of the UK.
• The range of lending per person ranges from £1.4 to £11.8 for UK regions, whereas the range for recipients only goes from £3.9 to £7.3 per person.
A broader message of this project is that this sort of granular financial data is collectable in the age of terabyte warehouses, and analytically tractable with visualisation tools we demonstrate here. In sum this project is a step toward a more publicly transparent and comprehensive mapping of the financial system. Eventually we hope this map will become updated in real-time with data feeds directly sourced from P2P platforms.
July 2013
2
Background: Visualising peer-to-peer (P2P) lending after the crisis
The City does not have the strongest record when it comes to transparency. Until 1969 banks were exempt from publicly revealing their true profits, a requirement imposed on other kinds of companies long before then.1 Although more recently the ‘third pillar’ of the Bank for International Settlements (BIS) global standards of best bank practice encouraged financial firms to make more data open, the sector as a whole remains opaque. This situation may have both caused and prolonged the recent financial crisis. Firstly, imperfect and asymmetric information in markets resulted in the mispricing of financial instruments. Once the crisis struck, an orderly re-pricing of these instruments could not occur because investors were uncertain about all the terms and conditions embedded within them.2 According to Donald Kohn, member of the Bank of England’s Financial Policy Committee (FPC), “Complex and poorly understood instruments were at the heart of the crisis. Transparency about these structures—full information about them readily available to all market participants—is required to protect financial stability.”3
Regulatory lessons like this are often learned following financial crises. Following the failure of the City of Glasgow Bank in the nineteenth century, for example, Parliament passed the 1879 Companies Act mandating for the first time that banks publish their balance sheets.4 Once again open data is an important component of post-crisis regulatory reforms. Thus the very first policy recommendation of the FPC in June 2011 advised micro-prudential regulators to make public disclosure of sovereign and banking sector exposures by major UK banks a permanent part of their reporting framework.5
Regulation of the conventional financial sector is following where innovative firms in the private sector are leading. Take ‘peer-to-peer’ (P2P) platforms that have grown rapidly following the financial crisis. In brief P2P platforms are online sites that channel funds from investors to borrowers. At this basic level they are much like banks. However, unlike banks, P2P platforms usually do not invest these funds solely at their own discretion.6 Instead some enable investors to directly make investment decisions by choosing the borrowers they fund or allowing investors to define the general social or financial features of the projects in which they want to invest. As a rule of thumb, the specific relationships made between investors and borrowers on P2P platforms are more transparent then when those relationships are indirectly constituted through banks. 1 FORREST CAPIE and MARK BILLINGS (2004). Evidence on competition in English commercial banking, 1920–1970. Financial History Review, 11, pp 69-103. 2 BANK OF ENGLAND (2011). Instruments of macroprudential policy, December, p. 28 3 DONALD KOHN (2011). Enhancing financial stability: the role of transparency. Speech at the London School of Economics, 6 September. 4 BENEDIKT KOEHLER (2006). History of Financial Disasters, 1763-1995 Volume 2, p. 148. 5 BANK OF ENGLAND (2011). Record of the interim Financial Policy Committee meeting, June. 6 For an understanding of the differences between banking and P2P from a macroprudential point of view see IZABELLA KAMINSKA (2013). P2P as full-reserve banking. Financial Times, 14 May.
July 2013
3
Transparency also characterises the approach many P2P platforms take to publicly disclosing data about their business.7 For example, Funding Circle makes its loan-by-loan data publicly available through its website. The data is downloadable in an Excel file and contains every loan Funding Circle has intermediated, whether outstanding or already paid off, since it started trading in 2010. The dataset includes a wide range of information on these loans, including the original credit band of the borrower, purpose of the loan, the loan term and loan amount, the interest rate, and the next repayment date of the loan, among other characteristics. The data are regularly updated, generally by the close of business each day.
This project expands Funding Circle’s open data set with additions from RateSetter and Zopa. Together these platforms comprise over 92 percent of the UK crowd-funding market.8 As far as we are aware, this project is therefore the most comprehensive snapshot of the UK P2P market published to date. This is a tangible benefit for the participating firms in this study because it sheds light on the wider P2P market in which they compete. It may also benefit the wider public by providing a more comprehensive picture of market prices. This information can lead consumers to make better decisions and the P2P market overall to become more efficient.
The P2P market is increasingly important, growing from practically nil before the financial crisis to a cumulative size of an estimated £558 million in the UK at present.9 Two factors account for its rapid growth. First, investors have been attracted by the relatively high rate of returns available by lending in this market, given the current low yield in bank and other conventional debt instruments. There is also evidence that the P2P market is outperforming equities. For example, according to West One Loans, direct lending to small growth companies via P2P sites has delivered higher returns than investing in smaller companies’ shares in the year to 31 March 2013.10
At the same time, growth of the P2P market has been underpinned by increasing demand from borrowers as liquidity from conventional sources has dried up. Last year the Breedon Review estimated demand for new funding by all businesses exceeded supply between £84 billion and £191 billion,11 with small and medium enterprises
7 See, for instance, the highly granular data available for download from US P2P platform Lending Club: www.lendingclub.com/info/download-data.action 8 Comparison of the three platforms combined loans to date against the whole of the UK P2P market (as at 19/06/2013). See www.p2pmoney.co.uk/companies.htm for details. The total amount in the sample, £378 million, covers a shorter period from October 2010 to May 2013 and excludes areas like the Isle of Man. 9 Ibid 10 JONATHAN MOULES (2013). Peer lending beats equity returns. Financial Times. It is also difficult for many ordinary individuals to have the opportunity to directly invest in small, early-stage enterprises via the equity market. This is because investment banks often distribute shares in newly listed companies to their existing network of high net worth individuals or fund manager clients. 11 DEPARTMENT FOR BUSINESS, INNOVATION AND SKILLS (2012). Boosting Finance Options for Business, March.
July 2013
4
(SMEs) facing particular difficulties obtaining funds.12 This is a result of banks becoming more risk adverse because of their own and regulators’ concerns regarding the adequacy of their capital to absorb potential losses. That being so, new flows of lending to SMEs have contracted, with a 271 percent increase in the number of unsuccessful SME bank loan applications between 2007 and 2010.13 A number of experimental financing initiatives have developed to fill the funding gap, with P2P platforms at the fore.14
While a number of commentators have highlighted the important role P2P platforms are now playing in funding SME and consumer loans in the UK, the focus of this project is sharper. Specifically we focus on visualising the regional geography of lending in the UK P2P marketing. In so doing, we show which regions are net investors and recipients, and analyse lending in terms of volume and price.
There are two key reasons for the geographic focus of this project. First, there are longstanding concerns in the UK about a perceived ‘North-South’ divide when it comes to obtaining investment, with the North perceived to be at a disadvantage when compared to regions in the South, particularly London.15 We were therefore interested to understand to what extent, if any, P2P platforms are bridging this regional funding gap. The second reason for focusing on the geography of the market is more pragmatic. Although each P2P platform records a number of characteristics related to the loans they intermediate, they are not recorded in a standard way. For example, while all three P2P platforms document the purpose of the loan, these descriptions vary across platforms and so are not easily comparable.16 Our focus on geography therefore had the advantage that the data was already standardised in terms of postcode.17
As such this project has wider public purchase. In particular the Government has recently expressed a desire for financial firms to disclose postcode-level lending data to assess if there are geographical imbalances as to which regions receive funding and on what terms from banks.18 We hope this project hastens the opening of such data.
12 ANDY COSH, ALAN HUGHES, ANNA BULLOCK, and ISOBEL MILNER (2009). SME finance and innovation in the current economic crisis. Centre for Business Research, University of Cambridge; NEIL LEE, HIBA SAMEEN and LLOYD MARTIN (2013). Credit and the crisis: Access to finance for innovative small firms since the recession. Big Innovation Centre, June. 13 YANNIS PIERRAKIS and LIAM COLLINS (2013). Banking on Each Other- Peer-to-Peer Lending to Business: Evidence from Funding Circle, p. 8. 14 ANDY DAVIS (2012). Seeds of Change: Emerging Sources of non-bank funding for Britain’s SMEs. Centre for the Study of Financial Innovation. 15 A good primer is DAVID SMITH (1989) North and South: Britain’s Economic, Social and Political Divide. Penguin. 16 This points to the need for the financial industry to develop a common data classification system. DAVID BHOLAT (2013) The future of central bank data. Journal of Banking Regulation 17 We did not focus on defaults and rates of recoveries because the industry is still in its infancy. Losses may still materialise and so no reliable inferences about the riskiness of the industry can be made at this point in time. 18 Community Development Finance Association (2012) Government commits to disclosure of ‘postcode level’ lending data, November 15.

July 2013
5
After all, if P2P platforms can make this data publically available, why not better financially resourced banks?
More generally, this project is a contribution to a growing economic literature which exploits micro-level datasets.19 P2P platforms are particularly rich sites for conducting this kind of research because they are syndicated loan markets in extremis; that is, each loan is funded by multiple (often hundreds) of lenders.20 So although our data set includes ‘only’ a total of 59,851 individual loans, the number of loan parts or individual loan contracts number nearly 14 million (13,924,547 rows).21 Hence, ours is ‘big’ data. A broader message of this project is that this sort of granular financial data is collectable in the age of terabyte warehouses, and analytically tractable with visualisation tools we demo at smtm.labs.theodi.org.
Screenshots of the interactive map of the P2P data (green = lenders, magenta = recipients)
19 For example, GABRIEL JIMENEZ, STEVEN ONGENA, JOSE LUIS PEYDRO, and JESUS SAURINA (2008). Hazardous times for monetary policy: What do twenty-three million bank loans say about the effects of monetary policy on credit risk-taking? Documentos de Trabajo No. 833, Banco de Espana; 20 Note that the current recipient of cash flows may be different from the original lender because certain P2P platforms allow the original lender to transfer rights to the remaining repayments to other investors. The foucs here is on the original lenders’ postcodes rather than geographical information on where and to whom those cash flows now go. 21 The data underpinning our analysis starts from 1. October 2010, the earliest date at which all three lenders were operating.

July 2013
6
Results
Overall statistics
The total amount of P2P loans in the sample was £378.3 million. In the data, the UK market from Oct 2010 to May 2013, we can identify 48,891 lenders and 59,851 recipients (see Methodology for details and caveats). Table 1.1 shows the average loan and Figure 1.1 and 1.2 the whole distribution across lenders and recipients.
The unit of analysis is a loan part. In total there are 13,924,547 loan parts. A recipient who takes out a loan of £2,000 may receive the money from hundreds of different lenders. Vice versa, a lender may subdivide her investment into many loans. A typical (median, see explanation) amount for a loan part is £10. However, in a small number of cases the investment per loan part is substantially larger.
July 2013
7
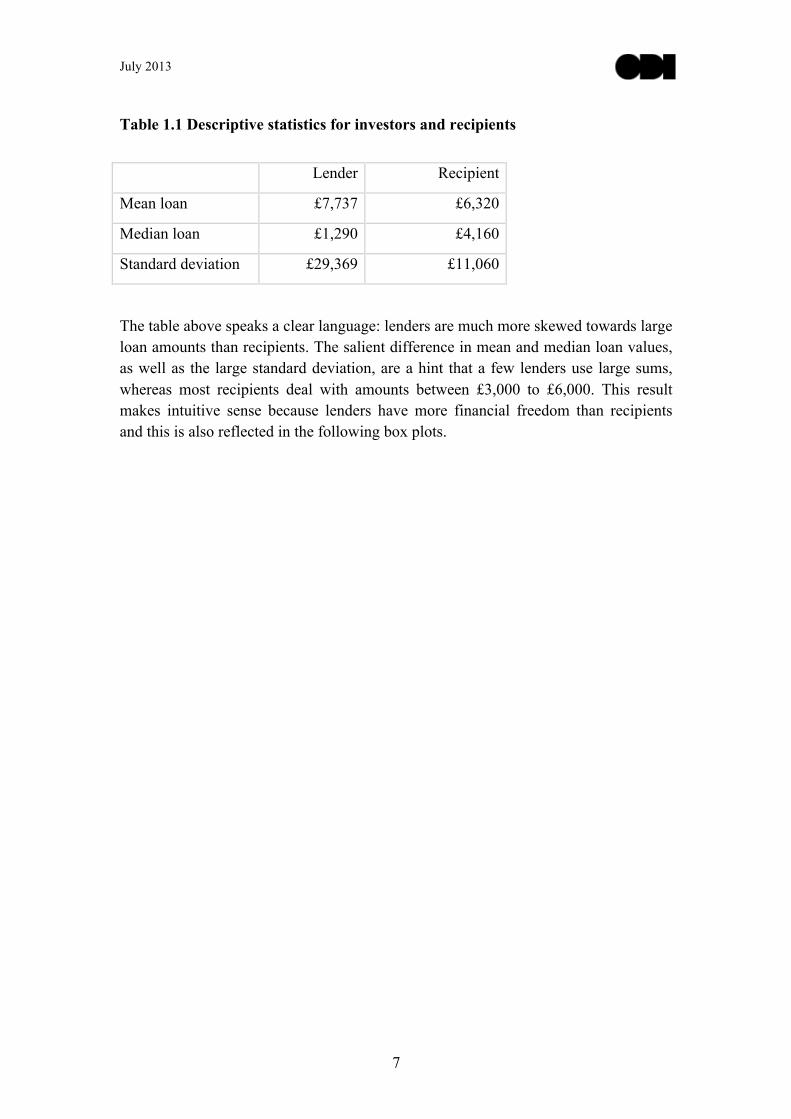
Table 1.1 Descriptive statistics for investors and recipients
Lender Recipient
Mean loan £7,737 £6,320
Median loan £1,290 £4,160
Standard deviation £29,369 £11,060
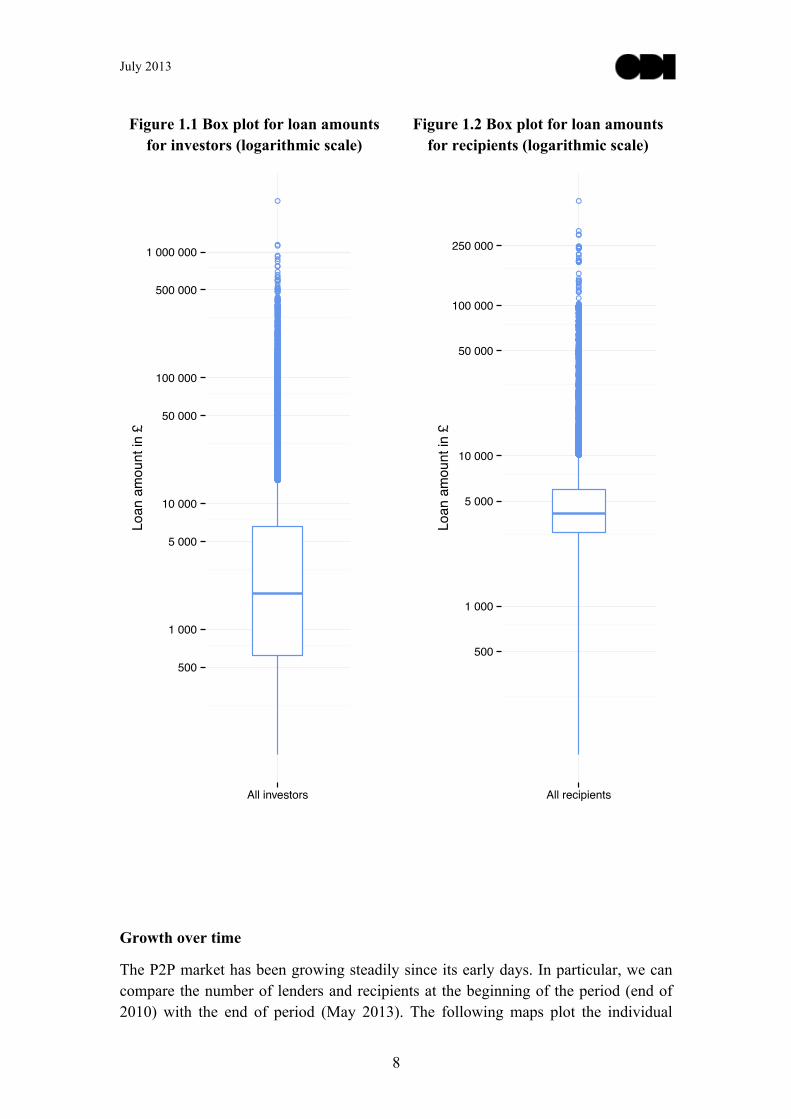
The table above speaks a clear language: lenders are much more skewed towards large loan amounts than recipients. The salient difference in mean and median loan values, as well as the large standard deviation, are a hint that a few lenders use large sums, whereas most recipients deal with amounts between £3,000 to £6,000. This result makes intuitive sense because lenders have more financial freedom than recipients and this is also reflected in the following box plots.
July 2013
8
Figure 1.1 Box plot for loan amounts for investors (logarithmic scale)
Figure 1.2 Box plot for loan amounts for recipients (logarithmic scale)
Growth over time
The P2P market has been growing steadily since its early days. In particular, we can compare the number of lenders and recipients at the beginning of the period (end of 2010) with the end of period (May 2013). The following maps plot the individual
●●●●●●●●●●●●●●●●●●●●●●●●●●●●●●●●●●●●●●●●●●●●●●●●●●●●●●●●●●●●●●●●●●●●●●●●●●●●●●●●●●●●●●●●●●●●●●●●●●●●●●●●●●●●●●●●●●●●●●●●●●●●●●●●●●●●●●●●●●●●●●●●●●●●●●●●●●●●●●●●●●●●●●●●●●●●●●●●●●●●●●●●●●●●●●●●●●●●●●●●●●●●●●●●●●●●●●●●●●●●●●●●●●●●●●●●●●●●●●●●●●●●●●●●●●●●●●●●●●●●●●●●●●●●●●●●●●●●●●●●●●●●●●●●●●●●●●●●●●●●●●●●●●●●●●●●●●●●●●●●●●●●●●●●●●●●●●●●●●●●●●●●●●●●●●●●●●●●●●●●●●●●●●●●●●●●●●●●●●●●●●●●●●●●●●●●●●●●●●●●●●●●●●●●●●●●●●●●●●●●●●●●●●●●●●●●●●●●●●●●●●●●●●●●●●●●●●●●●●●●●●●●●●●●●●●●●●●●●●●●●●●●●●●●●●●●●●●●●●●●●●●●●●●●●●●●●●●●●●●●●●●●●●●●●●●●●●●●●●●●●●●●●●●●●●●●●●●●●●●●●●●●●●●●●●●●●●●●●●●●●●●●●●●●●●●●●●●●●●●●●●●●●●●●●●●●●●●●●●●●●●●●●●●●●●●●●●●●●●●●●●●●●●●●●●●●●●●●●●●●●●●●●●●●●●●●●●●●●●●●●●●●●●●●●●●●●●●●●●●●●●●●●●●●●●●●●●●●●●●●●●●●●●●●●●●●●●●●●●●●●●●●●●●●●●●●●●●●●●●●●●●●●●●●●●●●●●●●●●●●●●●●●●●●●●●●●●●●●●●●●●●●●●●●●●●●●●●●●●●●●●●●●●●●●●●●●●●●●●●●●●●●●●●●●●●●●●●●●●●●●●●●●●●●●●●●●●●●●●●●●●●●●●●●●●●●●●●●●●●●●●●●●●●●●●●●●●●●●●●●●●●●●●●●●●●●●●●●●●●●●●●●●●●●●●●●●●●●●●●●●●●●●●●●●●●●●●●●●●●●●●●●●●●●●●●●●●●●●●●●●●●●●●●●●●●●●●●●●●●●●●●●●●●●●●●●●●●●●●●●●●●●●●●●●●●●●●●●●●●●●●●●●●●●●●●●●●●●●●●●●●●●●●●●●●●●●●●●●●●●●●●●●●●●●●●●●●●●●●●●●●●●●●●●●●●●●●●●●●●●●●●●●●●●●●●●●●●●●●●●●●●●●●●●●●●●●●●●●●●●●●●●●●●●●●●●●●●●●●●●●●●●●●●●●●●●●●●●●●●●●●●●●●●●●●●●●●●●●●●●●●●●●●●●●●●●●●●●●●●●●●●●●●●●●●●●●●●●●●●●●●●●●●●●●●●●●●●●●●●●●●●●●●●●●●●●●●●●●●●●●●●●●●●●●●●●●●●●●●●●●●●●●●●●●●●●●●●●●●●●●●●●●●●●●●●●●●●●●●●●●●●●●●●●●●●●●●●●●●●●●●●●●●●●●●●●●●●●●●●●●●●●●●●●●●●●●●●●●●●●●●●●●●●●●●●●●●●●●●●●●●●●●●●●●●●●●●●●●●●●●●●●●●●●●●●●●●●●●●●●●●●●●●●●●●●●●●●●●●●●●●●●●●●●●●●●●●●●●●●●●●●●●●●●●●●●●●●●●●●●●●●●●●●●●●●●●●●●●●●●●●●●●●●●●●●●●●●●●●●●●●●●●●●●●●●●●●●●●●●●●●●●●●●●●●●●●●●●●●●●●●●●●●●●●●●●●●●●●●●●●●●●●●●●●●●●●●●●●●●●●●●●●●●●●●●●●●●●●●●●●●●●●●●●●●●●●●●●●●●●●●●●●●●●●●●●●●●●●●●●●●●●●●●●●●●●●●●●●●●●●●●●●●●●●●●●●●●●●●●●●●●●●●●●●●●●●●●●●●●●●●●●●●●●●●●●●●●●●●●●●●●●●●●●●●●●●●●●●●●●●●●●●●●●●●●●●●●●●●●●●●●●●●●●●●●●●●●●●●●●●●●●●●●●●●●●●●●●●●●●●●●●●●●●●●●●●●●●●●●●●●●●●●●●●●●●●●●●●●●●●●●●●●●●●●●●●●●●●●●●●●●●●●●●●●●●●●●●●●●●●●●●●●●●●●●●●●●●●●●●●●●●●●●●●●●●●●●●●●●●●●●●●●●●●●●●●●●●●●●●●●●●●●●●●●●●●●●●●●●●●●●●●●●●●●●●●●●●●●●●●●●●●●●●●●●●●●●●●●●●●●●●●●●●●●●●●●●●●●●●●●●●●●●●●●●●●●●●●●●●●●●●●●●●●●●●●●●●●●●●●●●●●●●●●●●●●●●●●●●●●●●●●●●●●●●●●●●●●●●●●●●●●●●●●●●●●●●●●●●●●●●●●●●●●●●●●●●●●●●●●●●●●●●●●●●●●●●●●●●●●●●●●●●●●●●●●●●●●●●●●●●●●●●●●●●●●●●●●●●●●●●●●●●●●●●●●●●●●●●●●●●●●●●●●●●●●●●●●●●●●●●●●●●●●●●●●●●●●●●●●●●●●●●●●●●●●●●●●●●●●●●●●●●●●●●●●●●●●●●●●●●●●●●●●●●●●●●●●●●●●●●●●●●●●●●●●●●●●●●●●●●●●●●●●●●●●●●●●●●●●●●●●●●●●●●●●●●●●●●●●●●●●●●●●●●●●●●●●●●●●●●●●●●●●●●●●●●●●●●●●●●●●●●●●●●●●●●●●●●●●●●●●●●●●●●●●●●●●●●●●●●●●●●●●●●●●●●●●●●●●●●●●●●●●●●●●●●●●●●●●●●●●●●●●●●●●●●●●●●●●●●●●●●●●●●●●●●●●●●●●●●●●●●●●●●●●●●●●●●●●●●●●●●●●●●●●●●●●●●●●●●●●●●●●●●●●●●●●●●●●●●●●●●●●●●●●●●●●●●●●●●●●●●●●●●●●●●●●●●●●●●●●●●●●●●●●●●●●●●●●●●●●●●●●●●●●●●●●●●●●●●●●●●●●●●●●●●●●●●●●●●●●●●●●●●●●●●●●●●●●●●●●●●●●●●●●●●●●●●●●●●●●●●●●●●●●●●●●●●●●●●●●●●●●●●●●●●●●●●●●●●●●●●●●●●●●●●●●●●●●●●●●●●●●●●●●●●●●●●●●●●●●●●●●●●●●●●●●●●●●●●●●●●●●●●●●●●●●●●●●●●●●●●●●●●●●●●●●●●●●●●●●●●●●●●●●●●●●●●●●●●●●●●●●●●●●●●●●●●●●●●●●●●●●●●●●●●●●●●●●●●●●●●●●●●●●●●●●●●●●●●●●●●●●●●●●●●●●●●●●●●●●●●●●●●●●●●●●●●●●●●●●●●●●●●●●●●●●●●●●●●●●●●●●●●●●●●●●●●●●●●●●●●●●●●●●●●●●●●●●●●●●●●●●●●●●●●●●●●●●●●●●●●●●●●●●●●●●●●●●●●●●●●●●●●●●●●●●●●●●●●●●●●●●●●●●●●●●●●●●●●●●●●●●●●●●●●●●●●●●●●●●●●●●●●●●●●●●●●●●●●●●●●●●●●●●●●●●●●●●●●●●●●●●●●●●●●●●●●●●●●●●●●●●●●●●●●●●●●●●●●●●●●●●●●●●●●●●●●●●●●●●●●●●●●●●●●●●●●●●●●●●●●●●●●●●●●●●●●●●●●●●●●●●●●●●●●●●●●●●●●●●●●●●●●●●●●●●●●●●●●●●●●●●●●●●●●●●●●●●●●●●●●●●●●●●●●●●●●●●●●●●●●●●●●●●●●●●●●●●●●●●●●●●●●●●●●●●●●●●●●●●●●●●●●●●●●●●●●●●●●●●●●●●●●●●●●●●●●●●●●●●●●●●●●●●●●●●●●●●●●●●●●●●●●●●●●●●●●●●●●●●●●●●●●●●●●●●●●●●●●●●●●●●●●●●●●●●●●●●●●●●●●●●●●●●●●●●●●●●●●●●●●●●●●●●●●●●●●●●●●●●●●●●●●●●●●●●●●●●●●●●●●●●●●●●●●●●●●●●●●●●●●●●●●●●●●●●●●●●●●●●●●●●●●●●●●●●●●●●●●●●●●●●●●●●●●●●●●●●●●●●●●●●●●●●●●●●●●●●●●●●●●●●●●●●●●●●●●●●●●●●●●●●●●●●●●●●●●●●●●●●●●●●●●●●●●●●●●●●●●●●●●●●●●●●●●●●●●●●●●●●●●●●●●●●●●●●●●●●●●●●●●●●●●●●●●●●●●●●●●●●●●●●●●●●●●●●●●●●●●●●●●●●●●●●●●●●●●●●●●●●●●●●●●●●●●●●●●●●●●●●●●●●●●●●●●●●●●●●●●●●●●●●●●●●●●●●●●●●●●●●●●●●●●●●●●●●●●●●●●●●●●●●●●●●●●●●●●●●●●●●●●●●●●●●●●●●●●●●●●●●●●●●●●●●●●●●●●●●●●●●●●●●●●●●●●●●●●●●●●●●●●●●●●●●●●●●●●●●●●●●●●●●●●●●●●●●●●●●●●●●●●●●●●●●●●●●●●●●●●●●●●●●●●●●●●●●●●●●●●●●●●●●●●●●●●●●●●●●●●●●●●●●●●●●●●●●●●●●●●●●●●●●●●●●●●●●●●●●●●●●●●●●●●●●●●●●●●●●●●●●●●●●●●●●●●●●●●●●●●●●●●●●●●●●●●●●●●●●●●●●●●●●●●●●●●●●●●●●●●●●●●●●●●●●●●●●●●●●●●●●●●●●●●●●●●●●●●●●●●●●●●●●●●●●●●●●●●●●●●●●●●●●●●●●●●●●●●●●●●●●●●●●●●●●●●●●●●●●●●●●●●●●●●●●●●●●●●●●●●●●●●●●●●●●●●●●●●●●●●●●●●●●●●●●●●●●●●●●●●●●●●●●●●●●●●●●●●●●●●●●●●●●●●●●●●●●●●●●●●●●●●●●●●●●●●●●●●●●●●●●●●●●●●●●●●●●●●●●●●●●●●●●●●●●●●●●●●●●●●●●●●●●●●●●●●●●●●●●●●●●●●●●●●●●●●●●●●●●●●●●●●●●●●●●●●●●●●●●●●●●●●●●●●●●●●●●●●●●●●●●●●●●●●●●●●●●●●●●●●●●●●●●●●●●●●●●●●●●●●●●●●●●●●●●●●●●●●●●●●●●●●●●●●●●●●●●●●●●●●●●●●●●●●●●●●●●●●●●●●●●●●●●●●●●●●●●●●●●●●●●●●●●●●●●●●●●●●●●●●●●●●●●●●●●●●●●●●●●●●●●●●●●●●●●●●●●●●●●●●●●●●●●●●●●●●●●●●●●●●●●●●●●●●●●●●●●●●●●●●●●●●●●●●●●●●●●●●●●●●●●●●●●●●●●●●●●●●●●●●●●●●●●●●●●●●●●●●●●●●●●●●●●●●●●●●●●●●●●●●●●●●●●●●●●●●●●●●●●●●●●●●●●●●●●●●●●●●●●●●●●●●●●●●●●●●●●●●●●●●●●●●●●●●●●●●●●●●●●●●●●●●●●●●●●●●●●●●●●●●●●●●●●●●●●●●●●●●●●●●●●●●●●●●●●●●●●●●●●●●●●●●●●●●●●●●●●●●●●●●●●●●●●●●●●●●●●●●●●●●●●●●●●●●●●●●●●●●●●●●●●●●●●●●●●●●●●●●●●●●●●●●●●●●●●●●●●●●●●●●●●●●●●●●●●●●●●●●●●●●●●●●●●●●●●●●●●●●●●●●●●●●●●●●●●●●●●●●●●●●●●●●●●●●●●●●●●●●●●●●●●●●●●●●●●●●●●●●●●●●●●●
●●
●
500
1 000
5 000
10 000
50 000
100 000
500 000
1 000 000
All investors
Loan
am
ount
in £
●●●●●●●●●●●●●●●●●●●●●●●●●●●●●●●●●●●●●●●●●●●●●●●●●●●●●●●●●●●●●●●●●●●●●●●●●●●●●●●●●●●●●●●●●●●●●●●●●●●●●●●●●●●●●●●●●●●●●●●●●●●●●●●●●●●●●●●●●●●●●●●●●●●●●●●●●●●●●●●●●●●●●●●●●●●●●●●●●●●●●●●●●●●●●●●●●●●●●●●●●●●●●●●●●●●●●●●●●●●●●●●●●●●●●●●●●●●●●●●●●●●●●●●●●●●●●●●●●●●●●●●●●●●●●●●●●●●●●●●●●●●●●●●●●●●●●●●●●●●●●●●●●●●●●●●●●●●●●●●●●●●●●●●●●●●●●●●●●●●●●●●●●●●●●●●●●●●●●●●●●●●●●●●●●●●●●●●●●●●●●●●●●●●●●●●●●●●●●●●●●●●●●●●●●●●●●●●●●●●●●●●●●●●●●●●●●●●●●●●●●●●●●●●●●●●●●●●●●●●●●●●●●●●●●●●●●●●●●●●●●●●●●●●●●●●●●●●●●●●●●●●●●●●●●●●●●●●●●●●●●●●●●●●●●●●●●●●●●●●●●●●●●●●●●●●●●●●●●●●●●●●●●●●●●●●●●●●●●●●●●●●●●●●●●●●●●●●●●●●●●●●●●●●●●●●●●●●●●●●●●●●●●●●●●●●●●●●●●●●●●●●●●●●●●●●●●●●●●●●●●●●●●●●●●●●●●●●●●●●●●●●●●●●●●●●●●●●●●●●●●●●●●●●●●●●●●●●●●●●●●●●●●●●●●●●●●●●●●●●●●●●●●●●●●●●●●●●●●●●●●●●●●●●●●●●●●●●●●●●●●●●●●●●●●●●●●●●●●●●●●●●●●●●●●●●●●●●●●●●●●●●●●●●●●●●●●●●●●●●●●●●●●●●●●●●●●●●●●●●●●●●●●●●●●●●●●●●●●●●●●●●●●●●●●●●●●●●●●●●●●●●●●●●●●●●●●●●●●●●●●●●●●●●●●●●●●●●●●●●●●●●●●●●●●●●●●●●●●●●●●●●●●●●●●●●●●●●●●●●●●●●●●●●●●●●●●●●●●●●●●●●●●●●●●●●●●●●●●●●●●●●●●●●●●●●●●●●●●●●●●●●●●●●●●●●●●●●●●●●●●●●●●●●●●●●●●●●●●●●●●●●●●●●●●●●●●●●●●●●●●●●●●●●●●●●●●●●●●●●●●●●●●●●●●●●●●●●●●●●●●●●●●●●●●●●●●●●●●●●●●●●●●●●●●●●●●●●●●●●●●●●●●●●●●●●●●●●●●●●●●●●●●●●●●●●●●●●●●●●●●●●●●●●●●●●●●●●●●●●●●●●●●●●●●●●●●●●●●●●●●●●●●●●●●●●●●●●●●●●●●●●●●●●●●●●●●●●●●●●●●●●●●●●●●●●●●●●●●●●●●●●●●●●●●●●●●●●●●●●●●●●●●●●●●●●●●●●●●●●●●●●●●●●●●●●●●●●●●●●●●●●●●●●●●●●●●●●●●●●●●●●●●●●●●●●●●●●●●●●●●●●●●●●●●●●●●●●●●●●●●●●●●●●●●●●●●●●●●●●●●●●●●●●●●●●●●●●●●●●●●●●●●●●●●●●●●●●●●●●●●●●●●●●●●●●●●●●●●●●●●●●●●●●●●●●●●●●●●●●●●●●●●●●●●●●●●●●●●●●●●●●●●●●●●●●●●●●●●●●●●●●●●●●●●●●●●●●●●●●●●●●●●●●●●●●●●●●●●●●●●●●●●●●●●●●●●●●●●●●●●●●●●●●●●●●●●●●●●●●●●●●●●●●●●●●●●●●●●●●●●●●●●●●●●●●●●●●●●●●●●●●●●●●●●●●●●●●●●●●●●●●●●●●●●●●●●●●●●●●●●●●●●●●●●●●●●●●●●●●●●●●●●●●●●●●●●●●●●●●●●●●●●●●●●●●●●●●●●●●●●●●●●●●●●●●●●●●●●●●●●●●●●●●●●●●●●●●●●●●●●●●●●●●●●●●●●●●●●●●●●●●●●●●●●●●●●●●●●●●●●●●●●●●●●●●●●●●●●●●●●●●●●●●●●●●●●●●●●●●●●●●●●●●●●●●●●●●●●●●●●●●●●●●●●●●●●●●●●●●●●●●●●●●●●●●●●●●●●●●●●●●●●●●●●●●●●●●●●●●●●●●●●●●●●●●●●●●●●●●●●●●●●●●●●●●●●●●●●●●●●●●●●●●●●●●●●●●●●●●●●●●●●●●●●●●●●●●●●●●●●●●●●●●●●●●●●●●●●●●●●●●●●●●●●●●●●●●●●●●●●●●●●●●●●●●●●●●●●●●●●●●●●●●●●●●●●●●●●●●●●●●●●●●●●●●●●●●●●●●●●●●●●●●●●●●●●●●●●●●●●●●●●●●●●●●●●●●●●●●●●●●●●●●●●●●●●●●●●●●●●●●●●●●●●●●●●●●●●●●●●●●●●●●●●●●●●●●●●●●●●●●●●●●●●●●●●●●●●●●●●●●●●●●●●●●●●●●●●●●●●●●●●●●●●●●●●●●●●●●●●●●●●●●●●●●●●●●●●●●●●●●●●●●●●●●●●●●●●●●●●●●●●●●●●●●●●●●●●●●●●●●●●●●●●●●●●●●●●●●●●●●●●●●●●●●●●●●●●●●●●●●●●●●●●●●●●●●●●●●●●●●●●●●●●●●●●●●●●●●●●●●●●●●●●●●●●●●●●●●●●●●●●●●●●●●●●●●●●●●●●●●●●●●●●●●●●●●●●●●●●●●●●●●●●●●●●●●●●●●●●●●●●●●●●●●●●●●●●●●●●●●●●●●●●●●●●●●●●●●●●●●●●●●●●●●●●●●●●●●●●●●●●●●●●●●●●●●●●●●●●●●●●●●●●●●●●●●●●●●●●●●●●●●●●●●●●●●●●●●●●●●●●●●●●●●●●●●●●●●●●●●●●●●●●●●●●●●●●●●●●●●●●●●●●●●●●●●●●●●●●●●●●●●●●●●●●●●●●●●●●●●●●●●●●●●●●●●●●●●●●●●●●●●●●●●●●●●●●●●●●●●●●●●●●●●●●●●●●●●●●●●●●●●●●●●●●●●●●●●●●●●●●●●●●●●●●●●●●●●●●●●●●●●●●●●●●●●●●●●●●●●●●●●●●●●●●●●●●●●●●●●●●●●●●●●●●●●●●●●●●●●●●●●●●●●●●●●●●●●●●●●●●●●●●●●●●●●●●●●●●●●●●●●●●●●●●●●●●●●●●●●●●●●●●●●●●●●●●●●●●●●●●●●●●●●●●●●●●●●●●●●●●●●●●●●●●●●●●●●●●●●●●●●●●●●●●●●●●●●●●●●●●●●●●●●●●●●●●●●●●●●●●●●●●●●●●●●●●●●●●●●●●●●●●●●●●●●●●●●●●●●●●●●●●●●●●●●●●●●●●●●●●●●●●●●●●●●●●●●●●●●●●●●●●●●●●●●●●●●●●●●●●●●●●●●●●●●●●●●●●●●●●●●●●●●●●●●●●●●●●●●●●●●●●●●●●●●●●●●●●●●●●●●●●●●●●●●●●●●●●●●●●●●●●●●●●●●●●●●●●●●●●●●●●●●●●●●●●●●●●●●●●●●●●●●●●●●●●●●●●●●●●●●●●●●●●●●●●●●●●●●●●●●●●●●●●●●●●●●●●●●●●●●●●●●●●●●●●●●●●●●●●●●●●●●●●●●●●●●●●●●●●●●●●●●●●●●●●●●●●●●●●●●●●●●●●●●●●●●●●●●●●●●●●●●●●●●●●●●●●●●●●●●●●●●●●●●●●●●●●●●●●●●●●●●●●●●●●●●●●●●●●●●●●●●●●●●●●●●●●●●●●●●●●●●●●●●●●●●●●●●●●●●●●●●●●●●●●●●●●●●●●●●●●●●●●●●●●●●●●●●●●●●●●●●●●●●●●●●●●●●●●●●●●●●●●●●●●●●●●●●●●●●●●●●●●●●●●●●●●●●●●●●●●●●●●●●●●●●●●●●●●●●●●●●●●●●●●●●●●●●●●●●●●●●●●●●●●●●●●●●●●●●●●●●●●●●●●●●●●●●●●●●●●●●●●●●●●●●●●●●●●●●●●●●●●●●●●●●●●●●●●●●●●●●●●●●●●●●●●●●●●●●●●●●●●●●●●●●●●●●●●●●●●●●●●●●●●●●●●●●●●●●●●●●●●●●●●●●●●●●●●●●●●●●●●●●●●●●●●●●●●●●●●●●●●●●●●●●●●●●●●●●●●●●●●●●●●●●●●●●●●●●●●●●●●●●●●●●●●●●●●●●●●●●●●●●●●●●●●●●●●●●●●●●●●●●●●●●●●●●●●●●●●●●●●●●●●●●●●●●●●●●●●●●●●●●●●●●●●●●●●●●●●●●●●●●●●●●●●●●●●●●●●●●●●●●●●●●●●●●●●●●●●●●●●●●●●●●●●●●●●●●●●●●●●●●●●●●●●●●●●●●●●●●●●●●●●●●●●●●●●●●●●●●●●●●●●●●●●●●●●●●●●●●●●●●●●●●●●●●●●●●●●●●●●●●●●●●●●●●●●●●●●●●●●●●●●●●●●●●●●●●●●●●●●●●●●●●●●●●●●●●●●●●●●●●●●●●●●●●●●●●●●●●●●●●●●●●●●●●●●●●●●●●●●●●●●●●●●●●●●●●●●●●●●●●●●●●●●●●●●●●●●●●●●●●●●●●●●●●●●●●●●●●●●●●●●●●●●●●●●●●●●●●●●●●●●●●●●●●●●●●●●●●●●●●●●●●●●●●●●●●●●●●●●●●●●●●●●●●●●●●●●●●●●●●●●●●●●●●●●●●●●●●●●●●●●●●●●●●●●●●●●●●●●●●●●●●●●●●●●●●●●●●●●●●●●●●●●●●●●●●●●●●●●●●●●●●●●●●●●●●●●●●●●●●●●●●●●●●●●●●●●●●●●●●●●●●●●●●●●●●●●●●●●●●●●●●●●●●●●●●●●●●●●●●●●●●●●●●●●●●●●●●●●●●●●●●●●●●●●●●●●●●●●●●●●●●●●●●●●●●●●●●●●●●●●●●●●●●●●●●●●●●●●●●●●●●●●●●●●●●●●●●●●●●●●●●●●●●●●●●●●●●●●●●●●●●●●●●●●●●●●●●●●●●●●●●●●●●●●●●●●●●●●●●●●●●●●●●●●●●●●●●●●●●●●●●●●●●●●●●●●●●●●●●●●●●●●●●●●●●●●●●●●●●●●●●●●●●●●●●●●●●●●●●●●●●●●●●●●●●●●●●●●●●●●●●●●●●●●●●●●●●●●●●●●●●●●●●●●●●●●●●●●●●●●●●●●●●●●●●●●●●●●●●●●●●●●●●●●●●●●●●●●●●●●●●●●●●●●●●●●●●●●●●●●●●●●●●●●●●
●●●●●●●●●●●●●●●●●
●●●
●
500
1 000
5 000
10 000
50 000
100 000
250 000
All recipients
Loan
am
ount
in £

July 2013
9
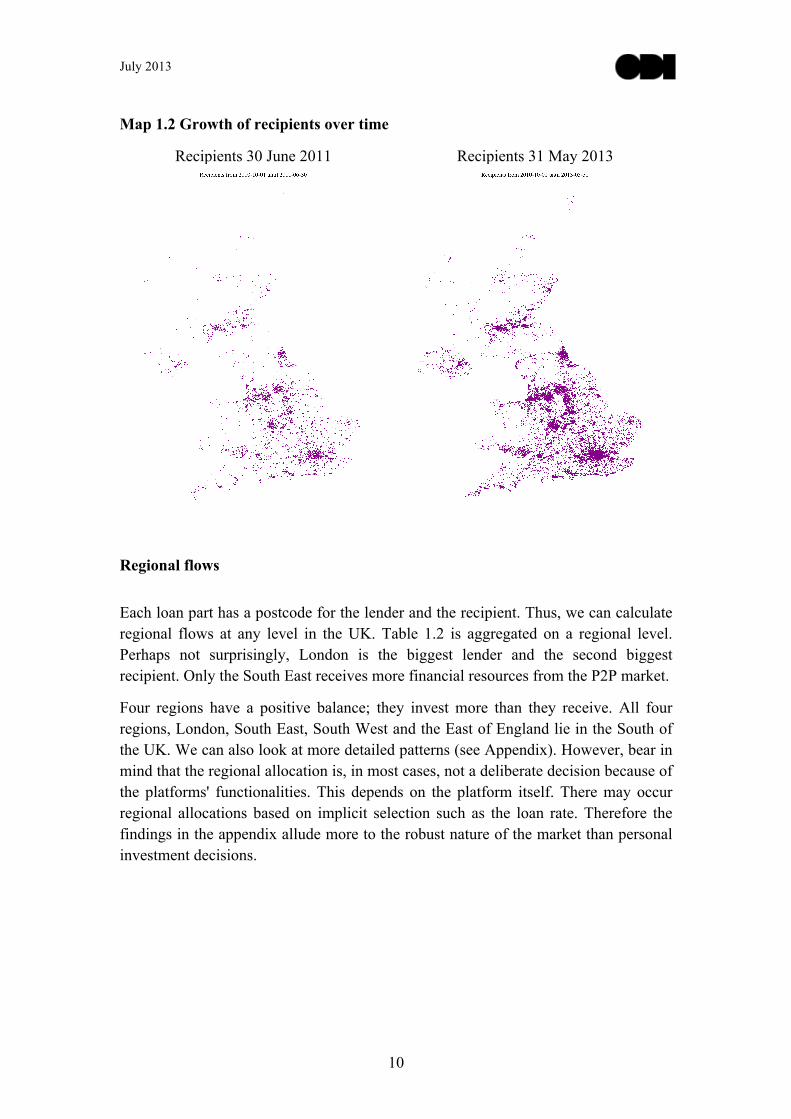
postcodes of lenders and recipients. Notice how there are no country boundaries and the maps emerge entirely from the postcodes.
Map 1.1 Growth of lenders over time
Lenders 30 June 2011 Lenders 31 May 2013
July 2013
10
Map 1.2 Growth of recipients over time
Recipients 30 June 2011 Recipients 31 May 2013
Regional flows
Each loan part has a postcode for the lender and the recipient. Thus, we can calculate regional flows at any level in the UK. Table 1.2 is aggregated on a regional level. Perhaps not surprisingly, London is the biggest lender and the second biggest recipient. Only the South East receives more financial resources from the P2P market.
Four regions have a positive balance; they invest more than they receive. All four regions, London, South East, South West and the East of England lie in the South of the UK. We can also look at more detailed patterns (see Appendix). However, bear in mind that the regional allocation is, in most cases, not a deliberate decision because of the platforms' functionalities. This depends on the platform itself. There may occur regional allocations based on implicit selection such as the loan rate. Therefore the findings in the appendix allude more to the robust nature of the market than personal investment decisions.
July 2013
11
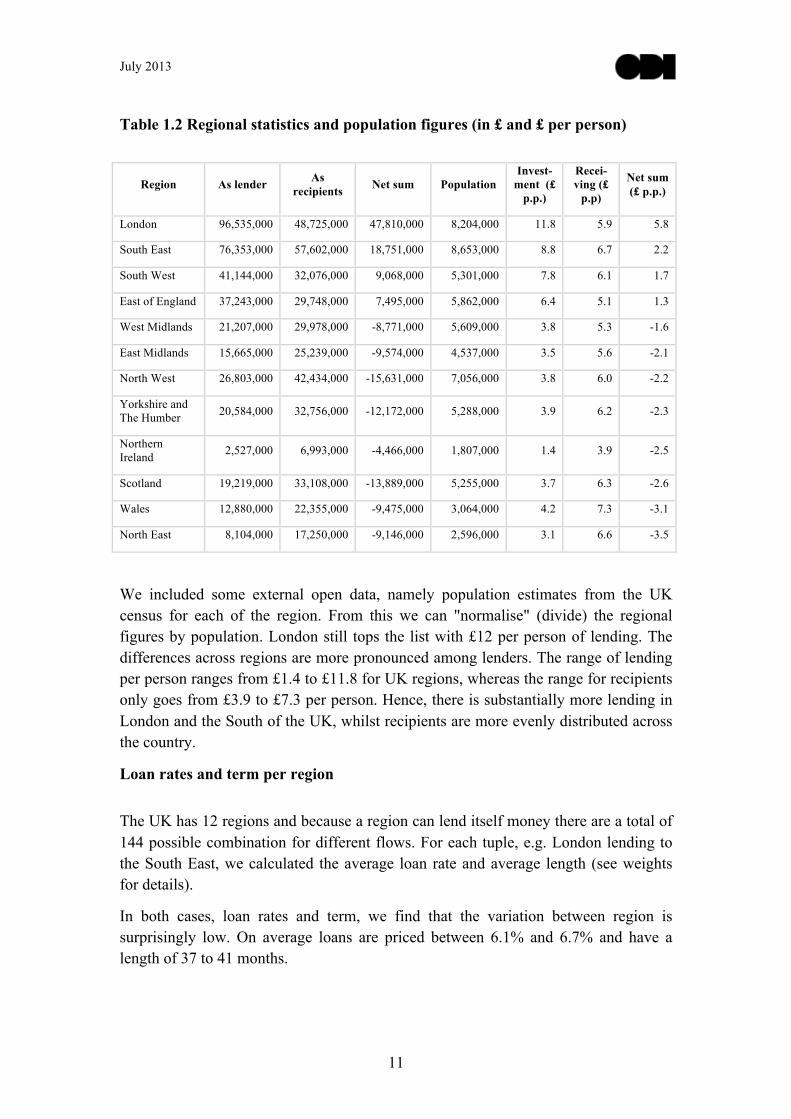
Table 1.2 Regional statistics and population figures (in £ and £ per person)
Region As lender As recipients Net sum Population
Invest-ment (£
p.p.)
Recei-ving (£
p.p)
Net sum (£ p.p.)
London 96,535,000 48,725,000 47,810,000 8,204,000 11.8 5.9 5.8
South East 76,353,000 57,602,000 18,751,000 8,653,000 8.8 6.7 2.2
South West 41,144,000 32,076,000 9,068,000 5,301,000 7.8 6.1 1.7
East of England 37,243,000 29,748,000 7,495,000 5,862,000 6.4 5.1 1.3
West Midlands 21,207,000 29,978,000 -8,771,000 5,609,000 3.8 5.3 -1.6
East Midlands 15,665,000 25,239,000 -9,574,000 4,537,000 3.5 5.6 -2.1
North West 26,803,000 42,434,000 -15,631,000 7,056,000 3.8 6.0 -2.2
Yorkshire and The Humber 20,584,000 32,756,000 -12,172,000 5,288,000 3.9 6.2 -2.3
Northern Ireland 2,527,000 6,993,000 -4,466,000 1,807,000 1.4 3.9 -2.5
Scotland 19,219,000 33,108,000 -13,889,000 5,255,000 3.7 6.3 -2.6
Wales 12,880,000 22,355,000 -9,475,000 3,064,000 4.2 7.3 -3.1
North East 8,104,000 17,250,000 -9,146,000 2,596,000 3.1 6.6 -3.5
We included some external open data, namely population estimates from the UK census for each of the region. From this we can "normalise" (divide) the regional figures by population. London still tops the list with £12 per person of lending. The differences across regions are more pronounced among lenders. The range of lending per person ranges from £1.4 to £11.8 for UK regions, whereas the range for recipients only goes from £3.9 to £7.3 per person. Hence, there is substantially more lending in London and the South of the UK, whilst recipients are more evenly distributed across the country.
Loan rates and term per region
The UK has 12 regions and because a region can lend itself money there are a total of 144 possible combination for different flows. For each tuple, e.g. London lending to the South East, we calculated the average loan rate and average length (see weights for details).
In both cases, loan rates and term, we find that the variation between region is surprisingly low. On average loans are priced between 6.1% and 6.7% and have a length of 37 to 41 months.

July 2013
12
There is no salient pattern for recipients when it comes to interest rates. The lowest rates for lenders, on the other hand, are all in the East of England. This fits with the fact that those loans are also slightly shorter compared to the rest of the UK.
Figure 1.3 Histogram of loan rates for each regional flow
Figure 1.4 Histogram of terms for each regional flow
0
10
20
6.0 6.3 6.6 6.9Histogram of loan rates (in %) for each regional flow
Rel
ative
freq
uenc
y
0
10
20
30
40
34 36 38 40 42Histogram of term (in months) for each regional flow
Rel
ative
freq
uenc
y

July 2013
13
Counties
Similarly to regions, we can calculate statistics for English counties. Table 1.3 shows total amount for lenders and recipients for each English county. The net is calculated as the difference, i.e. lending - receiving. The visualisation on the front page provides further tools to explore the data.
Table 1.3 Loan amounts for English Counties (in £)
County Lending Receiving Net
Buckinghamshire 8,533,000 3,974,000 4,559,000
Cambridgeshire 7,557,000 3,569,000 3,988,000
Cumbria 3,504,000 3,532,000 -28,000
Derbyshire 2,877,000 5,046,000 -2,169,000
Devon 6,759,000 3,786,000 2,973,000
Dorset 3,628,000 1,955,000 1,673,000
East Sussex 3,915,000 3,222,000 693,000
Essex 10,802,000 8,587,000 2,215,000
Gloucestershire 5,171,000 4,569,000 602,000
Hampshire 12,041,000 9,255,000 2,786,000
Hertfordshire 11,686,000 8,230,000 3,456,000
Kent 9,891,000 8,687,000 1,204,000
Lancashire 6,346,000 8,549,000 -2,203,000
Leicestershire 3,409,000 5,191,000 -1,782,000
Lincolnshire 2,957,000 4,594,000 -1,637,000
Norfolk 5,436,000 4,870,000 566,000
North Yorkshire 4,176,000 3,983,000 193,000
Northamptonshire 3,463,000 5,018,000 -1,555,000
Nottinghamshire 2,810,000 6,056,000 -3,246,000
Oxfordshire 8,573,000 5,625,000 2,948,000
Somerset 3,196,000 2,939,000 257,000
Staffordshire 2,680,000 5,797,000 -3,117,000
Suffolk 4,071,000 4,331,000 -260,000
Surrey 16,169,000 8,819,000 7,350,000
Warwickshire 3,271,000 4,323,000 -1,052,000
West Sussex 6,903,000 5,879,000 1,024,000
Worcestershire 4,764,000 3,921,000 843,000

July 2013
14
Methodology
Data
The data set contains all loans facilitated by the three main P2P lenders in the UK: Zopa, Funding Circle and RateSetter. These three platforms provide roughly 92% of all P2P lending activity in the UK. The time period in our sample spans 32 months from October 2010 to May 2013.
We received the data in its raw format (the loan book) from each of the three P2P lenders. All R code is available on GitHub. In order to aggregate, we harmonized the data, for example, by changing the unit for interest rates (percentage points instead of units).
Further, we had to exclude a total of 20,916 observations, that is loan parts. Given the large amount of loan parts this represents only 0.15% of the sample. Most of them were omitted due to missing postcodes. In fact, some of the P2P lenders do not validate UK postcodes, which meant we also excluded some foreign postcodes. We also excluded postcodes of the Isle of Man (IM), the British Forces (BF), Guernsey (GY) and Jersey (JE) as these areas are not part of the United Kingdom.
Notice that the number of lenders and borrowers are conservative estimates. This is because, we use loan ID and lender's postcode as a proxy for unique agents in the P2P market. There might be cases where two different lenders live in the same postcode or where the same person or company took out more than one loan. But the latter is extremely unlikely because of the short time period of our sample.
Weights
To calculate regional or area statistics, which are not counts or sums, we have to use a weighed average. The reason for this is the unequal number of loan parts per loan. If we were to calculate a mean over data with the loan part at its lowest unit (which we need for the flows), the statistics would be dominated by those loans which appear most often, i.e. have many loan parts. Weighting adjusts for this bias.
The weights are derived in a standard fashion: taking the inverse of the number of loan parts per loan and adjusting them to a mean of 1. The weights are well-behaved with a skewed distribution towards small weights because of loans that are highly syndicated.
The mean and median in statistics
You may have heard the old bon mot: “Bill Gates walks into a bar. On average everyone is a millionaire.” In fact, this would even work with a football stadium. (Do the math: His wealth is reported at $72.7 billion for 2013.)
July 2013
15
The mean, colloquially known as the average, is not robust against outliers. Values which are a lot larger or smaller can seriously distort the mean. This is a problem because often we are interested in the typical value. The median is often preferred with financial data, for example income in the UK. Most people earn something between £20,000 and £40,000 per year, so we would consider this the typical value. However, some very successful people such as Wayne Rooney have an income which has one or two more zeros – the mean is skewed upwards unlike the median.
What is the median? It is the value "in the middle". Imagine you know everyone's income, sort it by size and then count until you are half way. The corresponding value is the median.
Do not use this knowledge for the dark side. You may be tempted to suddenly report the median value, for example if you had three grades 15%, 80% and 82%. The average (median) here is 80%, which sounds a lot better than the, usually reported, mean of 59%.
Privacy
The P2P data derives mostly from individuals and hence counts as personal data. To avoid re-identification of individuals we completed the following three steps:
1. Publish the data without postcodes or other direct identifiers. 2. Omitted all variables which are not relevant to this study such as sector or
purpose 3. Conducted a privacy impact assessment (see appendix)
Acknowledgments
We thank Grant Alexander, David Bholat, Samir Desai, John Gillespie, Rhydian Lewis, Andrew Mullinger, Jingyi Wei, and Christian Wong for supporting this project.

July 2013
16
Appendix
Small-scale privacy impact assessment (PIA)
Following the ICO’s guide we conducted a small-scale PIA. The screening questions for the small-scale PIA are in the next section.
The initial consultation included all three P2P lending platforms. The main concerns for re-identification were fields that included free-text comments and the postcode of the lender or recipient.
We therefore decided not to include the fields that held additional information such as loan purpose or comment. They were not used in this project. Regarding the risk of releasing postcodes we relied on the following guidelines:
In England, when anonymising postcodes the following average characteristics of postcodes should be considered:
• full postcode = approx 15 households (although some postcodes only relate to a single property)
• postcode minus the last digit = approx 120/200 households • postal sector = 4 outbound digits + 1 inbound gives approx 2,600
households • postal district = 4 outbound digits approx 8,600 households • postal area = 2 outbound digits approx 194,000 households
Source: Centre for Advanced Spatial Analysis: UCL
An acceptable trade-off between granularity and usefulness resulted in postal districts. In Scotland, some districts may be below 8,600 households; this is still far above standard thresholds for avoiding re-identification.
The only output that utilises postcodes are maps that show the growing market over time. However, the resolution is not high enough to identify particular postcodes and, moreover, there is no additional information about loans displayed on the map.
Prior to publication, and in the final stage of the project, we conducted another consultation with the three P2P platforms. The unanimous assessment was that the risk of re-identification following these anonymisation steps is close to zero. If this project continues past pilot stage, we will have this independently audited.
Screening questions for small-scale PIAs
1. Does the project apply new or additional information technologies that have substantial potential for privacy intrusion?
No. Web technologies are arguably no longer new technologies and financial data exists similarly in the traditional banking sector.
July 2013
17
The data relates to individual loan parts and does not provide any information regarding the identity of the lender or recipient.
2. Does the project involve new identifiers, re-use of existing identifiers, or intrusive identification, identity authentication or identity management processes?
No. The project only uses identifiers for loans.
The original identifiers were masked by a generic list.
3. Might the project have the effect of denying anonymity and pseudonymity, or converting transactions that could previously be conducted anonymously or pseudonymously into identified transactions?
No. The data does not include names or any other identifiers.
The transactions are never completely anonymous as individuals have to sign up to the platform.
4. Does the project involve multiple organisations, whether they are government agencies (eg in ‘joined-up government’ initiatives) or private sector organisations (eg as outsourced service providers or as ‘business partners’)?
The project involves three private businesses.
5. Does the project involve new or significantly changed handling of personal data that is of particular concern to individuals?
The publication of P2P transactions does not involve any new or or significantly changed handling of personal data.
6. Does the project involve new or significantly changed handling of a considerable amount of personal data about each individual in the database?
No. The data relates to loans, is considerably reduced in size and is a snapshot in time.
7. Does the project involve new or significantly changed handling of personal data about a large number of individuals?
No, as outlined in question 6.
8. Does the project involve new or significantly changed consolidation, inter-linking, cross-referencing or matching of personal data from multiple sources?
No. The only link to other data sources occurs on a regional level and are population estimates.
9. Does the project relate to data processing which is in any way exempt from legislative privacy protections?
No.

July 2013
18
10. Does the project’s justification include significant contributions to public security measures?
No.
11. Does the project involve systematic disclosure of personal data to, or access by, third parties that are not subject to comparable privacy regulation?
The data can be viewed outside the UK. However, after the process of anonymisation it is no longer personal data.