october 9, 2017 public hearing - edl · october 9, 2017 budget adoption: october 23, ... form 4b...
TRANSCRIPT

October 9, 2017 Public Hearing

2018 Budget PresentationBudget Hearing:October 9, 2017Budget Adoption:October 23, 2017

THE FIVE THINGS YOU NEED TO KNOWABOUT EVERY PUBLIC BUDGET:
1. How much do we propose to spend and on what would we spend it?
2. What revenues and resources will we have to support the needed expenditures?
3. Will our budget be balanced?4. What does all this mean to the
taxpayer?5. What is our long-term outlook?

FIRST:The Required State of
Indiana Budget Forms and Related Budget Documents

DLGF’s State Budget Forms for 2018
Form 1 – Detail of AppropriationsForm 2 – Projected RevenuesForm 3 – Summary Totals of Appropriations and
Levies Form 4A – Another Summary of AppropriationsForm 4B – Calculation of LeviesRequired Supporting Documents:
• Current Year Worksheets• Debt Service Worksheets• CPF and Bus Replacement Plans

“Advertised” and “Actual”The
“Advertised” Budget
• Required format• Required forms• Rates, levies, calculations
pre-ordained or strongly recommended because of statutory process and state level oversight/direction
The “Actual” Budget • Anticipated revenues
based on formulas and laws
• Anticipated expenditures based on continuing contracts and other obligations
Projections!

DISCLAIMER: THE ESTIMATED EXPENDITURES, PROJECTIONS OF COSTS, TAX RATES, LEVIES, ANDAPPROPRIATIONS, AND ALL OTHER INFORMATION AND DATA PRESENTED HEREIN ARE INTENDED FOR INFORMATIONAL OR ANALYTICAL USE ONLY AND MAY NOT BE USED FOR ANY OTHER PURPOSE. THE STATE FORMS SHOWN IN THE OFFICIAL BUDGET (STATE FORMS 1 THROUGH 4B, THE CAPITAL PROJECTS PLAN, THE BUS REPLACEMENT PLAN, AND ALL OTHER STATE REQUIRED RELATED DOCUMENTS) CONSTITUTE THE OFFICIAL 2018 BUDGET OF THE ZIONSVILLE COMMUNITY SCHOOLS.
DIFFERENCES BETWEEN THE AMOUNTS SHOWN ON THE OFFICIAL STATE FORMS AND DOCUMENTS AND ITEMS IN THIS PRESENTATION, IF ANY, ARE SPECULATIVE, BASED ON ASSUMPTIONS ABOUT CERTAIN FUTURE EVENTS, AND CANNOT BE CONSTRUED AS CONTRADICTIONS OF OR DISCREPANCIES IN OR WITH THE OFFICIAL BUDGET.
FURTHER, THE PROJECTIONS AND ESTIMATES SHOWN, WHILE BASED ON THE MOST CURRENT INFORMATION AVAILABLE AT THE TIME OF THEIR FORMULATION, ARE SUBJECT TO UNKNOWN OR UNEXPECTED EVENTS AND CONTINGENCIES AT ANY TIME DURING THE BUDGET YEAR.
THE ACTUAL FINANCIAL RESULTS ACHIEVED MAY THEREFORE BE MATERIALLY DIFFERENT FROM THE PROJECTIONS AND ESTIMATES SHOWN.
About those Projections:The Purpose of our projections is to inform the Board that in our opinion:If the Board adopts “X”, the result will
be “Y.”“Y” may not always be the result we would like, but “X” has been carefully formulated to yield the optimum “Y”
we can achieve from the state’s budget process.

2018 BUDGET:REVENUES
How much revenue will we have? What are the
sources of our revenues?

$0
$2,500,000
$5,000,000
$7,500,000
$10,000,000
$12,500,000
$15,000,000
$17,500,000
$20,000,000
$22,500,000
$25,000,000
$27,500,000
$30,000,000
$32,500,000
$35,000,000
$37,500,000
$40,000,000
$42,500,000
$45,000,000
2018 Projected Revenues by Fund and Source
State Aid
Property Taxes
Excise & FIT
Other
REVENUES
Stat
e Ai
d
Prop
erty
Tax
es

REVENUES4,000
4,200
4,400
4,600
4,800
5,000
5,200
5,400
5,600
5,800
6,000
6,200
6,400
6,600
6,800
7,000
7,200
7,400
$4,000
$4,200
$4,400
$4,600
$4,800
$5,000
$5,200
$5,400
$5,600
$5,800
$6,000
$6,200
$6,400
$6,600
$6,800
$7,000
$7,200
$7,400
2003 2004 2005 2006 2007 2008 2009 2010 2011 2012 2013 2014 2015 2016 2017 2018 2019
Zionsville Community SchoolsGeneral Fund
Base Per Pupil Funding vs. Enrollment

$5,745.68
$5,695.68
$5,386.69
$5,311.09
$5,170.51
$5,117.71
$5,044.00
$4,960.82
$5,046.00
$5,153.00
$5,315.00
$5,394.00
$4,800
$5,000
$5,200
$5,400
$5,600
$5,800
2008 2009 2010 2011 2012 2013 2014 2015 2016 2017 2018 2019
Zionsville Community SchoolsPer Pupil Funding
Actual 2008 to 2017 with Estimated 2018 and 2019

$3,800
$4,000
$4,200
$4,400
$4,600
$4,800
$5,000
$5,200
$5,400
$5,600
$5,800
$6,000
2008 2009 2010 2011 2012 2013 2014 2015 2016 2017 2018 2019
Zionsville Community SchoolsPer Pupil Funding in Constant Dollars
(Adjusted for inflation to 2008)Compared to Actual Funding
Per Pupil Funding ‐ Actual
Inflation Adjusted to 2008 dollars

REVENUES
$4,000
$4,200
$4,400
$4,600
$4,800
$5,000
$5,200
$5,400
$5,600
$5,800
$6,000
$6,200
$6,400
$6,600
$6,800
$7,000
$7,200
$7,400
$7,600
$7,800
$8,000
2011 2012 2013 2014 2015 2016 2017 2018 2019
Zionsville Community SchoolsGeneral Fund Per Pupil Funding
ZCS vs. State Average vs. Highest Funded
Zionsville State Average Highest Funded School Corp

0.0%
10.0%
20.0%
30.0%
40.0%
50.0%
60.0%
70.0%
80.0%
90.0%
100.0%Free/Reduced Lunch Percentages
- Highest and Lowest in Indiana
ZCS
State Average
Carmel
HSE
Muncie
Gary
East Chi
IPS
Ft. Wayne
Westfield
SW Allen
Avon
Brownsburg

$4,000
$4,200
$4,400
$4,600
$4,800
$5,000
$5,200
$5,400
$5,600
$5,800
$6,000
$6,200
$6,400
$6,600
$6,800
$7,000
$7,200
$7,400
$7,600
$7,800
$8,000
2011 2012 2013 2014 2015 2016 2017 2018 2019
Zionsville Community SchoolsGeneral Fund Per Pupil Funding
ZCS vs. State Average vs. Highest Funded
Zionsville State Average Highest Funded School Corp REVENUES
$7,534
$5,394
THE GAP!By 2019 the
difference is $2,140 per pupil.This will be over $15 million for our entire
2019 enrollment.

June 2016

Higher Growth SeriesActual Projected
Grade 2013-14 2014-15 2015-16 2016-17 2017-18 2018-19 2019-20 2020-21 2021-22 2022-23 2023-24 2024-25 2025-26K 408 452 464 473 475 474 489 506 521 535 549 563 5761 454 461 489 512 524 525 524 542 560 576 591 606 6222 457 483 491 518 545 557 558 557 577 595 613 628 6453 478 479 509 515 542 574 586 587 586 606 625 645 6604 498 499 502 532 538 566 601 613 614 613 634 655 675
Sub-Total 2,295 2,374 2,455 2,550 2,624 2,696 2,758 2,805 2,858 2,925 3,012 3,097 3,178# Change 68 79 81 95 74 72 62 47 53 67 87 85 81% Change 3.1% 3.4% 3.4% 3.9% 2.9% 2.7% 2.3% 1.7% 1.9% 2.3% 3.0% 2.8% 2.6%
5 473 519 513 519 550 557 589 613 625 628 627 647 6686 466 480 547 530 534 566 572 604 629 639 642 641 6637 486 490 504 572 556 559 593 599 633 660 670 673 6728 511 496 488 508 581 566 570 604 611 646 672 682 685
Sub-Total 1,936 1,985 2,052 2,129 2,221 2,248 2,324 2,420 2,498 2,573 2,611 2,643 2,688# Change -6 44 27 77 92 27 76 96 78 75 38 32 45% Change -0.6% 4.6% 2.7% 3.8% 4.3% 1.2% 3.4% 4.1% 3.2% 3.0% 1.5% 1.2% 1.7%
9 457 487 497 481 502 576 562 566 600 607 642 667 67710 460 459 491 499 483 505 580 566 570 604 611 646 67111 435 459 471 496 502 485 505 580 566 570 604 611 64612 452 418 452 464 492 501 488 508 584 569 573 608 615
Sub-Total 1,804 1,823 1,911 1,940 1,979 2,067 2,135 2,220 2,320 2,350 2,430 2,532 2,609# Change -6 44 27 29 39 88 68 85 100 30 80 102 77% Change -0.6% 4.6% 2.7% 1.5% 2.0% 4.4% 3.3% 4.0% 4.5% 1.3% 3.4% 4.2% 3.0%
Total Enrollment 6,035 6,182 6,418 6,619 6,824 7,011 7,217 7,445 7,676 7,848 8,053 8,272 8,475# Change 113 147 236 201 205 187 206 228 231 172 205 219 203% Change 1.9% 2.4% 3.8% 3.1% 3.1% 2.7% 2.9% 3.2% 3.1% 2.2% 2.6% 2.7% 2.5%
ZCS Enrollment Projections, Final Results, June 2016
Projection for 2016-2017 school year was off by 7!
Cumulative Projection
for 2017-2018 school year was off by
26!

0
1,000
2,000
3,000
4,000
5,000
6,000
7,000
8,000
9,000
1996 1997 1998 1999 2000 2001 2002 2003 2004 2005 2006 2007 2008 2009 2010 2011 2012 2013 2014 2015 2016 2017 2018 2019 2020 2021 2022 2023 2024 2025
ZCS ENROLLMENTS - HISTORICAL and PROJECTED
2018 BUDGET:EXPENDITURES
How much will we spend and on what will we spend it?

$0
$2,500,000
$5,000,000
$7,500,000
$10,000,000
$12,500,000
$15,000,000
$17,500,000
$20,000,000
$22,500,000
$25,000,000
$27,500,000
$30,000,000
$32,500,000
$35,000,000
$37,500,000
$40,000,000
$42,500,000
$45,000,000
2018 Projected Expenditures By Fund and Category
Teacher Salaries & Benefits
Other Salaries & Benefits
Spec Ed Services & Co‐ops
Custodial Services
Purchased Services
Debt Service
Utilities & Property Ins
Capital Outlays
Supplies & Materials
Other
Teac
hers
Staf
f
Deb
t Ser
vice
Teac
hers
Proposed Expenditures
Utilities

56.4%26.3%
3.5%
3.6%
3.2%2.4%
4.2% 0.0%
2018 General Fund Estimated Expenditures
Teacher Salaries & Benefits
Other Salaries & Benefits
Spec Ed Services & Co-ops
Custodial Services
Purchased Services
Supplies & Materials
Utilities & Property Ins
Other
All Non-Teaching Staff Salaries and Benefits
Teachers’ Salaries and Benefits
But See Next 2 Slides!!!

100% of Referendum Fund will be used for teacher salaries and benefits!
These are direct instructional costs!
Proposed Expenditures

62.4%
22.7%
3.0%
3.1%
2.7%2.3%
3.6% 0.0%
2018 Combined General Fund and Referendum Fund Estimated Expenditures
Teacher Salaries &Benefits
Other Salaries & Benefits
Spec Ed Services & Co-ops
Custodial Services
Purchased Services
Supplies & Materials
Utilities & Property Ins
Other
Teachers’ Salaries and Benefits
Proposed Expenditures
Instruction 75.15%Maintenance and Utilities 11.25%Adminstration and Clerical 11.78%Other 1.82%
Total 100.00%
Operational Expenditures
$‐
$100,000
$200,000
$300,000
$400,000
$500,000
$600,000
$700,000
$800,000
$900,000
$1,000,000
$1,100,000
$1,200,000
$1,300,000
$1,400,000
$1,500,000
$1,600,000
$1,700,000
$1,800,000
$1,900,000
$2,000,000
2009 2010 2011 2012 2013 2014 2015 2016 2017
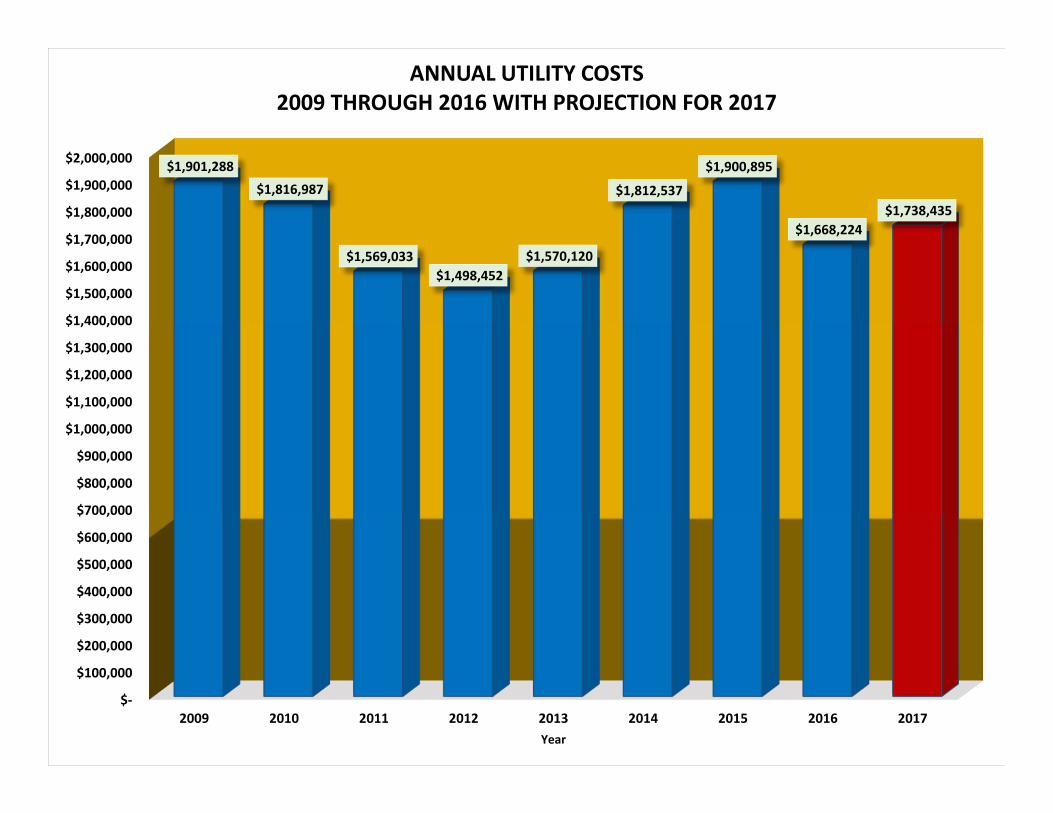
$1,901,288
$1,816,987
$1,569,033 $1,498,452
$1,570,120
$1,812,537
$1,900,895
$1,668,224 $1,738,435
Year
ANNUAL UTILITY COSTS2009 THROUGH 2016 WITH PROJECTION FOR 2017

Proposed Expenditures
Scheduled ScheduledPrincipal Projected Principal Projected
Total Principal Total Principal TotalOutstanding to be Paid Outstanding to be Paid OutstandingDebt as of 7/1/2017 to Debt as of 1/1/2018 to Debt as of06/30/17 12/31/17 12/31/17 12/31/18 12/31/18
General Obligation Bonds:Refunding Pension Bond of 2013 4,585,000.00$ 270,000.00$ 4,315,000.00$ 545,000.00$ 3,770,000.00$ General Obligation Bond of 2017A 1,915,000.00$ -$ 1,915,000.00$ 470,000.00$ 1,445,000.00$ General Obligation Bond of 2017B 1,975,000.00$ -$ 1,975,000.00$ 505,000.00$ 1,470,000.00$
Subtotals - General Obligation Bonds 8,475,000.00$ 270,000.00$ 8,205,000.00$ 1,520,000.00$ 6,685,000.00$
Lease-Rental Bonds:Lease Rental of 1999 CABS 2,661,989.10$ -$ 2,661,989.10$ -$ 2,661,989.10$ Lease Rental of 2000 CABS 109,848.50$ 109,848.50$ -$ -$ -$ Lease Rental of 2002 CABS 5,501,137.90$ 450,978.00$ 5,050,159.90$ 863,486.70$ 4,186,673.20$ Lease Rental of 2003Z CABS 1,127,853.00$ -$ 1,127,853.00$ -$ 1,127,853.00$ Lease Rental of 2005Z 3,650,054.40$ -$ 3,650,054.40$ -$ 3,650,054.40$ Refunding of 2005 215,000.00$ 215,000.00$ -$ -$ -$ Refunding of 2007 19,405,000.00$ 1,315,000.00$ 18,090,000.00$ 2,735,000.00$ 15,355,000.00$ Refunding of 2009 3,015,000.00$ 1,495,000.00$ 1,520,000.00$ 1,520,000.00$ -$ Refunding of 2011 7,610,000.00$ 1,415,000.00$ 6,195,000.00$ 2,915,000.00$ 3,280,000.00$ Refunding of 2012A 4,020,341.55$ -$ 4,020,341.55$ -$ 4,020,341.55$ Refunding of 2012B 4,749,475.95$ -$ 4,749,475.95$ -$ 4,749,475.95$ Refunding of 2014A 795,000.00$ 5,000.00$ 790,000.00$ 10,000.00$ 780,000.00$ Refunding of 2014B 87,200,000.00$ 1,530,000.00$ 85,670,000.00$ 5,780,000.00$ 79,890,000.00$
Subtotal - Lease-Rental Bonds 140,060,700.40$ 6,535,826.50$ 133,524,873.90$ 13,823,486.70$ 119,701,387.20$
TOTAL LONG-TERM DEBT 148,535,700.40$ 6,805,826.50$ 141,729,873.90$ 15,343,486.70$ 126,386,387.20$
Zionsville Community SchoolsSummary of Debt
As of June 30, 2017 and for 2018 Budget Year

$-
$25,000,000
$50,000,000
$75,000,000
$100,000,000
$125,000,000
$150,000,000
$175,000,000
$200,000,000
$225,000,000
$250,000,000
$275,000,000LONG-TERM BOND DEBT BALANCE

20.6% Utilities & Insurance
33.4%Tech Dept. Salaries and Benefits
13.8%ContractedServices
32.0% Building
Maintenance
Estimated Expenditures

83.4%
1.6%
9.4%
4.3% 0.9%0.3%
Estimated Expenditures
TRANSPORTATION FUND EXPENDITURES
83.4%Salaries and Benefits
9.4%Fuel, Tires, Parts, etc.

0
1
2
3
4
5
6
7
8
9
10
2018 2019 2020 2021 2022 2023 2024 2025 2026 2027 2028 2029
Num
ber o
f Buses to
be Re
placed
2018 Bus Replacement PlanBuses to be Replaced
Chart is per official plan. Actual expected 2018 purchases will be two Type “D” buses and perhaps
one Type “A” bus.
Estimated Expenditures

2018 BUDGET:CASH FLOWS ANDCASH BALANCESWill our budget be balanced?

Projected Projected ProjectedCalendar Calendar School
Year Year Year2018 2019 2018-2019
Revenues:
General Fund 43,175,216$ 44,451,086$ 43,813,151$ Debt Service Funds (Combined) 20,684,727$ 21,494,731$ 21,089,729$ Capital Projects 4,643,063$ 4,782,355$ 4,712,709$ Transportation 3,817,265$ 3,931,783$ 3,874,524$ Bus Replacement 235,798$ 242,872$ 239,335$ Referendum Fund 6,906,172$ 7,211,425$ 7,058,799$ Rainy Day Fund 2,000$ 2,000$ 2,000$
Total Revenues 79,464,241$ 82,116,252$ 80,790,247$
ZIONSVILLE COMMUNITY SCHOOLSPROJECTED REVENUES
FOR 2018, 2019 and 2018‐2019 School Year

Expenditures
General Fund 43,118,834$ 44,455,518$ 43,787,176$ Debt Service Funds (Combined) 21,586,728$ 21,338,400$ 21,089,729$ Capital Projects 4,490,000$ 4,629,190$ 4,559,595$ Transportation 3,805,038$ 3,919,189$ 3,862,114$ Bus Replacement 226,908$ 221,302$ 224,105$ Referendum Fund 6,899,082$ 7,104,022$ 7,001,552$ Rainy Day Fund -$ -$ -$
Total Expenditures 80,126,590$ 81,667,621$ 80,524,271$
Net Combined Fund Surplus (Deficit) (662,349)$ 448,632$ 265,976$
FOR 2018, 2019 and 2018‐2019 School YearPROJECTED EXPENDITURES AND NET CHANGE TO FUND BALANCES
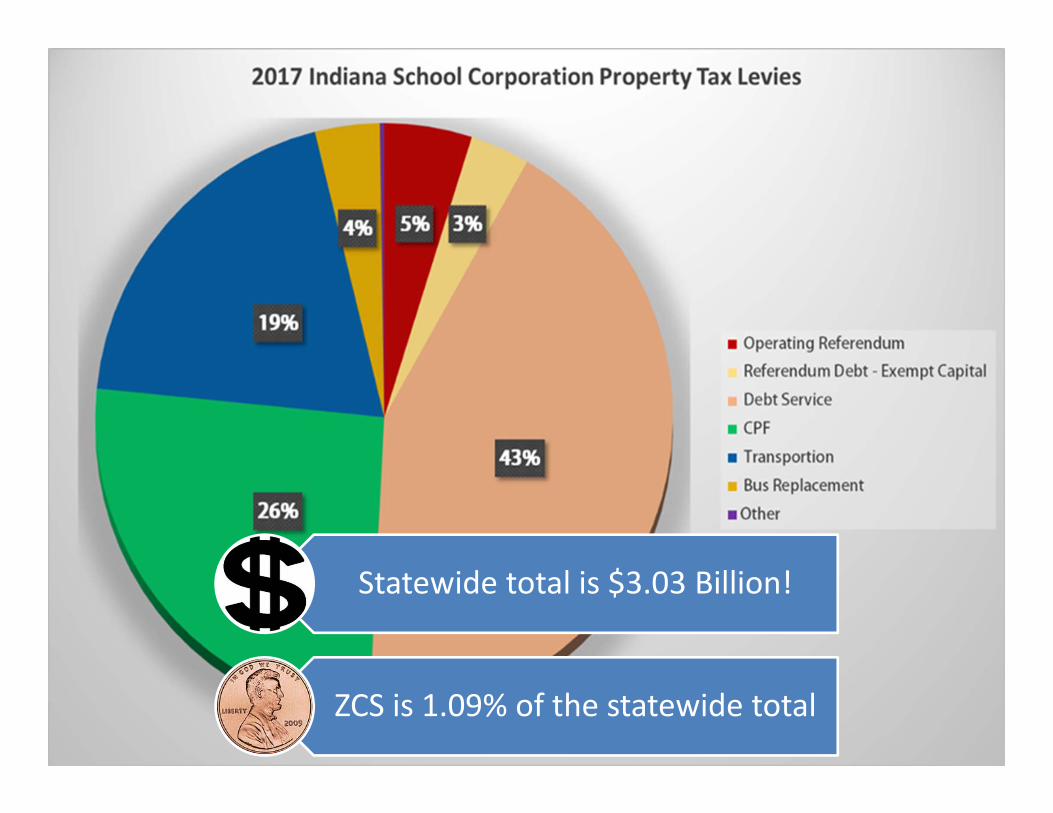
Statewide total is $3.03 Billion!
ZCS is 1.09% of the statewide total


$‐
$0.2000
$0.4000
$0.6000
$0.8000
$1.0000
$1.2000
$1.4000
$1.6000
Actual 2013 Rate Actual 2014 Rate Actual 2015 Rate Actual 2016 Actual 2016
Actual Tax Rates ‐ 2013 to 2017
Referendum Fund Bus Replacement Fund
Transportation Fund Capital Projects Fund
Pension Bond Debt Service Fund Debt Service Fund
2013 2014 2015 2016 2017

2015 Local property tax rates compared with peer communities
Rank Locality2014-Pay-2015
Tax Rate
1 Kokomo 3.8180$ 2 Sheridan 3.4828$ 3 Avon 3.1034$ 4 Noblesville 3.0721$ 5 Westfield 3.0430$ 6 IPS 2.9210$ 7 Brownsburg 2.9026$ 8 MSD Wayne Twp 2.8919$ 9 MSD Washington Twp 2.8702$ 10 MSD Pike Township 2.8603$ 11 Clark-Pleasant 2.8585$ 12 West Lafayette 2.7786$ 13 Lafayette 2.5518$ 14 Tippecanoe 2.4153$ 15 Lebanon 2.2878$ 16 Zionsville 2.2542$ 17 HSE 2.1505$ 18 Center Grove 2.0792$ 19 Carmel 2.0053$ 20 MSD SW Allen 1.9336$

2016 Local property tax rates compared with peer communities
Rank Locality2015-Pay-2016
Tax Rate
1 Sheridan 3.2785$ 2 IPS 3.0273$ 3 MSD Wayne Twp 2.9963$ 4 Avon 2.9810$ 5 MSD Washington Twp 2.9764$ 6 MSD Pike Township 2.9643$ 7 Westfield 2.8546$ 8 Kokomo 2.8332$ 9 Brownsburg 2.8170$ 10 Clark-Pleasant 2.8035$ 11 West Lafayette 2.7835$ 12 Noblesville 2.7811$ 13 Tippecanoe 2.4796$ 14 Lafayette 2.4278$ 15 Lebanon 2.1388$ 16 Zionsville 2.1382$ 17 HSE 2.1380$ 18 Center Grove 2.0818$ 19 Carmel 2.0706$ 20 MSD SW Allen 1.8945$

2017 Local property tax rates compared with peer communities
Rank Locality2016-Pay-2017
Tax Rate
1 Kokomo 3.8342$ 2 Sheridan 3.0743$ 3 Avon 3.0545$ 4 Clark-Pleasant 2.9979$ 5 Westfield 2.8383$ 6 Brownsburg 2.8014$ 7 Noblesville 2.7678$ 8 West Lafayette 2.7224$ 9 IPS 2.6127$ 10 MSD Wayne Twp 2.5830$ 11 MSD Washington Twp 2.5609$ 12 MSD Pike Township 2.5508$ 13 Lafayette 2.5463$ 14 Tippecanoe 2.4641$ 15 HSE 2.2647$ 16 Lebanon 2.2201$ 17 Center Grove 2.1250$ 18 Zionsville 2.0946$ 19 Carmel 2.0486$ 20 MSD SW Allen 1.8945$


$0
$500,000,000
$1,000,000,000
$1,500,000,000
$2,000,000,000
$2,500,000,000
$3,000,000,000
201820172016201520142013
$2,731,652,551$2,535,262,178
$2,408,540,759$2,200,072,446
$2,035,144,645$1,971,825,220
$268,121,052$264,459,818
$215,985,841$165,345,760
$156,997,358$155,403,413
ZCS Assessed Values
Base AV TIF AV

14.13% Decrease in School Tax Rate
drove entire bill down almost 10%!

For 2016The Additional Decrease in Our Tax Rate Dropped the
Bill Another $458!2016 School Tax Total is $1,654 Less than in 2014

For 2017:A NEW PICTURE
ANDA NEW TAX BILL!

For 20172017 School Tax Total is $1,667 Less than in 2014
2017 TOTAL TAX BILL IS $2,109 LESS
THAN 2014 BILL

2018 UPDATE:We are sustaining rates at a level 30 cents below the
2014 rate.Further, this tax rate level of about $1.30 can be maintained for the next decade and beyond.

$‐ $0.1000 $0.2000 $0.3000 $0.4000 $0.5000 $0.6000 $0.7000 $0.8000 $0.9000 $1.0000 $1.1000 $1.2000 $1.3000 $1.4000 $1.5000 $1.6000 $1.7000
Combine
d Tax Ra
tes for A
ll Fu
nds
Year
School Property Tax Rates: Actual 2013 to 2017
Projected 2018 to 2035

$-
$250,000
$500,000
$750,000
$1,000,000
$1,250,000
$1,500,000
$1,750,000
$2,000,000
$2,250,000
$2,500,000
$2,750,000
$3,000,000
$3,250,000
$3,500,000
$3,750,000
$4,000,000
2010 2011 2012 2013 2014 2015 2016 2017
Circuit Breaker CreditsActual 2010 - 2015
Projected 2016-2017
Total Losses = $18.4 Million!

$-
$500,000
$1,000,000
$1,500,000
$2,000,000
$2,500,000
$3,000,000
$3,500,000
$4,000,000
ZCS Zionsville Boone County H-M MemLibrary
Whitestown
Circuit Breaker/Tax Cap Losses 2014 to 2017
2014201520162017

2018 BUDGET PRESENTATION SUMMARY:The five questions about the proposed budget:
1. How much would we actually spend and what will we spend it on? An estimated $80.1 million will be expended.
2. What revenues and resources will we have to support the needed expenditures? All combined, revenues should be about $79.4 million, which will be made up of approximately 52% State Funding, 43% Property Taxes, and 5% Other Sources.
3. Will our budget be balanced? We expect the General Fund to be balanced . The Debt Service Fund will adjust its cash balance slightly, proportionate to savings from the refinancing of the 2005 bonds. All other funds will be balanced.
4. What does all this mean to the taxpayer? The total property tax bill for 2018 should be the same as in the past several years for nearly all homeowners. Rental and agricultural property, and commercial property, likely will see either no change or a tiny decrease.
5. What is our long-term outlook? Our outlook is fair. Our General Fund’s financial position remains dependent on continued continuity in future versions of the state funding formula. The overall property tax rate,whichsupports our other funds, is expected to remain steady at around $1.30 for the forseeable future. The long-term effects of the upcoming fund restructuring in 2019 are not yet known.

Thank You for Your Kind Attention!

Public Comments
Board of School Trustees

Adjournment
Board of School TrusteesNext Public Board Meeting:
Monday, October 23, 2017 6:00 PM

55

56