october 26, 2015 cumulative effects of amendment 31 regulations upon effective effort impacting sea...
TRANSCRIPT
April 20, 2023
Cumulative effects of Amendment 31 regulations upon effective effort impacting sea turtle takes in the Gulf of Mexico reef fish bottom longline fishery
Dr. Nick Farmer & Andy Strelcheck
Southeast Regional Office
St. Petersburg, Florida
Preliminary Results –
Pending SEFSC Review
Tab B, No. 4(d)ii

2
Introduction
Action 1: Allow or disallow squid bait in the bottom longline reef fish fishery
Action 2: Restrict the use of bottom longline gear for reef fish in the eastern Gulf of Mexico
Action 3: Longline endorsements to fish East of Cape San Blas
Action 4: Modify fishing practices and gear
Amendment 31: Reduce sea turtle interactions with reef fish bottom longline gear
www.noaanews.noaa.gov

3
Introduction
GOAL:
To evaluate the impacts of endorsement and depth/time closure alternatives proposed in A31 upon ‘effective effort’ in the reef fish bottom longline fisheryWWW.NETCRUSADERS.COM
www.noaanews.noaa.govwww.abcnews.com

4
Methods and Results
• Data: Commercial logbook (SEFSC Miami)
—2007-2008
—Total Hooks = Sets * Hooks/Set
*(Johnson et al. 1999, Richards 2006, Walsh and Garrison 2006, SEFSC 2007, SEFSC 2009)
• ‘Effective Effort’—Accounts for probability of sea turtle encounter by depth
contour by scaling effort (‘hooks’) to population density
—Reduced Hooks Reduced Sea Turtle Bycatch» Common assumption in sea turtle bycatch studies*
WWW.TAMPABAY.COM

5
Trip Elimination*
• Following SEFSC (2009)
• Eastern Gulf of Mexico (Areas 1-10)• 1-8 directly impacted by A31
• Gear = Longline
• Total landings aggregated at trip level into three general categories:
1. Reef Fish (50 CFR 622, App. A)
2. Shark3. Other
• Trip Eliminated:— If vessel had Shark permit and >66% landings were sharks— If no managed reef fish species were landed— If obvious effort reporting errors

6
Baseline Effort (2007-2008)
• Baseline = Average (2007-2008)— most recent complete time series available — most accurate depth reporting
• Logbook data summarized by vessel, month, and year— Year and month assigned using date landed
• Only effort in areas 1-8 (e.g., east of Cape San Blas, Florida) will be directly impacted by Amendment 31— Baseline effort in areas 9-10 (~1 million hooks) removed — Added back into grand totals as a constant

7
Baseline Effort (2007-2008)Reported ‘Depth Fished’
Total baseline effort = 28,762 thousand hooks
Note ‘unknown’ depth and effort from 1-20 fathoms
Depth (fathoms)
Jan Feb Mar Apr May Jun Jul Aug Sep Oct Nov Dec TOTAL
0-20 170 296 121 171 76 104 149 103 163 78 79 104 1,614
20-35 770 651 502 1,196 1,294 1,809 1,973 1,459 1,295 1,459 1,172 1,449 15,030
35-50 190 101 54 165 274 522 441 491 514 384 489 443 4,069
50+ 1,082 1,155 1,416 986 1,208 202 74 147 118 134 395 117 7,034
n/a 18 0 0 0 0 0 0 0 0 0 0 0 18Areas9-10 150 221 224 207 58 16 0 25 18 30 29 19 997
TOTAL 2,381 2,424 2,317 2,725 2,909 2,653 2,638 2,226 2,108 2,085 2,164 2,133 28,762
See Table 1A, p. 9

8
Misreported ‘Depth Fished’
• Amendment 31, Action 2 establishes seasonal closures along bathymetric contours
• Accuracy of reported ‘Depth Fished (ft)’ important
— Deepest depth retained for trip level summary
• Reef fish bottom longline prohibited <20 fathoms
• Approximately 6% effort reported in depths <20 fathoms
— Obvious monthly trends by vessels reporting depths in fathoms were adjusted
— Also adjusted by comparing species composition and area fished with similar, accurately reported trips by same vessel

9
Baseline Effort (2007-2008)Adjusted ‘Depth Fished’
Total baseline effort = 28,762 thousand hooks
Depth (fathoms)
Jan Feb Mar Apr May Jun Jul Aug Sep Oct Nov Dec TOTAL
20-35 823 870 518 1,366 1,336 1,905 2,072 1,562 1,429 1,538 1,234 1,534 16,188
35-50 190 101 54 165 274 522 471 491 542 384 492 463 4,150
50+ 1,217 1,233 1,521 987 1,241 210 95 147 118 134 409 117 7,428
Areas9-10 150 221 224 207 58 16 0 25 18 30 29 19 997
TOTAL 2,381 2,424 2,317 2,725 2,909 2,653 2,638 2,226 2,108 2,085 2,164 2,133 28,762
See Table 1C, p. 9

10
0
100
200
300
400
500
600
0 10 20 30 40 50 60 70 80 90 100 110 120
Depth of Fishing (fathoms)
Num
ber o
f Tri
psadjustedreportedReef Fish
Longline Fishing
Prohibited

11
Amendment 31: Action 2 (Depth/Time Closure)
35 fathom closure
•June - August
•April – August
•Annual
Effort from 20-35 fathoms scaled down before being added to the existing effort in 35-50 fathoms
Sea turtle sightings during summer 2007 aerial survey (Garrison 2009)

12
Amendment 31: Action 2 (Depth/Time Closure)
What is the appropriate SCALAR to use for redistributed effort?Garrison (2009)?Winter ratio? (35-50? 50-100? Summer 35-50?)
Depth(Fathoms)
CombinedDensity
CV of Combined Density
95% Confidence Limit
Ratio with 20-35 Fathoms
0 – 20 0.1163 0.1389 0.097 – 0.139 1.747
20 – 35 0.06658 0.4030 0.040 – 0.1098 -
35 – 50 0 - - 050 – 100 0.04237 0.4212 0.0251 – 0.0714 0.636
0 – 20 0.1712 0.1106 0.1485 – 0.1974 2.19420 – 35 0.0781 0.2756 0.0551 – 0.1108 -
35 – 50 0.0231 0.633 0.0109 – 0.04889 0.29650 – 100 0.0128 0.6498 0.0059 – 0.0276 0.164
WIN
TER
SUM
MER
WIN
TER
SUM
MER

13
AssumptionsDepth/Time Closure
1. Movement of fishery from 20-35 to 35-50 fathoms effectively reduces impacts of reef fish bottom longline effort upon sea turtles at a level proportional to ratio of their observed population densities at depth
• Sensitivity runs using confidence interval (13 – 66%) around ratio for ‘Summer 2007’ runs (Summer = Jan-Dec)
• During other runs, Summer = Apr-Sept, Winter = Jan-Mar, Oct-Dec• Garrison (2009): Winter = Jan/Feb, Summer = Jul/Aug
• Impacts of ‘Winter’ assumption only impact annual closure runs
2. Reef fish bottom longline effort from 20-35 fathoms will not move deeper than 50 fathoms (due to DWG quota) during closure
3. Not all effort may shift from 20-35 fathoms to deeper water during closure; some vessels may simply not fish
• Various levels of effort shifting examined (100%, 75%, 50%)
14
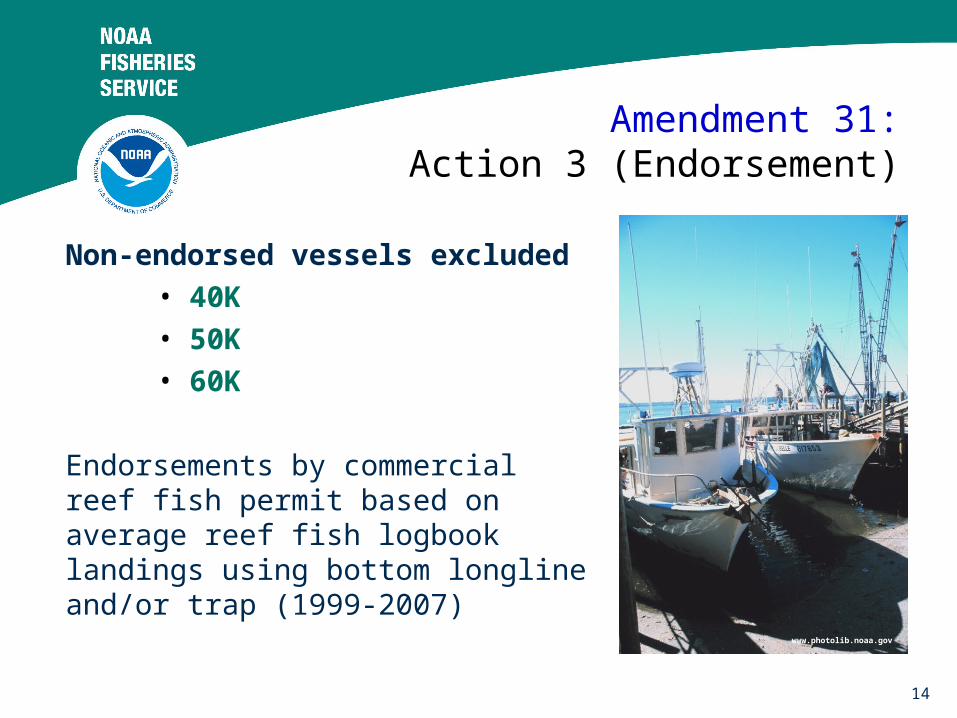
Amendment 31:Action 3 (Endorsement)
Non-endorsed vessels excluded• 40K• 50K• 60K
Endorsements by commercial reef fish permit based on average reef fish logbook landings using bottom longline and/or trap (1999-2007)
www.photolib.noaa.gov
15
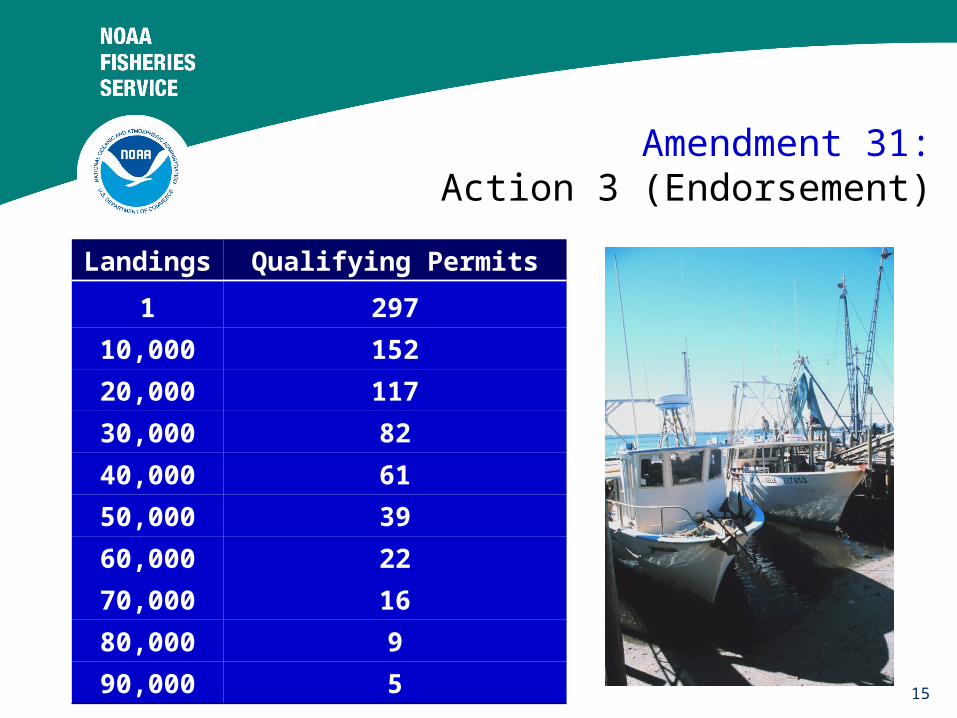
Amendment 31:Action 3 (Endorsement)
Landings Qualifying Permits
1 297
10,000 152
20,000 117
30,000 82
40,000 61
50,000 39
60,000 22
70,000 16
80,000 9
90,000 5

16
50 Fathom Closure
• Evaluated impacts of a closure within 50 fathoms, such as that implemented by the May 18, 2009 Emergency Rule
• All effort within 50 fathoms eliminated
• Assumption:— DWG and tilefish quota,
along with Grouper-Tilefish IFQ, would prohibit any profitable relocation of effort into deeper waters.
Observed longline sets 2006-2008.

17
Increased Effort in the Fishery
• Proposed alternatives in Amendment 31 eliminate vessels from the fishery and reduce fishable waters, but provide no caps on effort by remaining vessels in available waters
• Elimination of competition may provide opportunities for increased landings (and possibly increased effort)
• Changes in fishing behavior are influenced by a variety of factors that are difficult to predict and quantify
• GOAL: To evaluate the impacts of Amendment 31 given an increase in effort by endorsed vessels

18
Increased Effort in Fishery: Using 2003 Effort as Proxy
• Year of highest overall effort in reef fish bottom longline fishery (1999-2007) was 2003
• Effort in 2003 (by vessel) ~ Proxy for increased effort—Effort (2003) partitioned by depth following baseline (2007-
2008) by vessel, by month
• Trap prohibition did not go into effect until Feb 2007—Trap-endorsed vessels assigned effort from 2008
• Some vessels that fished in 2007-2008 did not fish in 2003—Effort remained at 2007-2008 baseline

19
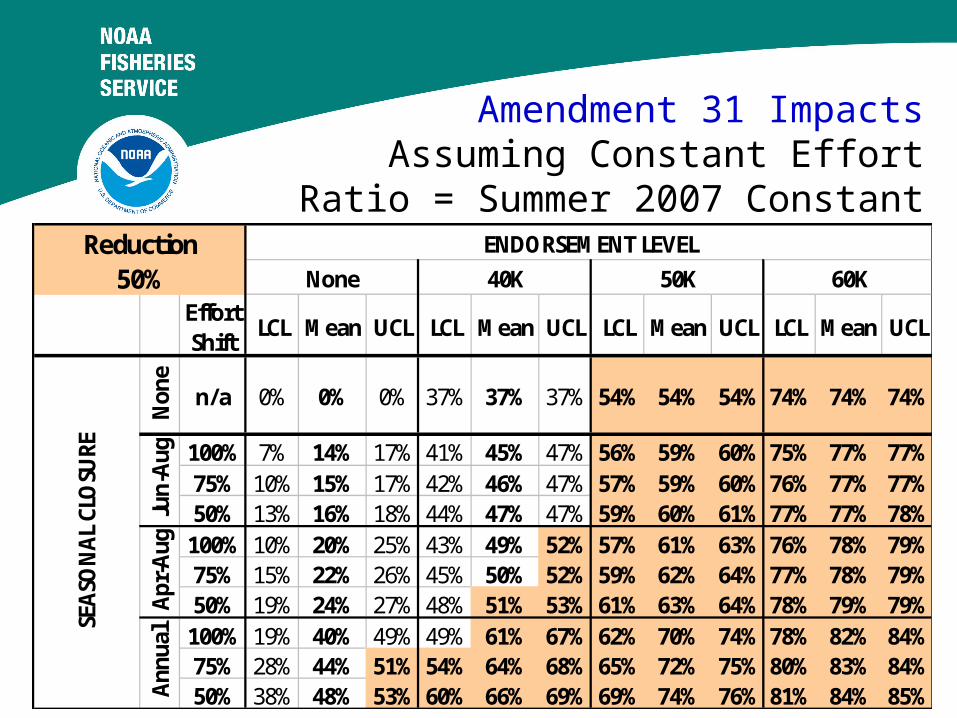
Amendment 31 ImpactsAssuming Constant Effort
Ratio = Summer 2007 Constant
Effort Shift
LCL Mean UCL LCL Mean UCL LCL Mean UCL LCL Mean UCL
100% 7% 14% 17% 41% 45% 47% 56% 59% 60% 75% 77% 77%75% 10% 15% 17% 42% 46% 47% 57% 59% 60% 76% 77% 77%50% 13% 16% 18% 44% 47% 47% 59% 60% 61% 77% 77% 78%
100% 10% 20% 25% 43% 49% 52% 57% 61% 63% 76% 78% 79%75% 15% 22% 26% 45% 50% 52% 59% 62% 64% 77% 78% 79%50% 19% 24% 27% 48% 51% 53% 61% 63% 64% 78% 79% 79%
100% 19% 40% 49% 49% 61% 67% 62% 70% 74% 78% 82% 84%75% 28% 44% 51% 54% 64% 68% 65% 72% 75% 80% 83% 84%50% 38% 48% 53% 60% 66% 69% 69% 74% 76% 81% 84% 85%
Reduction ENDORSEMENT LEVEL40% None 40K 50K 60K
37% 37%
SEAS
ON
AL C
LOSU
RE
Non
e
n/a 0%
Apr-
Aug
Annu
al
74% 74% 74%
Jun-
Aug
37% 54% 54% 54%0% 0%

20
Amendment 31 ImpactsAssuming Increased Effort
Ratio = Summer 2007 Constant
Effort Shift
LCL Mean UCL LCL Mean UCL LCL Mean UCL LCL Mean UCL
100% -27% -16% -12% 23% 30% 33% 45% 49% 50% 68% 70% 71%75% -22% -14% -11% 26% 31% 33% 46% 49% 51% 69% 70% 71%50% -17% -12% -10% 29% 32% 34% 48% 50% 51% 70% 71% 71%
100% -23% -8% -2% 26% 35% 39% 46% 52% 54% 68% 71% 72%75% -16% -5% 0% 30% 37% 40% 49% 53% 55% 70% 72% 73%50% -10% -2% 1% 34% 38% 41% 51% 54% 55% 71% 72% 73%
100% -9% 21% 34% 34% 52% 60% 52% 63% 68% 71% 76% 79%75% 5% 27% 37% 42% 55% 61% 57% 65% 69% 73% 78% 79%50% 18% 33% 39% 50% 59% 63% 62% 67% 70% 76% 79% 80%
Reduction ENDORSEMENT LEVEL40% None 40K 50K 60K
18% 18%
SEAS
ON
AL C
LOSU
RE
Non
e
n/a -36%
Apr-
Aug
Annu
al
66% 66% 66%
Jun-
Aug
18% 41% 41% 41%-36% -36%
21
Amendment 31 ImpactsAssuming Constant Effort
Ratio = Summer 2007 Constant
Effort Shift
LCL Mean UCL LCL Mean UCL LCL Mean UCL LCL Mean UCL
100% 7% 14% 17% 41% 45% 47% 56% 59% 60% 75% 77% 77%75% 10% 15% 17% 42% 46% 47% 57% 59% 60% 76% 77% 77%50% 13% 16% 18% 44% 47% 47% 59% 60% 61% 77% 77% 78%
100% 10% 20% 25% 43% 49% 52% 57% 61% 63% 76% 78% 79%75% 15% 22% 26% 45% 50% 52% 59% 62% 64% 77% 78% 79%50% 19% 24% 27% 48% 51% 53% 61% 63% 64% 78% 79% 79%
100% 19% 40% 49% 49% 61% 67% 62% 70% 74% 78% 82% 84%75% 28% 44% 51% 54% 64% 68% 65% 72% 75% 80% 83% 84%50% 38% 48% 53% 60% 66% 69% 69% 74% 76% 81% 84% 85%
Reduction ENDORSEMENT LEVEL50% None 40K 50K 60K
37% 37%
SEAS
ON
AL C
LOSU
RE
Non
e
n/a 0%
Apr-
Aug
Annu
al
74% 74% 74%
Jun-
Aug
37% 54% 54% 54%0% 0%

22
Effort Shift
LCL Mean UCL LCL Mean UCL LCL Mean UCL LCL Mean UCL
100% -27% -16% -12% 23% 30% 33% 45% 49% 50% 68% 70% 71%75% -22% -14% -11% 26% 31% 33% 46% 49% 51% 69% 70% 71%50% -17% -12% -10% 29% 32% 34% 48% 50% 51% 70% 71% 71%
100% -23% -8% -2% 26% 35% 39% 46% 52% 54% 68% 71% 72%75% -16% -5% 0% 30% 37% 40% 49% 53% 55% 70% 72% 73%50% -10% -2% 1% 34% 38% 41% 51% 54% 55% 71% 72% 73%
100% -9% 21% 34% 34% 52% 60% 52% 63% 68% 71% 76% 79%75% 5% 27% 37% 42% 55% 61% 57% 65% 69% 73% 78% 79%50% 18% 33% 39% 50% 59% 63% 62% 67% 70% 76% 79% 80%
66% 66% 66%
Jun-
Aug
18% 41% 41% 41%-36% -36% 18% 18%
SEAS
ON
AL C
LOSU
RE
Non
e
n/a -36%
Apr-
Aug
Annu
al
Reduction ENDORSEMENT LEVEL50% None 40K 50K 60K
Amendment 31 ImpactsAssuming Increased Effort
Ratio = Summer 2007 Constant

23
Amendment 31 ImpactsAssuming Constant Effort
Ratio = Summer 2007 Constant
Effort Shift
LCL Mean UCL LCL Mean UCL LCL Mean UCL LCL Mean UCL
100% 7% 14% 17% 41% 45% 47% 56% 59% 60% 75% 77% 77%75% 10% 15% 17% 42% 46% 47% 57% 59% 60% 76% 77% 77%50% 13% 16% 18% 44% 47% 47% 59% 60% 61% 77% 77% 78%
100% 10% 20% 25% 43% 49% 52% 57% 61% 63% 76% 78% 79%75% 15% 22% 26% 45% 50% 52% 59% 62% 64% 77% 78% 79%50% 19% 24% 27% 48% 51% 53% 61% 63% 64% 78% 79% 79%
100% 19% 40% 49% 49% 61% 67% 62% 70% 74% 78% 82% 84%75% 28% 44% 51% 54% 64% 68% 65% 72% 75% 80% 83% 84%50% 38% 48% 53% 60% 66% 69% 69% 74% 76% 81% 84% 85%
Reduction ENDORSEMENT LEVEL60% None 40K 50K 60K
37% 37%
SEAS
ON
AL C
LOSU
RE
Non
e
n/a 0%
Apr-
Aug
Annu
al
74% 74% 74%
Jun-
Aug
37% 54% 54% 54%0% 0%

24
Amendment 31 ImpactsAssuming Increased Effort
Ratio = Summer 2007 Constant
Effort Shift
LCL Mean UCL LCL Mean UCL LCL Mean UCL LCL Mean UCL
100% -27% -16% -12% 23% 30% 33% 45% 49% 50% 68% 70% 71%75% -22% -14% -11% 26% 31% 33% 46% 49% 51% 69% 70% 71%50% -17% -12% -10% 29% 32% 34% 48% 50% 51% 70% 71% 71%
100% -23% -8% -2% 26% 35% 39% 46% 52% 54% 68% 71% 72%75% -16% -5% 0% 30% 37% 40% 49% 53% 55% 70% 72% 73%50% -10% -2% 1% 34% 38% 41% 51% 54% 55% 71% 72% 73%
100% -9% 21% 34% 34% 52% 60% 52% 63% 68% 71% 76% 79%75% 5% 27% 37% 42% 55% 61% 57% 65% 69% 73% 78% 79%50% 18% 33% 39% 50% 59% 63% 62% 67% 70% 76% 79% 80%
66% 66% 66%
Jun-
Aug
18% 41% 41% 41%-36% -36% 18% 18%
SEAS
ON
AL C
LOSU
RE
Non
e
n/a -36%
Apr-
Aug
Annu
al
Reduction ENDORSEMENT LEVEL60% None 40K 50K 60K

25
Amendment 31 ImpactsAssuming Constant Effort
None 40K 50K 60KEffort Shift Mean Mean Mean Mean
100% 40% 61% 70% 82%
75% 44% 64% 72% 83%
50% 48% 66% 74% 84%
100% 46% 66% 73% 83%
75% 49% 67% 74% 84%
50% 51% 69% 75% 84%
100% 32% 56% 66% 80%
75% 39% 60% 69% 81%
50% 44% 64% 72% 83%
100% 0% 37% 54% 74%
75% 14% 45% 59% 77%
50% 28% 54% 65% 80%
Reduction Endorsement
50%
W =
0,
S =
0.29
6
An
nu
al C
losu
re
All
= 0.
296
W =
0.6
36,
S =
0.29
6A
ll =
0
Varying “Winter” ratio only impacts
annual closure scenarios
W=“Winter”
S=“Summer”

26
Amendment 31 ImpactsAssuming Increased Effort
None 40K 50K 60KEffort Shift Mean Mean Mean Mean
100% 21% 52% 63% 76%
75% 27% 55% 65% 78%
50% 33% 59% 67% 79%
100% 30% 57% 67% 78%
75% 34% 59% 68% 79%
50% 37% 62% 69% 80%
100% 10% 45% 59% 74%
75% 18% 50% 62% 76%
50% 27% 56% 65% 78%
100% -36% 18% 41% 66%
75% -16% 30% 49% 70%
50% 4% 42% 57% 73%
Reduction Endorsement
50%
W =
0,
S =
0.29
6
An
nu
al C
losu
re
All
= 0.
296
W =
0.6
36,
S =
0.29
6A
ll =
0
Varying “Winter” ratio only impacts
annual closure scenarios
W=“Winter”
S=“Summer”
27
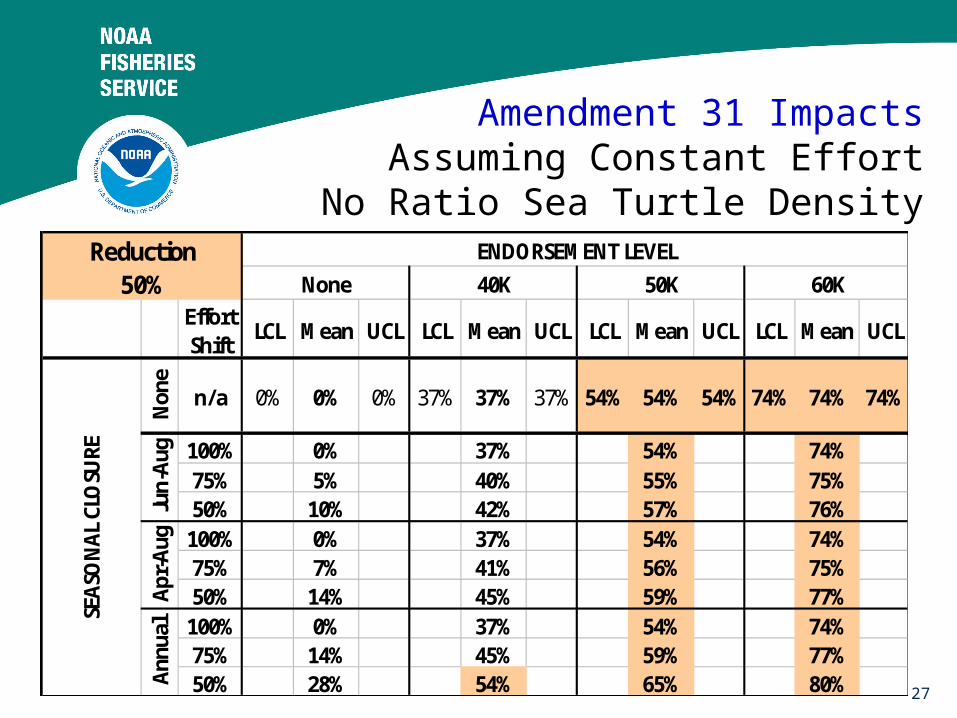
Amendment 31 ImpactsAssuming Constant Effort
No Ratio Sea Turtle Density
Effort Shift
LCL Mean UCL LCL Mean UCL LCL Mean UCL LCL Mean UCL
100% 0% 37% 54% 74%75% 5% 40% 55% 75%50% 10% 42% 57% 76%
100% 0% 37% 54% 74%75% 7% 41% 56% 75%50% 14% 45% 59% 77%
100% 0% 37% 54% 74%75% 14% 45% 59% 77%50% 28% 54% 65% 80%
74% 74% 74%
Jun-
Aug
37% 54% 54% 54%0% 0% 37% 37%
SEAS
ON
AL C
LOSU
RE
Non
e
n/a 0%
Apr-
Aug
Annu
al
Reduction ENDORSEMENT LEVEL50% None 40K 50K 60K

28
Effort Shift
LCL Mean UCL LCL Mean UCL LCL Mean UCL LCL Mean UCL
100% -36% 18% 41% 66%75% -29% 22% 44% 67%50% -22% 26% 46% 69%
100% -36% 18% 41% 66%75% -26% 24% 45% 68%50% -16% 30% 49% 70%
100% -36% 18% 41% 66%75% -16% 30% 49% 70%50% 4% 42% 57% 73%
Reduction ENDORSEMENT LEVEL50% None 40K 50K 60K
18% 18%
SEAS
ON
AL C
LOSU
RE
Non
e
n/a -36%
Apr-
Aug
Annu
al
66% 66% 66%
Jun-
Aug
18% 41% 41% 41%-36% -36%
Amendment 31 ImpactsAssuming Increased Effort
No Ratio Sea Turtle Density

29
Discussion
• Various combinations of Actions 2 and 3 of Amendment 31 may achieve significant reductions in effective effort that impact sea turtle takes by the bottom longline component of the reef fish fishery in the eastern Gulf of Mexico
• As with any model, the outcomes are sensitive to the assumptions
www.answersingenesis.org

30
Assumption: Misreported Depths
were properly adjusted
• Corrected for misreported depths to better reflect effort shifting relative to 35 fathom closure—Few vessels (15%) had potentially
misreported depth
—Even fewer trips (5%) had misreported depths
• Correction probably had little impact upon the overall projected percent reductions
www.captfredsmarineinc.com

31
Assumption: Constant effort in areas 9-10
• Assumed non-endorsed vessels would not relocate longline effort into Areas 9-10—Bottom longline fishing
prohibited < 50 fathoms
—Implementation of the Gulf of Mexico Grouper-Tilefish IFQ program
—Annual quotas for DWG and tilefish have been consistently met in Apr-Jun in recent years

32
Sensitivity Runs
• Sensitivity of model outputs to ratio of sea turtles in 20-35 fathoms versus 35-50 fathoms was investigated using the 95% confidence interval (13-66%) around the mean ratio for ‘Summer 2007’ runs
• Mean variability <5%• Also explored different ratios
– (All = 0, Winter = 0, Winter = 0.636)
• Sensitivity of model outputs to percent of vessels relocating outside 35 fathoms during closure was investigated using effort shifting scalar (100%, 75%, 50%)
• Mean variability <2%
33
Sensitivity Runs
• Variability was surprisingly low, especially for scenarios with longline endorsement criterion—Endorsements removed large amounts of effort from all
areas fished prior to shifting effort from 20-35 fathoms out to 35-50 fathoms during area/season closures
• 40K ~ 37% reduction without closure• 50K ~ 54% reduction without closure• 60K ~ 74% reduction without closure
—Impacts of variability dampened due to effort in 35-50 fathoms prior to redistribution, comparison to large baseline estimate
34
DiscussionIncreasing or Constant Effort?
• Increasing effort —Endorsed longliners will have less competition and
may be able to land more fish to fill market demand
• Constant effort—Several upcoming management actions may prevent
landings (and effort) from increasing in coming years• Reduction in commercial red grouper quota• Reduction in commercial gag grouper quota
35
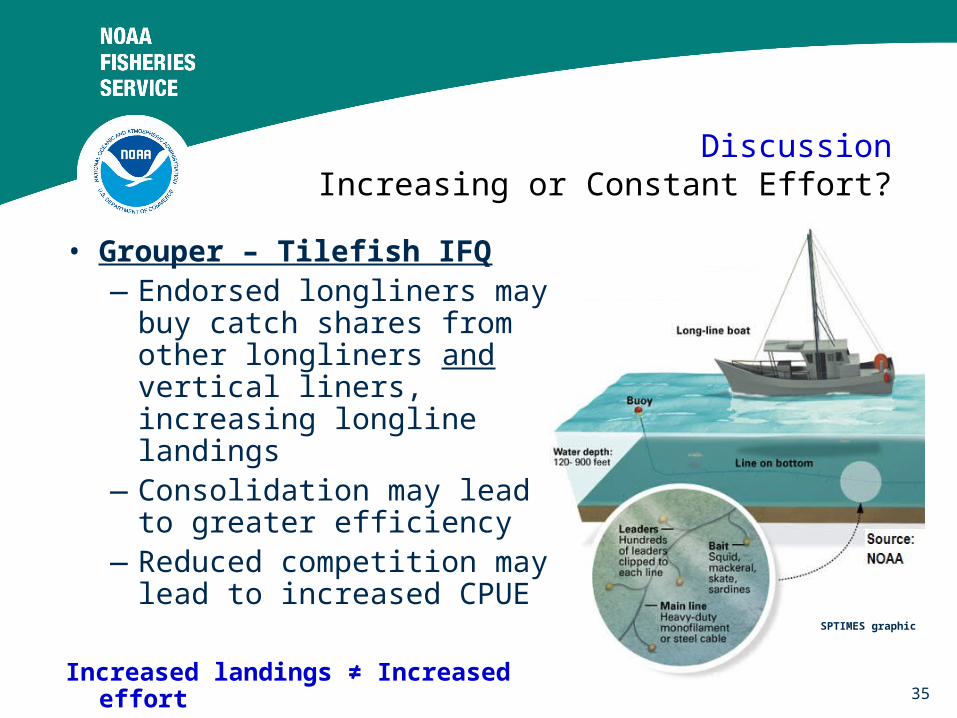
DiscussionIncreasing or Constant Effort?
• Grouper – Tilefish IFQ—Endorsed longliners may buy
catch shares from other longliners and vertical liners, increasing longline landings
—Consolidation may lead to greater efficiency
—Reduced competition may lead to increased CPUE
Increased landings ≠ Increased effortSPTIMES graphic

36
Summary
• Large reductions in effort, and corresponding sea turtle takes, may occur if longline endorsements and area closures are implemented
• Sources of uncertainty are numerous: —Depth of fishing reported—Effort shifting—Sea turtle density estimates—Impacts of quotas reductions upon longline effort—Implementation of the IFQ program

37
Summary
• Endorsements result in greater reductions than summer closures inside 35 fathoms
• Depending upon assumptions: • 40K + Closure 18-51% reduction• 50K + Closure 41-63% reduction• 60K + Closure 56-79% reduction

38
Questions?

39
Misreported ‘Depth Fished’ Obvious reporting in fathoms
• Reef fish longline fishing is prohibited within 20 fathoms• Diagnosing and Correcting Misreported ‘Depth Fished’:
— 18 vessels (~1.6 million hooks) reported fishing <20 fathoms— Maximum depth recorded by each vessel by month examined— If vessel’s maximum reported depth by month <120 ft:
• Assumed vessel reported in fathoms rather than feet that month• Depth = ‘Depth’ * 6• Several vessels reporting abundant shallow water grouper (SWG)
landings closely examined to validate this approach– Majority reported SWG landings between ‘20’ and ‘25’ – Subsequent adjustment to 120-480 ft appeared appropriate
— Adjustment relocated 93% of effort reported within 20 fathoms to deeper waters.
— Assumed maximum depths >120 ft were accurate, as reef fish fishery does not extend far beyond 120 fathoms (720 ft)

40
Misreported ‘Depth Fished’ Vessel-by-Vessel Adjustments
• Diagnosing and Correcting Misreported ‘Depth Fished’: — Ten records (9 vessels; ~0.1 million hooks) remained with
reported fishing depth <20 fathoms— One vessel clearly reported in fathoms Jan ’07 - mid Dec ’08
• Depth = ‘Depth’ * 6
— Two vessels landed snowy grouper (DWG) • Depth = ‘Depth’ * 6
— One vessel never fished >150 ft, and had just completed a fishing trip landing a similar suite of species in 120 ft• Depth = 120 ft
— One vessel misreported in Jan ‘07, mostly fished >50 fathoms • Depth = ‘Depth’ * 6
— Four vessels exhibited no obvious trends in reporting• Depth = ‘Depth’ * 6

41
Using 2003 Effort as Proxy for Increased Effort in Fishery
• Year of highest overall effort in reef fish bottom longline fishery (1999-2007) was 2003
• Effort in 2003 (by vessel) ~ Proxy for increased effort— Monthly vessel effort (2003) partitioned by depth following monthly
percent effort at depth from baseline (2007-2008) — If no fishing during that month (2007-2008), effort from 2003 assigned
‘unknown’ depth— ‘Unknown’ depth by vessel redistributed using aggregated proportional
distribution of effort at depth by month across vessels
• Trap prohibition did not go into effect until Feb 2007— Trap-endorsed vessels assigned effort from 2008
• Some vessels that fished in 2007-2008 did not fish in 2003— Effort remained at 2007-2008 baseline

42
Amendment 31 ImpactsAssuming Increased Effort, No Ratio
50% Effort Shift
No Endorsement 40K 50K 60K
No Closure -36.0% 17.6% 41.3% 65.9%
Jun – Aug(<35 fathoms) -22.1% 26.2% 46.4% 68.7%
Apr – Aug(<35 fathoms) -16.2% 29.8% 48.8% 69.6%
Annual(<35 fathoms) 4.3% 41.8% 56.6% 73.3%

43
Amendment 31 ImpactsAssuming Constant Effort, No Ratio
75% Effort Shift
No Endorsement 40K 50K 60K
No Closure 28,762,333 18,246,076 13,360,727 7,545,380
Jun – Aug(<35 fathoms) 27,377,436 17,411,328 12,829,592 7,255,730
Apr – Aug(<35 fathoms) 26,701,977 16,999,982 12,565,853 7,139,041
Annual(<35 fathoms) 24,715,398 15,724,357 11,676,195 6,720,910

44
Amendment 31 ImpactsAssuming Constant Effort, No Ratio
75% Effort Shift
No Endorsement 40K 50K 60K
No Closure 0.0% 36.6% 53.5% 73.8%
Jun – Aug(<35 fathoms) 4.8% 39.5% 55.4% 74.8%
Apr – Aug(<35 fathoms) 7.2% 40.9% 56.3% 75.2%
Annual(<35 fathoms) 14.1% 45.3% 59.4% 76.6%

45
Amendment 31 ImpactsAssuming Increased Effort, No Ratio
75% Effort Shift
No Endorsement 40K 50K 60K
No Closure 39,115,910 23,707,217 16,895,574 9,802,454
Jun – Aug(<35 fathoms) 37,111,795 22,466,476 16,160,822 9,401,637
Apr – Aug(<35 fathoms) 36,273,352 21,945,849 15,813,663 9,275,148
Annual(<35 fathoms) 33,325,917 20,229,603 14,685,799 8,734,194

46
Amendment 31 ImpactsAssuming Increased Effort, No Ratio
75% Effort Shift
No Endorsement 40K 50K 60K
No Closure -36.0% 17.6% 41.3% 65.9%
Jun – Aug(<35 fathoms) -29.0% 21.9% 43.8% 67.3%
Apr – Aug(<35 fathoms) -26.1% 23.7% 45.0% 67.8%
Annual(<35 fathoms) -15.9% 29.7% 48.9% 69.6%

47
Amendment 31 ImpactsAssuming Constant Effort, No Ratio
50% Effort Shift
No Endorsement 40K 50K 60K
No Closure 28,762,333 18,246,076 13,360,727 7,545,380
Jun – Aug(<35 fathoms) 25,992,538 16,576,581 12,298,457 6,966,080
Apr – Aug(<35 fathoms) 24,641,621 15,753,889 11,770,979 6,732,703
Annual(<35 fathoms) 20,668,464 13,202,638 9,991,663 5,896,440
48
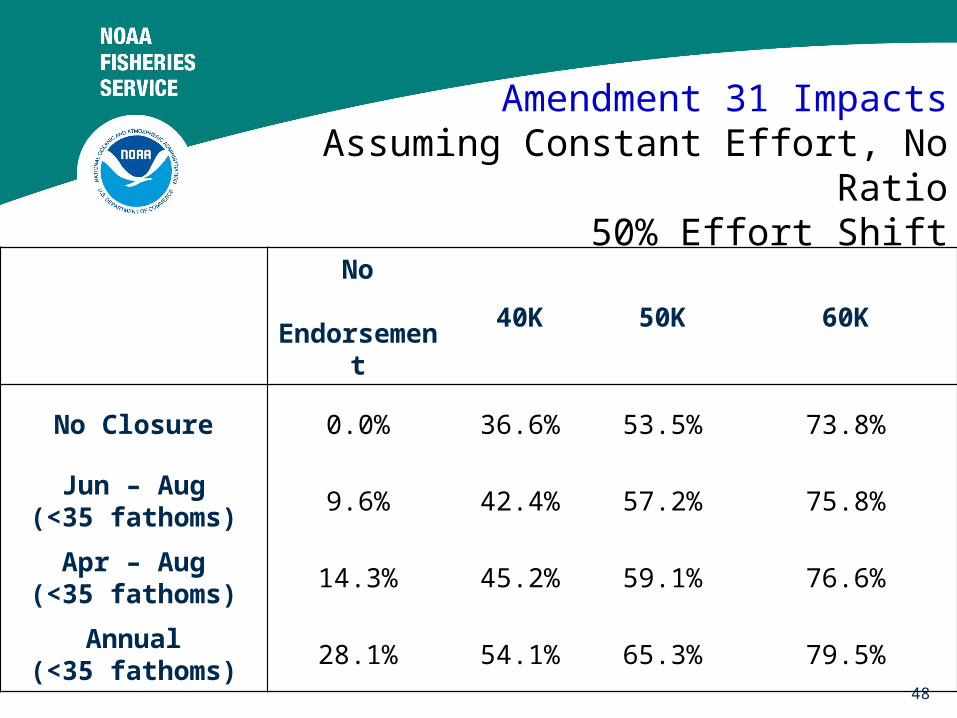
Amendment 31 ImpactsAssuming Constant Effort, No Ratio
50% Effort Shift
No Endorsement 40K 50K 60K
No Closure 0.0% 36.6% 53.5% 73.8%
Jun – Aug(<35 fathoms) 9.6% 42.4% 57.2% 75.8%
Apr – Aug(<35 fathoms) 14.3% 45.2% 59.1% 76.6%
Annual(<35 fathoms) 28.1% 54.1% 65.3% 79.5%

49
Amendment 31 ImpactsAssuming Increased Effort, No Ratio
50% Effort Shift
No Endorsement 40K 50K 60K
No Closure 39,115,910 23,707,217 16,895,574 9,802,454
Jun – Aug(<35 fathoms) 35,107,680 21,225,736 15,426,069 9,000,819
Apr – Aug(<35 fathoms) 33,430,795 20,184,481 14,731,751 8,747,842
Annual(<35 fathoms) 27,535,925 16,751,989 12,476,024 7,665,933
50
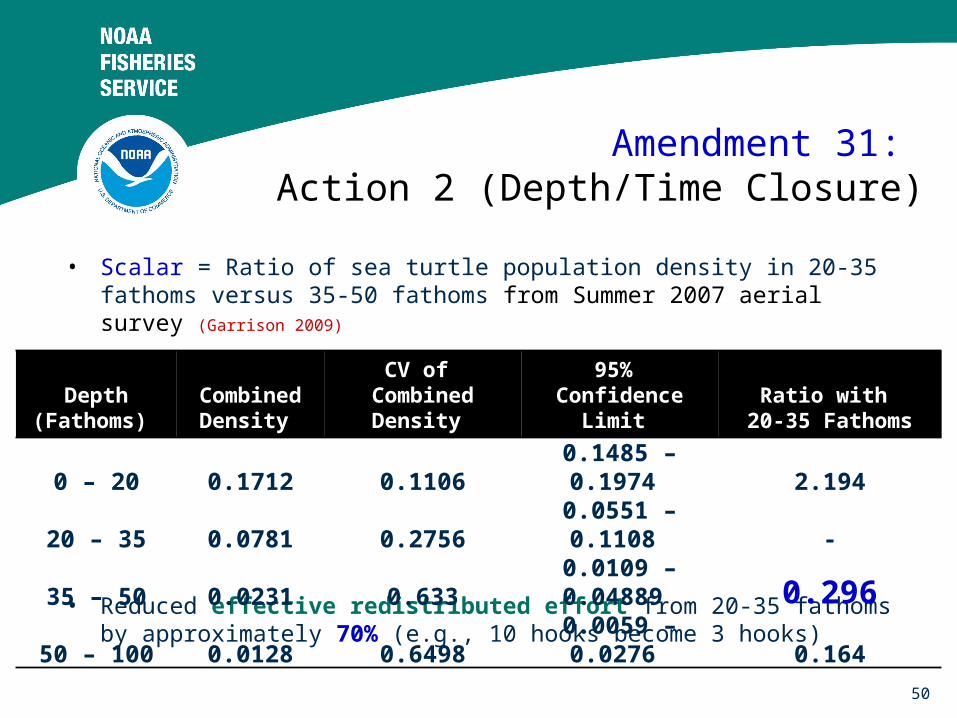
Amendment 31: Action 2 (Depth/Time Closure)
• Scalar = Ratio of sea turtle population density in 20-35 fathoms versus 35-50 fathoms from Summer 2007 aerial survey (Garrison 2009)
• Reduced effective redistributed effort from 20-35 fathoms by approximately 70% (e.g., 10 hooks become 3 hooks)
Depth(Fathoms)
CombinedDensity
CV of Combined Density
95% Confidence Limit
Ratio with 20-35 Fathoms
0 – 20 0.1712 0.1106 0.1485 – 0.1974 2.19420 – 35 0.0781 0.2756 0.0551 – 0.1108 -
35 – 50 0.0231 0.633 0.0109 – 0.04889 0.29650 – 100 0.0128 0.6498 0.0059 – 0.0276 0.164

51
Amendment 31 ImpactsAssuming Constant Effort, Winter
Ratio = 0
Effort Shift
LCL Mean UCL LCL Mean UCL LCL Mean UCL LCL Mean UCL
100% 7% 14% 17% 41% 45% 47% 56% 59% 60% 75% 77% 77%75% 10% 15% 17% 42% 46% 47% 57% 59% 60% 76% 77% 77%50% 13% 16% 18% 44% 47% 47% 59% 60% 61% 77% 77% 78%
100% 10% 20% 25% 43% 49% 52% 57% 61% 63% 76% 78% 79%75% 15% 22% 26% 45% 50% 52% 59% 62% 64% 77% 78% 79%50% 19% 24% 27% 48% 51% 53% 61% 63% 64% 78% 79% 79%
100% 46% 66% 73% 83%75% 49% 67% 74% 84%50% 51% 69% 75% 84%
74% 74% 74%
Jun-
Aug
37% 54% 54% 54%0% 0% 37% 37%
SEAS
ON
AL C
LOSU
RE
Non
e
n/a 0%
Apr-
Aug
Annu
al
Reduction ENDORSEMENT LEVEL50% None 40K 50K 60K

52
Effort Shift
LCL Mean UCL LCL Mean UCL LCL Mean UCL LCL Mean UCL
100% -27% -16% -12% 23% 30% 33% 45% 49% 50% 68% 70% 71%75% -22% -14% -11% 26% 31% 33% 46% 49% 51% 69% 70% 71%50% -17% -12% -10% 29% 32% 34% 48% 50% 51% 70% 71% 71%
100% -23% -8% -2% 26% 35% 39% 46% 52% 54% 68% 71% 72%75% -16% -5% 0% 30% 37% 40% 49% 53% 55% 70% 72% 73%50% -10% -2% 1% 34% 38% 41% 51% 54% 55% 71% 72% 73%
100% 30% 57% 67% 78%75% 34% 59% 68% 79%50% 37% 62% 69% 80%
Reduction ENDORSEMENT LEVEL50% None 40K 50K 60K
18% 18%
SEAS
ON
AL C
LOSU
RE
Non
e
n/a -36%
Apr-
Aug
Annu
al
66% 66% 66%
Jun-
Aug
18% 41% 41% 41%-36% -36%
Amendment 31 ImpactsAssuming Increased Effort
Winter Ratio = 0

53
Amendment 31 ImpactsAssuming Constant Effort, Winter
Ratio = 0.636
Effort Shift
LCL Mean UCL LCL Mean UCL LCL Mean UCL LCL Mean UCL
100% 7% 14% 17% 41% 45% 47% 56% 59% 60% 75% 77% 77%75% 10% 15% 17% 42% 46% 47% 57% 59% 60% 76% 77% 77%50% 13% 16% 18% 44% 47% 47% 59% 60% 61% 77% 77% 78%
100% 10% 20% 25% 43% 49% 52% 57% 61% 63% 76% 78% 79%75% 15% 22% 26% 45% 50% 52% 59% 62% 64% 77% 78% 79%50% 19% 24% 27% 48% 51% 53% 61% 63% 64% 78% 79% 79%
100% 32% 56% 66% 80%75% 39% 60% 69% 81%50% 44% 64% 72% 83%
Reduction ENDORSEMENT LEVEL50% None 40K 50K 60K
37% 37%
SEAS
ON
AL C
LOSU
RE
Non
e
n/a 0%
Apr-
Aug
Annu
al
74% 74% 74%
Jun-
Aug
37% 54% 54% 54%0% 0%

54
Effort Shift
LCL Mean UCL LCL Mean UCL LCL Mean UCL LCL Mean UCL
100% -27% -16% -12% 23% 30% 33% 45% 49% 50% 68% 70% 71%75% -22% -14% -11% 26% 31% 33% 46% 49% 51% 69% 70% 71%50% -17% -12% -10% 29% 32% 34% 48% 50% 51% 70% 71% 71%
100% -23% -8% -2% 26% 35% 39% 46% 52% 54% 68% 71% 72%75% -16% -5% 0% 30% 37% 40% 49% 53% 55% 70% 72% 73%50% -10% -2% 1% 34% 38% 41% 51% 54% 55% 71% 72% 73%
100% 10% 45% 59% 74%75% 18% 50% 62% 76%50% 27% 56% 65% 78%
66% 66% 66%
Jun-
Aug
18% 41% 41% 41%-36% -36% 18% 18%
SEAS
ON
AL C
LOSU
RE
Non
e
n/a -36%
Apr-
Aug
Annu
al
Reduction ENDORSEMENT LEVEL50% None 40K 50K 60K
Amendment 31 ImpactsAssuming Increased Effort
Winter Ratio = 0.636

55
Amendment 31 ImpactsAssuming Constant Effort
No Ratio Sea Turtle Density
Effort Shift
LCL Mean UCL LCL Mean UCL LCL Mean UCL LCL Mean UCL
100% 0% 37% 54% 74%75% 5% 40% 55% 75%50% 10% 42% 57% 76%
100% 0% 37% 54% 74%75% 7% 41% 56% 75%50% 14% 45% 59% 77%
100% 0% 37% 54% 74%75% 14% 45% 59% 77%50% 28% 54% 65% 80%
74% 74% 74%
Jun-
Aug
37% 54% 54% 54%0% 0% 37% 37%
SEAS
ON
AL C
LOSU
RE
Non
e
n/a 0%
Apr-
Aug
Annu
al
Reduction ENDORSEMENT LEVEL50% None 40K 50K 60K

56
Effort Shift
LCL Mean UCL LCL Mean UCL LCL Mean UCL LCL Mean UCL
100% -36% 18% 41% 66%75% -29% 22% 44% 67%50% -22% 26% 46% 69%
100% -36% 18% 41% 66%75% -26% 24% 45% 68%50% -16% 30% 49% 70%
100% -36% 18% 41% 66%75% -16% 30% 49% 70%50% 4% 42% 57% 73%
66% 66% 66%
Jun-
Aug
18% 41% 41% 41%-36% -36% 18% 18%
SEAS
ON
AL C
LOSU
RE
Non
e
n/a -36%
Apr-
Aug
Annu
al
Reduction ENDORSEMENT LEVEL50% None 40K 50K 60K
Amendment 31 ImpactsAssuming Increased Effort
No Ratio Sea Turtle Density