october 2021 | semiannual report recovering growth
TRANSCRIPT
RecoveringGrowthRebuilding Dynamic Post-COVID-19 Economies Amid Fiscal Constraints
OCTOBER 2021 | SEMIANNUAL REPORTOF LATIN AMERICA AND THE CARIBBEAN REGION

2 RECOVERING GROWTH: REBUILDING DYNAMIC POST-COVID-19 ECONOMIES AMID FISCAL CONSTRAINTS
© 2021 International Bank for Reconstruction and Development / The World Bank
1818 H Street NW, Washington DC 20433
Telephone: 202-473-1000; Internet: www.worldbank.org
Some rights reserved
1 2 3 4 24 23 22 21
This work is a product of the staff of The World Bank with external contributions. The findings, interpretations, and
conclusions expressed in this work do not necessarily reflect the views of The World Bank, its Board of Executive
Directors, or the governments they represent. The World Bank does not guarantee the accuracy of the data included
in this work. The boundaries, colors, denominations, and other information shown on any map in this work do not
imply any judgment on the part of The World Bank concerning the legal status of any territory or the endorsement
or acceptance of such boundaries.
Nothing herein shall constitute or be considered to be a limitation upon or waiver of the privileges and immunities
of The World Bank, all of which are specifically reserved.
Rights and Permissions
This work is available under the Creative Commons Attribution 3.0 IGO license (CC BY 3.0 IGO) http://
creativecommons.org/licenses/by/3.0/igo. Under the Creative Commons Attribution license, you are free to copy,
distribute, transmit, and adapt this work, including for commercial purposes, under the following conditions:
Attribution—Please cite the work as follows: World Bank. 2021. “Recovering Growth: Rebuilding Dynamic Post‐
COVID-19 Economies Amid Fiscal Constraints” LAC Semiannual Report (October), World Bank, Washington, DC. Doi:
10.1596/978-1-4648-1806-6. License: Creative Commons Attribution CC BY 3.0 IGO
Translations—If you create a translation of this work, please add the following disclaimer along with the attribution:
This translation was not created by The World Bank and should not be considered an official World Bank translation. The World
Bank shall not be liable for any content or error in this translation.
Adaptations—If you create an adaptation of this work, please add the following disclaimer along with the attribution:
This is an adaptation of an original work by The World Bank. Responsibility for the views and opinions expressed in the adaptation
rests solely with the author or authors of the adaptation and are not endorsed by The World Bank.
Third-party content—The World Bank does not necessarily own each component of the content contained within
the work. The World Bank therefore does not warrant that the use of any third-party-owned individual component
or part contained in the work will not infringe on the rights of those third parties. The risk of claims resulting from
such infringement rests solely with you. If you wish to re-use a component of the work, it is your responsibility
to determine whether permission is needed for that re-use and to obtain permission from the copyright owner.
Examples of components can include, but are not limited to, tables, figures, or images.
All queries on rights and licenses should be addressed to the Publishing and Knowledge Division, The World Bank,
1818 H Street NW, Washington, DC 20433, USA; fax: 202-522-2625; e-mail: [email protected].
ISBN (electronic): 978-1-4648-1806-6
DOI: 10.1596/978-1-4648-1806-6
Cover photo: Illustration based on a photograph by: Iakov Filimonov.
Cover design: Alejandro Espinosa (Sonideas).

Acknowledgements 3
RECOVERING GROWTH:REBUILDING DYNAMICPOST-COVID-19 ECONOMIESAMID FISCAL CONSTRAINTSAcknowledgements
This report is a product of the Chief Economist Office for Latin America and the Caribbean at the World Bank. The preparation of the report was led by William Maloney (Chief Economist) and Daniel Riera-Crich-ton (Research Economist) with contributions from Guillermo Beylis (Economist), Virgilio Galdo (Research Analyst), Elena Ianchovichina (Deputy Chief Economist), Maria Marta Ferreyra (Senior Economist), Ayan Qu (Research Analyst), Luis Diego Rojas Alvarado (Consultant), Joana Silva (Senior Economist), Rucheta Singh (Research Analyst) and Guillermo Vuletin (Senior Economist) in the Chief Economist Office (LCRCE).
Substantive contributions were made from across the regional teams:
Human Development: Luis Benveniste (Regional Director, HLCDR), Health: Michele Gragnolati (Practice Manager, HLCHN), Gianluca Cafagna (Health Specialist, HLCHN), Cristian A Herrera (Senior Health Spe-cialist, HLCHN), Education: Emanuela Di Gropello (Practice Manager, HLCED), Juan Diego Alonso (Senior Economist, HLCED), Indiana Taylor (Senior Program Assistant, HLCDR), Social Protection and Jobs: William Wiseman (Lead Economist, HLCSP ), and Harry Edmund Moroz (Economist, HLCSP).
Infrastructure and Energy: Franz Drees-Gross (Regional Director, ILCDR), Luis Andres (Sector Leader, ILC-DR), Doyle Gallegos (Lead Digital Development Specialist, IDD01), Nicole Klingen (Practice Manager, IDD01), Niccolo Comini (Digital Development Specialist, IDD01), Nicolas Peltier (Practice Manager, ILCT1), Stephanie Gil (Practice Manager, ILCE1), Claudia Ines Vasquez Suarez (Senior Energy Specialist, ILCE1), Janina Franco (Senior Energy Specialist, ILCE1), Javier Morales Sarriera (Economist, ILCT1), Fabian Hinojosa (Transport specialist, ILCT1), and Leonardo Canon Rubiano (Senior Transport specialist, ILCT1).
Equitable Growth, Finance and Institutions: Robert R. Taliercio (Regional Director, ELCDR), Poverty: Xi-mena del Carpio (Practice Manager, ELCPV), Hernan Winkler (Senior Economist, ELCPV), Sergio Olivieri (Senior Economist, ELCPV), and Diana Sanchez Castro (Research Analyst, ELCPV). Procurement: Majed El-Bayya (Lead Procurement Specialist, EPSPF) and Serena Sara Daniela Cocciolo (Economist, EPSPF). Finance, Competitiveness and Innovation: Denis Medvedev (Practice Manager, ETIFE), Sara Brolhato de Oliveira (Consultant, ETIFE), Santiago Reyes Ortiga (Extended-term Consultant, ETIFE), Jose Ernesto Lopez Cordova (Lead Economist, ETIFE), and Xavier Cirera (Senior Economist, ETIFE). Prospects: Temel Taskin (Economist, EPGDR), and Franz Ulrich Ruch (Economist, EPGDR).
Country-specific macroeconomic estimates and write-ups were produced by country economists in the Macroeconomics, Trade and Investment Global Practice, under the coordination of James Sampi (Econo-mist, ELCMU). Contributors included Sonia Araujo, Rafael Barroso, Elena Bondarenko, Luigi Butron, Bledi Celiku, Tamoya Christie, Fabiano Colbano, Barbara Cunha, Simon Davies, Anton Dobronogov, Jozef Draa-isma, Paolo Dudine, Julian Folgar, Fernando Giuliano, Marek Hanusch, Johannes Herderschee, Santiago Herrera, Evans Jadotte, Santiago Justel, Woori Lee, Ran Li, Rohan Longmore, David Cal MacWilliam, Edu-ardo Olaberria, Rafael Ornelas, Andres Pinchao, Ruslan Piontkivsky, Anjali Shahani Moreno, Julio Velasco, Katia Vostroknutova, Christian Zambaglione and Gabriel Zaourak, Alexander Haider, and Andrew Burns (all ELCMU).
Administrative support was provided by Jacqueline Larrabure (Program Assistant, LCRCE). Yanina Budkin (Senior External Affairs Officer, LCREC), Carlos Molina (Online Communications Officer, LCREC), Ruth Id-alina Gonzalez Llamas (Senior External Affairs Officer, ECRLC), Leandro Juan Hernandez (External Affairs Associate, ECRLC), Gonzalo Villamizar (Consultant, LCRCE), and Francisco Seminario (Consultant, LCREC) contributed on communication and Alejandro Espinosa (Sonideas) on design. The cutoff date for this report was September 23, 2021.
4 contents
RECOVERING GROWTH:REBUILDING DYNAMIC
POST-COVID-19 ECONOMIESAMID FISCAL CONSTRAINTS Contents
Acknowledgements . . . . . . . . . . . . . . . . . . . . . . . . . . . . . . . . . . . . . . . . . . . . . . . . . . . . . . . . . . . . . . . . . . . . . . . . . . . . . . . . . . . . . . . . . . 3
Executive Summary . . . . . . . . . . . . . . . . . . . . . . . . . . . . . . . . . . . . . . . . . . . . . . . . . . . . . . . . . . . . . . . . . . . . . . . . . . . . . . . . . . . . . . . . . . . 7
CHAPTER 1
From Devastation to an Anemic Recovery Path 11
The Ongoing Challenge of COVID-19 . . . . . . . . . . . . . . . . . . . . . . . . . . . . . . . . . . . . . . . . . . . . . . . . . . . . . . . . . . . . . . . . . . . 13
Slow Progress Defeating COVID-19 . . . . . . . . . . . . . . . . . . . . . . . . . . . . . . . . . . . . . . . . . . . . . . . . . . . . . . . . . . . . . . . . 13
Devastating Human Costs . . . . . . . . . . . . . . . . . . . . . . . . . . . . . . . . . . . . . . . . . . . . . . . . . . . . . . . . . . . . . . . . . . . . . . . . . . . . . . . 16
Recovering, without Taking Off . . . . . . . . . . . . . . . . . . . . . . . . . . . . . . . . . . . . . . . . . . . . . . . . . . . . . . . . . . . . . . . . . . . . . . . . . 18
The Paradoxical Recovery: A Return to Anemic Growth Despite Favorable Tailwinds . . . . . . . . . . . . . . . . . 20
Challenges to Recovery . . . . . . . . . . . . . . . . . . . . . . . . . . . . . . . . . . . . . . . . . . . . . . . . . . . . . . . . . . . . . . . . . . . . . . . . . . . . . . . . 23
New COVID-19 Outbreaks . . . . . . . . . . . . . . . . . . . . . . . . . . . . . . . . . . . . . . . . . . . . . . . . . . . . . . . . . . . . . . . . . . . . . . . . . 23
Inflation Risks . . . . . . . . . . . . . . . . . . . . . . . . . . . . . . . . . . . . . . . . . . . . . . . . . . . . . . . . . . . . . . . . . . . . . . . . . . . . . . . . . . . . . 24
Firm Arrears, Debt Overhang and Financial Stability . . . . . . . . . . . . . . . . . . . . . . . . . . . . . . . . . . . . . . . . . . . . . . 26
Disappearing Fiscal Space . . . . . . . . . . . . . . . . . . . . . . . . . . . . . . . . . . . . . . . . . . . . . . . . . . . . . . . . . . . . . . . . . . . . . . . 27
CHAPTER 2
Rebuilding a Dynamic, Inclusive and Greener Economy in a Constrained Fiscal Environment 30
The Fiscal Challenge to Growth and Inequality . . . . . . . . . . . . . . . . . . . . . . . . . . . . . . . . . . . . . . . . . . . . . . . . . . . . . . . . . 31
Growth-Neutral Revenue Mobilization . . . . . . . . . . . . . . . . . . . . . . . . . . . . . . . . . . . . . . . . . . . . . . . . . . . . . . . . . . . . . . . . . . 31
The Growth Costs of Tax Hikes are not Necessarily Large in the Developing World . . . . . . . . . . . . . . 32
Gains in Spending Efficiency . . . . . . . . . . . . . . . . . . . . . . . . . . . . . . . . . . . . . . . . . . . . . . . . . . . . . . . . . . . . . . . . . . . . . . . . . . . 34
Rethinking Spending Priorities . . . . . . . . . . . . . . . . . . . . . . . . . . . . . . . . . . . . . . . . . . . . . . . . . . . . . . . . . . . . . . . . . . . . . . . . . 35
A. Strengthening the Health System - Quick Wins to Improve and Expand Services . . . . . . . . . . . . . . 35
B. Making Better Grades in Education Efficacy and Equity . . . . . . . . . . . . . . . . . . . . . . . . . . . . . . . . . . . . . . . . 36
Primary and Secondary Schools in Crisis . . . . . . . . . . . . . . . . . . . . . . . . . . . . . . . . . . . . . . . . . . . . . . . . . . . . . . . . . . 37
Higher Education: The Paradox of LAC’s Generous but Ineffective Higher Educational Spending . 39
C. Repurposing Innovation Resources . . . . . . . . . . . . . . . . . . . . . . . . . . . . . . . . . . . . . . . . . . . . . . . . . . . . . . . . . . . . 43
D. Public Transfers for Equity: Converting Short-Term Stimulus to Long Term Growth . . . . . . . . . . . . 45

contents 5
RECOVERING GROWTH:REBUILDING DYNAMICPOST-COVID-19 ECONOMIESAMID FISCAL CONSTRAINTS
E. Smart Public Investment in Infrastructure . . . . . . . . . . . . . . . . . . . . . . . . . . . . . . . . . . . . . . . . . . . . . . . . . . . . . . 46
What are Performance-Based Contracts (PBC)? . . . . . . . . . . . . . . . . . . . . . . . . . . . . . . . . . . . . . . . . . . . . . . . . . . . 49
What are the Benefits of the PBCs? . . . . . . . . . . . . . . . . . . . . . . . . . . . . . . . . . . . . . . . . . . . . . . . . . . . . . . . . . . . . . . . . 49
4G: An Ambitious Toll Road PPP Program . . . . . . . . . . . . . . . . . . . . . . . . . . . . . . . . . . . . . . . . . . . . . . . . . . . . . . . . . 50
Digital Infrastructure: Low-cost Investments in Growth, Resilience and Inclusion . . . . . . . . . . . . . . . . . . 51
F. Powering a Sustainable Energy Future . . . . . . . . . . . . . . . . . . . . . . . . . . . . . . . . . . . . . . . . . . . . . . . . . . . . . . . . . 52
Moving the Energy Efficiency Agenda Forward . . . . . . . . . . . . . . . . . . . . . . . . . . . . . . . . . . . . . . . . . . . . . . . . . . . 53
Conclusion 56
References . . . . . . . . . . . . . . . . . . . . . . . . . . . . . . . . . . . . . . . . . . . . . . . . . . . . . . . . . . . . . . . . . . . . . . . . . . . . . . . . . . . . . . . . . . . . . . . . . . 57
List of Figures
Figure 1.1: LAC Leads the World on Cumulative Confirmed COVID-19 Deaths . . . . . . . . . . . . . . . . . . . . . . . . . . . . . . . . . . . . . . 13
Figure 1.2: COVID-19 Hit LA Especially Hard and Remains a Barrier to Recovery . . . . . . . . . . . . . . . . . . . . . . . . . . . . . . . . . . . 13
Figure 1.3: Progress on COVID-19 Varies by Country but Reflects Gains in Vaccination . . . . . . . . . . . . . . . . . . . . . . . . . . . . . 14
Figure 1.4: LAC is Advancing on Vaccinations, but Still Lags Other Regions . . . . . . . . . . . . . . . . . . . . . . . . . . . . . . . . . . . . . . . . 15
Figure 1.5: Progress in Vaccination Rates Varies Across the Region . . . . . . . . . . . . . . . . . . . . . . . . . . . . . . . . . . . . . . . . . . . . . . . 15
Figure 1.6: From Low Growth to the Worst Recession . . . . . . . . . . . . . . . . . . . . . . . . . . . . . . . . . . . . . . . . . . . . . . . . . . . . . . . . . . . . . 16
Figure 1.7: Employment Remains Below Pre-Pandemic Levels . . . . . . . . . . . . . . . . . . . . . . . . . . . . . . . . . . . . . . . . . . . . . . . . . . . . 16
Figure 1.8: Without Brazil, Poverty Increased Sharply Throughout the Region . . . . . . . . . . . . . . . . . . . . . . . . . . . . . . . . . . . . . . 17
Figure 1.9: The Human Development Index Recorded Its Largest Drop . . . . . . . . . . . . . . . . . . . . . . . . . . . . . . . . . . . . . . . . . . . . 17
Figure 1.10: The Region Suffered Large Losses in Learning-Adjusted Years of Schooling . . . . . . . . . . . . . . . . . . . . . . . . . . . 18
Figure 1.11: GDP Growth Rates Have Been Robust . . . . . . . . . . . . . . . . . . . . . . . . . . . . . . . . . . . . . . . . . . . . . . . . . . . . . . . . . . . . . . . . 18
Figure 1.12: Most Countries Have Not Regained their 2019 Levels of Income . . . . . . . . . . . . . . . . . . . . . . . . . . . . . . . . . . . . . . . 19
Figure 1.13: Machine Learning Estimates of Business Sentiment from Quarterly Earnings Calls Investors Are
Shaking Off Concerns About Progress on COVID-19 . . . . . . . . . . . . . . . . . . . . . . . . . . . . . . . . . . . . . . . . . . . . . . . . . . . . . . . . . . . . . 19
Figure 1.14: Tailwinds in Key External Factors . . . . . . . . . . . . . . . . . . . . . . . . . . . . . . . . . . . . . . . . . . . . . . . . . . . . . . . . . . . . . . . . . . . . . 21
Figure 1.15: Given Favorable Tailwinds, LAC Should Have Grown Faster in 2021 . . . . . . . . . . . . . . . . . . . . . . . . . . . . . . . . . . . 21
Figure B1: Growth Response to External Factors (in percentage points) . . . . . . . . . . . . . . . . . . . . . . . . . . . . . . . . . . . . . . . . . . 22
Figures 1.16: Much of the Slowdown in Activity Was Due to Voluntary Self Distancing . . . . . . . . . . . . . . . . . . . . . . . . . . . . . 23
Figure 1.17: Steeper Yield Curve in the US May Indicate Higher Inflation in the Horizon . . . . . . . . . . . . . . . . . . . . . . . . . . . . 24
Figures 1.18: Inflation in LAC is Nudging Upward and is Largely Demand Driven . . . . . . . . . . . . . . . . . . . . . . . . . . . . . . . . . . 25
Figure 1.19: Much of the Private Sector is in Arrears . . . . . . . . . . . . . . . . . . . . . . . . . . . . . . . . . . . . . . . . . . . . . . . . . . . . . . . . . . . . . 26
Figure 1.20: LAC’s Debt Resolution Mechanisms Need to Be Streamlined . . . . . . . . . . . . . . . . . . . . . . . . . . . . . . . . . . . . . . . . 26

6 contents
RECOVERING GROWTH:REBUILDING DYNAMIC
POST-COVID-19 ECONOMIESAMID FISCAL CONSTRAINTS
Figure 1.21: Widespread Overall and Primary Fiscal Deficits . . . . . . . . . . . . . . . . . . . . . . . . . . . . . . . . . . . . . . . . . . . . . . . . . . . . . 27
Figure 1.22: Large Fiscal Efforts Continue in 2021 . . . . . . . . . . . . . . . . . . . . . . . . . . . . . . . . . . . . . . . . . . . . . . . . . . . . . . . . . . . . . . . 27
Figure 1.23: Public Debt is on the Rise . . . . . . . . . . . . . . . . . . . . . . . . . . . . . . . . . . . . . . . . . . . . . . . . . . . . . . . . . . . . . . . . . . . . . . . . . . 28
Figure 1.24: As Debt Grows Sovereign Credit Ratings Slide . . . . . . . . . . . . . . . . . . . . . . . . . . . . . . . . . . . . . . . . . . . . . . . . . . . . . . 28
Figure 1.25: Sovereign Spreads Remained High Despite Economic Recovery . . . . . . . . . . . . . . . . . . . . . . . . . . . . . . . . . . . . . 29
Figure 2.1: Advancing Growth, Equity and Sustainability under Fiscal Constraints . . . . . . . . . . . . . . . . . . . . . . . . . . . . . . . . . . 31
Figure 2.2: LAC Taxes are Substantially Less than the OECD . . . . . . . . . . . . . . . . . . . . . . . . . . . . . . . . . . . . . . . . . . . . . . . . . . . . 32
Figure 2.3: The Growth Effects of Raising the VAT Vary by Country . . . . . . . . . . . . . . . . . . . . . . . . . . . . . . . . . . . . . . . . . . . . . . 32
Figure 2.4: Higher Income Taxes May Have Negative Growth Consequences . . . . . . . . . . . . . . . . . . . . . . . . . . . . . . . . . . . . 33
Figure 2.5: Latin America Taxes Property Less than Comparable Countries . . . . . . . . . . . . . . . . . . . . . . . . . . . . . . . . . . . . . . 34
Figure 2.6: LAC Suffers Large Waste and Inefficiency in Public Expenditure . . . . . . . . . . . . . . . . . . . . . . . . . . . . . . . . . . . . . . 35
Figure 2.7: 15-Year-Old Students in LAC are, on Average, Three Years Behind OECD Students in Reading,
Mathematics, and Science . . . . . . . . . . . . . . . . . . . . . . . . . . . . . . . . . . . . . . . . . . . . . . . . . . . . . . . . . . . . . . . . . . . . . . . . . . . . . . . . . . . . . 37
Figure 2.8: Wide Gaps in Education Outcomes Reveal Regressive Patterns of Access and Quality . . . . . . . . . . . . . . . . 38
Figure 2.9: Public Subsidies for SCP Students are Lower than for Bachelor’s Students in LAC Countries . . . . . . . . . . . . 41
Figure 2.10: In LAC, SCP Graduates Attain Better Labor Market Outcomes than Dropouts from Bachelor’s Programs 41
Figure 2.11: LAC Lags in Firm Management Practices Necessary to Innovate . . . . . . . . . . . . . . . . . . . . . . . . . . . . . . . . . . . . . 44
Figure 2.12: Subjective Firm Opinion of the Quality of Scientific Research Institutions and the Degree of
Collaboration of Firms with Universities . . . . . . . . . . . . . . . . . . . . . . . . . . . . . . . . . . . . . . . . . . . . . . . . . . . . . . . . . . . . . . . . . . . . . . . . 45
Figure 2.13: Social Transfers Have Three Times the Impact on Output in LAC as in Advanced Countries . . . . . . . . . . . 46
Figure 2.14: Infrastructure Investment is Correlated with Higher Growth, Equality and Competitiveness . . . . . . . . . . . . 47
Figure 2.15: Private Sector Investment Has Not Offset the Fall in Public Infrastructure Investment . . . . . . . . . . . . . . . . . 47
Figure 2.16: Digital Connectedness Varies Widely across LAC . . . . . . . . . . . . . . . . . . . . . . . . . . . . . . . . . . . . . . . . . . . . . . . . . . . . 51
Figure 2.17: Energy Subsidies are High and Rise with Oil Prices . . . . . . . . . . . . . . . . . . . . . . . . . . . . . . . . . . . . . . . . . . . . . . . . . . 52
Figure 2.18: LAC Lags in Reducing Energy Intensity . . . . . . . . . . . . . . . . . . . . . . . . . . . . . . . . . . . . . . . . . . . . . . . . . . . . . . . . . . . . . . 53
List of Tables
Table 2.1: Higher education spending and distribution of students across fields . . . . . . . . . . . . . . . . . . . . . . . . . . . . . . . . . . . . . 39
Table 2.2: Cost savings of different countries under PBC over conventional contracts . . . . . . . . . . . . . . . . . . . . . . . . . . . . . . 49
List of Boxes
Box 1.1. Machine Learning: Earnings Calls Transcripts Offer Early Information on Economic Trends . . . . . . . . . . . . . . . . . . . 20
Box 1.2. A Model of Growth Explained by External Factors . . . . . . . . . . . . . . . . . . . . . . . . . . . . . . . . . . . . . . . . . . . . . . . . . . . . . . . . . 22
Box 2.1. Finland: Building a World Class Education and Research System . . . . . . . . . . . . . . . . . . . . . . . . . . . . . . . . . . . . . . . . . . 43
Box 2.2. Improving the Sustainability and Efficiency of Road Expenditures: Performance-Based Contracting . . . . . . . . . 49
Box 2.3. New Strategies for Attracting Foreign Investment: the 4G and 5G Infrastructure PPP Scheme in Colombia . . 50
Box 2.4. Green Hydrogen Exports from Latin America: a Pathway Towards a Green, Resilient, Inclusive
Economic Recovery . . . . . . . . . . . . . . . . . . . . . . . . . . . . . . . . . . . . . . . . . . . . . . . . . . . . . . . . . . . . . . . . . . . . . . . . . . . . . . . . . . . . . . . . . . . . . 54

executive summAry 7
RECOVERING GROWTH:REBUILDING DYNAMICPOST-COVID-19 ECONOMIESAMID FISCAL CONSTRAINTSExecutive Summary
Latin America is emerging from the COVID-19 crisis, but the recovery is weaker than expected, and the scars on the economy and society will take years to fade. The need to recover dynamic, inclusive, and sustainable growth to redress both the legacy of the pandemic and long-standing social needs has never been more acute. In turn, despite the emergence of some industrial “green shoots” offering new avenues for growth, addressing long-unattended agendas that prevent the region from taking off has never been more urgent. In this spirit, Chapter 1 of this report lays out the recent social and macroeconomic evolution of the region and the near-term challenges it faces emerging from the pandemic. Chapter 2 then explores several of the areas where key growth-advancing reforms could be undertaken in the constrained fiscal context, focusing especially on spending more efficiently and reallocating resources to more productive uses.
The social costs of the pandemic have been devastating. Poverty rates, excluding Brazil, measured at 5.5 USD/day rose from 24 to 26.7 percent, their highest increase in decades; students lost between one and one-and-a-half years of education; and the fall in the UN Human Development Index dwarfed that during the financial crisis. The good news is that the vaccination drive has picked up steam over the last six months and, while still far from where it needs to be, COVID-19 deaths are falling in most countries.
Latin America and the Caribbean’s (LAC’s) economic recovery is stronger than predicted earlier in the year, but weaker than favorable tailwinds would dictate. Forecasts of 2021 growth have been up-graded over the summer and regional growth is expected to reach 6.3 percent for 2021, almost recovering the 6.7 percent losses of 2020. However, given the robust recoveries in their principal trading partners, low global borrowing rates, and the prospect of another commodity super cycle, growth rates might be expect-ed to be 1.5 percentage points higher.
…And several challenges face the recovery:
Recurrence of the virus. Any recurrence of the virus will lead to declines in economic activity, not only because of government measures to enforce social distancing, but also because half of the decline in activity is due to voluntary distancing due to fear of the disease.
Tightening of global liquidity to tamp down inflation. Should global inflation pressures not prove temporary, glob-al borrowing rates will rise, depressing demand and challenging budget management.
High levels of private sector debt and lack of clarity on banking solidity. World Bank Pulse Surveys suggest that in many countries 40-60 percent of firms are in arrears as a result of pandemic-driven falls in revenues. This overhang will in the best case dampen investment, and in the worst case create zombie firms that are effec-tively bankrupt but are still in operation. To the degree that banking systems are forbearing debt payments, this could also be creating a de-transparentization of the financial sector, where the true level of non-per-forming loans in the system is hard to discern. Governments will need to streamline presently unwieldly debt resolution mechanisms and monitor systemic soundness.
Rising budget deficits. Declining government revenues and extraordinary efforts to protect families and firms during the COVID-19 pandemic have led to high deficits, and increased debt. In some cases, this has led to ratings downgrades and potentially raised borrowing costs. In all cases, there is reduced room for govern-ments to engage in growth and equity promoting investments.
Rising public debt: The average public debt to Gross Domestic Product (GDP) ratio has risen dramatically over two years by 15 points to 75.38 percent, leading to reduced ability to borrow abroad and complicating fiscal management going forward.

8 executive summAry
RECOVERING GROWTH:REBUILDING DYNAMIC
POST-COVID-19 ECONOMIESAMID FISCAL CONSTRAINTS
The COVID-19 crisis came on top of another “lost decade” of low growth, suggesting deeper struc-tural problems. From 2010 to the outbreak of the pandemic, LAC grew at 2.2 percent per year while the world grew at 3.1 percent. The forecasts for 2022 and 2023 are similarly lackluster at 2.8 and 2.6 percent, respectively. The lackluster recovery, together with the low growth rates of the previous decade suggest structural problems internal to the region and point to the urgency of addressing the list of long-recognized growth-impeding internal shortfalls in infrastructure, education, energy policy, firm capabilities, and in-novation, while confronting some new climate change challenges.
The situation is not uniformly bleak across countries and industries and historically, green shoots may arise from crises triggering large-scale economic restructuring. As an example, while hospitality and personal services have suffered greatly, accelerated digitization brought about by the need to socially distance could help boost sectors like information technology, finance, and logistics and these may, in turn, enhance market competition and increase economic efficiency. However, unless these structural factors are addressed, anemic growth is likely to continue and will be insufficient to make progress on poverty and relieve social tensions.
Taking Off: Rebuilding Dynamic, Inclusive, and Greener Economies with Limited Fiscal Resources.
Chapter 2 focuses on possible ways of raising potential growth and societal well-being with limited fiscal space through three channels: raising additional revenues, increasing the efficiency of current spending, and reallocating spending to higher growth/higher social value added areas. Progress in each area requires increasing the transparency of public spending and information about it, increasing public sector account-ability and employing private sector discipline, working toward consistency and coherence across pro-grams, and maintaining an equity lens throughout.
Growth Neutral Revenue Mobilization Emerging evidence suggests that there is room for increased revenue mobilization without large negative impacts on growth. The popular value added tax (VAT), for example, appears to have negative growth im-pacts for countries with already high tax burdens, but for countries with rates between 7.5 percent and 14 percent, the negative effects are small, and expansion is feasible. However, because it weighs on consump-tion, the VAT is regressive and potentially exacerbates inequality. By contrast, income taxes can be designed to be more progressive, but are estimated to have a larger negative impact on output in LAC than, for ex-ample, in the United States. Property taxes as a share of GDP in LAC are generally below 0.6 percent of GDP, while the Organisation for Economic Co-operation and Development (OECD) level is 2 percent and offers another potential source of revenue, that, again, would be more progressive. Taxes on tobacco, alcohol and sugar sweetened products generate health benefits and revenues. Increasing the excise taxes has been estimated to raise the tax to GDP ratios by an average of 0.7 percent in low-income countries (LICs) and low-to-middle-income countries (LMICs) and, when health impacts are taken into account, the impact of the increase is progressive. The goal of lowering carbon emissions may also involve levying taxes which would also raise revenues although the magnitudes and equity impacts are as yet unclear for the region. Finally, there are gains to be made in tax enforcement. For example, the regional average evasion rates for VAT and corporate income taxes are 29.4 and 49.2 respectively.
Gains in Spending EfficiencyLarge potential gains in spending efficiency offer an important complement or alternative to raising reve-nues. This does not mean cutting spending across the board, as has been done many times in the past, with strong contractionary effects. It means using existing resources better. Estimated inefficiencies in procure-ment, civil service, and targeted transfers in LAC represent an average amount of waste in the region of 4.4 per-cent of GDP -larger than the current average spending on health and almost as large as the average spending on education- and accounts for about 16 percent of average government spending. Public procurement of goods, services, and capital equipment accounts for, on average 30 percent of spending and is frequent-ly a source of waste, mismanagement, and in some cases corruption. The waste originating in bribes and

executive summAry 9
RECOVERING GROWTH:REBUILDING DYNAMICPOST-COVID-19 ECONOMIESAMID FISCAL CONSTRAINTS
padded budgets appears to be enormous: about 26 percent over the cost of projects. World Bank simulations estimate savings of 16 to 22 percent with straightforward modifications in practices and without changing existing procurement laws. The average wage bill consumes 29 percent of general government spending, and wage bill inefficiencies are estimated to cost 1.2 percent of GDP. About 30 percent of public spending on average in LAC consists of transfers, including social programs, firm subsidies (mostly energy), and con-tributory pensions; inefficiencies through mistargeting and waste are estimated at about 1.7 percent of GDP.
Rethinking Spending Priorities for Growth and EquityStrengthening the Health System Quick Wins to Improve and Expand Service. COVID-19 revealed the limitations of the health systems in most LAC countries. Over time, public spending will need to increase to international levels, but in the short term, moving systems toward the global efficiency frontier has the potential to ex-tend average lifespan by four years. This includes benchmarking services offered against global norms, un-dertaking Health Technology Assessments, unifying fragmented systems, reconfiguring services provision, improving information systems, and reducing corruption.
Making Better Grades in Education Efficacy and Equity. Over the medium term, substantial remedial work will need to be done at the elementary school level, to counteract the lost years of learning and human capital accumulation due to COVID-19, while addressing long-standing inefficiencies that have led to perennially inadequate outcomes. Prioritizing the hardest hit schools, better use of technology to complement teach-ing, improving monitoring and reporting of educational outcomes, and improving educational leadership would all contribute. At the university level, shifting the ample funding from bachelor programs to Short Course Programs (two to three years) more focused on particular technical skills in line with global norms would be progressive, address a persistent skill shortage in the private sector, and improve labor market outcomes. More generally, collecting and diffusing information on and increasing accountability for school outcomes and revisiting the allocation of subsidies across programs would all make the higher education system more effective and less regressive.
Getting More from Innovation Spending. LAC underinvests in research and innovation-as a crude proxy, average re-search and development (R&D) expenditures are 0.6 percent of GDP compared to double that (1.2 percent) for mid-dle-income countries and 1.4 percent for upper-middle-income countries. Further, the private sector reports both low confidence in the quality of research institutes and little interaction with them by global standards. Revisiting funding mechanisms to strengthen incentives to quality and collaboration would ensure that scarce innovation resources have an impact on growth. Reprioritizing away from R&D toward strengthening managerial capabilities and product and process innovation would, over the long run, facilitate participation in global value chains (GVCs), and prepare firms for longer-term innovation projects, including the transition to greener technologies.
Public Transfers for Equity: Converting Short-Term Stimulus to Long-Term Growth. Public transfers were important to supporting households during COVID-19 and, over the longer term, higher flows are likely necessary to approach OECD levels of equality. The evidence to date suggests a positive short-term impact on output through demand, but over the longer term, targeting transfers to support productivity increasing invest-ments (for instance subsidies to Short Cycle programs, or other human capital accumulation) would both improve equity and lay the foundation for growth.
Smart Public Investment in Infrastructure. Public investment in infrastructure as a share of GDP has fallen by two-thirds since the 1980s and has not been offset by public-private partnerships (PPPs) or other private funding mechanisms. The overall fall has negative adverse impacts on competitiveness, growth, and in-equality. Studies identify barriers to better using existing resources including weak planning, project ap-praisal, and preparation capacity; overly rigid or myopic budgeting designed to control fiscal deficits rather than promote efficient spending; difficulties with budget execution; unclear project sustainability, often due to imbalances between capital and current spending on infrastructure, often arising, again, from over-ly rigid budgets and suboptimal planning; weak procurement practices; and finally, often uncompetitive construction industries. Savings in traditional infrastructure are potentially large. Expansion of digital in-frastructure is relatively cheap and could increase productivity, connect rural areas, and build in resilience to future crises, for instance, through broader access to distance learning.
10 executive summAry
RECOVERING GROWTH:REBUILDING DYNAMIC
POST-COVID-19 ECONOMIESAMID FISCAL CONSTRAINTS
Powering a Sustainable Energy Future. Depending on global energy prices, energy subsidies can cost several points of GDP and remain poorly targeted: 40-60 percent of electricity subsidies, for example, go to the top 20 percent of the income distribution. Shifting away from general subsidies and providing targeted support to vulnerable populations would free up resources to explore conservation measures and other sources of low cost and environmentally sustainable power. The region’s gains in energy efficiency have been below those of comparable regions, and the World Bank has identified hundreds of potential energy savings areas ranging from building codes, setting minimum energy performance standards, and developing financial mechanisms to support investments that would contribute. LAC also has a comparative advantage in gener-ating Green Hydrogen which, if scaled, would be competitive in world markets and reduce emissions across many domestic industries.
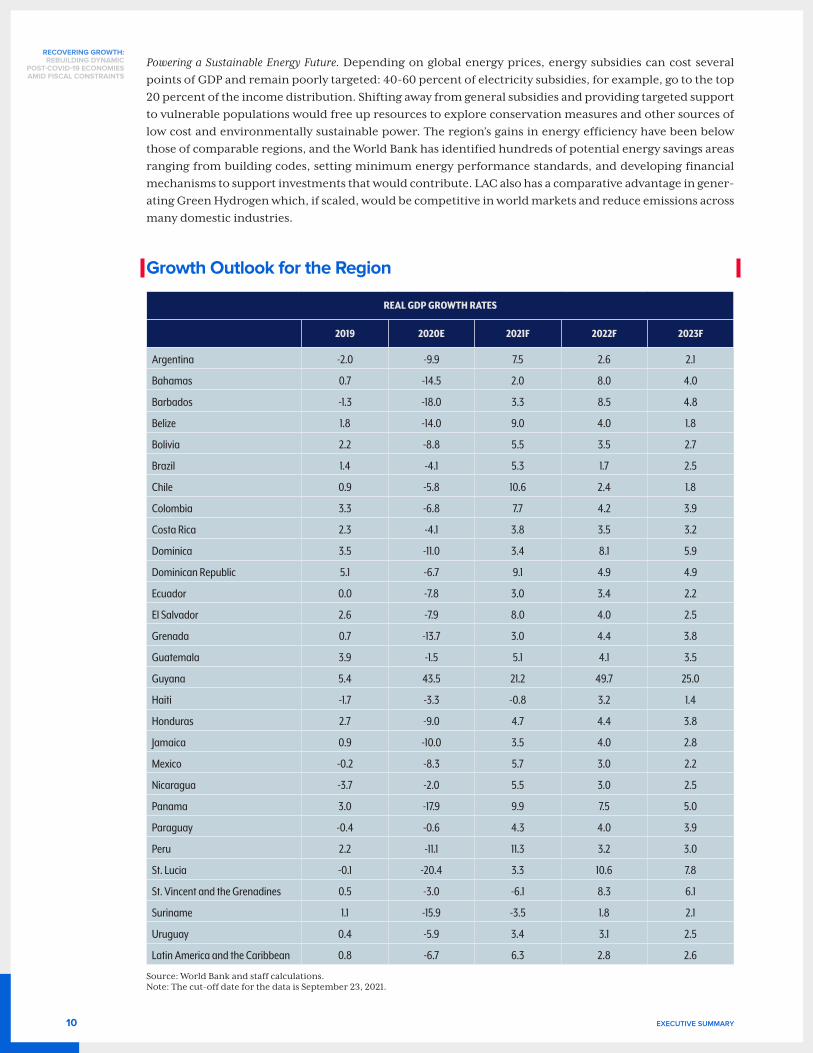
Growth Outlook for the Region
REAL GDP GROWTH RATES
2019 2020E 2021F 2022F 2023F
Argentina -2.0 -9.9 7.5 2.6 2.1
Bahamas 0.7 -14.5 2.0 8.0 4.0
Barbados -1.3 -18.0 3.3 8.5 4.8
Belize 1.8 -14.0 9.0 4.0 1.8
Bolivia 2.2 -8.8 5.5 3.5 2.7
Brazil 1.4 -4.1 5.3 1.7 2.5
Chile 0.9 -5.8 10.6 2.4 1.8
Colombia 3.3 -6.8 7.7 4.2 3.9
Costa Rica 2.3 -4.1 3.8 3.5 3.2
Dominica 3.5 -11.0 3.4 8.1 5.9
Dominican Republic 5.1 -6.7 9.1 4.9 4.9
Ecuador 0.0 -7.8 3.0 3.4 2.2
El Salvador 2.6 -7.9 8.0 4.0 2.5
Grenada 0.7 -13.7 3.0 4.4 3.8
Guatemala 3.9 -1.5 5.1 4.1 3.5
Guyana 5.4 43.5 21.2 49.7 25.0
Haiti -1.7 -3.3 -0.8 3.2 1.4
Honduras 2.7 -9.0 4.7 4.4 3.8
Jamaica 0.9 -10.0 3.5 4.0 2.8
Mexico -0.2 -8.3 5.7 3.0 2.2
Nicaragua -3.7 -2.0 5.5 3.0 2.5
Panama 3.0 -17.9 9.9 7.5 5.0
Paraguay -0.4 -0.6 4.3 4.0 3.9
Peru 2.2 -11.1 11.3 3.2 3.0
St. Lucia -0.1 -20.4 3.3 10.6 7.8
St. Vincent and the Grenadines 0.5 -3.0 -6.1 8.3 6.1
Suriname 1.1 -15.9 -3.5 1.8 2.1
Uruguay 0.4 -5.9 3.4 3.1 2.5
Latin America and the Caribbean 0.8 -6.7 6.3 2.8 2.6
Source: World Bank and staff calculations. Note: The cut-off date for the data is September 23, 2021.

RECOVERING GROWTH: REBUILDING DYNAMIC POST-COVID-19 ECONOMIES AMID FISCAL CONSTRAINTS 11
CHAPTER 1
FROM DEVASTATION TO AN ANEMIC RECOVERY PATH

RECOVERING GROWTH:REBUILDING DYNAMIC
POST-COVID-19 ECONOMIESAMID FISCAL CONSTRAINTS
12 chApter 1 | From devAstAtion to An Anemic recovery pAth
Latin America and the Caribbean (LAC) is recovering from the COVID-19 crisis. Vaccination rates have steadily risen, and mortality rates are progressively under control after a tragic loss of life at a scale incomparable in memory, and among the most heartbreaking in the world. The pressure on health
facilities is slowly relaxing, and school doors are reopening. Matching the health impact, the 2020 economic downturn in the region was the deepest in this century and globally notable for its severity, especially af-flicting the lower strata of society. But here, too, gross domestic product (GDP) forecasts have been revised steadily upward over the summer with favorable tailwinds offering opportunities for full recovery of 2020 losses.
But recovery to what? Even if a new variant does not threaten gains to date, the scars left on the economy and society are deep: unsustainable fiscal accounts; a private sector with unclear indebtedness and health; and up to a year-and a half of lost human capital accumulation to name only a few. Taking a longer view, these blows are layered on what might be called the “second lost decade” of the 2010s. While the world grew at 3.1 percent, LAC grew at 2.2 percent, a rate too low to pull LAC populations to prosperity and calm social unease- and this was before the arrival of COVID-19. The weak performance was partly driven by erosion of commodity prices, the sensitivity to which only underscores how undiversified the economies of the region remain. Of more concern, given the strong favorable tailwinds from external factors —continued low global interest rates, strong recovery in principal trade partners, a potential new commodity super-cycle— is the recovery has been unexpectedly weak, and growth forecasts for 2022 and 2023 are back to the lackluster pre-COVID-19 rates. The recovery is anemic for internal reasons, and the analysis here confirms the ur-gent need to address a list of long recognized growth-impeding internal shortfalls in infrastructure, firm capabilities and innovation, education, energy policy, andgovernance, while confronting some new climate change challenges.
Chapter 1 first lays out how the pandemic brought us here, and what the economic and social implications have been. We then discuss the conjunctural macroeconomic challenges going forward: the possible down-sides of another outbreak; a possible tightening of international and domestic liquidity to restrain inflation; the rise in corporate debt and the de-transparentization of the banking sector that could undermine future stability; and the disappearing fiscal space.
This last issue is especially critical as it occurs precisely at a time of new urgency to address more structural factors in our economies. The large countercyclical policies put in place during the pandemic were suc-cessful in protecting at risk populations during the worst of the pandemic, but fiscal space in the region has been almost depleted and continued deficits may become unsustainable, thus creating their own drag on the economy.
Hence the second chapter of this report argues that faced with an unforgiving fiscal panorama over the fore-seeable horizon, it is time to precisely intensify the focus on how efficiently and wisely we raise and spend public resources to lay the foundation for dynamic and inclusive growth going forward. We focus on growth neutral revenue mobilization, potential savings through reduced waste and leakages, and reallocation of existing resources. Though a thorough discussion of all candidate areas is not possible in the span of this document, the goal is to put several ideas on the policy table and highlight recurring principles of reform, including increasing transparency and information; increasing public sector accountability and employing private sector discipline; working toward consistency and coherence across programs; and maintaining an equity lens throughout.

RECOVERING GROWTH:REBUILDING DYNAMICPOST-COVID-19 ECONOMIESAMID FISCAL CONSTRAINTS
chApter 1 | From devAstAtion to An Anemic recovery pAth 13
The Ongoing Challenge of COVID-19
Slow Progress Defeating COVID-19In the first year and a half of the COVID-19 pandemic, Latin America and the Caribbean (LAC) experienced the highest death tolls among all developing regions (Figure 1.1) despite most countries in the region impos-ing strict stay-at-home orders, closing most non-essential activities, and even imposing curfews. Some ar-gue that the low effectiveness of these measures and the poor quality of data collected on death tolls across the region may explain part of this puzzle (Shi and Taskin, forthcoming). However, World Bank calculations of “excess mortality”—the number of deaths above what is usually expected at that time of year—place Latin America (LA) substantially above other regions of the world after January 2021 (figure 1.2).1
Figure 1.1: LAC Leads the World on Cumulative Confirmed COVID-19 Deaths
NO DATA 0 10 20 30 10050 200 300 500 1,000 2,000 3,000 5,000 10,000
Source: Our World in Data.Note: Data reported as of September 20, 2021.
Figure 1.2: COVID-19 Hit LA Especially Hard and Remains a Barrier to Recovery
0102030405060708090
0
5
10
15
20
25
30
Jan-
20
Feb-
20
Mar-2
0
Apr-2
0
May-2
0
Jun-
20
Jul-2
0
Aug-
20
Sep-
20
Oct-2
0
Nov-2
0
Dec-2
0
Jan-
21
Feb-
21
Mar-2
1
Apr-2
1
May-2
1
Jun-
21
Jul-2
1
Excess mortality
World excluding LA LA (right-axis)
Percent Percent
Source: Our World in Data.Note: Excess mortality is measured as the percentage difference between the reported and projected number of deaths for each country and time period, as provided by Our World in Data. Latin America (LA), includes Bolivia, Brazil, Chile, Colombia, Ecuador, Mexico, Paraguay, and Peru. The global sample covers 59 countries. The aggregates represent weighted averages by population.
1 As in previous editions, we defined excess mortality as the difference between the total number of deaths in 2020 and the corresponding figure in “normal” times — measured in practice as the average mortality of the previous five years. To ensure meaningful comparison, both official COVID-19 deaths and excess mortality are reported relative to the population.

RECOVERING GROWTH:REBUILDING DYNAMIC
POST-COVID-19 ECONOMIESAMID FISCAL CONSTRAINTS
14 chApter 1 | From devAstAtion to An Anemic recovery pAth
Exploring excess mortality across individual countries in the region (figure 1.3), we observe that Peru, Mex-ico, Bolivia and Ecuador have suffered peaks in mortality that triple the size of those usually experienced across the whole pandemic period. Brazil and Uruguay were hit much harder in 2021 than in 2020. Chile and Costa Rica saw positive but relatively small excess mortality rates throughout the different waves.
The burden of COVID-19 has not been shared equally across society. Detailed tracking shows that in Bogota, Columbia infection rates rose sharply in poorer sections of the city, a pattern that is likely to be repeated elsewhere (Laajaj et al. 2021). In low- and middle-income countries (LMICs), mortality among young people is relatively higher compared to high-income countries (HICs) (Demoynbynes et al. 2021).
Figure 1.3: Progress on COVID-19 Varies by Country but Reflects Gains in VaccinationExcess mortality (per million people)
0
400
800
1200
1600
Jan−20 Dec−20 Aug−21
ARG
0
400
800
1200
1600
Jan−20 Dec−20 Aug−21
BOL
0
400
800
1200
1600
Jan−20 Dec−20 Aug−21
BRA
0
400
800
1200
1600
Jan−20 Dec−20 Aug−21
CHL
0
400
800
1200
1600
Jan−20 Dec−20 Aug−21
COL
0
400
800
1200
1600
Jan−20 Dec−20 Aug−21
CRI
0
400
800
1200
1600
Jan−20 Dec−20 Aug−21
ECU
0
400
800
1200
1600
Jan−20 Dec−20 Aug−21
GTM
0
400
800
1200
1600
Jan−20 Dec−20 Aug−21
MEX
0
400
800
1200
1600
Jan−20 Dec−20 Aug−21
PER
0
400
800
1200
1600
Jan−20 Dec−20 Aug−21
SLV
0
400
800
1200
1600
Jan−20 Dec−20 Aug−21
URY
Deaths Expected deaths
Sources: National statistical agencies and World Bank staff calculations.
While economic activity recovered after countries relaxed quarantines and lockdowns, the hopes for a full return to normalcy are still pinned on vaccines. As Figure 1.4 shows, LAC is making progress, but the region still lags far behind advanced economies and other emerging regions such as East Asia and advances in vac-cinations differ across countries. On the positive side, Chile and Uruguay reported completed vaccination

RECOVERING GROWTH:REBUILDING DYNAMICPOST-COVID-19 ECONOMIESAMID FISCAL CONSTRAINTS
chApter 1 | From devAstAtion to An Anemic recovery pAth 15
rates close to 75 percent and countries like Argentina, Brazil, Costa Rica, Ecuador, El Salvador, and Panama accelerated their campaigns, growing their vaccinated population by more than 6 percent in the last two weeks. On the negative side, the Central American and Caribbean countries report vaccination rates below 20 percent, and the share of the vaccinated population in these economies is increasing at a slow pace.
Figure 1.4: LAC is Advancing on Vaccinations, but Still Lags Other Regions
Source: Our World in Data.
NO DATA 0% 10% 20% 30% 40% 50% 60% 70% 80%
Note: Data reported as of September 20, 2021. Data reflects share of fully vaccinated population.
Figure 1.5: Progress in Vaccination Rates Varies Across the Region
ATG
ARG
BHS
BRB
BLZ
BOL
BRA
CHLCOL
CRI
DMADOM
ECU
SLV
GRD
GTM
GUY
HTI
HND
JAM
MEX
NIC
PAN
PRY
PER
KNALCAVCT
SUR TTO
URY
VEN
0
2
4
6
8
10
12
0 10 20 30 40 50 60 70 80
14-d
ay ch
ange
in fu
lly va
ccina
ted
popu
lation
Percent of fully vaccinated population
Source: Our World in Data.Note: The 14-day change is reported between August 28, 2021, and September 10, 2021.

RECOVERING GROWTH:REBUILDING DYNAMIC
POST-COVID-19 ECONOMIESAMID FISCAL CONSTRAINTS
16 chApter 1 | From devAstAtion to An Anemic recovery pAth
Devastating Human CostsThe COVID-19 pandemic left deep scars. Estimates show that LAC suffered one of the largest recessions in the world with an aggregate GDP loss of 6.7 percent in 2020 (figure 1.6). 2021 is predicted to be a rebound year with revised growth rates estimated at 6.3 percent.
Figure 1.6: From Low Growth to the Worst Recession
-8
-6
-4
-2
0
2
4
6
8
10
2003 2004 2005 2006 2007 2008 2009 2010 2011 2012 2013 2014 2015 2016 2017 2018 2019 2020 2021(e) 2022(f )
Real GDP growthPercent
Sub-Saharan Africa Europe & Central Asia East Asia & the PacificSouth Asia Middle East & North Africa Latin America & the Caribbean
Source: World Bank.Note: e=estimate; f=forecast.
Figure 1.7 shows that employment fell dramatically in 2020 Q2 and has yet to recover. Part of this fall was due to the fall in output, but part also was due to declines in participation, perhaps driven by concerns about the pandemic itself. Moreover, as the recent World Bank Report Employment in Crisis: The Path to Better Jobs in a Post-COVID-19 Latin America (Silva et al. 2021), argues, as in previous crises, we are likely to see a roughly 2 percent shift from formal to informal employment.2
Figure 1.7: Employment Remains Below Pre-Pandemic Levels
70
75
80
85
90
95
100
105
110
2019Q1 2019Q2 2019Q3 2019Q4 2020Q1 2020Q2 2020Q3 2020Q4 2021Q1 2021M2–M4 2021M3–M5
Number of people employed (2019Q1=100)
Argentina Brazil Chile Colombia Costa Rica Mexico
Sources: National statistical agencies and staff calculations.
The COVID-19 outbreak has highlighted the ability of social protection systems to mitigate deteriorations in well-being by partially replacing lost income. Countries throughout the region have topped up existing social assistance schemes and expanded programs to reach new beneficiaries, including in the informal
2 http://hdl.handle.net/10986/35549.

RECOVERING GROWTH:REBUILDING DYNAMICPOST-COVID-19 ECONOMIESAMID FISCAL CONSTRAINTS
chApter 1 | From devAstAtion to An Anemic recovery pAth 17
sector. Coverage of cash transfers expanded from 28 percent to 67 percent of the population in LAC (World Bank 2020). The impact has been impressive, but uneven. Without the mitigation measures, the region was projected to add 28 million poor people; instead, for the region as a whole, 2 million fewer people were in poverty in the region in 2020 than in 2019. However, most of these gains were heavi-ly concentrated in Brazil. Excluding Brazil, whose transfer programs were very generous, the region is projected to suffer an increase of 3 percentage points in the number of people living with less than USD 5.5 between 2019 and 2020 (figure 1.8). This translates into more than 13 million people drop-ping below the poverty line. The Human Develop-ment Index (HDI) (Figure 1.9), a measure created by the United Nations that combines changes in in-come, health, and education in equal shares, shows an unprecedented decline unseen even during the global financial crisis.
Figure 1.9: The Human Development Index Recorded Its Largest Drop
-0.030
-0.025
-0.020
-0.015
-0.010
-0.005
0
0.005
0.010
1991
1992
1993
1994
1995
1996
1997
1998
1999
2000
2001
2002
2003
2004
2005
2006
2007
2008
2009
2010
2011
2012
2013
2014
2015
2016
2017
2018
2019
2020
Annu
al ch
ange
in H
DI va
lue
2020 simulated change in COVID-19 adjusted HDI
Global financial crisis
Sources: Human Development Index (HDI), Human Development Report (2020) and staff calculations.Note: The HDI is reported for the World.
Yet, another especially worrisome outcome of the pandemic is the large costs in human capital foregone due to persistent school closures. Estimates suggest that learning-adjusted years of schooling (LAYS) in LAC may have decreased from 7.8 years to 6.4-6.7 years on average (figure 1.10). These losses affect all countries and could represent a significant long-term drag on labor productivity growth. Since they are most acute among the lower social strata, they may also exacerbate existing inequalities and impede up-ward mobility.
Figure 1.8: Without Brazil, Poverty Increased Sharply Throughout the Region
20
22
24
26
28
30
2015 2016 2017 2018 2019 2020e
Percent of population living on less than USD5.5 a day
LAC LAC without Brazil
Source: World Bank 2021. Note: e=estimate. The Latin America and Caribbean regional aggregate is estimated based on a sample of 18 countries (LAC-18).

RECOVERING GROWTH:REBUILDING DYNAMIC
POST-COVID-19 ECONOMIESAMID FISCAL CONSTRAINTS
18 chApter 1 | From devAstAtion to An Anemic recovery pAth
Figure 1.10: The Region Suffered Large Losses in Learning-Adjusted Years of Schooling
0123456789
10
Baseline Scenario 1 Scenario 2 Scenario 3
Learning-Adjusted Years of Schooling (LAYS)
Arge
ntina
Braz
il
Chile
Colom
bia
Costa
Rica
Dom
inica
Dom
inica
n Re
publi
c
Ecua
dor
El Sa
lvado
r
Gren
ada
Guat
emala
Guya
na
Haiti
Hond
uras
Jam
aica
Mexic
o
Nica
ragu
a
Pana
ma
Para
guay
Peru
Trini
dad
and
Toba
go
Urug
uay
LAC
regio
n
Source: World Bank Staff calculations.Note: Methodology follows Azevedo et al. (2021) “Country Tool for Simulating the Potential Impacts of COVID-19 School Closures on Schooling and Learning, version 6 transpose.” School closures data comes from the UNESCO database, available in https://en.unesco.org/covid19/educationresponse. Scenario 1 considers that partially opened systems are equivalent to fully closed systems (assuming very low coverage); ii) Scenario 2 assumes that partially opened school systems are 20 percent opened (or 80 percent closed), iii) Scenario 3 assumes that partially opened school systems are 40 percent opened (or 60 percent closed).
Recovering, without Taking OffAfter facing one of the worst economic recessions in 100 years, the region is poised to grow at 6.3 percent for 2021, a credible recovery but still insufficient to recover pre-pandemic GDP levels for most countries. There are significant differences across countries. At the high end, Guyana again posted high GDP growth rates driven by the exploitation of large oil discoveries. Among the other top performers, Belize, Chile, the Dominican Republic, Panama, and Peru are all expected to grow at rates above 9 percent. Other large econ-omies in the region like Argentina and Colombia are expected to grow at 7.5 and 7.7 percent respectively while Brazil and Mexico are expected to post growth rates above 5 percent. Caribbean economies populate the bottom end of the growth distribution as they heavily rely on tourism flows that are recovering slowly. St Vincent and the Grenadines, Suriname, and Haiti, still recovering either from disasters or political up-heaval, are expected to lose 6.1, 3.5, and 0.8 percent of GDP, respectively. the Bahamas, Barbados, Jamaica, Grenada and St Lucia are expected to grow between 2 and 3.5 percent in 2021 (figure 1.11).
Figure 1.11: GDP Growth Rates Have Been Robust
-25-15-10-505101520253035
-8-6-4-202468
101214
St. V
incen
t and
the
Gren
adine
sSu
rinam
e
Haiti
Baha
mas
, The
Ecua
dor
Gren
ada
Urug
uay
Barb
ados
St. L
ucia
Dom
inica
Jam
aica
Costa
Rica
Para
guay
Hond
uras
El Sa
lvado
r
Guat
emala
Braz
il
Boliv
ia
Nica
ragu
a
Mexic
o
Colom
bia
Beliz
e
Dom
inica
n Re
publi
c
Pana
ma
Chile
Peru
Guya
na (r
ight a
xis)
GDP growth rate in 2021fPercent Percent
Source: World Bank staff calculations.Note: f = forecast.

RECOVERING GROWTH:REBUILDING DYNAMICPOST-COVID-19 ECONOMIESAMID FISCAL CONSTRAINTS
chApter 1 | From devAstAtion to An Anemic recovery pAth 19
Figure 1.12 shows that these gains in most cases will at best just offset the GDP losses in 2020. Chile and the Dominican Republic lie above the 45-degree line and will more than recover. Brazil, Colombia, and Mexico lie above but close to the line and will just recover. Argentina, Ecuador, Peru, and Uruguay lie below the line and will fall short of full recuperation.
Figure 1.12: Most Countries Have Not Regained their 2019 Levels of Income
Real GDP losses in 2020 (e)- percent
Real GDP growth in 2020e vis-a-vis 2021f
ARGBOL
BRACHL
COL
CRI
DOM
ECUSLV
GTM MEX
NIC
PANPRY
PER
URY
-25
-20
-15
-10
-5
0
5
10
15
20
25
-10 -5 0 5 10 15 20 25
Real
GDP
gains
in 2
021 (
f)- p
erce
nt
Source: World Bank staff calculations.Note: e=estimate, f=forecast.
While current estimates point towards a rebound that will be insufficient to make up for the 2020 losses in many countries, these estimates are continuously evolving, and the latest revisions have been mostly pos-itive. Additional green shoots arise from studies trying to gauge current domestic business sentiment. An artificial intelligence (AI) analysis of quarterly earnings call transcripts of major corporations with interests in LAC show that sentiment around the region’s ability to battle back against COVID-19 was less upbeat than in East Asia and the Pacific or Europe and Central Asia, yet overall business sentiment shook that off and is now relatively favorable (figure 1.13). Improvements in business sentiment typically lead to higher domestic investment and thus higher economic growth.
Figure 1.13: Machine Learning Estimates of Business Sentiment from Quarterly Earnings Calls Investors Are Shaking Off Concerns About Progress on COVID-19
-3.5
-3.0
-2.5
-2.0
-1.5
-1.0
-0.5
0.0
0.5
1.0
1.5
Jan-20Feb-20
Mar-20Apr-2
0May-
20Jun
-20Jul
-20Aug-20
Sep-20Oct-2
0Nov-2
0Dec-2
0Jan
-21Feb-21
Mar-21Apr-2
1May-
21Jun
-21Jul
-21Aug-21
Overall business sentiment across regions
East-Asia and the Pacific Europe and Central Asia Latin America and the Caribbean Sub-Saharan Africa
-1.5
-1.0
-0.5
0
0.5
1.0
1.5
Jan-20Feb-20
Mar-20Apr-2
0May-
20Jun
-20Jul
-20Aug-20
Sep-20Oct-2
0Nov-2
0Dec-2
0Jan
-21Feb-21
Mar-21Apr-2
1May-
21Jun
-21Jul
-21Aug-21
COVID-19 sentiment across regions
Source: Shi and Taskin, forthcoming.Note: The analysis is based on the earning calls transcripts of publicly listed companies in the United States stock market between 2006-Q1 and 2021-Q3. Middle-East and North Africa and South Asia are excluded from regional charts due to small number of observations. The average values are calculated using the observations between January 2010 to December 2018 for overall business sentiment and January 2020 to December 2020 for COVID-19 sentiment. The last observation is August 12, 2021. See Shi and Taskin (2021) for further details.

RECOVERING GROWTH:REBUILDING DYNAMIC
POST-COVID-19 ECONOMIESAMID FISCAL CONSTRAINTS
20 chApter 1 | From devAstAtion to An Anemic recovery pAth
The Paradoxical Recovery: A Return to Anemic Growth Despite Favorable Tailwinds
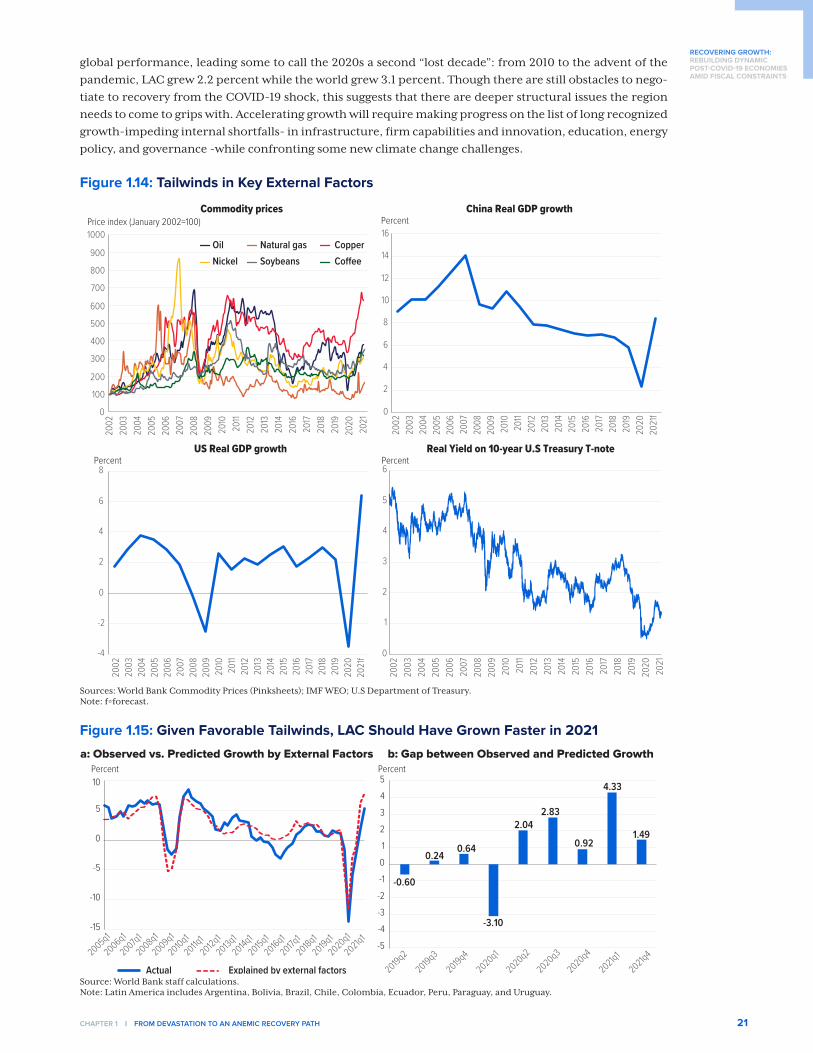
Beyond the economic rebound experienced in 2021, economic projections for the region are lackluster al-beit with some variance across countries and industries. Colombia, for example, is expected to grow de-cently at 4.2 percent in 2022 and 3.8 percent in 2023. Moreover, during times of heightened uncertainty, economic green shoots may arise from unexpected technological disruption which, as highlighted in our previous semiannual report (World Bank 2021), can contribute to reinvigorating productivity growth when public stimuli start to dry up. Sizeable advances in digitization and other technologies adopted to manage social distancing may introduce new products and industries as well as inject more competitiveness. This said, on average, the region is expected to register growth of 2.8 percent in 2022, similar to the growth ex-perienced between 2017 and 2019. This return to low growth is predicted despite clearly favorable external factors. Figure 1.14 show the evolution of three major external drivers of growth for the region. First, foreign demand for goods and services is expected to rebound as the two major trade partners of the region, the US and China, experience robust economic recoveries. International liquidity, which is an important de-terminant of the cost of external borrowing, remains abundant, as the Federal Reserve and the European Central Bank continue their expansive monetary policies. Finally, commodity prices, which represent an important source of growth for commodity exporters, have been on the rise, foretelling the potential of a new commodity super cycle.
For a region that heavily depends on international trade foreign financing as well as the price of commod-ities, the disappointing growth implies a significant drag on the economy arising from domestic factors. To measure the size of such a drag, we rely on a simple model that estimates the output growth in the region predicted by the three external drivers mentioned above. As shown in figure 1.15, the model estimates a significant gap between the growth predicted by external factors and actual growth (see box 1.2). The esti-mates predict that the region may have missed upwards of 4 percentage points of annualized GDP growth relative to the potential growth presented by external tailwinds by the first quarter of 2021 although the gap narrows to 1.5 percentage points by the end of 2021. While these estimates vary by country, this regional “underperformance,” combined with the low pre-COVID-19 rates of growth relative to the rest of the world, are worrisome. Figure 1.15 suggests a decline in growth preceding the pandemic that significantly lagged
Box 1.1. Machine Learning: Earnings Calls Transcripts Offer Early Information on Economic Trends
Analyzing earnings calls transcripts offers an early view into how companies see the evolution of the econ-omy months before formal statistics are released. Machine learning technologies allow “reading through” thousands of transcripts and generating an aggregate sentiment index. Shi and Taskin (forthcoming) for this report employed 178,339 transcripts publicly listed companies in the United States stock market cover-ing companies headquartered in 81 different countries between 2006-Q1 and 2021-Q3. Sentiment score in a given text is calculated by the balance of positive and negative words divided by the total number of words. In each earning call, the COVID-19 sentiment score is calculated around the COVID-19 mentions. Specifical-ly, the sentiment score within 10 words before and after each COVID-19 mention is calculated and averaged across these mentions to obtain the COVID-19 sentiment score in each earning call. The COVID-19 sentiment for a region in each call is calculated by the same method by focusing on the text around COVID-19 that cites at least one country of the region within 10 words before or after the COVID-19 mention. The regional sen-timent scores are calculated by focusing on the text around the mentions of the corresponding region or its countries. Z-scores are computed as raw series minus average score divided by standard deviation.
The economic sentiment score shows a strikingly high correlation of 0.87, with realized GDP evolution two months forward from 2010-Q1 and 2021-Q1 and hence gives useful intelligence on future trends.
See Shi and Taskin (forthcoming) for further details.
RECOVERING GROWTH:REBUILDING DYNAMICPOST-COVID-19 ECONOMIESAMID FISCAL CONSTRAINTS
chApter 1 | From devAstAtion to An Anemic recovery pAth 21
global performance, leading some to call the 2020s a second “lost decade”: from 2010 to the advent of the pandemic, LAC grew 2.2 percent while the world grew 3.1 percent. Though there are still obstacles to nego-tiate to recovery from the COVID-19 shock, this suggests that there are deeper structural issues the region needs to come to grips with. Accelerating growth will require making progress on the list of long recognized growth-impeding internal shortfalls- in infrastructure, firm capabilities and innovation, education, energy policy, and governance -while confronting some new climate change challenges.
Figure 1.14: Tailwinds in Key External Factors
0
100
200
300
400
500
600
700
800
900
1000
2002
2003
2004
2005
2006
2007
2008
2009
2010
2011
2012
2013
2014
2016
2017
2018
2019
2020
2021
Commodity pricesPrice index (January 2002=100)
Oil Natural gas CopperNickel Soybeans Coee
0
2
4
6
8
10
12
14
16
2002
2003
2004
2005
2006
2007
2008
2009
2010
2011
2012
2013
2014
2015
2016
2017
2018
2019
2020
2021
f
2002
2003
2004
2005
2006
2007
2008
2009
2010
2011
2012
2013
2014
2015
2016
2017
2018
2019
2020
2021
f
China Real GDP growth Percent
-4
-2
0
2
4
6
8
US Real GDP growth Percent
0
1
2
3
4
5
6
2002
2003
2004
2005
2006
2007
2008
2009
2010
2011
2012
2013
2014
2015
2016
2017
2018
2019
2020
2021
Real Yield on 10-year U.S Treasury T-notePercent
Sources: World Bank Commodity Prices (Pinksheets); IMF WEO; U.S Department of Treasury.Note: f=forecast.
Figure 1.15: Given Favorable Tailwinds, LAC Should Have Grown Faster in 2021
a: Observed vs. Predicted Growth by External Factors b: Gap between Observed and Predicted Growth
-15
-10
-5
0
5
10
2005q1
2006q1
2007q12008q1
2009q1
2010q12011q
12012q1
2013q12014q
12015q1
2016q12017q
12018q1
2019q12020q1
2021q1
Actual Explained by external factors
-0.60
0.240.64
-3.10
2.042.83
0.92
4.33
1.49
-5
-4
-3
-2
-1
0
1
2
3
4
5
2019q22019q3
2019q42020q1
2020q2
2020q3
2020q4
2021q12021q4
PercentPercent
Source: World Bank staff calculations. Note: Latin America includes Argentina, Bolivia, Brazil, Chile, Colombia, Ecuador, Peru, Paraguay, and Uruguay.

RECOVERING GROWTH:REBUILDING DYNAMIC
POST-COVID-19 ECONOMIESAMID FISCAL CONSTRAINTS
22 chApter 1 | From devAstAtion to An Anemic recovery pAth
Box 1.2. A Model of Growth Explained by External Factors
In the last decades, Latin America and the Caribbean has opened to international trade and financial flows, coupling its growth to external forces. The share of trade as percent of GDP increased from 32 percent in 1990 to 46 percent in 2020, while net inflows of foreign direct investment (as percent of GDP) have multi-plied by five. Trade agreements have flourished, and open capital accounts are the norm.
As result, the relationship between growth and the external sector has strengthened. For instance, the cor-relation between South America’s growth and the change in commodity prices is 0.80, while that with Chi-na’s growth is above 0.70. In the same period, the correlation between Central America, Mexico, and the Dominican Republic’s growth with that of the G7 amounts to 0.85.3
The external factors model seeks to exploit these correlations to get an estimate of how LAC’s (expected) growth is driven by the global economy. Specifically, following De la Torre et al. (2013), the model collects the part of GDP growth that is explained by external variables that are common to all countries in the region. To keep the model simple, only four variables are included to gather real and financial variations in LAC’s external sector. Real global factors are represented by the growth of China and the G7, in conjunction with the change in commodity prices. Financial factors are represented by international interest rates.4
Using quarterly data from 2005, the annual growth rate of each country is regressed against these foreign variables. The estimated values represent the expected growth due to external factors. These rates are then aggregated by region through a weighted average. The weights represent the share of each country’s GDP in the region’s total in 2019. Forecasted values are obtained by combining the estimated parameters of the model with the World Economic Outlook (WEO) forecasts of the external variables.
Figure B1: Growth Response to External Factors (in percentage points)
G7 growth China growth
Change in commodity pricesChange in LIBOR
-0.08-0.06-0.04-0.020.000.020.040.060.080.100.12
Argentina Brazil Colombia Peru-3.0
-2.5
-2.0
-1.5
-1.0
-0.5
0.0
0.5
Argentina Brazil Colombia Peru
0.0
0.2
0.4
0.6
0.8
1.0
1.2
Argentina Brazil Colombia Peru0.0
0.5
1.0
1.5
2.0
2.5
3.0
3.5
Argentina Brazil Colombia Peru
Sources: Haver Analytics, IMF WEO and World Bank staff calculations.Note: The dots show the point estimates and the lines represent 95 percent confidence intervals.
3 Using quarterly data between 2005 and 2019. South America includes Argentina, Bolivia, Brazil, Chile, Colombia, Ecuador, Peru, Para-guay, and Uruguay. Panama is excluded from Central America.
4 As international rates the Treasury’s 10-year yield and the six-month London interbank offered rate (LIBOR) were used with similar results. The LIBOR is used in the results presented here, since this rate is forecasted in the WEO.

RECOVERING GROWTH:REBUILDING DYNAMICPOST-COVID-19 ECONOMIESAMID FISCAL CONSTRAINTS
chApter 1 | From devAstAtion to An Anemic recovery pAth 23
As an example, Figure B1 shows the estimated response of the annual growth rate to variations in external factors for Argentina, Brazil, Colombia, and Peru. Growth is particularly associated with G7 and China’s GDP, while there is more variation in the response of growth to changes in commodity prices, with coun-tries like Argentina and Brazil showing a stronger association. As expected, growth rates are (on average) negatively associated with foreign interest rates.
More generally, among the four external factors, South America’s growth seems most correlated with the economic activity in the G7 (with an average elasticity of 1.16) and in China. Similar results are found for Central America, Mexico, and the Dominican Republic (CAMD). This subregion’s growth is particularly as-sociated with G7’s growth (with an average elasticity of 1.25). Relative to South America, CAMD’s growth seems to be less responsive to changes in commodity prices and in China’s growth.
Source: World Bank staff calculations .
Challenges to Recovery
New COVID-19 OutbreaksLAC’s rapid advancement in vaccines and recent better news in managing the Delta variant is partly respon-sible for the more positive market assessments in recent months. However, the likelihood of the emergence of new strains including those more resistant to present vaccines is impossible to know, and the impact on the economy even less so. Part of the diminished economic activity arose because of the severe Non-Phar-maceutical Interventions (NPIs) (e.g., lockdowns) imposed across the region. Even if these become less prev-alent during future outbreaks, it is also important to acknowledge that throughout the pandemic, citizens demobilized themselves. Figure 1.16 shows that, even without any NPIs, the increase in COVID-19 deaths led to a drop in google mobility measures across countries of all income levels. In both high-income and lower middle-income countries, the voluntary demobilization was as at least as important as NPIs. As a particular striking but relevant case, the decline in patronizing restaurants in the US occurred entirely before any NPIs were implemented. These voluntary effects arguably exacerbated the recession in LAC because of the large role of the informal sector, which initially contracted in several countries due to fear of contagion (Leyva and Urrutia 2021; Alvarez et al. 2021).
Figures 1.16: Much of the Slowdown in Activity Was Due to Voluntary Self Distancing
a. Decline in Restaurant Reserva-tions vs. COVID-19 Cases - US
b. Workplace Mobility Decline vs. COVID-19 Cases by Country Income Level
Resta
uran
t res
erva
tions
(year
-on-
year
per
cent
)
-5 0 5 10Log (case per 1 million people)
No shutdown Shutdown
US
-100
-50
0
50
-100
-50
0
50
Wor
kplac
e m
obilit
y(p
erce
nt d
eviat
ion fr
om b
aseli
ne)
-5 0 5 10Log (case per 1 million people)
LIC LMIC UMIC HIC
No shutdown
Source: Maloney and Taskin 2019. Note: U.S. Restaurant reservations against COVID-19 incidence. Workplace mobility is Google measure of work-related mobility index. LIC, LMIC, UMIC, and HIC stand for Low-Income Countries, Lower-Middle-Income Countries, Upper-Middle-Income Countries, and High-Income Countries, respectively.
RECOVERING GROWTH:REBUILDING DYNAMIC
POST-COVID-19 ECONOMIESAMID FISCAL CONSTRAINTS
24 chApter 1 | From devAstAtion to An Anemic recovery pAth
The take-away is that control of the virus is essential to a healthy recovery and that, regardless of measures that authorities take, continued mortality will be a drag on growth. Though we are fundamentally treading in the unknown, one set of estimates predicts that a severe outbreak would shave 1 percentage point off growth (Gagnon, Kamin, and Kearns 2021).5
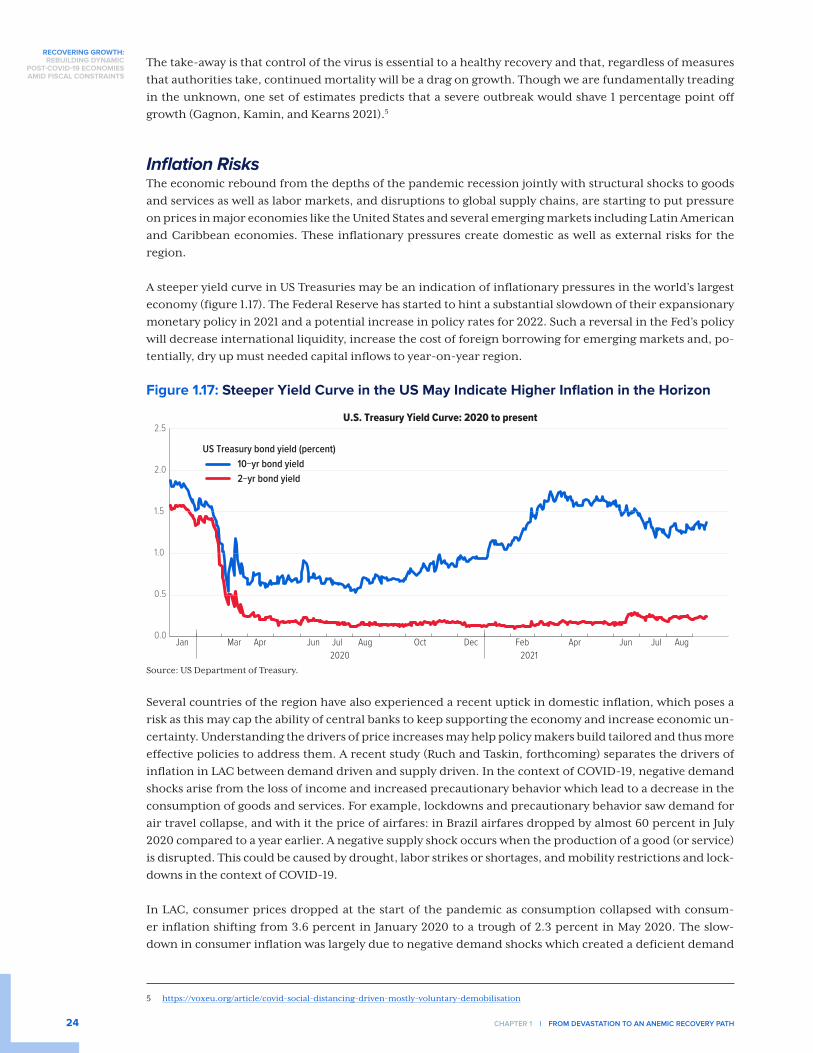
Inflation RisksThe economic rebound from the depths of the pandemic recession jointly with structural shocks to goods and services as well as labor markets, and disruptions to global supply chains, are starting to put pressure on prices in major economies like the United States and several emerging markets including Latin American and Caribbean economies. These inflationary pressures create domestic as well as external risks for the region.
A steeper yield curve in US Treasuries may be an indication of inflationary pressures in the world’s largest economy (figure 1.17). The Federal Reserve has started to hint a substantial slowdown of their expansionary monetary policy in 2021 and a potential increase in policy rates for 2022. Such a reversal in the Fed’s policy will decrease international liquidity, increase the cost of foreign borrowing for emerging markets and, po-tentially, dry up must needed capital inflows to year-on-year region.
Figure 1.17: Steeper Yield Curve in the US May Indicate Higher Inflation in the Horizon
0.0
0.5
1.0
1.5
2.0
2.5
Jan Mar Apr AprJun Jul Aug Jun Jul AugOct Dec Feb2020 2021
10−yr bond yield2−yr bond yield
U.S. Treasury Yield Curve: 2020 to present
US Treasury bond yield (percent)
Source: US Department of Treasury.
Several countries of the region have also experienced a recent uptick in domestic inflation, which poses a risk as this may cap the ability of central banks to keep supporting the economy and increase economic un-certainty. Understanding the drivers of price increases may help policy makers build tailored and thus more effective policies to address them. A recent study (Ruch and Taskin, forthcoming) separates the drivers of inflation in LAC between demand driven and supply driven. In the context of COVID-19, negative demand shocks arise from the loss of income and increased precautionary behavior which lead to a decrease in the consumption of goods and services. For example, lockdowns and precautionary behavior saw demand for air travel collapse, and with it the price of airfares: in Brazil airfares dropped by almost 60 percent in July 2020 compared to a year earlier. A negative supply shock occurs when the production of a good (or service) is disrupted. This could be caused by drought, labor strikes or shortages, and mobility restrictions and lock-downs in the context of COVID-19.
In LAC, consumer prices dropped at the start of the pandemic as consumption collapsed with consum-er inflation shifting from 3.6 percent in January 2020 to a trough of 2.3 percent in May 2020. The slow-down in consumer inflation was largely due to negative demand shocks which created a deficient demand
5 https://voxeu.org/article/covid-social-distancing-driven-mostly-voluntary-demobilisation

RECOVERING GROWTH:REBUILDING DYNAMICPOST-COVID-19 ECONOMIESAMID FISCAL CONSTRAINTS
chApter 1 | From devAstAtion to An Anemic recovery pAth 25
environment (figure 1.18.a). At its peak in the second quarter of 2020, demand shocks contributed almost 1 percentage point to the decline in inflation. These shocks reversed in 2021—reflecting in part base effects—and contributed significantly to the rise in consumer inflation through 2021. The collapse in supply at the start of COVID-19 only partially offset the impact of the deficient demand environment and increased infla-tion by 0.2 percentage point during the second quarter of 2020.
Demand and supply dynamics differed across the region (figure 1.18.b). In Brazil, Colombia, and Mexico, large demand shocks pushed inflation down and was only partially offset by supply shocks in Colombia and Mexico. The collapse in demand was largest in Brazil and Colombia. In Peru, supply shocks limited the fall in inflation at the onset of the pandemic, contributing close to 0.4 percentage point to consumer inflation. In Chile, however, supply shocks contributed 0.5 percentage points and saw an increase in inflation during 2020.
With vaccination rates remaining moderately low and uncertainty about the course of economic activity still significantly elevated, uncertainty around inflation is equally high. The standard deviation on consum-er inflation during COVID-19 was four-times higher than in normal times. In 2021, uncertainty has declined but remains elevated. Inflation uncertainty will likely remain above normal levels until the COVID-19 pan-demic is under control and supply-demand mismatches are resolved.
Figures 1.18: Inflation in LAC is Nudging Upward and is Largely Demand Driven
Consumer inflation (rhs)Supply Demand
a. Inflation decomposition, LAC
0
1
2
3
4
5
6
7
8
-1.0-0.8-0.6-0.4-0.2
00.20.40.60.81.0
2019 2020 2021
PercentPercent
Supply Demand Consumer inflation
Percentage pointsb. Inflation decomposition, by country
-3
-2
-1
0
1
2
3
2020 2021 2020 2021 2020 2021 2020 2021 2020 2021Brazil Chile Colombia Mexico Peru
Source: Ruch and Taskin, forthcoming. Note: Based on sign-restricted Bayesian VAR models. Decompositions only show demand and supply shocks and exclude other shocks. Shocks are measured as deviations from a model-based constant. Regional aggregates are a weighted average of Brazil, Chile, Colombia, Mexico, and Peru using 2020 constant GDP in USD. “Consumer inflation” is shown as a deviation from a model-based constant or initial condition.

RECOVERING GROWTH:REBUILDING DYNAMIC
POST-COVID-19 ECONOMIESAMID FISCAL CONSTRAINTS
26 chApter 1 | From devAstAtion to An Anemic recovery pAth
Firm Arrears, Debt Overhang and Financial StabilityThe reduction in sales caused by COVID-19 has led many firms to run arrears and fall behind in payments. Figure 1.19 tabulates the share of firms that report being likely to be in arrears in the next six months. Several countries find themselves with over 40 percent of firms reporting a likelihood of arrears in the six months after January 2021, and two are over 60 percent. The concern is threefold. First, these firms will either exit from COVID-19 with high levels of debt, impeding capital accumulation and growth, or they are, de fac-to bankrupt and continue as zombie firms. Developing more streamlined mechanisms than often clumsy bankruptcy procedures of the region, particularly for small and medium enterprises (SMEs), is an urgent priority (figure 1.20). Governments, to the degree feasible, may continue to offer support: preliminary data suggest that the share of firms varies with access to public support: 9 percent in Mexico, 20 percent in Viet-nam, 30 percent in Brazil and 65 percent in Poland. This, too, has perils to the degree that it props up less efficient firms and prevents the necessary reallocation of resources to their most productive use.
Figure 1.19: Much of the Private Sector is in ArrearsShare of firms that answered yes to: Is it expected that this establishment will
fall in arrears in any of its outstanding liabilities in the next 6 months?
0
20
40
60
80
Argentina Chile Colombia El Salvador Guatemala Honduras Mexico Nicaragua Sao PauloWave 1 (May 2020) Wave 2 (Aug 2020 - Jan 2021) Wave 3 (May 2021 - Jul 2021)
Source: World Bank Pulse Surveys.Note: Firms reporting the expectation of falling into arrears in any of their outstanding liabilities in the next months. For Colombia, the questions refer to the expectation of falling into arrears within the next month. For Argentina, Chile and Sao Paulo, the figures include firms which are already in arrears at the time of survey.
Figure 1.20: LAC’s Debt Resolution Mechanisms Need to Be Streamlined
0
20
40
60
80
100
Gren
ada
Haiti
St. K
itts a
nd N
evis
St. V
incen
t & th
e Gre
nadin
esVe
nezu
ela, R
BGu
yana
Ecua
dor
Guat
emala
Hond
uras
Surin
ame
Costa
Rica
Dom
inica
Antig
ua an
d Ba
rbud
aSt
. Luc
iaDo
mini
can
Repu
blic
Pana
ma
Arge
ntina
Nica
ragu
aPa
ragu
ayBo
livia
Luxe
mbo
urg
El Sa
lvado
rBe
lize
Peru
Trini
dad
and
Toba
goBr
azil
Baha
mas
, The
Urug
uay
Barb
ados
Jam
aica
Mexic
oCo
lombia
Fran
ceAu
stria
Italy
Spain
Swed
enUn
ited
King
dom
Puer
to R
icoNo
rway
Germ
any
Unite
d St
ates
Finlan
d
Ease of Doing Business - "Resolving insolvency" scores
Advanced economies LAC countries LAC Average
LAC average: 39.16
Source: Doing Business 2020.Note: The score for resolving insolvency is the simple average of the scores for each of the component indicators: the recovery rate of insolvency proceedings involving domestic entities, as well as the strength of the legal framework applicable to judicial liquidation and reorganization proceedings.
Second, in some countries, tariffs have been raised explicitly to support firms, effectively “off the budget.” While understandable, given the high levels of concentration of industry in the region (see for example, De Loecker and Eeckhout 2018) and overall low levels of contestability, reversing this tendency will be important both from a point of ensuring allocative efficiency, and also improving within firm performance. 6
6 See, Cusolito and Maloney (2018) for a discussion of the sources of productivity growth.

RECOVERING GROWTH:REBUILDING DYNAMICPOST-COVID-19 ECONOMIESAMID FISCAL CONSTRAINTS
chApter 1 | From devAstAtion to An Anemic recovery pAth 27
Finally, in many countries, banks have forborne debt payments for long periods. This effectively has led to a process of de-transparentization of the banking sector- it is not possible to know what share of these assets will eventually be healthy, and which will eventually be classified as non-performing loans. A sudden uncovering of an unknown volume of non-performing loans could put the financial sector under stress, suggesting active monitoring by financial authorities would be prudent.
A WorldBank analysis (Feyen and Mare 2021) of what increase in NPLs would wipe out the capital buffers for at least 20 percent of the total banking system assets suggests that, for the median country in LAC, NPLs would have to rise by 10 percentage points to threaten system stability7. For some countries, the buffers are substantially less, which combined with a high share of firm arrears poses a situation meriting close atten-tion by supervisory agencies.
Disappearing Fiscal Space To mitigate the devastating effects of the pandemic on economic activity, the Latin American and Caribbe-an countries applied strong counter-cyclical fiscal policies in 2020. Stimulus packages ranged in size from relatively small, less than 2 percent of GDP in Mexico, to very large, more than 10 percent of GDP in Brazil. As shown in figures 1.21 and 1.22, fiscal efforts are still predominant throughout the region in 2021. These efforts have translated into large primary fiscal deficits. Chile, Colombia, and Peru — to name a few - are estimated to post deficits in excess of 4 percent of GDP this year.
Figure 1.21: Widespread Overall and Primary Fiscal Deficits
Fiscal balance in LAC, 2021f
Overall balance Primary balance
-20-15-10-505
1015
Percent of GDP
Bahamas,
The
St. Vinc
ent &
the Gren
adines
Bolivia
ColombiaChile Beliz
e
St. Luc
ia
Panama
Brazil
Dominica
Costa Rica
Honduras
Uruguay
Mexico Peru Haiti
Barbados
Surina
me
Paraguay
Dominican
Republic
El Salv
ador
Nicarag
ua
Guatem
alaGuya
na
Jamaic
a
Grenada
Source: World Bank and staff calculations. Note: f=forecast.
Figure 1.22: Large Fiscal Efforts Continue in 2021
-16-14-12-10-8-6-4-202
2018
2019
2020
e
2018
2019
2020
e20
21f
2018
2019
2020
e20
21f
2018
2019
2020
e20
21f
2018
2019
2020
e20
21f
2018
2019
2020
e20
21f
2018
2019
2020
e20
21f
2018
2019
2020
e20
21f
Argentina Brazil Chile Colombia Ecuador Peru Uruguay Mexico
As a
perc
ent o
f GDP
Fiscal balance in selected LAC Countries: South America and Mexico, 2018-2021
Overall balance Primary balanceSource: World Bank.Note: e=estimate; f=forecast
7 This analysis has several important limitations and should be interpreted as a rough approximation of banking system resilience. Limitations in-clude data quality, simplifying stress test assumptions, focus on credit shock only, uncertain COVID-19 outlook, impact of regulatory forbearance, quality and extent of policy/fiscal support, and second round effects among others.

RECOVERING GROWTH:REBUILDING DYNAMIC
POST-COVID-19 ECONOMIESAMID FISCAL CONSTRAINTS
28 chApter 1 | From devAstAtion to An Anemic recovery pAth
Providing households and firms as much fiscal relief as possible during the worst time of the pandemic was a sensible policy, which may have helped many households and firms across the region avoid the financial abyss. Broad-based social transfers have provided relatively large economic returns and may be needed for the time being. This being said, these fiscal efforts have been conducted in an environment of limited fiscal space and heavily financed by public debt issuances, mostly to foreign investors.
Figure 1.23: Public Debt is on the Rise
2021 2021f LAC average 2019 LAC average
Public Debt-to-GDP Ratios in LAC, 2021f
0
20
40
60
80
100
120
140
160
Haiti
Guatemala Peru
Paraguay Chile
Guyana
Mexico
Honduras
Ecuador
Dominican
Republic
Nicarag
ua
Uruguay
Panama
Grenada
Costa Rica
ColombiaBolivi
aBraz
il
El Salv
ador
St. Luc
ia
Bahamas,
The
Jamaic
a
St. Vinc
ent &
the Grenad
ines
Dominica
Belize
Surina
me
Barbados
60.22
75.38
Percent
Source: World Bank and staff calculations. Note: f=forecast.
The large increases in public debt ratios can be perceived by domestic and foreign investors as fiscally un-sustainable, in which case these developments may affect countries’ credit ratings and consequently limit their access to international credit markets. The average public debt-to-GDP ratio has risen in the past two years by 15 points to 75.38 (figure 1.23). Figure 1.24 shows how the deteriorating fiscal positions of the big economies in the region, such as Brazil, Colombia, Chile, Ecuador, and Peru have been accompanied by significant credit downgrades, which in turn have kept sovereign spreads, i.e., cost of international funds, relatively high (figure 1.25).
Figure 1.24: As Debt Grows Sovereign Credit Ratings Slide
Argentina
Ecuador
El Salvador
Nicaragua
Bolivia
Costa Rica
Jamaica
Brazil (Negative Outlook)
Dominican Republic(negative outlook)
Paraguay
Colombia
PanamaUruguay
Mexico
Peru(negative outlook)
Chile
20
30
40
50
60
70
80
90
100
110
120
D RD C CC CCC- CCC CCC+ B- B B+ BB- BB BB+ BBB- BBB BBB+ A- A A+
Gros
s deb
t (as
a pe
rcen
t of G
DP)
Fitch long-term credit ratings
Sources: Fitch Ratings, World Bank and staff calculations. Note: Arrows indicate change from pre-pandemic positions to the end of 2020. Argentina and Ecuador suffered restricted defaults during the time of the pandemic. Brazil, the Dominican Republic and Peru did not change their ratings, but Fitch moved their outlook to negative foretelling possible downgrades in the future.
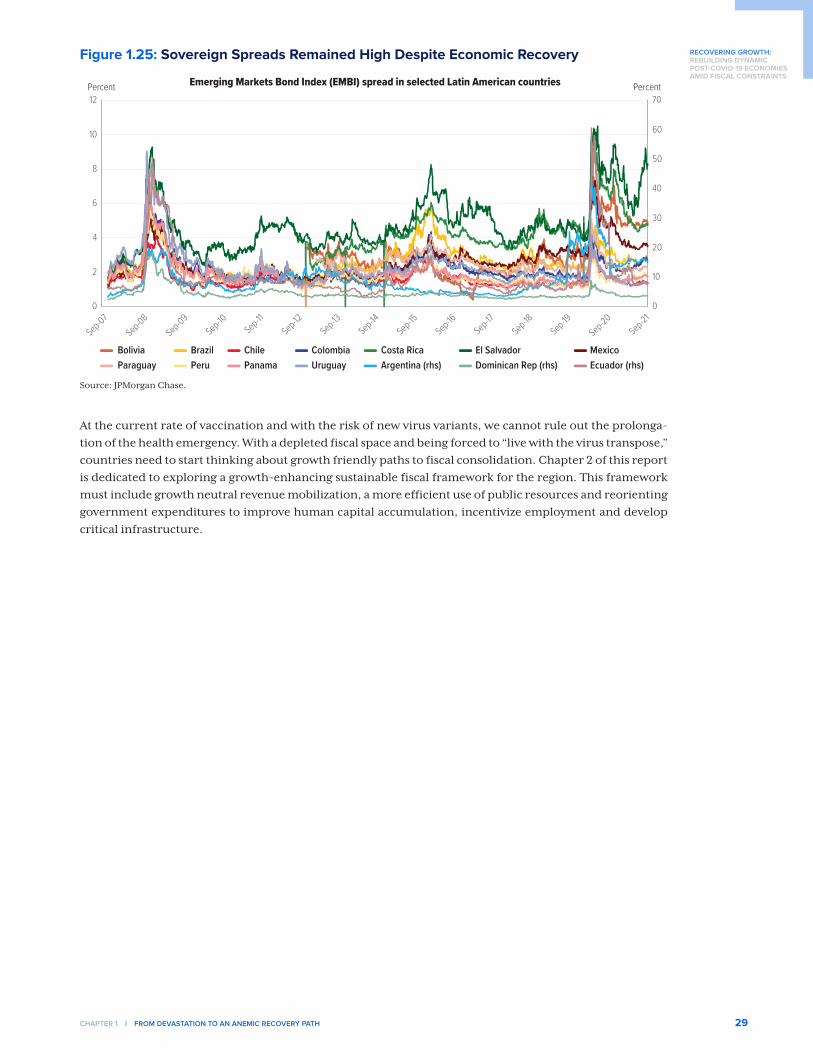
RECOVERING GROWTH:REBUILDING DYNAMICPOST-COVID-19 ECONOMIESAMID FISCAL CONSTRAINTS
chApter 1 | From devAstAtion to An Anemic recovery pAth 29
Figure 1.25: Sovereign Spreads Remained High Despite Economic Recovery
0
10
20
30
40
50
60
70
0
2
4
6
8
10
12
Sep-07Sep-08
Sep-09Sep-10
Sep-11Sep-12
Sep-13Sep-14
Sep-15Sep-16
Sep-17Sep-18
Sep-19Sep-20
Sep-21
Emerging Markets Bond Index (EMBI) spread in selected Latin American countries
Bolivia Brazil Chile Colombia Costa Rica El Salvador MexicoParaguay Peru Panama Uruguay Argentina (rhs) Dominican Rep (rhs) Ecuador (rhs)
Percent Percent
Source: JPMorgan Chase.
At the current rate of vaccination and with the risk of new virus variants, we cannot rule out the prolonga-tion of the health emergency. With a depleted fiscal space and being forced to “live with the virus transpose,” countries need to start thinking about growth friendly paths to fiscal consolidation. Chapter 2 of this report is dedicated to exploring a growth-enhancing sustainable fiscal framework for the region. This framework must include growth neutral revenue mobilization, a more efficient use of public resources and reorienting government expenditures to improve human capital accumulation, incentivize employment and develop critical infrastructure.
30 RECOVERING GROWTH: REBUILDING DYNAMIC POST-COVID-19 ECONOMIES AMID FISCAL CONSTRAINTS
CHAPTER 2
REBUILDING A DYNAMIC, INCLUSIVE AND GREENER ECONOMY IN A CONSTRAINED FISCAL ENVIRONMENT
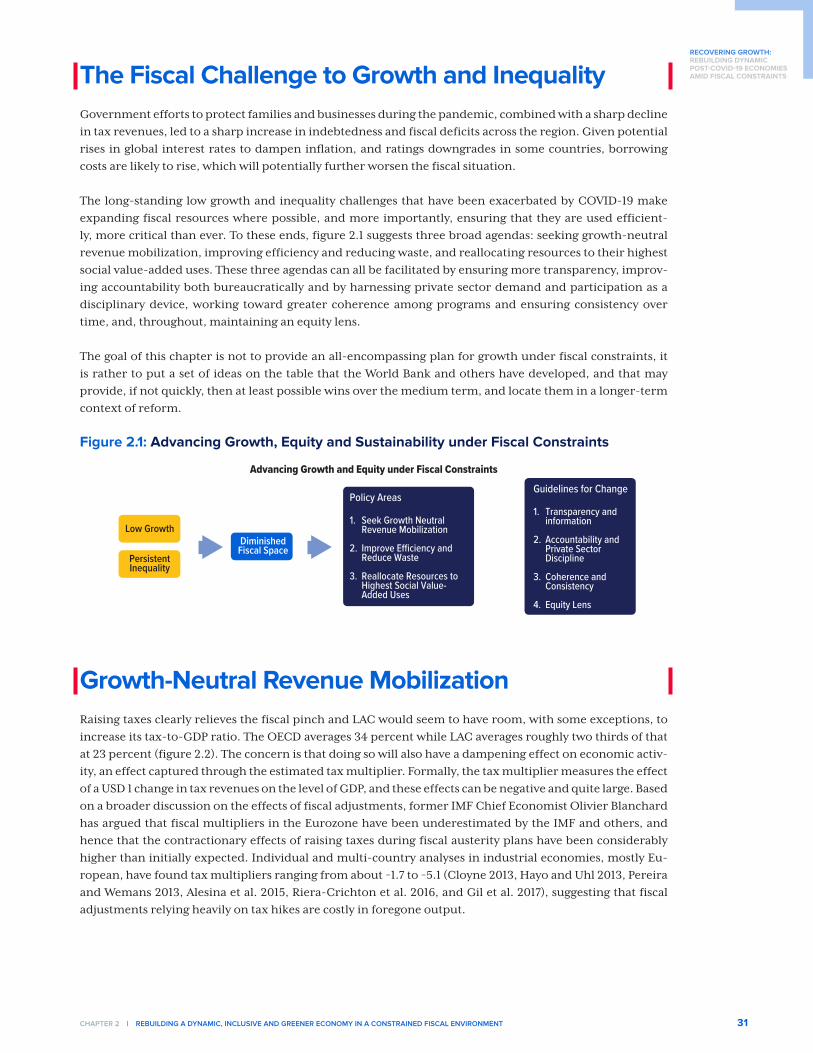
RECOVERING GROWTH:REBUILDING DYNAMICPOST-COVID-19 ECONOMIESAMID FISCAL CONSTRAINTS
chApter 2 | rebuilding A dynAmic, inclusive And greener economy in A constrAined FiscAl environment 31
The Fiscal Challenge to Growth and InequalityGovernment efforts to protect families and businesses during the pandemic, combined with a sharp decline in tax revenues, led to a sharp increase in indebtedness and fiscal deficits across the region. Given potential rises in global interest rates to dampen inflation, and ratings downgrades in some countries, borrowing costs are likely to rise, which will potentially further worsen the fiscal situation.
The long-standing low growth and inequality challenges that have been exacerbated by COVID-19 make expanding fiscal resources where possible, and more importantly, ensuring that they are used efficient-ly, more critical than ever. To these ends, figure 2.1 suggests three broad agendas: seeking growth-neutral revenue mobilization, improving efficiency and reducing waste, and reallocating resources to their highest social value-added uses. These three agendas can all be facilitated by ensuring more transparency, improv-ing accountability both bureaucratically and by harnessing private sector demand and participation as a disciplinary device, working toward greater coherence among programs and ensuring consistency over time, and, throughout, maintaining an equity lens.
The goal of this chapter is not to provide an all-encompassing plan for growth under fiscal constraints, it is rather to put a set of ideas on the table that the World Bank and others have developed, and that may provide, if not quickly, then at least possible wins over the medium term, and locate them in a longer-term context of reform.
Figure 2.1: Advancing Growth, Equity and Sustainability under Fiscal Constraints
Advancing Growth and Equity under Fiscal Constraints
Low Growth
PersistentInequality
DiminishedFiscal Space
Policy Areas
1. Seek Growth Neutral Revenue Mobilization
2. Improve E�ciency and Reduce Waste
3. Reallocate Resources to Highest Social Value- Added Uses
Guidelines for Change
1. Transparency and information
2. Accountability and Private Sector Discipline
3. Coherence and Consistency
4. Equity Lens
Growth-Neutral Revenue Mobilization Raising taxes clearly relieves the fiscal pinch and LAC would seem to have room, with some exceptions, to increase its tax-to-GDP ratio. The OECD averages 34 percent while LAC averages roughly two thirds of that at 23 percent (figure 2.2). The concern is that doing so will also have a dampening effect on economic activ-ity, an effect captured through the estimated tax multiplier. Formally, the tax multiplier measures the effect of a USD 1 change in tax revenues on the level of GDP, and these effects can be negative and quite large. Based on a broader discussion on the effects of fiscal adjustments, former IMF Chief Economist Olivier Blanchard has argued that fiscal multipliers in the Eurozone have been underestimated by the IMF and others, and hence that the contractionary effects of raising taxes during fiscal austerity plans have been considerably higher than initially expected. Individual and multi-country analyses in industrial economies, mostly Eu-ropean, have found tax multipliers ranging from about −1.7 to −5.1 (Cloyne 2013, Hayo and Uhl 2013, Pereira and Wemans 2013, Alesina et al. 2015, Riera-Crichton et al. 2016, and Gil et al. 2017), suggesting that fiscal adjustments relying heavily on tax hikes are costly in foregone output.

RECOVERING GROWTH:REBUILDING DYNAMIC
POST-COVID-19 ECONOMIESAMID FISCAL CONSTRAINTS
32 chApter 2 | rebuilding A dynAmic, inclusive And greener economy in A constrAined FiscAl environment
Figure 2.2: LAC Taxes are Substantially Less than the OECD
LAC avg., 23
OECD avg., 34
0
5
10
15
20
25
30
35
40
Bar
bado
s
Bra
zil
Uru
guay
Arg
entin
a
Jam
aica
Nica
ragu
a
Boli
via
Trin
idad
and
Toba
go
Costa
Rica
Guy
ana
Hon
dura
s
Sain
t Luc
ia
El S
alvad
or
Chile
Ecu
ador
Colom
bia
Bah
amas
, The
Ant
igua a
nd B
arbu
da
Per
u
Mexic
o
Pan
ama
Par
agua
y
Dom
inica
n Re
publi
c
Gua
tem
ala
Percent of GDP
Source: OECD Global Revenue Statistics Database.Note: Values are total tax revenues (as percent of GDP) for 2019. Tax revenues may not be strictly comparable as measures of provision of social services as, for instance, countries which fund pensions through mandated individual contributions in private accounts will show lower taxation despite a comparable burden on taxpayers. Revenue collection also rises with level of development.
The Growth Costs of Tax Hikes are not Necessarily Large in the Developing WorldThese findings, however, may not translate to the developing country context. Recent work at the World Bank on the value-added tax (VAT) for a large set of industrial and developing countries shows that tax hikes are not always contractionary (Gunter et al. 2021). Negative effects on output are found to be highly non-linear with the initial level of tax rates: when initial tax rates are low or moderate, the impact of tax changes on long-run eco-nomic activity is very small (or virtually zero), becoming negative only as the initial level of the tax rate rises. The reason is that the distortion imposed by taxation on economic activity is directly related to the level of tax rates.
This suggests that the growing consensus pointing to large negative tax multipliers in advanced countries is driven mainly by high initial tax rates. As figure 2.3 shows, for half of the world (88 of 175 countries) the tax multiplier is statistically zero. For example, tax changes would have virtually no effect on GDP in coun-tries with low tax rates such as Angola, Costa Rica, Ecuador, Guatemala, Nigeria, and Paraguay which have current VAT rates ranging between 7.5 percent and 14 percent. In contrast, the same tax increase would cause output to fall in countries with relatively high VAT rates, including emerging markets like Argentina and Uruguay and, especially, many industrial European countries. The initial level of taxes is thus a critical consideration when contemplating tax hikes.
Figure 2.3: The Growth Effects of Raising the VAT Vary by Country
Tax Multiplier
0
-5.4
Source: Gunter, Riera-Crichton, Vegh, and Vuletin (2021)Note: The Multiplier represents currency units decrease in real GDP after a one currency unit increase in real revenue from VAT

RECOVERING GROWTH:REBUILDING DYNAMICPOST-COVID-19 ECONOMIESAMID FISCAL CONSTRAINTS
chApter 2 | rebuilding A dynAmic, inclusive And greener economy in A constrAined FiscAl environment 33
Income Taxes: The VAT, by focusing on consumption, tends to be regressive. Individual (or personal) in-come taxes, however, can be designed to be progres-sive and thereby help offset high levels of inequality. Income tax rates are generally low in LAC, but in-creasing them may have more direct adverse effects on labor supply, effort or new business activity. Ev-idence of the elasticity to taxable income (ETI), de-fined as the percentage change in pretax individual income, which in the aggregate is highly correlated with GDP, to a percentage change in the individual income tax, is virtually non-existent in the devel-oping world, including the LAC region. Short-term ETI estimates for the United States range between -0.02 (Saez 2004) to -1.2 (Mertens and Olea 2018), however, recent work at the World Bank by Ventu-ri, Riera-Crichton, and Vuletin (2021) finds that for a sample of 6 Latin American countries (Argentina, Brazil, Colombia, Ecuador, Paraguay, and Peru) the response may be significantly more negative. Figure 2.4 shows a short-term ETI of about -2.5 suggesting that the distortive labor and macroeconomic costs of increasing individual income taxes are, at least, about 2 times larger than those estimated in the United States, suggesting that income taxes are po-tentially costly in terms of growth in LAC.
Property Taxes: The growth impacts of property taxes are expected to be less adverse since the assets are not mobile and the link to growth is less clear, and they can also be designed to be more progressive. There is room to expand them over the medium term in LAC: OECD levels of property taxes constitute 2 percent of GDP (5 percent of taxation) while virtually all countries in LAC are below 0.6 percent and in no LAC country do they exceed 0.8 percent (Birdsall and Gupta 2018, Figure 2.5).
Pro-health Taxes: Though the case for taxing tobacco, alcohol and sugar-sweetened beverages is generally grounded in their effects on health, increasing the excise taxes has been estimated to raise the tax to GDP ratios by an average of 0.7 percent in lower-income countries (LICs) and lower-middle-income countries (LMICs) (World Bank 2019). Spain, for instance, increased the value-added tax on sugar-sweetened bever-ages from 10 to 21 percent in 2021. When longer-term health gains are factored in, pro-health taxes can be expected to deliver most of their benefits to lower-income populations and their net effect is progressive (Fuchs, Icaza and Paz 2019).
Carbon Taxes: Conceived of raising the price of emitting CO2 to reflect the social costs, carbon taxes clearly also count as a source of revenue. Nevertheless, to date, there are few examples in LAC of experiments with carbon taxes. The section below on eliminating energy subsidies makes clear that the revenues involved are very significant.
Tax Compliance: As a final point, raising tax collection efficiency would dramatically increase revenues. As an example, the average rate of evasion of VAT in LAC is 29.4 percent, and of corporate income taxes is 49.2 percent (CEPAL 2000). Both the use of new technologies as well as measures to boost tax morale could reduce evasion substantially.
Figure 2.4: Higher Income Taxes May Have Negative Growth Consequences
-14
-12
-10
-8
-6
-4
-2
0
2
4
6
8
10
12
0 1 2 3 4Pe
rcen
t cha
nge
in Na
tiona
l Inco
me
Year
Source: Venturi, Riera-Crichton, Vuletin (2021).Note: The marginal income tax multiplier represents percent change in national income after a one percentage point change in the average marginal income tax.
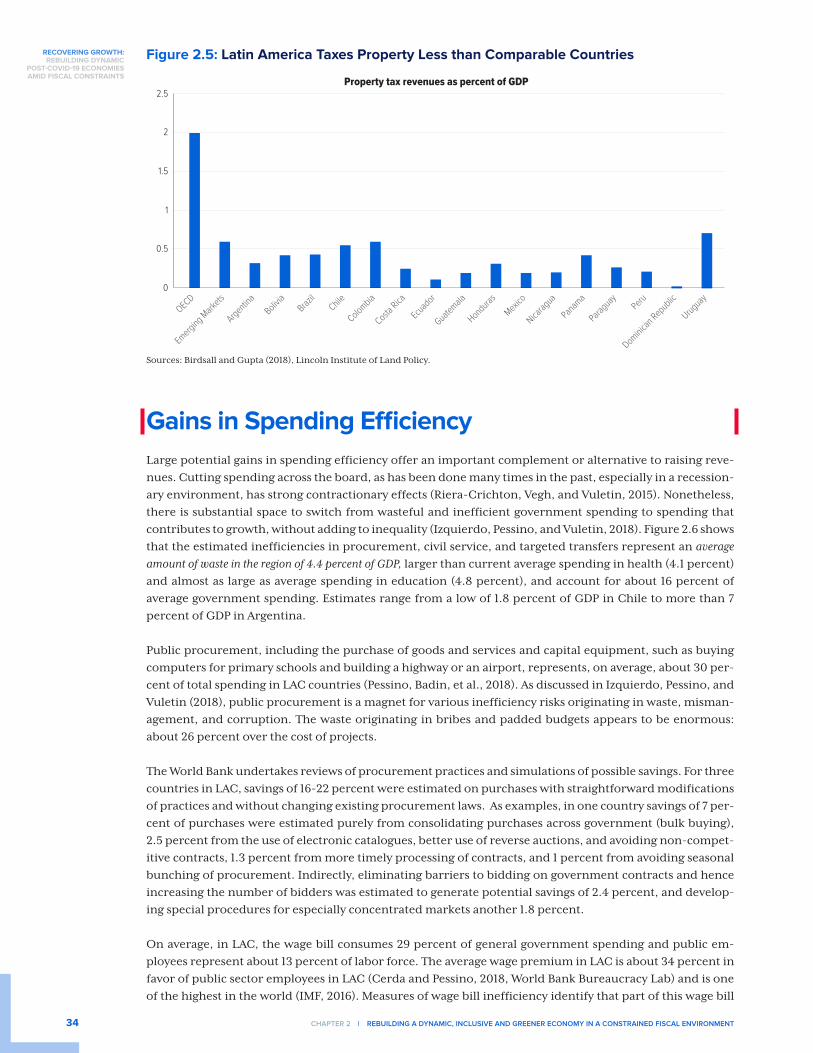
RECOVERING GROWTH:REBUILDING DYNAMIC
POST-COVID-19 ECONOMIESAMID FISCAL CONSTRAINTS
34 chApter 2 | rebuilding A dynAmic, inclusive And greener economy in A constrAined FiscAl environment
Figure 2.5: Latin America Taxes Property Less than Comparable Countries
0
0.5
1
1.5
2
2.5
OECD
Emerging
Markets
Argentina
Bolivia
Brazil
Chile
Colombia
Costa Rica
Ecuador
Guatemala
Honduras
Mexico
Nicarag
ua
Panama
Paraguay Peru
Dominican
Republic
Uruguay
Property tax revenues as percent of GDP
Sources: Birdsall and Gupta (2018), Lincoln Institute of Land Policy.
Gains in Spending EfficiencyLarge potential gains in spending efficiency offer an important complement or alternative to raising reve-nues. Cutting spending across the board, as has been done many times in the past, especially in a recession-ary environment, has strong contractionary effects (Riera-Crichton, Vegh, and Vuletin, 2015). Nonetheless, there is substantial space to switch from wasteful and inefficient government spending to spending that contributes to growth, without adding to inequality (Izquierdo, Pessino, and Vuletin, 2018). Figure 2.6 shows that the estimated inefficiencies in procurement, civil service, and targeted transfers represent an average amount of waste in the region of 4.4 percent of GDP, larger than current average spending in health (4.1 percent) and almost as large as average spending in education (4.8 percent), and account for about 16 percent of average government spending. Estimates range from a low of 1.8 percent of GDP in Chile to more than 7 percent of GDP in Argentina.
Public procurement, including the purchase of goods and services and capital equipment, such as buying computers for primary schools and building a highway or an airport, represents, on average, about 30 per-cent of total spending in LAC countries (Pessino, Badin, et al., 2018). As discussed in Izquierdo, Pessino, and Vuletin (2018), public procurement is a magnet for various inefficiency risks originating in waste, misman-agement, and corruption. The waste originating in bribes and padded budgets appears to be enormous: about 26 percent over the cost of projects.
The World Bank undertakes reviews of procurement practices and simulations of possible savings. For three countries in LAC, savings of 16-22 percent were estimated on purchases with straightforward modifications of practices and without changing existing procurement laws. As examples, in one country savings of 7 per-cent of purchases were estimated purely from consolidating purchases across government (bulk buying), 2.5 percent from the use of electronic catalogues, better use of reverse auctions, and avoiding non-compet-itive contracts, 1.3 percent from more timely processing of contracts, and 1 percent from avoiding seasonal bunching of procurement. Indirectly, eliminating barriers to bidding on government contracts and hence increasing the number of bidders was estimated to generate potential savings of 2.4 percent, and develop-ing special procedures for especially concentrated markets another 1.8 percent.
On average, in LAC, the wage bill consumes 29 percent of general government spending and public em-ployees represent about 13 percent of labor force. The average wage premium in LAC is about 34 percent in favor of public sector employees in LAC (Cerda and Pessino, 2018, World Bank Bureaucracy Lab) and is one of the highest in the world (IMF, 2016). Measures of wage bill inefficiency identify that part of this wage bill

RECOVERING GROWTH:REBUILDING DYNAMICPOST-COVID-19 ECONOMIESAMID FISCAL CONSTRAINTS
chApter 2 | rebuilding A dynAmic, inclusive And greener economy in A constrAined FiscAl environment 35
premium is not driven by skills but rather mainly by higher union density in the public sector and political economy considerations. According to Izquierdo, Pessino, and Vuletin (2018), the overall wage bill ineffi-ciency in LAC is on average 1.2 percent points of GDP (14 percent of wage spending).
About 30 percent of public spending on average in LAC are transfers including social programs, firm sub-sidies, and contributory pensions. Transfers targeting errors or leakages-defined as fraction of program funds that do not reach the intended beneficiaries, typically the poor- are at the core of transfers economic inefficiencies. Main inefficiencies in transfers, including energy subsidies, cash transfers, non-contributory pensions, and tax expenditures to the non-poor, represent about 1.7 percent of GDP in LAC.
Figure 2.6: LAC Suffers Large Waste and Inefficiency in Public Expenditure
Perc
ent o
f GDP
8
7
6
5
4
3
2
1
0
Arge
ntina
El Sa
lvado
r
Boliv
ia
Nica
ragu
a
Colom
bia
Mexic
o
Costa
Rica
Hond
uras
Para
guay
Braz
il
Pana
ma
Dom
inica
n Re
publi
c
Urug
uay
Guat
emala Peru
Chile
Latin
Am
erica
and
the
Carib
bean
4.7 4.63.9 3.9 3.8 3.8 3.7
2.7 2.51.8
4.44.74.85.0
6.3
7.26.5
Leakages in Transfers Procurement Waste Wage Bill Ine�ciency
Source: Izquierdo, Pessino, and Vuletin (2018).
Rethinking Spending PrioritiesThe way to improve outcomes of spending is to ensure that the marginal resources are devoted to the ac-tivity yielding the highest social rate of return, whether being growth promoting or supportive of greater equity. We examine six areas. Again, it is impossible to thoroughly describe reforms of an entire sector of the economy in a few pages. The goal is to put some “big ticket” items on the table with a brief explanation of why World Bank or other experts believe there are wins, quick or over the medium term, that could advance growth and equity by rethinking spending priorities.
A. Strengthening the Health System - Quick Wins to Improve and Expand ServicesOver the long term, Latin America and the Caribbean countries will need to spend more and better on health to effectively face major health emergencies like COVID-19. Ensuring LAC is prepared to meet fur-ther outbreaks, and over the medium term, improve the wellbeing of the population, is critical. A well-per-forming health system is also necessary to ensure a healthy work-force essential to labor productivity and growth. The Health at a Glance report from the OECD and World Bank (2020) showed that health spending in LAC was about USD 1,000 per person in 2017, only a quarter of what was spent in OECD countries (adjusted for purchasing power). Government spending and compulsory health insurance represent an average of 54.3 percent of total health spending in LAC, significantly lower than the 73.6 percent in the OECD. These data show that health systems in the LAC region are heavily dependent on out-of-pocket expenditures or supplemental private insurance from households.

RECOVERING GROWTH:REBUILDING DYNAMIC
POST-COVID-19 ECONOMIESAMID FISCAL CONSTRAINTS
36 chApter 2 | rebuilding A dynAmic, inclusive And greener economy in A constrAined FiscAl environment
Important gains can be made in rationalizing current spending. For example, it is estimated that if LAC countries brought their health efficiency to the frontier, average life expectancy could be extended by four years. A recent multiregional study from the Inter-American Development Bank (Izquierdo et al., 2018) uses data envelopment analysis (DEA) to assess efficiency across eight health system outputs, grouped in three categories: a) health (life expectancy at birth and at age 60, under-five mortality, Disability Adjusted Life Years); b) access to services (DPT immunization, skilled birth attendance); and c) equity of access to services (ratios urban/rural and poorest/richest of skilled birth attendance)8. Chile is the only LAC country in the top 25 percent of the average efficiency ranking, 22 (out of 27) LAC countries are in the bottom half, and 12 in the bottom 25 percent. The LAC efficiency performance is particularly poor for equity of access to services.
Poor allocation of health spending is slowing down if not halting the path towards universal health coverage in LAC. OECD/World Bank (2020) suggests several opportunities where immediate action on the appropri-ate policies can represent quick fiscal wins from the health sector.
• Benchmarking procedures and policies can reduce costs and improve outcomes. As an example, the aver-age of caesarean section rates among 27 LAC countries is 32 per 100 live births, above the OECD average of 28, and twice as high as WHO’s recommendation of no more than 15. Excessive use of antibiotics has no positive impact on patients and causes harm in the form of antimicrobial resistance. Among the LAC countries with data available, Brazil, Bolivia and Paraguay consume more antibiotics per capita than the OECD average.
• Health technology assessments can help ensure that public financing is prioritized and made available for those drugs, devices and procedures that have demonstrated effects in improving health and other outcomes, which also represents a good financial investment. However, only 5 out of 21 LAC countries report using it systematically to make coverage decisions and no country reports using it for reimbursement purposes.
• Health systems fragmentation in LAC is a key source of waste. Most countries have subsystems with duplicated functions of governance, financing, and services provision.
• Reconfiguring health service delivery will bring efficiency. Investing more in primary health care sys-tems based on the principles of patient-centered, first-contact, continued, comprehensive, and coordinated care. The effective implementation of such principles could be accelerated by the ongoing digital health transformation, which should be considered as a strategic and sustained process that is not limited to the immediate response to public health emergencies, such as the one imposed by the COVID-19 pandemic.9 The creation of a digital health strategy and of a dig-ital ecosystem involving other sectors, such as education and connectivity infrastructure, are considered as effective steps for a sustained digital transformation process in the health sector.
• Improving health information systems would raise understanding of public expenditures and their related re-sults. Across 22 LAC countries, an average of 10 percent of all deaths are never reported in public mortality databases.
• Eliminating corruption and improving governance of institutions would lower costs and raise confidence in the system. 42 percent of those interviewed across 12 LAC countries consider the health sector to be corrupt, higher than the 34 percent in 28 OECD countries. Moreover, bribery rate in public health centers reaches 11 percent across 18 LAC countries. In general, the IDB study suggests that efficiency can be improved by improving the quality of institutions.
B. Making Better Grades in Education Efficacy and EquityThe COVID-19 pandemic has dealt unprecedented blows to the region’s growth and equity goals by effec-tively shutting down an education system that was already underperforming. Indeed, LAC employers strug-gle to find the qualified human capital essential to growth and improved productivity. Almost 30 percent of employers in LAC report that an inadequately educated workforce is a major constraint to their current operations relative to 20 percent in the world, the highest of all regions. As importantly, it has also long been
8 The input used for the efficiency analysis is pooled health expenditure, which is the sum of public health expenditure and private prepaid health expenditure.
9 https://blogs.worldbank.org/health/digital-health-solutions-primary-health-care-during-covid-19-lessons-latin-america

RECOVERING GROWTH:REBUILDING DYNAMICPOST-COVID-19 ECONOMIESAMID FISCAL CONSTRAINTS
chApter 2 | rebuilding A dynAmic, inclusive And greener economy in A constrAined FiscAl environment 37
established that education offers the most effective path to upward mobility and lower inequality, but that uneven access and quality of educational services present a barrier to forming more equitable societies.
The present fiscal situation offers an opportunity to rethink both how educational resources are spent and how the quality of the outcome can be improved.
primary and secondary schools in crisisCOVID-19 led to school closures in all countries of the region, except Nicaragua, affecting 170 million stu-dents. These closures were the longest in the world, averaging 159 in person school days missed as of De-cember 2020 and leading to over a year’s loss in human capital accumulation in a region where, as figure 2.7 shows, 15-year-olds already lag 3 years behind their OECD comparators in reading, mathematics, and science. Further, remote learning is the most commonly used strategy to compensate for school closures, but, as noted above, most lower strata families lack access to the internet at modest costs and hence students cannot get access to on-line education platforms and download homework assignments on smart or flip phones or tablets. This has implied that losses from COVID-19 will further exacerbate what figure 2.8 shows to be an already highly unequal distribution of educational attainment. Students in the bottom quintile are lagging at least two years in many countries below their counterparts in the top quintile. The World Bank (2021)’s Acting Now to Protect the Human Capital of Our Children: The Costs of and Response to COVID-19 Pandemic’s Impact on the Education Sector in Latin America and the Caribbean details first the tremendous costs of COVID-19 in these areas, as well as the agenda to recover.
Figure 2.7: 15-Year-Old Students in LAC are, on Average, Three Years Behind OECD Students in Reading, Mathematics, and Science
438
424416415
406402400
395365
334
399
415467
483488
0 50 100 150 200 250 300 350 400 450 500
Latin America
Middle East & North Africa
East Europe & Central Asia
East Asia & the Pacific
OECD
Chile
Uruguay
Mexico
Costa Rica
Colombia
Peru
Brazil
Argentina
Panama
Dominican Republic
Pisa scores, 40 pts=1 grade level
Source: World Bank (2021)
Extending internet access, as discussed above, is an important medium-term goal, but not likely to solve the access problem in the short run. Perhaps more importantly, nothing replaces face-to-face education. Keeping educational institutions open is therefore fundamental. As much as countries have developed mechanisms to keep health professionals where they need to be, the same needs to be done with teachers. In the short run, as students return to school, they will require differential levels of remedial help given the disruptions they face, and many will need counseling and emotional support to overcome the traumatic effects of the pandemic. Content will need to be prioritized and curricula tailored and streamlined. More than ever before, schools will need to be engaging, challenging, and useful—in a word, worth attending, particularly for students at the highest risk of dropping out.

RECOVERING GROWTH:REBUILDING DYNAMIC
POST-COVID-19 ECONOMIESAMID FISCAL CONSTRAINTS
38 chApter 2 | rebuilding A dynAmic, inclusive And greener economy in A constrAined FiscAl environment
Figure 2.8: Wide Gaps in Education Outcomes Reveal Regressive Patterns of Access and Quality
0 100 200 300 400 500 600
Dominican Republic
Panama
Peru
Argentina
Brazil
Colombia
Uruguay
Mexico
Costa Rica
Chile
Pisa scores, 40 pts=1 grade level
509409
390
378
375
373
371
349
333
316
343
481
471
486
466
466
390
461
479
473
Bottom 20% Top 20%
Source: World Bank (2021).
Over the medium run, the present fiscal pressures dictate the need to build an educational system that forms human capital equitably and efficiently.
Prioritizing funding for hardest-hit schools and communities and exploring the potential for using resources more efficient-ly. In Argentina, for example, the Ministry of Education surveyed 24 jurisdictions in the country to assess school infrastructure, and funding for school reopening was allocated based on the identified needs. Chile, Ecuador and Peru have been able to allocate more resources to vulnerable areas in a progressive school finance model, which bodes well for addressing the new challenges.
Teaching better through data and technology. The pandemic forced the adoption of several innovations in edu-cation, the most important of which may be the use of technology. Besides being an indispensable tool for online teaching, technology can be extremely fruitful in three other ways. The first is the use of adaptive technology to teach at the right level, usually through software that offers material adaptively, based on the student’s competence level. The second is the use of technology to track students’ attendance and progress—for instance, to implement early warning systems based on students’ attendance patterns to prevent them from falling behind or dropping out. The third is the use of data-driven instruction that analyzes patterns of students’ performance and uses them to inform teaching.
Allocating resources better through data and technology. New technologies could support efficiency improve-ments as schools reopen to recover from learning losses, especially in under-served areas and schools. Us-ing satellite internet to connect its best teachers to more than 100 million rural students, China managed to improve their learning outcomes while helping address the urban-rural gap in teacher allocation and realize efficiency gains in the use of resources. A comparable strategy, albeit on a much smaller scale, will also be implemented in Guyana.
Over the longer-term, improved monitoring and reporting of educational outcomes together with greater access to data on education finance and resource utilization would help identify and correct spending inef-ficiencies and inequalities, ultimately improving spending decisions and educational outcomes. In Brazil, the state of Ceará has a system of results-based intergovernmental transfers where municipalities compete for a fixed pool of funds by achieving improvements (not by being the best) in key indicators such as learn-ing scores and progression rates. Among all Brazilian states, Ceará achieved the highest improvements in learning outcomes in recent years.

RECOVERING GROWTH:REBUILDING DYNAMICPOST-COVID-19 ECONOMIESAMID FISCAL CONSTRAINTS
chApter 2 | rebuilding A dynAmic, inclusive And greener economy in A constrAined FiscAl environment 39
Improving educational leadership is critical to longer-term efficiency and learning gains. International and regional evidence increasingly suggests that educational leadership is critical in both the public and private sectors, with three broad approaches.
• Improving leader selection processes. In countries across LAC and the world, many school directors are politically appointed without merit-based criteria, or they earn their position solely by being the longest-serving teacher. Research on recent changes in school director selection methods in Brazil, Chile, and Peru show that moving away from political appointments can change who is selected to lead schools and their subsequent performance, but consideration of the quality of the candidate pool, local conditions, and broader political economy are critical to the reforms’ ultimate impacts on student outcomes.
• Developing and implementing practical, coherent training and support for school leaders. Practical pre-service, induction, and in-service training programs that focus on practices tied to student out-comes can have sizable impacts on managerial practices and student outcomes. In the United States, an intensive, two-year in-service training in instructional leadership, delivered to school directors who remained in the same school for both years, raised student test scores by 0.15–0.30 standard deviations. In Argentina, providing school leaders with easy-to-understand student performance data and guidance on how to use those data raised subsequent student test scores by about 0.3 standard deviations. In Guatemala, a short, practice-oriented training program for school leaders to prevent student dropout reduced dropouts by 4 percent.
• Better defining and allocating roles at all levels of the education system and addressing incoherence. In many LAC countries, the quality of services provided by public schools depends as much on the educational authorities who sit above the school level as it does on school directors themselves. New data from Brazil, the Dominican Republic, Guatemala, and Peru show that when school leaders and educational authorities above them do not share a common understanding of their roles and responsibilities, student learning is lower. In Brazil, an impact evaluation found that a program that aligned school directors and local education authorities around specific stu-dent achievement targets increased student test scores by about 0.1 standard deviations and was highly cost-effective.
Higher Education: The Paradox of LAC’s Generous but Ineffective Higher Educational spending The problem of persistent higher level skill scarcity offers a great paradox, since the higher education gross enrollment rate in LAC is 52 percent—higher than the world’s average; only second to Europe and Central Asia (ECA) (which includes Western Europe) and North America—and LAC countries spend more resources in higher education than comparable ECA or East Asia and Pacific (EAP) countries. Indeed, as table 2.1 shows, whereas the average LAC country spends 1.04 percent of GDP on higher education, the average ECA and EAP comparable country spends 0.69 and 0.49 percent, respectively.
Table 2.1: Higher Education Spending and Distribution of Students Across Fields
REGION % OF GDP % IN ENGINEERING % IN SS, BUSINESS, LAW
LAC 1.04 13 38
ECA 0.69 20 34
EAP 0.49 22 28
Sources: UNESCO, World Bank Enterprise Surveys.
The paradox can potentially be explained by two factors. The first is the mix of fields being studied. In the average LAC country, 13 percent of higher education graduates major in Engineering or Science compared to 20 percent in ECA and 22 percent in EAP. Meanwhile, LAC trains relatively more students in Social Sci-ences, Business, and Law.

RECOVERING GROWTH:REBUILDING DYNAMIC
POST-COVID-19 ECONOMIESAMID FISCAL CONSTRAINTS
40 chApter 2 | rebuilding A dynAmic, inclusive And greener economy in A constrAined FiscAl environment
The second is the type of educational programs being attended. Though the vast majority of LAC higher education students see a 4–6-year bachelor’s degree as the only path to advanced education, globally 25 percent of higher education students attend 2–3-year short cycle programs (SCPs) that focus on very practi-cal and occupationally targeted training, both in traditional fields such as advertising, hospitality, physical therapy, and electronics but also in newer ones such as digital animation, app design, big data, and cyberse-curity. LAC is the lowest in the world at 9 percent. This, combined with the ineffectiveness of many training programs, implies that LAC firms are starved for the necessary technical skills. A recently launched World Bank study The Fast Track to New Skills: Short-Cycle Higher Education Programs in Latin America and the Caribbean lays out how LAC arrived at this situation and possible reforms (Ferreyra et al. 2021).
At the core of this problem is the structure of public spending in higher education. In LAC countries, most public spending in higher education consists of transfers to public higher education institutions so that students can attend them at subsidized or zero tuition. This spending has several features (Ferreyra et al. 2017; Ferreyra et al. 2021).
• Weak targeting toward priority fields and programs. Per-student public spending varies little or nothing depending on the field of study. LAC needs more engineers and fewer accountants or lawyers, but that is not reflected in per-student public spending. Further, there are excessive incentives to enroll in bachelor’s programs rather than SCPs. A poor student faced with attending a weak bach-elor’s program at a public institution or a high-quality SCP is pushed toward the former.
• Regressive subsidies. Across the world, heavily subsidized tuition for bachelor’s programs winds up being regressive simply because the taxation that finances the subsidies is not very progressive while those who enroll in bachelor’s programs tend to be from higher income households. Some form of means testing for public support would both free up resources for other types of education and be less regressive. The same pattern occurs with bachelor’s programs vs. SCPs - the public sub-sidy as shown in figure 2.9 is far less per student-year even though SCP students are usually more disadvantaged. This effect is, of course, compounded by the fact that the subsidy to bachelor’s pro-grams lasts up to twice as many years. And as one further compounding effect, among bachelor’s students, those from higher-income families are more likely to enjoy the total subsidy because they are more likely to graduate. Indeed, students from the top income quintile are approximately 20 percentage points more likely to graduate, on average, than those from the bottom two quintiles.
• Low graduation rates. Despite their higher per-student subsidy and their more advantaged stu-dent population, bachelor’s programs have lower graduation rate than SCPs. On average, only 46 percent of bachelor’s students obtain their degree relative to 57 percent of SCP students. Moreover, a comparison of SCP graduates with bachelor’s programs dropouts (which account for about a half of all higher education students) shows that the former attains better labor mar-ket outcomes than the latter in terms of employment, formality, and salaries (figure 2.10). In fact, well-designed SCPs can provide the full set of competencies—technical, cognitive, and so-cio-emotional—required to succeed in the new world of work.
• Lack of accountability and information. Public funding directed to students and institutions is rarely subject to performance evaluation. Institutions often receive funding regardless of their stu-dents’ academic or labor market outcomes (which are, in most cases, not known or published), and students often receive funding regardless of their performance (measured, for instance, by annual progression). In addition, the proliferation of private “garage” universities with no evaluation or published track record often attract low-income families with little information or access to quality institutions. Underneath these issues is a systemic lack of information, as in many LAC countries students and their families have no information on the academic or labor market outcomes of specific institutions and programs—either public or private. In many coun-tries, this is compounded by the unwillingness, on the part of the educational authorities, to act against poorly performing institutions and programs.
• Uneven playing field. While countries subsidize students in public higher education institutions (HEIs) quite generously, most of them provide little to no subsidies or funding mechanisms for students in private HEIs, even though the latter account for about half of the higher education en-rollment in the region. These students might have attended public HEIs if they had enough capac-ity, had offered their desired program, or had been located in a convenient area. The emergence

RECOVERING GROWTH:REBUILDING DYNAMICPOST-COVID-19 ECONOMIESAMID FISCAL CONSTRAINTS
chApter 2 | rebuilding A dynAmic, inclusive And greener economy in A constrAined FiscAl environment 41
of high-quality private institutions has offered an important source of healthy competition to traditional public universities and provided high quality options for students for whom public institutions did not meet their needs. Of course, expanding the support for students in private institutions would require a thorough and transparent evaluation of their quality.
Figure 2.9: Public Subsidies for SCP Students are Lower than for Bachelor’s Students in LAC Countries
0
2000
4000
6000
SC BA SC BA SC BABrazil Colombia Peru
Dolla
rs PP
P 20
19
Private Public
0
2000
4000
6000
Brazil Colombia Peru
Dolla
rs PP
P 20
19Short-cycle Bachelor's
a. Average tuition b. Average subsidy at public HEIs
Sources: Ferreyra et al. (2021) based on countries’ administrative information. Note: All averages are simple averages over programs. In panel a, the orange diamonds indicate zero average tuition. For Colombia, average tuition at public institutions includes SENA programs, which charge zero tuition. In panel b, for a given country, the average subsidy at public higher education institutions (HEIs) for bachelor’s programs equals average tuition in private HEIs minus average tuition in public HEIs, and similarly for SCPs. The figure includes all programs (licensed and non-licensed) in Peru. All monetary values are in dollars (PPP 2019).
Figure 2.10: In LAC, SCP Graduates Attain Better Labor Market Outcomes than Dropouts from Bachelor’s Programs
0
1
2
3
4
5
6
7
High scho
ol
Incomplete SC
P
Complete SCP
Incomplete Bach
elor's
Complete Bachelor's
High scho
ol
Incomplete SC
P
Complete SCP
Incomplete Bach
elor's
Complete Bachelor's
Incomplete SC
P
Complete SCP
Incomplete Bach
elor's
Complete Bachelor's
0
20
40
60
80
100
0
20
40
60
80
100
120
140
a. Unemployment rate b. Formal employment c. Wage premium
Source: Ferreyra et al. (2021) based on SEDLAC.Note: The figures depict average labor market outcomes, circa 2018, for the working-age population, defined as individuals between ages 25 and 65, given educational attainment. Complete bachelor’s includes individuals with graduate degrees. For each level of educational attainment, the corresponding bar shows the simple average outcome over countries. Panel a shows the unemployment rate (percentage of unemployed individuals relative to the labor force). Panel b shows the percentage of employed individuals who have formal employment. Informal workers include salaried workers in firms with up to five employees, self-employed workers with at most a high school diploma, and workers with no reported income. In panel c, the wage premium in each category reflects the percentage by which the average (hourly) wage in the category exceeds the average (hourly) wage for high school graduates. The difference between outcomes for complete SCP and incomplete bachelor’s is significantly different from zero in panels a, b, and c. The difference between outcomes for complete SCP and complete bachelor’s is significantly different from zero in panel c, but not in panels a or b. Comp. = complete; Incomp. = incomplete; SCP = short-cycle programs.
In sum, LAC’s present spending on higher education is bloated relative to comparator countries, inequi-tably distributed, and does not provide the needed skills for rapid growth. Taking relatively inexpensive actions to increase transparency and accountability and explore the reallocation of public higher education funding among students, programs, institutions, and fields would be a step in the right direction, from both a growth and equity perspective.

RECOVERING GROWTH:REBUILDING DYNAMIC
POST-COVID-19 ECONOMIESAMID FISCAL CONSTRAINTS
42 chApter 2 | rebuilding A dynAmic, inclusive And greener economy in A constrAined FiscAl environment
Increasing Information for Efficiency and Equity. Students, universities, governments, and the private sector would benefit from a credible and far-reaching information system that provided accurate and widely dis-seminated measures of output quality. Such a system would measure learning, attainment, and long-term (e.g., job market) outcomes, which are fundamental to know whether the system is meeting its goals. At the primary and secondary levels, for instance, through the PISA scores we know that LAC’s education system is failing relative to comparators. In such a system, the information collected through measurement would be easily available, and prospective college students who are choosing a college major would know the employ-ment outcomes of alternative higher education programs. Since this type of information is harder to pro-cess by less educated parents, these would be assisted by others—such as secondary school teachers and staff. Not only do information policies yield better, more efficient decisions; they also increase equity because students from more advantaged backgrounds can typically gather information through their own channels.
Accountability for Efficiency and Equity. A good higher education system would include strong accountability, hold-ing institutions and programs—especially those with public funding—accountable based on their outcomes. The regulatory authority (for instance, the Ministry of Education) would monitor institutions and programs periodi-cally—not just at the accreditation stage--, and these reviews would be publicly available. The regulatory authority would screen new institutions thoroughly to avoid the opening of “garage” universities, and only authorize the opening of the most solid, promising ones. At the primary and secondary level, for instance, this type of system is effective for charter schools in some jurisdictions of the United States. In those places, aspiring charter schools submit detailed, exhaustive educational and business proposals to the charter school authorizer, which reviews the proposals and authorizes the entry of only the most promising ones. Further, the authorizer monitors the institutions annually based on multiple criteria, and if necessary, closes underperforming schools. The United Kingdom’s inspectorate, carried out by the Office for Standards in Education, Children's Services and Skills (Ofst-ed), takes equally seriously the task of periodically monitoring elementary and secondary schools. Accountability matters not only for efficiency but also for equity, because more affluent parents can always hold an institution accountable by paying for a different one. Low-income families, in contrast, do not have such an option.
If institutions and programs were evaluated by the educational authority (and the students) based on student outcomes, they would have greater incentives to interact closely with the private sector—to gauge its needs, as-sess the adequacy of the graduates, share knowledge, and cooperate on initiatives aiming at growth and devel-opment. Further, institutions would support their students’ job placement—a task that most of them have his-torically not undertaken in LAC. Since countries are eager to implement the so-called “Education 4.0” systems to address the new world of work’s needs, private sector engagement cannot be postponed any further. More-over, the market can provide discipline to ensure the quality and relevance of programs even if governments lack the capacity to do so. For instance, permitting firms to use part of their mandated training budgets to subsidize workers taking courses at SCPs would both pressure those institutions to ensure greater matching of training investments to firm needs, and ensure that those programs were producing skills that workers need.
Targeting for Impact and Equity. While higher education serves society across all fields, LAC’s bias away from sciences, technology, and engineering suggests that the system might reweight public funding to encour-age those strategic fields, which are directly related to growth, as well as towards the highest-performing programs. From an equity point of view, overcoming the intrinsic regressiveness of the present system would again suggest shifting resources more toward high-need students, and particularly those attending SCPs which are both necessary and disproportionately serve disadvantaged populations. This was the spirit of Colombia’s program, Generación E-Excelencia program, which sought to help highly talented, low-income students attend accredited, high-quality institutions through loans covering tuition and living expenses, that were converted to grants upon graduation. The combination of targeting talented disadvantaged students, supporting quality universities, and promoting degree completion all work in the right direction. Looking forward, since public funds will not be enough to support the growing higher education enrollment, it will be imperative to design and implement viable student loans—for instance, income-contingent loans.
Using Technology to Reach More Students and Offer Flexibility. As in elementary and secondary education, it is im-portant to capitalize on the technology and information and communication technology (ICT) investment recently made by the institutions to promote a flexible delivery, particularly for students who work or have family obligations, facilitate remediation, and develop information systems.

RECOVERING GROWTH:REBUILDING DYNAMICPOST-COVID-19 ECONOMIESAMID FISCAL CONSTRAINTS
chApter 2 | rebuilding A dynAmic, inclusive And greener economy in A constrAined FiscAl environment 43
Box 2.1. Finland: Building a World Class Education and Research System
After the Second World War, Finland looked much like Latin America - highly resource-dependent, with a largely agrarian society shifting to a more urban, industrial society. Perhaps the best symbol of that shift is the development of a world class telecommunications industry led by Nokia, a forestry company that over several decades steadily raised its technological capabilities and diversified its production.
A growing middle class started to demand a more equitable education system; at the same time, firms were demanding workers who would be better trained for industry and services. After much consideration and research, in 1968 parliament introduced legislation to reform the K-12 education system. The reforms im-plemented a system of free comprehensive schools for children between seven and sixteen. While the system was centrally controlled at first, over time authority was transferred to local municipalities and teachers. Multiple constituencies worked together on the reform, including governments, unions, and employers. Since the reform was implemented gradually, it was critical to sustain the engagement and commitment of all relevant parties. Crucial to the reform were the adoption of relevant curricula to fulfill the needs of all stakeholders, and the measurement of outcomes. Today, Finland boasts one of the best educational systems in the world.
Since the 60s, Finland has also implemented reforms in higher education. Through reforms introduced in the 80s and 90s, the government steers universities to meet social goals, such as student training in research in specific fields, through a performance contract signed with individual institutions. Fund-ing formulas include basic funding, performance-based funding, and funding related to new projects. Every institution negotiates its budget and goals with the government and is held accountable for its outcomes.
This proved especially important to ensuring that research was both relevant and found its way to the pri-vate sector. The percentage of government financing to university research that was structured as competi-tive and matching grants rose over time to ensure that researchers sought collaborators in the private sector and nudged their research towards greater relevancy given the needs of the country.
Perhaps the main lessons from Finland’s reform for LAC are the need for a deep, sustained commitment; the ability to engage all relevant stakeholders, ranging from parents to teachers to employers; the willing-ness to implement a comprehensive—as opposed to marginal—reform; and significant autonomy for local jurisdictions and institutions. In fact, all new Parliamentarians take a course in the “Finnish Model of In-novation” so they understand the overall growth, labor market, and equity strategy that necessarily spans generations of governments.
C. Repurposing Innovation Resources Increasing technological adoption is critical for raising productivity and product quality, creating better jobs, making growth more environmentally sustainable, and providing better services to citizens. The best identified recent estimates of the returns to Research and Development (R&D) for the US are around 55 percent (Bloom et al. 2013). Advanced countries further from the frontier show even higher rates of re-turn, reflecting their ability to borrow existing technologies (Griffith et al. 2004); and extrapolating to Latin America, the rates would dwarf the returns to any other investment. Further, recent studies suggest that Latin America’s historical underinvestment in technical capabilities proxied by the density of engineers, can explain much of the dramatic divergence of LAC from the now advanced natural resource-based countries, such as Denmark and Sweden, across the 20th century (Maloney and Valencia 2020).
The paradox, then, is why Latin America invests so little in innovation capabilities and R&D, both absolutely and relative to its level of income. As a proxy, average R&D expenditures are 0.6 percent of GDP compared to double that (1.2 percent) for middle-income countries and 1.4 percent for upper-middle-income coun-tries. The World Bank’s Innovation Paradox: Developing Country Capabilities and the Unrealized Promise of Techno-logical Catch-up suggests that part of the reason is that governments and firms do not expect the promised

RECOVERING GROWTH:REBUILDING DYNAMIC
POST-COVID-19 ECONOMIESAMID FISCAL CONSTRAINTS
44 chApter 2 | rebuilding A dynAmic, inclusive And greener economy in A constrAined FiscAl environment
expected returns, and this points to four critical areas of reform to improve the impact of funds before increasing their quantity (Cirera and Maloney 2017, Goñi and Maloney 2017).
• Improve access to the necessary complements to innovation spending. The absence of well-functioning markets, highly educated workers, high levels of managerial capabilities, and quality infrastruc-ture to allow firms to take advantage of scale in markets means that the marginal investment in, for instance, R&D will have much lower rates of return. Further, low levels of domestic com-petition imply little incentive to raise quality in domestic markets. The implied reforms to the national innovation system in LAC, hence, entail a much broader agenda than, for instance, innovation subsidies.
• Readjust the mix of spending. The discussion around innovation often centers on very sophisticated investments in R&D. However, comparative statistics from the World Management Survey and on the ground interviews with firms suggest that most SMEs struggle with even very basic man-agerial tasks and are unlikely to be able to plan and execute R&D projects. Figure 2.11 suggests that the region as a whole is only slightly higher than much poorer countries like Kenya or India in terms of managerial capabilities. Most should probably be focusing on more prosaic advanc-es in adoption of new processes and products, including those that would enable more green recoveries. But this in turn suggests that more “innovation” funding should, in fact, be directed to raising the capabilities of firms to identify new processes and products and implement them. Recent RCTs from India and Colombia suggest that well-designed managerial extension pro-grams can importantly raise the uptake of good managerial practices, and potentially with very high rates of return. Over time, this may boost the private sector contribution to R&D spending (See Iacovone, Maloney and McKenzie forthcoming).
• Rethink the execution of spending and consolidate. The World Bank has pioneered Innovation Pub-lic Expenditure Reviews (iPERs) that track the flow of innovation financing across ministries. What consistently emerges from these iPERs is a plethora of underfunded programs, fragment-ed across ministries without a clear strategic framework for spending. In addition to providing this information, the iPER exercise can play a catalyzing role in the discussion across ministries on how to improve coherence among programs and what the national strategy should be. As Finland also shows, maintaining a political focus on this strategy over decades is a critical in-gredient to success (box 2.1).
Figure 2.11: LAC Lags in Firm Management Practices Necessary to Innovate
ARGBRA
CHL
COL
MEX
NIC
FRA
DEU
GRC
IRL
ITAPOL
PRTESP
SWE
GBR
CHN
IND
JPN
SGP
TUR
AUS
NZL
CAN
USA
ETH GHA
KEN
MOZ
MMRNGA
TZAZMB
22.
53
3.5
Mana
gem
ent
7 8 9 10 11Log of 10−yr average GDP based on PPP per capita (current international $, billions)
Latin America
Europe
Asia
Oceania
North America
Africa
Source: World Management Survey. Note: Management refers to average management practices.

RECOVERING GROWTH:REBUILDING DYNAMICPOST-COVID-19 ECONOMIESAMID FISCAL CONSTRAINTS
chApter 2 | rebuilding A dynAmic, inclusive And greener economy in A constrAined FiscAl environment 45
• Redesign incentives to ensure research resources benefit national objectives. If new ideas do not reach the private sector or the relevant public sector agencies, there will be no impact on growth or improved public services. As figure 2.12 suggests, Latin American firms think less of the quality of their national research establishments than the US, Finland, Norway or Japan, and report far lower levels of collaboration with universities. Tuning incentives to both raise the quality of research institutions and increase the flow of relevant knowledge from them to the private sector are critical. For instance, often LAC research institutes have poorly defined or no mission statement, and funding sources do not encourage them to seek out private sector partners. To turn again to Finland, in the crisis of 1990s government shifted some university funding into competitive matching grants to encourage collaboration with the private sector. Public research institutes rely both on matching grants and private sector contracts to cover their budget. Tax write-offs for R&D were eliminated as not incentivizing collaboration. All these reforms both created incentives to raise the quality of the research, and to ensure tight collaboration between researchers and those taking ideas to market.
Figure 2.12: Subjective Firm Opinion of the Quality of Scientific Research Institutions and the Degree of Collaboration of Firms with Universities
0
1
2
3
4
5
6
7
Unite
d St
ates
Finlan
d
Japa
n
Norw
ay
Kore
a, Re
p.
Costa
Rica
China
Arge
ntina
Chile
Mexic
o
Jam
aica
Urug
uay
Colom
bia
Pana
ma
Braz
il
Guat
emala
Vene
zuela
, RB
Ecua
dor
Peru
Hond
uras
Dom
inica
n Re
publi
c
Para
guay
El Sa
lvado
r
Haiti
Nica
ragu
a
Quality of scientific research institutions University-industry collaboration in Research & Development
Score from 1 to 7 (best)
Source: World Economic Forum Global Competitiveness Report 2017-2018.Note: Score from 1 to 7 (best).
D. Public Transfers for Equity: Converting Short-Term Stimulus to Long Term Growth Transfers constitute large shares of government budgets, although their role in Latin America is modest compared to the OECD. The World Bank showed that in LAC in the 2000s, taxes and transfers created little wedge between the market determined Gini and that of disposable income after tax and transfer. By con-trast the “pre-fisc” EU15 Gini of 0.47 fell by 14 percent points to 0.33 after taxes and transfers. Fully half of the difference in disposable income inequality between Latin America and Europe (or the United States) was attributable to the different effectiveness of tax and transfer systems (Perry et al., 2006).
Still, the question “what do we know about the impact of such transfers on growth” remains. Figure 2.13 shows the size of social transfer multiplier (STM) in developed (blue color) and Latin American (red col-or) countries, respectively, from Bracco et al. (2021). The size of the STM is much larger in Latin American countries than in developed economies, particularly in the short-and medium-term. While the STM in de-veloped countries is 0.3 on impact, it is 0.9 in Latin American economies. In both sets of countries, the peak is reached after one quarter, coming to 0.5 and 1.1 in the developed and Latin American sets, respectively,

RECOVERING GROWTH:REBUILDING DYNAMIC
POST-COVID-19 ECONOMIESAMID FISCAL CONSTRAINTS
46 chApter 2 | rebuilding A dynAmic, inclusive And greener economy in A constrAined FiscAl environment
after which the output effects tend to decrease. In other words, while the temporal profile of the STM is similar in both sets of countries, the size of the STM in Latin American countries is about three times larger overall than the estimates for advanced countries found here or elsewhere. The novel evidence of such large STM on a set of emerging markets -Latin American countries in this case- contrasts sharply with the more modest size of the STM obtained in developed economies (e.g., Gechert, 2015; Romer and Romer, 2016; Alesina et al. 2017; Pennings, 2020). This difference may be explained by the larger share of households that are financially constrained (Bracco et al. 2021). Where a larger share of the population lives hand-to-mouth, social transfers are directly channeled into consumption with attendant effects on output. Evidence from Brazil’s Bolsa Familia Program also suggests that such transfers lead to increases in local formal employment (Gerard, Naritomi, and Silva 2021). Overall, the substantial social transfers during the COVID-19 emergency, and during downturns in general, are effective in preventing vulnerable families from falling into poverty, and also help the economy to recover faster.
Having said that, because most of the effect of a social transfer shock impacts the economy especially in the short and medium-run and through private consumption, as opposed to via increasing the economy’s pro-ductive capacity and investment, this type of fiscal policy tool does not contribute to laying the foundation for long-term growth and productivity. To the degree that the increases in social transfers during COVID-19 will persist, and in contemplating transfers more generally as a tool for reducing inequality, linking them to accumulating human capital, for instance, to support remedial education measures or vouchers for short cycle programs is more likely to have a longer-term effect on growth.
Figure 2.13: Social Transfers Have Three Times the Impact on Output in LAC as in Advanced Countries
5
4
3
2
1
0
-1
-2
-30 1 2 3 4 5 6 7 8
Quarter
Cum
ulativ
e so
cial tr
ansfe
r mult
iplier
On impact, STMdeveloped = 0.3 On impact, STMLAC = 0.95
4
3
2
1
0
-1
-2
-30 1 2 3 4 5 6 7 8
Quarter
Cum
ulativ
e so
cial tr
ansfe
r mult
iplier
3 times larger
Source: Bracco, Galeano, Juarros, Riera-Crichton, and Vuletin (2021)Note: The Multiplier represents currency units increase in real GDP after a one currency unit increase in real social transfers. Dark, medium, and light areas show standard errors at 68, 90, and 95 percent confidence intervals, respectively.
E. Smart Public Investment in Infrastructure Infrastructure moves center stage as a medium-term agenda because it is a well-documented ingredient to growth, because taking advantage of reshoring opportunities will require lifting the region’s game in terms of logistics and mobility costs, and because both climate adaptation and carbon emission reduction will require new kinds of investment across sectors. In a tight budgetary environment, understanding how this can be achieved requires understanding, in particular, how more can be done with less, and the opportu-nities offered by new technologies.
Figure 2.14 re-establishes long understood facts. Infrastructure multipliers are high in underinvesting countries and they increase over time, there is a correlation of infrastructure’s stock and equity, and infra-structure is an essential element of competitiveness. World Bank estimates suggest that the low infrastruc-ture stock in many countries of the region drive multipliers between 1.2-2.

RECOVERING GROWTH:REBUILDING DYNAMICPOST-COVID-19 ECONOMIESAMID FISCAL CONSTRAINTS
chApter 2 | rebuilding A dynAmic, inclusive And greener economy in A constrAined FiscAl environment 47
Figure 2.14: Infrastructure Investment is Correlated with Higher Growth, Equality and Competitiveness
E�ect of Public Investment on GDPEvaluated at low ratio of initialstock of public capital to GDP
Infrastructure Stock vs IncomeInequality
Infrastructure Qualityvs Competitiveness
0
0
1
1
2
2
3 00.0
0.01
0.02
0.03
0.04
0.05
0.06
0.07
-4 -3 -2 -1 1 2 3
3
4 5 6 7 8
Cum
ulativ
e sp
endin
g m
ultipl
ier
Quarter Infraestructure Stocks(1st. Principal Component)
Global Competitiveness Index
Infra
struc
ture
Qua
lity In
dex
y=-0.0303×0.403R=0.2157
RWA
ETHTZA
MDGSEN
KENHNDBWA
NGAFNG
ZWE
ZWB FHUMY
MEXPAN
BOMTHGTHG VENZAF
CF TTOJAMURYARGCIV
EGY
JPNJPNJOR MUS
KCRYSRTWN TWNROMHUNPOL ENGAR
GYPBGR
GER
GER
NLDCHE
CHE FRAFRAHKG SGH
AUSGRSDEL
BELESP
MPR
CHACHN
MDPAK
ECGCOLCHL
MYMY BOMBOMTHGTHG
CHLCHL
BRA
THABFA
UGABDG DN
Gini
Coe�
cient
(0-1)
2.51
2
3
4
5
6
7
3.5 4.5 5.5
Source: Izquierdo et al. (2019).Note: Evidence from European Countries. Evaluated at high, 95th percentile, and low, 5th percentile, initial stock of public capital over GDP ratios.
Source: Calderon and Serven (2004). Source: World Economic Forum (2017), Percenption-Based Infrastructure Index.
Yet, as figure 2.15a shows, public and private infrastructure investment in LAC has been falling steadily from roughly 4 percent in 1980 to 1.3 percent by 2019. With perhaps the exception of Africa, Latin America invests the least in infrastructure among developing regions as a share of GDP—that commonly invest 4–7 percent. Households in LAC spend more on infrastructure-related services than other regions at roughly 14 percent of household income. Much of the fall in investment over time has been driven by the retrenchment of the public sector from 3 percent of GDP to 1 percent that has not been offset by the moderate increase in private sector investment. As figure 2.15b shows, with the exception of Peru, Chile and Honduras, private sector participation remains small.
Figure 2.15: Private Sector Investment Has Not Offset the Fall in Public Infrastructure Investment
0
2
4
6
8
Public Private
0112233445
Perc
ent o
f GDP
Public Investment 1980-2006
Public Investment 2007-2019
Private Investment 1980-2006
Private Investment 2007-2019
Total Investment 1980-2006
Total Investment 2007-2019
a. Infrastructure Investment over Time by Source b. Infrastructure Investment by Country and Source (2015-2019)
1981
1983
1985
1987
1989 1991
1993
1995
1997
1999
2001
2003
2005
2007
2009 2011
2013
2015
2017
2019
Boliv
iaBe
lize
Nica
ragu
aPe
ruPa
nam
aCo
lombia
Costa
Rica
Ecua
dor
Hond
uras
Chile
Urug
uay
Para
guay
El Sa
lvado
rMe
xico
Dom
inica
n Re
publi
cAr
gent
inaGu
yana
Trini
dad
and
Toba
goBr
azil
Guat
emala Ha
iti
Sources: World Bank staff elaborations based on data from Calderon and Servén (2010) for 1980-2006, INFRALATAM for public sector data 2007-2019, and PPI Database for private sector for 2007-2019 (except for Chile, which is not reported in the PPI database). Note: Includes telecommunications, water, energy, and transport (only roads and railways from 1980-2006). Country-level data is weighted by GDP and includes ARG, BRA, CHL, COL, MEX, and PER.
Sources: Data from INFRALATAM for Public Investment. Data from PPI for private Investment, expect for Chile, Uruguay, Panama and Trinidad and Tobago, for which IADB (2020) data is displayed.

RECOVERING GROWTH:REBUILDING DYNAMIC
POST-COVID-19 ECONOMIESAMID FISCAL CONSTRAINTS
48 chApter 2 | rebuilding A dynAmic, inclusive And greener economy in A constrAined FiscAl environment
Low levels of infrastructure investment in the last decades contributed to the widening infrastructure gap needed which is estimated to be 3.4 percent of GDP in capital and 1.1 percent in maintenance (Rozenberg and Fay 2019). Together, needed investment would be 2.0 percent in transport, 1.4 percent in energy, 0.7 percent in water and sanitation, 0.3 percent in flood protection, and 0.1 percent in irrigation, which are-significantly above current levels. As a longer-term goal, 16 countries in LAC would need to invest at least 2 percentage points over current levels to close the infrastructure gap (Castellani et al. 2019).
In the short to medium term, the gap in infrastructure services can be narrowed, by ensuring that spending is well targeted and that it is efficient. Recent World Bank and Inter-American Development Bank studies have identified key whole-of-government challenges that are problematic for public investment manage-ment including:
• Weak planning, project appraisal, and preparation capacity; • Overly rigid or myopic budgeting designed to control fiscal deficits rather than promote effi-
cient spending; • Difficulties with budget execution; • Unclear project sustainability, often due to imbalances between capital and current spending on
infrastructure, often arising, again, from overly rigid budgets and suboptimal planning; • Weak procurement practices; and finally, • An uncompetitive construction industry.
None of these issues require more resources to be resolved, but they do require building government ca-pabilities and altering some procedures (Fay et al. 2017). Quite a few also involve sector reforms, with the traditional recommendations regarding independent, well-performing regulators, and better corporate governance still applicable. Box 2.2, for example, suggests that adopting Performance-Based Contracts for road maintenance can save between 10 and 40 percent over conventional contracts.
Could the private sector do more? Investments captured through the World Bank’s private participation in infrastructure (PPI) database have ranged from 0.5 to 1.2 percent of GDP per year since 2006. But with about one-third of this financing coming from public sources, and about half of the deals requiring public guar-antees, PPI expansion is constrained by limited public finance. In other words, while PPIs may help improve performance, they do not leverage significant amounts of private capital and are best seen as a complement to, rather than a substitute for, public investments (Fay et al. 2017). Box 2.3 describes Colombia’s present system in what has perhaps become best practice in the region in structuring and encouraging private par-ticipation. However, the complementary government guarantees, and co-participation still imposes a limit on private funding.

RECOVERING GROWTH:REBUILDING DYNAMICPOST-COVID-19 ECONOMIESAMID FISCAL CONSTRAINTS
chApter 2 | rebuilding A dynAmic, inclusive And greener economy in A constrAined FiscAl environment 49
Box 2.2. Improving the Sustainability and Efficiency of Road Expenditures: Performance-Based Contracting
what are performance-based contracts (pbc)?PBC is a type of contract in which payments for the management and maintenance of road assets are linked to the Contractor successfully meeting specific performance indicators. The work selection, design, and delivery are all the Contractor´s responsibilities, and payments are not related to the number of workers and services executed. They differ significantly from traditional method-based or input-based contracts, where the client specifies the techniques, technologies, materials, and material quantities, and payment is based on the amounts delivered.
The development of PBCs started in 1988 in Brit-ish Columbia, Canada, by contracting out road maintenance to the private sector and introducing some performance levels for routine maintenance. During the 1990s, PBCs developed in Australia, New Zealand, and the United States, and this ex-pansion would continue rapidly throughout the world in the 2000s. In the developing world, Lat-in America was a pioneer. In 1997, with the World Bank´s support, Argentina contracted out around 11,000 km under its own PBC model, the ´CREMA´ (Contrato de Recuperación y Mantenimiento). By 2010, around 24,000 km of Argentina´s road net-work was maintained under a CREMA. In the re-gion, the model was taken up by many countries such as Brazil, Chile, Peru, and Uruguay. The rapid adoption of PBCs worldwide indicates that they can bring significant benefits and may eventually replace the traditional way of contracting out road maintenance.
What are the Benefits of the PBCs?PBCs offer significant advantages over more traditional approaches:
a) Cost savings in managing and greater efficiency: They are achieved through reduced workforce requirements on the side of the roads agency and by streamlining services through a single, ded-icated contractor. Contractors carry out detailed engineering designs before initiating the work, which minimizes the risk of delays and thus improves the overall efficiency of implementation. Besides, fixed-price contracts reduce the risk of cost overruns. According to different sources (Ss-see table 2.2), PBCs can lead to savings of between 10 and 40 percent over conventional contracts.
b) Stable long-term maintenance financing: A PBC covers several years, which obliges the gov-ernment treasury to make a multi year funding commitment for road maintenance. The expe-rience in Argentina showed that even during times of tight fiscal constraints, the budget process honored the CREMA contract as a long-term commitment, and allocated funds. PBCs can be-come a useful mechanism to ensure some minimum level of maintenance funding.
c) Guarantee of quality and better users’ satisfaction: Contractors’ obligations to maintain the roads and ensure a certain level of service over several years create an incentive to provide good quality rehabilitation work. Thus, the Contractor takes long-term responsibility for the quality of all inputs. This guarantees a better condition of the roads and therefore a greater satisfaction of the users.
d) Economic opportunities: PBCs with capital-intensive, high value rehabilitation works and la-bor-intensive low-cost routine maintenance encourages large contractors to subcontract the latter activities and helps promote the development of small local contractors. For the Contractors, guar-anteeing a consistent workload over a long period is an excellent opportunity for business growth.
Table 2.2: Cost Savings of Different Countries Under PBC over Conventional Contracts
COUNTRY COST SAVINGS, %
Norway About 20-40%
Sweden About 30%
Finland About 30-35%
Holland About 30-40%
Estonia 20%-40%
England 10% minimum
Australia 10-40%
New Zealand About 20%-30%
United States 10-15%
Ontario, Canada About 10%
Alberta, Canada About 20%
RECOVERING GROWTH:REBUILDING DYNAMIC
POST-COVID-19 ECONOMIESAMID FISCAL CONSTRAINTS
50 chApter 2 | rebuilding A dynAmic, inclusive And greener economy in A constrAined FiscAl environment
e) Innovation and enhanced asset management: PBCs stimulate innovation in contractors who are encouraged to continually seek the most cost-effective solutions to achieve maintenance objectives. Besides, the road agencies benefit from applying fundamental Asset Management skills in the preparation of a PBC.
f) Reduction of corruption: PBCs offer a procurement model that is more resistant to corrup-tion than conventional contracts because of fewer transactions involved and more transparen-cy, which also facilitates better audits.
These many benefits explain the expanding interest in PBCs, which can provide solutions for road mainte-nance in the context of fiscal constraints that developing countries often face.
Box 2.3. New Strategies for Attracting Foreign Investment: the 4G and 5G Infrastructure PPP Scheme in ColombiaColombia’s national road network10 comprises primary roads (17,958 km, 9 percent), secondary roads (45,137 km, 22 percent) and tertiary (rural) roads (142,284 km, 69 percent). The primary road network is divided into concessional toll roads (6,999 km, 39 percent), managed by the National Infrastructure Agency (ANI), and publicly managed primary roads (10,959 km, 61 percent) managed by the National Roads Institute, IN-VIAS. The 4th and 5th Generation infrastructure PPPs (4G and 5G), featured in this box, are concessioned and supervised by ANI.
4g: An Ambitious toll road ppp programThe 4G PPP program was launched in 2012 (including the 1508/12 PPP Law) as a strategy to reduce the country’s infrastructure investment gap and modernize key road corridors. The 4G program comprises 40 road conces-sions and 7,000 km of road upgrading and construction. CAPEX amounts to USD 24 billion (COP 47 trillion) and an investment horizon of 8 years. As of 2020, ANI expects 18 of the 40 projects to be delivered by 2022.
The 4G program is a Project Finance scheme that has been internationally recognized for its ability to attract unprecedented levels of private sector investment in Colombia11. Contractually, investors, through an SPV, are responsible for Engineering, Procurement and Construction (EPC), followed by a period of road oper-ation and maintenance of up to 30 years. Financial closure requires a minimum equity/debt ratio of 20/80. Investors include institutional funds, capital markets, and multilateral and commercial banks. Key factors for 4G’s success include (i) financial closure requirements for bidders, that demand upfront private sec-tor investments against securitized toll roads and availability payment cashflows guaranteed by Colombia, mainly through FDN, a state-owned development bank, and (ii) an innovative risk allocation framework for the public and private sectors. Shared risks include land acquisition, permitting and force majeure cost overrun risks (during construction) as well as commercial and financing risk in the operation phase. Fund-ing sources for debt servicing combine payments for the completion of functional units during construc-tion; toll road revenues; annual availability payments through multiannual budgetary allocations (vigencias futuras); guaranteed minimum toll revenues (diferencial de recaudo, DRs), paid by ANI at years 8, 13 and 18 of the concession; and commercial exploitation rights. Concessions include step-in-rights and payments in case of early termination.
The 5G program was launched in 2020 to add fluvial, rail and airport concessions to the toll road PPP pro-gram, and learned from the 4G experience in managing risk to enhance the program’s bankability. This includes improvements in early termination payments, annualized guaranteed minimum revenues (to im-prove cash flow), and toll risk compensation, for events exogenous to the concessionaire (i.e., lifting of toll charges by government, government failure to relinquish toll stations).12
10 All data by Ministerio de Transporte (2019), Transporte en cifras. 11 Between 1994 and 2014, the Colombian transport PPP sector awarded concessions for nearly USD 9.5 billion; in contrast, 4G aimed to award con-
cessions for nearly USD 25 bilion in 8 years (around 50% awarded by June 2021). 12 See Philippi Prietocarrizosa Ferrero DU & Uria, date n/a. Link here.

RECOVERING GROWTH:REBUILDING DYNAMICPOST-COVID-19 ECONOMIESAMID FISCAL CONSTRAINTS
chApter 2 | rebuilding A dynAmic, inclusive And greener economy in A constrAined FiscAl environment 51
Digital Infrastructure: Low-cost Investments in Growth, Resilience and InclusionThe promise of expanding digital infrastructure is great, although present coverage varies across the region (figure 2.16). Estimates suggest that a 1 percent increase in the penetration of mobile broadband would pro-duce a 0.15 percent increase in GDP per capita while a 1 percent increase in the penetration of fixed broad-band connections could increase GDP p.c. by 0.08 percent. Importantly, greater connectivity improves the resilience of households. Within groups of households that share similar socioeconomic characteristics, those with higher digital connectivity experienced noticeably lower job loss rates during the COVID-19 pan-demic. More connected households also reported lower income losses and fewer instances of food inse-curity. Of particular importance during the last crisis, households with access to the internet were able to continue remote learning, while those without lost over a year of education.
Digital connectivity offers a way of reducing the rural-urban income gap. While urban areas are often well covered with 60-80 percent access, with the exception of Chile, Costa Rica, and Uruguay, coverage in rural areas is generally far less, often around 20 percent. This is a vast lost opportunity. Clearly, communicating information on, for instance, health and weather-related risks is facilitated by the internet. In addition, the recent World Bank Publication, Harvesting Prosperity: Technology and Productivity Growth in Agriculture (Fuglie et al. 2020), suggests that digital infrastructure provides a cost-effective way of expanding agricultural ex-tension services to far flung locales and potentially integrating more farmers in supply chains. Hence, both from a point of view of resilience, and of defending (and perhaps, addressing lost learning), digital access has become more critical.
The affordability of digital connectivity services should also be of concern to policymakers. World Bank studies show that the cost to poorer households of 1 gigabyte of connectivity (SIC) approaches 10 percent for households in the first quintile where it is well below 1 percent for the top quintile. Hence it is not only the expansion of the network, but ensuring economical access that becomes a policy priority. Fortunately, the costs are manageable given the scale of infrastructure spending. Over the next decade, universalizing broadband access in LAC is estimated to cost 0.12 percent of the region’s annual GDP; deploying 5G in first- and second-tier metropolitan centers, 0.17 percent; and achieving OECD levels of connectivity, 0.62 percent (Katz and Callorda 2018). Reaching the lowest quintile requires special effort. For instance, the Government of Chile through the Subsecretary of Telecommunications (SUBTEL) has promoted its digital agenda with the primary objective of closing the existing digital gap, with particular focus on rural and remote areas of the country. Public funds are assigned to the bidder(s) able to meet SUBTEL targets with the minimum amount of subsidies which allows minimizing state intervention and leverages competition dynamics in the private sector. For instance, in the case of the Fibra Óptica Nacional (FON), the process allocated about USD 80 mil of public funds to the local provider WOM, which committed to invest almost USD 70 mil. The project — which allocated another USD 30 mil subsidies to Telefonica — will deploy more than 10,000 km of fiber optic cable reaching approximately 3 million final users.
Figure 2.16: Digital Connectedness Varies Widely across LAC
0
20
40
60
80
100
120
Haiti Cuba
Grenada
St Vinc
ent and the
Grenadine
s
St. Kitts
and Nevis
Jamaic
aGuya
na
St. Luc
ia
Dominica
Belize
Surina
me
Bahamas,
The
Nicarag
ua
El Salv
ador
Dominican
Republic
Honduras
Guatemala
Barbados
VenezuelaMexic
o
Antigua
and Barb
uda
Costa Rica
Paraguay
Trinidad an
d Tobago
Bolivia
Ecuador
Peru
Panama
Colombia
Argentina
Brazil
Chile
Uruguay
4G Market PenetrationPercent
Source: World Bank staff calculations.

RECOVERING GROWTH:REBUILDING DYNAMIC
POST-COVID-19 ECONOMIESAMID FISCAL CONSTRAINTS
52 chApter 2 | rebuilding A dynAmic, inclusive And greener economy in A constrAined FiscAl environment
F. Powering a Sustainable Energy FutureAs part of the policy package to support their populations through the economic and health crisss resulting from the COVID-19 pandemic, many countries in the region instituted targeted subsidies and/or payment deferral policies for utility services, particularly in electricity. Over the medium term, however, limited government resources need to be used more strategically, both to better target the poor and vulnerable, and free up resources to lay the foundations for a more sustainable energy future. Energy Pricing Policies for Inclusive Growth in Latin America and the Caribbean (Beylis and Cunha 2017) lays out many of the choices and opportunities related to this agenda.
Although some governments have made progress in reforming energy subsidies, many countries still de-vote significant public resources to reduce the price of different energy products. Figure 2.17 shows a falling cost as a share of GDP of these efforts to roughly a still huge 2 percent of GDP. The decline in the subsidy cost is largely due to the fall in petroleum prices, which, should they rise again, will push the fiscal burden much higher. Energy costs are a large part of the budgets of poor households, but present approaches are often extremely inefficient ways of relieving the burden. Energy subsidies are highly regressive in an ab-solute sense—that is, the lion’s share of every dollar spent on keeping energy prices low benefits wealthier households. Between 40 percent and 60 percent of gasoline and diesel subsidies end up favoring the richest 20 percent of households, and only 10–20 percent of the benefit goes to the bottom 40 percent. Even for liquefied petroleum gas (LPG), which appears to be one of the most progressive price subsidies, 34 percent of the benefits are captured by the wealthiest 20 percent on average, whereas only 23 percent is received by the bottom 40 percent. However, subsidies for fuels used widely for cooking and heating— LPG, natural gas, and kerosene, as well as electricity—can be relatively neutral or progressive, implying that lower-income households capture benefits that are proportionate to their expenditures. In other words, although poorer households receive very little from every dollar spent on energy subsidies, that small amount can represent an important share of their expenditures.
Figure 2.17: Energy Subsidies are High and Rise with Oil Prices
0
20
40
60
80
100
0
2
4
6
8
10
12
2010 2011 2012 2013 2014 2015 2016 2017 2018 2019 2020
Crude Oil Price ($/bbl)Energy Subsidies (percent of GDP)
Argentina Bolivia ColombiaEcuador El Salvador MexicoTrinidad and Tobago Venezuela Crude oil price, avg. ($/bbl, rhs)
Sources: IEA Fossil Fuel Subsidies Database (2021) and World Bank.Note: Crude oil price is the average of Brent, Dubai and West Texas.
For policymakers the message should be clear, reforming the energy pricing policy can result in significant fiscal savings while not sacrificing the welfare of vulnerable households. For reforms to be successful, how-ever, educational and informational campaigns may be necessary to alert citizens to the large inequities that arise from price controls and subsidies. Specific compensatory mechanisms will be necessary for house-holds and specific industries that may be adversely affected, such as direct cash transfers or consumption vouchers that target vulnerable households. The advantage of such transfers over subsidies is that they ad-vance equity, reduce wasteful consumption, and have beneficial environmental externalities by realigning prices for the majority of the population.
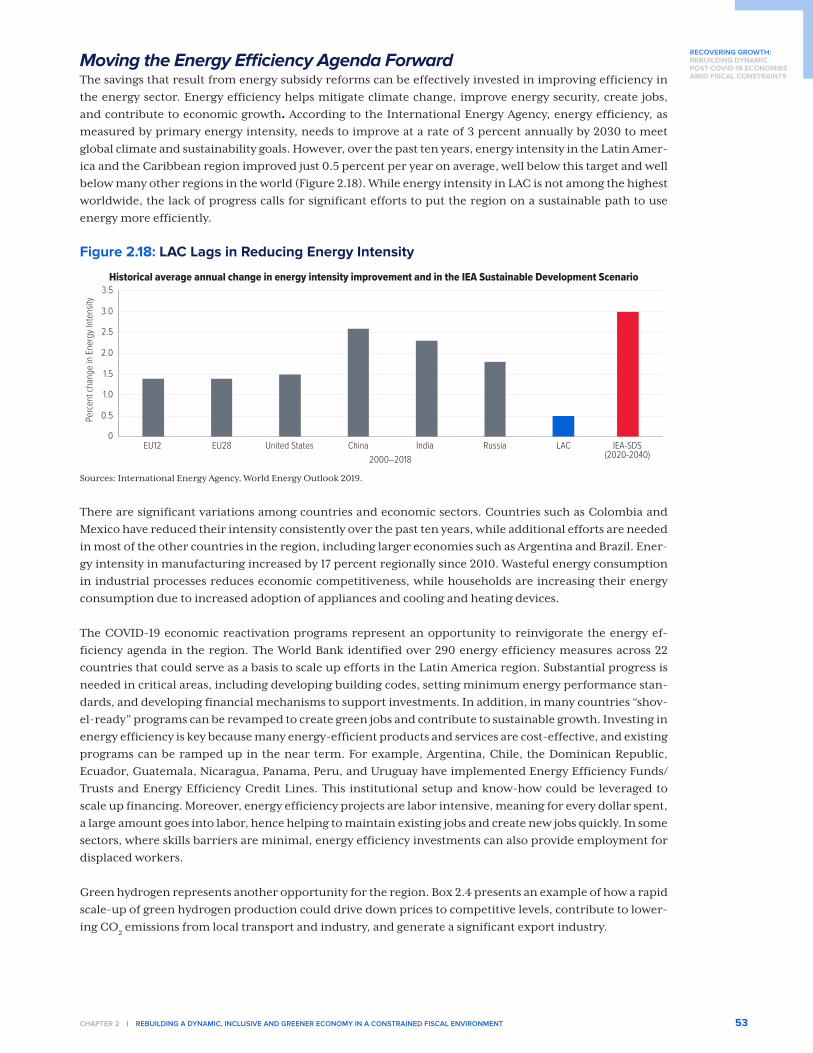
RECOVERING GROWTH:REBUILDING DYNAMICPOST-COVID-19 ECONOMIESAMID FISCAL CONSTRAINTS
chApter 2 | rebuilding A dynAmic, inclusive And greener economy in A constrAined FiscAl environment 53
Moving the Energy Efficiency Agenda Forward The savings that result from energy subsidy reforms can be effectively invested in improving efficiency in the energy sector. Energy efficiency helps mitigate climate change, improve energy security, create jobs, and contribute to economic growth. According to the International Energy Agency, energy efficiency, as measured by primary energy intensity, needs to improve at a rate of 3 percent annually by 2030 to meet global climate and sustainability goals. However, over the past ten years, energy intensity in the Latin Amer-ica and the Caribbean region improved just 0.5 percent per year on average, well below this target and well below many other regions in the world (Figure 2.18). While energy intensity in LAC is not among the highest worldwide, the lack of progress calls for significant efforts to put the region on a sustainable path to use energy more efficiently.
Figure 2.18: LAC Lags in Reducing Energy Intensity
0
0.5
1.0
1.5
2.0
2.5
3.0
3.5
EU12 EU28 United States China India Russia LAC IEA-SDS(2020-2040)
Perc
ent c
hang
e in
Ener
gy In
tens
ity
2000–2018
Historical average annual change in energy intensity improvement and in the IEA Sustainable Development Scenario
Sources: International Energy Agency, World Energy Outlook 2019.
There are significant variations among countries and economic sectors. Countries such as Colombia and Mexico have reduced their intensity consistently over the past ten years, while additional efforts are needed in most of the other countries in the region, including larger economies such as Argentina and Brazil. Ener-gy intensity in manufacturing increased by 17 percent regionally since 2010. Wasteful energy consumption in industrial processes reduces economic competitiveness, while households are increasing their energy consumption due to increased adoption of appliances and cooling and heating devices.
The COVID-19 economic reactivation programs represent an opportunity to reinvigorate the energy ef-ficiency agenda in the region. The World Bank identified over 290 energy efficiency measures across 22 countries that could serve as a basis to scale up efforts in the Latin America region. Substantial progress is needed in critical areas, including developing building codes, setting minimum energy performance stan-dards, and developing financial mechanisms to support investments. In addition, in many countries “shov-el-ready” programs can be revamped to create green jobs and contribute to sustainable growth. Investing in energy efficiency is key because many energy-efficient products and services are cost-effective, and existing programs can be ramped up in the near term. For example, Argentina, Chile, the Dominican Republic, Ecuador, Guatemala, Nicaragua, Panama, Peru, and Uruguay have implemented Energy Efficiency Funds/Trusts and Energy Efficiency Credit Lines. This institutional setup and know-how could be leveraged to scale up financing. Moreover, energy efficiency projects are labor intensive, meaning for every dollar spent, a large amount goes into labor, hence helping to maintain existing jobs and create new jobs quickly. In some sectors, where skills barriers are minimal, energy efficiency investments can also provide employment for displaced workers.
Green hydrogen represents another opportunity for the region. Box 2.4 presents an example of how a rapid scale-up of green hydrogen production could drive down prices to competitive levels, contribute to lower-ing CO
2 emissions from local transport and industry, and generate a significant export industry.

RECOVERING GROWTH:REBUILDING DYNAMIC
POST-COVID-19 ECONOMIESAMID FISCAL CONSTRAINTS
54 chApter 2 | rebuilding A dynAmic, inclusive And greener economy in A constrAined FiscAl environment
Box 2.4. Green Hydrogen Exports from Latin America: a Pathway Towards a Green, Resilient, Inclusive Economic Recovery
Greening an existing industry and decarbonizing hard-to-abate sectors. Hydrogen production is a global industry producing 70 million ton (Mt) of hydrogen in 2019, primarily using fossil fuels as an energy source, to serve refining, chemical and steel manufacturing13. The largest demand comes from China, the US, and the Middle East. In 2017, global hydrogen production accounted for greater annual CO
2 emissions
than either Germany or the global shipping industry14. Scaling the production and promoting the usage of green hydrogen will be critical to put the Latin America and the Caribbean region on a path toward decarbonization, as well as to develop innovative technologies supporting a green and resilient economic recovery. Green hydrogen, produced using electrolysis powered by renewable electricity, can provide coun-tries in the region with a zero-carbon energy carrier to support their national determined contribution ob-jectives and overcome their fossil fuel dependence. Moreover, green hydrogen offers a solution to decar-bonize hard-to-abate sectors that cannot be readily electrified, including parts of transport (long-haul shipping and aviation) and heavy industries (ce-ment, iron, steel, mining, and agrochemicals to produce green fertilizers). Green hydrogen can help reduce such hard-to-abate emissions. In Colombia, for example, the introduction of low-emission hy-drogen can avoid the release of 13 Mt CO
2eq per year
from transport and heavy industries by 2050. Chile projects that green hydrogen can help the country reduce 21 percent of its national greenhouse gas (GHG) emissions 15.
Unlocking new global trade opportunities for LAC. Green hydrogen and its derivatives (such as ammonia, methanol or e-fuels) can help countries develop green energy value chains across different productive industries. The introduction of green hydrogen in Latin America’s key industries can help the region maintain its competitive edge in the pro-duction of low-emission steel, copper, ammonia, fertilizers or agricultural products, which are traded internationally. Moreover, green hydrogen and its derivatives can be a source of export revenues by strengthening the region’s access to developed mar-kets willing to pay a premium that guarantees green value chains, such as EU member states16. The Inter-national Energy Agency (IEA) has identified Argentina, Brazil, Chile, Colombia, Trinidad and Tobago, and Mexico as having the potential to become global green hydrogen exporters and offer competitive prices to importers in Europe and Asia, with the potential to reach a competitive Levelized Cost of Hydrogen (LCOH) of about USD 1/kg H2 by 205017. As of September 2021, thirteen countries have expressed their interest in developing a national green hydrogen industry18.
13 IEA (2020), Hydrogen at https://www.iea.org/fuels-and-technologies/hydrogen and https://www.iea.org/reports/hydrogen.14 Wood MacKenzie (2020). The future for Green Hydrogen. https://www.woodmac.com/news/editorial/the-future-for-green-hydrogen/.15 Ministerio de Energia (2021) Hoja de Ruta del hidrógeno en Colombia. 16 For instance, a Carbon Border Mechanism (CBAM) is an instrument that ensures that imported products sold to EU consumers face similar levels
of carbon pricing in the European Union as similar domestic products. See regulation at European Commission (2021). Proposal to set up a Carbon Border Adjustment Mechanism on selected sectors, at https://ec.europa.eu/info/sites/default/files/carbon_border_adjustment_mechanism_0.pdf .
17 IEA (2020), Latin America’s hydrogen opportunity: from national strategies to regional cooperation, at https://www.iea.org/commentaries/latin-america-s-hydrogen-opportunity-from-national-strategies-to-regional-cooperation.
18 H2LAC (2021), Participating countries, at https://h2lac.org/#.
CO2 emissions in energy consumptionby sector for LAC, 2015
TransportHeavy IndustryElectricity and heatingOther IndustriesResedentialFarmingCommerce and other public servicesFinal consumption of other unspecified productsFishing
36.20%
22.40%
20.50%
9.40%
6.30%
3.20%1.20%
0.10%0.70%
Source: León and Cárdenas 2020.

RECOVERING GROWTH:REBUILDING DYNAMICPOST-COVID-19 ECONOMIESAMID FISCAL CONSTRAINTS
chApter 2 | rebuilding A dynAmic, inclusive And greener economy in A constrAined FiscAl environment 55
Creating enduring local green jobs. Accelerating the green hydrogen industry will also be crucial to bolster Latin America’s economic recovery, as it can attract investments and create new green and skilled jobs. Green hydrogen can create new local jobs, both directly for the production, transport, and distribu-tion of hydrogen, and indirectly in the renewable energy sector to power electrolyzers with clean en-ergy. For example, in Chile, the development of a local value chain in the green hydrogen industry is expected to generate 22,000 new jobs by 2030 and 94,000 by 2050 (GIZ 2020). Notably, green hydrogen also offers a path to achieve a just transition as it can create jobs to shift employment from sectors that will be downsized as a consequence of the region’s trend to phase-out coal and other fossil fuels19.
19 European Parliament (2019), A just energy transition, opportunity for EU industries, the role of hydrogen in the future and the example of energy transition in Germany, at A just energy transition, opportunity for EU industries, the role of hydrogen in the future and the example of energy transition in Germany (europa.eu).
0
25000
50000
75000
100000
2030 2040 2050
Job creation by the green hydrogen industry in Chile
Source: GIZ (2020).

56 chApter 2 | conclusion
RECOVERING GROWTH:REBUILDING DYNAMIC
POST-COVID-19 ECONOMIESAMID FISCAL CONSTRAINTS
CONCLUSION
LAC is facing a truly challenging moment. COVID-19 has killed many, and
left scars in terms of increased poverty, lost human capital, indebted firms,
and overextended government budgets. And we are not yet out of the
woods. Vaccination campaigns will need to be pursued with vigor, and with
luck, will defend against emerging variants of the disease.
Growth was lackluster before COVID-19—too low to make progress on the
long-standing social issues facing the region—and it appears weaker during
the recovery than would be predicted given the favorable tailwinds. The
challenge, then, is laying the foundations for a more dynamic, sustainable,
and inclusive growth in a context of very limited fiscal resources. This vol-
ume has sought to highlight areas where existing resources could be used
more efficiently or reallocated to areas where they would contribute more
to growth and social well-being. In many cases, the political economy con-
fronting such changes may be complex to navigate, but it is precisely the
imperative that the 2020s will be a more prosperous decade for LAC that
dictates attempting them.

RECOVERING GROWTH:REBUILDING DYNAMICPOST-COVID-19 ECONOMIESAMID FISCAL CONSTRAINTS
chApter 2 | reFerences 57
References
Alesina, Alberto, Carlo Favero, and Francesco Giavazzi (2015). “The Output Effect of Fiscal Consolidation Plans”. Journal of International Economics 96: S19-S42.
Alesina, Alberto, Omar Barbiero, Carlo Favero, Francesco Giavazzi, and Matteo Paradisi (2017). “The Effects of Fiscal Consolidations: Theory and Evidence”. NBER Working Paper 23385.
Azevedo, João Pedro, et al. (2021) "Simulating the potential impacts of COVID-19 school closures on school-ing and learning outcomes: A set of global estimates." The World Bank Research Observer 36.1 (2021): 1-40.
Beylis, Guillermo, and Barbara Cunha (2017). “Energy Pricing Policies for Inclusive Growth in Latin America and the Caribbean”. Directions in Development—Energy and Mining. Washington, DC: World Bank.
Birdsall, Nancy, and Sanjeev Gupta (2018). “On the Equity-Friendly Property Tax: Time for Developing Coun-tries to Invest?”. Center for Global Development. https://www.cgdev.org/blog/equity-friendly-proper-ty-tax-time-developing-countries-invest.
Bloom, Nicholas, Mark Schankerman, and John Van Reenen (2013). “Identifying Technology Spillovers and Product Market Rivalry”. Econometrica 81(4): 1347-1393.
Bracco, Jessica, Luciana Galeano, Pedro Juarros, Daniel Riera-Crichton, and Guillermo Vuletin (2021). “So-cial Transfer Multipliers in Developed and Emerging Countries: The Role of Hand-to-Mouth Consum-ers”. World Bank Working Paper 9627 (April 2021).
Calderon, Cesar A., and Luis Servén. “The effects of infrastructure development on growth and income distribution.” Available at SSRN 625277 (2004).
Castellani, Francesca, Olarreaga, Marcelo, Panizza, Ugo and Yue Zhou (2019). “Investment Gaps in Latin America and the Caribbean”. International Development Policy | Revue internationale de politique de développement [Online].
CEPAL (2000). “Economic Survey of Latin America and the Caribbean 1999-2000”. New York: United Nations.
Cerda, Rodrigo, and Carola Pessino (2018). “How Large Are Fiscal Wage Gaps in Latin America? How Can They Be Corrected?”. Unpublished manuscript. Washington, DC: Inter-American Development Bank.
Cirera, Xavier, and William F. Maloney (2017). “The Innovation Paradox: Developing-Country Capabilities and the Unrealized Promise of Technological Catch-Up”. Washington, DC: World Bank.
Cloyne, James (2013). “Discretionary Tax Changes and the Macroeconomy: New Narrative Evidence from the United Kingdom”. American Economic Review 103: 1507-1528.
Cusolito, A. P., and Maloney, W. F. (2018). Productivity revisited: Shifting paradigms in analysis and policy. World Bank Publications.
De la Torre, Augusto, Samuel Pienknagura, and Eduardo Levy Yeyati (2013). “Latin America’s Deceleration and the Exchange Rate Buffer”. LAC Semiannual Report (October 2013). Washington, DC: World Bank.
De Loecker, Jan, and Jan Eeckhout (2018). “Global market power”. National Bureau of Economic Re-search No. w24768.
Fay, Marianne, Luis Alberto Andres, Charles Fox, Ulf Narloch, Stephane Staub, and Michael Slawson (2017). “Rethinking Infrastructure in Latin America and the Caribbean: Spending Better to Achieve More”. Washington, DC: World Bank.
Feyen, E. and D. Mare (2021). “Measuring systemic banking resilience: a simple reverse stress testing ap-proach using bank-level data”, World Bank Policy Research.
Ferreyra, María Marta, Ciro Avitabile, Javier Botero Álvarez, Francisco Haimovich Paz, and Sergio Urzúa (2017). “At a Crossroads: Higher Education in Latin America and the Caribbean”. Directions in Develop-ment - Human Development. Washington, DC: World Bank.

RECOVERING GROWTH:REBUILDING DYNAMIC
POST-COVID-19 ECONOMIESAMID FISCAL CONSTRAINTS
58 chApter 2 | reFerences
Ferreyra, María Marta, Lelys Dinarte Díaz, Sergio Urzúa, and Marina Bassi (2021). “The Fast Track to New Skills: Short-Cycle Higher Education Programs in Latin America and the Caribbean”. doi:10.1596/978-1-4648-1706-9. Washington, DC: World Bank.
Fuchs, Alan, Fernanda González Icaza, and Daniela Paz (2019). “Distributional Effects of Tobacco Taxation: A Comparative Analysis”. Policy Research Working Paper No. 8805. Washington, DC: World Bank.
Fuglie, Keith, Madhur Gautam, Aparajita Goyal, and William F. Maloney (2020). “Harvesting Prosperity: Technology and Productivity Growth in Agriculture”. Washington, DC: World Bank.
Gagnon, Joseph E., Steven Kamin, and John Kearns (2021). “Economic Costs and Benefits of Accelerated COVID-19 Vaccinations”. PIIE Policy Brief 21-11, May 2021.
Gechert, Sebastian (2015). “What Fiscal Policy is Most Effective? A Meta-regression Analysis”. Oxford Eco-nomic Papers, Vol. 67, No. 3: 553-580.
Gerard, François, Joana Naritomi, and Joana Silva (2021). “Cash Transfers and Formal Labor Markets: Evi-dence from Brazil”. London: Centre for Economic Policy Research.
Gil, Paula, Francisco Martí, Richard Morris, Javier J. Pérez, and Roberto Ramos (2017). “The Output Effects of Tax Changes: Narrative Evidence from Spain”. Bank of Spain Working Paper 1721.
GIZ, HINICIO Chile (2020) “Cuantificación del encadenamiento industrial y laboral para el desarrollo del hidrógeno en Chile”.
Goñi, Edwin, and William F. Maloney (2017). “Why Don’t Poor Countries do R&D? Varying Rates of Factor Returns Across the Development Process”. European Economic Review 94: 126-147.
Griffith, Rachel, Stephen Redding, and John Van Reenen (2004). "Mapping the Two Faces of R&D: Productivity Growth in a Panel of OECD Industries". Review of Economics and Statistics Vol. 86, No. 4 (2004): 883-895.
Gunter, Samara, Daniel Riera-Crichton, Carlos Vegh, and Guillermo Vuletin (2021). “Non-Linear Effects of Tax Changes on Output: The Role of the Initial Level of Taxation”. Journal of International Economics 131.
Hayo, Bernd, and Matthias Uhl (2013). “The Macroeconomic Effects of Legislated Tax Changes in Germany”. Oxford Economic Papers 66: 397-418.
Human Development Index (HDI). Human Development Reports. 2020. Available online: http://hdr.undp.org/en/content/human-development-index-hdi
Iacovone, Leonardo, William F. Maloney, and David McKenzie (forthcoming). “Improving Management with Individual and Group-Based Consulting: Results from a Randomized Experiment in Colombia”. Review of Economic Studies.
International Monetary Fund (2016). "Managing Government Compensation and Employment - Institu-tions, Policies, and Reform Challenges". Washington, DC: International Monetary Fund.
Izquierdo et al. (2019). “Is Public Investment Multiplier Higher in Developing Countries? An Empirical Ex-ploration”. Washington, D.C.: International Monetary Fund.
Izquierdo, Alejandro, Carola Pessino, and Guillermo Vuletin (2018). “Better Spending for Better Lives: How Latin America and the Caribbean Can Do More with Less”. Washington, D.C.: Inter-American Development Bank.
Katz, Raul, Fernando Callorda (2018). “The Economic Contribution of Broadband, Digitization and ICT Reg-ulation”. ITU Publications.
Laajaj, Rachid, et al. (2021). “COVID-19 Spread, Detection, and Dynamics in Bogota, Colombia”. Nature Communications 12, 4726.
León, Diana C., and Juan C. Cárdenas (2020). “Latin America and the Caribbean: Natural Wealth and Envi-ronmental Degradation in the XXI Century”. New York: UNDP.
Leyva, Gustavo, and Carlos Urrutia (2021). “Informal Labor Markets in Times of Pandemic: Evidence for Latin America and Policy Options”. Center for Latin American Monetary Studies (February 22, 2021).
Maloney, William F., and Felipe Valencia Caicedo (2020). “Engineering Growth”. CEPR Discussion Paper No. DP15144.
Maloney, William F. and Temel Taskin (2020). “Determinants of social distancing and economic activity during COVID-19: A global view”. World Bank Policy Research Working Paper (9242).
RECOVERING GROWTH:REBUILDING DYNAMICPOST-COVID-19 ECONOMIESAMID FISCAL CONSTRAINTS
chApter 2 | reFerences 59
Mertens, Karel, José Luis Montiel Olea (2018). “Marginal Tax Rates and Income: New Time Series Evidence”. The Quarterly Journal of Economics, Volume 133, Issue 4, November 2018: 1803–1884.
OECD and World Bank (2020). “Health at a Glance: Latin America and the Caribbean 2020”. Paris: OECD Publishing.
Pennings, Steven (2020). “Cross-region Transfers in a Monetary Union: Evidence from the US and Some Implications”. World Bank Policy Research Working Paper No. 9244.
Pereira, Manuel C., and Lara Wemans (2013). “Output Effects of a Measure of Tax Shocks Based on Changes in Legislation for Portugal”. Central Bank of Portugal Working Paper 15.
Perry, Guillermo E., Omar S. Arias, J. Humberto López, William F. Maloney, Luis Servén (2006). “Poverty Re-duction and Growth: Virtuous and Vicious Circles”. World Bank Latin American and Caribbean Studies. Washington, DC: World Bank.
Pessino, Carola, I. Badin, J. C. Benítez, D. Dborkin, N. Tolsa, and J. Zentner (2018). “Trends in Public Spend-ing: Insights from a New Latin American Dataset”. Washington, DC: Inter-American Development Bank.
Riera-Crichton, Daniel, Carlos Vegh, and Guillermo Vuletin (2015). “Procyclical and Countercyclical Fiscal Multipliers: Evidence from OECD Countries”. Journal of International Money and Finance, Vol. 52 (April 2015): 15-31.
Riera-Crichton, Daniel, Carlos Vegh, and Guillermo Vuletin (2016). “Tax Multipliers: Pitfalls in Measure-ment and Identification”. Journal of Monetary Economics 79: 30-48.
Romer, Christina D., and David H. Romer (2016). “Transfer Payments and the Macroeconomy: The Effects of So-cial Security Benefit Increases, 1952-1991”. American Economic Journal: Macroeconomics, Vol. 8, No. 4: 1-42
Rozenberg, Julie, and Marianne Fay (2019). “Beyond the Gap: How Countries Can Afford the Infrastructure They Need while Protecting the Planet” Sustainable Infrastructure. Washington, DC: World Bank.
Ruch, Franz Ulrich, and Temel Taskin (forthcoming). “Demand and Supply Shocks: Evidence from Earning Calls”. World Bank Working Papers.
Saez, Emmanuel (2004). "Reported Incomes and Marginal Tax Rates, 1960-2000: Evidence and Policy Impli-cations". Ed. J. Poterba Tax Policy and the Economy: 117-172.
Shi, Shijie, and Temel Taskin (forthcoming). “Tracking the Footprints of COVID-19: A Textual Study of the Collapse and Recovery”. World Bank Working Paper Series.
Silva, Joana, Liliana D. Sousa, Truman G. Packard, and Raymond Robertson (2021). “Employment in Crisis: The Path to Better Jobs in a Post-COVID-19 Latin America”. World Bank Latin America and Caribbean Studies. Washington, DC: World Bank.
Venturi, Lucila, Daniel Riera-Crichton, and Guillermo Vuletin (forthcoming 2021). “Effects of individual income tax changes on income and labor: Evidence from a novel Latin America dataset”.
World Bank Group (2019). “High-Performance Health Financing for Universal Health Coverage: Driving Sustainable, Inclusive Growth in the 21st Century”. Washington, DC: World Bank.
World Bank (2020). “Social Protection and Jobs Responses to COVID-19: A Real-Time Review of Country Measures (July Update)”. Washington, DC: World Bank.
World Bank (2021). “Acting Now to Protect the Human Capital of Our Children: The Costs of and Response to COVID-19 Pandemic’s Impact on the Education Sector in Latin America and the Caribbean”. Washing-ton, DC: World Bank.
World Economic Forum. (2017). The Global Competitiveness Report 2016–2017. Retrieved from https://www.weforum.org/reports/the-global-competitiveness-report-2016-2017-1
Zambrano, Andres, David Montoya, Andres Alvarez, Hernando Zuleta (2021). "The Role of the Informal Sec-tor in the COVID Crisis: A Cushion or an Amplifier?". University of the Andes.

OCTOBER 2021 | SEMIANNUAL REPORTOF LATIN AMERICA AND THE CARIBBEAN REGION