october 2017 social and political attitudes of people … social research | social and political...
TRANSCRIPT

Social and political attitudes of people on low incomes 2017 reportAuthors: Eleanor Taylor, Charlotte Saunders, Mari Toomse-SmithPrepared for: The Joseph Rowntree Foundation
October 2017

At NatCen Social Research we believe that social research has the power to make life better. By really understanding the complexity of people’s lives and what they think about the issues that affect them, we give the public a powerful and influential role in shaping decisions and services that can make a difference to everyone. And as an independent, not for profit organisation we’re able to put all our time and energy into delivering social research that works for society.
NatCen Social Research 35 Northampton Square London EC1V 0AX T 020 7250 1866 www.natcen.ac.uk A Company Limited by Guarantee Registered in England No.4392418. A Charity registered in England and Wales (1091768) and Scotland (SC038454) This project was carried out in compliance with ISO20252

Contents
Executive summary ........................................................... 1
Day-to-day worries .......................................................................................... 1
The role of government ................................................................................... 2
The benefit system .......................................................................................... 2
Political attitudes and engagement .................................................................. 2
Conclusions ............................................................................................. 3
1 Introduction ................................................................. 4
1.1 Methodology ........................................................................................... 4
How does our variable compare? ..................................................................... 5
2 People on low income ................................................. 6
2.1 Who are the poorest in society?.............................................................. 6
2.2 Financial wellbeing .................................................................................. 8
3 Day-to-day worries .................................................... 10
3.1 Current concerns or worries .................................................................. 10
3.2 Feelings of control ................................................................................. 12
3.3 Who has the power to improve your life? .............................................. 13
4 The role of government ............................................. 15
4.1 Government responsibilities .................................................................. 15
4.2 Taxation ........................................................................................... 17
5 Poverty, work and benefits ........................................ 19
5.1 Child poverty ......................................................................................... 19
5.2 The benefit system ................................................................................ 20
5.3 Deservingness ...................................................................................... 21
6 Politics .................................................................... 25
6.1 Political interest and knowledge ............................................................ 25
6.2 Political efficacy and trust ..................................................................... 26
6.3 Political views ........................................................................................ 27
6.4 Views on Europe and migrants from the EU ......................................... 29
7 Conclusion ................................................................ 32
Appendix A. Methodology ............................................... 34

List of figures
Figure 2-1 Age profile of income groups ....................................................................... 6
Figure 2-2 Gender by income ....................................................................................... 7
Figure 2-3 Working status profile of the lowest income group ....................................... 7
Figure 2-4 Education by income ................................................................................... 8
Figure 2-5 Feelings towards income, by income group ................................................. 9
Figure 3-1 Current concerns or worries of lowest income quintile ............................... 11
Figure 3-2 Six most frequent concerns or worries among lowest income quintile, by
income group .............................................................................................................. 11
Figure 3-3 Feelings of control among the lowest income quintile, by concern or worry 13
Figure 3-4 Who has the first and second most power to improve your life ................... 14
Figure 4-1 Views of government responsibilities, by income ....................................... 15
Figure 4-2 Support for government action to reduce financial inequalities, by income. 16
Figure 4-3 Taxes are too high for people with..., by income group .............................. 17
Figure 4-4 Taxes are too high for people with..., by perception of income ................... 18
Figure 5-1 Main reason for child poverty given by lowest income group ..................... 20
Figure 5-2 Many people who get social security don't really deserve any help, by
income group .............................................................................................................. 22
Figure 5-3 Most people on the dole are fiddling one way or another, by income group 23
Figure 6-1 Interest in politics, by income group ........................................................... 25
Figure 6-2 People like me don’t have any say about what the government does, by
income group .............................................................................................................. 26
Figure 6-3 Support of a political party, by income group ............................................. 28
Figure 6-4 Proportion agreeing or strongly agreeing with left-leaning statements, by
income group .............................................................................................................. 28
Figure 6-5 For some crimes the death penalty is the most appropriate sentence, by
income group .............................................................................................................. 29
Figure 6-6 How voted in EU referendum, by income group ......................................... 30
Figure 6-7 View of Britain's future involvement with the EU, by income group ............ 31

Executive summary
British politics have gone through an unprecedented degree of change since the summer of 2016. The ‘Leave’ vote at the EU referendum has shown mainstream politicians that they cannot ignore the concerns of large proportions of the electorate who often feel marginalised and overlooked by their political representatives and the elites. This includes a substantial proportion of lower income people, who have for a long time been less engaged in and less trusting of politics1.
Last year the Joseph Rowntree Foundation funded a report, published by NatCen Social Research that explored the social and political attitudes and concerns of people on low incomes in Britain. This study aims to expand on this previous work. We are seeking to build up a picture of the social and political attitudes of people on low income who have previously been marginalised from public debate.
The analysis uses a wide range of measures of social and political attitudes collected as part of British Social Attitudes survey (BSA). The 2016 BSA survey included a new set of questions on household income, funded by the Joseph Rowntree Foundation, which collected detailed information on different sources of income. Responses to these questions were combined into a new total income measure that has been used in this report. This gives us a more robust income estimate which allows for a more detailed analysis of how attitudes vary across the whole income spectrum than would be possible with the previous BSA income question.
Day-to-day worries People on low incomes report a variety of concerns. The six most frequently mentioned concerns for people on low income are:
Money or debt
Physical health
Caring for someone
Housing
Immigration
Work or finding a job
The top concerns for people on low incomes differ from those of the population overall. Those in the lowest income group are more likely than richer people to say they are concerned about money or debt, their physical health, their work or finding a job and housing.
In general, most people feel able to act to improve the situations they are concerned about, but only 10% of those concerned about immigration feel they had any power to act. The majority of people on low incomes (73%) say that they, rather than anyone else, have the most power to change their life.
1 Dunatchik, M., Davies, M., Griggs, J., Husain, F., Jessop, C., Kelley, N., Morgan, H., Rahim,
N., Taylor, E. & Wood, M. (2016), Social and political attitudes of people on low incomes, available at: http://natcen.ac.uk/media/1345858/social-and-political-attitudes-of-people-on-low-incomes.pdf

2 NatCen Social Research | Social and political attitudes of people on low incomes
The role of government Lower income people hold distinct views on what the role of government should be. While there is near universal support across income groups for government supporting the sick and the elderly, there are marked differences in views on what the government’s role should be in relation to the unemployed.
Those who have lower incomes, and are therefore more likely to have been affected by unemployment at some point, are much more likely to believe that government should provide a decent living standard for the unemployed (65% compared with 47% of people with the highest incomes) and to provide a job to everybody who wants one (62% compared with 34% of the richest group).
While those on lower incomes tend to favour more active governmental involvement in supporting the unemployed (65%-67% of the lowest two income groups compared to 47% of the highest two groups), there is no consensus as to whether current spending is adequate. Half of the poorest group (49%) says taxes should be increased with more money spent on health, education and social benefits, while 39% say that taxation and spending should remain as it is.
The benefit system There is a feeling that the current levels of benefits are the minimum levels
required to provide people with a decent quality of life, with 53% of the poorest group saying that cutting benefits would damage too many people’s lives.
Even among the poorest group attitudes are less generous when thinking about unemployment benefits than thinking about benefits generally (only 14% of the lowest income group was unemployed themselves). A minority (37%) thinks that unemployment benefits are too low and cause hardship, although this this is a higher proportion than among higher income groups.
The middle income group is the most cynical towards benefit recipients. In particular, those in the middle income group are more likely to believe that those on social security do not deserve any help (29% compared with 14% of the lowest and 18% of the highest income groups) and that those on dole are fiddling one way or another (28% compared with 21% of those in the lowest group and 16% of those in the highest).
Those with lower incomes are more likely to be sympathetic towards benefit fraud, with 4 in 10 (43%) of the lowest and second lowest income group believing that some people who cheat the benefit system do it because they do not get enough to live on (compared with 26% of the highest income group).
Political attitudes and engagement 2016 saw public interest in politics rise to its highest level since 1986 (the earliest year for which data are available). This is likely due to the EU referendum and particularly the uncertainty caused by the Brexit vote, as well as wide spread media coverage. However, it did not reverse the upward trend in the proportion of people who feel that they have no say in what government does.
People on lower incomes are less interested and have a lower self-reported understanding of political issues than those with higher incomes. However, there are no income differences in trust in the government, or political efficacy

NatCen Social Research | Social and political attitudes of people on low incomes 3
i.e. a feeling of having political influence. People in the second income quintile are less likely to say they trust politicians to tell the truth than either the poorest or the richest groups.
Support for the Conservative party has a strong income gradient, with those in higher income groups much more likely to support them.
Labour support does not vary by income, indicating that the Labour party’s traditional base among lower income people is declining. But this support does not seem to be moving to other political parties. The poorest group is most likely to be ‘politically homeless’ with a quarter (24%) saying they do not identify with any political party (compared with 6%-9% of those in the two highest income groups).
While support for the Labour party is similar across the income groups, the lowest group is more likely than those with highest incomes to hold traditional left-wing views, such as believing that ordinary people do not get a fair share of nation’s wealth.
As might be expected, there is a clear income pattern in the EU referendum vote, with those in the highest income group being particularly likely to vote ‘Remain’ and other income groups having a more even distribution of ‘Leave’ and ‘Remain’ voters. The fact that concerns about immigration were an important motivator for many ‘Leave’ voters is also reflected in the fact that lower income people tend to favour more restrictions for EU migrants claiming benefits.
Conclusions People on low incomes have distinct social and political views as well as everyday concerns. The largest everyday worry faced by this group is money and debt, which is likely part of the reason why they are more supportive of government helping the unemployed and more likely to think that cutting benefits would damage too many lives. Yet this does not lead to unequivocal support for higher social security spending and increasing benefits for the unemployed. Those on low incomes are more understanding of benefit fraud, but, like other groups, believe that the government should clamp down on it.
These distinct views do not translate into high political engagement around these or other issues. Instead the low income group is politically marginalised, showing less interest and understanding of politics and is more likely to feel that no political party represents their views. It is an open question whether any of this has changed since 2016 when we spoke to the British public, although the results of the 2017 General Election suggest that it may have been able to engage some who were previously politically passive.
4 NatCen Social Research | Social and political attitudes of people on low incomes
1 Introduction
2016 witnessed a sea change in the British political landscape. The ‘Leave’ vote revealed a broad sense of dissatisfaction with the government and the way British society is changing, particularly among groups of people who are often overlooked by mainstream politicians. The ‘Leave’ vote was particularly prevalent in areas with lower growth and fewer opportunities, revealing poverty in particular as an issue that needs to be addressed to build a more cohesive and prosperous British society in the aftermath of Brexit. This is clearly recognised in the Joseph Rowntree Foundation’s UK poverty: Causes, costs and solutions report2 that proposes a clear agenda for solving poverty in the UK. In this context it is particularly important to understand how those on lower incomes perceive their society and government, as well as to see what they are concerned about on a day-to-day basis.
The aim of this report is to analyse what worries people on low incomes as well as how their social and political attitudes compare with people on higher incomes. It will build on NatCen’s report from 2016 that explored the attitudes of low income people in the year before the EU referendum3. This time we are looking at a broader range of attitudes and are using a more robust and nuanced income measure that gives us a more accurate picture of how income is related to a number of attitudes.
1.1 Methodology The analysis is based on the British Social Attitudes (BSA) survey data from 2016 that was collected in the months following the EU referendum vote. BSA has traditionally included a single banded question to collect household income information. While this is sufficient for simple income breakdowns, this type of question does not offer sufficient detail to enable more in depth analysis adjusted for individual circumstances, and it is known to underestimate households’ total income. To overcome this, JRF funded the development of new income questions that ask for income received from different sources separately, thus providing more detail for the analysis stage, and reducing the risk that any income sources are forgotten.
The variable we are using to measure income includes income from all sources including earnings, pensions, benefits, and ‘other’ sources, for the respondent and their partner, and is the net equivalised household income after housing costs, and exclusive of disability benefits, divided into quintiles.
We calculated household income after housing costs by subtracting the total amount spent on rent or mortgage payments from the household income, giving us a better representation of the disposable income available to the household.
We have also removed any income from disability benefits which provide funds for needs which arise directly due to their disability. For example we have removed funds which are provided to pay for equipment which the person uses because of their disability. This includes Disability Living Allowance, Personal Independence Payment and Attendance Allowance.
2 JRF, (2016). UK poverty: Causes, costs and solutions. Available at:
https://www.jrf.org.uk/file/49551/download?token=l3hZew4S&filetype=full-report 3 Dunatchik, M., Davies, M., Griggs, J., Husain, F., Jessop, C., Kelley, N., Morgan, H., Rahim,
N., Taylor, E. & Wood, M. (2016), Social and political attitudes of people on low incomes, available at: http://natcen.ac.uk/media/1345858/social-and-political-attitudes-of-people-on-low-incomes.pdf

NatCen Social Research | Social and political attitudes of people on low incomes 5
We have taken account of the number of people in the household by using an equivalised version of income. Please see Appendix A for further details of this process.
How does our variable compare?
We assessed the validity of the equivalised income quintiles variables by comparing the proportion of households classified as living on low income (below 60% of the median income) based on our measure, with the equivalent measure from the 2015/16 Family Resources Survey (FRS), which provides well-established, high-quality income estimates. Table 1 shows that overall the proportions of each household type on low income are very similar, suggesting that our variable is a reasonable estimate of the actual income.
Table 1 Proportion on low income using BSA before housing costs in poverty measure, and FRS before housing costs in poverty measure, by household type
BSA 2016
FRS 2015/16
Household type
%
%
Pensioner couple 13 14
Single male pensioner 22 19
Single female pensioner 27 24
Couple with children 27 17
Couple without children 15 10
Single with children 31 26
Single male without children 23 18
Single female without children 23 17
All 24 16
Note: for this comparison we used 60% below median income as the ‘low income’ group

6 NatCen Social Research | Social and political attitudes of people on low incomes
2 People on low income
This report focuses particularly on the views of the people in the poorest fifth of the British population. In this chapter we look at the characteristics of those included in this ‘lowest income’ group
2.1 Who are the poorest fifth of the population? Overall, people in the poorest fifth of society are more likely to be younger, female and less educated than the general population. Figure 2.1 shows that the lowest income group tends to be younger than the general population. The youngest age group (18-24 years old) are more likely to be in the lowest income group than the general population. Figure 2-1 Age profile of income groups
Base: All respondents (2,942) Women make up 67% of adults in the lowest income group (see Figure 2-1). Conversely 7 out of 10 (71%) adults in the highest income group are men.
38
30 29 30
23
43 40
33 33
38
19
30
38 37 40
0
5
10
15
20
25
30
35
40
45
50
Lowestincomequintile
2nd incomequintile
3rd incomequintile
4th incomequintile
Highestincomequintile
% 18 - 34
% 35 -54
% 55+

NatCen Social Research | Social and political attitudes of people on low incomes 7
Figure 2-2 Gender profile of income groups
Base: All respondents (2,942) As could be expected, those who are unemployed (14%) and those in ‘other’ work statuses e.g. education, sick, looking after the home (38%) are more likely to be in the lower income groups than in a higher income group. Only 11% of the lowest income group are retired, unlike the three highest income groups where between 21% and 24% are retired. While those who are in work are less likely to be in the lowest income group than a higher income group, it is important to note that more than a third (38%) of those in the lowest income group are in work (see Figure 2-3). Figure 2-3 Working status profile of the lowest income group
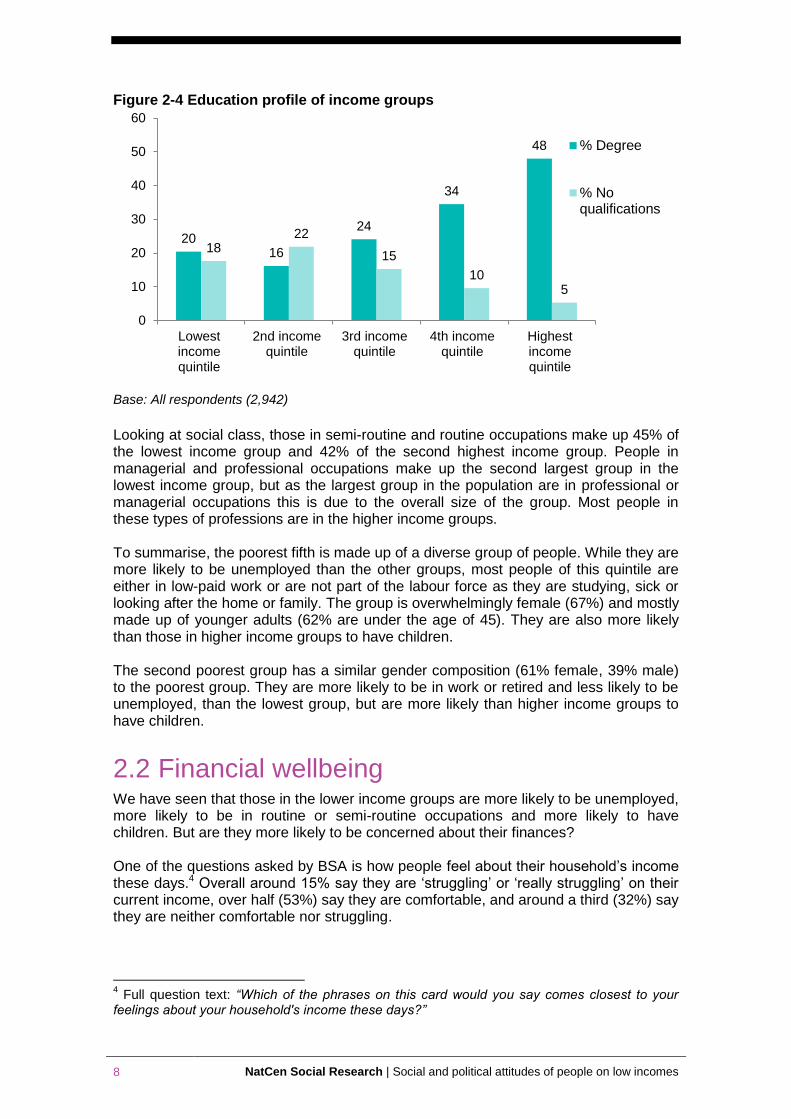
Base: All respondents (2,942) Most people (75%) in the lowest income group have either GCSEs or A levels. A fifth (18%) have no qualifications and 20% have a degree level qualification or higher. Those with degrees are most likely to be in the highest income group and least likely to be in one of the two lowest income groups. Those with no qualifications are most likely to be in the lower income groups (see Figure 2-4).
33 39
49 53
71 67
61
51 47
29
0
10
20
30
40
50
60
70
80
Lowestincomequintile
2nd incomequintile
3rd incomequintile
4th incomequintile
Highestincomequintile
% Male
% Female
38
58
71 73 76
14
5 1
11
19 23 24
21
37
18
5 3 3
0
10
20
30
40
50
60
70
80
Lowest incomequintile
2nd incomequintile
3rd incomequintile
4th incomequintile
Highest incomequintile
% In work
% Unemployed
% Retired
% Other (education, sick, looking after home etc)
8 NatCen Social Research | Social and political attitudes of people on low incomes
Figure 2-4 Education profile of income groups
Base: All respondents (2,942) Looking at social class, those in semi-routine and routine occupations make up 45% of the lowest income group and 42% of the second highest income group. People in managerial and professional occupations make up the second largest group in the lowest income group, but as the largest group in the population are in professional or managerial occupations this is due to the overall size of the group. Most people in these types of professions are in the higher income groups. To summarise, the poorest fifth is made up of a diverse group of people. While they are more likely to be unemployed than the other groups, most people of this quintile are either in low-paid work or are not part of the labour force as they are studying, sick or looking after the home or family. The group is overwhelmingly female (67%) and mostly made up of younger adults (62% are under the age of 45). They are also more likely than those in higher income groups to have children. The second poorest group has a similar gender composition (61% female, 39% male) to the poorest group. They are more likely to be in work or retired and less likely to be unemployed, than the lowest group, but are more likely than higher income groups to have children.
2.2 Financial wellbeing We have seen that those in the lower income groups are more likely to be unemployed, more likely to be in routine or semi-routine occupations and more likely to have children. But are they more likely to be concerned about their finances? One of the questions asked by BSA is how people feel about their household’s income these days.4 Overall around 15% say they are ‘struggling’ or ‘really struggling’ on their current income, over half (53%) say they are comfortable, and around a third (32%) say they are neither comfortable nor struggling.
4 Full question text: “Which of the phrases on this card would you say comes closest to your
feelings about your household's income these days?”
20 16
24
34
48
18 22
15
10 5
0
10
20
30
40
50
60
Lowestincomequintile
2nd incomequintile
3rd incomequintile
4th incomequintile
Highestincomequintile
% Degree
% Noqualifications

NatCen Social Research | Social and political attitudes of people on low incomes 9
Figure 2-5 shows that people in the lowest income groups are, as may be expected, most likely to feel they are struggling on their income. While only around a third (35%) of those in the lowest income group feels they are living comfortably, 77% in the highest group feel this way. Conversely, some 31% of people in the lowest income group say they are struggling, compared with just 4% in the two highest groups.
Figure 2-5 Feelings towards income, by income group
Base: All respondents (2,942)
35 36
48
65
77
31
23
12
4 4
0
10
20
30
40
50
60
70
80
90
Lowest incomequintile
2nd incomequintile
3rd incomequintile
4th incomequintile
Highest incomequintile
% Living comfortably
% Struggling
10 NatCen Social Research | Social and political attitudes of people on low incomes
3 Day-to-day worries
We all face worries and concerns throughout our lives. Some of these concerns are deeply personal. Other worries may concern local services, national issues or global problems. This chapter focuses on the most important and immediate worries in people’s lives, specifically people with low incomes. Do people on low incomes have distinct concerns from other groups? And how much control do people feel over the problems or concerns in their lives?
3.1 Current concerns or worries We asked respondents the following question: ‘Here is a list of things that some people may be concerned or worried about. Which, if any, of these would you say you are concerned or worried about at the moment?’ Overall the most common concerns or worries mentioned are physical health (32%), immigration (32%), money and debt (30%), and caring for family or another person (26%). 14% say they have no current concerns or worries. This is consistent with previous results. A similar question asked in 20155 on the NatCen Panel also found health or disability to be the most commonly selected issue, with immigration and finances also high on the list. People in the lowest fifth of incomes have different concerns to those on higher incomes. Money or debt is the most commonly selected concern for people in the lowest income group (45%). The next most common concerns are physical health (38%), caring for someone (30%), housing (30%) and immigration (30%) (see Figure 3-1).
5 Asked on NatCen Panel in 2015 for JRF. See Dunatchik, M., Davies, M., Griggs, J., Husain,
F., Jessop, C., Kelley, N., Morgan, H., Rahim, N., Taylor, E. & Wood, M. (2016), Social and political attitudes of people on low incomes, available at: http://natcen.ac.uk/media/1345858/social-and-political-attitudes-of-people-on-low-incomes.pdf This question is not directly comparable because the question wording was slightly different and used different answer options and ordering.
NatCen Social Research | Social and political attitudes of people on low incomes 11
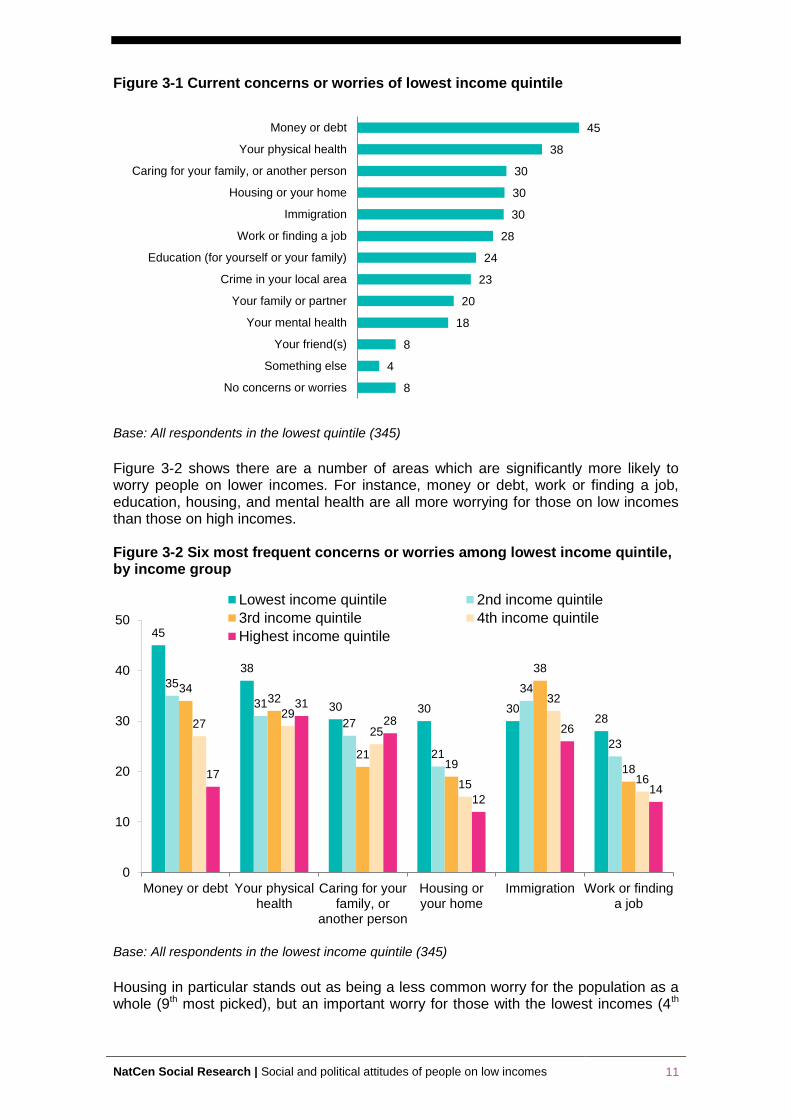
Figure 3-1 Current concerns or worries of lowest income quintile
Base: All respondents in the lowest quintile (345) Figure 3-2 shows there are a number of areas which are significantly more likely to worry people on lower incomes. For instance, money or debt, work or finding a job, education, housing, and mental health are all more worrying for those on low incomes than those on high incomes. Figure 3-2 Six most frequent concerns or worries among lowest income quintile, by income group
Base: All respondents in the lowest income quintile (345)
Housing in particular stands out as being a less common worry for the population as a whole (9th most picked), but an important worry for those with the lowest incomes (4th
45
38
30
30
30
28
24
23
20
18
8
4
8
Money or debt
Your physical health
Caring for your family, or another person
Housing or your home
Immigration
Work or finding a job
Education (for yourself or your family)
Crime in your local area
Your family or partner
Your mental health
Your friend(s)
Something else
No concerns or worries
45
38
30 30 30 28
35
31
27
21
34
23
34 32
21 19
38
18
27 29
25
15
32
16 17
31
28
12
26
14
0
10
20
30
40
50
Money or debt Your physicalhealth
Caring for yourfamily, or
another person
Housing oryour home
Immigration Work or findinga job
Lowest income quintile 2nd income quintile
3rd income quintile 4th income quintile
Highest income quintile

12 NatCen Social Research | Social and political attitudes of people on low incomes
most picked). 30% of people in the poorest fifth say housing is a concern for them compared with 12%-21% of those in the richer groups. Housing is more likely to be a problem for renters than homeowners, particularly for private renters, with 35% of private renters mentioned housing as a problem compared with 27% of Local Authority renters, 25% of Housing Association renters, and just 11% of people who own their own home. Concern about immigration is relatively high among all income groups, but is highest among those with middle-incomes (38%), and lowest among the highest income group (26%).
3.2 Feelings of control For each concern or worry mentioned, respondents were asked whether they feel able to improve their situation.6 People on low incomes generally feel able to do at least a little to improve the situations they are most worried about (see Figure 3-3). 71% say they thought there is something they could do to improve their money or debt concerns; 74% say they could improve their physical health; 72% say they could improve their caring situation; and 77% say there is something they could do to improve their situation at work. It should be noted that people feel the most able to do ‘a lot’ to improve their situation if they had a physical health problem (37%). At the other end of the scale, people on low incomes who are concerned about housing (44%) and education (50%) feel less able to do anything to improve the situation. The majority of those concerned about immigration and crime feel these problems are out of their control; 25% of those worried about crime and just 10% of people worried about immigration feel able to improve the situation.
6 Full question text: “Thinking about the concern you have about XXX. Do you feel you can do
anything to improve this situation?”

NatCen Social Research | Social and political attitudes of people on low incomes 13
Figure 3-3 Feelings of control among the lowest income quintile, by concern or worry
Base: Respondents in the lowest income quintile who expressed concern about each issue (345) But how did this compare with people on higher incomes? For some of the questions (crime, housing and mental health) our analysis was constrained by the fact that the questions were asked of a small sample. However we did find that people with lower incomes are more likely to feel powerless to improve their physical health problems, money concerns or worries about crime than people on the highest incomes. For example, among those with a physical health problem, 74% of the poorest fifth feel they could do something to improve the situation, compared with 84% among the richest fifth.
3.3 Who has the power to improve your life? The vast majority (85%) of people on low incomes feel that they themselves have the most or second most power to improve their own lives (Figure 3-4).7 The next most powerful people are close family, with 39% saying their partner has the power to improve their life, and 30% saying family does. In general, feelings are similar across the income groups, but those on lower incomes are more likely to feel a health professional can improve their life (11% compared to 7% of the richest group), possibly because members of this group are more likely to be long-term sick or disabled. Those on higher incomes, who are more likely than the poorest group to be employed, are more likely to say their employer or a potential employer has power to improve their life (15% compared to 9% of the poorest group).
7 Full question text: “Who do you think has the most power to improve your life?”
15
12
14
19
17
17
37
25
9
22
35
44
57
53
55
57
37
52
89
75
50
44
29
28
28
26
26
23
Immigration
Crime in local area
Education (for yourself or your family)
Housing or your home
Money or debt
Caring for your family, or another person
Family or partner
Your mental health
Your physical health
Work or finding a job
I feel I can do a lot to improve the situation
I feel I can do a little to improve the situation
I feel I can't do anything to improve the situation

14 NatCen Social Research | Social and political attitudes of people on low incomes
Figure 3-4 Who has the first and second most power to improve your life
Base: All respondents in the lowest income quintile (345)
73
6 5 9
3 1 0
12
27 23
10 8 8
4
0
10
20
30
40
50
60
70
80
Myself My partner Members ofmy family
Thegovernment
My GP orother healthprofessional
My employeror potentialemployers
My friend(s)
% Has the most power to improvelife
% Has the second most power toimprove life

NatCen Social Research | Social and political attitudes of people on low incomes 15
4 The role of government
Expectations of the role the government should play in society, and how this should be funded, have always been politically controversial. This chapter looks at how views on these issues vary by income.
4.1 Government responsibilities Across all income groups, there is almost universal agreement that the government should be responsible for providing health care (96%) and providing a decent standard of living for the old (93%); policy areas where government intervention is likely to benefit everyone at some point in their lives. However, policy areas which do not directly benefit everyone received lower levels of support. For example, 56% of people overall say that the government should be responsible for providing a decent standard of living for the unemployed. Only half (48%) think the government should provide a job for everyone who wants one. Not only do these issues receive less support overall than the services which are directly used by everyone, but this support also varied with income. Looking at Figure 4-1 we can see that only one-third (34%) of people in the richest group say the government should provide a job for everyone who wants one, this rises to 62% of the poorest group who think the government should provide jobs for all. Figure 4-1 Views of government responsibilities, by income group
Base: All respondents returning self-completion questionnaire (1,038)
Similarly 47% of the two highest income groups say the government should provide a decent standard of living for the unemployed, rising to 65% of the lowest income group and 67% of the second lowest income group.
96 94
83
65 62
97 95
86
67
51
96 94
84
56
42
98 92
72
47 41
98
91
79
47
34
0
20
40
60
80
100
Provide healthcare for the sick
Provide a decentstandard of living
for the old
Provide decenthousing for thosewho can't afford it
Provide a decentstandard of living
for theunemployed
Provide a job foreveryone who
wants one
Lowest income quintile 2nd income quintile
3rd income quintile 4th income quintile
Highest income quintile
% Should be the government's responsibility
16 NatCen Social Research | Social and political attitudes of people on low incomes
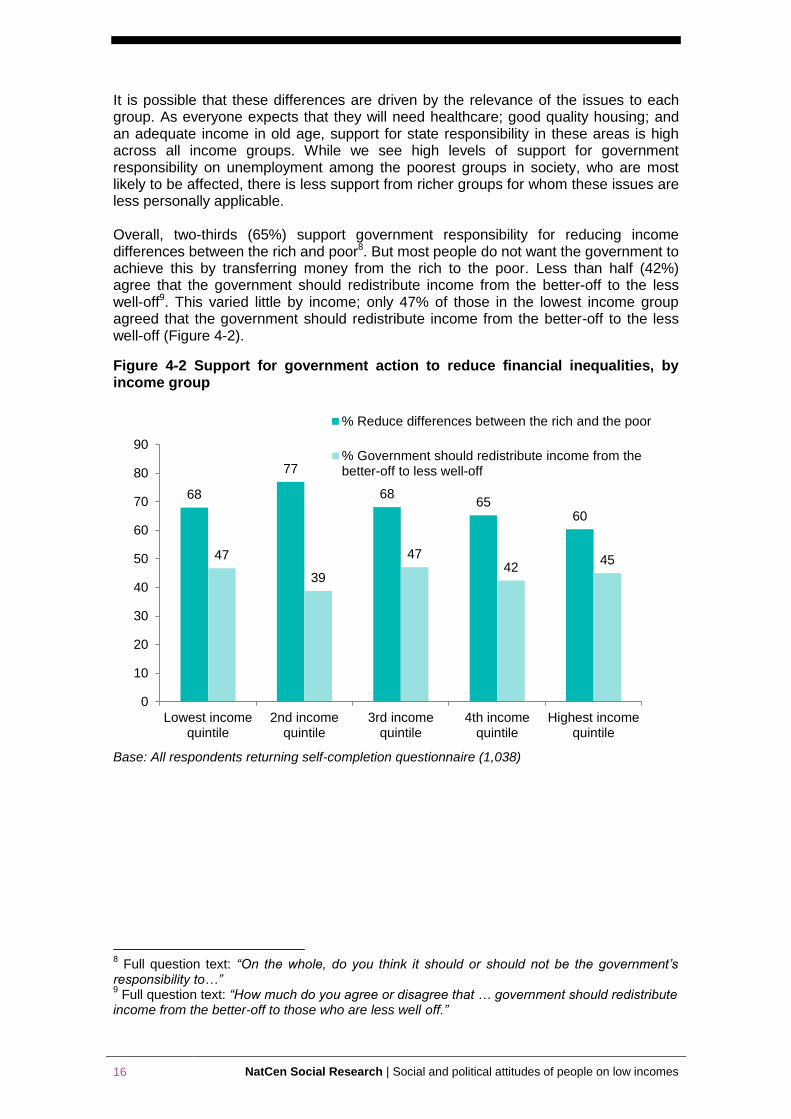
It is possible that these differences are driven by the relevance of the issues to each group. As everyone expects that they will need healthcare; good quality housing; and an adequate income in old age, support for state responsibility in these areas is high across all income groups. While we see high levels of support for government responsibility on unemployment among the poorest groups in society, who are most likely to be affected, there is less support from richer groups for whom these issues are less personally applicable. Overall, two-thirds (65%) support government responsibility for reducing income differences between the rich and poor8. But most people do not want the government to achieve this by transferring money from the rich to the poor. Less than half (42%) agree that the government should redistribute income from the better-off to the less well-off9. This varied little by income; only 47% of those in the lowest income group agreed that the government should redistribute income from the better-off to the less well-off (Figure 4-2).
Figure 4-2 Support for government action to reduce financial inequalities, by income group
Base: All respondents returning self-completion questionnaire (1,038)
8 Full question text: “On the whole, do you think it should or should not be the government’s
responsibility to…” 9 Full question text: “How much do you agree or disagree that … government should redistribute
income from the better-off to those who are less well off.”
68
77
68 65
60
47
39
47 42
45
0
10
20
30
40
50
60
70
80
90
Lowest incomequintile
2nd incomequintile
3rd incomequintile
4th incomequintile
Highest incomequintile
% Reduce differences between the rich and the poor
% Government should redistribute income from thebetter-off to less well-off
NatCen Social Research | Social and political attitudes of people on low incomes 17
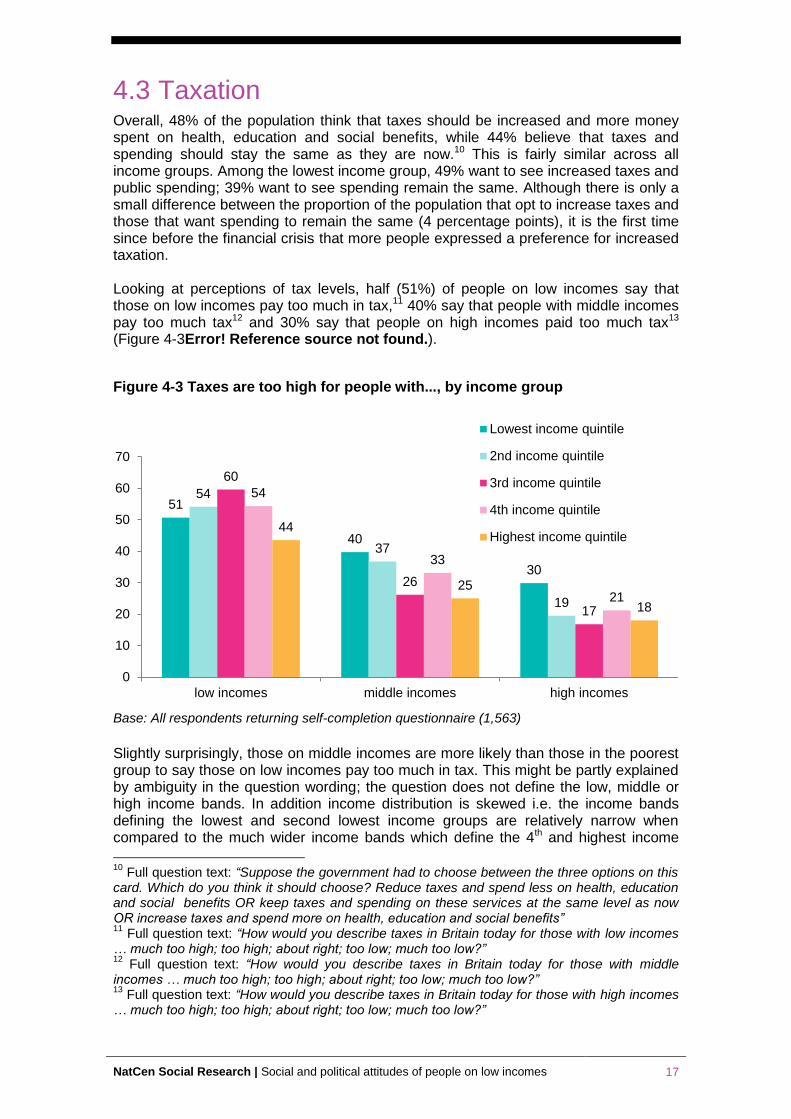
4.3 Taxation Overall, 48% of the population think that taxes should be increased and more money spent on health, education and social benefits, while 44% believe that taxes and spending should stay the same as they are now.10 This is fairly similar across all income groups. Among the lowest income group, 49% want to see increased taxes and public spending; 39% want to see spending remain the same. Although there is only a small difference between the proportion of the population that opt to increase taxes and those that want spending to remain the same (4 percentage points), it is the first time since before the financial crisis that more people expressed a preference for increased taxation. Looking at perceptions of tax levels, half (51%) of people on low incomes say that those on low incomes pay too much in tax,11 40% say that people with middle incomes pay too much tax12 and 30% say that people on high incomes paid too much tax13 (Figure 4-3Error! Reference source not found.).
Figure 4-3 Taxes are too high for people with..., by income group
Base: All respondents returning self-completion questionnaire (1,563)
Slightly surprisingly, those on middle incomes are more likely than those in the poorest group to say those on low incomes pay too much in tax. This might be partly explained by ambiguity in the question wording; the question does not define the low, middle or high income bands. In addition income distribution is skewed i.e. the income bands defining the lowest and second lowest income groups are relatively narrow when compared to the much wider income bands which define the 4th and highest income
10
Full question text: “Suppose the government had to choose between the three options on this card. Which do you think it should choose? Reduce taxes and spend less on health, education and social benefits OR keep taxes and spending on these services at the same level as now OR increase taxes and spend more on health, education and social benefits” 11
Full question text: “How would you describe taxes in Britain today for those with low incomes … much too high; too high; about right; too low; much too low?” 12
Full question text: “How would you describe taxes in Britain today for those with middle incomes … much too high; too high; about right; too low; much too low?” 13
Full question text: “How would you describe taxes in Britain today for those with high incomes … much too high; too high; about right; too low; much too low?”
51
40
30
54
37
19
60
26
17
54
33
21
44
25
18
0
10
20
30
40
50
60
70
low incomes middle incomes high incomes
Lowest income quintile
2nd income quintile
3rd income quintile
4th income quintile
Highest income quintile

18 NatCen Social Research | Social and political attitudes of people on low incomes
groups. This means that people in middle income groups might consider themselves to be poorer than they actually are in comparison to the rest of the population. We would expect people in the lowest income bracket to be most likely to say that those on low incomes face tax bills that are too high, but if people on middle incomes think that their relative income is lower than it actually is, and these people feel squeezed by their tax bill then this could partly explain why a higher proportion of those on middle incomes say low income taxes are too high. Looking at how views of taxation varied according to people’s assessment of their own income (Figure 4-4) we can see that there is strong correlation between the way people feel about their current income and whether or not they say that taxes are too high for people on low incomes. Unsurprisingly, people who say they are really struggling on their present income are more likely than people who say that they are living really comfortably to say that tax levels are too high across the board.
Figure 4-4 Taxes are too high for people with..., by perception of income
Base: All respondents returning self-completion questionnaire (1,563)
While we might expect the poorest group to say that those on the highest incomes do not pay enough tax, this is not the case. They are more likely (30%) than those in higher income groups (17%-21%) to say that that people with high incomes pay too much tax. This suggests that those in the lowest income group are more likely to think that taxes are too high overall, for everyone, while those on high incomes are less likely to have this view.
70
39
26
62
41
28
56
33
21
48
28
19
43
24 21
0
20
40
60
80
low incomes middle incomes high incomes
Really struggling on present income
Struggling on present income
Neither comfortable nor struggling onpresent income
Living comfortably on present income
Living really comfortably on presentincome
NatCen Social Research | Social and political attitudes of people on low incomes 19
5 Poverty, work and benefits
We have seen that people on low incomes expect the government to provide a decent income for the unemployed, provide decent housing and reduce income differences between the rich and the poor. But how well is the benefits system working? And who should receive state support?
5.1 Child poverty Concern about overall levels of poverty in Britain has been growing over the past five years. At the end of 2016 one-fifth of the public said that poverty was one of the most important issues facing Britain today; the highest level of concern reported in the UK in the past 40 years.14 Although overall concern about poverty has increased, recognition of child poverty has not changed since 201215, when the question was first asked. Overall the majority of people (84%) say there is at least some child poverty in Britain today, with 39% saying there is ‘quite a lot’ and 45% saying there is ‘some’. Only 11% say there is very little, and 3% say ‘there is no child poverty’. Those in the poorest group are no more likely than other income groups to say that there is at least some child poverty in the Britain today, with 38% saying there is ‘quite a lot’ of child poverty, and 45% saying there is ‘some’. There are several narratives which attempt to explain the presence of child poverty in Britain. Some blame child poverty on poor lifestyle choices and decision making by parents and grandparents. Others see poverty as a result of structural inequalities caused by the tax and benefits system or market failures such as the shape of the housing market.16 The causes of child poverty identified by the public are split across both perspectives. A quarter (26%) mention reasons that fall into the ‘personal responsibility’ category (parental addiction, too many children in the family, parents do not want to work). But just over one-third (35%) mention more systemic causes (social benefits not high enough, work doesn’t pay enough, long term illness or disability, discrimination, no access to affordable housing, and inequalities in society). The final third (32%) mention causes that could be seen as arising from a combination of both societal structure and personal responsibility (family break-up or loss of a family member, parents have been out of work for a long time, they live in a poor-quality area, their parents lack education, their parents do not work enough hours, their grandparents were also poor). People in the highest quintile are less likely than people in other quintiles to mention ‘personal responsibility’ reasons (19%), and more likely than people in the other quintiles to identify one of the reasons which combine personal responsibility and systemic causes as the main cause of child poverty (44%). The most common reasons given for child poverty are:
“Their parents suffer from addictions” (15%);
“Their parent’s work does not pay enough” (13%); and
“Inequalities in society” (10%).
14
Ipsos MORI Issues Index. December 2016/January 2017 15
Full question text: “I am now going to ask you some questions about child poverty. Some people say there is very little child poverty in Britain today. Others say there is quite a lot. Which comes closest to your view?” 16
JRF (2016) UK Poverty: Causes, costs and solutions.

20 NatCen Social Research | Social and political attitudes of people on low incomes
The least frequently mentioned reasons are:
“Long term illness or disability” – of a parent or the child (3%); and
“It has been passed down the generations” (2%).17 In general, the views of the poorest group (Figure 5-1) reflect those of the rest of the population. However, the poorest fifth are less than half as likely to mention parent’s lack of education (6%) as the richest fifth (15%) as a reason for child poverty. Poverty is a complex issue driven by an array of factors. The wide range of responses does, to some extent, reflect the complexity of the causes of poverty in the real world. Figure 5-1 Main reason for child poverty given by lowest income group
Base: All respondents returning self-completion questionnaire (1,916).
5.2 The benefit system In addition to the widespread concern about child poverty, the majority of people (69%) think that it is harder for young people to get a job today than it was when they themselves left full-time education.18 This does not vary by income. Although people feel that it is hard for young people to get jobs, there is divided support for an increase in government spending on benefits. Overall just over a third (35%) agree that ‘the government should spend more money on welfare benefits for the poor, even if it leads to higher taxes’19, while 30% disagree. Again, there is no real variation in views by to income..
17
Full question text: “Which do you think is the main reason why children are in poverty in Britain?” 18
Full question text: “Do you think it is easier or more difficult for young people to get a job now than it was when you completed your full-time education?” 19
Full question text: “How much do you agree or disagree that … the government should spend more money on welfare benefits for the poor, even if it leads to higher taxes.”
16%
16%
9%
7%
7%
6%
6%
6%
6%
6%
3%
3%
1%
Their parents suffer from addictions
Their parents' work doesn't pay enough
Because of the inequalities in society
They live in a poor quality area
Social benefits for families are not high enough
Their parents lack education
There has been a family break up
Their parents do not want to work
Their parents have been out of work for a long time
Their family cannot access affordable housing
There are too many children in the family
It has been passed down the generations
Long term illness/disability
NatCen Social Research | Social and political attitudes of people on low incomes 21
There is a stronger consensus overall (50%) that ‘cutting welfare benefits would damage too many people’s lives’; only 16% disagreed.20 This is consistent across all income groups. Overall, attitudes are less generous when thinking about welfare benefits specifically for unemployed people. Only 37% of people in the lowest income group think that benefits for unemployed people are too low and cause hardship. This belief is even less common among the two highest income groups, a quarter (24%-25%) of whom think benefits are too low. People who are themselves unemployed are more likely to say unemployment benefits are too low (50%), but a quarter (25%) still say that benefits for unemployed people are too high and discourage them from finding a job. This might be due to the transitional nature of unemployment. BSA data is collected at a single point in time and does not distinguish between those who are long-term unemployed and those out of work for only a short time. People who are unemployed for only a short time might well see themselves differently from those who are long term unemployed – for example seeing themselves as people who are working hard to re-enter the job market while viewing those as long-term unemployed as being less deserving of support. The link between income and attitudes towards benefits for unemployed people seems to be related to other factors associated with being in different income groups rather than varying according to income itself. People who think that benefits for unemployed people are too high are more likely to support the Conservative party or UKIP and to be employed or retired. Having a degree, being unemployed or in an ‘other’ economic category (i.e. being in education, looking after the home or being long-term sick or disabled) are all associated with thinking that benefits for unemployed people are too low. A large minority, 43% of the public agree that ‘if welfare benefits weren’t so generous, people would learn to stand on their own two feet’.21 This varies to some extent by income group. Just over a third of people (36%) on low incomes believe this. People in the middle-income group are most likely to agree with this statement (49%), with 43% of those in the highest income group agreeing.
5.3 Deservingness In the UK, media coverage of benefit recipients tends to be critical rather than sympathetic.22 72% of people say they remember seeing at least one TV programme, newspaper or online article about benefit recipients within the last 6 months. Of these, 71% say the programme or article was somewhat or very critical. This chapter explores what people think about benefit recipients more generally, particularly looking at how views vary by income. The public are divided in their opinion of whether people on social security deserve financial help. A fifth (21%) of people agree that ‘many people who get social security don’t really deserve any help’;23 the lowest proportion in the last 30 years. However, this does not mean that a majority believe that people getting social security do
20
Full question text: “How much do you agree or disagree that … cutting welfare benefits would damage too many people's lives.” 21
Full question text: “How much do you agree or disagree that … if welfare benefits weren't so generous, people would learn to stand on their own two feet.” 22
http://www.bsa.natcen.ac.uk/media/39144/bsa34_benefit_tax_final.pdf 23
Full question text: “How much do you agree or disagree that … many people who get social security don't really deserve any help?”

22 NatCen Social Research | Social and political attitudes of people on low incomes
deserve help. Just over a third believe that this group deserve support (38%), the same as the proportion who ‘neither agree nor disagree’.. Figure 5-2 shows that those on middle incomes (29%) are more likely than those in either the richest or poorest groups to agree. The attitudes of those with the lowest incomes reflect the broad pattern of views across the overall population. While they are the least likely to agree (14%), 39% are unsure whether or not they think that many people who get social security do not really deserve any help. Figure 5-2 Many people who get social security don't really deserve any help, by income group
Base: All respondents returning self-completion questionnaire (1,566)
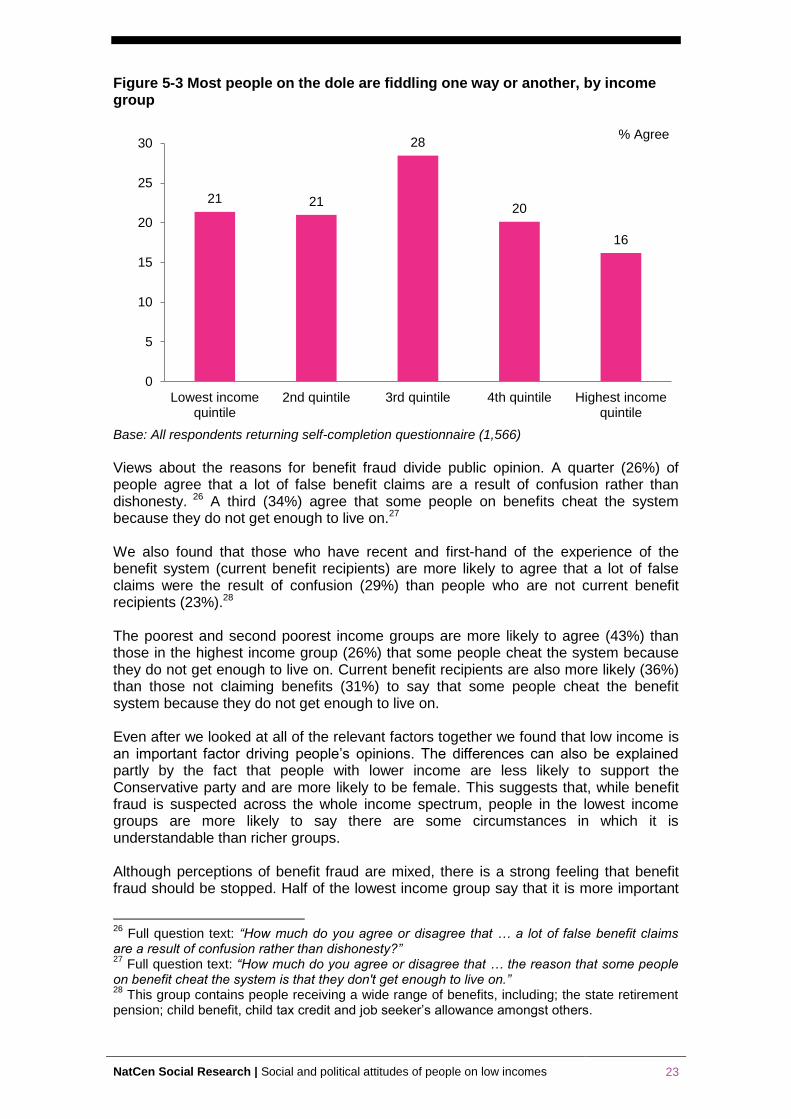
Even after controlling for other relevant factors, income remains an important driver of whether respondents feel that people on social security deserve help. We also found that men, UKIP supporters and people with no qualifications are more likely than other groups to believe that people on social security do not really deserve any help.24 The belief that ‘most people on the dole are fiddling in one way or another’25 is only held by one in five (22%) people living on low incomes. Although we found no difference between those on low incomes and the population overall, those on middle incomes are most likely to agree (28%), which is 12 percentage points higher than the richest group (16%) (Figure 5-3).
24
We controlled for multiple explanatory variables using logistic regression models developed in SPSS. All models control for age, sex, political party identification, highest qualification and current economic activity. 25
Full question text: “How much do you agree or disagree that … most people on the dole are fiddling in one way or another?”
14
22
29
20 18
0
5
10
15
20
25
30
35
Lowest incomequintile
2nd quintile 3rd quintile 4th quintile Highest incomequintile
% Agree
NatCen Social Research | Social and political attitudes of people on low incomes 23
Figure 5-3 Most people on the dole are fiddling one way or another, by income group
Base: All respondents returning self-completion questionnaire (1,566)
Views about the reasons for benefit fraud divide public opinion. A quarter (26%) of people agree that a lot of false benefit claims are a result of confusion rather than dishonesty. 26 A third (34%) agree that some people on benefits cheat the system because they do not get enough to live on.27 We also found that those who have recent and first-hand of the experience of the benefit system (current benefit recipients) are more likely to agree that a lot of false claims were the result of confusion (29%) than people who are not current benefit recipients (23%).28 The poorest and second poorest income groups are more likely to agree (43%) than those in the highest income group (26%) that some people cheat the system because they do not get enough to live on. Current benefit recipients are also more likely (36%) than those not claiming benefits (31%) to say that some people cheat the benefit system because they do not get enough to live on. Even after we looked at all of the relevant factors together we found that low income is an important factor driving people’s opinions. The differences can also be explained partly by the fact that people with lower income are less likely to support the Conservative party and are more likely to be female. This suggests that, while benefit fraud is suspected across the whole income spectrum, people in the lowest income groups are more likely to say there are some circumstances in which it is understandable than richer groups. Although perceptions of benefit fraud are mixed, there is a strong feeling that benefit fraud should be stopped. Half of the lowest income group say that it is more important
26
Full question text: “How much do you agree or disagree that … a lot of false benefit claims are a result of confusion rather than dishonesty?” 27
Full question text: “How much do you agree or disagree that … the reason that some people on benefit cheat the system is that they don't get enough to live on.” 28
This group contains people receiving a wide range of benefits, including; the state retirement pension; child benefit, child tax credit and job seeker’s allowance amongst others.
21 21
28
20
16
0
5
10
15
20
25
30
Lowest incomequintile
2nd quintile 3rd quintile 4th quintile Highest incomequintile
% Agree
24 NatCen Social Research | Social and political attitudes of people on low incomes
for the government to stop people from claiming benefits to which they are not entitled than to help them claim all the benefits they could get. In contrast, 36% say that the government should help people claim benefits to which they are entitled. Attitudes towards the government’s role in minimising benefit fraud do not vary by income. It seems that while poorer groups might be more understanding of the reasons for false benefit claims, they still feel it is more important for the government to clamp down on fraud rather than maximise legitimate claims.

NatCen Social Research | Social and political attitudes of people on low incomes 25
6 Politics
6.1 Political interest and knowledge The data presented in this report were collected at a time of political turmoil for Britain; the EU referendum had just taken place, surrounded by fraught debate and controversy. Did this historic event affect our relationship with politics? And how did people on low incomes feel towards politics during this time? With the sheer volume of political news being reported, as well as the significance of the events taking place, it is perhaps unsurprising that 2016 saw an increase in interest in politics in the population as a whole, with 47% saying they have ‘a great deal’ or ‘quite a lot’ of interest in politics compared with 41% in 2015 (Figure 6-1. This represents a continuation of an increase in political interest since the 2010, and the highest level of political interest since the question was first asked in 1986. Despite the overall increase, there are large differences in interest in politics between people with different income levels. Just 34% of people in the poorest fifth, and 28% of people in the second lowest income group say they had ‘a great deal’ or ‘quite a lot’ of interest in politics, compared with 56% in the highest income group (Figure 6-1). Similarly people with lower incomes are less likely to feel confident in their understanding of politics. 55% and 47% of the two lowest income groups say they had a good understanding of political issues29, compared with 77% of those in the highest income group. Figure 6-1 Interest in politics, by income group
Base: All respondents (2,942)
Our analysis found that increased political interest is related to a number of characteristics, including being older, having a higher level of qualifications, and supporting a political party, in particular supporting the Conservatives or Liberal Democrats. When considering all of the factors together, we found that the differences
29
People who agree or strongly agree with the statement “I feel that I have a pretty good understanding of the important political issues facing our country”.
34
28
42
48
56
0
10
20
30
40
50
60
Lowest incomequintile
2nd incomequintile
3rd incomequintile
4th incomequintile
Highestincome quintile
% a great deal or quite a lot ofinterest

26 NatCen Social Research | Social and political attitudes of people on low incomes
between the income groups in level of political interest reflect the fact that people with lower incomes are more likely to be younger, have lower levels of education and are less likely to support a particular political party, and not by the fact that these groups have less money. Similarly, the differences seen for self-rated political understanding are driven by the lower income group having a lower education level, being less likely to support a political party and including more women.
6.2 Political efficacy and trust While previous analyses of the BSA survey have found a long-term decrease in feelings of political powerlessness among the British public30, recent years have seen the beginnings of a reversal of this trend. 51% say that “people like me don’t have any say about what the government does”, up from 44% in 2014. We found that people in the second poorest group are more likely (57%) than those in the richest group (44%) to say that “people like me don’t have any say about what the government does” (Figure 6-2). Figure 6-2 People like me don’t have any say about what the government does, by income group
Base: All respondents returning self-completion questionnaire (1,563)
Overall, 67% agree that they can only have any say through voting31, up from 60% in 2012. This feeling was consistent across all income groups. So while people consistently feel that they can only participate in the political process by voting, richer groups are more likely to feel that process allows them to have a say. Only 15% of the lowest income group say that they “trust politicians of any party in Britain to tell the truth when they are in a tight corner”. While this is a small minority, it is a significantly larger proportion than those in the 2nd income group (4%) or 3rd income group (7%) who say they trust politicians to tell the truth. Levels of trust are slightly higher for government than for politicians. A quarter (24%) of the poorest group say
30
Lee, L. & Young, P. (2013), ‘A disengaged Britain? Political interest and participation over 30 years’, in Park, A., Bryson, C., Clery, E., Curtice, J. and Phillips, M. (eds.), British Social Attitudes: the 30th Report, London: NatCen Social Research, available at http://www.bsa.natcen.ac.uk/media/38455/bsa30_politics_final.pdf 31
People who agree or strongly agree with the statement “Voting is the only way people like me can have any say about how the government runs things”.
50
57
53 51
44
0
10
20
30
40
50
60
Lowest incomequintile
2nd quintile 3rd quintile 4th quintile Highest incomequintile
% Agree
NatCen Social Research | Social and political attitudes of people on low incomes 27
they trust British governments of any party to place the needs of the nation above the interests of their own political party just about always or most of the time. There is a link between income and the share of people disagreeing or strongly disagreeing with the statement “people we elect as MPs try to keep the promises they have made during the election”. Those in the second lowest income group are most likely to disagree with this statement (49%) compared with 32% among those in the richest fifth and 38% in the poorest fifth.
6.3 Political views We have seen that those on lower incomes expressed less interest in and understanding of politics, next we turn to exploring political views across the income groups. As Figure 6-3 shows, there is a distinct pattern of party allegiance among people with lower incomes when compared with people in higher income groups.32 The key difference between the income groups is a lower level of Conservative support among people with lower incomes, with 23% of the poorest fifth identifying themselves as Conservative supporters compared with 46% of the richest fifth. Labour support has traditionally been highest among those with lower income. While Labour is still the most popular party among low income groups, the levels of support the Labour party receive do not vary with income. This is likely to be a reflection of broader changes in the UK political landscape at the time of data collection in 2016, including the increased relevance of UKIP. Almost a quarter (24%) of people in the lowest income group do not support any political party; this is true of just 6% among the highest income group. This, together with a lower political understanding and interest among those with the lowest incomes, indicates an overall disengagement with politics that is not seen among the higher income groups. UKIP support is highest among the second income group at 7%, while Liberal Democrat support is highest among the fourth income group (8%).
32
Combined responses to “Generally speaking, do you think of yourself as a supporter of any one political party?” and “Do you think of yourself as a little closer to one political party than to the others?”

28 NatCen Social Research | Social and political attitudes of people on low incomes
Figure 6-3 Support of a political party, by income group
Base: All respondents (2,941)
But what, more specifically, are the political views of those with low incomes? Predictably, people on lower incomes are more likely than those with the highest incomes to hold traditionally ‘left-leaning’ views such as “there’s one law for the rich, and one for the poor”, “ordinary working people do not get their fair share of the nation’s wealth” (Figure 6-4) and “management will always try to get the better of employees if it gets the chance”. These views are not peculiar to the lowest income group; the bottom three-fifths of the population hold very similar views, in comparison with the richest two fifths who are much less likely to believe this. Figure 6-4 Proportion agreeing or strongly agreeing with left-leaning statements, by income group
Base: All respondents (2,400)
23 26 29 39
46
30 32
32
28 27
5 5
5
8 6
4
7 4
3 3
6
7 7
8 6
24
18 15 9 6
9 5 7 6 6
0%
10%
20%
30%
40%
50%
60%
70%
80%
90%
100%
Lowestincomequintile
2nd incomequintile
3rd incomequintile
4th incomequintile
Highestincomequintile
DK / refused
None
Other
UKIP
Liberal Democrat
Labour
Conservative
61 63 62
55 51
63 62 64 62
52
0
10
20
30
40
50
60
70
Lowest incomequintile
2nd incomequintile
3rd incomequintile
4th incomequintile
Highest incomequintile
% agreeing there is one law for the rich and one for the poor
% agreeing ordinary working people do not get their fair share of the nation’s wealth

NatCen Social Research | Social and political attitudes of people on low incomes 29
Despite the fact that those with lower or middle incomes are more likely to feel a disparity between the way the rich and the poor are treated by society, as we saw in Chapter 4, there is no difference between the groups in their view of redistribution of wealth. Similar levels among all income groups (42% overall) agree that “government should redistribute income from the better-off to those who are less well off”. BSA also includes questions which explore how libertarian or authoritarian people’s views are. In general we found no differences between income groups in their views of these questions, but there are income differences for the following question: “for some crimes, the death penalty is the most appropriate sentence”. The second and third income groups are most likely to say that the death penalty is appropriate for some crimes (Figure 6-5), with the poorest and richest fifth less likely to agree. Figure 6-5 For some crimes the death penalty is the most appropriate sentence, by income group
Base: All respondents (2,400)
6.4 Views on Europe and migrants from the EU There is now a substantial evidence base exploring which groups were more likely to vote to remain or leave the EU in the referendum. Even before the referendum vote, euroscepticism was found to be higher among older people and people with lower levels of education, than younger people and those with higher levels of education.33 Post-referendum research has confirmed this, with NatCen’s report on Understanding the leave vote reporting that voting to leave the EU was highest among people without formal qualifications, with low incomes, and those in social housing. However, identity played a role as well; for example people believing Britain has got a lot worse in the
33
Curtice, J. (2015), Britain divided? Who support and who opposes EU membership, available at http://whatukthinks.org/eu/wp-content/uploads/2015/10/Analysis-paper-1-Britain-divided.pdf
43
53
48
41 39
0
10
20
30
40
50
60
Lowest incomequintile
2nd incomequintile
3rd incomequintile
4th incomequintile
Highest incomequintile
% agreeing for some crimes, the death penalty is the most appropriatesentence

30 NatCen Social Research | Social and political attitudes of people on low incomes
past ten years, and people who see themselves as English rather than British being among those most likely to have voted leave.34 The latest BSA data shows a clear difference between those with low and high incomes in their views on Europe. While opinion is fairly evenly split among the lowest income groups (albeit with the ‘Leave’ vote prevailing), there is a dominating ‘remain’ vote among the higher income groups.35 While just 36% of the highest income group say they voted to leave the EU, 51%-55% of the lower three income groups say they did so (see Figure 6-6).
Figure 6-6 How voted in EU referendum, by income group
Base: All respondents (2,302)
Voting to leave the EU is also more likely among older people (62% of people aged 75 or over, compared with 28% of people aged 18-24), people with lower qualification levels (70% of people with no qualifications, compared with 22% of people with a degree), as well as UKIP supporters (96%), Conservative supporters (53%) and people who do not support a particular party (60%). Income remained a key driver of EU vote even after factors such as age, education and party support were considered. BSA also asked respondents a more nuanced question about their view of Britain’s involvement with the EU:
Leaving aside the result of the referendum on Britain's membership of the European Union, what do you think Britain's policy should be. Should it... ... leave the European Union,
stay in the EU and try to reduce the EU's powers, stay in the EU and try to keep the EU's powers as they are, stay in the EU and try to increase the EU's powers, or, work for the formation of a single European government?
34
Swales, K. (2016), Understanding the leave vote, available at http://www.natcen.ac.uk/our-research/research/understanding-the-leave-vote/ 35
Full question text: “Did you vote to ‘remain a member of the EU’ or to ‘leave the EU’?”
48 44
49
58
64
51 55
51
42
36
0
20
40
60
80
Lowest incomequintile
2nd incomequintile
3rd incomequintile
4th incomequintile
Highest incomequintile
Remain a member of theEU
Leave the EU

NatCen Social Research | Social and political attitudes of people on low incomes 31
This question reveals that although the lowest income group are most likely to want to leave the EU, 35% say they would wish to stay in the EU and try to reduce its powers, and a further 12% would want to stay in the EU and keep the powers as they are (Figure 6-7). Again people with the highest incomes are most likely to want to remain in the EU, although the most prevalent view among this group is to stay in the EU and reduce its powers. Figure 6-7 View of Britain's future involvement with the EU, by income group
Base: All respondents (1,965)
People with lower incomes are also found to have stricter views on EU migrants and access to benefits. 35% of people in the lowest income group say EU migrants should have to wait more than four years or never be given access to benefits, this compares with 23% of people with the highest incomes.36
36
Full question text: “How long should migrants from within EU have lived in Britain before they can receive the same welfare benefits as British citizens?”
43
35
12
3
48
22 19
5
45
29
19
3
37 38
18
5
28
50
16
3
0
10
20
30
40
50
60
Leave the EuropeanUnion,
Stay in the EU and try toreduce the EU powers
Stay in the EU and try tokeep the EU powers as
they are
Stay in the EU and try toincrease the EU powers
% Lowest income quintile
% 2nd income quintile
% 3rd income quintile
% 4th income quintile
% Highest income quintile

32 NatCen Social Research | Social and political attitudes of people on low incomes
7 Conclusion
The aim of this report was to understand the concerns of people on low incomes, how they believe these issues could be addressed by the government and how involved they are in the political process.
The lowest income group is not a homogenous one, although it is generally younger, more female and more likely to be unemployed or in low paid, routine or semi-routine work.
This group is financially stretched with only a third saying they are comfortable on their current incomes and many feeling that their tax burden is too high. This financial crunch is reflected in their worries and concerns. Almost half are worried about money or debt, but the majority think they can do something about it.
The vast majority of people across the income spectrum think that it is the government’s responsibility to provide health care for the sick and a decent standard of living for the old. Those on lower incomes are more likely than richer groups to say that the government should provide a decent standard of living for the unemployed or a job for everyone who wants one, perhaps reflecting the larger proportion of this group who are unemployed or in less secure work. With such a large proportion in routine or semi-routine jobs in this income group there may also be concerns about continuing automation within the service and manufacturing industries which is likely to continue to threaten jobs over the next decade. While the majority of the poorest fifth say they would like the government to reduce income differences between the rich and the poor, they do not necessarily want the government to redistribute money from the rich to the poor. Almost a third say that taxes for those on high incomes are too high and only half say they wanted the government to redistribute income from the better-off to the less well-off. This suggest that this group has more interest in targeting existing government resources more towards those on low income, but not necessarily increasing the resources available to the government by increasing taxes.
There are few differences between the perceptions of poverty among those on low incomes and those on higher incomes. Those on low incomes are no more likely to say there is at least some child poverty than the rest of the population. Like the rest of the population they identify a wide variety of causes for child poverty, though they are less likely than the highest income groups to mention the parent’s lack of education as a cause.
In general, those on low incomes are more sympathetic than other groups towards those on benefits. They tend to disagree that benefit recipients do not really deserve any help, and only a fifth agree that most people on the dole are ‘fiddling’. They are also more likely to identify reasons for benefit fraud where it does occur – such as confusion over the system or cheating the system due to poverty. However, their support for an increase in government spending on benefits is divided and they feel it is more important for the government to clamp down on benefit fraud than to help people claim all the benefits to which they are entitled. This may reflect the concerns of the large proportion who are working, who feel that their income is squeezed and already feel that their tax burden is too high.
While those on low incomes have distinct views on the role of the government in addressing issues that are important to them, they are also the income group that is most marginalised politically. They have less interest in politics, have lower self-reported understanding of it and are much more likely to be ‘politically homeless’, i.e. not to support any political party. Those on low incomes have traditionally been less likely to support the Conservatives and more likely to support Labour. Yet our results

NatCen Social Research | Social and political attitudes of people on low incomes 33
show that while the support for the Conservatives is still lowest among this group, there no longer appears to be a link between income groups and Labour support. This reflects the changing political landscape in the second half of 2016, where Labour in particular was considered by many to be in disarray and unable to address the varying concerns of its traditional voters, many of whom had voted ‘Leave’.
It will be informative to see whether any of this has changed in 2017. In the 2017 election campaign Labour focused heavily on redistribution of income and improving living standards, which appears to have contributed to their larger than expected vote share. With this they may have been able to galvanise some in the low income group who as we have shown are concerned about issues such as money and debt. Larger than usual turnout at the election suggests higher engagement among groups that are usually politically aloof, such as the young (many of whom are in the lower income group).
34 NatCen Social Research | Social and political attitudes of people on low incomes
Appendix A. Methodology
In 2016, the Joseph Rowntree Foundation (JRF) funded two modules of questions on NatCen’s British Social Attitudes survey (BSA):
The first was a set of detailed income questions. Historically BSA has asked respondents for their household income using a single banded question, resulting in information that is not very detailed, and is prone to underreporting. To overcome this NatCen developed a set of detailed income questions that allow for more precise categorisation of people by income.
The second module was a set of questions about personal concerns and worries, and how much control people feel they have over problems in their lives.
Carried out annually since 1983,37 BSA is an authoritative source of data on the views of the British public. It uses a random probability sampling methodology to yield a representative sample of adults aged 18+ living in private households in Britain.38 The majority of questions are asked by an interviewer face-to-face in the form of a Computer Assisted Personal Interview (CAPI), while a smaller number are answered by respondents in a self-completion booklet. Questions relating to education were included in both sections of the survey. Data collection was carried out between July and November 2016 and the overall response rate was 46%. The achieved sample for the face-to-face questions was 2,942; the achieved sample for the self-completion questions was 2,400. The data have been weighted to account for unequal selection probabilities and non-response and calibrated to match the population profile on the basis of age, sex and region. All differences described in the text (between different groups of people) are statistically significant at the 95% level or above, unless otherwise specified.
Income variable
The new income questions asked on BSA 2016 consisted of separate questions asking each respondent (where appropriate) for their income and their partner’s income from employment, self-employment, pensions, benefits and tax credits, and any other sources of income. Mortgage or rent costs were also collected from respondents. From these questions an income variable was derived, defined as the net total household income from all sources, after housing costs and equivalised to account for household size according to the OECD companion scale39. Certain disability benefits were excluded from the total income because these relate to specific monetary outgoings that person will have as a result of their disability. The incomes of respondents and their partners were collected but not the incomes of the entire household. This was due to high item non-response at ‘other adult’ income questions at the questionnaire piloting stage, and the high respondent burden for people in multi-adult households. To correct for this, respondents who were financially
37
Apart from in 1988 and 1992 when its core funding was used to fund the British Election Study series. 38
For more technical details of the survey methodology see http://www.bsa.natcen.ac.uk/latest-report/british-social-attitudes-34/technical-details.aspx 39
More information on standard equivalisation can be found here: https://www.gov.uk/government/uploads/system/uploads/attachment_data/file/325492/households-below-average-income-quality-methodology-2012-2013.pdf

NatCen Social Research | Social and political attitudes of people on low incomes 35
dependent on an adult/s in the household other than their partner were not included in the income analysis.
To account for household size, an equivalence scale was derived in accordance with the OECD companion scale to equivalise income after housing cost, which assigns a weight of 0.58 to the first adult, a weight of 0.42 to all other adults and children aged 14 or over and a weight of 0.2 to all younger children.

NatCen Social Research35 Northampton Square
LondonEC1V 0AX
Tel. 020 7250 1866Fax. 020 7250 1524
E-mail: [email protected]
A company limited by guaranteeRegistered in England No. 04392418
A charity registered in England and Wales (1091768) and Scotland (SCO38454)