october 2017 - justice4all.org · executive summary in 2016, the legal aid justice center released...
TRANSCRIPT
CHARLOTTESVILLE | RICHMOND | PETERSBURG | NORTHERN VIRGINIA | WWW.JUSTICE4ALL.ORG
An update on the state of exclusionary discipline in Virginia’s public schools October 2017

Author
Amy Woolard
Acknowledgements
The author is grateful for the assistance of attorneys Jason Langberg, Rachael Deane, and Angela Ciolfi, who contributed to and reviewed multiple drafts of this report.
The Legal Aid Justice Center (LAJC) fights injustice in the lives of individual Virginians while rooting out exploitative policies and practices that keep people in poverty. LAJC uses impact litigation, community organizing, and policy advocacy to solve urgent problems in areas such as housing, education, civil rights, immigration, health care and consumer finance. LAJC’s primary service areas are Charlottesville, Northern Virginia, Richmond, and Petersburg, but the effects of its work are felt statewide.
Charlottesville
1000 Preston Avenue, Suite A Charlottesville, VA 22903 Phone: 434-977-0553
Northern Virginia
6066 Leesburg Pike, Suite 520 Falls Church, VA 22041 Phone: 703-778-3450
Richmond
123 East Broad Street Richmond, VA 23219 Phone: 804-643-1086
Petersburg
229 North Sycamore Street Petersburg, VA 23803 Phone: 804-862-2205
Toll-free: 800-763-7323 (clients only) | International: 1-800-892-1751 (In Mexico, dial 001 first)
www.justice4all.org
Disclaimer
This report is not legal advice. Because of the rapidly changing nature of the law, information contained in this report may become outdated, and anyone using this material in a legal matter must always research original sources.

Table of Contents
8 Troubling Facts about Suspension & Expulsion in Virginia Schools during 2015-16 ……………………………..1
5 Recommendations for Lawmakers & Policymakers ……………………………..7
Virginia Suspension & Expulsion Data (2015-16) …………………………….11

Executive Summary
In 2016, the Legal Aid Justice Center released Suspended Progress, an issue brief on the state of exclusionary discipline in the Commonwealth of Virginia’s public school system for the 2014-2015 academic year. The results were appalling: hundreds of thousands of students excluded from school for weeks and months at a time, with the vast majority of suspensions issued for non-violent, relatively minor misbehavior. Students with disabilities and students of color were disproportionately suspended and expelled at two-and-a-half and three-and-a-half times the rate of their white and non-disabled peers, respectively. Tens of thousands of suspensions were issued to very young students in elementary grades. These results from the 2014-2015 school year also represented an increase in the Virginia suspension rate after four years of a downward trend.
When we reviewed the disciplinary outcome data reported by local school divisions to the Virginia Department of Education for the 2015-16 academic year, we were hoping the prior year had been an aberration. After doing our homework, our hopes were dashed: Virginia schools continue to issue a huge number of out-of-school suspensions, posting a slight increase from even the 2014-2015 totals.
In this update to Suspended Progress, which covers the 2015-16 academic year, we found:
• Virginia schools issued over 131,500 out-of-school suspensions to over 70,000 individual students, representing an increase in the overall suspension rate for the second year in a row.
• The short-term suspension rate increased in 2015-16 after years of significant steady decline.• Virginia schools continue to use exclusionary discipline with very young students at an astonishing rate,
issuing over 17,300 short-term suspensions and at least 93 long-term suspensions just to children in pre-Kindergarten (pre-K) through third grade alone.
• The majority of suspensions were issued for minor offenses, with approximately two-thirds of all suspensions given for behavior offenses, such as possession of cell phones, minor insubordination, disrespect, and using inappropriate language.
Perhaps most disturbing is that Virginia schools continue to disproportionately suspend African-American students and students with disabilities. The suspension rate for African-American students was 3.8 times larger than for Hispanic and white students. Students with disabilities were suspended at a rate 2.6 times larger than that of their non-disabled peers. When examining the effects of race, sex, and disability, the results are especially troubling: African-American male students with disabilities were almost 20 times more likely to be suspended than white female students without disabilities.
The bottom line: We cannot continue to use access to education as a punishment for student conduct and expect positive results from either students or schools.
• When children are suspended from school in Virginia, they are more likely to experience academicfailure, drop out of school, have substance abuse issues, have mental health needs, and becomeinvolved in the justice system.
• When the underlying causes of conduct issues are left unaddressed, students who do manage to returnto school have both academic and reputational challenges to overcome.
• Exclusion can also have harsh effects on students’ basic care and safety: a suspended student may bealone and/or unsupervised during the day, and may also experience hunger and poor nutrition if theyrely on school lunch and breakfast for meals.

• Schools with high suspension rates generally have poor school climate ratings, as well as lower testscores and graduation rates.
But it doesn’t have to be this way.
Virginia schools’ use of exclusionary discipline is myopic and harmful. Suspensions and expulsions place students out of sight and out of mind, but they don’t disappear. These are often children who—still forming as people—need academic, social, and therapeutic supports, and positive adult guidance, more than ever.
• When students are struggling, they need more help, not less.• When students become disconnected from their education, they need more support, not less.• When students are misbehaving, they need more attention from the adults in their lives, not less.
At both state and local levels, Virginia should scale back use and duration of suspensions and expulsion. In the rare event exclusionary discipline is used, students should still be able to access high-quality educational services that keep them on track toward returning promptly to their home school, achieving a diploma, and having opportunities for higher education and employment. The Commonwealth should direct greater resources toward in-school supports like counselors, school psychologists, school social workers, and alternatives to exclusion, like restorative practices, positive behavioral supports, and social and emotional learning. School staff, parents, and students should engage with each other in designing codes of conduct to reframe discipline in ways that focus on strengthening students and schools, rather than defaulting to punishment and isolation, which often lead to students dropping out.
This update to Suspended Progress provides detailed school discipline data, both in the aggregate and by locality, for the 2015-16 school year, the most recent year data is available as of this release.1 We examine current effects of school discipline policy in Virginia and offer timely recommendations for lawmakers, policymakers, and local school boards. This brief serves to accompany, not replace, our original 2016 Suspended Progress report.
1 The data in this report were obtained through a Freedom of Information Act request to the Virginia Department of Education (VDOE), VDOE Fall Membership Reports, and VDOE’s Safe Schools Information Resource, https://p1pe.doe.virginia.gov/pti/.

1
Suspended Progress:8 Troubling Facts about Suspension & Expulsion
in Virginia Schools during 2015-16
#1: Virginia schools continued to issue a huge number of out-of-school suspensions.
Virginia schools issued: 127,255 short-term suspensions to 70,239 students; 2,965 long-term suspensions to 2,834 students; 282 expulsions to 282 students; and 1,013 modified expulsions to 990 students. Over 10% of ninth graders were suspended at least once. Middle and high schools issued 1.5 out-of-school suspensions for every 10 students. Thousands more students were subjected to bus suspensions, in-school suspensions, reassignments to alternative schools and programs, and other disciplinary consequences that may cause them to miss critical instruction time.
The average length of short-term suspensions, long-term suspensions, and expulsions were three, 62, and 365 school days, respectively.
Definitions
Short-Term Suspension: Banning a student from school for up to 10 school days
Long-Term Suspension: Banning a student from school for 11 school days to 364 calendar days
Expulsion: Banning a student from school for one calendar year at a time
Modified Expulsion: Expelling a student from school, but then modifying the expulsion to a lesser consequence, such as a long-term suspension
Reassignment: Requiring a student found to have committed a “serious offense or repeated offenses” of the code of conduct to attend an alternative education placement
#2: The short-term suspension rate in Virginia schools has begun to increase.
From 2010-11 to 2013-14, the statewide rate of students short-term suspended declined by over 20%. Then, from 2013-14 to 2014-15, the rate of students short-term suspended remained approximately the same. Most recently, from 2014-15 to 2015-16, the rate of students short-term suspended increased by 1.8%. The long-term suspension rate remained virtually unchanged from 2014-15 to 2015-16. The number of expulsions steadily declined from 553 in 2011-12 to 282 in 2015-16; the number of modified expulsions decreased by 56% during the same time period. In aggregate, students missed 381,765 school days due to short-term suspension alone.
Short-term suspensions may not seem harmful at face value, but they have cumulative effects that can set students (especially very young students) on a direct path to dropping out:
2
• A short-term suspension can be given for as long as 10 school days, which equates to two full weeks ofschool—a significant period of academic time, especially for elementary-age students.
• Short-term suspensions can be issued one after another, in unlimited succession and without anyrequirements on schools to consider interventions.
• After an initial short-term suspension is issued, suspension often becomes the default response for anysubsequent behavioral issues, and for longer durations, which creates a downward spiral of exclusionand makes it ever more difficult for a student to catch up.
• Students may appeal a short-term suspension, but by the time an appeal is heard, the suspension hasoften already been served, the school days already missed. Students—and especially students withdisabilities—may receive multiple short-term suspensions before school staff makes critical connections(if ever made) between the student’s behavior and supports that could prevent or address the behavior.
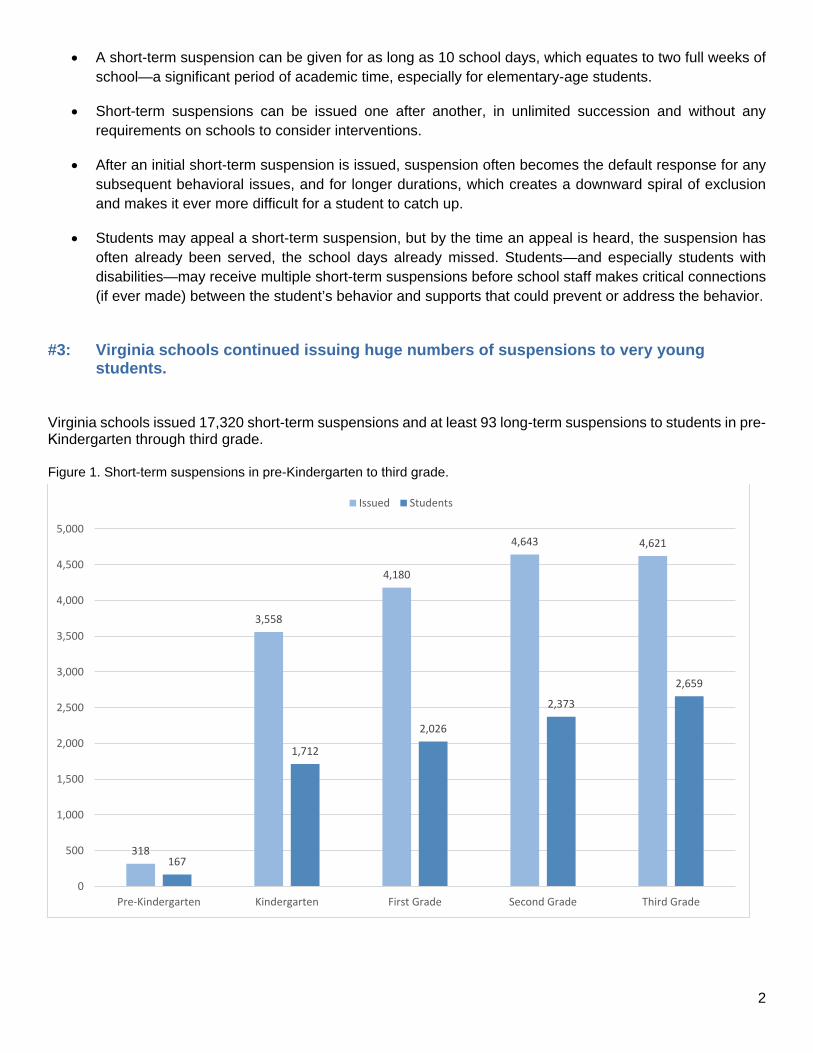
#3: Virginia schools continued issuing huge numbers of suspensions to very young students.
Virginia schools issued 17,320 short-term suspensions and at least 93 long-term suspensions to students in pre-Kindergarten through third grade.
Figure 1. Short-term suspensions in pre-Kindergarten to third grade.
318
3,558
4,180
4,643 4,621
167
1,712
2,026
2,373
2,659
0
500
1,000
1,500
2,000
2,500
3,000
3,500
4,000
4,500
5,000
Pre-Kindergarten Kindergarten First Grade Second Grade Third Grade
Issued Students

3
#4: Virginia schools continued to issue most suspensions for relatively minor, non-violent offenses.
57% of all short-term suspensions and 18% of all long-term suspensions were issued for the ten relatively minor, non-violent offenses in the table below.
Table 1. Suspensions for minor offenses.
Offense Short-Term
Suspensions Long-Term
Suspensions Issued Students Issued Students
Attendance 664 521 * * Cellular Telephones 2,087 1,699 * * Classroom or Campus Disruption 14,573 11,056 115 115 Defiance of Authority/Insubordination 18,398 12,768 105 104 Disrespect/Walking Away 7,729 6,373 35 35 Disruptive Demonstrations 15,392 11,093 217 214 Electronic Devices 144 143 * * Inappropriate Personal Property (food/beverage, clothing, toys, etc.) 389 370 * * Minor Insubordination 3,921 2,984 14 14 Using Obscene/Inappropriate Language/Gestures 8,952 7,540 42 41 Total 72,249 54,547 528 523
* VDOE suppresses data points between one and ten; therefore, these figures cannot be calculated.
#5: Virginia schools continued to disproportionately suspend African-American students.
African-American students made up 23% of the statewide student population, but received 59% of short-term suspensions, 57% of long-term suspensions, 43% of expulsions, and 34% of modified expulsions. The suspension rate for African-American students was 3.8 times larger than the suspension rate for Hispanic and white students.
Figure 2. Suspensions issued by race. Figure 3. Students suspended by race.
22.9
14.4
50.5
58.7
7.8
28.0
57.1
9.0
28.1
0
10
20
30
40
50
60
70
African American Hispanic White
Perc
ent
Student Population Short-Term Suspensions Long-Term Suspensions 12.9
3.4 3.4
0
2
4
6
8
10
12
14
AfricanAmerican
Hispanic White
Perc
ent o
f Rac
ial G
roup

4
From 2011-12 to 2015-16, the gap between the percent of all African-American students short-term suspended and the percent of all white students short-term suspended (i.e., the African-American to white student “risk difference”) has fluctuated very little—ranging from 8.9 to 9.8 percentage points. The gap increased from 2014-15 to 2015-16.
Figure 3. Racial disparity in students short-term suspended.
#6: Virginia schools continued to disproportionately suspend students with disabilities.
Approximately 10.6% of students with disabilities were short-term suspended at least once, compared to 4.7% of students without disabilities. The rate of short-term suspensions issued to students with disabilities was 2.6 times larger than the rate for students without disabilities. The disparities are the worst in the following divisions (among divisions with at least ten students with disabilities and ten students without disabilities suspended).
Table 2. Divisions with highest disability disparities in short-term suspension.
Division % of Students with Disabilities Short-Term Suspended
% of Students without Disabilities Short-Term Suspended
Risk Difference
Colonial Beach 33.3 9.2 24.1 Richmond City 29.7 15.0 14.6 Hampton City 26.9 12.4 14.5 Northumberland County 22.5 8.3 14.2 Northampton County 25.5 11.3 14.2 Norton City 17.1 4.4 12.7 Mecklenburg County 26.1 13.8 12.3 Pulaski County 19.1 7.0 12.1 Newport News City 22.8 10.9 11.9 Norfolk City 24.1 12.8 11.4 Nelson County 19.5 8.3 11.2 Nottoway County 18.1 7.0 11.1 Lunenburg County 24.4 13.6 10.7 Mathews County 14.9 4.4 10.5 King and Queen County 17.8 7.4 10.4 Bristol City 16.9 6.7 10.2 Cumberland County 16.5 6.5 10.0
2011-12 2012-13 2013-14 2014-15 2015-16African American 14.0 13.3 12.2 12.3 12.9White 4.2 3.9 3.3 3.3 3.3
0
2
4
6
8
10
12
14
16
Perc
ent o
f Sub
grou
p(in
div
ision
s with
at l
east
te
n st
uden
ts in
eac
h su
bgro
up
shor
t-te
rm su
spen
ded)

5
From 2011-12 to 2015-16, the gap between the rate of students with disabilities short-term suspended and the rate of students without disabilities short-term suspended (i.e., the students with disabilities to students without disabilities “risk difference”) has fluctuated very little—ranging from 6.3 to 6.8 percentage points. The gap has been the same since 2013-14.
Figure 4. Disability disparity in students short-term suspended.
#7: Disparities in suspension are especially pronounced when examining the overlap of race, sex, and disability.
Nearly one quarter of African-American male students with disabilities were suspended at least once. They were almost 20 times more likely than white female students without disabilities to be suspended.
Figure 5. Race, sex, and disability disparities in short-term suspension.
2011-12 2012-13 2013-14 2014-15 2015-16Students with Disabilities 12.4 11.9 10.9 10.9 11.0Students without Disabilities 5.6 5.2 4.6 4.6 4.7
0.0
2.0
4.0
6.0
8.0
10.0
12.0
14.0
Perc
ent o
f Sub
grou
p (in
div
ision
s with
at l
east
te
n st
uden
ts in
eac
h su
bgro
up
shor
t-te
rm su
spen
ded)
15.4
7.9
23.3
14.8
4.0
1.2
8.7
3.4
0
5
10
15
20
25
Afr. Am. Fem.w/ Dis.
Afr. Am. Fem.w/o Dis.
Afr. Am. Malesw/ Dis.
Afr. Am. Malesw/o Dis.
White Fem. w/Dis.
White Fem.w/o Dis.
White Malesw/ Dis.
White Fem.w/o Dis.
Perc
ent o
f Gro
up S
uspe
nded
(in 1
9 di
visio
ns th
at sh
ort-
term
susp
ende
d at
le
ast 1
0 st
uden
ts in
eac
h ca
tego
ry)
6
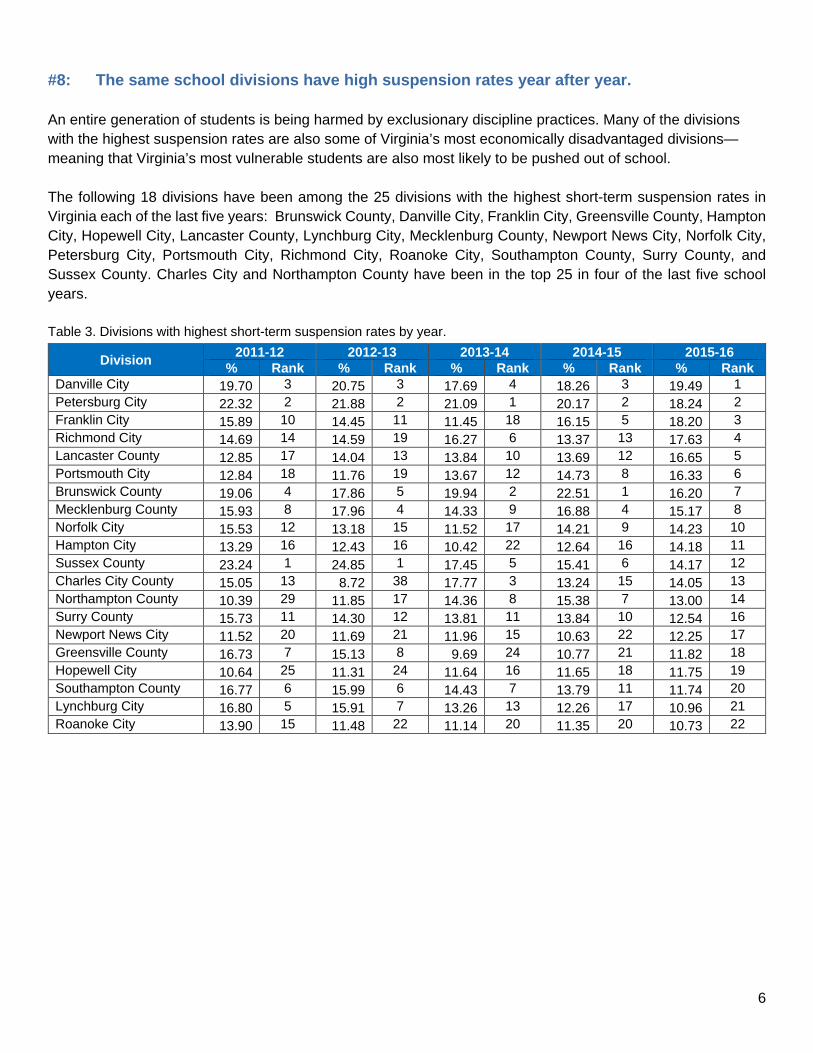
#8: The same school divisions have high suspension rates year after year.
An entire generation of students is being harmed by exclusionary discipline practices. Many of the divisions with the highest suspension rates are also some of Virginia’s most economically disadvantaged divisions—meaning that Virginia’s most vulnerable students are also most likely to be pushed out of school.
The following 18 divisions have been among the 25 divisions with the highest short-term suspension rates in Virginia each of the last five years: Brunswick County, Danville City, Franklin City, Greensville County, Hampton City, Hopewell City, Lancaster County, Lynchburg City, Mecklenburg County, Newport News City, Norfolk City, Petersburg City, Portsmouth City, Richmond City, Roanoke City, Southampton County, Surry County, and Sussex County. Charles City and Northampton County have been in the top 25 in four of the last five school years.
Table 3. Divisions with highest short-term suspension rates by year.
Division 2011-12 2012-13 2013-14 2014-15 2015-16 % Rank % Rank % Rank % Rank % Rank
Danville City 19.70 3 20.75 3 17.69 4 18.26 3 19.49 1 Petersburg City 22.32 2 21.88 2 21.09 1 20.17 2 18.24 2 Franklin City 15.89 10 14.45 11 11.45 18 16.15 5 18.20 3 Richmond City 14.69 14 14.59 19 16.27 6 13.37 13 17.63 4 Lancaster County 12.85 17 14.04 13 13.84 10 13.69 12 16.65 5 Portsmouth City 12.84 18 11.76 19 13.67 12 14.73 8 16.33 6 Brunswick County 19.06 4 17.86 5 19.94 2 22.51 1 16.20 7 Mecklenburg County 15.93 8 17.96 4 14.33 9 16.88 4 15.17 8 Norfolk City 15.53 12 13.18 15 11.52 17 14.21 9 14.23 10 Hampton City 13.29 16 12.43 16 10.42 22 12.64 16 14.18 11 Sussex County 23.24 1 24.85 1 17.45 5 15.41 6 14.17 12 Charles City County 15.05 13 8.72 38 17.77 3 13.24 15 14.05 13 Northampton County 10.39 29 11.85 17 14.36 8 15.38 7 13.00 14 Surry County 15.73 11 14.30 12 13.81 11 13.84 10 12.54 16 Newport News City 11.52 20 11.69 21 11.96 15 10.63 22 12.25 17 Greensville County 16.73 7 15.13 8 9.69 24 10.77 21 11.82 18 Hopewell City 10.64 25 11.31 24 11.64 16 11.65 18 11.75 19 Southampton County 16.77 6 15.99 6 14.43 7 13.79 11 11.74 20 Lynchburg City 16.80 5 15.91 7 13.26 13 12.26 17 10.96 21 Roanoke City 13.90 15 11.48 22 11.14 20 11.35 20 10.73 22
7
5 Recommendations Lawmakers and School Divisions Can and Should Enact in the Next Year
#1: The General Assembly should pass legislation that limits the use and duration of suspension and expulsion, most especially for elementary school students.
During the 2015-16 school year, Virginia schools issued 17,320 short-term suspensions and at least 93 long-term suspensions to students in pre-Kindergarten through third grade. For these young students, school exclusion can be especially detrimental.
• Schools often label developmentally appropriate behavior in very young children as “misbehavior.” Such behavior can be more effectively addressed with skill building, rather than punitive responses.
• Such behavior could indicate unidentified disabilities or other developmental, physical health, mental health, or emotional support needs. Out-of-school suspensions can delay identification and exacerbate symptoms.
• Excluding young children from school can create collateral consequences for families that compound issues or create new problems, especially for parents who lack child care or work leave time.
• Children form their school attendance habits in elementary school. When we use out-of-school suspensions as punishment, we teach young children that attending school isn’t an important, fundamental value they should prioritize.
• Very young students do not necessarily associate staying home from school as a consequence of misbehavior. They perceive time differently than older youth, and the difficult transitions that come from the changes in daily structure can make matters worse.
• Behavioral challenges in young students can be rooted in academic gaps. Excluding children from school worsens both behavioral and academic issues.
• Many families rely on school breakfast and lunch programs to ensure their children have enough nutritious, regular meals to eat. Out-of-school suspension not only takes away education, it prevents students from accessing basic needs like meals, social interaction, and health services.
The General Assembly should eliminate all out-of-school suspensions and expulsions for students in pre-K through third grade. Limited exceptions could be made for the extremely rare instances of serious weapon-, drug-, or serious violence-related events. Especially in these early grades, school divisions can and should be employing alternatives to exclusion that build skills, including parent conferences, referrals to supports or special education, restorative practices, and evidence-backed in-school interventions that ensure students stay engaged with their education and return to their classroom as quickly as possible.
As we detail in our original 2016 Suspended Progress report, the General Assembly should also significantly reduce the maximum duration of long-term suspensions to a period of no more than 45 days. Additionally, the General Assembly should eliminate the use of long-term suspension and expulsion for behavior violations that do not involve serious injury or serious credible threat to others.

8
#2: The General Assembly should direct the Virginia Department of Education to collect and report data on alternative education programs offered by local school divisions to students subject to disciplinary measures like suspension and reassignment.
Virginia students currently have no statutory right to continued education during a suspension or an expulsion (except in some instances of students with disabilities suspended for more than 10 school days for behavior directly related to their disability).
Most school divisions offer no meaningful opportunity to maintain educational progress or prevent educational regression while a student is excluded from school. Missing months, weeks, or even just days of school can leave many students in the stressful situation of feeling isolated and perpetually struggling to catch up. Some students are forced to repeat grades. Tragically, many students who endure out-of-school suspension and expulsion are driven to drop out of school entirely.
For school divisions that provide some form of alternative education, there is currently little accountability or transparency: Virginia does not keep track of the type, quality, duration, outcomes, or student enrollment totals of many programs authorized as “alternative education” offered to students under Va. Code §22.1-277.2:1 and 8 VAC 20-330-10. Such programs may entail anything from a few hours per week oftutoring at home, to an online course, to attending a separate physical school building with dozens of otherstudents whose only common characteristic is having been suspended or expelled. These placements can goon indefinitely.
Alternative education functions as a shadow school system, in that student data is masked by a school division’s overall performance. We don’t know what these programs are, how many students attend them, how long students stay or if they ever return to their home school, or how these students fare academically or socially. Students consigned to alternative programs are also often disconnected from opportunities like participating in extra-curricular activities and developing the “social capital” experiences that can help smooth the path to college and employment, like relationships with coaches and teachers who can provide recommendation letters and mentorship. While some alternative education programs provide meaningful services to students who genuinely need instruction in an alternative setting, we need to know more about their scope across the Commonwealth, including the extent to which they segregate and isolate students.
The General Assembly can and should, through legislation, demand that local school divisions report a variety of performance and attendance indicators of their alternative education offerings to the Virginia Department of Education, which should compile the information and make it public. Accountability and transparency are the first steps toward ensuring that “alternative education” isn’t a one-way ticket to a second-rate education.
#3: The Governor and the General Assembly should fully fund the Virginia Board of Education’s 2016 revisions to the Standards of Quality—most especially lifting constraints on school support staff positions—and should also adjust current targeted funding formulas to better support economically disadvantaged students and schools in high-poverty areas.
While many of the proven alternatives to suspension and expulsion cost less than the current exclusionary school discipline approach, state funding for public education falls far short of student and local school division needs. The General Assembly must allocate adequate funding for Virginia’s schools in order to provide maximum support to students and create a positive school climate.

9
In the fall of 2016, the Virginia Board of Education issued recommended revisions to the Standards of Quality, the foundational framework for the Commonwealth’s public education system.2 Recognizing a 39 percent increase in economically disadvantaged students over the last decade, the Board recommended changes to the Standards of Quality that would result in nearly $600 million more per year in additional support for all students. The recommendations included minimum staffing levels for school social workers, school psychologists, and school nurses, who are vital for creating a positive and supportive school climate, implementing positive behavioral interventions and supports, and addressing behavior on an individual basis according to student needs. The Board also recommended lifting the support position cap, an arbitrary, recession-era change to the school funding formula that limits state funding for other crucial support positions, including attendance staff, maintenance workers, and school transportation staff. The General Assembly should eliminate this cap and fully fund the Board’s revisions to the Standards of Quality.
The General Assembly should also increase the “At-Risk Add-On,” which provides school divisions with one to 13 percent more funding for every economically disadvantaged student in the school division, based on the division’s concentration of poverty. Virginia’s targeting funding lags far behind that of other states; the national average among states that make a poverty adjustment in their funding formula is 29 percent.3 The General Assembly should increase the At-Risk Add-On to one to 25 percent.
#4: Local governments and school divisions should direct resources into proven alternatives to suspension and expulsion, like restorative practices, multi-tiered systems of supports, and social and emotional learning programs.
There is no evidence to suggest that suspension or expulsion of students deter misconduct or improve school safety. In fact, we already have strong examples of evidence-backed alternatives to exclusion that strengthen students’ relationship with school and improve school climate.
Restorative practices are non-punitive methods that provide meaningful, appropriate accountability for a student’s specific behavior issue.4 Restorative responses focus on repairing the harm done, developing a workable plan for restoring relationships or damage, and including victims and others affected by the conduct in the process. In many cases, actual restitution can occur—a restorative plan can include property repair, tailored school service projects, and relationship skill-building. We have identified more than a dozen Virginia school divisions that have already employed restorative practices with encouraging results, including Chesterfield, Richmond City, Harrisonburg, Fairfax, Spotsylvania, Loudoun, and Roanoke, among others. In these and other school divisions that implement restorative practices:
• Behavioral incidents decrease;• Academic achievement increases;• Students report more positive school climate in general;• Peer-to-peer accountability increases; and• Students and teachers learn invaluable conflict resolutions skills.
The General Assembly, the Virginia Department of Education, and local school divisions should direct resources toward building strong restorative practices in all Virginia schools.
2 Virginia Board of Education, 2016 Annual Report on the Condition and Needs of Public Schools in Virginia, (Nov. 2016), available at http://www.doe.virginia.gov/boe/reports/annual_reports/2016.pdf (last visited Oct. 3, 2017). 3 Chris Duncombe and Michael Cassidy, Weighing Support for Virginia’s Students, The Commonwealth Institute, available at http://www.thecommonwealthinstitute.org/2016/06/01/weighing-support-for-virginias-students/ (last visited Oct. 2, 2017). 4 Trevor Fonious, et. al., Restorative Justice in US Schools: A Research Review, WestEd Justice & Prevention Research Center (Feb. 2016), available at https://jprc.wested.org/wp-content/uploads/2016/02/RJ_Literature-Review_20160217.pdf (last visited Oct. 2, 2017).

10
Multi-tiered systems of supports (MTSS)5 and social and emotional learning (SEL)6 programs both use positive, skill-building frameworks that include both students and school staff. MTSS uses academic and behavioral interventions that are tailored and scaled to specific student needs, rather than using a one-size-fits-all (or one-size-removes-all) approach; serious conduct issues, for example, would generate a behavioral assessment, an individualized intervention plan, and wraparound services to address a student’s specific needs. SEL helps students and adults develop emotional, behavioral, and social competencies that promote strong relationships, responsible decision-making, and self-management. Our Suspended Progress (2016) report outlines both of these approaches, along with several other supportive alternatives, in greater detail.
#5: Local school divisions, parents, and students should engage with one another in designing codes of conduct to reframe discipline in ways that focus on strengthening students and schools, rather than defaulting to punishment and isolation.
Local school boards should adopt student codes of conduct that are consistent with adolescent development, promote fundamental fairness, and ensure that students receive consistent, quality education even when under a disciplinary consequence. Such codes of conduct should:
• Be consistent with positive behavioral interventions and supports (PBIS);• Describe and emphasize students’ rights as well as responsibilities;• Describe expectations of staff in managing behavior;• Tier consequences by grade level and offense severity;• Describe prohibited conduct with adequate specificity;• Require that administrators consider mitigating factors before meting out discipline;• Require the use of available interventions and alternatives that are appropriate and tailored to specific
offenses in lieu of exclusionary discipline;• Describe available interventions and alternatives;• Use clear, simple language, and define uncommon words and jargon; and• Be comprehensible to students and parents with lower reading levels.
School divisions should also assure that these codes of conduct are developed in partnership with community stakeholders, which should not only include students and families, but also teachers, support staff, community advocates, and service providers. School boards and administrators should regularly engage in conversation with these stakeholders to review codes of conduct, school discipline data, and other aspects of local school policy.
5 Edutopia, Supporting Behavioral Needs: A Multi-Tiered Approach, available at http://www.edutopia.org/practice/supporting-behavioral-needs-multi-tiered-approach (last visited Oct. 2, 2017). 6 Collaborative for Academic, Social, and Emotional Learning, What is Social and Emotional Learning?, available at http://www.casel.org/what-is-sel/ (last visited Oct. 2, 2017).
Recent Positive Developments in Virginia
In 2017, the Virginia General Assembly passed and Gov. McAuliffe signed into law SB829/HB1924, bills that directed the Virginia Board of Education to establish guidelines for alternatives to suspension and
expulsion for consideration by local school boards. These guidelines are expected to be issued alongside a “Model Student Code of Conduct” currently under development by the Virginia Department of Education.
11
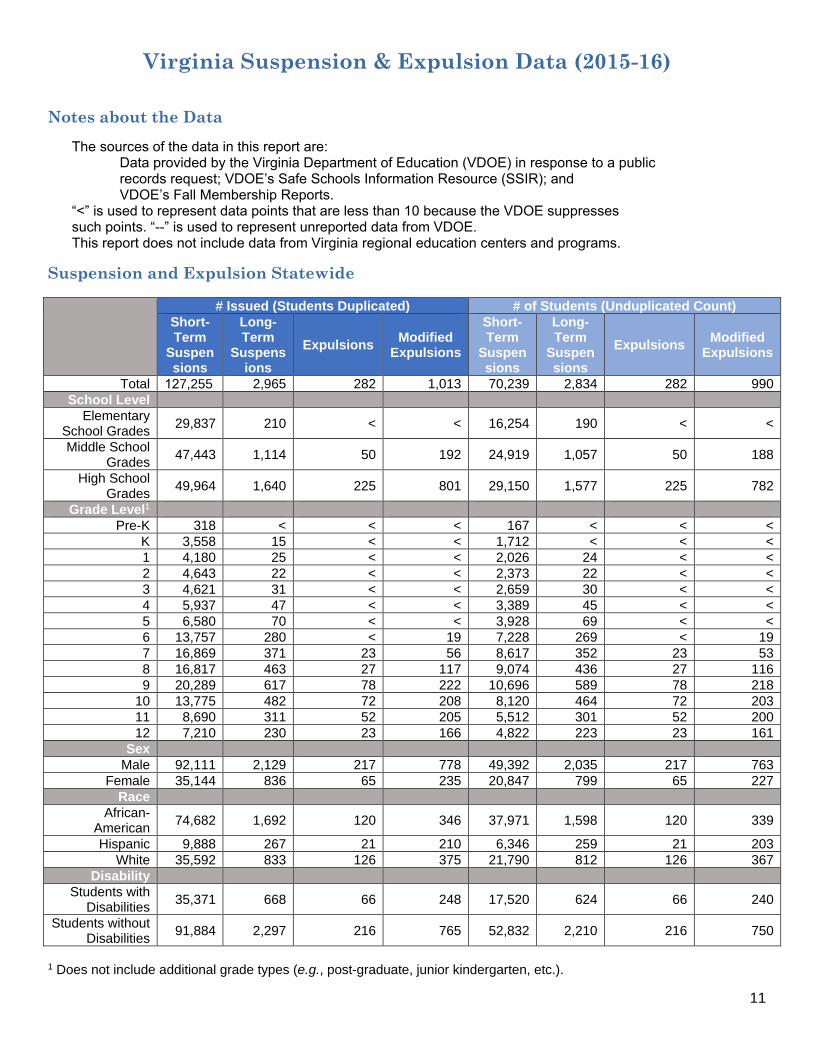
Virginia Suspension & Expulsion Data (2015-16)
Notes about the Data The sources of the data in this report are:
Data provided by the Virginia Department of Education (VDOE) in response to a public records request; VDOE’s Safe Schools Information Resource (SSIR); and VDOE’s Fall Membership Reports.
“<” is used to represent data points that are less than 10 because the VDOE suppresses such points. “--” is used to represent unreported data from VDOE. This report does not include data from Virginia regional education centers and programs.
Suspension and Expulsion Statewide
# Issued (Students Duplicated) # of Students (Unduplicated Count) Short-Term
Suspensions
Long-Term
Suspensions
Expulsions Modified Expulsions
Short-Term
Suspensions
Long-Term
Suspensions
Expulsions Modified Expulsions
Total 127,255 2,965 282 1,013 70,239 2,834 282 990 School Level
Elementary School Grades 29,837 210 < < 16,254 190 < <
Middle School Grades 47,443 1,114 50 192 24,919 1,057 50 188
High School Grades 49,964 1,640 225 801 29,150 1,577 225 782
Grade Level1 Pre-K 318 < < < 167 < < <
K 3,558 15 < < 1,712 < < < 1 4,180 25 < < 2,026 24 < < 2 4,643 22 < < 2,373 22 < < 3 4,621 31 < < 2,659 30 < < 4 5,937 47 < < 3,389 45 < < 5 6,580 70 < < 3,928 69 < < 6 13,757 280 < 19 7,228 269 < 19 7 16,869 371 23 56 8,617 352 23 53 8 16,817 463 27 117 9,074 436 27 116 9 20,289 617 78 222 10,696 589 78 218
10 13,775 482 72 208 8,120 464 72 203 11 8,690 311 52 205 5,512 301 52 200 12 7,210 230 23 166 4,822 223 23 161
Sex Male 92,111 2,129 217 778 49,392 2,035 217 763
Female 35,144 836 65 235 20,847 799 65 227 Race
African-American 74,682 1,692 120 346 37,971 1,598 120 339
Hispanic 9,888 267 21 210 6,346 259 21 203 White 35,592 833 126 375 21,790 812 126 367
Disability Students with
Disabilities 35,371 668 66 248 17,520 624 66 240
Students without Disabilities 91,884 2,297 216 765 52,832 2,210 216 750
1 Does not include additional grade types (e.g., post-graduate, junior kindergarten, etc.).
12
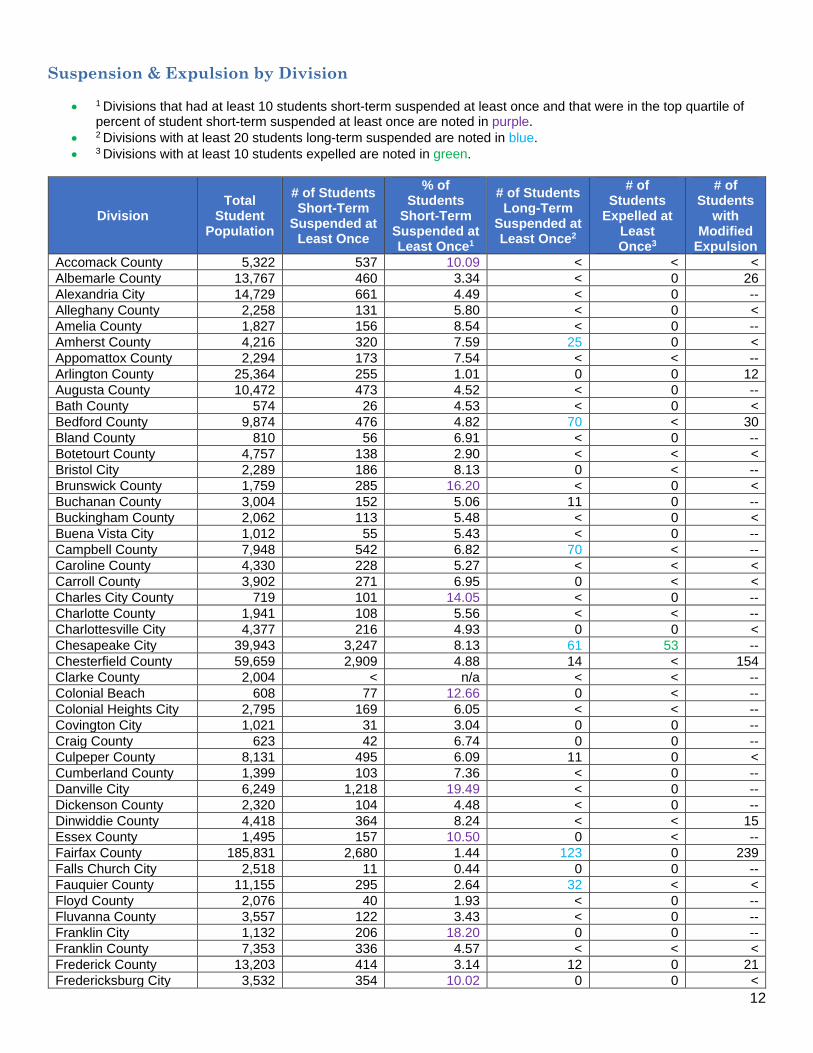
Suspension & Expulsion by Division
• 1 Divisions that had at least 10 students short-term suspended at least once and that were in the top quartile ofpercent of student short-term suspended at least once are noted in purple.
• 2 Divisions with at least 20 students long-term suspended are noted in blue.• 3 Divisions with at least 10 students expelled are noted in green.
Division Total
Student Population
# of Students Short-Term
Suspended at Least Once
% of Students
Short-Term Suspended at Least Once1
# of Students Long-Term
Suspended at Least Once2
# of Students
Expelled at Least Once3
# of Students
with Modified
Expulsion Accomack County 5,322 537 10.09 < < < Albemarle County 13,767 460 3.34 < 0 26 Alexandria City 14,729 661 4.49 < 0 -- Alleghany County 2,258 131 5.80 < 0 < Amelia County 1,827 156 8.54 < 0 -- Amherst County 4,216 320 7.59 25 0 < Appomattox County 2,294 173 7.54 < < -- Arlington County 25,364 255 1.01 0 0 12 Augusta County 10,472 473 4.52 < 0 -- Bath County 574 26 4.53 < 0 < Bedford County 9,874 476 4.82 70 < 30 Bland County 810 56 6.91 < 0 -- Botetourt County 4,757 138 2.90 < < < Bristol City 2,289 186 8.13 0 < -- Brunswick County 1,759 285 16.20 < 0 < Buchanan County 3,004 152 5.06 11 0 -- Buckingham County 2,062 113 5.48 < 0 < Buena Vista City 1,012 55 5.43 < 0 -- Campbell County 7,948 542 6.82 70 < -- Caroline County 4,330 228 5.27 < < < Carroll County 3,902 271 6.95 0 < < Charles City County 719 101 14.05 < 0 -- Charlotte County 1,941 108 5.56 < < -- Charlottesville City 4,377 216 4.93 0 0 < Chesapeake City 39,943 3,247 8.13 61 53 -- Chesterfield County 59,659 2,909 4.88 14 < 154 Clarke County 2,004 < n/a < < -- Colonial Beach 608 77 12.66 0 < -- Colonial Heights City 2,795 169 6.05 < < -- Covington City 1,021 31 3.04 0 0 -- Craig County 623 42 6.74 0 0 -- Culpeper County 8,131 495 6.09 11 0 < Cumberland County 1,399 103 7.36 < 0 -- Danville City 6,249 1,218 19.49 < 0 -- Dickenson County 2,320 104 4.48 < 0 -- Dinwiddie County 4,418 364 8.24 < < 15 Essex County 1,495 157 10.50 0 < -- Fairfax County 185,831 2,680 1.44 123 0 239 Falls Church City 2,518 11 0.44 0 0 -- Fauquier County 11,155 295 2.64 32 < < Floyd County 2,076 40 1.93 < 0 -- Fluvanna County 3,557 122 3.43 < 0 -- Franklin City 1,132 206 18.20 0 0 -- Franklin County 7,353 336 4.57 < < < Frederick County 13,203 414 3.14 12 0 21 Fredericksburg City 3,532 354 10.02 0 0 <

13
Division Total
Student Population
# of Students Short-Term
Suspended at Least Once
% of Students
Short-Term Suspended at Least Once1
# of Students Long-Term
Suspended at Least Once2
# of Students
Expelled at Least Once3
# of Students
with Modified
Expulsion Galax City 1,390 58 4.17 0 0 -- Giles County 2,408 118 4.90 < < < Gloucester County 5,557 358 6.44 31 < < Goochland County 2,567 69 2.69 < 0 -- Grayson County 1,684 97 5.76 0 0 -- Greene County 3,192 175 5.48 < 0 -- Greensville County 2,573 304 11.82 < 0 < Halifax County 5,364 440 8.20 12 0 -- Hampton City 20,618 2,924 14.18 172 < 58 Hanover County 18,061 384 2.13 15 0 < Harrisonburg City 5,923 328 5.54 < 0 < Henrico County 51,534 3,201 6.21 57 35 -- Henry County 7,415 637 8.59 < < < Highland County 207 < n/a < 0 -- Hopewell City 4,376 514 11.75 < < -- Isle of Wight County 5,483 324 5.91 0 0 -- King and Queen Co. 878 74 8.43 < < -- King George County 4,385 168 3.83 13 < -- King William County 2,246 111 4.94 0 < < Lancaster County 1,243 207 16.65 < 0 -- Lee County 3,297 108 3.28 < 0 < Lexington City 492 0 0.00 0 0 -- Loudoun County 76,228 699 0.92 < 0 14 Louisa County 4,876 411 8.43 13 < -- Lunenburg County 1,585 233 14.70 0 0 < Lynchburg City 8,587 941 10.96 < 0 -- Madison County 1,829 117 6.40 0 0 -- Manassas City 7,605 352 4.63 < < -- Manassas Park City 3,443 47 1.37 0 0 -- Martinsville City 2,186 211 9.65 < 0 < Mathews County 1,106 66 5.97 0 0 -- Mecklenburg Co. 4,529 687 15.17 0 0 -- Middlesex County 1,232 129 10.47 11 < -- Montgomery Co. 9,775 384 3.93 < < < Nelson County 1,960 190 9.69 < 0 < New Kent County 3,042 157 5.16 11 0 -- Newport News City 29,197 3,577 12.25 212 0 55 Norfolk City 32,149 4,574 14.23 243 < < Northampton Co. 1,700 221 13.00 < 0 -- Northumberland Co. 1,377 139 10.09 < 0 < Norton City 835 52 6.23 0 0 -- Nottoway County 2,254 183 8.12 11 < -- Orange County 5,137 287 5.59 < 0 -- Page County 3,459 93 2.69 0 0 -- Patrick County 2,932 104 3.55 0 0 < Petersburg City 4,282 781 18.24 0 < -- Pittsylvania County 9,239 906 9.81 < 31 < Poquoson City 2,103 46 2.19 < 0 -- Portsmouth City 14,927 2,437 16.33 < < -- Powhatan County 4,270 116 2.72 < 0 -- Prince Edward Co. 2,104 188 8.94 < < -- Prince George Co. 6,455 481 7.45 < 0 -- Prince William Co. 87,793 2,504 2.85 90 < < Pulaski County 4,346 384 8.84 0 0 <

14
Division Total
Student Population
# of Students Short-Term
Suspended at Least Once
% of Students
Short-Term Suspended at Least Once1
# of Students Long-Term
Suspended at Least Once2
# of Students
Expelled at Least Once3
# of Students
with Modified
Expulsion Radford City 1,661 74 4.46 < 0 < Rappahannock Co. 894 13 1.45 0 0 -- Richmond City 23,987 4,228 17.63 452 23 66 Richmond County 1,282 110 8.58 0 0 < Roanoke City 13,676 1,468 10.73 0 0 42 Roanoke County 14,385 392 2.73 < < -- Rockbridge County 2,817 90 3.19 0 0 -- Rockingham Co. 11,876 553 4.66 20 < 15 Russell County 4,062 91 2.24 0 0 -- Salem City 3,808 120 3.15 < 0 < Scott County 3,817 112 2.93 11 0 < Shenandoah County 6,075 231 3.80 < 23 < Smyth County 4,594 298 6.49 0 0 < Southampton Co. 2,793 328 11.74 0 0 -- Spotsylvania County 23,731 902 3.80 102 < -- Stafford County 27,841 1,726 6.20 85 < 31 Staunton City 2,660 110 4.14 < 0 < Suffolk City 14,383 1,479 10.28 < 0 -- Surry County 837 105 12.54 < 0 -- Sussex County 1,066 151 14.17 0 0 -- Tazewell County 6,111 373 6.10 < < < Virginia Beach City 69,777 2,847 4.08 557 0 125 Warren County 5,433 285 5.25 0 0 < Washington County 7,346 262 3.57 0 0 -- Waynesboro City 3,238 265 8.18 < 0 -- West Point 764 57 7.46 < 0 -- Westmoreland Co. 1,666 173 10.38 0 0 < Williamsburg-James CC 11,597 433 3.73 49 < 13 Winchester City 4,414 205 4.64 < 0 < Wise County 6,024 208 3.45 0 0 < Wythe County 4,237 266 6.28 0 0 -- York County 12,699 478 3.76 31 < --

15
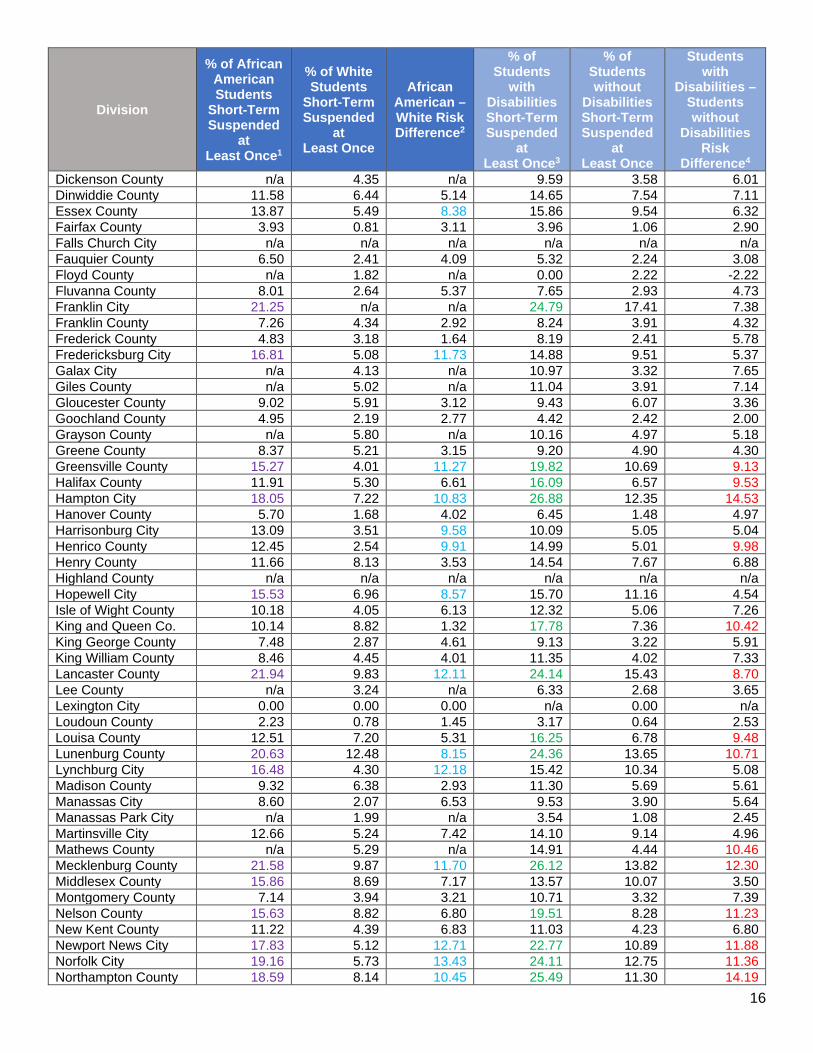
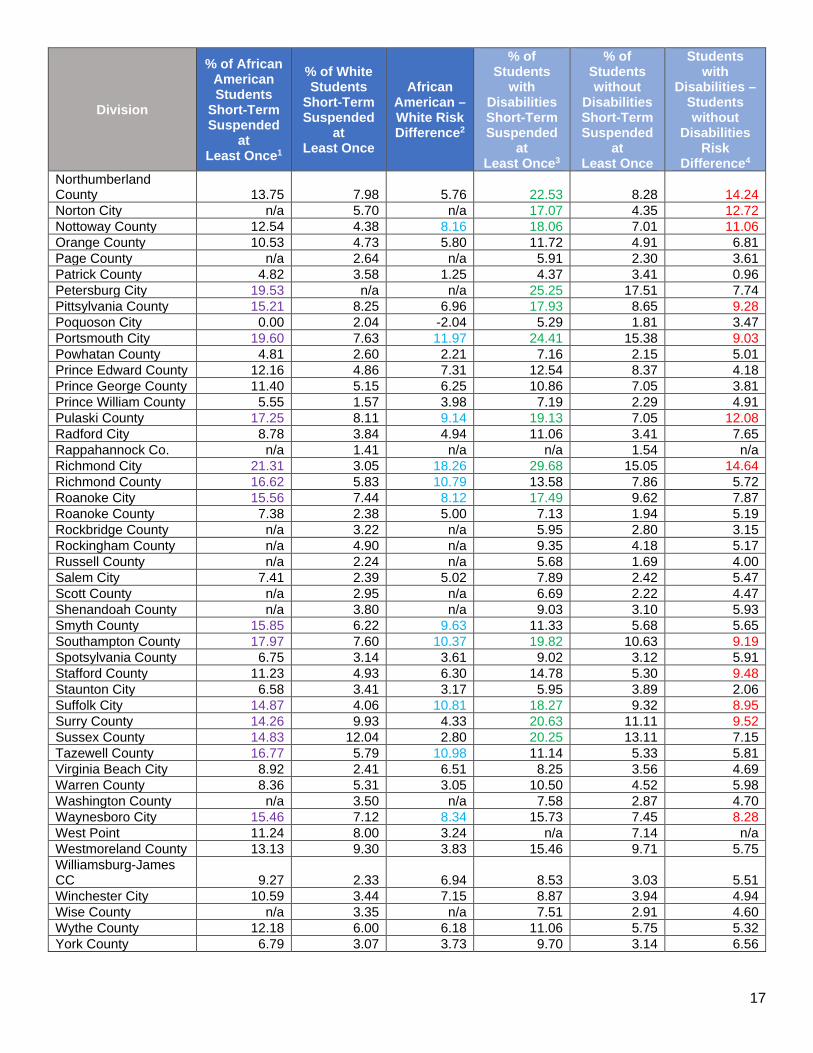
Race and Disabilities Disparities in Short-Term Suspension by Division
• 1 Divisions that had at least 10 African-American students short-term suspended and that were in thetop quartile of divisions with the highest percentages of African-American students suspended arenoted in purple.
• 2 Risk difference is the percent of one subgroup affected subtracted from the percent of anothersubgroup affected. Divisions that had at least 10 African-American students and 10 white studentsshort-term suspended, and that were in the top quartile of divisions with the highest African-American towhite student risk differences, are noted in blue.
• 3 Divisions that had at least 10 students with disabilities short-term suspended and that were in the topquartile of divisions with the highest percentages of students with disabilities suspended are noted ingreen.
• 4 Divisions that had at least 10 students with disabilities and 10 students without disabilities short-termsuspended, and that were in the top quartile of divisions with the highest students with disabilities tostudents without disabilities risk differences, are noted in red.
Division
% of African American Students
Short-Term Suspended
at Least Once1
% of White Students
Short-Term Suspended
at Least Once
African American – White Risk Difference2
% of Students
with Disabilities Short-Term Suspended
at Least Once3
% of Students without
Disabilities Short-Term Suspended
at Least Once
Students with
Disabilities – Students without
Disabilities Risk
Difference4 Accomack County 16.30 7.63 8.68 15.93 9.20 6.73 Albemarle County 8.14 2.43 5.71 10.16 2.53 7.64 Alexandria City 8.24 2.03 6.21 9.71 3.86 5.85 Alleghany County 7.64 5.81 1.82 11.48 4.83 6.65 Amelia County 9.79 8.42 1.36 17.28 7.58 9.70 Amherst County 9.54 6.99 2.56 10.67 7.10 3.57 Appomattox County 13.95 5.02 8.93 11.95 7.06 4.89 Arlington County 2.80 0.59 2.21 2.92 0.72 2.19 Augusta County 8.55 4.48 4.07 7.87 4.37 3.50 Bath County 0.00 4.94 -4.94 n/a 4.04 n/a Bedford County 10.16 4.42 5.74 11.62 4.03 7.59 Bland County n/a 6.92 n/a 9.68 6.41 3.26 Botetourt County n/a 2.92 n/a 9.16 1.94 7.22 Bristol City 14.04 7.43 6.61 16.87 6.67 10.20 Brunswick County 19.16 9.60 9.55 18.99 15.97 3.02 Buchanan County n/a 5.03 n/a 8.20 4.41 3.79 Buckingham County 6.75 4.74 2.01 10.47 4.64 5.83 Buena Vista City n/a 5.37 n/a 8.50 4.89 3.61 Campbell County 11.45 5.87 5.58 8.68 6.66 2.02 Caroline County 8.20 4.09 4.12 9.18 4.72 4.46 Carroll County n/a 6.89 n/a 11.25 6.09 5.16 Charles City County 13.98 15.35 -1.37 20.22 13.17 7.05 Charlotte County 8.13 4.01 4.11 8.88 5.05 3.83 Charlottesville City 9.01 1.55 7.45 12.22 3.84 8.38 Chesapeake City 15.01 4.40 10.61 15.34 6.75 8.58 Chesterfield County 10.11 2.58 7.53 11.37 4.02 7.35 Clarke County 0.00 n/a n/a n/a n/a n/a Colonial Beach 24.00 9.68 14.32 33.33 9.21 24.12 Colonial Heights City 9.94 5.06 4.88 11.09 5.12 5.96 Covington City n/a 2.74 n/a n/a 2.73 n/a Craig County n/a 6.89 n/a 10.16 5.86 4.30 Culpeper County 10.98 4.97 6.00 13.97 5.26 8.71 Cumberland County 9.50 5.95 3.55 16.53 6.49 10.03 Danville City 24.51 8.09 16.42 24.84 18.57 6.26
16
Division
% of African American Students
Short-Term Suspended
at Least Once1
% of White Students
Short-Term Suspended
at Least Once
African American – White Risk Difference2
% of Students
with Disabilities Short-Term Suspended
at Least Once3
% of Students without
Disabilities Short-Term Suspended
at Least Once
Students with
Disabilities – Students without
Disabilities Risk
Difference4 Dickenson County n/a 4.35 n/a 9.59 3.58 6.01 Dinwiddie County 11.58 6.44 5.14 14.65 7.54 7.11 Essex County 13.87 5.49 8.38 15.86 9.54 6.32 Fairfax County 3.93 0.81 3.11 3.96 1.06 2.90 Falls Church City n/a n/a n/a n/a n/a n/a Fauquier County 6.50 2.41 4.09 5.32 2.24 3.08 Floyd County n/a 1.82 n/a 0.00 2.22 -2.22Fluvanna County 8.01 2.64 5.37 7.65 2.93 4.73 Franklin City 21.25 n/a n/a 24.79 17.41 7.38 Franklin County 7.26 4.34 2.92 8.24 3.91 4.32 Frederick County 4.83 3.18 1.64 8.19 2.41 5.78 Fredericksburg City 16.81 5.08 11.73 14.88 9.51 5.37 Galax City n/a 4.13 n/a 10.97 3.32 7.65 Giles County n/a 5.02 n/a 11.04 3.91 7.14 Gloucester County 9.02 5.91 3.12 9.43 6.07 3.36 Goochland County 4.95 2.19 2.77 4.42 2.42 2.00 Grayson County n/a 5.80 n/a 10.16 4.97 5.18 Greene County 8.37 5.21 3.15 9.20 4.90 4.30 Greensville County 15.27 4.01 11.27 19.82 10.69 9.13 Halifax County 11.91 5.30 6.61 16.09 6.57 9.53 Hampton City 18.05 7.22 10.83 26.88 12.35 14.53 Hanover County 5.70 1.68 4.02 6.45 1.48 4.97 Harrisonburg City 13.09 3.51 9.58 10.09 5.05 5.04 Henrico County 12.45 2.54 9.91 14.99 5.01 9.98 Henry County 11.66 8.13 3.53 14.54 7.67 6.88 Highland County n/a n/a n/a n/a n/a n/a Hopewell City 15.53 6.96 8.57 15.70 11.16 4.54 Isle of Wight County 10.18 4.05 6.13 12.32 5.06 7.26 King and Queen Co. 10.14 8.82 1.32 17.78 7.36 10.42 King George County 7.48 2.87 4.61 9.13 3.22 5.91 King William County 8.46 4.45 4.01 11.35 4.02 7.33 Lancaster County 21.94 9.83 12.11 24.14 15.43 8.70 Lee County n/a 3.24 n/a 6.33 2.68 3.65 Lexington City 0.00 0.00 0.00 n/a 0.00 n/a Loudoun County 2.23 0.78 1.45 3.17 0.64 2.53 Louisa County 12.51 7.20 5.31 16.25 6.78 9.48 Lunenburg County 20.63 12.48 8.15 24.36 13.65 10.71 Lynchburg City 16.48 4.30 12.18 15.42 10.34 5.08 Madison County 9.32 6.38 2.93 11.30 5.69 5.61 Manassas City 8.60 2.07 6.53 9.53 3.90 5.64 Manassas Park City n/a 1.99 n/a 3.54 1.08 2.45 Martinsville City 12.66 5.24 7.42 14.10 9.14 4.96 Mathews County n/a 5.29 n/a 14.91 4.44 10.46 Mecklenburg County 21.58 9.87 11.70 26.12 13.82 12.30 Middlesex County 15.86 8.69 7.17 13.57 10.07 3.50 Montgomery County 7.14 3.94 3.21 10.71 3.32 7.39 Nelson County 15.63 8.82 6.80 19.51 8.28 11.23 New Kent County 11.22 4.39 6.83 11.03 4.23 6.80 Newport News City 17.83 5.12 12.71 22.77 10.89 11.88 Norfolk City 19.16 5.73 13.43 24.11 12.75 11.36 Northampton County 18.59 8.14 10.45 25.49 11.30 14.19
17
Division
% of African American Students
Short-Term Suspended
at Least Once1
% of White Students
Short-Term Suspended
at Least Once
African American – White Risk Difference2
% of Students
with Disabilities Short-Term Suspended
at Least Once3
% of Students without
Disabilities Short-Term Suspended
at Least Once
Students with
Disabilities – Students without
Disabilities Risk
Difference4 Northumberland County 13.75 7.98 5.76 22.53 8.28 14.24 Norton City n/a 5.70 n/a 17.07 4.35 12.72 Nottoway County 12.54 4.38 8.16 18.06 7.01 11.06 Orange County 10.53 4.73 5.80 11.72 4.91 6.81 Page County n/a 2.64 n/a 5.91 2.30 3.61 Patrick County 4.82 3.58 1.25 4.37 3.41 0.96 Petersburg City 19.53 n/a n/a 25.25 17.51 7.74 Pittsylvania County 15.21 8.25 6.96 17.93 8.65 9.28 Poquoson City 0.00 2.04 -2.04 5.29 1.81 3.47 Portsmouth City 19.60 7.63 11.97 24.41 15.38 9.03 Powhatan County 4.81 2.60 2.21 7.16 2.15 5.01 Prince Edward County 12.16 4.86 7.31 12.54 8.37 4.18 Prince George County 11.40 5.15 6.25 10.86 7.05 3.81 Prince William County 5.55 1.57 3.98 7.19 2.29 4.91 Pulaski County 17.25 8.11 9.14 19.13 7.05 12.08 Radford City 8.78 3.84 4.94 11.06 3.41 7.65 Rappahannock Co. n/a 1.41 n/a n/a 1.54 n/a Richmond City 21.31 3.05 18.26 29.68 15.05 14.64 Richmond County 16.62 5.83 10.79 13.58 7.86 5.72 Roanoke City 15.56 7.44 8.12 17.49 9.62 7.87 Roanoke County 7.38 2.38 5.00 7.13 1.94 5.19 Rockbridge County n/a 3.22 n/a 5.95 2.80 3.15 Rockingham County n/a 4.90 n/a 9.35 4.18 5.17 Russell County n/a 2.24 n/a 5.68 1.69 4.00 Salem City 7.41 2.39 5.02 7.89 2.42 5.47 Scott County n/a 2.95 n/a 6.69 2.22 4.47 Shenandoah County n/a 3.80 n/a 9.03 3.10 5.93 Smyth County 15.85 6.22 9.63 11.33 5.68 5.65 Southampton County 17.97 7.60 10.37 19.82 10.63 9.19 Spotsylvania County 6.75 3.14 3.61 9.02 3.12 5.91 Stafford County 11.23 4.93 6.30 14.78 5.30 9.48 Staunton City 6.58 3.41 3.17 5.95 3.89 2.06 Suffolk City 14.87 4.06 10.81 18.27 9.32 8.95 Surry County 14.26 9.93 4.33 20.63 11.11 9.52 Sussex County 14.83 12.04 2.80 20.25 13.11 7.15 Tazewell County 16.77 5.79 10.98 11.14 5.33 5.81 Virginia Beach City 8.92 2.41 6.51 8.25 3.56 4.69 Warren County 8.36 5.31 3.05 10.50 4.52 5.98 Washington County n/a 3.50 n/a 7.58 2.87 4.70 Waynesboro City 15.46 7.12 8.34 15.73 7.45 8.28 West Point 11.24 8.00 3.24 n/a 7.14 n/a Westmoreland County 13.13 9.30 3.83 15.46 9.71 5.75 Williamsburg-James CC 9.27 2.33 6.94 8.53 3.03 5.51 Winchester City 10.59 3.44 7.15 8.87 3.94 4.94 Wise County n/a 3.35 n/a 7.51 2.91 4.60 Wythe County 12.18 6.00 6.18 11.06 5.75 5.32 York County 6.79 3.07 3.73 9.70 3.14 6.56

18