october 2015 issn 2347 - 4912 shelter · vol 16 no.2 october 2015 issn 2347 - 4912 shelter is an...
TRANSCRIPT

ISSN 2347 - 4912
Publication
October 2015 Volume 16 No. 2
Theme Paper Policy Review Case Studies
SHELTER
THEME: PUBLIC SPACES FOR ALLTHEME: PUBLIC SPACES FOR ALL


Theme
Public Spaces for All
Public spaces are places in any settlement, which are accessible to people for social interaction, everyday experiences, community activities, cultural events or leisure. Access to public spaces is generally unrestricted; however, some public spaces may have restricted, limited or regulated access which is controlled by permission, passes, or tickets, such as museums, cinema, public libraries.Public spaces are mostly created by the government, but private sector efforts, including the building of shopping malls, clubs and art galleries, also lead to the creation of vibrant public spaces.
These spaces play a very important role in the social, cultural and economic, development of the people who use it, and give an identity to the settlement. Public spaces sometimes become so important that they get recognized even beyond the geographic boundaries of the settlement in which it is located. The Taj Mahal, the Central Park of New York, and the Eiffel Tower of Paris are some examples of public spaces that are cherished not only by those who reside in the area, but also by people the world over, who identify these cities with these spaces.
With urbanization on the rise, it is important to ensure that we plan for meaningful public spaces which are accessible to all, foster a sense of safety and community, and act as a shared resource in which experiences and value are created for those all who use it.
Policy Review
Case Study
HUDCO awarded Best Practices
Theme Papers
01
67
70
72
08
18
27
34
43
IN THE BOX
Rental Housing –Lessons for India from International Experiences.
• Conservation and Revitalization 0f Hazratganj Precinct, Lucknow
• Chennai Street Design Project
• Urban Design and Inner City renewal/ revitalisation in Gangtok
Approaches to Affordable Housing in India.
Efforts of Affordable Housing Sup-ply Models-Futile or Worthwhile?
Safety and Security Based Evalua-tion of Pedestrian Facilities around Public Spaces.
Developing Community Spaces & Bringing Community Together.
Designing Urban Public Spaces for Pedestrian Mobility of Elderly Citizens A Case of Bengaluru City.
Dr. Akshaya Kumar Sen
Jit Kumar Gupta
Gowthami Sai DubaguntaSejal Patel
Dr. Purnima ParidaDr. Mukti AdvaniDr. M Parida
Aga Khan Trust for Culture
Dakshayini R. PatilDr. Mamatha P. Raj
56 Housing for the Urban Poor in Chandigarh: Including the Excluded.Manoj Kumar Teotia
My Opinion
52 Public Spaces in Cities: Hidden Gems for All Citizens.
Alain Grimard
Reclaiming India’s Streets with Raahgiri Day
General Guidelines for Submission of Articles
HUDCO’s Assistance under CSR & SD Policy
HUDCO Awards for Best Practice to Improve the Living Environment
7
26
64
66
The views expressed in this publication are the personal views of authors and do not necessarily reflect the official views and policies of HUDCO/HSMI. Articles or any other material in the publication may be reproduced so long as credit is given and tear sheets are provided to the editor. All photo credits are by the authors unless otherwise specified.
I N S I D E

World Habitat Day is celebrated on the first Monday of October every year. This year, the world Habitat Day will be celebrated on 5th October 2015 and the theme is “Public Spaces for All”. Each year the theme is selected to bring attention to UN-Habitat’s mandate to promote adequate shelter for all. The World Habitat Day is also an occasion to remind the stakeholders of their responsibility to make cities and towns better places to live and work.
Public spaces play an important role not only for the image of the city but also for the social and economic wellbeing of a community. The Executive Director of UN-HABITAT, Dr. Joan Clos reiterates the importance of public space in his words- “What defines a character of a city is its public space, not its private space. What defines the value of the private assets of the space are not the assets by themselves but the common assets. The value of the public good affects the value of the private good. We need to show every day that public spaces are an asset to a city.”
Public spaces act as important places to enhance community cohesion through activities that ensure participation of all sections of the society. It is therefore important that policies on urban planning should adhere to norms which set aside adequate open spaces in a layout, so that social interactions become a practice not only during festivities but in everyday life. Public spaces help to build a sense of community, civic identity and culture. However, most often open spaces are used as synonyms for public spaces. In some countries where land is scarce, use of space changes with time. For example, office complex during the day get used as a centre for exhibitions and cultural activities, commercial streets in Bangkok gets converted to open markets at night etc.
Public spaces can be categorized into two groups – open spaces with access to all or, places with restricted entry either through tickets, or with the permission of the community which is regulating and maintaining it. India has a tradition of creating well defined open spaces at community level and city level. At a community level Mohallas and Vadas, Katras have been planned around central open spaces which were preserved and guarded by the community. The community acts as a watchdog to ensure that these spaces are not exploited, encroached and at the same time remain available for the wellbeing of the community living around. However, over the years, the planned neighborhoods have also ensured open spaces at community level. But these spaces are being encroached and misused by the people due to lack of ownership by the community to which they belong. It is therefore important that public spaces are designed in a way that community is able to own it and maintain it.
This issue of SHELTER deals with two important themes -'Public Spaces for All' and 'Affordable Housing'. The article by Ms. Dakshayini R. Patil (et.al) has gone into the details of providing public spaces for safe movement of the elderly. On the other hand, the article by Dr. Purnima Parida (et.al) discusses the importace of walkability in urban areas and assimilates the concern of users for designing the footpaths/streets. The revitalization and restoration of public spaces in the Nizamuddin Basti has been documented by the Aga Khan Trust for Culture. Their work has transformed the Nizamuddin area and its heritage, which is worth emulating. The articles on housing discuss various approaches followed to provide housing to the low income groups. Rental housing is an important area that needs to be explored further for the Indian context. This has been aptly documented by Dr. Akshaya Kumar Sen. The articles by Mr. Jit Kumar Gupta and Ms. Gowthami Sai Dubagunta (et.al) bring important issues in the planning and implementation of housing for the urban poor. The case study of Chandigarh by Shri Manoj Kumar Teotia gives an overview of a city level effort in providing affordable housing. Some cities have used innovative planning tools to improve the image of their cities by restoring and renovating public spaces. These efforts have brought back life in many urban areas and three cities namely- Chennai, Gangtok and Lucknow have been presented in this volume of SHELTER as showcase projects.
I do hope that readers will like the compilation of this issue of SHELTER and enjoy reading it.
SHELTERVol 16 No.2 October 2015
www.hudco.org
ISSN 2347 - 4912
SHELTER is an official publication of HUDCO/HSMI, distributed free of charge. It deals with issues related to housing, urban development and other themes relevant to the habitat sector. Contributions, comments and correspondence are most welcome and should be forwarded to:
EDITORSHELTERHUDCO’S Human SettlementManagement InstituteHUDCO House, Lodhi RoadNew Delhi-110 003Tel: 011-24308600-638Fax: 011-24365292Email: [email protected]
BOARD OF DIRECTORSChairman & Managing DirectorDr. M. Ravi Kanth, IAS (r)DirectorsShri N. L. ManjokaDirector Finance, HUDCOShri Rajiv Ranjan Mishra, IASSmt. Jhanja TripathyProf. Sukhadeo Thorat
Company SecretaryShri Harish Kumar Sharma
EDITORIAL TEAMChief Editor: Rajiv SharmaCo-Editor: Dr. Akshaya SenDr. Ravi ShankarMs. Nila PandianCover Design: Arun SharmaCover Photo: Apni Basti Mela held annually since 2010 in the Hazrat Nizamuddin Basti.Photo Credit: Aga Khan Trust for Culture
Registered Office:HUDCO Bhawan, Core 7-A,India Habitat Centre,Lodhi RoadNew Delhi-110 003Tel (EPABX) 011-24649610-23,24627113-15, 24627091,92,95After Office Hours : 24648193-95Fax : 011-24625308CIN: U74899DL1970GOI005276E-Mail : [email protected]
FROM THE CHIEF EDITOR

October 2015 Volume 16 No. 2 - SHELTER | 1
POLICY REVIEW
Rental Housing Lessons for India from International Experiences
A large proportion of the weaker sections and lower income groups of the society can’t afford housing on ownership basis, even when such housing is subsidized. Citing international experiences, this paper argues that rental housing can be an effective tool for addressing the shelter needs of all categories of people in India, provided some of the key issues like financial viability of rental housing and legal framework are addressed effectively. Since housing has been given a special priority status by the Government of India through initiatives such as JNNURM and PMAY, this paper calls for a significant push for improving the housing conditions of the poor through promotion of rental housing.
THE CONTEXTA large proportion of the weaker sections and lower income groups of the society can’t afford housing on ownership basis, even when such housing is subsidized. Since the social housing scheme is to be targeted towards poorer sections of population, it is emerging that rental housing would be a viable option for these groups. Apart from affordability, rental housing would also improve labour mobility. Rental housing schemes have been an important instrument for provision of housing services at affordable prices to general public in many countries of the world. Newly arrived migrants, students, people who have recently changed their jobs or got divorced or separated may rely, at least temporarily, on rental housing. For others, renting
is a semi-permanent state because home ownership, whether in the formal or informal, is unaffordable.
RENTAL TENURE - GLOBAL SCENARIOStatistics shows that a significant proportion of residents in cities and towns of developed as well as developing countries are tenants. Housing tenure in Germany, for example, is 60 per cent rental and 40 per cent owner-occupied, whereas the largest city of Germany, Berlin, has 89 per cent of houses occupied on rental basis. The housing tenure in different countries and major cities of the world is shown in Table-1.
In the Netherlands, 47 per cent of housing tenure is rental where as the largest city of the Netherlands, Rotterdam, has 49 per cent of houses occupied on rental basis. In India, the distribution of households by ownership status, as per 2011 Census data, indicates that 87 per cent (urban & rural combined) are owned, whereas only 11 per cent are rented. In the capital city of India, Delhi, 28 per cent of houses are occupied on rental basis. In urban India as a whole, 67 per cent houses are owner-occupied and 28 per cent houses are rented.
EMERGING RENTAL HOUSING POLICY TRENDSRental housing is receiving
KEYWORDS
Rental housing, affordable housing tenure, rental vouchers
Dr. Akshaya Kumar Sen ([email protected]) is working as Fellow at the Centre for Affordable Housing, HUDCO’s Human Settlement Management Institute, New Delhi
Renting offers many benefits. First, moving to and from rental housing involves much lower transaction costs than home ownership both for tenants as well as landlords. Second, renting transfers primary responsibility for upkeep and maintenance of the house to the landlord. Third, renting does not tie up funds in the form of a down payment. Fourth, allows labour force mobility and geographic shifts for jobs. Fifth, provides a staging post to the tenant and enables a steady source of income to the owner.
DR. AKSHAYA KUMAR SEN

2 | HUDCO - HSMI Publication
POLICY REVIEW
Table-1: Housing tenure in selected countries and in their largest city.
Country Owned (%) Rented (%) City Owned (%) Rented (%)
Germany 40 60 Berlin 11 89
The Netherlands 53 47 Rotterdam 26 49
USA 66 34 New York 45 55
UK 69 31 London 58 41
Colombia 54 31 Bogota 46 43
Brazil 74 25 Sao Paulo 70 20
South Africa 77 22 Johannesburg 55 42
Chile 73 20 Santiago 73 21
Bolivia 60 18 LaPaz/El Alto 55 23
Thailand 87 13 Bangkok 54 41
Mexico 81 11 Mexico City 76 16
India 87 11 Delhi 68 28
Note: Wherever percentages do not add to 100%, it is because the authorities have calculated other kinds of non-ownership separately.Source: UN-HABITAT (2003: 9-11) and recent census figures of India, Colombia and Mexico.
increasing policy attention around the globe to accommodate the increasing demand. In both the developing and developed world, rental housing is being included in housing policy frameworks that previously focused exclusively on ownership. While the reasons for this are many and varied, often depending on particular contexts, they can be together summarised in a global phenomenon in which ownership is becoming increasingly unaffordable or unattainable.
The sub-prime crisis of 2008 in the United States of America that gripped the owner-occupied housing market, serves as a stark reminder of the advantages and importance of rental housing. The plunge in home prices across the country, coupled with steep job losses, put the financial risks of home-ownership into sharp relief as millions of Americans lost their homes. The economic distress
caused by the recession—including the swelling ranks of low-income households—has also underscored the critical importance of an adequate supply of affordable rental housing (Harvard University, 2011).
Renting offers many benefits. First, moving to and from rental housing involves much lower transaction costs than homeownership both for tenants as well as landlords. Second, renting transfers primary responsibility for upkeep and maintenance of the house to the landlord. Third, renting does not tie up funds in the form of a down payment, nor does it expose households to the risk of loss of that investment. Fourth, the rental market allows labour force mobility and geographic shifts for jobs. Fifth, in a position of acute shortage, rental housing provides a staging post to the tenant and enables a steady source of income, which converts
urban land into an investment, to the owner (MoHUPA, 2009).
A PUBLIC POLICY SHIFT IN THE 1980s AND 1990sDuring 1950s-60s, public rental housing was more common in most countries. Government constructed and maintained the public rental housing stocks. A common feature of all social rental housing programmes has been their heavy dependence on government promotion, finance and subsidization. A policy shift occurred during 1980s-90s after the government decision to withdraw from this sector. Most countries (e.g. transition economies of central and eastern europe) have resorted to sale of existing (dilapidated) rental housing stock to the occupants. As a result, the emphasis in most of these countries have shifted from rental houses to owner occupied houses for all income groups.

October 2015 Volume 16 No. 2 - SHELTER | 3
POLICY REVIEW
In developed countries like the United States, and the UK, housing policies have encouraged homeownership. This is reflected in the favorable tax treatment for homeowners, in the form of capital gains tax, non-taxation of imputed rent, and in some countries, tax deductibility of mortgage interest. As a result, levels of new rental construction have suffered as demand is diverted into the ownership sector as well as declining rental yields. Countries, such as Austria, Germany, and Sweden, have sought to maintain a more tenure neutral framework (including regulation, subsidy, and taxation) to achieve and sustain more balanced housing systems with a wider choice across social renting, private renting, and homeownership.
New public rental housing has been constructed in very few countries over the last decade. The most notable exceptions are China and the Republic of Korea. In China, the housing is targeted at the poorest but is intended for eventual sale. In Korea, one million rental housing units were planned over the 2003-2012 period.
Globally, a shift occurred from bricks and mortar (new housing construction, supply side) to consumer-oriented subsidies (focused on demand side). The rental market for low-income households was viewed as an income problem and the response was thus to devise rent assistance programs (as opposed to rental supply programs). In this case, governments strived to complement private sector initiatives (as opposed to competing). However, research and analyses showed that
rent assistance programs were not sufficient to induce an adequate supply of low-income rental housing (Pomeroy & Godbout, 2011; Fraser Institute, 1975; Kemp, 1990; Husle, 2001).
Problems of this shift in policy from rental housing to ownership-based housing, especially for the lower income groups, have come to the fore. The inability of low income groups to access housing finance and if able to access, meet the mortgage payments and subsequent default is one. A more serious problem relates to that of disrepair of the housing stock because of very low quality. The low income occupants would have no funds to spend on repairs leading to fast deterioration of the housing stock. The increasing cost of housing and problems associated with rental housing have led most of these countries to search for alternative tenures as via media between owner-occupied and rented sectors. The emphasis is on evolving plurality of tenures to cater to the varying requirements and capacities of general public and special groups.
The question of what constitutes the optimal balance between income-related assistance and other forms of subsidies is still a major component of housing policy debates in many countries. International experiences suggest that the most extensive approach involves facilitative measures with a strong emphasis on deregulation of rent controls and implementation of reformed regulatory systems that seek a balance between tenant protection (security of occupancy) and a fair return to investors. The need to minimize uncertainty is highlighted
as a critical precondition to private investment.
TAX INCENTIVES FOR RENTAL HOUSING – GLOBAL CONTEXTA number of countries have employed tax provisions to enhance after tax yields as a way to encourage private investment in rental housing. Direct subsidy expenditures are also used in some countries, e.g. the Netherlands employs small capital grants while Japan and Sweden sustain pre-existing interest rate subsidies (a mechanism used in the 1960s and 1970s in both Canada and the United States).
Australia and New Zealand have implemented and maintained healthy investment environments without direct subsidy. Notably, neither country has onerous rent controls, both permit depreciation and deductibility of rental losses against other income (an incentive to small, non-corporate investors), and both involve a common structure, mainly for detached dwellings which fluctuate between ownership and the rented sector.
INNOVATIVE RENTAL HOUSING SCHEMES IN DIFFERENT COUNTRIESThe US government tried to empower tenants with rent vouchers allowing them to seek their own housing from private landlords. Housing choice vouchers or rent vouchers are administered locally by Public Housing Agencies (PHAs) who receive federal funds from the U.S. Department of Housing and Urban Development (HUD) to administer the voucher program.
4 | HUDCO - HSMI Publication
POLICY REVIEW
Under the programme, a housing subsidy is paid to the landlord directly by the PHA on behalf of the participating family. The family then pays the difference between the actual rent charged by the landlord and the amount subsidized by the program. In addition, the Low-Income Housing Tax Credit (LIHTC) of US is the nation’s largest and most successful affordable rental housing production programme. LIHTC Program is an indirect federal subsidy used to finance the development of affordable rental housing for low-income households.
In United Kingdom, Housing Associations, have promoted ‘rent to buy’ schemes, in which aspiring buyers can let/rent affordable newly-built homes for up to five years, while they amass a deposit to secure a loan to buy the same. These government-backed schemes offer a discounted rent of no more than 80 per cent of what tenants would pay in the open market, and some tenants even return some of the rent for use as part of the deposit when they graduate to ownership.
In Australia, the government has launched the National Rental Affordability Scheme (NRAS) to help increase the supply of affordable rental dwellings. Rent for these properties is charged at 20 per cent below the market rate for eligible tenants. Under this scheme, the Australian government would provide funding to increase the supply of affordable rental dwellings; reduce rental costs for low to moderate income households; and encourage large scale investment and innovative delivery of affordable housing.
Canada has pursued systematic long term devolution of social housing and rental allowances to the provinces and some local governments, accompanied by fiscal transfers.
Ireland has introduced a ‘shared ownership’ scheme which enables the purchase of a new or a second-hand home from the open market with the local authority or the not-for-profit housing agency initially taking at least 40 per cent stake, which they rent to the beneficiaries. The individuals fund their equity stake through a local authority loan and committed to take out all the equity in the property over 25 years. They make payments on a mortgage for the part they own and pay rent to the local authority for the other part. Social security recipients may be entitled to receive a supplementary welfare allowance, a ‘rent supplement’ to cover the substantial part of the average market rent in their area. Another scheme called ‘Rental Accommodation Scheme’ was introduced in 2004 under which the local authority would progressively take over responsibility for procuring new rental accommodation on a long term basis. A key procurement mechanism for securing additional accommodation would be through long term partnerships with the private sector to acquire, own and operate dwellings for these recipients using funds transferred from the rent supplement programme.
In France, investors in private rental housing may have access to subsidized loans. They can claim capital depreciation and may obtain a tax credit equivalent to a maximum of 10 per cent of the interest paid on mortgage for two years.
In the Netherlands, the rent for the cheaper rental homes is kept low through governmental oversight and regulation. In practice this is accomplished by non-profit private housing foundations or associations.
In China, the government provides old flats which are rented at a very low price and called 'Lian Zu Fang' (literally 'low-rent house' or 'low-rent housing’). China has another popular scheme called the “Public Rental Housing” (PRH) scheme which is the first attempt to use non-ownership housing to solve the housing problem of people, mainly focusing on relieving the accommodation stress of local young staff and migrant workers who have relatively low incomes. China has introduced a series of tax exemptions for companies responsible for building and managing public rental-housing projects, in an attempt to increase reliance on state-subsidized housing to cool its overheated property market (Shen Hong, 2010).
In India, 30 per cent of gross rental income is exempted from income tax. In addition, the amount of municipal/house tax paid for the rental property can be off set against rental income. The National Urban Housing and Habitat Policy (NUHHP) 2007 also aims at promoting rental housing in India. It advocates that a model Rent Control Act be prepared by the Government of India to promote rental housing, on the principle that the rent of a house should be fixed by mutual agreement between the landlord and the tenant, for a stipulated lease period, prior to which the tenant will not be allowed to be evicted and after

October 2015 Volume 16 No. 2 - SHELTER | 5
POLICY REVIEW
the expiry of the said lease period, the tenant will not be permitted to continue to stay in the said housing unit. This advocacy tool has been considered necessary because states have been slow or reluctant to act on various legislative changes along these lines. In line with NUHHP 2007, the Ministry of Housing & Urban Poverty Alleviation (MoHUPA), Government of India has already drafted a ‘Model Tenancy Act’ and as part of the mandatory reforms conditions under the recently launched ‘Pradhan Mantri Awas Yojana’ (PMAY), states/union territories are required to either legislate or amend existing rental laws in the line of this Model Tenancy Act of MoHUPA. Further, an innovative rental housing product ‘Rent-to-Own’ has been launched by the Housing & Urban Development Corporation Ltd (HUDCO) in 2013 as a rental-cum-ownership scheme for lower level employees of public agencies, who cannot afford to have a house of their own.
A ‘Task Force on Rental Housing’ was also set up by the MoHUPA, Government of India, to promote rental housing in India, the report of which has been received by the MoHUPA. Given the advantages of rental housing, the Task Force has advocated that focus on rental housing is a vital ingredient for a successful growth of India’s development story. The Task Force looked at several levers that can be used to grow the affordable rental housing market. The levers included incentive related levers such as taxation, deductions, incentives and subsidies; regulatory levers such as eviction policies and procedures, grievance redress; and market related levers such as rent pricing, creation
of enabling agencies like Rental Management Companies (RMC), innovative financing mechanisms such as creation of Real Estate Improvement Trusts, (REITs), Foreign Direct Investments (FDI) for rental housing, etc.
LESSONS FOR INDIA TO PROMOTE RENTAL HOUSINGInternational experiences show that rental housing can be an effective tool for addressing the shelter needs of all categories of people provided some of the key issues like financial viability of rental housing (due to low or frozen rents, increasing cost) and legal framework (like Rent Control laws) are addressed effectively. Internationally, for providing housing for all, government thrust has been on rental housing, by either providing direct subsidies or encouraging private rental sector. Building houses for ownership requires huge funding which is not feasible for the governments to provide. The rental housing could provide an immediate relief for which Indian states have to expedite amendment to the present Act, as has been done in many other countries of the world.
In line with UN-HABITAT policy guide for rental housing in developing countries (UN-HABITAT, 2004) the following suggestions may be examined to promote rental housing in India - especially for the poor.
a. Rental housing should be included in the urban housing agendaAt present rental housing is virtually
invisible in most state governments’ housing policies. Since healthy housing markets need to offer a range of tenure options, a change in policy is essential. In line with NUHHP 2007, a separate National Rental Housing Policy may be required to promote rental housing in India.
b. Promising universal homeownership should be stoppedToo many governments tend to think that they can provide homeownership to everyone. This is neither achievable nor desirable despite the rhetoric that normally accompanies policy statements. Therefore, rental housing and homeownership should not be competing tenure options. Governments should enable the housing market to provide people with an effective choice of tenure that is affordable and appropriate to their needs. This requires a housing policy that is ‘tenure neutral’. Tenure neutrality means: avoiding favourable tax breaks only for owners; providing subsidies to poor families irrespective of their tenure; creating prejudice against any tenure group; and restricting particular housing submarkets e.g. through rent control.
c. Rent control act may be abolished in all statesIn many countries, rent controls were introduced at the outbreak of war as a means of preventing inflation. They still continue even after peace had been restored and brought many distortions in the rental housing market. While the rent control act has been abolished in many parts of the world, Indian states have been slow to act on

6 | HUDCO - HSMI Publication
POLICY REVIEW
this reform. Rent control reform which was mandatory under JNNURM has been implemented in few states only. The central government needs to support and encourage affordable rented housing legislative reforms, including quicker abolition of the Rent Control Act, and also provide rental subsidies where required, to bring confidence to investors.
d. Subsidy for low income tenants could be providedIf keeping rents low does not work, perhaps increasing tenants’ incomes is a more effective approach to making shelter affordable to tenants. A commonly employed method in some developed countries, like USA and Canada, has been to introduce a rent supplement or a rental housing voucher (that recipients are free to use in any homes that meet minimum standards and accept voucher payments). Most developed countries have employed some variation on this approach at one time or another and, to a degree, it has worked. Its replicability in India may be examined and adapted with suitable modifications.
e. Subsidies and finance to private landlords engaged in providing low-income rental housing may be introducedIf subsidies aimed at tenants often find their way to landlords, why not offer subsidies directly to landlords? Such an approach can stimulate the production of rental housing for the poor. Subsidies can take several forms. Subsidies can be directed to small-scale landlords who wish to extend their property, to companies
intending to build housing for their workers and to social housing agencies and cooperatives. Subsidies can take the form of offering small areas of public land free or at a subsidised price to informal or small-scale landlords prepared to create affordable rental units on this land, therefore increasing the overall supply of low-income rental housing.
f. Security of tenure for tenants may be promoted without discouraging rental supplySecurity of tenure - in this case, a tenant’s level of confidence that they will not be removed from their rented property without adequate notice – is important for tenants’ wellbeing and feeling of security. However, security of tenure should be balanced with incentives to both landlords and tenants, so as to increase the supply of rental housing.
g. Innovative rental housing schemes may be devisedTo promote rental housing in the country, innovative rental housing schemes implemented internationally may be suitably adopted, such as: (i) ‘rent to buy’ scheme of U.K. in which aspiring buyers can let/rent an affordable new-built home for upto 5-years, while they amass a deposit to secure a loan to buy the same; (ii) ‘National Rental Affordability Scheme’ of Australia which provides new rental property at below market rates and a minimum discount of 20 per cent for a 10-year period; and (iii) ‘Shared ownership scheme’ of Ireland which enables the purchase of a new or a second-hand home from the open market with the local authority or the not-
for-profit housing agency initially taking at least 40 per cent stake, which they rent to the beneficiary.
h. Tax incentives may be provided to encourage private investment in rental housingIt is being recognized globally, that involvement of private sector in the provision of rental housing is a must in order to promote the sector. To make rental housing lucrative to the private sector, suitable incentives through fiscal concessions could be devised. The tax treatment of rental property may need to be considered in order to help encourage the sector. Taxes should be set at such a level that a reasonable level of return can be achieved on the investment in this sector. There is a need to foster an environment that would make rental housing for EWS/LIG categories a worthwhile activity to invest in.
i. Need for further housing sector reformsIn order to decide the contours of a policy for promoting social housing, issues related to the role of various levels of government and institutions for providing such housing have to be discussed and decided upon. A necessary element of such a policy will be housing sector reforms, especially the tenancy laws.
CONCLUSIONInternational experiences show that rental housing can be an effective tool for addressing the shelter needs of all categories of people, provided some of the key issues, like financial viability of rental housing and legal framework, are addressed effectively. While the rent control act, a major

October 2015 Volume 16 No. 2 - SHELTER | 7
POLICY REVIEW
Reclaiming India’s Streets with Raahgiri Day“Raahgiri Day” is a street event, which provides citizens with an opportunity to reclaim their streets, connect with the community, celebrate the city and rejuvenate their lives. Raahgiri translates into “Giving the Streets as Public Space back to the Community”. This is India’s first sustained car free citizen initiative that began in Gurgaon on November 17 2013 and was conceived with the Raahgiri Foundation, consisting of local inhabitants from five organizations – EMBARQ India, I Am Gurgaon, Pedalyatri, Heritage School Gurgaon and Duplays Gurgaon.
Inspired by Ciclovia; a weekly open street event in Bogota, Colombia, Raahgiri Day has provided momentum for streets
being used as public places. On Sunday, one whole street in the city (Connaught Place, Gurgaon, Dwarka or Rohini) is cordoned off for motor vehicles for 4-5 hours in the morning. Citizens come together in large numbers and use these streets for recreation that promotes health, well-being, fitness, togetherness and joy. People from all age groups are invited to bike,
skate, run, walk and enjoy community leisure activities such as street games, street dancing etc. The recurring event celebrates the fact that cities are meant for people and not for cars.
The vision of Raahgiri Day is to encourage people to develop living streets, encourage pedestrians, cyclists and other non-motorised modes of transport. The end goal is to help build safer, happier, healthier and sustainable cities. The focus for future efforts should not only be on carving out new public spaces, but also on rethinking and transforming existing underutilized public spaces.
Source: www.raahgiriday.com
Photo Credits: Nila Pandian
factor throttling the rental market, has been abolished since many years in many parts of the world, Indian states have been slow to act on this reform. Amendment of rent control laws was one of the mandatory reforms of JNNURM and continues to be the one in the recently launched ‘Pradhan Matri Awas Yojana’ (PMAY). States/UTs are expected to implement the reform in order to avail of central assistance under the PMAY programme and therefore bigger cities need to take up the agenda of rent reform and set example for others. Since housing has been given a special priority status by the government’s positive initiatives, it is imperative that a significant push is given for improving the housing conditions of the poor- including the existing and prospective slum dwellers through the promotion of rental housing. This is possible only if both the central and state governments, and all other stakeholders, follow a coordinated approach towards its amelioration.
REFERENCESCensus of India, 2011: Office of the
Registrar General, Govt. of India, 2011
Fraser Institute (1975) Rent Control A Popular Paradox. Fraser Institute, Vancouver
Hulse, Kath, June 2001, “Demand Subsidies for Private Renters: A Comparative Review”, Institute for Social Research, Swinburne University of Technology, Melbourne, Australia, p.12.
Harvard University (2011), America’s Rental Housing- Meeting Challenges, Building on Opportunities, Joint Centre for Housing Studies, Harvard University (available on www.jchs.harvard.edu/sites/jchs.harvard.edu/files/ahr2011-1-intro.pdf).
Kemp, Peter, 1990, “Income-related Assistance with Housing Costs: A cross-national Comparison”, Urban Studies, Vol. 27, No 6, p. 795-808.
MoHUPA (2015): Pradhan Mantri Awas Yojana (2015)- Housing for All (Urban)- Scheme Guidelines, Ministry of Housing and Urban Poverty Alleviation, Govt. of India.
MoHUPA (2009): Theme Paper for National Conference of the Ministers dealing with Housing, Urban Development and Municipal Administration, 20th
January, 2009, New Delhi.
Pomeroy, Steve & Godbout, Marc (2011), Development of the Rental Housing Market in Latin America and the Caribbean, Discussion Paper No. IDB-DP-173, Inter-American Development Bank, New York.
Shen Hong (2010): China Offers Tax Incentives For Public Rental Housing, The Wall Street Journal, September 18, 2010
UN-HABITAT (2003: 9-11): Rental Housing- An essential option for the urban poor in developing countries, United Nations Human Settlements Programme, Nairobi, 2003
UN-HABITAT (2004): A Policy Guide to Rental Housing in Developing Countries, Publishing Services Section, UN-HABITAT, Nairobi, ISO 14001:2004.
Wadhva, Kiran (2011): Rent Control Act and Affordable Rental Housing For Low Income Groups, Draft Paper.
www.wikipedia.org/wiki/Public_housing: Public Housing in different Countries.

8 | HUDCO - HSMI Publication
POLICY REVIEW
Approaches to AffordableHousing in India
Migration constitutes fair proportion of urban population growth and consequent problems for orderly development of urban areas. Accordingly, providing shelter and improving the quality of life of the residents, becomes one of the critical issues for urban local bodies. In India, majority of migrants are from lower economic strata of financial pyramid, with poor capacity and ability to rent a house, which makes securing appropriate shelter for them extremely difficult. This paper, analyses the present status of affordable housing, with a focus on the housing needs of the lower income group. It further elaborates key issues in providing affordable housing in India. It finally brings out key strategies and options, to provide housing in urban areas and to put affordable housing delivery on fast track.
INTRODUCTION India is fast urbanizing and as per census 2011, the population of urban India was 377.10 million with level of urbanization at 31.16 per cent, as against 279 million in 2001 when level of urbanization was of the order of 27.8 per cent. Census 2011 will be known as landmark in the demographic history of India for the reason that for the first time urban areas added more population (91 million) as compared to its rural counterpart (90 million) during the decade 2001-2011. Based on the prevailing urban growth rate of 3.18 per cent against 1.22 per cent for rural India, it is estimated that by the year 2031, urban India will house 600 million people out of a total population of 1400 million and by
2051, urban and rural areas will have equal share with total population placed at 1600 million (McKinsey Global Institute, 2010).
Census data for the year 2011 reveal the existence of large variations at state and regional level with regard to level of urbanization and distribution of urban population, marked by a high degree of concentration with every 6th urbanite living in 4 super- metros of India viz. Mumbai, Kolkata, Delhi and Chennai, 42 per cent urban residents housed in 53 metropolitan cities and more than 70 per cent urbanites preferring class-I cities. The number of urban centers has gone up from 5161 in 2001 to 7935 in 2011 and million plus cities (Metropolitan Centers) have recorded a 50 per cent increase, with numbers going up from 35 in 2001 to 53 in 2011. It is estimated that the number of such centers will be 85 in 2031 and 100 in 2051. Out of 26 ten-million plus cities of the world, three cities namely, Mumbai, Kolkata and Delhi are located in India. As per estimates made by the United Nations in its report, ‘World Urbanization Prospect, The Revision 2014’, the number of such cities will go up to 7 in 2031 and 9 in 2051 with Delhi already ranking second among largest urban agglomerations in the world.
Indian cities are no different from
KEYWORDS
Affordable housing, land use planning,Public Private Partnership (PPP)
Ar. Jit Kumar Gupta ([email protected]) is Chief Town Planner, Sahara Prime City Limited, Chandigarh.
Conventionally, housingfor EWS/LIG sectionsof the economic/socialpyramid has been largelythe responsibility of theparastatal agencies withlimited role assignedto the private sector.Considering the largedemand for housing inthis segment, most of thedevelopers have startedworking on the affordablehousing to explore thedepth, breadth and lengthof the demand on along-term basis.
JIT KUMAR GUPTA

October 2015 Volume 16 No. 2 - SHELTER | 9
POLICY REVIEW
the global pattern where growth and development are marked by deprivation and opulence. Despite distinct advantages and critical role, urban centres have not been growing in a planned and rational manner. Emerging urban scenario on Indian canvas portrays large number of slums over-shadowing the city growth; where slums and state-of-the-art buildings rub shoulders; where poverty and prosperity compete; where unplanned development has emerged as the order of the day; where informal sector governs the growth and development of cities and where basic amenities and services are eluding the majority of urban residents. Urban centres continue to face problems of acute housing shortage and rapid uncontrolled growth resulting in haphazard expansion with sub-standard infrastructure, adversely impacting the quality of life of majority of urban residents. The existing inadequacies have resulted in uncontrolled rapid growth and proliferation of informal sector. Poverty, population, pollution and inadequate housing have emerged as the major issues and greatest threats to the urban living.
HOUSINGAs provider of social security, distinct identity and assured quality of life, securing ownership of an appropriate home has emerged as the lifetime ambition of every individual and family. Besides social connotations, housing has major economic implications for both human beings and nations. Being one of the key promoters of
industrialization, with more than 290 industries involved in producing materials used in the construction, housing has been found to be one of the largest contributors to the economy, besides providing large employment to both skilled and unskilled manpower. Considering the multiple connotations, providing housing has emerged as priority for both society and nation. In order to focus on housing, number of steps were taken and housing policies were put in place by the Government of India. First such policy put in place in 1988, aimed at providing shelter to all with the objective that every family must have a dwelling unit of appropriate quality and space, duly supported by basic amenities of life. This was followed by National Housing Policy, 1994 which focused on transition of public sector role from provider to facilitator. The policy also enlarged the scope of housing by making it an integral part of the neighborhood and city.
The National Housing Policy (NHP), 1994 was further strengthened with the inclusion of 'habitat' in the 'National Housing and Habitat Policy' of 1998. However, National Urban Housing and Habitat Policy 2007, was the first policy which made urban housing as the theme, and emphasized the need for providing and promoting housing on a large scale in urban areas with priority for EWS and LIG categories. June 25, 2015 marks a watershed in the history of housing, with Prime Minister of India launching Pradhan Mantri Awas Yojana (PMAY), to provide housing to all by the year 2022, when India completes 75 years of independence. Based on the efforts made, housing sector is being given priority and ranks high on the agenda of state and central governments.
Since migration constitutes a fair proportion of urban population growth, providing shelter becomes all the more critical for orderly
Picture 1 : Newly Rehabilitated Colony in Chandigarh Periphery

10 | HUDCO - HSMI Publication
POLICY REVIEW
Picture 2 : A slum (Colony number 4) in Chandigarh
development of urban areas and providing appropriate quality of life. In India, majority of migrants are from lower economic strata of financial pyramid with poor capacity and ability to rent a house etc which makes securing appropriate shelter for majority of urban residents more difficult. With ever-rising land and building material prices, besides large financial resources required for creating appropriate shelter through legal means, the poor urban residents and rural migrants have no option but to encroach upon available public and derelict land in the city to create temporary and makeshift arrangements due to poor financial capacity. This leads to mushrooming of slums, jhugi jhompris and shantytowns in urban areas. This pattern of urban growth has high visibility in large urban centres with 54 per cent of population living in slums in Mumbai whereas Kolkata’s share is placed at 33 per cent . In India more than 60 million people are residents of slums and shanty towns and the proportion is increasing rapidly.
The makeshift shelter lacks the basic necessities of life and proper air, light and ventilation, thus leading to poor health and hygiene, with poor quality of life emerging as the natural corollary of urban living for these migrants. With shelter made on the encroached public/private land, the poor are in perpetual fear of being displaced by the parastatal agencies with possible destruction of the makeshift shelter. The fear of demolition acts as a major deterrent for the poor to improve their shelter, with savings available at their disposal, leading to ever increasing housing shortage with gap between demand and supply getting wider and wider.
HOUSING SHORTAGETechnical Group constituted by Ministry of Housing and Poverty Alleviation (MHPUA), estimated urban housing shortage at 18.78 million dwelling units in 2012, out of which 95.6 per cent belong to EWS and LIG categories. As per projections of a report by the Mckinsey Global Institute, the
housing shortage under business as usual scenario could reach up to 38 million units by 2030.
Despite the fact that large volume of housing stock has been created since the involvement of private sector, the shortage of housing has increased over the years because majority of housing created falls under the category of higher and upper- mid housing segments because these categories fetch higher premium over the low income housing. Housing for the poor and EWS categories is essentially being looked after by the parastatal agencies and to some extent by the private developers, who are required to provide housing stock for economically weaker sections to meet the legal obligation of license granted to them for setting up colonies/ townships. But in majority of cases such obligation is discharged in the shape of plots, which are beyond the affordability and capacity of the poor to pay for the cost of land and construction of the minimal shelter. Accordingly, these minimal opportunities are siphoned off by the speculators and high income categories. With limited capacity and resources available with parastatal agencies, housing for the poor has remained in perpetual neglect and shortage. Ever rising cost of land, cost of construction and large number of externalities, have put housing beyond the affordability of majority of urban residents. Operational mechanism of the housing market has pushed large number of urban migrants to the fringe, excluding them from formal process of owning/ renting an appropriate shelter. However, considering the enormous shortage

October 2015 Volume 16 No. 2 - SHELTER | 11
POLICY REVIEW
of housing in these categories, existing shortage can be leveraged as an opportunity to create housing stock for LIG/EWS categories, based on their affordability.
AFFORDABLE HOUSING FOR POORAffordable housing, as a concept, approach, strategy and opportunity, has been gaining currency and attracting the attention of providers and developers involved in housing because of the focus of the government to create a larger stock of housing for the economically weaker sections based on their affordability. However, affordability cannot be precisely defined because of a large number of variables and determinants, involved in the making of affordability. ‘RICS Report on Making Urban Housing Work in India’, defines affordability as provision of ‘adequate shelter’ on sustainable basis, ensuring security of tenure within the means of the common urban households. Further, Affordable Housing is that which is provided to those whose needs are not met by the open market. KPMG Report on Affordable Housing- A Key Growth Driver in the Real Estate Sector’ has defined affordable housing, ‘in terms of three main parameters, namely income level, size of dwelling unit and affordability. Task Force on Affordable Housing set up by the Ministry of Housing and Urban Poverty Alleviation, 2008, has defined affordable housing in terms of, size of dwelling and household income whereas JNNURM has defined affordable housing in terms of size of dwelling units involving super built up area/carpet area and
EMI/rent not exceeding 30-40 per cent of gross monthly income of the buyer. Government of India has put a ceiling of 30 sq.m of carpet area along with other conditions as the limit for EWS category housing under PMAY. Jones Lang LaSalle has defined affordable housing in terms of volume of habitation instead of area, provision of basic amenities, cost of the house (including purchase cost and maintenance cost) and location of the shelter.
This definition enlarges the scope and dimensions of the concept of affordable housing by: Adopting volume based approach
instead of area, for the size of the dwelling unit, providing more flexibility in designing.
Adopting provision of the minimum physical and social infrastructure on prescribed norms, as the basis to ensure appropriate quality of life.
Making cost of shelter broad based by including operational and maintenance cost for a reasonable period to the actual cost of the house.
Making project attractive and affordable by limiting the cost and travel time between place of work and place of living.
Based on the studies made and analysis carried out, the highest gap between demand and supply of housing is found to be in the annual income range of Rs 2-3 lakh because of the limitations imposed by minimum disposable income surplus placed at 30-35 per cent. This considerably reduces the capacity of this income group to own shelter, which is highly cost- intensive.
Based on the defined norms and the concept given above, the cost of the dwelling unit in the affordable category calls for rationalization to be brought within the affordability limits. The cost of house can be made more rational and affordable if developer’s margin is lowered down and cost of construction is reduced using state-of-art/ cost effective technologies, cost-effective local building materials, materials made from waste and production of houses on a mass basis leading to economies of scale. Affordable housing is said to be essentially a volume game and not a margin game. However location, cost of land, FAR, density, number of dwelling units permitted per unit area and government charges will be major determinants of the cost of dwelling unit. Considering the present status, housing cost can be made affordable with the enabling environment, active involvement of beneficiaries, innovative technologies, cost-effective materials and supportive policies of the Government.
ISSUES IN DEVELOPING AFFORDABLE HOUSINGHousing is both labour and capital intensive activity with land and construction as the major components. Considering the multi-lateral implications of the housing, there are large numbers of economic, regulatory and urban challenges in developing the affordable housing. Ever rising cost of land and cost of construction are the constraints that have emerged on the supply side whereas lack of access to home finance is the major demand side constraint. Based on the existing

12 | HUDCO - HSMI Publication
POLICY REVIEW
scenario, major issues identified in developing adequate housing have been enumerated below:a) Low availability of developed land Low availability of developed land remains a major challenge in the domain of creating adequate housing stock in India. With 2.4 per cent of global land and 16.7 per cent of world population, India is under perpetual shortage of land needed to meet the basic requirements of more than 1.21 billion Indians for food, clothing and shelter. With rapid urbanization and industrialization, asking for more and more land to be brought under non-agricultural uses, the pressure on the land is increasing rapidly. With low land-man ratio coupled with ever rising demand and numerous constraints emerging out of speculation, legal framework, planning tools and building bye-laws, the supply of developed urban land is diminishing very fast and accordingly, cost of land rising very rapidly, making the cost of shelter highly unaffordable for majority of urbanites. Major issues leading to shortage of urban land have been identified as:
i. Excessive parastatal control on the development of land;
ii. Lack of marketable land parcels;iii. High degree of encroachments
on public land;iv. Poor land information system;v. Cumbersome legal and
procedural framework for sourcing land;
vi. Restrictions imposed by the planning mechanism including master plans, zonal plans etc; and
vii. Restrictive government policies and approach.
b) Rising threshold cost of constructionConstruction cost is estimated to constitute 50-60 per cent of the total selling price in the case of affordable housing. In order to make the housing cost-effective and affordable, it will be critical to optimize the cost of construction. However, due to rapidly rising cost of building materials, cost of labor, cost of transportation, government levies and globalization and liberalization of economies, the cost of housing is rising rapidly.
c) High degree of charges by government / parastatal agencies Charges levied by the parastatal agencies for granting change of land use, approval of the layout and building plan, licensing fee, internal and external development charges, registration of land and registration charges for the finished house etc are major contributors to the escalation of the cost of the house. These would need rationalization and should be brought to the realistic level in order to promote affordability in the housing sector.
d) Rigid land use planningExisting pattern of urban planning has done more damage than good to the urban fabric. Master Plans, Development Plans, Controlled Area Plans prepared for the rational growth and development of the city and periphery do not provide space for most of the urban residents and migrants. The informal sector and poor find no place in the planning process/strategies. This leads to
their exclusion and their demand for shelter and employment remain unfulfilled. For making affordable housing a reality, mechanism, approach, intent, content and scope of these plans need to be re-defined by making poor and informal sector integral part of city planning and development process.
e) Irrational building bye-laws Existing building bye-laws and subdivision regulations are fast leading to emergence of large number of operational inefficiencies in land utilization, poor space utilization, use of cost-effective and state of art building materials and construction technologies. These need critical review on priority for optimizing land resource and adopting cutting edge technologies.
f) Delay in project approvalsComplicated procedures, cumbersome processes, involvement of large number of personnel, duplications of processes/procedures and lack of decentralization of powers, invariably result in delay in approving the projects and building plans (16-24 months) leading to time over-runs and cost over- runs. Delays in project approvals are estimated to add 25-30 per cent to the project cost. For making affordable housing reality, project approvals must be put on fast track and made time bound.
g) Lack of access to cheaper housing financeLack of access to cheaper housing finance for low income groups has its genesis in the non- availability of large number of documentations involved in approvals based on providing securities, proof of

October 2015 Volume 16 No. 2 - SHELTER | 13
POLICY REVIEW
Picture 3 : EWS housing in sector 38, Chandigarh
assured sources of income and residential address etc, which needs rationalization and simplification for increasing access to housing.
h) Multiplicity of agencies involvedA study made by the KPMG & NAREDCO (2012) has revealed that real estate projects are required to pass through 150 tables in about 40 departments of central, state and urban local bodies before approval is granted, which invariably delays the projects and makes housing cost-inefficient.
i) Outdated and irrational legal frame workExisting legal framework has put spokes in creating adequate housing stock in the country. Rent Control Act has emerged as the major road block in creating adequate rental housing stock. Legal framework needs rationalization, review and revision on priority to make housing for all a reality.
j) Non- involvement of private sectorConsidering the magnitude of the backlog, resources involved and spread of the housing shortage, it appears a difficult task for the government to create adequate housing stock of its own. Involvement of all the stakeholders will be critical for achieving the goal of housing for all. Role of private sector, which has been marginalized, will be critical in creating large housing stock for the poor considering the resources, innovations, technology and operational efficiency available with private sector.
k) Outdated technologies and poor project managementOutdated technologies and conventional methods of construction, besides poor project management, have invariably led to the wastage, delays in construction and rising cost of dwelling units.
l) Non-availability of trained manpowerDespite the fact that construction sector is one of the major contributors to the national economy and provider of the largest employment, still the sector is dominated by manpower that has no understanding, training and expertise available with them to undertake construction in a scientific manner. This invariably results in delays, wastage, cost and time- over runs. Absence of institutions for imparting formal training in the domain of art and science of construction, new and emerging building technologies and materials, besides low priority accorded to skill development
has led to the construction sector becoming highly inefficient and unproductive. This calls for creating a pool of trained manpower to bridge the gap between demand and supply to create large housing stock at the most competitive cost within a given time frame.
m) One solution fit all approachConsidering the existing scenario, it is observed that the present approach to housing shortage does not look at the fine grains of housing typologies required to meet the housing shortage and is limited only to the EWS and LIG housing. Considering the large number of migrants and persons who come to urban areas for working, learning and staying for a short period, formal housing should not be the only choice and option for shelter. For such residents rental housing, creating temporary shelter and hostel type accommodation would suffice, which requires lesser resources and funds for creation. Thus, a variety of living spaces need to be created to overcome the shortage.

14 | HUDCO - HSMI Publication
POLICY REVIEW
n) Lack of research and developmentMajor causes of housing maladies have their roots and genesis in the absence of adequate research in the area of housing typologies, building materials, building technologies, standardization of building components, pre-fabrication, pre-casting and other related issues which can lead to creation of large housing stock on the affordable basis. Few institutions, which exist, have failed to deliver the results due to various internalities and externalities. There is a need to focus and accord high priority to research and development by creating more institutions at regional, state and national levels duly supported with adequate resources and manpower to launch housing on fast trajectory.
o) Absence of adequate and reliable data on housingThe country is still in search of adequate and reliable data, both qualitative and quantitative, which can realistically showcase the existing scenario with regard to housing shortage, housing stock, housing need and demand, congestion, derelict housing and housing requiring replacement, up-gradation and improvement. Absence of factual data has led to creating mismatch in policy framework and ground realities, making policies and program which has number of limitations, inadequacies in projections made for housing needs at national, state and local level. Creation of adequate and reliable data bank would be critical for making realistic assessment of status of housing and putting in place rational policy framework for housing.
WAY FORWARDConventionally, housing for EWS/LIG sections of the economic/social pyramid has been largely the responsibility of the parastatal agencies with limited role assigned to the private sector. Considering the large demand for housing in this segment, most of the developers have started working on the affordable housing to explore the depth, breadth and length of the demand on a long-term basis. With major initiatives in the urban development being taken at the national/ state level including National Urban Housing and Habitat Policy, 2007(NUHHP); Jawaharlal Nehru National Urban Renewal Mission (JnNURM); Rajiv Awas Yojana (RAY); Affordable Housing in Partnership (AHIP); and the Pradhan Mantri Awas Yojna (PMAY) 2015, focussing on the lower end of the pyramid, affordable housing has emerged as the priority area. Further, industry analysts and developers have started believing that if the government takes the initiative to remove the roadblocks, the segment could move to the fast track. Developers feel it is possible to have a profitable proposition in affordable housing if the project and cost management are made very strong. Improved technologies can help in reducing timeframe and cut down cost of construction to a large extent. Context of design of dwelling unit and standardization of housing units/components can help in cost reduction. Further, economies of scale and developing a standard product can keep the cost low. Thus, project design and construction management can lead to making the
affordable housing projects risk free and profitable, considering the huge latent demand with saleability not being an issue. To create a large stock of housing in the country, and to put affordable housing on fast track of growth and development, following options are suggested:
Adopting project based approachConsidering elements of cross-subsidy and cost-reduction, a project based approach should be adopted for creating mass housing. Housing project should invariably involve mixing of all categories including HIG, MIG besides EWS and LIG, to make project viable and self-sustaining. Making provision and addition of commercial component would help in making project profitable and attractive for both public and private sectors.
Promoting strong project and cost- managementIn order to minimise the time span for completion of the project, bring high degree of cost- efficiency and to eliminate time and cost-over run, it will be critical to adopt strong project and cost-management approach in the planning, designing and construction of the project to achieve the desired results.
Single window clearanceFor ensuring early completion of the project and to avoid any cost escalation, it will be important to put in place an effective and efficient mechanism of single window clearance to ensure approval of the projects on a time bound basis within a prescribed time frame not exceeding three months.

October 2015 Volume 16 No. 2 - SHELTER | 15
POLICY REVIEW
Creating Land BankIn order to ensure the creation of large stock of affordable housing through the active involvement of private sector, it will be important to put in place a dedicated land bank for making available off the shelf land parcels, with all required clearances, to developers under a joint venture .
Innovative and state-of-the art architectural designsInnovative and state-of-the art architectural design would be a pre-requisite for creating cost-effective affordable housing. State-of-the art architectural design will provide for highest building efficiency, optimum utilization of land resource, optimum structural design, cost-effective building technologies/services, use of large prefabricated components and minimum of maintenance and upkeep.
Green buildingsDesigning affordable housing on the concept of green buildings will help in considerable reduction of operational cost of the house over the entire life cycle of the building due to reduced energy and water consumption besides lower generation of waste to make the dwellings really cost-effective and sustainable.
Standardisation of building componentsStandardisation of various building components, based on available size of materials to promote pre-fabrication, reduce wastage, minimise cost, promote quality and achieve economy of scale will go a long way to reduce time frame of construction and labour component for the housing.
Providing higher floor area ratio/ densityFloor area ratio and density are the two major determinants for achieving optimization of land resource and rationalizing the housing cost. Making available higher floor area ratio and redefining density accordingly will help in optimising land utilisation, create larger housing stock and making housing cost-effective by lowering cost of land for each dwelling unit.
State-of-the art building technologiesPromoting state-of-the art and cost-effective building technologies will be critical in reducing not only period of construction but also lowering the cost of construction.
Reducing and rationalising government levies, charges, fees and taxesGovernment charges, fees, taxes etc form considerable proportion of the total cost of housing. In order to reduce the cost of the house, it will be desirable that these charges are rationalised and minimised, to make housing affordable in the real sense of the term. Reducing these charges would involve redefining land use conversion charges, plan scrutiny fee, internal and external development charges. In all affordable housing projects, no land use conversion and licensing charges should be levied, building scrutiny fee should be charged @25 per cent of prescribed rates whereas EDC should be charged @50 per cent for EWS and@ 75 per cent for LIG categories. Haryana model for affordable housing can be considered for adoption with appropriate modifications.
Long term tie up of conventional materials Due to longer gestation period of the projects and other externalities, it is observed that not only the cost of essential materials invariably goes up but also sometimes their supply is disrupted, which adversely impacts the sustainability of the project. In order to hedge the project against the cost-escalation of essential materials including cement, steel, bricks, tiles sand, wood etc and to ensure the assured supply of critical materials during the project life cycle, it will be desirable to have long term tie up with the producers/suppliers of such materials.
Using locally available building materials Using locally available building materials and materials based on industrial and agricultural waste would be critical for promoting cost-effectiveness and utilizing waste. Accordingly, government should encourage research and development and promote industries producing materials from industrial and agricultural waste in order to increase the availability of cost-effective materials and reduce depletion of non-renewable resources used for creating conventional building materials.
Adopting co-operative based approachCreating co-operative societies of beneficiaries, adopting co-operative based approach and promoting co-operative culture would be vital for involving stakeholders, sourcing their support and resources for creating adequate housing stock, minimising transfer of such units

16 | HUDCO - HSMI Publication
POLICY REVIEW
and procuring easy loans from financial institutions.
Treating affordable housing as a volume gameAffordable housing is not to be treated as a profit game but a volume game, based on the principle of creating large housing stock with minimum cost, within a short span of 18-24 months and disposing off the entire stock within the time span of the project. Taking up large housing projects with number of units ranging from 1000-1500 for promoting economy of scale, have proved to be highly successful in promoting affordable housing.
Separating ‘Right to Shelter’ from ‘Right to Ownership of Shelter’For achieving the objective of housing for all the, ‘Right to shelter must be separated from Right to Ownership of Shelter’. This concept will help in promoting optimum utilization of the available housing stock, minimising speculation and eliminating transfer of affordable housing to non-beneficiaries/ higher strata of society.
Creating multiple options for shelterMultiple options of providing affordable shelter, need to be considered on priority, based on affordability, family size, shelter requirements, marital status, type of vocation, skill, tenure etc. Night shelters, mobile housing, bachelor/single accommodation etc. at various places should be used as options for augmenting shelter and minimising quantum of formal and expensive housing.
Creating Built up Houses for EWS in Private Colonies/Townships
Reservations made for the LIG & EWS categories in the approved colonies/townships, under the legal framework, must be mandated to be provided in the shape of built up houses in order to create readily available affordable housing stock in various cities. Existing provision of providing plots for these groups must be dispensed with and replaced with built up houses. In order to avoid the misuse such parcels of land should be transferred to the Housing Board/ Development Authority, who should be mandated to construct such houses and make them available to identified beneficiaries. In addition, the proportion of such housing to be constructed must be increased keeping in view the prevailing housing shortage. Reservation should be made irrespective of the size of the colony or group housing. Under the Pradhan Mantri Awas Yojana (PMAY), the proportion of economically weaker sections housing placed at 35 per cent, minimum project size under PPP model to be 250 houses with carpet area of the house limited to 30 sq.m, needs to be adopted and made an integral part of state and local legal framework.
Siting of the affordable housing projsects Siting of the mass housing projects will have to be done with utmost care and caution in order to ensure success and viability of the projects. Such projects should not to be constructed far away from place of work leading to considerable loss of time in travel and increased expenditure on travel. Making available cost-effective, efficient and reliable public transport from
the project area would be critical to promote the acceptability/success of the project.
Providing essential/ basic amenities as integral part of projectBasic amenities involving education, healthcare, recreation, child care, shopping, community centre, open spaces etc. should be made an integral part of the project to make it self- contained and self-sustainable.
Using peri-urban areas Peri-urban areas in metropolitan cities with basic infrastructure services and transport should be permitted to be used for creating affordable housing due to lower prevailing land cost.
Formulating well defined, trans-parent and objective guidelinesFormulating well defined, transparent and objective guidelines with a networked system of sharing information, would be critical and essential for identifying right beneficiaries eliminating speculators, minimising multiple ownership and illegal transfer/ sale of units at the local, state and national level.
Using PPP ModelHousing, being largely a private sector activity, leveraging land for market based strategies and PPP models, would help in improving supply of affordable housing.
Revolving fundPromoting easy access to institutional finance at an affordable cost, for creating cost-effective housing through a dedicated revolving fund, created at the national and state level, with contributions made by central and state governments, urban local bodies, development

October 2015 Volume 16 No. 2 - SHELTER | 17
POLICY REVIEW
authorities and assistance provided under different centrally and state sponsored schemes, would be a pre-requisite, critical and essential to ensure creation of affordable housing on large scale.
Involving beneficiariesActive involvement and participation of beneficiaries, in cash, kind or both, in a project would be critical for the success of the project involving slum up-gradation and provision of shelter.
Making land market more efficientMaking land market more efficient by streamlining the land ownership record, rationalising stamp duties, minimising benami transactions, eliminating speculation by taxing vacant urban lands, minimising monopolisation, regulating land use conversion, creating dedicated land use zones for affordable housing in the master plans, rationalising building bye-laws, zoning regulations, development controls, densities, ground coverage, floor area ratio, height etc. would be pre-requisites for promoting affordable housing.
Ticket size of the projectStudies and analysis of ongoing housing projects have revealed that affordable housing projects having area in the range of 15-35 acres, with number of dwelling units ranging between 1500-3500, located not beyond 20-25 kms from the city centre of metro cities, with area of dwelling units ranging between 250-350 sft, constructed as low rise G+3/G+4 walk up apartments, completed within 18-24 months and provided with all basic amenities have proved to be successful and
should be taken as ideal model for constructing the affordable housing.
Based on the options suggested above, it appears that providing affordable housing can become a reality only if concerted efforts are made in tandem and in a holistic/sustained manner by all the stakeholders, including governments, parastatal agencies, financial institutions, private sector, builders, developers, colonizers, industry, and professionals including architects / engineers/ planners etc. Affordable housing friendly policy framework will have to be put up on priority by the government, providing required incentives and removing all roadblocks to achieve the desired objectives. The role of parastatal agencies shall be that of facilitators rather than providers with key responsibility given to the private and co-operative sectors. Reform linked policy framework, calling for making land market effective and efficient; cutting down government levies/fees/taxes; promoting industries involved in producing pre-fabricated components and making building materials from waste; providing housing loans at concessional and affordable rates with flexible options of repayment; making landowners active partners in creating affordable housing on a mass scale and making all stakeholders work in a concerted/committed manner, would be critical in making affordable housing a reality in the Indian context. Looking at the role and importance of housing, affordable housing can be effectively leveraged to create/ expand large job market for unskilled/ semi-skilled rural migrants; revitalize Indian industry; promote economy; achieving high
growth rate and marginalizing poverty in urban India. Housing as a sector can be effectively leveraged in making urban centers smart , more productive, more effective, highly efficient, more healthier, better habitable, better organized, well planned and more sustainable with assured quality of life.
REFERENCESGovernment of India, (2011) Census of
India- 2011, New Delhi.
McKinsey Global Institute (2010) India’s Urban Awakening: Building Inclusive Cities, Sustaining Economic Growth, New York: McKinsey & Company. .
United Nations (2014) World Urbanization Prospects: The 2014 Revision, New York: United Nations.
KPMG International & NAREDCO , (2012) Bridging the Urban Housing Shortage in India:kmpg.com/in
Jones Lang Lasale (2012),Affordable Housing in India- an Inclusive Approach to Sheltering the Bottom of the Pyramid
Government of Haryana (2013) , Policy of Affordable Housing: Chandigarh
Knowledge @Wharton (2012 ), What is Holding Back Affordable Housing in India:
Government of India, Ministry of Housing and Poverty Alleviation(2012), Report of Technical Group(TG12) on Urban Housing Shortage 2012-17: New Delhi
Kulshrestha S K ( Vol.22 No.3 MAY-JUNE 2015), Spatio- economic Development Record, SDR News Notes-Smart Cities, AMRUT and Housing for All: New Delhi.
Gupta J K (2014), Making Affordable Housing A Reality in India,

18 | HUDCO - HSMI Publication
POLICY REVIEW
Efforts of Affordable Housing Supply Models
Futile or Worthwhile?
Grand schemes with extravagant promises are neither new nor unusual in the Indian housing sector. Despite constant efforts by public and private sectors, the conundrum of affordable housing for poor continues to plague urban India, because, first the efforts in the country to resolve the housing shortage for poor are immensely inadequate in comparison to the demand. Second, the efforts to sustain the outreach to the intended beneficiaries over a long period are even fewer. For example, lower occupancy ratio, high share of units rented by ineligible users against policy guidelines and speculative investments by higher income sections in private affordable housing schemes are creating artificial shortage of housing supply for poor and are altering the intended outcome of various supply mechanism models.
This article forwards the argument that efficacy in sustaining the outreach is a key for ensuring affordable housing for all, rather than re-formulation of programs or models every other year. This article inquires the causes for failure in sustaining the outreach to intended beneficiaries under a variety of affordable housing supply models for urban poor. The article also addresses the successful interventions and supply side potentials to significantly overcome the challenges. End user satisfaction is vital in retaining the success of any housing model. This article highlights the significance of different factors influencing the end user satisfaction in the success of each model and concludes with recommendations on measures necessary to sustain the outreach to intended beneficiaries, in the face of large scale urbanization and housing delivery under “Housing for All” mission, announced by the Government of India in 2015.
INTRODUCTIONFostering socio-economic stability and promoting national development in India and other developing countries has always been a challenge. Both through migration and natural process, cities face never ending urban sprawl. The subsidiary effects include urban poor living in substandard housing like slums, waiting for subsidies to make the change or undertaking long commutes to work. According to the Ministry of Housing and Urban Poverty Alleviation (MHUPA, 2012), Government of India (GoI), urban housing shortage in India is recorded as 18.78 million at the beginning of the 12th five year plan and is likely to touch 30 million by 2022. About 56 per cent of housing shortage is recorded in Economically Weaker Sections (EWS) at 10.5 million, followed by 40 per cent in Lower Income Groups (LIG) at 7.4 million and only 4 per cent in the Middle Income Groups (MIG) and above (MHUPA, 2012). Despite these facts, the irony in Indian affordable housing market is that on the one hand, around 18.7 million is the urban housing shortage, and on the other hand, around 11 million housing stock is lying vacant (MHUPA 2012). Researchers argue that “the units lying vacant are precisely the ones
KEYWORDS
Affordable housing, post occupancy, beneficiary, speculative investments, urban poor, artificial housing shortage, rehabilitation housing, government subsidized housing, private sector housing
Ms. Gowthami Sai Dubagunta ([email protected]) is Research Assistant at Centre for Urban Land and Real Estate Policies, CEPT Research Development Foundation, Ahmedabad. Ms. Sejal Patel is Associate Professor in the Faculty of Planning at CEPT University, Ahmedabad.
GOWTHAMI SAI DUBAGUNTA
SEJAL PATEL
If the impending impoverishment is the reason for low occupancy ratio in the rehabilitation housing, the vertical growth and lack of incremental opportunity in the unit design (desire for bigger house) is the reason for renting out the allotted unit by beneficiary in the subsidized housing.

October 2015 Volume 16 No. 2 - SHELTER | 19
POLICY REVIEW
that would allow the more affluent slum dwellers to move out of the slums and afford older units in the formal market” (Annez, Bertaud et al. 2010: 8). If that was true, 11 million housing stock would not have been left vacant or unused. In this regard, where are the UN’s time bound-Millennium Development Goals failing? In improving the equitable access to shelter or in suppressing the poor in the rush of development?
Will the poor always remain poor or why poverty is persistent in cities, is not the scope of this research. But, where are all those efforts made for urban poor? What have we done to improve their living conditions? Why aren’t we upscaling the subsidized housing programs? Rather than overcoming the flaws of ongoing affordable housing programs, why are we introducing new schemes with repeated modifications every other year? These are some of the concerns that the paper attempts to address.
Changing paradigm of housing supply models in India: Did they succeed?Post-independence, the Government of India’s stance towards housing deficit has been consistently shifting, from being provider to facilitator to communities and markets, to self-help housing, to once again, direct provision since 2005 (Batra 2009). Along with different affordable housing programs, with neo-liberalization the markets have showed a peculiar interest in serving the poor in recent past. The models largely serving the lower income affordable housing segment in India are rehabilitation, government
subsidized, private sector and rental housing. However, the national average proportion of renters in India is only 11 per cent(UN-HABITAT 2008) and majority of programs and projects fall in the other three supply models. Some of the programs in the past decade are: Basic Services for Urban Poor (BSUP) under Jawaharlal Nehru Urban Renewal Mission (JnNURM), Rajiv Awas Yojana (RAY) and Slum Rehabilitation Schemes (SRS) by the state government of Maharashtra, Gujarat etc.
The recent addition to these programs in Indian affordable housing sector is ‘Housing for All by 2022’. The vision entails development of about 110 million housing units, including the current shortage of about 60 million units (KPMG 2014). The requirements translates to about INR 16,500 billion to INR 17,000 billion annually for the next seven years, “more than double the annual investments witnessed in FY14”(KPMG 2014: 12). In addition, the cap on annual income of lower income sections is raised from INR 100,000 to INR 300,000 for EWS and from INR 200,000 to INR 600,000 for LIG. The official claim on redefinition of income criteria, is that it increases the number of beneficiaries that will be eligible for central grants (Nair 2015). Access to housing finance in India continues to be challenging due to high demand, exorbitant land prices, political biases and other socio-economic factors and in all these, is it viable to raise the income cap? Apart from new housing projects and programs demanding funds, continuing the trend of re-formulating policies for poor without identifying existing
challenges in models, might thrash away all the government spending and efforts.
Out of the approved 1,517 projects in BSUP, which were to cater for merely 6 per cent of housing shortage declared in 2007 (Mahadevia, Datey et al. 2013), only 22 projects were actually completed. Along with a lower delivery rate of the model, literature shows that housing stock built under BSUP, the largest housing program in India till date, are left unoccupied despite allotment. “Only 52 per cent of the total one million approved housing units were constructed and out of the approved, only 36 per cent are actually occupied” (Patel, Sliuzas et al. 2015: 2). In most cities across India, similar scenarios are reported. Around 57 per cent of BSUP housing stock, in Bengaluru, was left unoccupied and almost 90 per cent was left unoccupied in Greater Hyderabad (Mahadevia, Datey et al. 2013).
Apart from the government funded projects, even with deep interest of private sector in affordable housing for lower income sections, so far only 78,000 units have been launched all over India in the past five years (Monitor 2013). Costing below INR 10,00,000 per dwelling, the private sector catered for only 1per cent of shortage recorded by MHUPA. Monitor (2013) shows that Households (HHs) earning INR 10,000 – 25,000 per month can afford privately built formal housing, costing INR 400,000 – INR 1,000,000 without any assistance from the government. Even with an estimate (Monitor 2013) of 15 million HHs lying in the above range, the outcome discussed above contradicts the envisaged results.

20 | HUDCO - HSMI Publication
POLICY REVIEW
What produces challenges - case of AhmedabadOur research conducted in Ahmedabad indicates the utmost necessity of measures to sustain the outreach to intended beneficiaries in three distinct models – rehabilitation housing, government subsidized housing and private sector housing. The seventh largest metropolis in India, Ahmedabad, hosts a population of 55, 70,585 (The Registrar General of India 2011). According to Ahmedabad Municipal
Corporation (AMC), the estimated slum population is around 13 per cent of 2011 AMC population, and around 9.8 per cent of HHs in the city are living in dilapidated, congested and temporary structures. In wake of the rapid growth of population, the city has witnessed distinct housing supply models based on consumer market profile.
The research conducted (Table 1) shows that in case of rehabilitation housing under the approach of BSUP by AMC, around 63 per cent
of allotted HHs are willing to vacate the site after the issuance of property rights. In case of government subsidized housing, under the approach of BSUP by Ahmedabad Urban Development Authority (AUDA), more than 50 per cent of allotted housing units are rented and used majorly by ineligible users against the policy guidelines. In private housing, around 40 per cent of units are owned by investors themselves and are later rented out, thereby creating an artificial shortage of housing supply for the EWS.
Table 1: Gap between rhetoric and on ground realities in rehabilitation housing
Rehabilitation HousingParameters Rhetoric On ground realities
Objective The mission aims for development of slums in an integrated approach and providing shelter as well as basic minimum services and other civic amenities to the urban poor.
Contrary to the objective of providing in-situ basic services to poor HHs, the model funded off-site rehabilitation housing for PAP
Eligibility criteria EWS-monthly HH income less than INR 8,000 LIG –monthly HH income between INR 8,000 to INR 20,000
Occupied HHs (PAP) has income within the eligibility criteria between INR 8000 to INR 15000 per month
Allotment Procedure Selection of housing unit in the site through draw system. As far as possible the site location must be in proximity to the location of occupation of the urban poor.
Selection of housing unit in site done through draw system. But selection of site ignored proximity measures resulting in 65% of total HHs compelled to change their occupation and 50% faced loss of livelihood due to high transportation costs and lack of required opportunities.
Carpet area Not less than 25 sq.m 25 sq.mFinancial share (INR) Min. 12% cost of Dwelling Unit (DU) borne by
beneficiary and in the case of SC/ST/BC/OBC/PH and other weaker sections shall be 10 per cent. 50 percent of total DU cost must be borne by state/ULB/beneficiary and the rest 50 percent by central level agency.
Around 26 per cent of the total DU cost borne by the beneficiary, around 24% by AMC and the rest 50% by the central government
Property rights Non-transferable lease rights on a housing unit for 10 years, following which, and after the beneficiary contribution has been paid, the allottee will be able to sell the house, but only to the government.
2% of total housing units rented against policy guidelines.
Occupied to sanctioned percentage
Anticipated 100% occupancy by 2013 (over 7 years period of JnNURM, starting from 2005-06).
Around 50%.
Occupied to allotted/constructed percentage
Anticipated 100% occupancy. Around 81%.
Challenge Low occupancy rate and large possibility of vacating the housing unitsSource: Policy documents and Field Survey, 2015

October 2015 Volume 16 No. 2 - SHELTER | 21
POLICY REVIEW
It may be rehabilitation or subsidized or private sector affordable housing for poor, from the perspective of end user - spatial location of site, access to employment opportunities, tenure, affordability, presence of infrastructure, access to amenities, community relations and design of unit have proved to be the significant factors influencing the success rate of any model. Negligence of a single factor may lead to underperformance of the overall model. The research forwards three distinct challenges affecting the extent and sustainability of outreach of various affordable housing supply models in India. The causes for the identified challenges are discussed below.
Risk of impoverishment leading to lower occupancy ratio in rehabilitation housingEven though the two models of BSUP – rehabilitation housing and subsidized housing are under the same tag of BSUP by JnNURM, with similar objectives and eligibility criteria, they carry a distinct approach in the case of Ahmedabad. In case of BSUP by AMC, the program served the Project Affected People (PAP) of Sabarmati River Front Development project, Bus Rapid Transit System (BRTS), road extensions and other development projects of the city.
The low success rate of rehabilitation model is because of the imprudent attempts by the local government, under which the poor HHs were resettled rather than rehabilitated. Lack of adequate employment opportunities, in the allotted location, and forceful evictions,
affected the livelihood of 50 per cent of HHs in rehabilitation housing leading to risk of impoverishment. However, the poor largely rely on temporary employment, since availability of opportunities is a challenge when located far away from their earlier residences. Surprisingly, BSUP policy did not clearly define the proximity to relocation site from departure slum location (Patel, Sliuzas et al. 2015). Research by Patel et al. shows that “no surveyed HHs in Ahmedabad were resettled within the same ward, and only 3 per cent were resettled within 3 kilometers of their departure slum” (Patel, Sliuzas et al. 2015:10).
In response to the search for the cause, loss of employment was reported by 50 per cent of HHs, poor infrastructure by 21 per cent, lack of social amenities by 14 per cent and increase in transportation costs by 9 per cent. Interestingly, weaker community relations is the reason given by 6 per cent of HHs for dissatisfaction rate under this model, making the HHs willing to shift from allotted location in near future. Even though commenced five years back (from the time of field work of this research), weaker community relations still persist, because AMC displaced the slum dwellers from different project affected sites and relocated them under one project roof. With different ethnic backgrounds and different behavioral patterns, the neighborhood experiences social disarticulation. Due to this, the beneficiaries could not develop good community relations and lost the last opportunity of generating livelihood through community indulged self-employment activities.
The weak social relations also led to poor functioning of Resident Welfare Associations (RWAs) which ended in poor maintenance of the neighborhood. The above factors made more than 60 per cent of HHs in rehabilitation housing willing to shift from allotted relocation sites in Ahmedabad .
Presence of high rental component against policy guidelines in subsidized housing
If the impending impoverishment is the reason for low occupancy ratio in the rehabilitation housing, the vertical growth and lack of incremental opportunity in the unit design (desire for bigger house) is the reason for renting out the allotted unit by beneficiary in the subsidized housing. Field work in government subsidized housing (Table 2) shows that, out of total HHs planning to shift from allotted location, 63 per cent was attributable to desire for bigger house followed by lack of social amenities at 25 per cent and poor infrastructure at 13 per cent. The desire for bigger house specifies that there is definite improvement in quality of life of allotted residents, indicating partial success of the model. But on flip side, lack of incremental improvement opportunity in unit design, are leading the allottees to rent the allotted unit to ineligible HHs. The interesting finding emerging from the fieldwork in Ahmedabad, is that the allotted HHs in the site are earning an average monthly income between INR 20,000 to INR 25,000 whereas the same for the tenants is at an average of INR 30,000 per month. When inquired regarding

22 | HUDCO - HSMI Publication
POLICY REVIEW
the profile of owners who rented out the allotted units, RWA chairman’s response was, “largely families who were allotted with housing units are able to afford far better house in the city than the allotted unit” . This indicates either malpractice of allowing higher income group in the allotment process by the authority or an improvement in quality of life of the HHs in the post occupancy stage had occurred resulting in high share of rental component in the model. This is a clear example where the authority moderately satisfied the
needs of beneficiaries, but improper post occupancy vigilance and lack of incremental opportunity in design of unit led the beneficiaries to rent out the units to the unintended HHs, altering the desired objective of the model.
Speculative investments of higher income group in private / markets based housing model
In a free market, the highest bidder is always the winner. These behavioral biases of investors largely cause
speculative investments in private sector model. From the primary survey, higher rate of satisfaction towards quality of services is noticed from end users in private model. Despite this, only 70 per cent of occupancy is recorded (Table 3). In addition, the percentage share of lower income sections is reported even lesser. Interviews of RWA chairperson revealed that one in fifteen units of 1RK and 1BHK is used for non-residential purposes like HH industries, commercial use, office use etc. Of the total units, a
Table 2: Gap between rhetoric and on ground realities in government subsidized housing
Government Subsidized HousingParameters Rhetoric On ground realities
Objective The mission for development of slums in integrated approach, aiming to provide shelter as well as basic minimum services and other civic amenities to the urban poor.
Open to market, for HHs within prescribed eligibility limits.
Eligibility criteria EWS-monthly HH income less than INR 8,000 LIG –monthly HH income between INR 8,000 to INR 20,000
In contradiction to eligibility criteria, primary study shows that HHs with an average monthly income INR 30,000 are also allottees under the program.
Allotment Procedure Selection of housing unit in the site through draw system. As far as possible the site location must be in proximity to the location of occupation of the urban poor.
Selection of housing unit and location of site done through draw system. Option of withdrawal from allotted site location given.
Carpet area Not less than 25 sq.m 25 sq.mFinancial share (INR) Min. 12% cost of DU borne by beneficiary and in the
case of SC/ST/BC/OBC/PH and other weaker sections shall be 10%. 50% of total DU cost must be borne by State/ULB/beneficiary and the rest 50% by central level agency.
50% of total DU cost borne by beneficiary and remaining 50% by the central government.
Property rights Non-transferable lease rights on a housing unit for 10 years, following which, and after the beneficiary contribution has been paid, the allottee will be able to sell the house but only to the government.
52% of total housing units rented against policy guidelines.
Occupied to sanctioned percentage
Anticipated 100 per cent occupancy by 2013 (over 7 years period of JnNURM starting from 2005-06).
Around 98%.
Occupied to allotted/constructed percentage
Anticipated 100% occupancy. Around 96%.
Challenge High share of rental stock against the policy guidelines to unintended beneficiaries
Source: Policy documents and Field Survey, 2015

October 2015 Volume 16 No. 2 - SHELTER | 23
POLICY REVIEW
substantial share i.e. 40 per cent are owned by investors/ developers themselves and rented to lower income sections.
Reasons being, first, the location of private projects is in the periphery of the city. With high transportation costs, lower income HHs are reluctant to purchase the housing unit in open market, unless and until they are working in the nearby locality. Second reason not evident in other models, is lack of purchase affordability. Griha Pravesh, a not for profit organization in Ahmedabad, revealed that about 43 per cent of total clients backed out from purchasing housing units in all the projects under this model after initial booking, only because of the inability to afford the down payment. In all the three models, the income affordability stated by
Gan and Hill (2008) as house price to income ratio, is within the Indian affordable housing standards, which is five, as per the Task force (2012). But the purchase affordability is not met in the case of private housing. The other finding emerging from the interview with Griha Pravesh, is that a household earning monthly income less than INR 10,000 cannot meet both purchase and repayment affordability in private model. The above two reasons are leading the stock to lie vacant, and owned by investors themselves in private sector housing. And in due process, with increase in urban sprawl, the demand of sites in periphery increases, leading the poor to stay on rent, since by then, the prices would have skyrocketed for urban poor to purchase. Therefore, despite large demand in lower sections
of society for housing, unless and until the supplied product meets the purchasing power of the poor, the shortage continues.
SUCCESSFUL INTERVENTIONS AND PATH AHEADIn addition to better delivery of infrastructure, the RWAs of private sector housing for urban poor, ensured the longevity of provided infrastructure services and thus sustained decent quality of life. However, the biggest loophole in the private sector housing is that they can do little to control the market distortions. With exorbitant land prices in the core, private sector housing models are often located in the periphery of city making them unsuitable for lower income sections to reside (high transportation costs).
Table 3: Gap between rhetoric and on ground realities in private sector housing
Private sector HousingParameters Rhetoric On ground realities
Objective As corporate social responsibility and also to capture the large opportunity at the Bottom of Pyramid (BOP).
To capitalize the necessities in the BOP by meeting affordable standards of lower income sections (only LIG are catered, not EWS )
Eligibility Criteria Aimed to target lower income sections 1 RK and 1 BHK constructed exclusively for lower income sections, but on ground, the highest bidder owned the unit. Around 40% of total units are owned by investors/ higher income groups.
Allotment Procedure Voluntary selection of site and housing unit. Voluntary selection of site and housing unit.Carpet area Assuring basic standard of unit -not less than 25 sq.m 28 sq.mFinancial share Total price of unit including land cost to be borne by
beneficiaryTotal price of unit including land cost borne by the beneficiary
Property rights Owned by purchaser Owned by purchaserOccupied to allotted/constructed percentage
Anticipated 100% occupancy Only 70% occupied
Challenge Lower income housing units owned by high income group resulting in artificial shortage of housing supply for the poor
Source: Interview with private developers and Griha Pravesh; Field Survey, 2015

24 | HUDCO - HSMI Publication
POLICY REVIEW
Table 4: Gap between rhetoric and on ground realities in PPP model of SRS,2010
PPP model of SRS,2010
Parameters Rhetoric On ground realities
Objective For in-situ redevelopment of slums irrespective of land ownership through private involvement.
Redevelopment of slums irrespective of land ownership through private involvement.
Eligibility criteria Hutment occupant for minimum 10 years and domicile of Gujarat for 25 years/ his descendant.
The slum HHs that are living in slums on or before 1-12-2010 considered as beneficiaries.
Allotment Procedure Redevelopment only after gaining 100 percent consensus from slum dwellers. Selection of housing unit through draw system.
Redevelopment only after gaining 100 percent consensus from slum dwellers. Selection of housing unit through draw system.
Carpet area Not less than 25sq.m 25 sq.m
Financial share (INR) Total cost of dwelling unit to be borne by developer Total cost of dwelling unit borne by developer
Property rights Non-transferable rights till 20 years of continuous possession
Non-transferable rights till 20 years of continuous possession
Occupied to sanctioned percentage
Started in 2010, anticipated 100% occupancy Around 23%
Occupied to allotted/ constructed percentage
Anticipated 100% occupancy 100% occupancy
Source: Policy documents and Field Survey, 2015
In this regard, promotion of PPP by authorities by providing land, the crucial component for developing housing can assure desired outcomes in the city.
One such intervention is the Slum Rehabilitation Scheme (SRS), 2010 in Ahmedabad (Table 4), where developers are handed over slum land with additional Floor Space Index (FSI) to rehabilitate slum dwellers on the same plot. In this scheme, the developer gains Transfer of Developmental Rights (TDR), slum dwellers gain improved housing unit with leasehold title for free, and finally, the authority guarantees well-being of urban poor without any financial investment. Gaining the trust of slum dwellers is the key to success in PPP model of SRS, 2010. That is where the role of NGOs like Mahila Housing Trust (MHT) strengthened the process by
bridging the gap between suppliers and beneficiaries.
The other successful model is the Slum Network Program (SNP) in Ahmedabad, which focused on giving in-situ upgrade of basic service, de-facto tenure, and access to micro finance, through which the beneficiary upgraded the houses themselves over a period of time. SNP created a partnership between local government, NGOs, industry and the slum communities themselves to design, finance and implement slum upgrading projects (Hingorani 2011). Major reason for success of the above interventions is in-situ upgrade or redevelopment. A study by Patel et al (2015) on the risk of impoverishment in urban development, showcased that slum dwellers rehabilitated on-site were substantially less impoverished than those rehabilitated off-site. However,
while these programs are successful from end user perspective, there is a limited upscale rate of projects. The reason pertains to the mammoth effort required in gaining 100 percent consensus of slum dwellers. But if the operandi of private partnership in public housing consistently involves mass production and innovative building techniques, India can accomplish the vision of 'Housing for All by 2022'. In addition to assured social development, boost in economy of country can also be witnessed by promoting housing and construction industry, since housing industry supports 250 ancillary industries and contributes nearly 10 per cent to the GDP (MHUPA 2013).With cross subsidy and incentivizing the private in PPP, climb in gaining equitable social status and long term economic development of the country can be achieved. But the story of PPP does

October 2015 Volume 16 No. 2 - SHELTER | 25
POLICY REVIEW
not end with successful completion of projects. Even with similar approach, Mumbai’s SRS failed to retain the actual purpose of model. The percentage of ineligible users reported under SRS in Mumbai is more than 50 per cent. Mumbai’s SRS immensely lacked monitoring and post occupancy vigilance, thereby failing the city’s most acclaimed model.
CONCLUSIONThe unending housing shortage in Indian housing market is due to the inability to forecast the uncertain challenges of formulated policies or projects. Exclusion of beneficiaries in crucial stages of planning and relocation process will never result in planned and desired outputs for them. In the name of social cause and development, they are forcefully relocated in distress. The best example showcased in the paper is rehabilitation housing model, where the beneficiaries are ready to leave the allotted site after the issuance of property rights. In case of government subsidized model, even after receiving adequate services, due to lack of incremental opportunity in unit design and improper post occupancy measures, high share of rental component used by ineligible users is witnessed. Therefore, the failure of sustaining the outreach in public housing for poor is not attributable only to lack of understanding of end user needs, but also to lack of monitoring and post occupancy measures.
Private sector based model has proved better performance in comparison to others. But the longer commuting costs and higher
purchase affordability are pulling the large sections of poor from purchasing house under private model, despite the evidence of improved quality of life among existing users. Curbing the challenge of speculative investments is a difficult but imperative task. Government support in obtaining developable land for markets or PPP models with proper post occupancy vigilance can yield results. Apart from PPPs, the lack of awareness regarding private projects is also a major cause for it to lag behind. Market tie up with organizations like Griha Pravesh can create awareness of the potentials of the model, to intended beneficiaries.
To conclude, a piece meal approach resolving the housing shortage for the entire pie of urban poor in India is impossible. Every model discussed, serves distinct beneficiaries, from slum dwellers to economically weaker sections to lower income groups. The solution lies in each individual model being prepared to address any of the mentioned challenges, rather than in naïve optimism. Without the efforts of sustaining the housing models for the poor, housing shortage with growing population trends might take ages or stay impossible forever to resolve. So it is now for the government, developers and beneficiaries to answer-will the efforts made for the poor continue to remain futile or worthwhile?
REFERENCESAnnez, P. C., A. Bertaud, et al. (2010).
Working with the Market: Approach to Reducing Urban Slums in India, World Bank.
Batra, L. (2009). A Review of Urbanisation
and Urban Policy in Post-Independent India. New Delhi, Centre for the Study of Law and Governance.
Gan, Q. and R. J. Hill (2008). Measuring Housing Affordability: Looking Beyond the Median. Social Science Research Network, Australian School of Business.
Hingorani, P. (2011). Housing Solutions: A Review of Models. Revisiting Upgrading: Low-Income Housing and Infrastructure, Mysore, IIHS.
KPMG (2014). Decoding housing for all by 2022, KPMG & NAREDCO,.
Mahadevia, D., A. Datey, et al. (2013). Foisting Mass Housing on the Poor: Lessons from Social Audit of BSUP. Ahmedabad, Centre for Urban Equity.
MHUPA (2012). Report on Technical Group on Urban Housing Shortage (2012-2017). M. o. H. a. U. P. Alleviation. New Delhi, Government of India.
MHUPA (2013). Model State Affordable Housing Policy for Urban Areas. New Delhi, Government of India.
Monitor (2013). State of the Low-Income Housing Market:Encouraging Progress & Opportunity to Realize Dreams of Millions. A. Agarwal, V. Jain and A. Karamchandani.
Nair, S. (2015). Govt’s flagship project ‘Housing for All’ to be unveiled by PM Modi soon, income cap up to Rs 6 lakh The Indian Express. New Delhi.
Patel, S., R. Sliuzas, et al. (2015). "The risk of impoverishment in urban development-induced displacement and resettlement in Ahmedabad." Environment & Urbanization27(1): 1–26.
Task Force (2012). Task Force on Promoting Affordable Housing. M. o. H. a. U. Development. New Delhi, Government of India.
The Registrat General of India (2011). District Census Handbook. C. o. India. New Delhi, Government of India.
UN-HABITAT (2008). Housing the Poor in Asian Cities. Bangkok.
Under Section-3 of the Slum Area Improvement and Clearance Act, 1956, slums have been defined as mainly those residential areas where dwellings

26 | HUDCO - HSMI Publication
POLICY REVIEW
are in any respect unfit for human habitation by reasons of dilapidation, overcrowding, faulty arrangements and designs of such buildings, narrowness or faulty arrangement of streets, lack of ventilation, light, sanitation facilities or any combination of these factors which are detrimental to safety, health and morals. As per UN Habitat, a slum is characterized by lack of durable housing, insufficient living area, and lack of access to clean water, inadequate sanitation and insecure tenure.
Analyzed from Census of India: H-series, 2015.
DU cost in Rehabilitation housing (BSUP by AMC) is around 2.5 lacs.
From field survey,2015.
Interview with Resident Welfare Association (RWA) chairman at Chandkedha site, Ahmedabad, Gujarat; to understand the profile of allottees who left the housing unit for rent, 15 April,2015.
DU cost paid by an allotted HH in Government Subsidized Model is INR 105,000 and total unit cost in the modelis around 2 to 2.5 lacs.
1RK-One Room Kitchen with an average area of 28 sq.m and 1BHK-One bedroom Hall Kitchen with an average area of 43 sq.m
“Largely, residents working in GIDC estates
(located in periphery) or any other close by establishments prefer living here. This is one of the reasons for building mixed income housing in periphery of city” claimed by respondent in Interview with chairman of Navjivan Apartment, Ahmedabad, Gujarat, 17 April 2015.
Purchase affordability, stated by Gan and Hill in Measuring Housing Affordability, 2008 estimates whether the household can gather enough funds to purchase the house.
Repayment affordability, stated by Gan and Hill in Measuring Housing Affordability, 2008 measures the stress on the household to make its mortgage payments.
General Guidelines for Submission of Articles
1. The paper should be created using a word-processing program (such as Microsoft Word) and should be between 3,000 and 5,000 words in length. The file may be in .docx or .doc format.
2. The paper is typewritten, double-spaced, and formatted to print on 8.5” x 11” (or A4) size paper. It is written in the third person in a clear style, free of jargon.
3. The first page of the article includes the following:i. the paper’s title andii. an approximately 200-word
abstract that emphasizes the paper’s contribution to the field and its practical architectural/ planning social/ economic implications.
iii. the name(s), position(s), professional or academic affiliation(s), and email address(es) of the author(s), as well as the full postal address of the corresponding author;
4. The body of the paper should include the following:i. an introduction to the subject,ii. background information,iii. discussion of procedure,iv. results,v. conclusions,
vi. implications for practice and advancement of research,
vii. references,viii. acknowledgments (optional;
if funding for the research was received from non-personal sources, the sources must be identified in this section), and
ix. an autobiographical sketch.5. Please ensure that:
i. References are complete, have been arranged alphabetically by author surname and checked for accuracy.
ii. Reference citations in the text are referred to by author name and year. If there are more than two authors, the name of the first author followed by “, et al.” has been used.
iii. References contain the following information, in the order shown: names of all contributing authors (last name followed by first initial), date of publication, title of article, names of editors (edited books only), title of journal or book, volume and issue numbers (journals only), location and name of publishing company (books only), and inclusive pages (journals and articles in edited books).
iv. Figures/ pictures/ graphs submitted are:a. Large enough to be readable
when reduced to fit the journal
page size (approximately 5.25” x 8.25”).
b. A brief caption is provided for each figure/ picture/ graph.
c. The figure is cited in the text.d. Please ensure that scanned
images are of a high resolution to ensure good quality printing (not less than 640 x 480)
v. All tables are included either in the original manuscript file or as a separate Microsoft Word document and have been checked to ensure that they can be easily reproduced on the journal page size approximately 5.25” x 8.25”).a. A brief caption is provided for
each table.b. The table is cited in the text
6. If your paper is accepted for publication, you will be provided with information on where to send the hard copies of any figures if required.
7. The manuscript and any table/picture files should be sent via email to [email protected]. ONLY original works neither published nor under review elsewhere will be considered.

THEME PAPERS
October 2015 Volume 16 No. 2 - SHELTER | 27
Safety and Security Based Evaluation of Pedestrian
Facilities Around Public SpacesTo achieve sustainable transportation, pedestrians need to be given due priority. The infrastructure for pedestrian movement has to be provided extensively on the entire network of a city. The lack of infrastructure acts as a deterrent to perform walk trips even for a short trip length and leads to safety hazards. The percentage of pedestrians dying in road accidents is a testimony to this fact. In India, more than 50 per cent of the fatal accidents involve pedestrians.
To improve the share of walk in the overall modal split of a city and reduce the road accidents involving pedestrians, spaces should be designed for human convenience and have to be qualitatively suitable to the needs of human beings. Pedestrian level of service is a concept used to evaluate a pedestrian space and serves as a design guide for development of standards for pedestrian facilities. The planning and design methods for pedestrian, as suggested by many researchers, are based primarily on vehicular traffic flow theory. However, additional environmental factors that contribute to the walking experience and therefore to the perceived level of service, such as comfort, convenience, safety, security and attractiveness, should also be considered. This paper proposes an alternative planning technique that is flexible and enables user needs (safety parameters) to be incorporated into design considerations. The qualitative
level of service model incorporates the perception and need of the pedestrians explicitly.
INTRODUCTION
In India, space allocated for roads in urban areas has been increasing over the years. Road network increased from 0.4 million kilometers in 1951 to 4.7 million kilometers in 2011. Similarly, for Delhi, the road network increased from 14,316 kilometers in 1981 to 28,508 kilometers in 2011. However, this increased road length keeps inspiring the usage of personalized vehicles and has resulted in the reduction of the trips made by non-motorised transport, including pedestrians. Development of pedestrian facilities plays an important role in making public spaces active and vibrant.
City size plays a significant role in deciding the modal split i.e. trips made by various modes including non-motorised, personalized motorized and public transport. Figure 1 presents the interrelationship between city size and modal split for 15 selected cities of India, including Delhi. The modal split presented here is for two categories i.e. for motorized trips and non-motorised trips.
KEYWORDS
Dr. Purnima Parida([email protected]) works as Principal Scientist in the Transport Planning Division of CSIR-Central Road Research Institute, New Delhi. Dr. Mukti Advani is working as Scientist in the same division of CSIR-CRRI. Dr. M Parida is MoRTH Chair Professor, Indian Institute of Technology Roorkee.
DR. PURNIMA PARIDA
DR. MUKTI ADVANI
DR. M PARIDA
For sustainable transportation system, the share of public transport and non-motorised and walk mode has to be enhanced. Every trip made by public transport essentially begins/ ends with a walk trip. So, to achieve sustainability the walk environment needs to be made safer.

THEME PAPERS
28 | HUDCO - HSMI Publication
Figure 1: City area and modal split of motorized and non-motorised trips
Source: MoUD, 2008
It can be observed from figure 1 that with increase in city area, share of non-motorised trips is decreasing. Therefore, it becomes very important to understand the reasons behind low amount of non motorised trips in large cities like Delhi.
Pedestrian movement forms an important part of non-motorised mode, but it is not getting due recognition. Pedestrians have been thrust into the background as ever-increasing vehicular demand calls for widening of roads for motorised vehicles. Ideally, the limited road space has to be shared between all road users but the reality is completely opposite. Motor vehicle population in the urban areas is rising, calling for a need to widen roads, construct flyovers, freeways etc., disregarding completely the needs of pedestrians. Competition on a common route by users of different type or with different purposes works to the disadvantage of the most vulnerable users i.e., pedestrians. In the megacities of India (population more than 8 million), 30 per cent of the trips are made by NMT, 50 per
cent by PT (both formal bus systems and informal bus systems, tempos) and rest are by Personal Motorized Vehicles (PMV) i.e. cars and two wheelers. But even these cities lack a complete pedestrian infrastructure. Pedestrian facilities have been identified as an important aspect of Smart City proposals. In this paper an attempt has been made to understand the importance of safety and security parameters for design of pedestrian infrastructure.
DEVELOPMENT OF QUALITATIVE LEVEL OF SERVICE MODELWith a view to achieving the above objectives of the study, 12 locations were selected for qualitative assessment of the sidewalk facility. The locations were selected on the basis of varying sidewalk widths, pedestrian volumes and spatial distribution in the city of Delhi. For qualitative assessment of the safety aspect of sidewalk facilities, a questionnaire-based survey was conducted.
One of the common devices for psychological measurements is the numerical rating scale. The rater is simply given a set of ordered categories or intervals; each associated with a numerical rating and is asked to place the object of judgment in the most appropriate category or at the most appropriate point on a graphic scale. His rating is then taken to indicate the amount of psychological characteristics he perceives in the object. The rater may be given a graphic scale consisting of a straight line marked off into seven equal intervals. On the boundaries between the intervals may appear the number 1 through 6. Some times the rater is simply presented with such a scale, and his ratings are treated as the amount of psychological characteristics shown by the objects. The implicit assumption is made that the rater is able to translate their perception of the object, directly into a number.
A simple assumption made in collecting and analyzing rating data is that of equal-appearing intervals. The rater is told explicitly that the intervals into which the rating, scale is divided should be psychologically equal. That is, the rater is to adopt the attitude that an object rated exactly 1 is psychologically just as different from an object rated 2 as the object with rating 2 is from an object rated 3. The assumption is that the rater can indeed hold this instructional set in mind and can assign objects accordingly. In assigning any given object along the scale, the rater is presumed to compare the perceived status of the object to the idealized values represented by the boundaries of the equal intervals. Furthermore, it is assumed that if variability

THEME PAPERS
October 2015 Volume 16 No. 2 - SHELTER | 29
occurs among the ratings of a given object across a group of judges, this variability reflects disagreements about the status of the object but does not reflect any disagreement about the boundaries of the intervals into which objects may fall.
RESEARCH METHODOLOGYPedestrian level of service indicates the environmental qualities of a pedestrian space and serves as a guide for development of standards for pedestrian facilities. Pedestrian spaces need to be designed in consideration of human convenience and have to be qualitatively suitable to the specific requirements of human beings. The planning and design methods for pedestrians suggested by many researchers are based primarily on vehicular traffic flow theory. Additional environmental factors that contribute to the walking experience and therefore to the perceived level of service, such as comfort, convenience, security and attractiveness, should also be considered. The qualitative method of developing level of service models incorporates the perception and need of the pedestrians implicitly. The pedestrians are asked to identify their requirements i.e., importance of various attributes of the sidewalk. The pedestrians of various age groups and gender have different needs and they are neglected in conventional methods. In qualitative approach of developing level of service all these factors are taken care of.
In this paper, psychometric method has been adopted to develop relative weights of five attributes of sidewalk facilities and satisfaction rating of pedestrians. Twelve locations
for qualitative assessment of the sidewalk facility were selected in the city of Delhi. The locations were selected on the basis of varying sidewalk width, pedestrian volumes and spatial distribution in Delhi. For qualitative assessment of the sidewalk facilities a questionnaire-based survey was conducted. The pedestrians using the sidewalk facility were asked a set of questions; with a view to ascertain the level of service they are experiencing by using the particular sidewalk facility.
For qualitative evaluation of pedestrian facilities a proforma was designed using rating scale concept. The initial stage of this method involved the identification of parameters for inclusion in a questionnaire, reflecting the important aspects of level of service experienced by pedestrians. Five broad parameters were identified to be included in the questionnaire. Out of these, three parameters pertain to the physical evaluation of the sidewalk facility, like sidewalk width, sidewalk surface and obstruction. The other factors were security and comfort of users. An equal number of male and female pedestrians were asked to rate both the importance (how important good performance is to them) and performance (indicating “bad” or “good” condition) on a five-point scale. Detailed description of all the factors is given below.
User characteristics for Sidewalks• Security: The feeling of being
safe is the most important governing factor. A pedestrian should feel safe during the day as
well as at night. Characteristics of this factor include provision of adequate street lighting, police patrolling during the night time, sufficient activities in the surrounding areas etc.
• Comfort: A pedestrian needs to be protected from the inclement weather like harsh sun and rain. The trees protect the pedestrians but if planted in an unplanned manner also act as an obstruction. The location of trees and the species needs to be carefully selected. The curbs have to be mountable so that they can be climbed up and down easily. Provision of chairs /benches and rest rooms adds to the comfort of pedestrians.
Physical Characteristics of Sidewalks
• Footpath surface: a smooth surface without any cracks or bumps for comfortable walking.
• Footpath Width: a measure in meters of the width of the sidewalk available to the pedestrians.
• Obstructions: The obstruction can be an electric pole, tree, garbage bin and hoardings. The number of obstructions per kilometer of the sidewalk was assessed.
Survey Locations
The details of locations for qualitative survey are given in Table 1.

THEME PAPERS
30 | HUDCO - HSMI Publication
Table 1: Details of locations for pedestrian survey
Table 2: Relative weights for sidewalk attributes
S.No. Location Land use Type1 CRRI Okhla Tank Institutional +Residential2 AIIMS Institutional3 Azadpur Commercial4 Ashram Residential5 Janakpuri Residential6 ITO Public- Semi Public7 Connaught Place CBD8 Hauz Khas Institutional +Residential9 Vivek Vihar Residential
10 Rohini Residential11 ISBT, Ajmeri Gate Terminal12 Shahadara Residential + Commercial
SURVEY EXECUTIONSimple random sampling strategy was employed to select a respondent from the pedestrian stream. The survey was conducted on working days from 6.00 am to 10.00pm, to capture people using footpath for various purposes. The data so obtained was used to ascertain importance and satisfaction rating of each attribute. The weights assigned to ‘Importance’ and ‘Satisfaction’ were employed to rate qualitative level of service of sidewalks.
Onsite assessment of thirty sidewalk
facilities was carried out by the authors in various locations spatially distributed all over the city of Delhi. On the basis of the weights achieved from primary surveys and the scores assigned by this onsite assessment, attitudinal scores have been estimated for these locations.
ANALYSIS OF PEDESTRIAN RESPONSEThe response of male and female pedestrians was analyzed separately to study the difference in mean relative weights and satisfaction rating for
different parameters of sidewalks. It is possible to estimate frequency of male and female respondents with respect to the different weights assigned for the sidewalk parameters and then compare these values. Similarly for the five identified categories of satisfaction rating, percentage response of male and female respondents can be compared. Mean relative weight is a representation of aggregate value, and it might undermine the effect of microscopic variation in response of male and female pedestrians within subcategories. A detailed comparison of responses for relative weights and satisfaction rating has been presented below.
Response to importance attached by pedestriansResponses of male and female pedestrians were compared on five point scale i.e. from immaterial to extremely important. Percentage responses for all the five points were compared and difference was estimated. Finally, mean weights were calculated for male and female pedestrians separately. The attribute- wise comparison of response towards importance level
Attribute Width Surface Obstruction Security Comfort
Score M F M F M F M F M F
Immaterial 19.8 27.1 22.4 18.2 13.6 19.1 29.3 9.3 17.1 15.1
Least Imp 25.1 19.1 26.4 34.2 23.3 22.2 17.1 16.9 20.9 16.4
Important 19.6 17.3 18.4 16.0 28.2 24.4 13.3 17.3 18.0 22.2
Very Imp 16.2 15.6 15.8 18.2 21.8 17.3 19.1 23.6 22.9 18.7
Extremely Imp 19.3 20.9 16.9 13.3 13.1 16.9 21.1 32.9 21.1 27.6
Mean weight 2.9 2.8 2.8 2.7 3.0 2.9 2.9 3.5 3.1 3.3M-Male, F- Female

THEME PAPERS
October 2015 Volume 16 No. 2 - SHELTER | 31
of parameters is presented in Table 2. The mean weights were almost similar for all the attributes except for security, where importance attached is more by the females than males. The mean weight assigned by females to security is 3.5, while the corresponding figure for males is 2.9. Since the sample size was small, this difference is statistically not significant. In India, females generally do not venture to go out alone during night hours, or at the places which are relatively unsafe, still security plays large in their mind.
Response to satisfaction rating by pedestriansThe response of males and females pertaining to satisfaction rating of five parameters were compared on a five point scale and the results are given in Table 3. Females seemed to be more satisfied than their counterparts in terms of physical factors, but for user factor, security, they were more dissatisfied. It can be inferred from this response that women are ready to compromise with physical parameters but not with security and comfort.
Table 3: Satisfaction rating for sidewalk attributes
Attribute Width Surface Obstruction Security Comfort
Rating M F M F M F M F M F
Poor 10.7 8.0 17.6 10.7 30.4 22.7 28.7 36.9 26.4 30.2
Satisfactory 29.8 22.7 29.3 28.9 21.8 20.9 14.9 20.9 23.6 26.7
Good 25.6 23.1 16.2 24.0 17.8 16.0 21.3 18.7 28.0 16.0
Very Good 16.9 20.9 18.4 20.4 13.6 16.0 11.1 15.1 13.8 16.0
Excellent 17.1 25.3 18.4 16.0 16.4 24.4 24.0 8.4 8.2 11.1
Mean weight 3.0 3.3 2.9 3.0 2.6 3.0 2.9 2.4 2.5 2.5
M-Male, F- Female
Security and female pedestriansFemale pedestrians assign higher weightage to security and comfort. A comparison of relative weightage for all the five parameters indicates, male and female responses are quite different for “security”. Female users avoid using transport services after evening hours indicating security issues associated with this service. Mean weight for satisfaction rating for “security” is lower for female pedestrians in comparison to male pedestrians. Even though the difference in response of male and female pedestrians was not significant for width, surface, obstruction & comfort, the same was pronounced for “security” as a design element of sidewalk. Efforts need to be undertaken to enhance “security” of female users, besides other qualitative parameters. Deployment of video surveillance system in Smart City Program can be a potential solution to enhance security of pedestrians in general and females in particular.
LEVEL OF SERVICE (LOS) OF SIDEWALK LOS describes the adequacy of
pedestrian facilities and has been evolved utilizing the five factors affecting pedestrian LOS. LOS A provides best walking conditions for pedestrians in terms of wide sidewalk, good surface quality and separation from fast moving vehicles. LOS E is the opposite end of the scale and may depict narrow sidewalks, encroachment, unpleasant walk environment, and potential of conflict with motorized vehicles. With this background, the following five Levels of Service have been worked out for design of sidewalks:
i) LOS A is a pedestrian environment where ideal pedestrian conditions exist and the negative factors affecting pedestrian LOS are minimal.
ii) LOS B indicates that reasonable pedestrian conditions exist but still small numbers of factors have impact on pedestrian safety, security and comfort. As LOS A is the ideal, LOS B is an acceptable standard.
iii) LOS C indicates that basic pedestrian conditions exist but a significant number of factors have impact on pedestrian safety, security and comfort.

THEME PAPERS
32 | HUDCO - HSMI Publication
iv) LOS D indicates poor pedestrian conditions and the factors that negatively affect pedestrian LOS are wide-ranging or individually severe. Pedestrian comfort is minimal and safety and security concerns within the pedestrian environmental are evident.
v) LOS E indicates that the pedestrian environment is unsuitable. This situation occurs when all or almost all the factors, affecting pedestrian LOS are below acceptable standards.
The satisfaction rating for all the five attributes was multiplied by the relative weight assigned to each attribute. The total weighted score have been calculated for all the thirty locations. Mean of the scores was found to be 56.6 and standard deviation 11.6. After the calculation of total weighted scores grading of sidewalks has been carried out to define five ranges representing five different LOS. Initially, grading has been worked out taking mean and standard deviation as two reference figures. Mean plus one standard deviation has been defined as the upper limit and any score above this shall qualify for LOS A. The lower limit, is mean minus twice
standard deviation. Any score less than this shall be designated as LOS E. For LOS B to LOS D, an interval with a range equal to one standard deviation has been used. With this scheme more than 50 percent locations were qualifying for LOS A and B for the 30 sidewalks selected for onsite assessment. It is desirable that locations in LOS A, LOS B and 50 percent of LOS C should lie within 50 to 60 percent. In view of this, the intervals for cumulative scores were marginally modified. These grading schemes are indicated in Table 4 and Table 5.
The 30 locations were distributed in various LOS and is shown in Table 4. Out of 30 locations 15 fall in the Level of Service A and B, while remaining
Table 4: Grading scheme for defining LOS
Table 5: Qualitative LOS scale for sidewalks
Mean = 56.6, Standard Deviation=11.6
Mean = 56.6, Standard Deviation=11.6
LOS Cumulative Score
No. of Sidewalks Cumulative Score
No. of Sidewalks
A >68.2 3 > 70 4
B 56.6– 68.2 12 60-70 11
C 45– 56.6 10 50-60 7
D 33.4– 45 3 40-50 5
E <33.4 2 < 40 3
Range LOS No. of Locations % age
> 70 A 4 13
60 – 70 B 11 37
50 – 60 C 7 23
40 – 50 D 5 17
< 40 E 3 10
Total 30 100
50 per cent fall in LOS C, D and E. It implies that still much needs to be done to enhance the safety and security of the pedestrians.
For sustainable transportation system, the share of public transport and non motorized and walk mode has to be enhanced. Every trip made by public transport essentially begins/ends with a walk trip. So to achieve sustainability, the walk environment needs to be made safer.
COMPARING QUALITATIVE AND QUANTITATIVE LOSBesides employing a qualitative evaluation strategy videographic studies were undertaken for a sample at five locations (details in Table 6). This videographic pedestrian flow data was analyzed to extract macroscopic flow parameters such as speed, flow and density. Quantitative Level of Service was worked out with a conventional macroscopic modeling approach, which is similar to vehicular stream flow modeling. For these five locations, qualitative evaluation of pedestrian facilities was also undertaken. A comparison of level of service by quantitative and qualitative approach for all the five locations is given in Table 6, which indicates that quantitative

THEME PAPERS
October 2015 Volume 16 No. 2 - SHELTER | 33
LOS is always higher than qualitative LOS. Quantitative LOS model tend to neglect the effect of subjective sidewalk attributes such as walk environment, safety, security, comfort etc. This comparison indicates that qualitative service models are more efficient in evaluating sidewalk facilities since they use large number of attributes, are policy sensitive and take cognizance of human experience with physical environment.
CONCLUSIONIn this study, rating scale method was employed for assessing the importance attached and satisfaction rating of sidewalk safety and security attributes by the pedestrians. Pedestrians were asked to undertake both the satisfaction rating (indicating poor, satisfactory, good, very good and excellent condition) and importance (immaterial, least important, important, very important and most important) on a five-point scale. Mean relative weights for five attributes have been estimated from pedestrian response for the locations selected for this study. The importance ratings were called weights attached to the parameter. The weights assigned to each parameter were multiplied to
Table 6: Comparison of quantitative & qualitative LOS for sidewalks
Location Peak Flow Footpath width in Mts. Quantitative LOS Qualitative LOS
Ashram 792 2.5 A C
ITO 1992 5 A A
CP 4248 4.5 C B
ISBT 1651 1.4 C D
AIIMS 1462 2 B D
corresponding satisfaction rating of the same parameter to arrive at Walkability Index (WI).
This method can be used in grading a pedestrian facility in terms of safety and security attributes. The model developed in this study can predict changes in walkability index as a function of changes in design parameters. The LOS model presented in this paper can be used for similar projects of sidewalk improvement. Improving safety and security of pedestrian facilities can contribute towards higher share of walk mode and consequently enhance patronage of public spaces in cities.
REFERENCES Appreciation of Gender Difference in
Development of Qualitative Level of Service for Sidewalks, Dr Purnima Parida & Dr M Parida published in 4th International conference on Women Issues in Transportation, Transportation Research Board of the National Academy, USA, 2011.
Development of Qualitative Walkability Measures for Pedestrian Facilities in Delhi, Dr. Purnima Parida and Dr. M. Parida, Presented at Transforming Transportation, World Bank Washington, D.C. Jan. 2009 (Available at www.slideshare.net/../modeling-qua l i t at ive- le ve l -of - s er v ice- for-sidewalk)
MOUD (2008), “Study on Traffic and Transportation Policies and Strategies in Urban areas in India”, Ministry of Urban Development, Government of India, New Delhi, May 2008.
Parida, M., Jain, S.S. and Bhavanarayana, K. (2001), “A Level of Service Concept for Capacity Analysis of Stairways”, Urban Transport Journal, Institute of Urban Transport (India), Vol. 2, No.1, March, pp. 74-92.
Parida, Purnima (2006), “Planning, Design and Operation of Pedestrian Facilities in Delhi”, unpublished Ph.D. Thesis submitted to Department of Architecture & Planning, Indian Institute of Technology Roorkee, Roorkee.
Sarkar, Sheila (2002), ”Qualitative Evaluation of Comfort Needs in Urban Walkways in Major Activity Centers”, Transportation Research Record, Annual Meeting 2003.
Sharan, G. (2001), ”Pedestrian Safety – Role of Indian Roads Congress”, Proceedings of National Conference: Neglected and Vulnerable Road User – The Pedestrian, IRTE, New Delhi, pp. 159-160.
Veeraraghavan, A. (1991), ”Design of Pedestrian Sidewalks Based on Level of Service Criteria”, Highway Research Bulletin, No-45, pp. 61-75.

34 | HUDCO - HSMI Publication
THEME PAPERS

October 2015 Volume 16 No. 2 - SHELTER | 35
Developing Community Spaces & Bringing Community Together
THEME PAPERS
All text and images have been provided by Aga Khan Trust for Culture. For further details please contact Archana Saad Akhtar ([email protected])Programme Officer-Design and Outreach, Aga Khan Trust for Culture, New Delhi. View of Humayun’s Tomb from Hazrat Nizamuddin Basti
The Humayun’s Tomb – Nizamuddin area in Delhi has continuously evolved and been inhabited since the 13th century. Over the past 700 years, a profusion of monumental tomb building occurred in close proximity to the Dargah of Hazrat Nizamuddin Auliya, a revered Sufi saint. Here, the Aga Khan Trust for Culture (AKTC) commenced a major urban renewal initiative spread across 224 acres following a 2007 MoU with the Archaeological Survey of India (ASI), Central Public Works Department (CPWD) and the Municipal Corporation of Delhi (MCD, now SDMC).
To address the needs of a distinctive urban area, the Nizamuddin Urban Renewal Initiative commenced with the triple objectives of conservation of built urban heritage, environmental development of water features and open spaces and improving the quality of life for the resident communities – whose most significant asset remained their built and living cultural heritage. Since 2007, a multi-disciplinary team has worked with local communities to fulfil these objectives.
AGA KHAN TRUST FOR CULTURE, INDIA

THEME PAPERS
36 | HUDCO - HSMI Publication
For over 700 years the Hazrat Nizamuddin Area has boasted of a superior living culture that not only led to the construction of grand mausoleums, mosques, step-wells, garden’s in this area but also creation of cultural traditions of music, poetry, food, rituals that have defined both Hindustani culture and Sufi traditions.
Today, recognized as the densest ensemble of medieval Islamic buildings in the country the area is home to a large population with a significant number of families tracing their descent to the revered Sufi saint, Hazrat Nizamuddin Auliya, whose Dargah remains at the heart of the settlement. Humayun’s Tomb and several other grand garden-tombs were built in the vicinity as it is considered auspicious to be buried near a saint’s dargah.
Hazrat Nizamuddin Auliya’s teachings of love, pluralism and tolerance are as relevant today as they were seven hundred years ago. Despite seven centuries of cultural heritage legacy, a socio-economic survey conducted at the onset of the project revealed shockingly poor development parameters across health, education, employability, sanitation, urban infrastructure, amongst the families resident here. To address these issues, the project has coupled conservation with socio-economic initiatives aimed at improving the quality of life for residents.
In keeping with the Aga Khan Historic Cities Programme
Structured community spaces Creating cultural venues Improving urban services
Nizamuddin urban renewal initiative project area.
philosophy, it was clear that conservation measures here would require a people centric approach with a multi-disciplinary and multi-pronged approach addressing needs listed on the millennium development goals. The project has since demonstrated ‘CULTURE AS A TOOL FOR URBAN DEVELOPMENT ’.

October 2015 Volume 16 No. 2 - SHELTER | 37
The Hazrat Nizamuddin Basti remains one of the most densely populated settlements in Delhi. Although five acres of parks have existed for some time, the spaces were occupied by rag-pickers and drug dealers. Only two percent of the resident population were accessing park spaces. Following sustained community consultation, a landscape scheme for these parks was prepared and implemented. Parks have been developed for specific uses, such as a children’s play area, a screened park for the exclusive use of women, a park for community events and a play field for youth-related activities. The parks, becoming ‘lungs’ providing fresh air to the residents, are now managed by the community with AKTC support.
Open Space Development1.
Before
Before
After
After in 2009 Now
The Outer Park is now regularly used for the Basti Mela and outdoor sports events.
Ensuring Safe Positive Spaces for Community Use
THEME PAPERS

38 | HUDCO - HSMI Publication
Urban Improvements 02.Rehabilitation of civic open spaces seeks to enhance the area’s value and significance in terms of history, places of spiritual importance and recreation. In 2009, physical surveys were carried out to document and analyze the urban setting, prepare urban design guidelines and identify possibilities for street improvements and potential model projects. As a result, carefully designed street improvements have been implemented by the SDMC with technical assistance and supervision by AKTC on all Basti streets.
Aesthetic, Sustainable and Participatory
Developing Historic Neighbourhood & Rehabilitation of Civic Spaces
Water Points
Street Improvements Urban Spaces
Community Activities
(Left) Musafirkhana Roundabout in 2009; (Right) Om Pal, the Basti artist working on the roundabout; (Below) Musafirkhana roundabout now.
THEME PAPERS

October 2015 Volume 16 No. 2 - SHELTER | 39
Enabling Recreation & Reviving Arts
Though densely populated and built up, the Nizamuddin Basti still retained segregated open spaces along the periphery. These were however, poorly kept and neglected thereby, becoming unusable. Coupled with conservation and landscaping works in 2010, Mirza Ghalib’s tomb has now become a cultural venue hosting mushairas and poetry recitals. Similarly, the forecourt of the 16th century Chausath Khamba, which remains one of the largest open spaces in the Basti, has been landscaped to serve as a performance venue for the Jashn E Khusrau, an annual festival celebrating the legacy of Hazrat Amir Khusrau, who created Qawwali music traditions. Other events such as Dastangoi, exhibitions, theatre performances, workshops, book fairs have also been held here. These cultural events and melas attract many first time visitors to the Basti.
Young heritage volunteer from Sair E Nizamuddin youth group from Hazrat Nizamuddin Basti conducting heritage walks for tourists coming here
Creating appropriate spaces for community use: A park for exclusive use by women, called the Zenana Bagh, has been developed to encourage leisure activities centred on women.
Mirza Ghalib’s Tomb serves as a cultural hub after its restoration in 2010
Reclaiming Community Places 03.
Chausath Khamba forecourt in 2009
THEME PAPERS

40 | HUDCO - HSMI Publication
The annual fair, Apni Basti Mela, celebrates more than 700 years of history and continuous living culture of Nizamuddin through showcasing craft skills, built heritage, music traditions, food and oral history of the local communities.
The Mela provides an opportunity to the craft and food based SHG’s from Basti, created as a part of the livelihood component of the project, to exhibit and sell products directly to customers and get first-hand feedback. Through efforts such as the ‘Apni Basti Mela’, the project has attempted to restore the cultural identity of the Basti and instill a sense of pride in the residents. The event also provides an opportunity for many first-time visitors to the Basti.
Providing Platform for Arts & Culture04.THEME PAPERS

October 2015 Volume 16 No. 2 - SHELTER | 41
In addition to the millions of annual pilgrims who visit the Dargah, the initial surveys revealed that 19% of resident families did not have toilets in the home. Two community toilets have now been built providing a clean and safe facility, especially for women, separate bathing and washing areas and child-friendly seats. A management group comprising of users has been established.
Constructing Community Toilets
• 57% of the community expressed need for better sanitation• Group discussions revealed that out of the two community toilets only one was operational and was poorly maintained limiting access to safe
sanitation for a quarter of the resident population and the 3.5 lakh pilgrims to the Dargah
• Women felt unsafe and the toilets lacked adequate privacy especially at night; No provisions for children
• For families with no access to toilets, women were forced to bathe in the open or make temporary arrangements within the home
The larger toilet complex has been designed to address bathing and washing needs of both residents and pilgrims along with 30 toilet seats.
Courtyards on either sides of the building allowed for adequate light and cross ventilation. Special provisions were made for children where toilet seats as well as the door heights were designed for children. Two disabled friendly toilets located at the entrance allowed for easy access A community based management group- Rehmat Nigrani Samooh
is responsible for the daily maintenance and upkeep of the toilets. The toilets are managed through a pay and use system and family cards for
residents.
SDMC Community toilet in 2009 - before development works initiated by the AKTC Team.
First floor used as resource centre
SDMC Community Toilet in 2013 - after development works completed by the AKTC Team.
05.THEME PAPERS

42 | HUDCO - HSMI Publication Adapting open spaces for teaching-learning
Bridging the digital divide
Amphitheater created in the SDMC School has provided a platform for various
school plays and art events.
The SDMC school in the Basti today serves as a hub for education. The school needed a major renovation that were designed by specialised architects working with child psychologists, teachers, craftsmen and engineers. Addition of toilets on each floor, installing unbreakable glass in windows, incorporating Building as a Learning Aid (BaLA) elements, considerably improved the learning environment as did the creation of a children’s park on the adjoining DDA land. Physical improvement works coupled with improving infrastructure, activity-oriented classrooms, and enhanced student friendly and safe environment not only led to a vibrant environment in the school , but also encourages school going amongst students.
06. Educational SpacesTHEME PAPERS

THEME PAPERS
October 2015 Volume 16 No. 2 - SHELTER | 43
Designing Urban Public Spaces for Pedestrian Mobility of Elderly Citizens
A Case of Bengaluru City
This paper addresses elderly pedestrian mobility in public spaces of residential neighborhoods taking the case of Bengaluru city. Urban neighborhoods comprise of varied user groups- children, teens, middle aged and elderly, all of whom are vital while planning and designing public spaces. Planning principles must contribute to enhancing pedestrian mobility which tops the transport-pyramid and boosts the last mile connectivity. Public realm design must induce a favourable walking environment for all, after a critical assessment of the physical realities with a multi-faceted perspective of issues involving many components and stakeholders. This research uses Audits (through primary surveys) to gauge the on-ground status of urban spaces under three main aspects; barriers to mobility, crossings and street-amenity interface to evaluate walkability. Accordingly a road map has been formulated in the form of a ‘three-fold strategy’ to address barriers, a ‘visual strategy’ to address crossings and a ‘seamless interface strategy’ for accessing amenities for the benefit of urban designers. Overall a ‘comprehensive pedestrian mobility’ concept with a five-point strategy is proposed encompassing an integrated approach to design for inclusive mobility of the elderly.
Note: This paper has been prepared from doctoral research on the same theme.
INTRODUCTIONBengaluru, the capital of Karnataka and a fast growing metropolitan city, is popularly known as the garden city and pensioner’s paradise. The city, with a population of nearly ten million, is facing the impact of rapid urbanization which is reflected in the
state of its public spaces and streets. Vehicles, infrastructure elements and urban activities are gaining over pedestrian movement for space, resulting in haphazard and non-conducive street profiles. In such a state, one sector of the population – the senior citizens get impacted adversely in terms of mobility. A democratic urban setting, should aim towards an inclusive community and keep up the principle of equity in space allocation.
ELDERLY & MOBILITY CONCERNS‘National Policy on Older Persons’ formulated by Government of India in 2011 defines ‘Senior citizen’ as a person aged 60 years and above. Elderly demographics are increasing at a fast pace in India and all over the world. In 2011, the elderly constituted 10 per cent of population (India Census 2011), emphasizing them as an integral part of the user group. Secondly, there has been a change in social structure from joint family system to nuclear families, requiring the elderly to remain independent. The society has to support them in leading an independent life and carry out daily routine in an amicable manner; be it for socializing, running errands, shopping for needs, medical care or entertainment. According to theory of psychosocial development, this
KEYWORDS
Urban public spaces, elderly, pedestrian mobility, neighborhoods
Dakshayini R. Patil ([email protected]) is Assistant Professor & doctoral research scholar at Department of Architecture, B M S College of Engineering, Bengaluru. Dr. Mamatha P. Raj is Professor and Dean in the same institution.
Walking is the most popular activity amongst elderly, though it comes with constraints because of reduction in speed, reflexes, sensory and motor skills. The physical environment of public spaces has physical and psychological impact on mobility patterns of elderly.
DAKSHAYINI R. PATIL
DR. MAMATHA P. RAJ

THEME PAPERS
44 | HUDCO - HSMI Publication
stage of life comes with a need to lead a confident and assuring life and is characterized by ego-integrity and despair. (Erik Erickson, 1963) Thirdly, effects of aging as natural consequences and accompanied by reduction in overall motor skills make it essential to consider elderly mobility factors. Finally, challenges posed by the urban environment are numerous and leave much to a person’s ability to encounter outdoors and carry out day-to-day activities. Perils of urban falls and accidents due to poor state of public spaces add to woes of not just elderly but other user groups as well. Safe, comfortable and accessible public spaces are the indicators of good urban realm. For elderly, the zone of activity shrinks and becomes dwelling-centric; hence neighbourhood zone is of great concern to support concepts of active ageing or aging–in-place, (WHO 2002).
PEDESTRIAN MOBILITYA barrier-free environment is a space that allows for free and safe movement, function and access, regardless of age, sex or condition (UNNATI, 2004). It is a space or a set of services that can be accessed by all, without obstacles, with dignity and with as much independence as possible. This research aims to achieve a safe and inclusive pedestrian mobility of the elderly in the context of residential neighbourhoods. First objective is to study & analyse three aspects- neighbourhood public spaces, role of overall public realm in determining walkable environments and elderly mobility aspects; and secondly, to evaluate prevailing
on-ground conditions of public spaces by devising an audit method. A strategic road map, which initiates the drive towards achieving an all-inclusive walkable environment in urban public spaces, is the need of the day.
Walking is the simplest and most basic form of movement and exercise. Pedestrian mobility in any modal share is typically high but rarely highlighted. For instance taking the case of- main trip steps involved to access an amenity with a modal share involving one to-&-from bus journey- out of the total 26 steps, number of stages with walking involved is 20 and there are 12 interfaces between street (walking) and amenity. Thus, it is evident that being on-foot or walking is a crucial and major component of the entire trip length share though it remains understated. Walking is the most popular activity amongst elderly, though it comes with constraints because of reduction in speed, reflexes, sensory and motor skills. The physical environment of public spaces also has physical and psychological impact on mobility patterns of elderly.
INSTITUTIONAL FRAMEWORK FOR WALKABILITYThere are policies and bodies in place in India governing transport rules. The National Urban Transport policy (NUTP), 2014 was formulated with the aim of creating a sustainable urban transport network laying emphasis on pedestrian, non-motorized and transit-oriented urban growth. The Twelfth Five Year plan stressed that “NMT should get first priority in infrastructure
development and funding”. Indian Road Congress (IRC) has evolved general principles for pedestrian safety and footpath design.
The said regulations give certain directions towards pedestrian mobility, only in purview of vehicular transport planning as the main objective. But design for pedestrians; elderly & physically challenged, in particular, is not ingeniously dealt with. A complete extensive consideration of many other factors of influence or after-results of certain urban processes such as vehicular traffic, infrastructure locations or waste management is unaccounted for. Understanding these barriers to elderly pedestrians as a result of such processes is essential for a holistic perspective of the issues.
To achieve elderly mobility in residential neighbourhoods, it is essential to understand co-relation between impact of physical realm in public spaces on walkability. Hence, the exercise to assess walkability has been devised with an objective of critically understanding the existing state of public spaces from elderly pedestrian’s point of view.
This assessment is based on primary survey, called ‘Pedestrian Audits’ and comprises of observations and questionnaire/interview surveys. These surveys have been conducted in four predominantly residential neighbourhoods of Bengaluru. The city of Bengaluru is circular in plan with ring roads creating three main zones. The four neighbourhoods studied include Chamarajpete in the first-ring (inner core area); Basavanagudi, Vijayanagar and Govindrajnagar in the second-ring (developing areas) but also

THEME PAPERS
October 2015 Volume 16 No. 2 - SHELTER | 45
on the fringe of third –ring (urban extension areas). (Fig 1) Each study zone is approximately 1.5 sq. km area and displays unique physical and social characteristics (Table 1).
PEDESTRIAN AUDIT METHODSMain drawbacks that a pedestrian’s journey encounters, are the barriers along the path, quality of crossings at various junctions or across streets and finally the accessibility to perform the journey to avail some amenity. Pedestrian audits were conducted to address these barriers through critical observations in the study areas. The three main investigations carried out in this study are given in Table 2. In each study area 12 streets, 5 crossings and 8 amenities were identified and analyzed for these audits. This is illustrated for Vijayanagar in Fig 2.
Fig 1: Study neighborhoods in Bengaluru urban zone on planning district map
Table 1:Profile of study neighbourhoods
SNo. ASPECT Vijayanagar Govindrajnagar Basavanagudi Chamarajpete
1 Conception Planned Organic First planned neighborhood in Bangalore
Partly planned
2 Formation 1960s 1980s 1898 1892
3 Planning principle Spontaneous grid Grid • Grid originally• Spontaneous eventually
• Old- Organic• New- Grid
4 Population Heterogeneous • Diverse• Industrial housing• Newer apartments
• Original inhabitants• Migrants• Varied
• Original settlers• Migrants
5 Social index Medium- low Low- medium Mainly high • Medium to high• Low in inner core
6 Street pattern Mostly dis-continuous
• Mostly Disorganized • Partly Planned • Mostly Old
• Linear • Grid• Traditional fabric
• Mostly Random • Newer grid• Linear/ Narrow
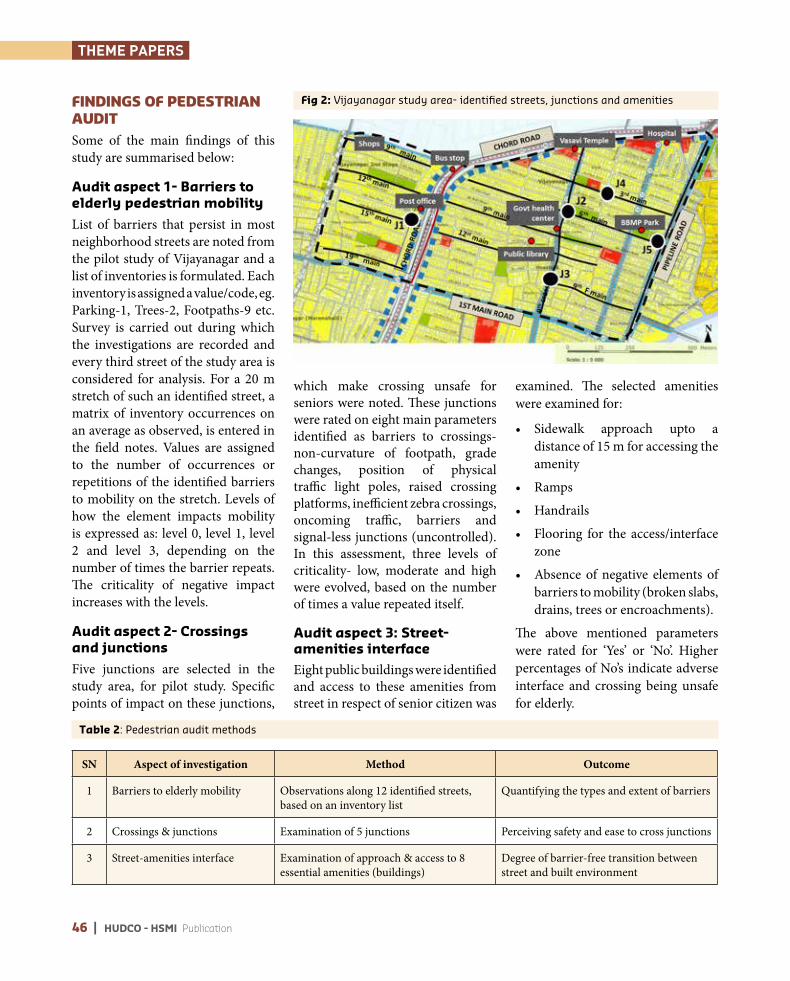
THEME PAPERS
46 | HUDCO - HSMI Publication
Fig 2: Vijayanagar study area- identified streets, junctions and amenities
Table 2: Pedestrian audit methods
SN Aspect of investigation Method Outcome
1 Barriers to elderly mobility Observations along 12 identified streets, based on an inventory list
Quantifying the types and extent of barriers
2 Crossings & junctions Examination of 5 junctions Perceiving safety and ease to cross junctions
3 Street-amenities interface Examination of approach & access to 8 essential amenities (buildings)
Degree of barrier-free transition between street and built environment
FINDINGS OF PEDESTRIAN AUDITSome of the main findings of this study are summarised below:
Audit aspect 1- Barriers to elderly pedestrian mobility
List of barriers that persist in most neighborhood streets are noted from the pilot study of Vijayanagar and a list of inventories is formulated. Each inventory is assigned a value/code, eg. Parking-1, Trees-2, Footpaths-9 etc. Survey is carried out during which the investigations are recorded and every third street of the study area is considered for analysis. For a 20 m stretch of such an identified street, a matrix of inventory occurrences on an average as observed, is entered in the field notes. Values are assigned to the number of occurrences or repetitions of the identified barriers to mobility on the stretch. Levels of how the element impacts mobility is expressed as: level 0, level 1, level 2 and level 3, depending on the number of times the barrier repeats. The criticality of negative impact increases with the levels.
Audit aspect 2- Crossings and junctions
Five junctions are selected in the study area, for pilot study. Specific points of impact on these junctions,
which make crossing unsafe for seniors were noted. These junctions were rated on eight main parameters identified as barriers to crossings- non-curvature of footpath, grade changes, position of physical traffic light poles, raised crossing platforms, inefficient zebra crossings, oncoming traffic, barriers and signal-less junctions (uncontrolled). In this assessment, three levels of criticality- low, moderate and high were evolved, based on the number of times a value repeated itself.
Audit aspect 3: Street-amenities interface Eight public buildings were identified and access to these amenities from street in respect of senior citizen was
examined. The selected amenities were examined for:
• Sidewalk approach upto a distance of 15 m for accessing the amenity
• Ramps
• Handrails
• Flooring for the access/interface zone
• Absence of negative elements of barriers to mobility (broken slabs, drains, trees or encroachments).
The above mentioned parameters were rated for ‘Yes’ or ‘No’. Higher percentages of No’s indicate adverse interface and crossing being unsafe for elderly.

THEME PAPERS
October 2015 Volume 16 No. 2 - SHELTER | 47
Audit-results and comparative analysis
1. Barriers to elderly pedestrian mobility
The cross sections of streets and walkways at strategic points were scanned for the inventory elements that pose barriers to mobility, their occurrence was recorded and the level of criticality was tabulated. (Fig 3)
The same survey was carried out for all study areas simultaneously and values derived were compared. The results of the experiments reveal high impacts & very high impacts at 34 per cent and 47 per cent respectively, for the four study areas. That is, 81per cent urban spaces & streets are neither barrier free nor provide safe and easy pedestrian mobility to elders.
2. Crossings and junctions
The identified crossings at pedestrian frequented junctions were evaluated on the eight parameters in each study area. (Fig 4 & 5). The final results reveal high risk at 68 per cent and moderate risk at 24 per cent for all four study areas as an average score. Thus 82 per cent of junctions or crossings were found unsafe for elderly pedestrians with the identified barriers forcing pedestrians to come on to road and face the traffic. The elderly face major challenge in stepping up and down the footpaths with high and inappropriate kerb heights. In 2013, 50 per cent of fatalities in road accidents were pedestrians (Times of India, 11/01/2014. pg4) and these were accounted for, mainly as elderly and at junctions.
Fig 3: ‘Barriers to mobility’- Vijayanagar 9th main road
Fig 4: Crossings& junction survey- Govindrajnagar, Nagarbhavi main road & Temple Road
3. Street-amenities interface
The elderly f r e q u e n t e d amenities were identified and were audited t h r o u g h obser vat ions for grading the access from street (Fig 6). The assessment revealed that on an average 75 per cent of a p p r o p r i a t e facilities were missing in the study areas, s u g g e s t i n g that elderly (or physically c h a l l e n g e d ) do not have a safe, easy

THEME PAPERS
48 | HUDCO - HSMI Publication
Fig 5: Barriers at junctions- Vijayanagar 18th cross
Fig 6: Street-amenity interface: steep steps, absence of handrails/ ramps, slippery floors
and comfortable transition between streets and amenities (buildings or such). This approach was characterized by poor walkways, barriers due to vehicles, encroachments and activities. Additionally access to some buildings show steep steps, absence of handrails, ramps or lifts.
An analysis of the overall scores of 3 parameters, viz. barriers to elderly pedestrian mobility (81 per cent), crossings (82 per cent) and street amenities interface (75 per cent), reveal that elderly pedestrians are at high risk under these categories of urban public spaces in residential neighbourhood.
Mobility assessmentA structured questionnaire was designed to seek response of the elderly w.r.t elderly attributes and activities and assessment of neighborhood in terms of public spaces and amenities. The questionnaire helps in reaching out to larger numbers of elderly and questions were formulated in an easy to answer manner. Using random sampling technique, the questionnaire was distributed to any two or three households with at least one elderly member in the family, on the identified street for every third such street
in the study zone. The outcome of this assessment is given below:
Reasons for walking: Over 75 per cent conveyed that walking is an exercise and they walk to shop for necessities, run errands or socializing. About 68 per cent respondents walk to bus stops and are frequent users of public transport. Further, 39 per cent respondents say that they need to walk beyond the neighborhood zone and another 35 per cent also walk to work. It was opined that bus stops need to be within walkable distance, well planned and designed, to increase ridership in public transport and promote sustainable urban transportation.

THEME PAPERS
October 2015 Volume 16 No. 2 - SHELTER | 49
Outdoor mobility: About 85 per cent respondents expressed extreme dissatisfaction with the outdoor mobility. This is an alarming figure reflecting the state of urban streets and the walkability index. Unsafe street, at 69 per cent is the prime reason for unsatisfied outdoor mobility, while 31 per cent also quoted health reasons coupled with non-conducive streets, thereby requiring some amount of assisted mobility. 72 per cent also expressed interest in bicycling, if streets permitted the same.
Neighbourhood assessment: The reason for inaccessibility to amenities in the neighborhood was due to poorly placed amenities (72%), longer walking distances (76%), traffic (84%) and unsafe footpaths (73%). Locating amenities is a crucial aspect of neighborhood planning and need to be grouped in clusters within walking ranges. Longer distances demand usage of private transportation which becomes unsustainable and restrict
the accessibility of these amenities to elderly who avoid self-driving due to health reasons and/or financial constraints.
Barriers to walking: Footpaths are the last link in the walkability loop. The overall inputs suggest that footpaths are neglected elements in urban design. Footpaths do not operate in isolation but are connected to other factors such as activities, public realm and surveillance. The encroachment of footpath is a main cause of barriers. The average scores of barriers are indicated as-infrastructure (utilities) – 74 per cent, commercial reasons – 76 per cent (hawkers, hoardings, parking) and civic reasons/ individuals – 60 per cent (debris, stray animals).
RECOMMENDATION FOR A STRUCTURE PLANThe paper addresses poor mobility environments for elderly, as a result of impact ranging from neighbourhood level plan to walkway details. A structure plan
encompassing a range of attributes in a systematic format is essential to initiate pedestrian friendly public spaces for elderly. Hence, strategies under the three aspects of the audits namely; barriers, crossings and interface is suggested for a wholesome approach to the issue.
‘Three-fold strategy’- addressing the barriers to mobilityThe investigations reveal that, on an average, for every 20 m stretch of a street, 26 types of physical barriers (as identified in the study) to mobility exists on Bengaluru neighborhood streets. The number of times these barriers appear on a given street signifies the degree of impact. An integrated outlook on the three categories of inventory elements, which were observed, is essential (Fig 7 & Table 3), since resolving one issue may trigger a fresh problem or in some cases lead to the resolution of another issue.
Fig 7: Three categories of inventory elements

THEME PAPERS
50 | HUDCO - HSMI Publication
Table 3: Categories of elements of barriers to mobility
Sl. No. Elements Relevance Components (Example) Aspects/Issues
1 Necessary elements- that have to be provided
Are essential and importantAre elements of public realm
Footpaths, signage, landscape, street furniture
• Design• Location• Treatment• Durability • Identity • Beauty • Functionality/usability
2 Default elements- that are to be accommodated
Are supporting elements of Infrastructure/ utilities
Infrastructure (power lines, phone lines, drains), traffic, parking, sidewalks, vendors
• Location• Design• Safety • Access to Maintenance • Aesthetics
3 Negative elements- that can be avoided
Are a result/ remnants of various urban processesAre to be controlled/ avoided
Vehicle parking, grade changes, reverse ramps, debris, garbage, hawking activities, stray animals, spill- overs, encroachments
• Order• Location• Regulatory mechanism/ monitoring• Civic sense• Surveillance • Hazards
A three-fold strategy, based on the categories of physical barriers perceived in public spaces is elaborated below:
1. ‘Public realm enhancing’ strategy- Necessary elements
2. ‘Accommodative’ strategy- Default elements
3. ‘Control’ strategy- Negative elements
Under this framework of categorization, first order of design includes provision of the necessary elements to induce a favorable environment for walking. Unless treated well, necessary elements can themselves become barriers. Second order includes accommodating in a systematic manner, the
must-provide elements of urban infrastructure so as not to hinder walkability. Third order involves controlling, restricting or avoiding certain elements of urban processes to induce a sense of responsibility on citizen’s part so as not to destroy the public realm at large. A set of guidelines under each strategy by the governing body in purview of these objectives can be formulated.
‘Visual literacy strategy’ – addressing crossings at junctionsCrossings have to be addressed with barriers as discussed above and a host of efficient traffic discipline measures. It is proposed that crossings be designed with a ‘Visual
literacy’ strategy which shall give both, the elderly pedestrian and vehicle drivers, a clear perception of the junction. The junctions shall be designed with an objective to aid absence of any physical or psychological barrier and to:
• Enhance ‘Visual access’- clear view of the junction at an approaching distance: strategic placement of poles, trees, infrastructure;
• Create ‘Visual focus’- provision of clear focus towards crossing: marked crossings, angular turns, pedestrian platforms, lights;
• Impose ‘Visual control’- clear scan of junction to pedestrians and drivers and know each other’s paths- well lighted, signage, markings; and

THEME PAPERS
October 2015 Volume 16 No. 2 - SHELTER | 51
• Reduce ‘Visual clutter’- avoid any kind of element that adds clutter to the scene and haze the vision, limit or avoid activities, unrequired elements, hoardings.
‘Seamless interface strategy’- addressing street-amenities accessThe access to amenities encompasses not only at-door entry but the pedestrian approach to the amenity as well within the walkable range. A ‘Seamless interface’ refers to incorporating the three-fold strategy to mitigate barriers and visual literacy strategy to aid safe crossings in approaching any amenity. Additionally, it suggests a 15 m to 30m absolute barrier-free approach to the amenity with added design attributes of legibility, place making and inclusiveness through appropriate design. Here urban design guidelines shall encompass street facades, street furniture, signage, lighting and walkway environment.
SUMMING-UPWalkability is the ease with which it is possible to walk around an area from one point to another. To understand how urban streets aid walkability for elderly mobility, a description of all aspects that influence, needs to be understood from planning level to micro level. The strategies to strengthen walkability should contribute to an integrated approach. Accordingly, a concept of ‘Wholesome pedestrian mobility’ is proposed with a five-point objective:
1. Creation of an amicable community in the
neighbourhood- compact, walkable, self-sustained zones;
2. Interpreting every stimulus and interface in the journey- critical approach to analysing the possible barriers to elderly pedestrian mobility and crossings;
3. Creation of a continuous ‘walking loop’- an unbroken network of pedestrian accessible public spaces and paths;
4. Enhance micro-level pedestrian environment in urban public spaces- giving attention to details of overall public realm; and
5. Enhance a user-friendly public transit system- design of transit stops, access paths and last mile connectivity.
CONCLUSIONEnhancement of public realm to aid pedestrian mobility is a multi-dimensional and incremental approach. A ‘Wholesome pedestrian mobility’ strategy is suggested, which encompasses resolving the specific issues in each context. Urban design, in line with the planning guidelines, should aim at an integrated approach, in co-ordination with the various governing bodies or stakeholders, keeping the interest of senior citizens in mind.
To trigger the facilitation of elderly pedestrian mobility in Indian cities, a broader framework to evaluate the status of public spaces is firstly needed; followed by the formulation of multi-tiered and micro level strategy. This research develops a methodological base and a strategic road map; based
on which designers, planners and architects shall further formulate design guidelines with specific details, to aid elderly pedestrian mobility. The framework further opens up scope for research on developing guidelines and design details under each of the strategies towards a holistic address of elderly pedestrian mobility in residential neighborhoods.
REFERENCESBangalore CDP, Master Plan- 2015
Census of India, 2011, Registrar General & Census Commissioner, New Delhi.
Erikson, Erik H, 1994, Identity and the Life Cycle, Norton Paperback, NYC, April 17, 1994.
Government of India, 2011, National Policy for Older Persons, Ministry of Social Justice, New Delhi.
National Urban Transport Policy, 2014. Ministry of Urban Development, www.iutindia.org
Patil, Dakshayini &Dr Raj, Mamatha. July-December 2012,” Urban public space: Exploring the semantics”, Brief over-view on various models, theories, interpretations and experiential exponents.Urban India, a journal of NIUA, Vol 32, No 2. Pages 44 to 65
Patil, Dakshayini &Dr Raj, Mamatha. Dec 4, 2013. Accessibility to Bus-stops for Senior citizens in the Urban neighbourhoods; An overview of best practices. Presented and published in the ‘6thUrban Mobility India (UMI) Conference & Expo 2013’- Transforming Cities with Transportation at The Manekshaw Centre, New Delhi organized by Institute of Urban Transport (IUT India) under the aegis of the Ministry of Urban Development, GOI
UNNATI, 2004, Design manual for a barrier-free Built Environment.
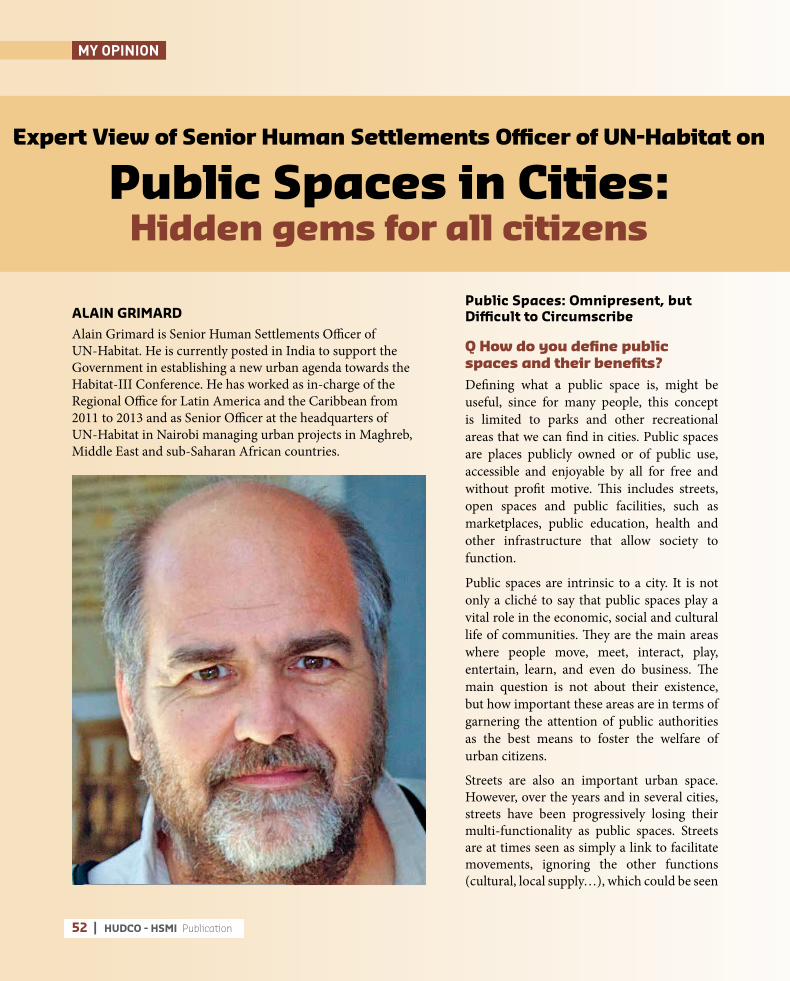
MY OPINION
52 | HUDCO - HSMI Publication
Expert View of Senior Human Settlements Officer of UN-Habitat on
Public Spaces in Cities:Hidden gems for all citizens
Public Spaces: Omnipresent, but Difficult to Circumscribe
Q How do you define public spaces and their benefits?Defining what a public space is, might be useful, since for many people, this concept is limited to parks and other recreational areas that we can find in cities. Public spaces are places publicly owned or of public use, accessible and enjoyable by all for free and without profit motive. This includes streets, open spaces and public facilities, such as marketplaces, public education, health and other infrastructure that allow society to function.
Public spaces are intrinsic to a city. It is not only a cliché to say that public spaces play a vital role in the economic, social and cultural life of communities. They are the main areas where people move, meet, interact, play, entertain, learn, and even do business. The main question is not about their existence, but how important these areas are in terms of garnering the attention of public authorities as the best means to foster the welfare of urban citizens.
Streets are also an important urban space. However, over the years and in several cities, streets have been progressively losing their multi-functionality as public spaces. Streets are at times seen as simply a link to facilitate movements, ignoring the other functions (cultural, local supply…), which could be seen
ALAIN GRIMARD Alain Grimard is Senior Human Settlements Officer of UN-Habitat. He is currently posted in India to support the Government in establishing a new urban agenda towards the Habitat-III Conference. He has worked as in-charge of the Regional Office for Latin America and the Caribbean from 2011 to 2013 and as Senior Officer at the headquarters of UN-Habitat in Nairobi managing urban projects in Maghreb, Middle East and sub-Saharan African countries.

MY OPINION
October 2015 Volume 16 No. 2 - SHELTER | 53
as “collateral” uses of the street. But nowadays, there is a new spirit, in which citizens are reclaiming streets and its fringes, as public spaces.
But streets can not be limited to metalled roads for motorised vehicles, they have to compete with other modes like pedestrians and non-motorised transport. Therefore, prosperous or smart cities shall expand their transport systems with sidewalks and bicycle paths, ensure eco-efficiency of infrastructural systems, and support density through integrated infrastructure development. Research studies repeatedly show that streets that provide space only to motorists are characterized by congestion and high CO2 emissions.
The economic and social advantages of public spaces may not be obvious to outsiders or public policy-makers. Well conceived and maintained, public spaces contribute to the communities’ welfare, and also increase the value of private space surrounding them. Hence, public spaces have important social benefits, as well as, positive economic impacts on a city’s development.
Q What are the main characteristics of good public spaces?Public spaces must facilitate human contact and promote community participation. They must be welcoming spaces that accommodate all classes of citizens, serve multi-purpose functions (recreation, fitness, catering…) and reflect the local culture or identity. They must also be well maintained and safe, regardless of the users and the time of day.
Designing public spaces is also crucial in order that the sites and equipment could be fully and correctly used. For instance, young and older people could be discouraged from frequenting parks due to lack of seating facilities. People make places, more than places make people. Hence the importance of consulting and involving local communities, especially women and girls, becomes a pre-requisite in making public spaces meet the expectations, motivations and concerns of local community. Public spaces that look good but fail to provide adequate attractions, amenities, or connections to existing economic and social realities may lead to the creation of sterile places that people will not use.
Q. How can we ensure that public spaces are planned as per the needs of the community?City-wide policies and strategies should ensure planning, design and management of public spaces at different scales. Ensuring city-wide distribution of public spaces is a way for governments to reduce inequalities and reallocate benefits. The benefit of preparing a city-wide
strategy/policy is to create and protect a network of high-quality public spaces. Without a clear strategy/policy, it is difficult for local governments to prioritise, plan and spend resources on public spaces, and to show how much public space is valued (e.g. gentrification). A strong strategic policy framework, supported by urban design, is core to mitigate the negative impacts of site specific interventions on public spaces.
Every city shall define specific norms regarding the use of public land in its policies such as proportion of land to be allocated to streets, the street density, the intersection density, the percentage of obstacle-free sidewalks, etc.
The use of public spaces varies according to the time of day and day of the week. This aspect needs to be taken into account in planning and designing different places. Safety, security and social interactions are key components of liveable streets and other public spaces.
Spatial or area-based planning shall prevail above master or socio-economic planning, when it comes to planning public spaces. It is
Public spaces, including streets, embody the most basic element of cities structure. They constitute the backbone of the urban fabric and play an indispensable
role by creating space for social interaction, communication, mobility, and even commerce. Public spaces contribute to the welfare of citizens and in the achievement of sustainable urban development. For Indian cities, the key challenges for a sound use and development of public spaces rely on access to land, good planning and design practices, community participation, as well as ensuring citizen’s safety.

54 | HUDCO - HSMI Publication
acknowledged that public spaces can occupy up to 40 per cent of land in well-developed cities (New York, Barcelona…), while public spaces in cities of least developed countries may sometimes represent only 10 per cent of the total urban areas. Worse still, studies related to slums in Africa and Asia show that public spaces occupy less than 5 per cent of these informal settlements area. All this simply show that use of space for public purpose does not hamper value of private spaces, quite the contrary.
Moreover, when planning the city, the multiple functions of streets (cars, bicycles, sidewalks, food vending etc.) have to be recognised and accounted for. Street design decides the form and dynamics of a city. Therefore, streets shall not be regarded as mere links in a road network, enabling travel between two or more destinations but rather a planning tool which determines
the growth pattern of a settlement.
The main challenges for cities are to make sure that public spaces are not lost to the benefit of private space, and the benefit of public spaces accure to all citizens. This could be ensured through use of good planning and design practices, and consistent pressure from citizens to maintain and develop public spaces.
For a city to be prosperous, it must have prosperous streets. Using the same notion of prosperity, UN-Habitat presents a holistic approach to streets as public spaces that embraces the notion of liveability and completeness as well. A prosperous street must promote infrastructure development, enhance environmental sustainability, support high productivity, and promote quality of life, equity and social inclusion. All this is possible in an environment where streets receive their just recognition for
their multi-functionality as public spaces.
Q. What are the challenges and prospects, specific to India? The consolidation and development of public spaces in India have some challenges that are worth mentioning. The absence of guidelines to assist the policy-makers and practitioners to plan and develop public spaces, the high costs in converting private into public lands in order to expand public spaces and sustaining the operation and maintenance of infrastructure are some of the key challenges. Preserving the public land vis-à-vis the lure of short-term gains, for authorities in selling public land to individuals, ensuring security and safety for all citizens- particularly of women and girls and overcoming the deficiency or shortage of infrastructure for non-motorized transport (e.g. pavements
Fruit-vendors on Footpath
MY OPINION

October 2015 Volume 16 No. 2 - SHELTER | 55
or sidewalks for walking and bicycle lanes for cycling) are other issues to be addressed.
The Government of India recently launched the Smart City Mission and Atal Mission for Rejuvenation and Urban Transformation (AMRUT), in which Indian cities have better possibilities to increase or improve their public spaces. Above all, the Smart City Mission spurs through its strategy of retrofitting and redevelopment of built-up neighborhoods, the preserving and developing of open spaces such as parks, playgrounds, and recreational spaces in order to enhance the quality of life of citizens. This is a great opportunity to enhance the accessibility of public spaces to all its citizens.
Q. What do you think are the key drivers for action?As proposed in an Issue Paper guiding the Habitat-III Conference
that will be held in Quito in October 2016, the following precepts shall be applied in order to achieve sustainable public spaces:
- At regional and city level, city-wide strategies need to focus not only on places and spaces, but on the form, function and connectivity of the city as a whole.
- Local authorities should be able to design the network of public space as part of their development plans.
- At neighbourhood level, urban design should work with communities to foster social inclusion, celebrate multiculturalism, and enable urban livelihoods, thus creating rich, vibrant spaces in the urban commons.
- Laws and regulations need to be reviewed, to establish enabling systems to create, revitalise, manage, and maintain public
spaces, including participatory processes to define their use and manage access to public spaces.
- Land value sharing and land readjustment tools to be widely adopted and promoted for municipalities to capture private values generated by better public spaces to sustain investment in public space.
- Investing in public space needs to be harnessed as a driver for economic and social development.
- As cities expand, the necessary land for streets and public spaces as well as public infrastructure networks must be secured. Urban projects need to ensure adequate public space in planned city extensions, planned city infills and participatory slum upgrading projects. Instruments to enable the creation of public space from private owned land are of critical importance.
Motorised vehicles are encroaching streets & public spaces
MY OPINION

CASE STUDY
56 | HUDCO - HSMI Publication
Housing for the Urban Poor in Chandigarh
Including the Excluded
Chandigarh, the first planned city of north-west India saw the growth of slums and segregated growth of the poor settlements in the past. Although Chandigarh has been taking some initiatives to provide housing and basic services to the poor, it was only recently, the city took very drastic steps to enhance the access to housing and basic services to the poor living in segregated settlements. It has implemented an ambitious housing project in the city which has demonstrated positive results. The paper is an effort to highlight how and what kind of efforts have been taken by Chandigarh city to include the excluded, by providing housing to the slum dwellers. An effort has also been made to know the perception of the beneficiaries of the housing programme to suggest a suitable strategy for similar initiatives elsewhere.
INTRODUCTIONThe processes of globalization, liberalization and urbanization and the resultant processes of segregation, slums, poverty and houselessness are putting pressure on cities for devising tools to meet the growing needs/ aspirations of their citizens for housing, basic services and livelihood as well as inclusive development. Chandigarh, the first planned city of North-west India saw the growth of slums and segregated growth of the poor settlements in the past. Sarin (1982), Kalia (1987), CRRID (1999, 2010), Teotia (2002, 2007, 2013); Teotia et et al. (2007), Krishan (1999), Gupta and Teotia (2004) have highlighted
various aspects of planning, policies and exclusion of the poor from legal housing and employment in Chandigarh in the past. Although Chandigarh has been taking some initiatives to provide housing and basic services to the poor, but it was only recently, that the city took very drastic steps to enhance the access to housing and basic services to the poor living in segregated settlements. It has implemented an ambitious housing project (CHB 2006) in the city which has demonstrated positive results. The Planning Commission, Ministry of Urban Development, Ministry of Housing and Urban Poverty Alleviation, Government of India, media and a few research studies have lauded its efforts (CHB 2009 and Teotia 2013). The practices introduced by the Chandigarh Housing Board have brought good results in the city. The paper is an effort to highlight how and what kind of efforts have been taken by Chandigarh city to include the excluded.
METHODOLOGYThe paper mainly relies on secondary data, multiple visits to various housing sites in Chandigarh, informal discussions with the local people, observation and review of literature and local news papers. The photographs depicting housing
KEYWORDS
Urbanisation, exclusion, inclusion, housing
Manoj Kumar Teotia ([email protected]) is Assistant Professor, Centre for Research in Rural and Industrial Development (CRRID), Chandigarh.
Another good feature of the scheme was simplification and transparency of the process. A simple one page application form was devised without enclosures, attachment or proof. Allotment letter, possession slip and license deed were also simplified in one page. The role of middlemen was completely eliminated.
MANOJ KUMAR TEOTIA

CASE STUDY
October 2015 Volume 16 No. 2 - SHELTER | 57
conditions and post rehabilitation situation were taken by the author. The beneficiaries were interviewed to explore the positive and negative aspects of the housing initiative. The data from Chandigarh Housing Board (CHB) was analyzed to learn about the physical and financial progress of the initiatives. The census data was collected to learn about past and emerging pattern of urbanization in the city.
DISCUSSIONRapid Urbanisation: Chandigarh has crossed the million-mark in 2011 in term of its population. It is the second most populated city after Delhi in terms of density. Table 1 shows the trends in urbanization in Chandigarh.
The growth trends in urban population of Chandigarh shows high annual exponential growth rate (AEGR) and decennial growth rate (DGR) in the past. Although AEGR and DGR have declined in the last decade of 2001-2011, the absolute
increase of population has been considerably high in the city i.e. 0.22 millions.
Chandigarh has already crossed the mark of the million plus metropolitan city in 2011 with a population base of 1.03 million. The rapid urban growth has been beyond the absorbing capacity of the city as it was initially planned for a limited population and therefore it resulted in haphazard growth of slums in many parts of the city despite strict planning norms. It has been a matter of concern for the urban policy makers, as providing adequate housing and basic services to the huge poor slum population has been a gigantic task.
Unplanned growth of Slums: The slum population in northwestern India including Chandigarh, is high and it continues to grow despite the slum rehabilitation programme. Table 2 shows slum population in the Union Territory of Chandigarh and selected Northwestern states.
In Chandigarh, approximately 9.7
per cent population live in slums. Slums in Chandigarh have third highest percentage of Scheduled Caste (SC) population (30.7%), after Punjab (39.8%) and Tamil Nadu (32.0%). The data on spatial features of slums indicate that slum dwellers are being forced to live in peripheral and industrial areas with or without basic infrastructure and services. The literacy rate is also poor in slums compared to non-slum areas. In 2001, the gap in literacy rate in slum and non slum areas was highest in Chandigarh at 54.8% in slums and 82.6% in urban areas. In a biometric survey conducted by Chandigarh Administration in 2006, about 23,841 slum families living in 18 slum colonies were identified for providing housing.
In November 2013, the largest slum colony of Chandigarh i.e., Colony No. 5, was demolished and slum dwellers were rehabilitated in Dhanas, in houses constructed under the JNNURM project. As a result, large number of families who had
TABLE 1: Growth trends in urban population of Chandigarh
Census year Total no. Of UAs/ towns*
Total population(Million)
Total urban population(Million)
Per cent urban
population
Decennial growth Annual exponential growth rate of urban population (percent)Absolute
(Million)Per cent
1971 1(2) 0.257 0.233 90.55 0.134 +134.67 8.53
1981 1(4) 0.452 0.423 93.63 0.190 +81.52 5.96
1991 1(5) 0.642 0.576 89.69 0.153 +36.18 3.09
2001 1 0.901 0.809 89.78 0.233 +40.46 3.40
2011 1 1.055 1.025 97.15 0.216 +26.86 2.39
Source: Census of India 2001, Chandigarh, Provisional Population Totals, Rural-Urban Distn., Paper -2; Census of India 2011.
Note: figures in parenthesis are number of towns in UT Chandigarh

CASE STUDY
58 | HUDCO - HSMI Publication
come to Chandigarh after biometric survey and settled in Colony no 5, suddenly became homeless and were not eligible for new houses under this scheme. Therefore, this population was forced to either move to the old slum or form a new slum in Chandigarh or in other neighboring towns.
Housing shortage: The housing situation continues to be
unsatisfactory for economically weaker sections and low income groups residing mainly in slums in Chandigarh. Table 3 shows the housing stock and shortage in Chandigarh.
The shortage of housing in Chandigarh in 2001 was of 65,211 units, which increased to 96,371 units in 2011. The exclusion of urban poor from housing is visible
in Chandigarh, despite its planned character and strict planning control norms & service standards. Housing shortage is acute and it seems to be assuming alarming proportions, particularly for the urban poor, EWS, LIG and lower middle classes. The housing poverty among slum dwellers seems to be magnified due to various factors such as continuous inflow of poor migrants
TABLE 2 : Slum population in north western region in 2001-11
TABLE 3 : Housing stock and shortage in Chandigarh
States/UT 2001 2011
Total Slum Population
% of slum population
To total population of the state
To population of cities/ towns reporting slums
Total Slum Population
% to Urban Population
% of SC Population in
the Slums
Haryana 16,81,117 27.5 32.2 16,62,305 37.3 29.9
J & K 3,73,898 14.9 22.3 6,62,062 19.4 1.7
Punjab 14,83,574 18 22.20 14,60,518 26.9 39.8
Chandigarh 1,07,125 13.2 13.2 95,135 9.7 30.7
Sr.No Particulars Chandigarh Urban Chandigarh (2001)
Urban Chandigarh (2011)
1. Population 900,635 808,515 1025682
2. Total households 201,878 180,576 235061
3. Census houses (residence+ Residence cum other purpose)
192,555 172,078 251523 (i)
4. Minimum housing shortage (2-3) 9323 8498 16462
5. No. of household without any room 1931 1725 1900(ii)
6. Serviceable/non-serviceable 6414 5866 7381(iii)
7. Married couple without independent room 56541 49122 61402(iv)
8. Total housing shortage(4+5+6+7) 74290 65211 96371(v)
Source: Census of India 2011
Source: Census of India 2001 and 2011.
(i) It is assumed that number of houses increased at the rate of 20 percent per decade.
(ii) It is assumed that number of household increased at the rate of10 percent to per decade.
(iii) It is assumed that serviceable/non-serviceable houses increased at the rate of 20 percent during the last decade.
(iv) It is assumed that number of married couple without independent room increased at the rate of 25 percent during the last decade.

CASE STUDY
October 2015 Volume 16 No. 2 - SHELTER | 59
from other states, inadequate housing supply, commodification of land & housing, poor livelihood and income levels of the poor. The private as well as public sector agencies and departments have been unable to provide adequate housing to their employees. So, is the case with Chandigarh administration and state governments of Punjab
& Haryana, which have also been unable to provide adequate government accommodation, thus forcing their employees to live in rental housing. The employees of the Chandigarh Housing Board (CHB), prime mover of government driven housing programe, are not eligible to get government houses in the city. This is an indication of withdrawal of
government from its responsibility of providing minimum housing at least to its own employees, irrespective of their income (Sarin 1982).
Urban inequality seems to be growing with social and physical deprivation with a sizeable population residing in the slums. How slums can be transformed from slums of despair to slums of hope within the broader framework of globalization, liberalization and privatization, is a big question. The socio-cultural marginality exhibited in the slums needs a holistic approach to bring this population into the mainstream.
Towards including the excluded: Initiatives for housing for the urban poor: Chandigarh Administration through Chandigarh Housing Board (CHB) has been consistently making efforts to provide housing and basic services to the poor. The administration has been providing land to the Board at the concessional rate. The land is on a 99 years lease; same as in the case of auctioned plots. The period for paying for the dwellings is through monthly installments which vary from 18 years for economically weaker sections to 10 years for middle income group. In addition, there are front end costs at the time of application and allotment. Till March 2011, CHB had constructed a total of 49,713 houses of various categories. About 46 per cent of these were meant for the Economically Weaker Section (EWS), primarily in peripheral colonies, for resettling of unauthorized settlements. Another 19 per cent were for the Low Income Group (LIG), 22 per cent for the Middle Income Group (MIG) and 13 per cent for the High Income
Picture 1 and 2 : Houses allotted in sector 38 west
Picture 2
Picture 1

CASE STUDY
60 | HUDCO - HSMI Publication
Group (HIG). It has been estimated that about 25 percent population of Chandigarh lives in CHB constructed houses.
Slum rehabilitation project under small flats scheme: To address the problem of housing for the urban poor mainly living in slums, Chandigarh administration implemented Slum Rehabilitation Project under Chandigarh Small Flats Scheme 2006. This project was conceived to provide hygienic living condition and housing to 1,20,000 slum dwellers (23,841 families spread over 18 notified colonies) as identified through a bio-metric survey in 2006.
Chandigarh administration designated CHB as the nodal agency for implementing this project. CHB plans to construct 25,728 small flats at the cost of Rs 1237.70
crore, as envisaged at the time of conceptualization of the scheme. The task of socio-economic survey was entrusted to the Infrastructure Development Finance Company Limited (IDFC). Digital photograph of the family, thumb and finger prints of the head of the family were captured electronically. Some conditions were made mandatory for identification of slum dwellers and potential beneficiaries for the new houses built by the CHB, such as the name of beneficiary should appear in the bio-metric survey conducted by the administration in the year 2006; voter list of the year 2006 and voter list of the year in which allotment is made; etc. In the event of beneficiary’s name, not appearing in the voter lists of 2006, the beneficiary may still qualify, if his/her name existed in the voter
lists of 2004-2005 and that of 2007- 2008.
The bio-metric survey found that the average household size of slum dwellers was 4.5 persons. Majority of the slum dwellers (90 per cent) had nuclear families and average monthly salary reported by 85 per cent of slum population ranged between Rs. 1,000 (US$ 15.65 at the current rate of US$ 1=Rs 63.88) and Rs. 3,000 (US$ 46.96) per month. At the same time average monthly expenditure reported by 90 per cent population ranged between Rs. 700 (US$ 10.96) and Rs. 3000 per household (US$ 46.96). The survey also found that 90 per cent of families were in a position to generate a monthly disposable surplus of Rs. 1,000 (US$ 15.65).
The allotment to the identified beneficiaries was made initially on a license fee of Rs 800/- per (US$
TABLE 4 : Status of construction of 25,728 flats and their allotment and beneficiaries
Phase-I Construction of 6368 Small Flats
Sr. No.
Location No. of Flats Physical Status of Construction
Status of Allotment
1 Sector 49 1024 Work Completed 1024 Flats allotted
2 Sector 38 (West) 1120 Work completed 1120 Flats allotted
3 Maloya-II 3648 Yet to be started ----------------------
4 Ram Darbar 576 Work Completed 576 Flats allotted
Phase-II Construction of 10016 Small Flats
5 Dhanas 8448 Work Completed 8288 Flats allotted
6 Maulijagran-II 1568 Construction Completed Process of allotment started, to be completed by July 2015
Phase-III Construction of 9344 Small Flats
7 Maloya-I 8896 Work in progress 4960 Flats (Construction started, to be completed by June 2016)
8 Maulijagran-I 448 Yet to be started ----------------------
TOTAL 25728 11008 Flats allotted
Source: Data compiled from the office of the Chandigarh Housing Board, Chandigarh on May 15, 2015

CASE STUDY
October 2015 Volume 16 No. 2 - SHELTER | 61
15.52) month and ownership rights would be given after 20 years. Therefore, possession would remain with the beneficiary for 20 years and thereafter registration would be done in the joint name of husband &
wife. There is a provision of eviction, in case allotment is based on false information or non-payment of license fee. There is an option of conferring ownership rights after 20 years to those who have been in
continuous and lawful occupation of the flat. According to Chandigarh Housing Board, some innovations were used in the process of housing the poor. Earlier housing units were allotted on hire-purchase basis and were highly subsidized. Large number of beneficiaries encashed the subsidy by selling their unit and returned again to the slums. Now all allotments are done on affordable monthly license fee basis i.e., Rs 800 (US$ 15.52) per month which was below the monthly disposable surplus i.e., Rs 1000 (US$ 15.65) for majority of families (90 per cent), at the time of bio-metric survey. The ownership of house is possible only after twenty years.
Another good feature of the scheme was simplification and transparency of the process. A simple one page application form was devised without enclosures, attachment or proof. Allotment letter, possession slip and license deed were also simplified in one page. The role of middlemen was completely eliminated. The
Picture 3 & 4 : Views of park in ramdarbar colony
Picture 5 & 6: Sewer pipe inside the kitchen are and water leakage in houses
FIGURE 1: Perception of beneficiaries about housing and basic services
Picture 3
Picture 4
Picture 5
Picture 6

CASE STUDY
62 | HUDCO - HSMI Publication
layout had no incidental spaces, to check the possibility of violations or encroachments. Single multi-purpose room was provided with a toilet, bath and kitchen. The design allowed direct access to sunlight. Individual water and electricity connections were provided in all flats. Although, efforts were made to have minimal relocation, it could not be completely avoided. The land thus freed from slums was put to optimal use.
The Government of India had approved three major projects for Chandigarh for Rs 102,148 million comprising Rs. 24,793 million for rehabilitation of 6,368 families, Rs. 30,043 million for rehabilitation of 10,016 families and Rs 47,312 million for rehabilitation of 9,344 families under the Jawaharlal Nehru National Urban Renewal Mission (JNNURM). The total approved amount comprises central share of Rs 74,462 million and UT/ state share of Rs. 36,412 million for rehabilitation of 27,728 families.
The CHB, is executing and implementing these projects. Out of 25,728 flats, 11008 have been allotted at 4 sites (1,024 flats at sector 49, 1,120 flats at sector 38 west, 576 flats at Ramdarbar and 7,200 flats at Dhanas). The work on 1,568 flats in Maulijagran-II is also complete and will be handed over soon. The work in the remaining 2 sites is yet to start.
Perception of beneficiaries of housing units: While the above story explains the happy augury, there are some grey areas which need attention of the urban policy makers. A recent study (Teotia 2013) explored the perception of the 50 beneficiaries on housing and services
provided under the completed JNNURM scheme in Chandigarh.
The condition of basic services, parks and drainage etc in newly rehabilitated areas was found quite unsatisfactory in Ramdarbar, sector 49 and sector 38 west.
Another common problem is that grey water and black water pass from within the house and during the blockage in any floor, ground floor occupants suffer a lot. People want these pipes to be placed on external walls of the house or in a separate duct.
Some beneficiaries reported that they were suffering from the problem of leakage of water from the top floor. Top floor occupants consider that the concrete is of poor quality which causes leakage.
Inadequate space was reported by all the beneficiaries. The problems of small bathrooms, entry to toilet, absence of a separate kitchen and exposed wastewater pipes through the room/ kitchen were not liked by many beneficiaries. The infrastructural inadequacies were potential for adverse impact on the health of the dwellers. Sewage pipes were not properly connected to main sewer line, resulting in overflow from gutters. This unhygienic condition was considered adversely by the community. The perception of the people about housing units shows that they are not comfortable with the space, internal lay out in the housing unit, facilities in and around the locality etc. Similarly, people complain about the poor maintenance of water supply, sewerage, drainage and street lights etc (Figure 1).
The perception of the beneficiaries and field observations underline the following crucial points:1. The participation of poor was
absent in the preparation of plans of the individual housing units.
2. The needs of urban poor were not considered while designing the housing units.
3. There were infrastructural inadequacies within and outside the housing units.
4. The workmanship and material used in construction of house was of poor quality.
5. Open spaces and parks are inadequate and not as per norms.
6. Maintenance of the units and upkeep of the infrastructure and services is not planned for by the corporation.
7. There is no mechanism in place for checking day to day grievances of the residents regarding basic services.
These difficulties need to be paid special consideration while formulating housing policies for the urban poor. There is a need to engage the beneficiaries in all housing projects from the beginning. They should be consulted in designing the dwelling units as well as monitoring its implementation/construction in terms of the quality of material used. The augmentation of operation and maintenance of basic services in rehabilitated areas is as important as in other parts of city, to maintain a uniform quality of life.
SUMMARY, CONCLUSIONS, AND STRATEGIESChandigarh has been urbanizing rapidly and slums have grown

CASE STUDY
October 2015 Volume 16 No. 2 - SHELTER | 63
even faster despite the City’s strong planning control. The City has a strong economic base, but urban poverty still looms large and is concentrated in slum areas. The urban poor are being forced to settle in peripheral areas of the city. The exclusion of poor slum dwellers continue to affect the social, economic and environmental fabric of the city. The development practices adopted by the Local Government Department of Chandigarh administration have been pro-rich. It is visible in the form of inequality in the quality and coverage of urban infrastructure and services in slum and non slum areas. Majority of the poor people live in southern sectors, particularly in peripheral area, and the quality of life in these sectors is very poor in comparison to the northern sectors, inhabited by higher income groups. Housing shortage is acute and it is assuming alarming proportions, despite consistent initiatives of Chandigarh administration. With the rapidly escalating prices of land and flats, affordable housing is slipping out of the reach of most of the urban poor and low income groups. The recent boom and extreme comodification of land and housing policy (use of land and housing for profit motives by high income groups) has forced the poor to either move towards slums or towards villages, where housing conditions are very poor.
Chandigarh has been given two awards under JNNURM namely ‘Best City in Earmarking of Land for the Poor’ in December 2009 and ‘Best City for Best Planned Habitat for Urban Poor’ in December 2010.
The focus of the Chandigarh administration is now on
improvement of overall human well being and capability formation of the urban poor. To achieve this, a comprehensive integrated and visionary plan, comprising of pro poor thrust areas and their needs, should be prepared and given priority. The plan should enable convergence of major schemes and programmes thrusting upon to reduce inequalities regarding housing, basic services and livelihood. Community based participatory planning strategies need to be evolved to address the socio-economic inequalities. Pro-poor city friendly sustainable planning and growth, aimed at equitable distribution of resources and clear cut vision for future will help to regenerate the physical, socio-economic and environmental conditions of the city. Effective implementation of a comprehensive integrated development plan will certainly help to protect and sustain modern architectural grandeur of this planned city, and maintain and cherish the unique beauty of the city. This will also help to improve social order by inculcating feelings of equality and sense of security in underprivileged classes for maintaining harmony, integrity and unity in different sections of the society.
REFERENCESCensus of India (2001 and 2011).
Registrar General, Census Operations. Government of India: New Delhi.
Chandigarh Housing Board (CHB 2006). Slum Rehabilitation Construction of 6368 small flats. Detailed Project Report for Grant Under JNNURM. CHB: Chandigarh.
Chandigarh Housing Board (CHB 2009). Rebuilding Lives. CHB: Chandigarh.
CRRID (1999). Report on Baseline Socio-
economic Survey of Unauthorized and Rehabilitated Colonies of Chandigarh. Submitted to the UT Administrator, Chandigarh (unpublished). CRRID: Chandigarh.
CRRID (2010). Mid Term Appraisal of the Eleventh Five Year Plan of Chandigarh. CRRID: Chandigarh.
Gupta, JP and Teotia, M. K. (2004). Innovative Municipal Management for Mobilization of Financial Resources and Up gradation of Environmental Infrastructure (A Case Study of Chandigarh Municipal Corporation. An unpublished report submitted to NIUA under FIRE (D) project of USAID. CRRID: Chandigarh.
Krishan, G. (1999). Inner spaces- Outer Spaces of a Planned City: A Thematic Atlas of Chandigarh. Celebrating Chandigarh. UT Administration: Chandigarh.
Kalia, R. (1987). Chandigarh: The Making of an Indian City. Oxford University Press: New Delhi,
Sarin, M. (1982). Urban Planning in the Third World: The Chandigarh Experience. Mansell Publishing Ltd: London.
Teotia, M. K. (2013). Planning for the Urban Poor in Northwestern India: Emerging Policies, Practices and Issues (A Case Study of Chandigarh).An Unpublished report carried under HUDCO Research Grant. CRRID: Chandigarh.
-----------------------(2007). Strengthening and Sustaining Vitality of Urban Areas: A Case of Northwest India. In: Sociological Bulletin. January- March 2007.
----------------------- (2002). Preventing Pauperization of UT. February 25, The Hindustan Times: Chandigarh
Teotia, M.K., Duggal, B. & Bansal, S. (2007). Urban Poverty Profile for the city of Chandigarh (UT, India). Submitted to the AIILSG, Mumbai. CRRID: Chandigarh.

HUDCO AWARDED BEST PRACTICES
Solar Power Pack in a School Building at Jakkampudi,
VijayawadaVijayawada is the second largest city in the state of Andhra Pradesh with a population of 1,048,240 as per the 2011 census. The city is surrounded by Krishna River on the east, Indrakiladri hills on the west and Budameru river on the north. Vijayawada is also a part of Andhra Pradesh Capital Region and the headquarters of the Andhra Pradesh Capital Region
Development Authority. The city is a major trading and business centre and is also known as “The Business Capital of Andhra Pradesh”.
Considering the growing demand of energy in urban areas coupled with growing levels of green house gas emissions, Government of India, Ministry of New & Renewable Energy (MNRE) had included Vijayawada city amongst
the 60 cities selected in the country under “Development of Solar Cities” Programme during the 11th Plan period. Vijayawada is the only city selected by MNRE under Solar City Programme in the State of Andhra Pradesh. It is the first ESCO (Energy service Company) city in Andhra Pradesh to save energy by adopting the voltage controllers at 500 locations in the city during
Before
School Building After Installation of Solar Panels
HUDCO's ASSISTANCE UNDER CSR & SD POLICY
64 | HUDCO - HSMI Publication

HUDCO AWARDED BEST PRACTICES
2008 and has been able to save 10.65 million units so far. Vijayawada Municipal Corporation has taken up many projects on energy conservation and renewable energy during the last six years. Some of these projects are, solar street lighting at Jakkampudi housing colony, Nimma-thota hill area, Fraizerpet hill area; solar blinkers at
9 major junctions; and solar signals at 3 major junctions.
HUDCO’s CSR & SD assistance
Solar lighting and energy conservation was identified as one of the focus areas for performance evaluation template
of HUDCO under Corporate Social Responsibility & Sustainable Development (CSR & SD) for the year 2013-14. Accordingly, HUDCO initiated a project with Vijayawada Municipal Corporation for providing solar power pack to School I at JNNURM housing colony at Jakkampudi, Vijayawada, catering to 8216 EWS households. The Vijayawada Municipal Corporation worked out the total project cost as Rs.50.50 lakhs for providing solar power pack, out of which HUDCO sanctioned a financial assistance of Rs.35.35 lakhs to the corporation in the FY 2013-2014. The balance amount of Rs.15.15 lakh to be reimbursed by MNRE, was spent by Vijayawada Municipal Corporation.
HUDCO’s total CSR & SD sanctioned amount of Rs.35.35 lakhs was released to Vijayawada Municipal Corporation in three installments. The project has now been completed by the Corporation.
HUDCO's ASSISTANCE UNDER CSR & SD POLICY
October 2015 Volume 16 No. 2 - SHELTER | 65

HUDCO AWARDED BEST PRACTICES
HUDCO Awards for Best Practices to Improve the Living EnvironmentHUDCO is a techno-financing institution with significant contribution in the field of housing and urban development. It is contributing significantly in filling the gap for basic infrastructure and affordable housing in the country. In the year 2011-12, HUDCO started identifying and encouraging best practices annually in different spheres of habitat development. Since then, every year, HUDCO has been felicitating organisations and institutions, who have given innovative solutions to the problems related to housing and urban development.
Every year, ten awards are given by HUDCO to the organizations, who have been able to provide out of the box solutions, for problems encountered by citizens. These awards are distributed in a function organized on the occasion of HUDCO’s annual day. The award carries a
cash prize of Rs.1.00 lakh each along with a commemorative plaque and certificate. Some of the HUDCO best practice awards given for the financial year 2014-15 are given below.
Entries for HUDCO Best Practice Award are invited from Government Organisation, Parastatal Agencies, Multilateral Agencies, Local Bodies/Authorities, Non-Governmental Organisations (NGOs), Community Based Organizations (CBOs), Private/Corporate Sector, Research & Academic Institutions or Public/Private Foundations.
These entries are invited in various categories namely 1) Urban Governance; 2) Housing, Urban Poverty & Infrastructure; 3) Urban Transport; 4) Sanitation; 5) Environment Management; Energy Conservation & Green Building; 6) Urban Design & Regional Planning,
Inner City Revitalization & Conservation and 7) Disaster Preparedness, Mitigation & Rehabilitation.
A committee comprising of eminent professionals with diverse background is constituted to select the winning entries. The committee decides the winners through a rigorous procedure and evaluation criteria.
The award is generally announced in the month of November every year, and the announcement brochure along with the reporting format is uploaded on HUDCO’s website, ie www.hudco.org.
Interested organizations/institutions can refer our website in the month of November 2015 or contact the Executive Director, Training at [email protected], [email protected], [email protected].
Fig.1 : Hazarat Ganj Lucknow Market Redevelopment
Fig.4 : Harit janpath Thane Maharashtra
Fig.2 : HMG Road Gangtok
Fig.5 : Award Ceremony
Fig.3 : Kankaria lake Ahmedabad
Fig.6 : Award Ceremony
66 | HUDCO - HSMI Publication

HUDCO AWARDED BEST PRACTICES
October 2015 Volume 16 No. 2 - SHELTER | 67
Conservation and Revitalization of Hazratganj Precinct,
LucknowBACKGROUNDHazratganj in Lucknow is a place with 200 year old legacy and a rich heritage. The heritage of the high street of Hazratganj, which was acquired from the prestigious Awadh rule and later the British rule, was dwindling due to the commercial and utility pressures. Rapid urbanisation in the past decade has resulted in growth of suburban centers with shopping malls and multiplexes outside the traditional areas, which were more convenient and accessible. As a result, the business in Hazratganj was low, forcing traders to shift or extend their activity to malls, leading to the dwindling property values.
Hazratganj, being the core of the city, can be stated to be the victim of disorganized utilization of the spaces, exploitation of the street facade and excessive vehicular circulation. The prime issues on Hazratganj street before the intervention were : lack of pedestrian facility; lack of public amenities; domination of skyline by large scale hoardings, signage and banners; indiscriminate parking and traffic chaos; collapse of infrastructure services; lack of organized open public spaces; encroachment; haphazard overhead electrical
Project Area Hazaratganj Precinct, Lucknow
View of Hazaratganj Precinct

HUDCO AWARDED BEST PRACTICES
68 | HUDCO - HSMI Publication
wiring; and lack of architectural control
The Project - Urban Conservation and Revitalization of Hazratganj Precinct The basic priority for the project was to revitalise not only the tangible aspect, such as street facade and street elements, but also conserve intangible aspect of Hazratganj i.e. the experience of 'Ganjing' (to meet friends, see a movie and window shoping). The priorities were defined such as: identification of stakeholders and their role in the project; creating awareness among local stakeholders; political support; development of design and conservation strategy of the project by the architect consultant; and execution of project in a limited time (only five months) to complete it towards the 200th anniversary of the Hazratganj.
The features of the revitalization project were structured prioritizing the heritage character of the street and strengthening the civic infrastructure of the street. The project was conceived in April 2010, work started in September 2010 and the project was completed in January 2011. The major highlights of the rejuvenation project are: restoring character of the street; improvement of views and vistas; development of activity nodes and piazzas for general public; restoration of architectural features; development of open spaces; concept of active living by encouraging people to walk and enjoy the carefully designed meeting places and piazzas; introduction of softs cape in the area; and improvement of infrastructural
Situation Before Improvement
Situation After Improvement
Azam Ali Building
Moti Mahal
Sahu Cenema Complex
Sahu Complex, Barista
Azam Ali Building
Moti Mahal
Sahu Cenema Complex
Sahu Complex, Barista

October 2015 Volume 16 No. 2 - SHELTER | 69
facilities (like underground wiring and data cables, water supply, storm water drainage system).
RESULTS ACHIEVEDThe result of this project is an organized uncluttered and aesthetically pleasing urban space, which is friendly both for pedestrian and physically challenged. The area has become a tourist hot spot and every visitor coming to Lucknow visits this place at least once to experience the revived sham-e-awadh and enjoy the famous nostalgic 'Ganjing'. Work was accomplished using existing provisions and through persuasion and collaboration of local stakeholders.
A uniform code for the architectural façade, stating the colour scheme, of the buildings and the purposeful strategy releasing the architectural features of the street façade was followed. The property owners on the street themselves renovated their own premises on the basis of the standard code for the buildings. A signage system was developed and was agreed upon by the stakeholders, and applied to the street. These measures helped a lot to achieve the uniform character on the street and a sense of an individual precinct within the surroundings. There has been perceptible change in the attitude of local stakeholders towards one's own heritage. People have recognized the importance and now respect it. Any dilution
in the visual and special quality by offenders is objected to by them. The fallout of short term economic gains like revenue from hoardings, were understood and rejected in the larger interest of the site and the associated heritage.
The project created series of activities in the city like cleaning drives, heritage walks, debates on preserving one's own heritage by NGO’s, leading schools and media. A book has also been published to commemorate the 200 years of Hazratganj, which also included a detailed article describing the conservation and revitalization work. The project was acknowledged by awards like 22nd Architect of the year award by J.K. white cement and HUDCO Award for the Best Practices to improve the Living Environment. On similar lines, two new projects have been announced in Lucknow, for the conservation and revitalization of Hazratganj.
The Hazratganj Conservation and Revitalization project is a first of its kind where a heritage market in active use is conserved and revitalized. It is a unique example of synergy between the stakeholders and implementing authorities in the direction of successful co-ordination of the work. It shall certainly result in preparing the policies for revitalization and development of projects in near future, as stated from the appreciation it has created for itself.Source: HUDCO Award for Best Practice to Improve the Living Environment.
Landscape Court Development near Capoor's Hotel
Students Impromptu lecture on Hazratganj revitalization at newly developed open air theatre, Azam Ali Building
HUDCO AWARDED BEST PRACTICES
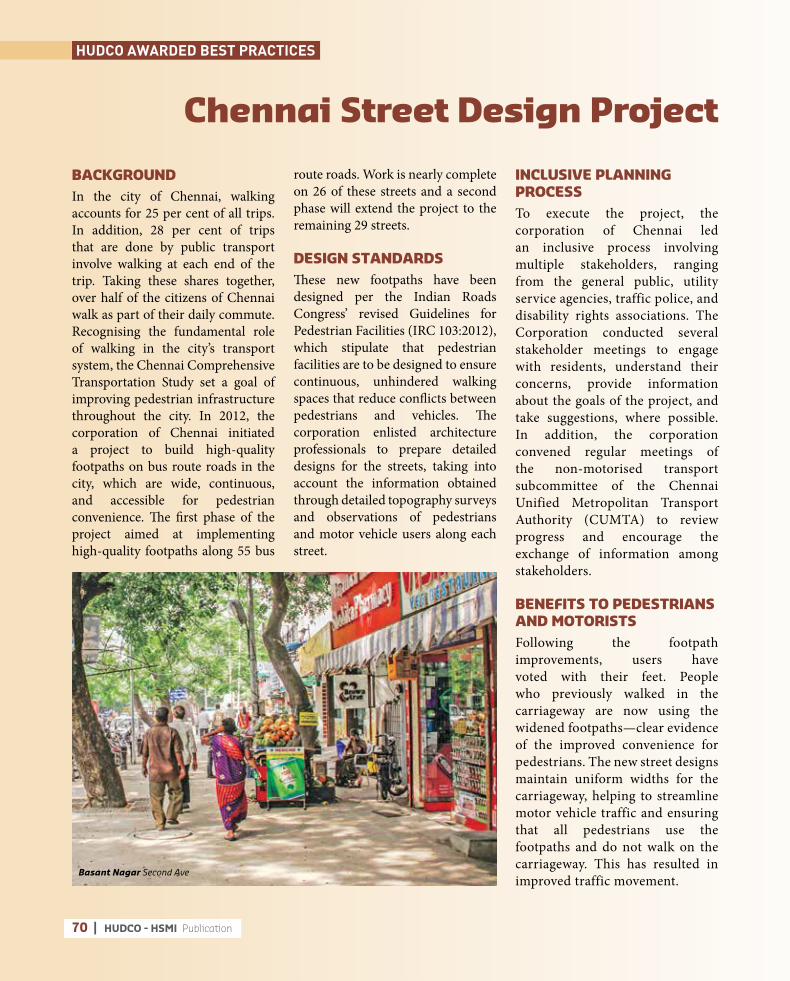
HUDCO AWARDED BEST PRACTICES
70 | HUDCO - HSMI Publication
Chennai Street Design Project
BACKGROUNDIn the city of Chennai, walking accounts for 25 per cent of all trips. In addition, 28 per cent of trips that are done by public transport involve walking at each end of the trip. Taking these shares together, over half of the citizens of Chennai walk as part of their daily commute. Recognising the fundamental role of walking in the city’s transport system, the Chennai Comprehensive Transportation Study set a goal of improving pedestrian infrastructure throughout the city. In 2012, the corporation of Chennai initiated a project to build high-quality footpaths on bus route roads in the city, which are wide, continuous, and accessible for pedestrian convenience. The first phase of the project aimed at implementing high-quality footpaths along 55 bus
route roads. Work is nearly complete on 26 of these streets and a second phase will extend the project to the remaining 29 streets.
DESIGN STANDARDSThese new footpaths have been designed per the Indian Roads Congress’ revised Guidelines for Pedestrian Facilities (IRC 103:2012), which stipulate that pedestrian facilities are to be designed to ensure continuous, unhindered walking spaces that reduce conflicts between pedestrians and vehicles. The corporation enlisted architecture professionals to prepare detailed designs for the streets, taking into account the information obtained through detailed topography surveys and observations of pedestrians and motor vehicle users along each street.
INCLUSIVE PLANNING PROCESSTo execute the project, the corporation of Chennai led an inclusive process involving multiple stakeholders, ranging from the general public, utility service agencies, traffic police, and disability rights associations. The Corporation conducted several stakeholder meetings to engage with residents, understand their concerns, provide information about the goals of the project, and take suggestions, where possible. In addition, the corporation convened regular meetings of the non-motorised transport subcommittee of the Chennai Unified Metropolitan Transport Authority (CUMTA) to review progress and encourage the exchange of information among stakeholders.
BENEFITS TO PEDESTRIANS AND MOTORISTSFollowing the footpath improvements, users have voted with their feet. People who previously walked in the carriageway are now using the widened footpaths—clear evidence of the improved convenience for pedestrians. The new street designs maintain uniform widths for the carriageway, helping to streamline motor vehicle traffic and ensuring that all pedestrians use the footpaths and do not walk on the carriageway. This has resulted in improved traffic movement.
Basant Nagar Second Ave

October 2015 Volume 16 No. 2 - SHELTER | 71
BUILDING CORPORATION CAPACITY
As Chennai moves to implement an efficient, inclusive transport system, building institutional capacity is essential to ensure long-term, sustained change. Toward
this end, the corporation has initiated partnerships with expert groups to build technical expertise, improve management capacity, and disseminate best practices. One such partnership is with the School of Architecture and Planning, Anna
University and the Institute for Transportation and Development Policy. Under this agreement, the corporation has initiated a formal certification programme in street design for corporation engineers. Source: HUDCO Award for Best Practice to Improve the Living Environment.
Before : The old footpath on 2nd Ave in Besant Nagar was uneven and inaccessible, forcing most pedestrians to walk in the carriageway.
Before : The old footpath on Police Commissioner Street which was narrow, with utility boxes obstructing pedestrian activity
Before : Like many other roads, pedestrian infrastructure was completely missing on the Police Commissioner Office Road
After : The new footpath is wide utility boxes moved to provide a continuous pedestrian realm that is accessible to all
After : The new wide footpaths are continuous even at crossing allowing uninterrupted pedestrian movement
After : The new footpath features a continuous, smooth surface that is accessible to all
HUDCO AWARDED BEST PRACTICES

HUDCO AWARDED BEST PRACTICES
72 | HUDCO - HSMI Publication
Urban Design and Inner City Renewal/ Revitalisation in
Gangtok
BACKGROUNDGangtok, capital of Sikkim is at an elevation of 1700m above sea level and is a picturesque hill station. Due to rapid and unplanned growth, the basic amenities and urban services have been affected to a great extent. The infrastructure of the capital is unable to cope the with the demands
of the local stakeholders and the tourist population. Gangtok is also the main tourism hub of Sikkim. In order to preserve the serene beauty of the town, efforts are being made to improve the existing infrastructure, with the techniques of urban renewal and redevelopment.
REFORMS INITIATED
(i) Restoration of Mahatma Gandhi (MG) Marg
MG Marg, the main business centre of the town was facing problems of congestion, conflict between vehicles and pedestrians, lack of adequate on street parking facilities,
Situation Before the Remodeling of MG Marg Situation After the Remodeling of MG Marg

HUDCO AWARDED BEST PRACTICES
October 2015 Volume 16 No. 2 - SHELTER | 73
encroachment of open spaces and degradation in the quality of life with rising air pollution from vehicular emissions.
To preserve the beauty and importance of the main business centre, MG Marg has been declared No Vehicular Zone. Initially there was resistance from the stakeholders and public. The local businessmen felt that the closure of vehicular traffic will result in loss of business as people may not visit their shops once vehicles are not allowed into the main market. However, the administration made efforts to convince them of the long term benefits of change and managed to convince all the stakeholders. Hence, vehicular traffic
has been closed and people entering. MG Marg use the parking places located at Old West Point School, Old Children Park and Lall Bazaar. The shifting of main-line taxis to multi-level car park at Deorali has improved the traffic flow in and around the city. Gulleys have been widened, redesigned and refurbished to suit the commuters. A bust of the Father of the Nation, after whom the street has been named has been relocated to improved surroundings. Now the street is one of the best walking malls in the country, free from vehicular traffic, the visitors can take a leisurely walk along the street, rest on chairs and enjoy the beauty in a pollution free environment.
(ii) Improvement of public footpath at Kazi Road.
Gangtok has many such public footpaths which connect different arterial roads of the city. These footpaths which were constructed many years ago are back bones of internal connectivity of the city though most of them are in dilapidated condition.
During the first phase, the Gangtok Municipal Corporation undertook the repairing and remodelling of the footpath connecting Tibet Road and the Kazi Road of the city. This footpath is one of the most important connecting footpaths which is used by a large section of the public, office
Situation Before Improvement of Public Footpath at Kazi Road
Situation After Improvement of Public Footpath at Kazi Road

HUDCO AWARDED BEST PRACTICES
74 | HUDCO - HSMI Publication
goers and students. The footpath which was in dilapidated condition crosses through the alley which also provides support for drinking water pipes. The exposed pipes posed threat to the public using the footpath. The open drainage flowing along the footpath also posed health hazards to the people living nearby. considering its importance, the corporation undertook its repairing and remodelling at an estimated cost of R27.36 lakh under the BSUP programme.
Initially, people living in the surrounding areas protested, as they felt the digging of the already damaged footpath may lead to aggravation of existing problems. They were deeply sceptical about the early completion of the project. But the local ward councillor played a pivotal role in convincing the public and bringing them on board.
The footpath has been laid with kota stone and side walls with tiles
to make it more user friendly. All the drinking water pipes which were exposed along the path have been laid underground. The pipes can be repaired internally without digging the surface of the footpath. In order to facilitate people using the footpath at night, the footpath has been provided with new street lights. Now the citizens are happy with the new ambience that the renovated public path has provided.
Butterfly flyover bridge at Deorali. Deorali is one of the important hubs of the town. The area has residential localities with schools, offices and many prominant banks. The main national highway passes through the area which is always overcrowded with vehicular traffic.
People find it extremely difficult to cross the road to go to the other side of town, many accidents occured due to lack of proper crossing area. Keeping in mind the gravity of the problem, a new pedestrian flyover bridge has been constructed at Deorali which has eased the problem of the locality.
Construction of public footpath along the National Highway.Gangtok is one of few cities in the country which can boast of having a separate walk way for public along the national highway. A 12 km long public footpath connecting inner Gangtok to Ranipool bazaar (a suburb of the town) has been constructed to facilitate the safe walking for the public along the National Highway. The effort has reduced the chances of vehicles hitting the pedestrians walking along the road.
These initiatives have improved the overall image of Gangtok. Tourists and local citizens are happy with the city renewal project of the corporation.Source: HUDCO Award for Best Practice to Improve the Living Environment.
Butterfly flyover bridge at Deorali, Gangtok
Constructed public footpath along the National Highway

