october 2009 - hdfcfund.com · average assets under management for october 2009: rs. 93,316.04...
TRANSCRIPT

Vol. No. 7 Issue No. 4
Average assets under management for October 2009: Rs. 93,316.04 Crore
October 2009
The way to your first home
hdfc-cov-october-09.qxd 11/7/2009 4:55 PM Page 1
2 October 2009 Intouchmutually
The equity market retreated for the first timein several months. The Sensex and Niftyfell 7% each while the broader market fared
better with the CNX Midcap index down 2%.During the month, most of the attention was onthe second quarter results, which were more orless in line with expectations. Overseas, the keyissue remains the sustainability of the global eco-nomic recovery.
The Indian markets have rallied more than100% in just six months since their low in earlyMarch. After such a sharp rally some amount ofcorrection was not unexpected. While the shortterm direction of the market is very difficult topredict the longer-term outlook has decisivelyimproved. Economic activity is picking up as seenin the 10.4% rise in industrial production inAugust. India’s GDP is forecasted to grow at morethan 6.0%, putting it among the fastest growingeconomies in the world. At the same time liquidi-ty, both global and domestic is sufficient and con-tinues to provide the capital required to fuelIndia’s growth plans.
While the economic environment has certainlyimproved, we are not completely out of the woodsand reflecting that, the second quarter perform-ance was mixed. While revenues have come inmore or less as per expectations, cost cutting and cheaper raw material inputs have driven margin expansion. However, there have been significant variations across sectors. On one hand,
telecom and construction company results havebeen disappointing. On the other hand, consumer, pharmaceutical and financial sectors have put in a relatively better performance. In some cases,even within the same sector, the performance ofindividual companies has varied quite a bit.
Internationally, both developed and emergingmarkets corrected on concerns over the sustain-ability of the economic recovery. While data so far has been somewhat encouraging, it remainsto be seen how the global economy will fare oncethe economic stimulus wears off. During themonth, the MSCI Emerging Market Asia Indexfell 4%. Developed markets had a mixed perform-ance with the Dow flat while most European mar-kets were down between 2% and 5%. On thecommodity front, prices remained firm. Crudejumped 9% to $77/bbl, copper and zinc were up5% and 10% while aluminum and lead priceswere flat.
With valuations near their long-term average,we feel it is reasonable to expect that returns overa 3-5 year horizon will be driven more by earningsgrowth. Companies that have strong fundamentalsand are well managed are better positioned to takeadvantage of emerging opportunities and to with-stand any potential setbacks. Thus, we continue tomaintain a bottom up approach aimed at creatinga portfolio of high quality businesses, which areavailable at a reasonable price that can generatesuperior long-term returns. �
Equity market update
During the month of October 09, the yieldsin the debt markets moved higher. Theyield on the 10-year Government Security
increased by 0.15% over September 2009 to7.32% p.a. (source: Bloomberg).
The stock of liquidity (LAF + MSS + Surpluscash held by center) continued to remain comfort-able. The average LAF during the month wasRs.101,903 crs, which is lower by Rs. 18,661 crsover the average LAF maintained in the previousmonth. The NSE overnight MIBOR ended at3.29% slightly lower than the rate seen in endSeptember.
In October, WPI inflation has moved up to1.51% for the week ended October 17, 2009 ascompared to 0.70% for the week ended September26, 2009. INR appreciated to 46.9750 as compared
to 48.11 at end of previous month. Net FII invest-ment in equities & debt was an inflow of USD3428.10 million in October as compared to aninflow of USD 4262.60 million in September 2009.
During the month RBI in its mid-year mone-tary policy review withdrew some of the liquiditymeasures announced during the Oct-Dec 2008. Itmaintained the Reverse Repo and Repo rate at3.25% and 4.75% respectively, but increased thebank SLR to 25% from 24%. G-sec yields areexpected to be range bound as the government’sgross borrowing is lower than previous quarterand at the same time WPI inflation is expected tomove higher due to base effect. The Fund contin-ues to position itself in instruments and maturitybuckets that provide higher relative value in anattempt to deliver superior risk adjusted returns. �
Debt market update
Market Review
hdfc-mkt1:hdfc-mkt1.qxd 11/7/2009 05:39 PM Page 1

October 2009 3Intouchmutually
Buying your first home is not the easiest ofthings to do. There are plenty of factorsthat discourage potential home-buyers.
There are often contradictory reports of howeither ‘property prices will fall by 10 per cent’,or ‘property prices will rise by 20 per cent’. Thelack of any concrete information on the realestate market makes it impossible for someone todecide the direction in which property prices areheaded. Stories doing the rounds about how theprices of given properties shoot up by Rs 5 lakhin a week only stoke the doubts further.
However, if you are buying your first homeand have been waiting for the right time, let usstart with the basics. There is no right time to buyyour home. It is irrelevant whether the market isgoing up or down. If you have found the rightplace and at the price you can afford, just goahead and purchase it.
Identifying the property is not that easy,though. It should be guided by a few parameters.These include your affordability factor and thelocation. The location will depend on how muchyou can afford. Of course, if the house is reallygood, you might still be tempted to go in for it,even if it stretches your budget somewhat.
There is, of course, the crucial stage of soundfinancial planning, which should have buffers,apart from providing you with the initial budget.Before approaching a bank for the loan, you needto remember that you will need to generate the ini-tial 10 to 15 per cent. Unless you already have thisamount, here are a few options for you look at.
You can opt for a personal loan from a bank.Keep in mind that these will be more expensivethan home loans, increasing your monthly out-flow. You could also surrender your life insurancepolicy for a loan, or else, pledge your securitiessuch as shares, fixed deposits and gold. You could also turn to your Employee Provident Fund account to furnish yourself with the initial amount.
Once the property is decided and the initialdown payment provided for, you will need tohunt for the bank that gives you the best bargain.Here are the terms on which you should weighyour decision:
Interest rate – This is the most important fac-tor in any loan. The lower the interest rate, the bet-ter it is for you. However, bear in mind that many
banks offer a low rate for a limited time period,only to hike it in subsequent months. So, surveywhat other banks are offering. For example, if therates are hovering between 8.75 per cent and 9.75per cent (as currently offered by most banks), anda bank is offering less than 8 per cent, then it is outof sync with market conditions.
This implies that there will be a hike in therate after some time. And this can send yourbudget to go haywire. Also, while the bank maybe willing to give you more than 50-60 per centof your take-home salary as home loan, it isadvisable that you do not take up such offers.Ideally, limit the loan to 40 per cent of your take-home salary, so that you can use the rest forinvestment and other expenditures.
Pre-payment flexibility – Banks oftenimpose a pre-payment penalty, if you were to
The way to your first homeBuying your first home can be an arduous process. Here is a primer to make it a rewarding journey

4 October 2009 Intouchmutually
pay more than a certain percentage of the out-standing loan during the loan tenure. You needto negotiate with the bank so that this additionalexpense can be prevented. This is especiallyhelpful when the interest rate is rising and eitheryour Equated Monthly Installment (EMI) orloan tenure has to be increased. You can pre-paypart of the loan and keep both parameters thesame. It will be a big help if there is no extra coston this pre-payment.
However, what do you do if all major bankscut their prime lending rates (PLRs) and, conse-quently, home loan rates come down? (This hashappened over the past few months, enablinghome loan borrowers to heaving a sigh of relief.After over three years, home loan rates camedown as the Reserve Bank of India broughtdown benchmark rates and persuaded banks tocut their own lending rates.)
The result of this is that many borrowers nowhave the option of reducing either their equatedmonthly installments, or their loan tenure.Reduced EMIs may be appealing to borrowersbecause the repayment burden is now lower on amonthly basis. However, there is a catch to it. Ifthe tenure remains unchanged, there is a higherinterest outgo. A hypothetical example shouldmake this clear. If you have taken a loan of Rs50 lakh at 10 per cent interest for 15 years, theEMI would be Rs 53,730.
Now, say, the interest rate falls to 8 per centat the end of the third year. The bank gives youan option of reducing either the EMI or thetenure of the loan. Here’s how your optionswork out: With an outstanding principal ofalmost Rs 45 lakh at 8 per cent for 12 years, therevised EMI would be Rs 48,667 – a reductionby Rs 5,063 per month. But continuing with anEMI of Rs 53,730 would lead to winding up ofthe loan in 123 months (10 years and 3 months).That is, a saving of interest payment of 21months (12 years = 144 months). The saving isa huge Rs 4.10 lakh (approximately).
This is the reason why financial planners saythat reducing the tenure should be of primeimportance. “One should always look at thelowest tenure possible and then take a call on the
EMI,” says a certified financial planner.According to him, even if tax deduc-
tions are good, a big loan can hurt,because of unpredictable interest
rate movements. Administrative and processing
costs – These can hike your ini-tial cost substantially. Banks
charge you anything between 0.25 and
0.50 per cent of the loan amount for this. Forexample, a loan of Rs 20 lakh will attract any-thing between Rs 50,000 and Rs 1 lakh, which iscertainly not a small sum. Always negotiate thisamount. Most banks give you a relief on thesecosts during the festive season.
After you have decided on the bank, makesure that you have all the documents in place.This would include proof of your age, incomeand employment.
Property verification – This is anotherprocess you may have to go through, if thebuilding is not already approved by the bank. For new buildings, there would be verifi-cations on the stage of construction as men-tioned in the payment notice, layout of the flatsas per the guidelines of the municipal corpora-tion and ‘no objection certificates’ (NOCs) fromdifferent authorities.
In addition, the bank may want to go in for aproper valuation of the property. It may arrive ata valuation that is lower than what you haveagreed with the seller, and the loan amount willbe decided in accordance with the bank’s valua-tion. For second-hand buildings, a couple of cru-cial documents that have to be provided are thetitle document of the seller and a NOC from thehousing society.
There are still some pitfalls, essentiallybecause banks have recently tightened their lend-ing norms. For example, according to direct sell-ing agents (DSAs), in recent months there hasbeen a 5-10 per cent reduction in the loan-to-value (LTV) ratio, a significant amount if you arebuying a house. “Earlier, banks used to lend up to85-90 per cent of the agreement value (includingregistration and stamp duty charges). Today, thelimit is 75-80 per cent,” said one DSA.
Another important change is a reduction in theinstallment-to-income ratio (IIR). This decidesthe size of the loan you are eligible for, dependingon your take-home salary. DSAs said IIRs hadseen a fall of 5-10 per cent. The IIR is higher forthose with lower salaries. A person earning Rs20,000 will have an IIR of 55-60 per cent; forthose earning between Rs 25,000 and Rs 50,000,the IIR is 45-50 per cent, according to a DSA.
After all these steps, the bank would be readyto disburse the loan to you. Before you receivethe cheque, all the original documents will haveto be given and the home loan agreement signed.Tiring as these formalities may be, at the end ofthe day, you will be the proud owner of yourvery own home. ●
BS REPORTER

Intouchmutually October 2009 5
NNaattuurree ooff SScchheemmee
IInnvveessttmmeenntt OObbjjeeccttiivvee
FFuunndd MMaannaaggeerr
IInncceeppttiioonn DDaattee((DDaattee ooff AAlllloottmmeenntt))
EEnnttrryy // SSaalleess LLooaadd
EExxiitt LLooaadd
IInnvveessttmmeennttPPllaann // OOppttiioonnss
MMiinniimmuumm AApppplliiccaattiioonn AAmmoouunntt((UUnnddeerr eeaacchh PPllaann))
LLoocckk--iinn PPeerriioodd
NNeett AAsssseett VVaalluuee((NNAAVV))
RReeddeemmppttiioonnPPrroocceeeeddss
HDFC Growth
Fund
Open-ended GrowthScheme
To generate long termcapital appreciationfrom a portfolio that is invested predominantly in equity and equity related instruments.
Srinivas Rao Ravuri(since Apr 3, 06)
September 11, 2000
Growth & Dividend
Nil
Every Business Day
Normally despatchedwithin 3 BusinessDays.
HDFC Equity
Fund
Open-endedGrowth Scheme
To achieve capital appreciation.
Prashant Jain(since Jun 19, 03)*
January 1, 1995
Growth & Dividend
Nil
Every Business Day
Normallydespatched within3 Business Days.
HDFC Top 200
Fund
Open-ended Growth Scheme
To generate long term capital appreciation from aportfolio of equity and equity-linked instrumentsprimarily drawn from thecompanies in BSE 200index.
Prashant Jain(since Jun19, 03)*
October 11, 1996
Growth & Dividend
Nil
Every Business Day
Normally despatched within3 Business Days.
HDFC Capital
Builder Fund
Open-endedGrowth Scheme
To achieve capital appreciation in the long term.
Chirag Setalvad(since Apr 2, 07)
February 1, 1994
Growth & Dividend
Nil
Every Business Day
Normallydespatched within3 Business Days.
HDFC Core & Satellite
Fund
Open-ended GrowthScheme
To generate capital appreciation through equity investment in companies whose sharesare quoting at prices belowtheir true value.
Vinay Kulkarni(since Nov 21, 06)
September 17, 2004
Growth & Dividend
Nil
Every Business Day
Normally despatched within 3 Business Days.
HDFC Premier
Multi-Cap Fund
Open-ended Growth Scheme
To generate capital appreciation in the long term through equity investments by investing in a diversified portfolio of Mid Cap & Large Cap‘blue chip’ companies.
Vinay Kulkarni(since Nov 21, 06)
April 6, 2005
Growth & Dividend
Nil
Every Business Day
Normally despatchedwithin 3 Business Days.
NNoott AApppplliiccaabbllee.. Pursuant to SEBI circular no. SEBI/IMD/CIR No.4/ 168230/09 dated June 30, 2009, no entry load will be charged by the Scheme to theinvestor effective August 1, 2009. Upfront commission shall be paid directly by the investor to the ARN Holder (AMFI registered Distributor) based
on the investors’ assessment of various factors including the service rendered by the ARN Holder.
Purchase : Rs. 5,000 and any amount thereafter.
Additional Purchase : Rs. 1,000 and any amount thereafter.
The Dividend Option offers Dividend Payout and Reinvestment facility.
Investors are advised to consult their tax advisors with respect to the tax consequences of the purchase, ownership and disposal of mutual fund units.
For Tax Benefits / Consequences, Please refer to page 10
* Date of migration from Zurich India Mutual Fund
● In respect of eeaacchh purchase / switch-in of Units, an Exit Load of 1% is payable if units are redeemed / switched-out within 1 year from the date of allotment.
● No Exit Load is payable if Units are redeemed / switched-out after 1 year from the date of allotment.
No Entry / Exit Load shall be levied on bonus units and units allotted on dividend reinvestment.
Features of our following schemes
hdfc-fos.qxd 11/7/2009 5:00 PM Page 1
Features of our following schemes
Intouchmutually4 October 2009
NNaattuurree ooff SScchheemmee
IInnvveessttmmeenntt OObbjjeeccttiivvee
FFuunndd MMaannaaggeerr
IInncceeppttiioonn DDaattee((DDaattee ooff AAlllloottmmeenntt))
EEnnttrryy // SSaalleess LLooaadd
EExxiitt LLooaadd
IInnvveessttmmeennttPPllaann // OOppttiioonnss
MMiinniimmuumm AApppplliiccaattiioonn AAmmoouunntt((UUnnddeerr eeaacchh PPllaann))
LLoocckk--iinn PPeerriioodd
NNeett AAsssseett VVaalluuee((NNAAVV))
RReeddeemmppttiioonnPPrroocceeeeddss
HDFC Children’s Gift Fund^#
Open-ended Balanced Scheme
The primary objective of both the Plans viz.Investment Plan & Savings Plan under theScheme is to generate long term capital appreciation.
Chirag Setalvad (since April 2, 07)
March 2, 2001
● For Units subject to Lock-in Period: NIL● For Units not subject to Lock-in Period: 3%
if the Units are redeemed / switched-out within one year from the date of allotment;2% if the Units are redeemed / switched-outbetween the first and second year of the dateof allotment; 1% if Units are redeemed /switched-out between the second and thirdyear of the date of allotment; Nil if the Unitsare redeemed / switched -out after third yearfrom the date of allotment.
No Entry / Exit Load shall be levied on bonus units
IInnvveessttmmeenntt PPllaann :: (Equity Oriented)SSaavviinnggss PPllaann :: (Debt Oriented)
Purchase : Rs. 5,000 and any amount thereafter.Additional Purchase : Rs. 1,000 and anyamount thereafter.
IIff oopptteedd :: Until the Unit holder (being the beneficiary child) attains the age of 18 years or until completion of 3 years from date ofallotment, whichever is later.
Every Business Day
Normally despatched within 3 Business Days (subject to completion of Lock-in Period, if opted).
HDFC Arbitrage Fund
Open ended Equity Fund
To generate income through arbitrage opportunitiesbetween cash and derivative market and arbitrageopportunities within the derivative segment and bydeployment of surplus cash in debt securities and money market instruments.
Anil Bamboli (since Oct 23, 07)
October 23, 2007
RReettaaiill PPllaann && WWhhoolleessaallee PPllaann● In respect of eeaacchh purchase / switch-in of Units, an
Exit Load of 1% is payable if units are redeemed /switched-out within 1 year from the date of allotment.
● No Exit Load is payable if Units are redeemed /switched-out after 1 year from the date of allotment.
No Entry / Exit Load shall be levied on bonus units and units allotted on dividend reinvestment.
Wholesale Plan and Retail Plan – Both Plan offers Growth and Dividend Option. Dividend Option offersQuarterly Dividend Option with Payout and Reinvestment Facility.
Wholesale Plan: Purchase / Additional Purchase :Rs. 1 Crore and any amount thereafter.Retail Plan: Purchase / Additional Purchase : Growth / Quaterly Dividend Option: Rs. 5,000 and any amount thereafter.
Nil
Every Business Day
Normally despatched within 3 Business days.
^̂ EElliiggiibbiilliittyy ((ooff UUnniitt hhoollddeerr)) :: Children less than 18 years of age as on the date of investment by the Investor / Applicant are eligible as Unit holders in the Scheme. ## Personal Accident Insurance Cover for Parent / Legal Guardian (upto the age of80 years) of the Unit holder, equivalent to 10 times the cost value of the outstanding Units held by the Unit holder under all the applications / account statements / folios, subject to a maximum amount of Rs. 10 lakhs per Unit holder. The insur-ance premium in respect of the personal accident insurance cover will be borne by the AMC. This accident insurance cover is subject to conditions of the group personal accident insurance policy. Investors are advised to consult their tax advisors with respect to the tax consequences of the purchase, ownership and disposal of mutual fund units. For Tax Benefits / Consequences, Please refer to page 10
HDFC Index Fund
Open-ended Index Linked Scheme
NNiiffttyy PPllaann :: To generate returns that arecommensurate with the performance ofthe Nifty, subject to tracking errors.SSEENNSSEEXX PPllaann :: To generate returns that arecommensurate with the performance of the SENSEX, subject to tracking errors.SSEENNSSEEXX PPlluuss PPllaann :: To invest 80 to 90% ofthe net assets of the Plan in companieswhose securities are included in SENSEX and between 10% & 20% of the net assetsin companies whose securities are not included in the SENSEX.
Vinay Kulkarni (since Dec 29, 06)
July 17, 2002
Nil
No Entry / Exit Load shall be levied on bonus units.
Nifty Plan, SENSEX Plan, SENSEX Plus PlanAt present, each Plan offers Growth Optiononly.
Purchase : Rs. 5,000 and any amount thereafter.Additional Purchase : Rs. 1,000 and anyamount thereafter.
Nil
Every Business Day
Normally despatched within3 Business Days.
NNoott AApppplliiccaabbllee.. Pursuant to SEBI circular no. SEBI/IMD/CIR No.4/ 168230/09 dated June 30, 2009, no entry load will be charged by the Scheme tothe investor effective August 1, 2009. Upfront commission shall be paid directly by the investor to the ARN Holder (AMFI registered Distributor)
based on the investors’ assessment of various factors including the service rendered by the ARN Holder.
hdfc-fos.qxd 11/7/2009 5:00 PM Page 2

Intouchmutually October 2009 7
Features of our following schemes
NNaattuurree ooff SScchheemmee
IInnvveessttmmeenntt OObbjjeeccttiivvee
FFuunndd MMaannaaggeerrss
IInncceeppttiioonn DDaattee((DDaattee ooff AAlllloottmmeenntt))
EEnnttrryy // SSaalleess LLooaadd
EExxiitt LLooaadd
IInnvveessttmmeennttPPllaann // OOppttiioonnss
MMiinniimmuumm AApppplliiccaattiioonn AAmmoouunntt
LLoocckk--iinn PPeerriioodd
NNeett AAsssseett VVaalluuee((NNAAVV))
RReeddeemmppttiioonnPPrroocceeeeddss
Investors are advised to consult their tax advisors with respect to the tax consequences of the purchase, ownership and disposal of mutual fund units. # Previously HDFC Tax Plan 2000For Tax Benefits / Consequences, Please refer to page 10
* Date of migration from Zurich India Mutual Fund
HDFC Balanced Fund
Open-ended Balanced Scheme
To generate capital appreciationalong with current income from a combined portfolio of equity &equity-related and debt & moneymarket instruments.
Chirag Setalvad (since April 2, 07)
September 11, 2000
● In respect of eeaacchh purchase /switch-in of Units, an Exit Loadof 1% is payable if units areredeemed / switched-out within1 year from the date of allotment.
● No Exit Load is payable if Unitsare redeemed / switched-outafter 1 year from the date ofallotment.
Growth & Dividend
Nil
Every Business Day
Normally despatched within 3 Business Days.
HDFC Prudence Fund
Open-ended Balanced Scheme
To provide periodic returns and capital appreciation over a longperiod of time from a judicious mixof equity and debt investments withan aim to prevent / minimise anycapital erosion.
Prashant Jain (since Jun 19, 03)*
February 1, 1994
● In respect of eeaacchh purchase /switch-in of Units, an Exit Loadof 1% is payable if units areredeemed / switched-out within 1 year from the date of allotment.
● No Exit Load is payable if Unitsare redeemed / switched-outafter 1 year from the date ofallotment.
Growth & Dividend
Nil
Every Business Day
Normally despatched within 3 Business Days.
HDFC Long Term AdvantageFund #
Open-ended Equity Linked SavingsScheme with a lock-in period of 3 years
To generate long term capital appreciation from a portfolio that is invested predominantly in equity and equity-related instruments.
Chirag Setalvad (since April 2, 2007)
January 2, 2001
Nil
Growth & Dividend
Every Business Day
HDFC TaxSaver
Open-ended Equity Linked SavingsScheme with a lock-in period of 3 years
To achieve long term growth of capital.
Vinay Kulkarni (since Nov 21, 2006)
March 31, 1996
Nil
Growth & Dividend
Every Business Day
3 years from the date of allotment of the respective Units
Normally despatched within 3 Business Days (subject to completionof Lock-in Period).
The Dividend Option offers Dividend payout and Reinvestment facility.
No Entry/Exit Load shall be levied on bonus units and units allotted on dividend reinvestment.
NNoott AApppplliiccaabbllee.. Pursuant to SEBI circular no. SEBI/IMD/CIR No.4/ 168230/09 dated June 30, 2009, no entry load will be charged by the Scheme to theinvestor effective August 1, 2009. Upfront commission shall be paid directly by the investor to the ARN Holder (AMFI registered Distributor) based on
the investors’ assessment of various factors including the service rendered by the ARN Holder.
For Purchase & Additional Purchase : Rs. 500 and in multiples of Rs 500 thereafter.
Purchase : Rs. 5,000 and any amount thereafter.Additional Purchase : Rs. 1,000 and any amount thereafter.
hdfc-fos.qxd 11/7/2009 5:00 PM Page 3

Features of our following schemes
Intouchmutually8 October 2009
Investors are advised to consult their tax advisors with respect to the tax consequences of the purchase, ownership and disposal of mutual fund units. For Tax Benefits / Consequences, Please refer to page 10
HDFC Income Fund
Open-ended Income Scheme
To optimise returns while maintaining a balance of safety, yield and liquidity.
Shobhit Mehrotra(since Sep 1, 07)
September 11, 2000
● In respect of eeaacchh purchase /switch-in of Units, an ExitLoad of 1% is payable ifunits are redeemed /switched-out within 1 year from the date of allotment.
● No Exit Load is payable ifUnits are redeemed /switched-out after 1 yearfrom the date of allotment.
Nil
Every Business Day
Normally despatched within 3 Business Days
HDFC Multiple Yield Fund– Plan 2005
Open-ended Income Scheme
To generate positive returns over medium time frame withlow risk of capital loss overmedium time frame.
Chirag Setalvad (Equities), (since April 2, 07)Anil Bamboli (Debt)(since Aug 17, 05)
August 17, 2005
● In respect of eeaacchh purchase/ switch-in of Units, an ExitLoad of 1% is payable ifunits are redeemed /switched-out within 15months from the date of allotment.
● No Exit Load is payable ifUnits are redeemed /switched-out after 15months from the date ofallotment.
Nil
Every Business Day
Normally depatched within 3 Business Days
HDFC Multiple Yield Fund
Open-ended Income Scheme
To generate positive returnsover medium time frame withlow risk of capital loss overmedium time frame.
Vinay Kulkarni (Equities), (since Nov 21, 06)Anil Bamboli (Debt)(since Sep 17, 04)
September 17, 2004
● In respect of eeaacchh purchase/ switch-in of Units, an ExitLoad of 1% is payable ifunits are redeemed /switched-out within 1 year from the date of allotment.
● No Exit Load is payable ifUnits are redeemed /switched-out after 1 yearfrom the date of allotment.
Nil
Every Business Day
Normally depatched within 3 Business Days
NNaattuurree ooff SScchheemmee
IInnvveessttmmeenntt OObbjjeeccttiivvee
FFuunndd MMaannaaggeerrss
IInncceeppttiioonn DDaattee((DDaattee ooff AAlllloottmmeenntt))
EEnnttrryy // SSaalleess LLooaadd
EExxiitt LLooaadd
IInnvveessttmmeennttPPllaann // OOppttiioonnss
MMiinniimmuumm AApppplliiccaattiioonn AAmmoouunntt
LLoocckk--iinn PPeerriioodd
NNeett AAsssseett VVaalluuee((NNAAVV))
RReeddeemmppttiioonnPPrroocceeeeddss
Growth & Dividend. The Dividend Option offers Dividend Payout and Reinvestment facility.
Purchase : Rs 5,000 and any amount thereafter. Additional Purchase : Rs. 1,000 and any amount thereafter.
HDFC MF Monthly Income Plan
An open-ended income scheme. Monthly income is not assured and is subject to availability of distributable surplus
The primary objective of Scheme is to generate regularreturns through investment primarily in Debt and Money Market Instruments. The secondary objective of the Scheme is to generate long-term capital appreciation by investing a portion of the Scheme’sassets in equity and equity related instruments.
LTP – Prashant Jain (Equities) (since Dec 26, 03),Shobhit Mehrotra (Debt) (since Sep 1, 07),STP – Vinay Kulkarni (Equities) (since Nov 21, 06),Shobhit Mehrotra (Debt) (since Feb 16, 04)
December 26, 2003
FFoorr SShhoorrtt--TTeerrmm PPllaann && LLoonngg--TTeerrmm PPllaann● In respect of eeaacchh purchase / switch-in of Units, an
Exit Load of 1% is payable if units are redeemed /switched-out within 1 year from the date of allotment.
● No Exit Load is payable if Units are redeemed /switched-out after 1 year from the date of allotment.
Short Term Plan (STP) & Long Term Plan (LTP). Each Planoffers Growth, Monthly Dividend & Quarterly DividendOption. The Dividend Option offers Dividend Payout andReinvestment facility.
SShhoorrtt TTeerrmm PPllaann :: Purchase : (Growth & Quarterly Dividend Option) – Rs. 5,000 andany amount thereafter under each Option.(Monthly Dividend Option) – Rs. 25,000 and anyamount thereafter.Additional Purchase : Rs. 1,000 and any amount thereafter.LLoonngg TTeerrmm PPllaann :: Purchase :(Growth & Quarterly Dividend Option) – Rs. 5,000 andany amount thereafter under each Option.(Monthly Dividend Option) – Rs. 25,000 and anyamount thereafter.Additional Purchase : Rs. 1,000 and any amount thereafter.
Nil
Every Business Day
Normally despatched within 3 Business Days
NNoott AApppplliiccaabbllee.. Pursuant to SEBI circular no. SEBI/IMD/CIR No.4/ 168230/09 dated June 30, 2009, no entry load will be charged by the Scheme to theinvestor effective August 1, 2009. Upfront commission shall be paid directly by the investor to the ARN Holder (AMFI registered Distributor) based on
the investors’ assessment of various factors including the service rendered by the ARN Holder.
No Entry/Exit Load shall be levied on bonus units and units allotted on dividend reinvestment.
hdfc-fos.qxd 11/7/2009 5:00 PM Page 4

NNaattuurree ooff SScchheemmee
IInnvveessttmmeenntt OObbjjeeccttiivvee
FFuunndd MMaannaaggeerrss
IInncceeppttiioonn DDaattee((DDaattee ooff AAlllloottmmeenntt))
EEnnttrryy // SSaalleess LLooaadd
EExxiitt LLooaadd
IInnvveessttmmeennttPPllaann // OOppttiioonnss
MMiinniimmuumm AApppplliiccaattiioonn AAmmoouunntt
LLoocckk--iinn PPeerriioodd
NNeett AAsssseett VVaalluuee((NNAAVV))
RReeddeemmppttiioonnPPrroocceeeeddss
HDFC Cash Management Fund
Savings & Call Plan: Open ended High LiquidityIncome Scheme.Treasury Advantage Plan* : Open-endedIncome Scheme.
Savings & Call Plan: To generateoptimal returns while maintainingsafety and high liquidity.Treasury Advantage Plan*: To generate regularincome through investment in debt securities and money market instruments.
Anil Bamboli – Treasury Advantage Plan (since Sep 1, 07)Bharat Pareek– Call Plan (since May 23, 08),Savings Plan (w.e.f. Oct 1, 09)
Savings & Treasury Advantage Plan* :November 18, 1999Call Plan : February 6, 2002
Savings, Treasury Advantage* & Call Plan : Nil
SSaavviinnggss PPllaann && CCaallll PPllaann :: Growth Option & Daily Dividend Option (with Reinvestment facility only). Savings Plan also offers WeeklyDividend Option (with payout andReinvestment facility. TTrreeaassuurryy AAddvvaannttaaggee PPllaann** :: ((RReettaaiill aannddWWhhoolleessaallee OOppttiioonn)) Growth and DividendOption. Dividend Option offers Daily DividendOption with Reinvestment facility only andWeekly and Monthly Dividend Option with payout and Reinvestment facility.
SSaavviinnggss PPllaann :: ((GGrroowwtthh OOppttiioonn))Purchase / Additional Purchase: Rs. 10,000 and any amount thereafter.((DDiivviiddeenndd OOppttiioonn)) Purchase / AdditionalPurchase: Rs. 1,00,000 and any amount thereafter.CCaallll PPllaann :: ((UUnnddeerr EEaacchh OOppttiioonn))Purchase / Additional Purchase: Rs. 1,00,000and any amount thereafter.TTrreeaassuurryy AAddvvaannttaaggee PPllaann** –– RReettaaiill OOppttiioonnGrowth, Weekly and Monthly Dividend OptionPurchase : Rs. 5,000 and any amount thereafter.Additional Purchase: Rs. 1,000 and anyamount thereafter.Daily Dividend Option Purchase / Additional Purchase: Rs. 1,00,000 and any amount thereafter.TTrreeaassuurryy AAddvvaannttaaggee PPllaann** –– WWhhoolleessaallee OOppttiioonnPurchase : Rs. 1 Crore and any amount thereafter.Additional Purchase : Re. 1 and any amountthereafter.
Nil
Savings & Call Plan: All Year RoundTreasury Advantage Plan*: Every Business Day
Savings & Call Plan : Normally despatchedwithin 1 Business Day.Treasury Advantage Plan*: Normally despatched within 3 Business Days.
Investors are advised to consult their tax advisors with respect to the tax consequences of the purchase, ownership and disposal of mutual fund units. For Tax Benefits / Consequences, Please refer to page 10* erstwhile HDFC Cash Management Fund - Savings Plus Plan
HDFC Short Term Plan (STP)
Open-ended Income Scheme
To generate regular income through investment in Debt Securities and MoneyMarket Instruments.
Anil Bamboli (since Jan 13, 04)
February 28, 2002
● In respect of eeaacchh purchase /switch-in of Units, an Exit Load of0.50% is payable if units areredeemed / switched-out within 3months from the date of allotment.
● No Exit Load is payable if Units areredeemed / switched-out after 3months from the date of allotment.
Growth & Dividend (Dividend Option offers payout and Reinvestment facility).
Purchase : Rs. 5,000 and any amountthereafter.Additional Purchase : Rs. 1,000 and anyamount thereafter.
Nil
Every Business Day
Normally despatched within 3 Business Days.
HDFC Liquid Fund (HLF)
Open-ended Liquid Income Scheme
To enhance income consistent with a high level of liquidity, through a judicious portfolio mix comprising of money market and debtinstruments.
Shobhit Mehrotra (since Feb 16, 04)
HLF : October 17, 2000HLF – Premium Plan & HLF – Premium Plus Plan :February 24, 2003
Nil
HLF, HLF – Premium Plan & HLF – Premium Plus Plan. Each Plan offers Growth & Dividend Option.HLF – The Dividend Option offers Daily DividendOption (Reinvestment facility only) and Weeklyand Monthly Dividend Option (with payout andReinvestment facility).HLF Premium Plan – The Dividend Option offersDaily Dividend Option (with Reinvestment facilityonly) and Weekly Dividend Option (with payoutand Reinvestment facility).HLF Premium Plus Plan – The Dividend Optionoffers Weekly Dividend Option (with payout andReinvestment facility).
HHLLFF :: Growth Option : Purchase / AdditionalPurchase: Rs. 10,000 and any amount thereafter. Dividend Option : Purchase / Additional Purchase:Rs. 1,00,000 and any amount thereafter.HHLLFF –– PPrreemmiiuumm PPllaann (Purchase) :: Rs. 5,00,00,000 and any amount thereafter for opening an account / folio (Under each Option). HHLLFF –– PPrreemmiiuumm PPlluuss PPllaann (Purchase) : Rs. 20,00,00,000 and any amount thereafter for opening an account / folio (Undereach Option). HLF – Premium Plan & HLF – Premium Plus Plan(Additional Purchase) : Re. 1 and and anyamount thereafter under each Option.
Nil
All Year Round
Normally despatched within 1 Business Day.
HDFC High Interest Fund (HHIF)
Open-ended Income Scheme
To generate income by investing in a range of debt and money market instruments of various maturity dates with a view to maximise income while maintaining the optimum balance of yield, safety and liquidity.
Anil Bamboli (HHIF) (since Feb 16, 04), Shobhit Mehrotra – STP (since Sep 1, 07)
HHIF : April 28, 1997HHIF-STP : February 6, 2002
HHHHIIFF ::● In respect of eeaacchh purchase / switch-in
of Units, an Exit Load of 0.50 % ispayable if units are redeemed /switched-out within 6 months year fromthe date of allotment.
● No Exit Load is payable if Units areredeemed / switched-out after 6 monthsfrom the date of allotment.
HHHHIIFF -- SSTTPP :: In respect of each purchase /switch-in of units, an Exit Load of 0.25% ispayable if units are redeemed / switched-outwithin 1 month from the date of allotment.
HHHHIIFF :: Growth, Quarterly, Half Yearly and Yearly Dividend Options.HHHHIIFF--SSTTPP :: Growth & Dividend OptionAll Dividend Options offer Dividend Payout andReinvestment facility.
(Under each Plan)Purchase : Rs. 5,000 and any amount thereafter.Additional Purchase : Rs. 1,000 and anyamount thereafter.
Nil
Every Business Day
Normally despatched within 3 Business Days
No Entry/Exit Load shall be levied on bonus units and units allotted on dividend reinvestment.
NNoott AApppplliiccaabbllee.. Pursuant to SEBI circular no. SEBI/IMD/CIR No.4/ 168230/09 dated June 30, 2009, no entry load will be charged by the Scheme to the investor effective August 1, 2009.Upfront commission shall be paid directly by the investor to the ARN Holder (AMFI registered Distributor) based on the investors’ assessment of various factors including the service
rendered by the ARN Holder.
Intouchmutually October 2009 9
Features of our following schemes
hdfc-fos.qxd 11/7/2009 5:00 PM Page 5
Features of our following schemes
Intouchmutually10 October 2009
HDFC Floating Rate Income Fund
Open-ended Income Scheme.
To generate regular income through investment in a portfolio comprising substantially of floatingrate debt / money market instruments, fixed rate debt / money market instruments swapped forfloating rate returns and fixed rate debt securities and money market instruments.
Shobhit Mehrotra (since Feb 16, 04)
January 16, 2003
SShhoorrtt TTeerrmm PPllaann :: NilLLoonngg TTeerrmm PPllaann :: ● In respect of eeaacchh purchase / switch-in of Units, an Exit Load of 3% is payable if units are
redeemed / switched-out within 18 months from the date of allotment.● No Exit Load is payable if Units are redeemed / switched-out after 18 months from the
date of allotment.
SShhoorrtt TTeerrmm PPllaann :: For investors who wish to invest for short time period.LLoonngg TTeerrmm PPllaann :: For investors who wish to invest for relatively longer time period. SShhoorrtt TTeerrmm PPllaann –– WWhhoolleessaallee && RReettaaiill OOppttiioonn :: Growth and Dividend Option. The Dividend Optionoffers Daily Dividend Option (with Reinvestment facility only) and Weekly and Monthly DividendOption (with payout and Reinvestment facility).LLoonngg TTeerrmm PPllaann :: Growth and Weekly Dividend Option (with Reinvestment facility only).
SShhoorrtt TTeerrmm PPllaann –– RReettaaiill OOppttiioonn :: ((GGrroowwtthh OOppttiioonn,, WWeeeekkllyy DDiivviiddeenndd OOppttiioonn &&MMoonntthhllyy DDiivviiddeenndd OOppttiioonn))Purchase : Rs 5,000 and any amount thereafter.Additional Purchase : Rs 1,000 and any amount thereafter.((DDaaiillyy DDiivviiddeenndd OOppttiioonn)) Purchase / Additional Purchase : Rs 1 lakh and any amount thereafter.SShhoorrtt TTeerrmm PPllaann –– WWhhoolleessaallee OOppttiioonn :: ((GGrroowwtthh OOppttiioonn,, DDaaiillyy DDiivviiddeenndd OOppttiioonn,, WWeeeekkllyy DDiivviiddeenndd OOppttiioonn && MMoonntthhllyy DDiivviiddeenndd OOppttiioonn))Under each option : Purchase : Rs 1 crore and any amount thereafter.Additional Purchase : Re 1 and and any amount thereafter.LLoonngg TTeerrmm PPllaann :: For Purchase : Rs. 5,000 and any amount thereafter.Additional Purchase : Rs. 1,000 and any amount thereafter.
Nil
Every Business Day
Normally despatched within 3 Business Days.
HDFC Gilt Fund
Open-ended Income Scheme.
To generate credit risk-free returns through investmentsin sovereign securities issued by the Central Governmentand / or a State Government.
Anil Bamboli (since Sep 1, 2007)
July 25, 2001
Nil
SShhoorrtt TTeerrmm PPllaann :: For investors who wish to invest for short time period. LLoonngg TTeerrmm PPllaann :: For investors who wish to invest forrelatively longer time period.
(Under each Plan / Option)Purchase :Rs. 5,000 and any amount thereafter.Additional Purchase :Rs. 1,000 and any amount thereafter.
Nil
Every Business Day
Normally despatched within 3 Business Days.
NNaattuurree ooff SScchheemmee
IInnvveessttmmeenntt OObbjjeeccttiivvee
FFuunndd MMaannaaggeerr
IInncceeppttiioonn DDaattee((DDaattee ooff AAlllloottmmeenntt))
EEnnttrryy // SSaalleess LLooaadd
EExxiitt LLooaadd
IInnvveessttmmeenntt
MMiinniimmuumm AApppplliiccaattiioonn AAmmoouunntt
LLoocckk--iinn PPeerriioodd
NNeett AAsssseett VVaalluuee((NNAAVV))
RReeddeemmppttiioonnPPrroocceeeeddss
Each Plan offers Growth and Dividend Options.The Dividend Option offers Dividend Payout andReinvestment facility.
Investors are advised to consult their tax advisors with respect to the tax consequences of the purchase, ownership and disposal of mutual fund units.
TTaaxx BBeenneeffiittss // CCoonnsseeqquueenncceess :: Income distributed by the Scheme(s) will be exempt from Income-tax in the hands of investors. Distribution tax in case of Scheme(s) other than equity-oriented funds shall bepayable by the mutual fund at the rate of 14.1625% (including surcharge @10%, education cess @2% and secondary and higher education cess @1%) on income distributed to an individual/HUF and atthe rate of 22.66% (including surcharge @10%, education cess @2% and secondary and higher education cess @1%) on income distributed to any other investor. In case of income distributed by LiquidFunds and Money Market Mutual Funds, Dividend Distribution Tax is payable by the Mutual Fund @28.325% (including surcharge @10%, education cess @2% and secondary and higher education cess@1%). Units of the Scheme(s) are not subject to Wealth-tax and Gift-tax. Unit holders are required to pay Securities Transaction Tax (STT) at the rate of 0.25% at the time of redemption / switch-out of unitsof an equity-oriented fund.GGiifftt ooff UUnniittss :: With effect from 1.10.2009, as per the provisions of section 56(2)(vii) of the Income-tax Act, 1961, certain specified property transferred, without consideration / adequate consideration,exceeding specified limits, are taxable in the hands of the recipient individual / HUF (subject to certain exceptions). The term “property” includes shares and securities. Units of a mutual fund could fall withinthe purview of the term “securities”. Investors should be aware that the fiscal rules / tax laws may change and there can be no guarantee that the current tax position may continue indefinitely. In view of individual nature of tax consequences,each investor is advised to consult his / her own professional tax advisor.
FFuunndd MMaannaaggeerr TToottaall EExxppeerriieenncceePrashant Jain Over 18 yearsShobhit Mehrotra Over 16 yearsAnil Bamboli Over 14 yearsVinay Kulkarni Over 18 yearsChirag Setalvad Over 12 yearsSrinivas Rao Ravuri Over 14 yearsBharat Pareek Over 8 years
No Entry / Exit Load shall be levied on bonus units and units allotted on dividend reinvestment.
NNoott AApppplliiccaabbllee.. Pursuant to SEBI circular no. SEBI/IMD/CIR No.4/ 168230/09 dated June 30, 2009, no entry load will be charged by the Scheme to the investor effective August 1, 2009. Upfront commission shall be paid directly by the investor to the ARN Holder (AMFI registered Distributor) based on the investors’
assessment of various factors including the service rendered by the ARN Holder.
hdfc-fos.qxd 11/7/2009 5:00 PM Page 6

DDaattee PPeerriioodd NNAAVV RReettuurrnnss BBeenncchhmmaarrkkppeerr UUnniitt ((RRss..)) ((%%))^̂ RReettuurrnnss ((%%))##
^̂PPaasstt ppeerrffoorrmmaannccee mmaayy oorr mmaayy nnoott bbee ssuussttaaiinneedd iinn tthhee ffuuttuurreePerformance of the Dividend Option for the investor would be net of Distribution Tax as applicable* Absolute Returns ** Compounded Annualised Returns # SENSEX~Due to an over all sharp rise in the stock prices
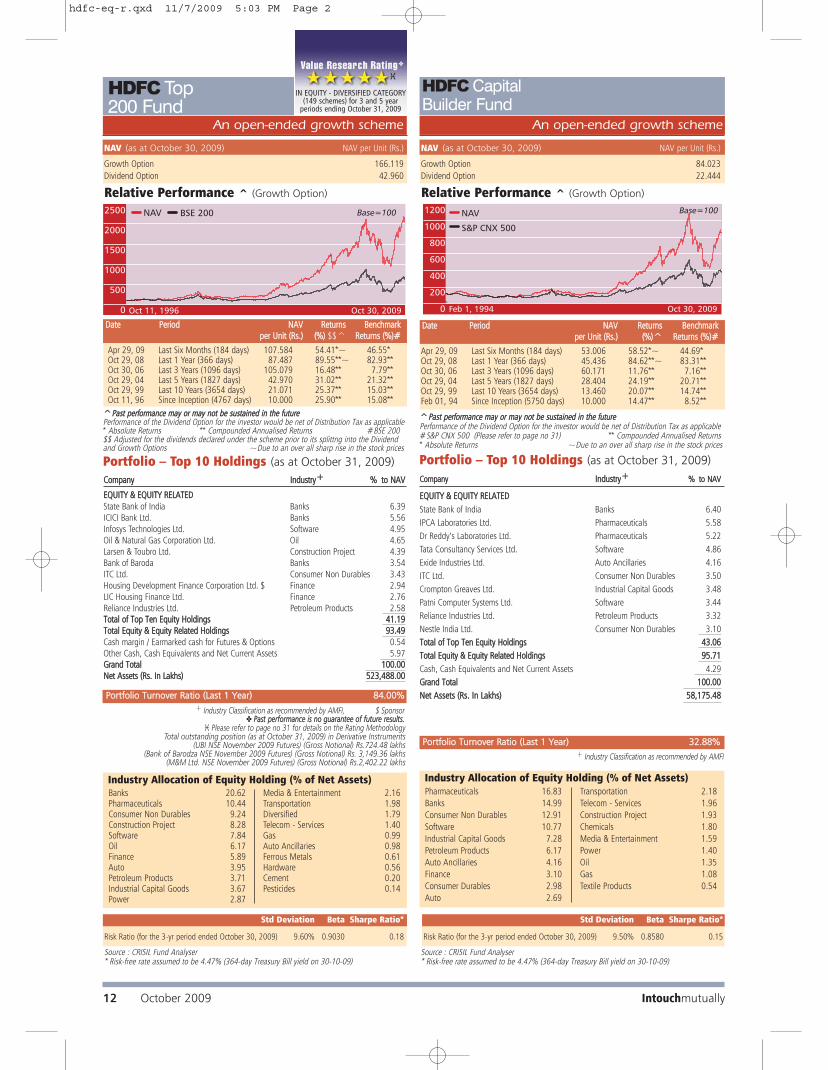
Portfolio – Top 10 Holdings (as at October 31, 2009)
HDFC
Growth Fund
Relative Performance ^ (Growth Option)
+ Industry Classification as recommended by AMFI, $ Sponsor✤ PPaasstt ppeerrffoorrmmaannccee iiss nnoo gguuaarraanntteeee ooff ffuuttuurree rreessuullttss..
� Please refer to page no 31 for details on the Rating MethodologyTotal outstanding position (as at October 31, 2009) in Derivative Instruments
(Suzlon NSE November 2009 Futures) (Gross Notional) Rs. 753.19 lakhs
An open-ended growth scheme
HDFC
Equity FundAn open-ended growth scheme
Banks 14.44Petroleum Products 9.83Pharmaceuticals 9.53Consumer Non Durables 9.03Media & Entertainment 8.82Industrial Capital Goods 7.06Oil 6.16Auto Ancillaries 5.28Software 4.83Finance 3.79
Construction Project 2.70Fertilisers 2.66Chemicals 2.53Telecom - Services 2.34Construction 2.20Transportation 1.07Ferrous Metals 1.02Paper Products 0.69Industrial Products 0.20
Industry Allocation of Equity Holding (% of Net Assets)
PPoorrttffoolliioo TTuurrnnoovveerr RRaattiioo ((LLaasstt 11 YYeeaarr)) 5566..4466%%
NAV (as at October 30, 2009) NAV per Unit (Rs.)
Growth Option 66.859Dividend Option 28.798
Std Deviation Beta Sharpe Ratio*
Risk Ratio (for the 3-yr period ended October 30, 2009) 9.40% 0.9490 0.16
Std Deviation Beta Sharpe Ratio*
Risk Ratio (for the 3-yr period ended October 30, 2009) 10.10% 0.9270 0.17
IN EQUITY - DIVERSIFIED CATEGORY(149 schemes) for 3 and 5 year
periods ending October 31, 2009
DDaattee PPeerriioodd NNAAVV RReettuurrnnss BBeenncchhmmaarrkkppeerr UUnniitt ((RRss..)) ((%%))^̂ RReettuurrnnss ((%%))##
Relative Performance ^ (Growth Option)
^̂PPaasstt ppeerrffoorrmmaannccee mmaayy oorr mmaayy nnoott bbee ssuussttaaiinneedd iinn tthhee ffuuttuurreePerformance of the Dividend Option for the investor would be net of Distribution Tax as applicable** Compounded Annualised Returns #S&P CNX 500 (Please refer to page no 31) * Absolute Returns ~Due to an over all sharp rise in the stock prices
Apr 29, 09 Last Six Months (184 days) 127.097 64.46*~ 44.69*Oct 29, 08 Last 1 Year (366 days) 105.630 97.51**~ 83.31**Oct 30, 06 Last 3 Years (1096 days) 139.407 14.44** 7.16**Oct 29, 04 Last 5 Years (1827 days) 54.963 30.59** 20.71**Oct 29, 99 Last 10 Years (3654 days) 18.850 27.17** 14.74**Jan 01, 95 Since Inception (5416 days) 10.000 22.74** 9.71**
Apr 29, 09 Last Six Months (184 days) 44.131 51.50*~ 39.40*Oct 29, 08 Last 1 Year (366 days) 39.940 67.16**~ 75.49**Oct 30, 06 Last 3 Years (1096 days) 45.185 13.94** 6.86**Oct 29, 04 Last 5 Years (1827 days) 19.520 27.88** 22.86**Sep 11, 00 Since Inception (3336 days) 10.000 23.11** 14.27**
NAV (as at October 30, 2009) NAV per Unit (Rs.)
Growth Option 209.023Dividend Option 41.963
Portfolio – Top 10 Holdings (as at October 31, 2009)
PPoorrttffoolliioo TTuurrnnoovveerr RRaattiioo ((LLaasstt 11 YYeeaarr)) 110077..2277%%+ Industry Classification as recommended by AMFI✤ PPaasstt ppeerrffoorrmmaannccee iiss nnoo gguuaarraanntteeee ooff ffuuttuurree rreessuullttss..
� Please refer to page no 31 for details on the Rating Methodology
Banks 20.04Pharmaceuticals 15.69Consumer Non Durables 10.22Media & Entertainment 8.22Oil 6.20Finance 5.88Software 4.94Construction Project 4.64Auto Ancillaries 4.25Industrial Capital Goods 3.57
Auto 3.34Power 2.88Transportation 2.69Hardware 2.61Construction 1.12Ferrous Metals 0.63Chemicals 0.44Textile Products 0.43Textiles - Synthetic 0.31
Industry Allocation of Equity Holding (% of Net Assets)
CCoommppaannyy IInndduussttrryy++ %% ttoo NNAAVV
EEQQUUIITTYY && EEQQUUIITTYY RREELLAATTEEDDState Bank of India Banks 6.82 Zee Entertainment Enterprises Ltd. Media & Entertainment 6.44 ITC Ltd. Consumer Non Durables 5.81 Bharat Petroleum Corporation Ltd. Petroleum Products 5.40 Oil & Natural Gas Corporation Ltd. Oil 5.28 Crompton Greaves Ltd. Industrial Capital Goods 5.23 ICICI Bank Ltd. Banks 5.15 Infosys Technologies Ltd. Software 4.83 Sun Pharmaceutical Industries Ltd. Pharmaceuticals 4.01 Housing Development Finance Corporation Ltd. $ Finance 3.79 TToottaall ooff TToopp TTeenn EEqquuiittyy HHoollddiinnggss 5522..7766TToottaall EEqquuiittyy && EEqquuiittyy RReellaatteedd HHoollddiinnggss 9944..1188Short Term Deposits as margin for Futures & Options 0.78 Cash margin 0.38 Other Cash, Cash Equivalents and Net Current Assets 4.66 GGrraanndd TToottaall 110000..0000NNeett AAsssseettss ((RRss.. IInn LLaakkhhss)) 112277,,889988..9933
CCoommppaannyy IInndduussttrryy++ %% ttoo NNAAVV
EEQQUUIITTYY && EEQQUUIITTYY RREELLAATTEEDD
State Bank of India Banks 6.86
Oil & Natural Gas Corporation Ltd. Oil 5.03
ICICI Bank Ltd. Banks 4.52
Bank of Baroda Banks 4.31
LIC Housing Finance Ltd. Finance 3.46
Dr Reddy’s Laboratories Ltd. Pharmaceuticals 3.21
Lupin Ltd. Pharmaceuticals 2.99
Sun Pharmaceutical Industries Ltd. Pharmaceuticals 2.92
Zee Entertainment Enterprises Ltd. Media & Entertainment 2.89
NTPC Ltd. Power 2.88
TToottaall ooff TToopp TTeenn EEqquuiittyy HHoollddiinnggss 3399..0077
TToottaall EEqquuiittyy && EEqquuiittyy RReellaatteedd HHoollddiinnggss 9988..1100
Cash, Cash Equivalents and Net Current Assets 1.90
GGrraanndd TToottaall 110000..0000
NNeett AAsssseettss ((RRss.. IInn LLaakkhhss)) 447722,,443388..0066
IN EQUITY - DIVERSIFIED CATEGORY(149 schemes) for 3 and 5 year
periods ending October 31, 2009
Source : CRISIL Fund Analyser* Risk-free rate assumed to be 4.47% (364-day Treasury Bill yield on 30-10-09)
Source : CRISIL Fund Analyser* Risk-free rate assumed to be 4.47% (364-day Treasury Bill yield on 30-10-09)
Intouchmutually October 2009 11
hdfc-eq-r.qxd 11/7/2009 5:03 PM Page 1
HDFC Top 200 Fund
An open-ended growth scheme
HDFCCapital Builder Fund
An open-ended growth scheme
DDaattee PPeerriioodd NNAAVV RReettuurrnnss BBeenncchhmmaarrkkppeerr UUnniitt ((RRss..)) ((%%)) $$^ RReettuurrnnss ((%%))##
Relative Performance ^ (Growth Option)
^̂PPaasstt ppeerrffoorrmmaannccee mmaayy oorr mmaayy nnoott bbee ssuussttaaiinneedd iinn tthhee ffuuttuurreePerformance of the Dividend Option for the investor would be net of Distribution Tax as applicable* Absolute Returns ** Compounded Annualised Returns #BSE 200$$ Adjusted for the dividends declared under the scheme prior to its splittng into the Dividendand Growth Options ~Due to an over all sharp rise in the stock prices
Apr 29, 09 Last Six Months (184 days) 107.584 54.41*~ 46.55*Oct 29, 08 Last 1 Year (366 days) 87.487 89.55**~ 82.93**Oct 30, 06 Last 3 Years (1096 days) 105.079 16.48** 7.79**Oct 29, 04 Last 5 Years (1827 days) 42.970 31.02** 21.32**Oct 29, 99 Last 10 Years (3654 days) 21.071 25.37** 15.03**Oct 11, 96 Since Inception (4767 days) 10.000 25.90** 15.08**
NAV (as at October 30, 2009) NAV per Unit (Rs.)
Growth Option 84.023
Dividend Option 22.444
NAV (as at October 30, 2009) NAV per Unit (Rs.)
Growth Option 166.119
Dividend Option 42.960
CCoommppaannyy IInndduussttrryy++ %% ttoo NNAAVV
EEQQUUIITTYY && EEQQUUIITTYY RREELLAATTEEDDState Bank of India Banks 6.39 ICICI Bank Ltd. Banks 5.56 Infosys Technologies Ltd. Software 4.95 Oil & Natural Gas Corporation Ltd. Oil 4.65 Larsen & Toubro Ltd. Construction Project 4.39 Bank of Baroda Banks 3.54 ITC Ltd. Consumer Non Durables 3.43 Housing Development Finance Corporation Ltd. $ Finance 2.94 LIC Housing Finance Ltd. Finance 2.76 Reliance Industries Ltd. Petroleum Products 2.58 TToottaall ooff TToopp TTeenn EEqquuiittyy HHoollddiinnggss 4411..1199 TToottaall EEqquuiittyy && EEqquuiittyy RReellaatteedd HHoollddiinnggss 9933..4499Cash margin / Earmarked cash for Futures & Options 0.54 Other Cash, Cash Equivalents and Net Current Assets 5.97 GGrraanndd TToottaall 110000..0000NNeett AAsssseettss ((RRss.. IInn LLaakkhhss)) 552233,,448888..0000
Portfolio – Top 10 Holdings (as at October 31, 2009)
IN EQUITY - DIVERSIFIED CATEGORY(149 schemes) for 3 and 5 year
periods ending October 31, 2009
Relative Performance ^ (Growth Option)
DDaattee PPeerriioodd NNAAVV RReettuurrnnss BBeenncchhmmaarrkkppeerr UUnniitt ((RRss..)) ((%%))^̂ RReettuurrnnss ((%%))##
^̂PPaasstt ppeerrffoorrmmaannccee mmaayy oorr mmaayy nnoott bbee ssuussttaaiinneedd iinn tthhee ffuuttuurreePerformance of the Dividend Option for the investor would be net of Distribution Tax as applicable#S&P CNX 500 (Please refer to page no 31) ** Compounded Annualised Returns* Absolute Returns ~Due to an over all sharp rise in the stock prices
Apr 29, 09 Last Six Months (184 days) 53.006 58.52*~ 44.69*Oct 29, 08 Last 1 Year (366 days) 45.436 84.62**~ 83.31**Oct 30, 06 Last 3 Years (1096 days) 60.171 11.76** 7.16**Oct 29, 04 Last 5 Years (1827 days) 28.404 24.19** 20.71**Oct 29, 99 Last 10 Years (3654 days) 13.460 20.07** 14.74**Feb 01, 94 Since Inception (5750 days) 10.000 14.47** 8.52**
Portfolio – Top 10 Holdings (as at October 31, 2009)
PPoorrttffoolliioo TTuurrnnoovveerr RRaattiioo ((LLaasstt 11 YYeeaarr)) 3322..8888%%
CCoommppaannyy IInndduussttrryy++ %% ttoo NNAAVV
EEQQUUIITTYY && EEQQUUIITTYY RREELLAATTEEDD
State Bank of India Banks 6.40
IPCA Laboratories Ltd. Pharmaceuticals 5.58
Dr Reddy’s Laboratories Ltd. Pharmaceuticals 5.22
Tata Consultancy Services Ltd. Software 4.86
Exide Industries Ltd. Auto Ancillaries 4.16
ITC Ltd. Consumer Non Durables 3.50
Crompton Greaves Ltd. Industrial Capital Goods 3.48
Patni Computer Systems Ltd. Software 3.44
Reliance Industries Ltd. Petroleum Products 3.32
Nestle India Ltd. Consumer Non Durables 3.10
TToottaall ooff TToopp TTeenn EEqquuiittyy HHoollddiinnggss 4433..0066
TToottaall EEqquuiittyy && EEqquuiittyy RReellaatteedd HHoollddiinnggss 9955..7711
Cash, Cash Equivalents and Net Current Assets 4.29
GGrraanndd TToottaall 110000..0000
NNeett AAsssseettss ((RRss.. IInn LLaakkhhss)) 5588,,117755..4488
Banks 20.62Pharmaceuticals 10.44Consumer Non Durables 9.24Construction Project 8.28Software 7.84Oil 6.17Finance 5.89Auto 3.95Petroleum Products 3.71Industrial Capital Goods 3.67Power 2.87
Media & Entertainment 2.16Transportation 1.98Diversified 1.79Telecom - Services 1.40Gas 0.99Auto Ancillaries 0.98Ferrous Metals 0.61Hardware 0.56Cement 0.20Pesticides 0.14
Industry Allocation of Equity Holding (% of Net Assets)Pharmaceuticals 16.83
Banks 14.99
Consumer Non Durables 12.91
Software 10.77
Industrial Capital Goods 7.28
Petroleum Products 6.17
Auto Ancillaries 4.16
Finance 3.10
Consumer Durables 2.98
Auto 2.69
Transportation 2.18
Telecom - Services 1.96
Construction Project 1.93
Chemicals 1.80
Media & Entertainment 1.59
Power 1.40
Oil 1.35
Gas 1.08
Textile Products 0.54
Industry Allocation of Equity Holding (% of Net Assets)
Std Deviation Beta Sharpe Ratio*
Risk Ratio (for the 3-yr period ended October 30, 2009) 9.60% 0.9030 0.18
Std Deviation Beta Sharpe Ratio*
Risk Ratio (for the 3-yr period ended October 30, 2009) 9.50% 0.8580 0.15
+ Industry Classification as recommended by AMFI
Source : CRISIL Fund Analyser* Risk-free rate assumed to be 4.47% (364-day Treasury Bill yield on 30-10-09)
Source : CRISIL Fund Analyser* Risk-free rate assumed to be 4.47% (364-day Treasury Bill yield on 30-10-09)
PPoorrttffoolliioo TTuurrnnoovveerr RRaattiioo ((LLaasstt 11 YYeeaarr)) 8844..0000%%
+ Industry Classification as recommended by AMFI, $ Sponsor ✤ PPaasstt ppeerrffoorrmmaannccee iiss nnoo gguuaarraanntteeee ooff ffuuttuurree rreessuullttss..
� Please refer to page no 31 for details on the Rating MethodologyTotal outstanding position (as at October 31, 2009) in Derivative Instruments
(UBI NSE November 2009 Futures) (Gross Notional) Rs.724.48 lakhs(Bank of Barodza NSE November 2009 Futures) (Gross Notional) Rs. 3,149.36 lakhs
(M&M Ltd. NSE November 2009 Futures) (Gross Notional) Rs.2,402.22 lakhs
12 October 2009 Intouchmutually
hdfc-eq-r.qxd 11/7/2009 5:03 PM Page 2

An open-ended growth scheme An open-ended growth scheme
HDFCCore & Satellite Fund
PPoorrttffoolliioo TTuurrnnoovveerr RRaattiioo ((LLaasstt 11 YYeeaarr)) 5599..1122%%
DDaattee PPeerriioodd NNAAVV RReettuurrnnss BBeenncchhmmaarrkkppeerr UUnniitt ((RRss..)) ((%%))^̂ RReettuurrnnss ((%%))##
Apr 29, 09 Last Six Months (184 days) 18.580 63.05*~ 46.55*Oct 29, 08 Last 1 Year (366 days) 15.598 93.87**~ 82.93**Oct 30, 06 Last 3 Years (1096 days) 25.046 6.54** 7.79**Oct 29, 04 Last 5 Years (1827 days) 10.433 23.73** 21.32**Sep 17, 04 Since Inception (1869 days) 10.000 24.17** 21.48**
+ Industry Classification as recommended by AMFI
+ Industry Classification as recommended by AMFI,
Pharmaceuticals 17.08
Banks 11.65
Media & Entertainment 11.27
Consumer Non Durables 9.12
Software 8.91
Auto Ancillaries 5.99
Finance 4.67
Power 4.59
Industrial Capital Goods 4.04
Petroleum Products 3.92
Auto 3.53
Construction Project 2.84
Consumer Durables 2.83
Industrial Products 1.91
Textiles - Synthetic 1.90
Construction 1.88
Chemicals 1.54
Oil 0.27
Industry Allocation of Equity Holding (% of Net Assets)
NAV (as at October 30, 2009) NAV per Unit (Rs.)
Growth Option 30.295
Dividend Option 20.848
Relative Performance ^ (Growth Option) Relative Performance ^ (Growth Option)
NAV (as at October 30, 2009) NAV per Unit (Rs.)
Growth Option 22.310
Dividend Option 15.403
DDaattee PPeerriioodd NNAAVV RReettuurrnnss BBeenncchhmmaarrkkppeerr UUnniitt ((RRss..)) ((%%))^̂ RReettuurrnnss ((%%))##
^̂PPaasstt ppeerrffoorrmmaannccee mmaayy oorr mmaayy nnoott bbee ssuussttaaiinneedd iinn tthhee ffuuttuurreePerformance of the Dividend Option for the investor would be net of Distribution Tax as applicable* Absolute Returns ** Compounded Annualised Returns#S&P CNX 500 (Please refer to page no 31) ~ Due to an overall sharp rise in stock prices
Apr 29, 09 Last Six Months (184 days) 13.809 61.56*~ 44.69*Oct 29, 08 Last 1 Year (366 days) 11.890 87.31**~ 83.31**Oct 30, 06 Last 3 Years (1096 days) 17.544 8.33** 7.16**Apr 06, 05 Since Inception (1668 days) 10.000 19.20** 18.02**
Banks 14.26Pharmaceuticals 14.21Media & Entertainment 14.06Software 11.28Consumer Non Durables 9.82Power 8.66Industrial Capital Goods 3.59Petroleum Products 3.52Transportation 3.44Oil 2.63
Telecom - Services 2.44Finance 1.90Chemicals 1.72Construction Project 1.57Industrial Products 1.54Auto Ancillaries 1.47Textile Products 0.76Paper Products 0.46Pesticides 0.30
Industry Allocation of Equity Holding (% of Net Assets)
PPoorrttffoolliioo TTuurrnnoovveerr RRaattiioo ((LLaasstt 11 YYeeaarr)) 5588..0000%%
HDFC Premier Multi-Cap Fund
^̂PPaasstt ppeerrffoorrmmaannccee mmaayy oorr mmaayy nnoott bbee ssuussttaaiinneedd iinn tthhee ffuuttuurreePerformance of the Dividend Option for the investor would be net of Distribution Tax as applicable*Absolute Returns #BSE 200 ** Compounded Annualised Returns~ Due to an overall sharp rise in stock prices
CCoommppaannyy IInndduussttrryy++ %% ttoo NNAAVV
EEQQUUIITTYY && EEQQUUIITTYY RREELLAATTEEDD
Dr Reddy’s Laboratories Ltd. Pharmaceuticals 6.36
Infosys Technologies Ltd. Software 4.72
LIC Housing Finance Ltd. Finance 4.67
KEC International Ltd. Power 4.59
Tata Consultancy Services Ltd. Software 4.19
Zee Entertainment Enterprises Ltd. Media & Entertainment 4.07
Crompton Greaves Ltd. Industrial Capital Goods 4.04
Bank of Baroda Banks 3.71
Motherson Sumi Systems Ltd. Auto Ancillaries 3.69
Maruti Suzuki India Ltd. Auto 3.53
TToottaall ooff TToopp TTeenn EEqquuiittyy HHoollddiinnggss 4433..5577
TToottaall EEqquuiittyy && EEqquuiittyy RReellaatteedd HHoollddiinnggss 9977..9944
Cash, Cash Equivalents and Net Current Assets 2.06
GGrraanndd TToottaall 110000..0000
NNeett AAsssseettss ((RRss.. IInn LLaakkhhss)) 3399,,776677..3333
Portfolio – Top 10 Holdings (as at October 31, 2009)
Std Deviation Beta Sharpe Ratio*
Risk Ratio (for the 3-yr period ended October 30, 2009) 10.50% 0.9720 0.11
Source : CRISIL Fund Analyser* Risk-free rate assumed to be 4.47% (364-day Treasury Bill yield on 30-10-09)
Std Deviation Beta Sharpe Ratio*
Risk Ratio (for the 3-yr period ended October 30, 2009) 10.40% 0.9540 0.12
Source : CRISIL Fund Analyser* Risk-free rate assumed to be 4.47% (364-day Treasury Bill yield on 30-10-09)
Large-Cap 32.67
Mid-Cap 64.96
Segmentwise Break-up of Equity Holding (% of Net Assets)
CCoommppaannyy IInndduussttrryy++ %% ttoo NNAAVV
EEQQUUIITTYY && EEQQUUIITTYY RREELLAATTEEDD
Dr Reddy’s Laboratories Ltd. Pharmaceuticals 6.32
ICICI Bank Ltd. Banks 5.77
Infosys Technologies Ltd. Software 5.61
KEC International Ltd. Power 5.58
Zee Entertainment Enterprises Ltd. Media & Entertainment 4.98
Emami Ltd. Consumer Non Durables 4.11
Axis Bank Ltd. Banks 3.78
State Bank of India Banks 3.65
Crompton Greaves Ltd. Industrial Capital Goods 3.59
Bharat Petroleum Corporation Ltd. Petroleum Products 3.52
TToottaall ooff TToopp TTeenn EEqquuiittyy HHoollddiinnggss 4466..9911
TToottaall EEqquuiittyy && EEqquuiittyy RReellaatteedd HHoollddiinnggss 9977..6633
Cash margin 1.39
Other Cash, Cash Equivalents and Net Current Assets 0.98
GGrraanndd TToottaall 110000..0000
NNeett AAsssseettss ((RRss.. IInn LLaakkhhss)) 4477,,999922..6699
Portfolio – Top 10 Holdings (as at October 31, 2009)
Intouchmutually October 2009 13
hdfc-eq-r.qxd 11/7/2009 5:03 PM Page 3
CCoommppaannyy IInndduussttrryy++ %% ttoo NNAAVV
EEQQUUIITTYY && EEQQUUIITTYY RREELLAATTEEDD
Reliance Industries Ltd. Petroleum Products 13.12
Infosys Technologies Ltd Software 8.88
ICICI Bank Ltd. Banks 7.26
Larsen and Toubro Ltd Construction Project 6.85
Housing Development Finance Corporation Ltd.$ Finance 5.63
ITC Ltd. Consumer Non Durables 5.58
State Bank of India Banks 5.17
HDFC Bank Ltd. Banks 4.87
Oil & Natural Gas Corporation Ltd. Oil 4.00
Bharti Airtel Ltd. Telecom - Services 3.21
TToottaall ooff TToopp TTeenn EEqquuiittyy HHoollddiinnggss 6644..5577
TToottaall EEqquuiittyy && EEqquuiittyy RReellaatteedd HHoollddiinnggss 9977..5577
Cash, Cash Equivalents and Net Current Assets 2.43
GGrraanndd TToottaall 110000..0000
NNeett AAsssseettss ((RRss.. IInn LLaakkhhss)) 66,,119922..9911
Portfolio – Top 10 Holdings (as at October 31, 2009)
PPoorrttffoolliioo TTuurrnnoovveerr RRaattiioo ((LLaasstt 11 YYeeaarr)) 112299..0011%%
Relative Performance ^
+ Industry Classification as recommended by AMFI, $ Sponsor
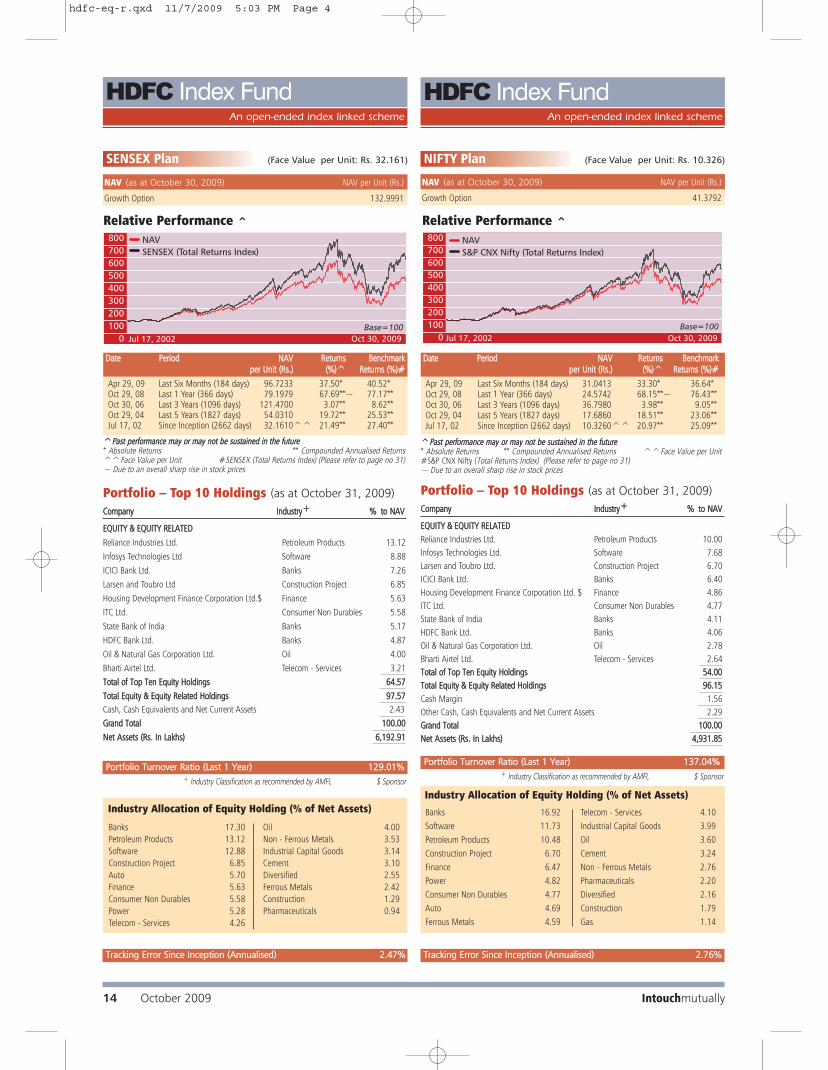
SENSEX Plan (Face Value per Unit: Rs. 32.161)
DDaattee PPeerriioodd NNAAVV RReettuurrnnss BBeenncchhmmaarrkkppeerr UUnniitt ((RRss..)) ((%%))^̂ RReettuurrnnss ((%%))##
^̂PPaasstt ppeerrffoorrmmaannccee mmaayy oorr mmaayy nnoott bbee ssuussttaaiinneedd iinn tthhee ffuuttuurree* Absolute Returns ** Compounded Annualised Returns ^^Face Value per Unit #SENSEX (Total Returns Index) (Please refer to page no 31) ~ Due to an overall sharp rise in stock prices
Apr 29, 09 Last Six Months (184 days) 96.7233 37.50* 40.52*Oct 29, 08 Last 1 Year (366 days) 79.1979 67.69**~ 77.17**Oct 30, 06 Last 3 Years (1096 days) 121.4700 3.07** 8.62**Oct 29, 04 Last 5 Years (1827 days) 54.0310 19.72** 25.53**Jul 17, 02 Since Inception (2662 days) 32.1610^^ 21.49** 27.40**
NAV (as at October 30, 2009) NAV per Unit (Rs.)
Growth Option 132.9991
An open-ended index linked scheme
HDFC Index Fund HDFC Index Fund
NIFTY Plan (Face Value per Unit: Rs. 10.326)
DDaattee PPeerriioodd NNAAVV RReettuurrnnss BBeenncchhmmaarrkkppeerr UUnniitt ((RRss..)) ((%%))^̂ RReettuurrnnss ((%%))##
Relative Performance ^
^̂PPaasstt ppeerrffoorrmmaannccee mmaayy oorr mmaayy nnoott bbee ssuussttaaiinneedd iinn tthhee ffuuttuurree* Absolute Returns ** Compounded Annualised Returns ^^Face Value per Unit#S&P CNX Nifty (Total Returns Index) (Please refer to page no 31) ~ Due to an overall sharp rise in stock prices
Apr 29, 09 Last Six Months (184 days) 31.0413 33.30* 36.64*Oct 29, 08 Last 1 Year (366 days) 24.5742 68.15**~ 76.43**Oct 30, 06 Last 3 Years (1096 days) 36.7980 3.98** 9.05**Oct 29, 04 Last 5 Years (1827 days) 17.6860 18.51** 23.06**Jul 17, 02 Since Inception (2662 days) 10.3260^^ 20.97** 25.09**
NAV (as at October 30, 2009) NAV per Unit (Rs.)
Growth Option 41.3792
CCoommppaannyy IInndduussttrryy++ %% ttoo NNAAVV
EEQQUUIITTYY && EEQQUUIITTYY RREELLAATTEEDD
Reliance Industries Ltd. Petroleum Products 10.00
Infosys Technologies Ltd. Software 7.68
Larsen and Toubro Ltd. Construction Project 6.70
ICICI Bank Ltd. Banks 6.40
Housing Development Finance Corporation Ltd. $ Finance 4.86
ITC Ltd. Consumer Non Durables 4.77
State Bank of India Banks 4.11
HDFC Bank Ltd. Banks 4.06
Oil & Natural Gas Corporation Ltd. Oil 2.78
Bharti Airtel Ltd. Telecom - Services 2.64
TToottaall ooff TToopp TTeenn EEqquuiittyy HHoollddiinnggss 5544..0000
TToottaall EEqquuiittyy && EEqquuiittyy RReellaatteedd HHoollddiinnggss 9966..1155
Cash Margin 1.56
Other Cash, Cash Equivalents and Net Current Assets 2.29
GGrraanndd TToottaall 110000..0000
NNeett AAsssseettss ((RRss.. IInn LLaakkhhss)) 44,,993311..8855
Portfolio – Top 10 Holdings (as at October 31, 2009)
PPoorrttffoolliioo TTuurrnnoovveerr RRaattiioo ((LLaasstt 11 YYeeaarr)) 113377..0044%%
+ Industry Classification as recommended by AMFI, $ Sponsor
An open-ended index linked scheme
Banks 17.30
Petroleum Products 13.12
Software 12.88
Construction Project 6.85
Auto 5.70
Finance 5.63
Consumer Non Durables 5.58
Power 5.28
Telecom - Services 4.26
Oil 4.00
Non - Ferrous Metals 3.53
Industrial Capital Goods 3.14
Cement 3.10
Diversified 2.55
Ferrous Metals 2.42
Construction 1.29
Pharmaceuticals 0.94
Industry Allocation of Equity Holding (% of Net Assets) Banks 16.92
Software 11.73
Petroleum Products 10.48
Construction Project 6.70
Finance 6.47
Power 4.82
Consumer Non Durables 4.77
Auto 4.69
Ferrous Metals 4.59
Telecom - Services 4.10
Industrial Capital Goods 3.99
Oil 3.60
Cement 3.24
Non - Ferrous Metals 2.76
Pharmaceuticals 2.20
Diversified 2.16
Construction 1.79
Gas 1.14
Industry Allocation of Equity Holding (% of Net Assets)
TTrraacckkiinngg EErrrroorr SSiinnccee IInncceeppttiioonn ((AAnnnnuuaalliisseedd)) 22..4477%% TTrraacckkiinngg EErrrroorr SSiinnccee IInncceeppttiioonn ((AAnnnnuuaalliisseedd)) 22..7766%%
14 October 2009 Intouchmutually
hdfc-eq-r.qxd 11/7/2009 5:03 PM Page 4
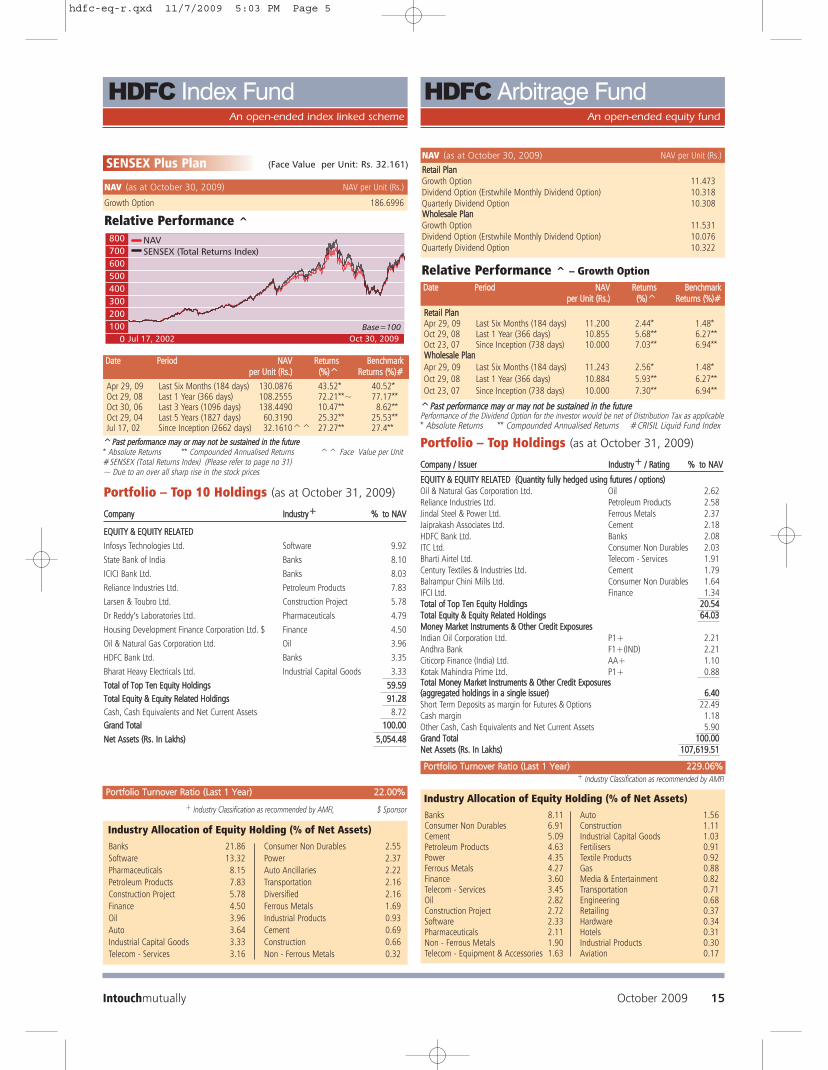
CCoommppaannyy IInndduussttrryy++ %% ttoo NNAAVV
EEQQUUIITTYY && EEQQUUIITTYY RREELLAATTEEDD
Infosys Technologies Ltd. Software 9.92
State Bank of India Banks 8.10
ICICI Bank Ltd. Banks 8.03
Reliance Industries Ltd. Petroleum Products 7.83
Larsen & Toubro Ltd. Construction Project 5.78
Dr Reddy’s Laboratories Ltd. Pharmaceuticals 4.79
Housing Development Finance Corporation Ltd. $ Finance 4.50
Oil & Natural Gas Corporation Ltd. Oil 3.96
HDFC Bank Ltd. Banks 3.35
Bharat Heavy Electricals Ltd. Industrial Capital Goods 3.33
TToottaall ooff TToopp TTeenn EEqquuiittyy HHoollddiinnggss 5599..5599
TToottaall EEqquuiittyy && EEqquuiittyy RReellaatteedd HHoollddiinnggss 9911..2288
Cash, Cash Equivalents and Net Current Assets 8.72
GGrraanndd TToottaall 110000..0000
NNeett AAsssseettss ((RRss.. IInn LLaakkhhss)) 55,,005544..4488
Portfolio – Top 10 Holdings (as at October 31, 2009)
PPoorrttffoolliioo TTuurrnnoovveerr RRaattiioo ((LLaasstt 11 YYeeaarr)) 2222..0000%%
DDaattee PPeerriioodd NNAAVV RReettuurrnnss BBeenncchhmmaarrkkppeerr UUnniitt ((RRss..)) ((%%))^̂ RReettuurrnnss ((%%))##
Relative Performance ^
^̂PPaasstt ppeerrffoorrmmaannccee mmaayy oorr mmaayy nnoott bbee ssuussttaaiinneedd iinn tthhee ffuuttuurree* Absolute Returns ** Compounded Annualised Returns ^^ Face Value per Unit#SENSEX (Total Returns Index) (Please refer to page no 31) ~ Due to an over all sharp rise in the stock prices
Apr 29, 09 Last Six Months (184 days) 130.0876 43.52* 40.52*Oct 29, 08 Last 1 Year (366 days) 108.2555 72.21**~ 77.17**Oct 30, 06 Last 3 Years (1096 days) 138.4490 10.47** 8.62**Oct 29, 04 Last 5 Years (1827 days) 60.3190 25.32** 25.53**Jul 17, 02 Since Inception (2662 days) 32.1610^^ 27.27** 27.4**
+ Industry Classification as recommended by AMFI, $ Sponsor
SENSEX Plus Plan (Face Value per Unit: Rs. 32.161)
NAV (as at October 30, 2009) NAV per Unit (Rs.)
Growth Option 186.6996
An open-ended index linked scheme
HDFC Index Fund
Banks 21.86
Software 13.32
Pharmaceuticals 8.15
Petroleum Products 7.83
Construction Project 5.78
Finance 4.50
Oil 3.96
Auto 3.64
Industrial Capital Goods 3.33
Telecom - Services 3.16
Consumer Non Durables 2.55
Power 2.37
Auto Ancillaries 2.22
Transportation 2.16
Diversified 2.16
Ferrous Metals 1.69
Industrial Products 0.93
Cement 0.69
Construction 0.66
Non - Ferrous Metals 0.32
Industry Allocation of Equity Holding (% of Net Assets)
PPoorrttffoolliioo TTuurrnnoovveerr RRaattiioo ((LLaasstt 11 YYeeaarr)) 222299..0066%%
DDaattee PPeerriioodd NNAAVV RReettuurrnnss BBeenncchhmmaarrkkppeerr UUnniitt ((RRss..)) ((%%))^̂ RReettuurrnnss ((%%))##
Relative Performance ^ – Growth Option
^̂PPaasstt ppeerrffoorrmmaannccee mmaayy oorr mmaayy nnoott bbee ssuussttaaiinneedd iinn tthhee ffuuttuurreePerformance of the Dividend Option for the investor would be net of Distribution Tax as applicable* Absolute Returns ** Compounded Annualised Returns #CRISIL Liquid Fund Index
RReettaaiill PPllaannApr 29, 09 Last Six Months (184 days) 11.200 2.44* 1.48*Oct 29, 08 Last 1 Year (366 days) 10.855 5.68** 6.27**Oct 23, 07 Since Inception (738 days) 10.000 7.03** 6.94**WWhhoolleessaallee PPllaann
Apr 29, 09 Last Six Months (184 days) 11.243 2.56* 1.48*
Oct 29, 08 Last 1 Year (366 days) 10.884 5.93** 6.27**
Oct 23, 07 Since Inception (738 days) 10.000 7.30** 6.94**
+ Industry Classification as recommended by AMFI
NAV (as at October 30, 2009) NAV per Unit (Rs.)
RReettaaiill PPllaannGrowth Option 11.473Dividend Option (Erstwhile Monthly Dividend Option) 10.318Quarterly Dividend Option 10.308WWhhoolleessaallee PPllaannGrowth Option 11.531Dividend Option (Erstwhile Monthly Dividend Option) 10.076Quarterly Dividend Option 10.322
An open-ended equity fund
HDFC Arbitrage Fund
Banks 8.11Consumer Non Durables 6.91Cement 5.09Petroleum Products 4.63Power 4.35Ferrous Metals 4.27Finance 3.60Telecom - Services 3.45Oil 2.82Construction Project 2.72Software 2.33Pharmaceuticals 2.11Non - Ferrous Metals 1.90Telecom - Equipment & Accessories 1.63
Auto 1.56Construction 1.11Industrial Capital Goods 1.03Fertilisers 0.91Textile Products 0.92Gas 0.88Media & Entertainment 0.82Transportation 0.71Engineering 0.68Retailing 0.37Hardware 0.34Hotels 0.31Industrial Products 0.30Aviation 0.17
Industry Allocation of Equity Holding (% of Net Assets)
CCoommppaannyy // IIssssuueerr IInndduussttrryy++ // RRaattiinngg %% ttoo NNAAVV
EEQQUUIITTYY && EEQQUUIITTYY RREELLAATTEEDD ((QQuuaannttiittyy ffuullllyy hheeddggeedd uussiinngg ffuuttuurreess // ooppttiioonnss))Oil & Natural Gas Corporation Ltd. Oil 2.62 Reliance Industries Ltd. Petroleum Products 2.58 Jindal Steel & Power Ltd. Ferrous Metals 2.37 Jaiprakash Associates Ltd. Cement 2.18 HDFC Bank Ltd. Banks 2.08 ITC Ltd. Consumer Non Durables 2.03 Bharti Airtel Ltd. Telecom - Services 1.91 Century Textiles & Industries Ltd. Cement 1.79 Balrampur Chini Mills Ltd. Consumer Non Durables 1.64 IFCI Ltd. Finance 1.34 TToottaall ooff TToopp TTeenn EEqquuiittyy HHoollddiinnggss 2200..5544 TToottaall EEqquuiittyy && EEqquuiittyy RReellaatteedd HHoollddiinnggss 6644..0033MMoonneeyy MMaarrkkeett IInnssttrruummeennttss && OOtthheerr CCrreeddiitt EExxppoossuurreessIndian Oil Corporation Ltd. P1+ 2.21 Andhra Bank F1+(IND) 2.21 Citicorp Finance (India) Ltd. AA+ 1.10 Kotak Mahindra Prime Ltd. P1+ 0.88 TToottaall MMoonneeyy MMaarrkkeett IInnssttrruummeennttss && OOtthheerr CCrreeddiitt EExxppoossuurreess((aaggggrreeggaatteedd hhoollddiinnggss iinn aa ssiinnggllee iissssuueerr)) 66..4400 Short Term Deposits as margin for Futures & Options 22.49 Cash margin 1.18 Other Cash, Cash Equivalents and Net Current Assets 5.90 GGrraanndd TToottaall 110000..0000NNeett AAsssseettss ((RRss.. IInn LLaakkhhss)) 110077,,661199..5511
Portfolio – Top Holdings (as at October 31, 2009)
Intouchmutually October 2009 15
hdfc-eq-r.qxd 11/7/2009 5:03 PM Page 5

+ Industry Classification as recommended by AMFI, $ Sponsor
DDaattee PPeerriioodd NNAAVV RReettuurrnnss BBeenncchhmmaarrkkppeerr UUnniitt ((RRss..)) ((%%))^̂ RReettuurrnnss ((%%))##
NAV (as at October 30, 2009) NAV per Unit (Rs.)
Growth Option 41.191Dividend Option 18.215
Relative Performance ^ (Growth Option)
^̂PPaasstt ppeerrffoorrmmaannccee mmaayy oorr mmaayy nnoott bbee ssuussttaaiinneedd iinn tthhee ffuuttuurreePerformance of the Dividend Option for the investor would be net of Distribution Tax as applicable* Absolute Returns ** Compounded Annualised Returns N.A. Not Available #CRISIL Balanced Fund Index ~ Due to an over all sharp rise in the stock prices
Apr 29, 09 Last Six Months (184 days) 29.489 39.68*~ 22.76*Oct 29, 08 Last 1 Year (366 days) 24.726 66.36**~ 51.53**Oct 30, 06 Last 3 Years (1096 days) 31.542 9.30** 8.76**Oct 29, 04 Last 5 Years (1827 days) 17.868 18.16** 16.13**Sep 11, 00 Since Inception (3336 days) 10.000 16.75** N.A.
PPoorrttffoolliioo TTuurrnnoovveerr RRaattiioo ((LLaasstt 11 YYeeaarr)) 1199..4422%%
HDFCBalanced FundAn open-ended balanced scheme
HDFC
Prudence Fund
An open-ended balanced scheme
DDaattee PPeerriioodd NNAAVV RReettuurrnnss BBeenncchhmmaarrkkppeerr UUnniitt ((RRss..)) ((%%))$$$$^̂ RReettuurrnnss ((%%))##
NAV (as at October 30, 2009) NAV per Unit (Rs.)
Growth Option 160.038Dividend Option 27.683
Relative Performance ^ (Growth Option)
^̂PPaasstt ppeerrffoorrmmaannccee mmaayy oorr mmaayy nnoott bbee ssuussttaaiinneedd iinn tthhee ffuuttuurree Performance of the Dividend Option for the investor would be net of Distribution Tax as applicable* Absolute Returns ** Compounded Annualised Returns #CRISIL Balanced Fund Index$$ Adjusted for the dividends declared under the scheme prior to its splittng into the Dividendand Growth Options ~Due to an over all sharp rise in the stock prices N.A. Not Available
Apr 29, 09 Last Six Months (184 days) 104.758 52.77*~ 22.76*Oct 29, 08 Last 1 Year (366 days) 88.251 81.05**~ 51.53**Oct 30, 06 Last 3 Years (1096 days) 106.542 14.51** 8.76**Oct 29, 04 Last 5 Years (1827 days) 49.734 26.30** 16.13**Oct 29, 99 Last 10 Years (3654 days) 19.350 23.50** N.A.Feb 01, 94 Since Inception (5750 days) 10.000 21.20** N.A.
IN HYBRID EQUITY - ORIENTED CATEGORY(28 schemes) for 3 and 5 year
periods ending October 31, 2009
PPoorrttffoolliioo TTuurrnnoovveerr RRaattiioo ((LLaasstt 11 YYeeaarr)) 6688..7788%%+ Industry Classification as recommended by AMFI $ Sponsor
✤ PPaasstt ppeerrffoorrmmaannccee iiss nnoo gguuaarraanntteeee ooff ffuuttuurree rreessuullttss.. � Please refer to page no 31 for details on the Rating Methodology
CCoommppaannyy // IIssssuueerr IInndduussttrryy++ // RRaattiinngg %% ttoo NNAAVV
EEQQUUIITTYY && EEQQUUIITTYY RREELLAATTEEDD
Coromandel International Ltd. Fertilisers 4.64
Tata Consultancy Services Ltd. Software 3.99
Crompton Greaves Ltd. Industrial Capital Goods 3.97
ITC Ltd. Consumer Non Durables 3.74
Infosys Technologies Ltd. Software 3.50
Sun Pharmaceutical Industries Ltd. Pharmaceuticals 3.28
Larsen & Toubro Ltd. Construction Project 3.21
Biocon Ltd. Pharmaceuticals 3.13
Balkrishna Industries Ltd. Auto Ancillaries 3.09
Bharat Heavy Electricals Ltd. Industrial Capital Goods 3.08
TToottaall ooff TToopp TTeenn EEqquuiittyy HHoollddiinnggss 3355..6633
TToottaall EEqquuiittyy && EEqquuiittyy RReellaatteedd HHoollddiinnggss 7700..2211
CCrreeddiitt EExxppoossuurreess
Tata Motors Ltd. (Guaranteed by SBI) AAA(SO) 11.94
Housing Development Finance Corporation Ltd. $ AAA 4.00
Shriram Transport Finance Co. Ltd. AA(SO) 3.13
Grasim Industries Ltd. AAA(SO) 2.77
State Bank of India AAA 2.12
Bajaj Auto Ltd. AAA(SO) 1.72
Reliance Industries Ltd. AAA(SO) 0.38
TToottaall CCrreeddiitt EExxppoossuurreess((aaggggrreeggaatteedd hhoollddiinnggss iinn aa ssiinnggllee iissssuueerr)) 2266..0066
Cash, Cash Equivalents and Net Current Assets 3.73
GGrraanndd TToottaall 110000..0000
NNeett AAsssseettss ((RRss.. IInn LLaakkhhss)) 1122,,660066..5566
Portfolio – Top Holdings (as at October 31, 2009)
CCoommppaannyy // IIssssuueerr IInndduussttrryy++ // RRaattiinngg %% ttoo NNAAVV
EEQQUUIITTYY && EEQQUUIITTYY RREELLAATTEEDDState Bank of India Banks 3.73 LIC Housing Finance Ltd. Finance 3.38 Oil & Natural Gas Corporation Ltd. Oil 3.32 Bank of Baroda Banks 3.05 Lupin Ltd. Pharmaceuticals 2.32 Apollo Tyres Ltd. Auto Ancillaries 2.32 ICICI Bank Ltd. Banks 2.19 Pidilite Industries Ltd. Chemicals 2.17 Axis Bank Ltd. Banks 2.03 Titan Industries Ltd. Consumer Non Durables 1.98 TToottaall ooff TToopp TTeenn EEqquuiittyy HHoollddiinnggss 2266..4499 TToottaall EEqquuiittyy && EEqquuiittyy RReellaatteedd HHoollddiinnggss 7733..7766GGoovveerrnnmmeenntt SSeeccuurriittiieess && OOtthheerr CCrreeddiitt EExxppoossuurreessGovernment Securities Sovereign 6.24 Indian Railways Finance Corporation Ltd. AAA 4.13 Power Finance Corporation Ltd. AAA 2.09 State Bank of India AAA 2.09 Indian Oil Corporation Ltd. AAA 1.60 Housing Development Finance Corporation Ltd.$ AAA 1.02 Punjab National Bank AAA 0.71 State Bank of Indore AAA 0.53 National Bank for Agriculture & Rural Development AAA 0.51 Infrastructure Development Finance Co. Ltd. AA+ 0.50 TToottaall ooff TToopp TTeenn GGoovveerrnnmmeenntt SSeeccuurriittiieess && OOtthheerrCCrreeddiitt EExxppoossuurreess ((aaggggrreeggaatteedd hhoollddiinnggss iinn aa ssiinnggllee iissssuueerr)) 1199..4422 TToottaall GGoovveerrnnmmeenntt SSeeccuurriittiieess && OOtthheerr CCrreeddiitt EExxppoossuurreess 2200..6677Cash, Cash Equivalents and Net Current Assets 5.57 GGrraanndd TToottaall 110000..0000NNeett AAsssseettss ((RRss.. IInn LLaakkhhss)) 330066,,993300..0077
Portfolio – Top 10 Holdings (as at October 31, 2009)
Pharmaceuticals 11.37
Consumer Non Durables 8.61
Software 7.49
Banks 7.49
Industrial Capital Goods 7.05
Auto Ancillaries 6.10
Fertilisers 4.64
Petroleum Products 4.54
Construction Project 3.21
Power 2.65
Construction 1.95
Consumer Durables 1.72
Chemicals 1.46
Telecom - Services 1.05
Industrial Products 0.88
Industry Allocation of Equity Holding (% of Net Assets)Banks 13.84Pharmaceuticals 10.31Consumer Non Durables 8.62Media & Entertainment 6.87Finance 5.32Oil 3.86Auto Ancillaries 3.18Chemicals 3.06Industrial Capital Goods 2.88Construction Project 2.86
Textile Products 2.02Industrial Products 1.95Trading 1.84Software 1.77Power 1.62Construction 1.44Auto 0.94Ferrous Metals 0.66Paper Products 0.57Textiles - Synthetic 0.15
Industry Allocation of Equity Holding (% of Net Assets)
16 October 2009 Intouchmutually
hdfc-eq-r.qxd 11/7/2009 5:03 PM Page 6
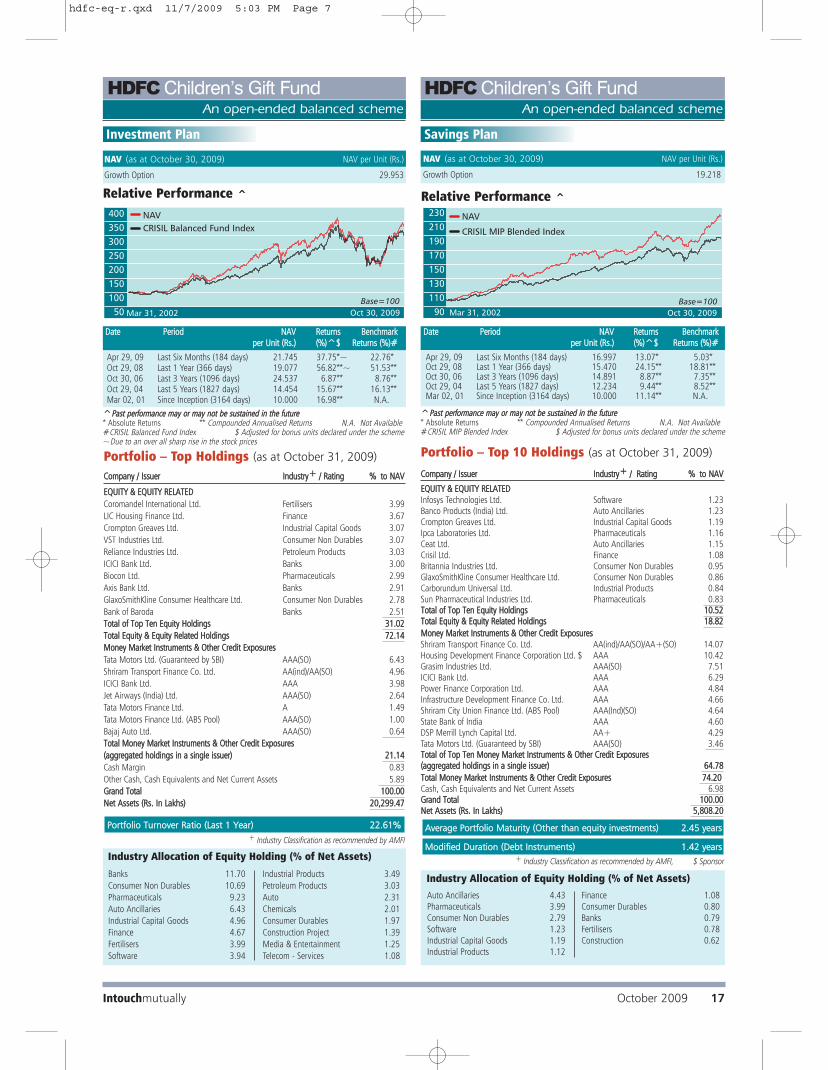
HDFCChildren’s Gift FundAn open-ended balanced scheme
HDFCChildren’s Gift FundAn open-ended balanced scheme
Investment Plan
DDaattee PPeerriioodd NNAAVV RReettuurrnnss BBeenncchhmmaarrkkppeerr UUnniitt ((RRss..)) ((%%))^̂$$ RReettuurrnnss ((%%))##
Apr 29, 09 Last Six Months (184 days) 21.745 37.75*~ 22.76*Oct 29, 08 Last 1 Year (366 days) 19.077 56.82**~ 51.53**Oct 30, 06 Last 3 Years (1096 days) 24.537 6.87** 8.76**Oct 29, 04 Last 5 Years (1827 days) 14.454 15.67** 16.13**Mar 02, 01 Since Inception (3164 days) 10.000 16.98** N.A.
Relative Performance ^
NAV (as at October 30, 2009) NAV per Unit (Rs.)
Growth Option 29.953
PPoorrttffoolliioo TTuurrnnoovveerr RRaattiioo ((LLaasstt 11 YYeeaarr)) 2222..6611%%
+ Industry Classification as recommended by AMFI
DDaattee PPeerriioodd NNAAVV RReettuurrnnss BBeenncchhmmaarrkkppeerr UUnniitt ((RRss..)) ((%%))^̂$$ RReettuurrnnss ((%%))##
Relative Performance ^
Apr 29, 09 Last Six Months (184 days) 16.997 13.07* 5.03*Oct 29, 08 Last 1 Year (366 days) 15.470 24.15** 18.81**Oct 30, 06 Last 3 Years (1096 days) 14.891 8.87** 7.35**Oct 29, 04 Last 5 Years (1827 days) 12.234 9.44** 8.52**Mar 02, 01 Since Inception (3164 days) 10.000 11.14** N.A.
Savings Plan
NAV (as at October 30, 2009) NAV per Unit (Rs.)
Growth Option 19.218
MMooddiiffiieedd DDuurraattiioonn ((DDeebbtt IInnssttrruummeennttss)) 11..4422 yyeeaarrss
AAvveerraaggee PPoorrttffoolliioo MMaattuurriittyy ((OOtthheerr tthhaann eeqquuiittyy iinnvveessttmmeennttss)) 22..4455 yyeeaarrss
+ Industry Classification as recommended by AMFI, $ Sponsor
Portfolio – Top Holdings (as at October 31, 2009)
CCoommppaannyy // IIssssuueerr IInndduussttrryy++ // RRaattiinngg %% ttoo NNAAVV
EEQQUUIITTYY && EEQQUUIITTYY RREELLAATTEEDDInfosys Technologies Ltd. Software 1.23 Banco Products (India) Ltd. Auto Ancillaries 1.23 Crompton Greaves Ltd. Industrial Capital Goods 1.19 Ipca Laboratories Ltd. Pharmaceuticals 1.16 Ceat Ltd. Auto Ancillaries 1.15 Crisil Ltd. Finance 1.08 Britannia Industries Ltd. Consumer Non Durables 0.95 GlaxoSmithKline Consumer Healthcare Ltd. Consumer Non Durables 0.86 Carborundum Universal Ltd. Industrial Products 0.84 Sun Pharmaceutical Industries Ltd. Pharmaceuticals 0.83 TToottaall ooff TToopp TTeenn EEqquuiittyy HHoollddiinnggss 1100..5522TToottaall EEqquuiittyy && EEqquuiittyy RReellaatteedd HHoollddiinnggss 1188..8822
MMoonneeyy MMaarrkkeett IInnssttrruummeennttss && OOtthheerr CCrreeddiitt EExxppoossuurreessShriram Transport Finance Co. Ltd. AA(ind)/AA(SO)/AA+(SO) 14.07 Housing Development Finance Corporation Ltd. $ AAA 10.42 Grasim Industries Ltd. AAA(SO) 7.51 ICICI Bank Ltd. AAA 6.29 Power Finance Corporation Ltd. AAA 4.84 Infrastructure Development Finance Co. Ltd. AAA 4.66 Shriram City Union Finance Ltd. (ABS Pool) AAA(Ind)(SO) 4.64 State Bank of India AAA 4.60 DSP Merrill Lynch Capital Ltd. AA+ 4.29 Tata Motors Ltd. (Guaranteed by SBI) AAA(SO) 3.46 TToottaall ooff TToopp TTeenn MMoonneeyy MMaarrkkeett IInnssttrruummeennttss && OOtthheerr CCrreeddiitt EExxppoossuurreess((aaggggrreeggaatteedd hhoollddiinnggss iinn aa ssiinnggllee iissssuueerr)) 6644..7788
TToottaall MMoonneeyy MMaarrkkeett IInnssttrruummeennttss && OOtthheerr CCrreeddiitt EExxppoossuurreess 7744..2200 Cash, Cash Equivalents and Net Current Assets 6.98 GGrraanndd TToottaall 110000..0000NNeett AAsssseettss ((RRss.. IInn LLaakkhhss)) 55,,880088..2200
Portfolio – Top 10 Holdings (as at October 31, 2009)
Banks 11.70
Consumer Non Durables 10.69
Pharmaceuticals 9.23
Auto Ancillaries 6.43
Industrial Capital Goods 4.96
Finance 4.67
Fertilisers 3.99
Software 3.94
Industrial Products 3.49
Petroleum Products 3.03
Auto 2.31
Chemicals 2.01
Consumer Durables 1.97
Construction Project 1.39
Media & Entertainment 1.25
Telecom - Services 1.08
Industry Allocation of Equity Holding (% of Net Assets)
Auto Ancillaries 4.43Pharmaceuticals 3.99Consumer Non Durables 2.79Software 1.23Industrial Capital Goods 1.19Industrial Products 1.12
Finance 1.08Consumer Durables 0.80Banks 0.79Fertilisers 0.78Construction 0.62
Industry Allocation of Equity Holding (% of Net Assets)
CCoommppaannyy // IIssssuueerr IInndduussttrryy++ // RRaattiinngg %% ttoo NNAAVV
EEQQUUIITTYY && EEQQUUIITTYY RREELLAATTEEDD
Coromandel International Ltd. Fertilisers 3.99
LIC Housing Finance Ltd. Finance 3.67
Crompton Greaves Ltd. Industrial Capital Goods 3.07
VST Industries Ltd. Consumer Non Durables 3.07
Reliance Industries Ltd. Petroleum Products 3.03
ICICI Bank Ltd. Banks 3.00
Biocon Ltd. Pharmaceuticals 2.99
Axis Bank Ltd. Banks 2.91
GlaxoSmithKline Consumer Healthcare Ltd. Consumer Non Durables 2.78
Bank of Baroda Banks 2.51
TToottaall ooff TToopp TTeenn EEqquuiittyy HHoollddiinnggss 3311..0022
TToottaall EEqquuiittyy && EEqquuiittyy RReellaatteedd HHoollddiinnggss 7722..1144
MMoonneeyy MMaarrkkeett IInnssttrruummeennttss && OOtthheerr CCrreeddiitt EExxppoossuurreess
Tata Motors Ltd. (Guaranteed by SBI) AAA(SO) 6.43
Shriram Transport Finance Co. Ltd. AA(ind)/AA(SO) 4.96
ICICI Bank Ltd. AAA 3.98
Jet Airways (India) Ltd. AAA(SO) 2.64
Tata Motors Finance Ltd. A 1.49
Tata Motors Finance Ltd. (ABS Pool) AAA(SO) 1.00
Bajaj Auto Ltd. AAA(SO) 0.64
TToottaall MMoonneeyy MMaarrkkeett IInnssttrruummeennttss && OOtthheerr CCrreeddiitt EExxppoossuurreess
((aaggggrreeggaatteedd hhoollddiinnggss iinn aa ssiinnggllee iissssuueerr)) 2211..1144
Cash Margin 0.83
Other Cash, Cash Equivalents and Net Current Assets 5.89
GGrraanndd TToottaall 110000..0000
NNeett AAsssseettss ((RRss.. IInn LLaakkhhss)) 2200,,229999..4477
^̂PPaasstt ppeerrffoorrmmaannccee mmaayy oorr mmaayy nnoott bbee ssuussttaaiinneedd iinn tthhee ffuuttuurree* Absolute Returns ** Compounded Annualised Returns N.A. Not Available#CRISIL Balanced Fund Index $ Adjusted for bonus units declared under the scheme~Due to an over all sharp rise in the stock prices
^̂PPaasstt ppeerrffoorrmmaannccee mmaayy oorr mmaayy nnoott bbee ssuussttaaiinneedd iinn tthhee ffuuttuurree* Absolute Returns ** Compounded Annualised Returns N.A. Not Available#CRISIL MIP Blended Index $ Adjusted for bonus units declared under the scheme
Intouchmutually October 2009 17
hdfc-eq-r.qxd 11/7/2009 5:03 PM Page 7

HDFC Long Term Advantage Fund*An open-ended equity linked savings scheme with a lock-in period of 3 years
HDFC
TaxSaver
An open-ended equity linked savings scheme with a lock-in period of 3 years
Portfolio – Top 10 Holdings (as at October 31, 2009)
DDaattee PPeerriioodd NNAAVV RReettuurrnnss BBeenncchhmmaarrkkppeerr UUnniitt ((RRss..)) ((%%))^̂ RReettuurrnnss ((%%))##
NAV (as at October 30, 2009) NAV per Unit (Rs.)
Growth Option 105.196Dividend Option 34.313
Relative Performance ^ (Growth Option)
^̂PPaasstt ppeerrffoorrmmaannccee mmaayy oorr mmaayy nnoott bbee ssuussttaaiinneedd iinn tthhee ffuuttuurreePerformance of the Dividend Option for the investor would be net of Distribution Tax as applicable* Absolute Returns ** Compounded Annualised Returns #SENSEX~Due to an over all sharp rise in the stock prices
Apr 29, 09 Last Six Months (184 days) 68.298 54.03*~ 39.40*Oct 29, 08 Last 1 Year (366 days) 60.417 73.85**~ 75.49**Oct 30, 06 Last 3 Years (1096 days) 87.713 6.24** 6.86**Oct 29, 04 Last 5 Years (1827 days) 39.741 21.47** 22.86**Jan 02, 01 Since Inception (3223 days) 10.000 30.54** 16.85**
+ Industry Classification as recommended by AMFI
PPoorrttffoolliioo TTuurrnnoovveerr RRaattiioo ((LLaasstt 11 YYeeaarr)) 2244..0033%%
CCoommppaannyy IInndduussttrryy++ %% ttoo NNAAVV
EEQQUUIITTYY && EEQQUUIITTYY RREELLAATTEEDD
ICICI Bank Ltd. Banks 6.01
State Bank of India Banks 5.12
Tata Consultancy Services Ltd. Software 4.63
Reliance Industries Ltd. Petroleum Products 4.00
Infosys Technologies Ltd. Software 3.87
Crompton Greaves Ltd. Industrial Capital Goods 3.23
Exide Industries Ltd. Auto Ancillaries 3.22
GlaxoSmithKline Consumer Healthcare Ltd. Consumer Non Durables 3.20
Blue Star Ltd. Consumer Durables 3.18
Hero Honda Motors Ltd. Auto 2.84
TToottaall ooff TToopp TTeenn EEqquuiittyy HHoollddiinnggss 3399..3300
TToottaall EEqquuiittyy && EEqquuiittyy RReellaatteedd HHoollddiinnggss 9955..7733
Cash, Cash Equivalents and Net Current Assets 4.27
GGrraanndd TToottaall 110000..0000
NNeett AAsssseettss ((RRss.. IInn LLaakkhhss)) 8855,,555500..4455
DDaattee PPeerriioodd NNAAVV RReettuurrnnss BBeenncchhmmaarrkkppeerr UUnniitt ((RRss..)) ((%%))$$$$^̂ RReettuurrnnss ((%%))##
Relative Performance ^ (Growth Option)
^̂PPaasstt ppeerrffoorrmmaannccee mmaayy oorr mmaayy nnoott bbee ssuussttaaiinneedd iinn tthhee ffuuttuurreePerformance of the Dividend Option for the investor would be net of Distribution Tax as applicable* Absolute Returns #S&P CNX 500 (Please refer to page no 31)** Compounded Annualised Returns ~Due to an over all sharp rise in the stock prices$$ Adjusted for the dividends declared under the scheme prior to its splittng into the Dividendand Growth Options
Apr 29, 09 Last Six Months (184 days) 112.050 58.25*~ 44.69*Oct 29, 08 Last 1 Year (366 days) 94.943 86.44**~ 83.31**Oct 30, 06 Last 3 Years (1096 days) 140.550 8.05** 7.16**Oct 29, 04 Last 5 Years (1827 days) 49.406 29.08** 20.71**Oct 29, 99 Last 10 Years (3654 days) 29.560 27.45** 14.74**Mar 31, 96 Since Inception (4961 days) 10.000 32.26** 13.37**
NAV (as at October 30, 2009) NAV per Unit (Rs.)
Growth Option 177.317Dividend Option 55.157
Portfolio – Top 10 Holdings (as at October 31, 2009)
PPoorrttffoolliioo TTuurrnnoovveerr RRaattiioo ((LLaasstt 11 YYeeaarr)) 3311..6611%%
* Previously HDFC Tax Plan 2000
Banks 13.57
Consumer Non Durables 13.31
Software 8.50
Industrial Capital Goods 8.23
Construction Project 7.38
Auto Ancillaries 7.00
Pharmaceuticals 6.79
Petroleum Products 5.46
Oil 3.31
Consumer Durables 3.18
Auto 2.84
Telecom - Services 2.74
Finance 2.49
Media & Entertainment 2.41
Industrial Products 2.40
Chemicals 2.15
Transportation 2.00
Pesticides 1.15
Gas 0.82
Industry Allocation of Equity Holding (% of Net Assets)Banks 18.32
Pharmaceuticals 16.17
Software 9.53
Consumer Non Durables 7.24
Industrial Capital Goods 7.09
Media & Entertainment 6.18
Finance 6.11
Auto Ancillaries 4.86
Construction Project 3.93
Petroleum Products 3.73
Transportation 2.28
Oil 2.04
Auto 1.70
Industrial Products 1.61
Telecom - Services 1.54
Chemicals 0.87
Power 0.85
Construction 0.73
Paper Products 0.45
Trading 0.11
Industry Allocation of Equity Holding (% of Net Assets)
CCoommppaannyy IInndduussttrryy++ %% ttoo NNAAVV
EEQQUUIITTYY && EEQQUUIITTYY RREELLAATTEEDD
ICICI Bank Ltd. Banks 5.79
State Bank of India Banks 5.51
Crompton Greaves Ltd. Industrial Capital Goods 4.72
Dr Reddys Laboratories Ltd. Pharmaceuticals 4.49
Tata Consultancy Services Ltd. Software 3.57
Axis Bank Ltd Banks 3.45
Rural Electrification Corporation Ltd. Finance 3.28
Sun Pharmaceutical Industries Ltd. Pharmaceuticals 3.17
Patni Computer Systems Ltd. Software 3.05
Larsen & Toubro Ltd Construction Project 2.97
TToottaall ooff TToopp TTeenn EEqquuiittyy HHoollddiinnggss 4400..0000
TToottaall EEqquuiittyy && EEqquuiittyy RReellaatteedd HHoollddiinnggss 9955..3344
Cash, Cash Equivalents and Net Current Assets 4.66
GGrraanndd TToottaall 110000..0000
NNeett AAsssseettss ((RRss.. IInn LLaakkhhss)) 118899,,880022..3344
IN EQUITY - TAX PLANNING CATEGORY(24 schemes) for 3 and 5 year
periods ending October 31, 2009
Std Deviation Beta Sharpe Ratio*
Risk Ratio (for the 3-yr period ended October 30, 2009) 9.10% 0.9000 0.10
Std Deviation Beta Sharpe Ratio*
Risk Ratio (for the 3-yr period ended October 30, 2009) 9.70% 0.8850 0.12
Source : CRISIL Fund Analyser* Risk-free rate assumed to be 4.47% (364-day Treasury Bill yield on 30-10-09)
Source : CRISIL Fund Analyser* Risk-free rate assumed to be 4.47% (364-day Treasury Bill yield on 30-10-09)
+ Industry Classification as recommended by AMFI✤ PPaasstt ppeerrffoorrmmaannccee iiss nnoo gguuaarraanntteeee ooff ffuuttuurree rreessuullttss..
� Please refer to page no 31 for details on the Rating Methodology
18 October 2009 Intouchmutually
hdfc-eq-r.qxd 11/7/2009 5:03 PM Page 8
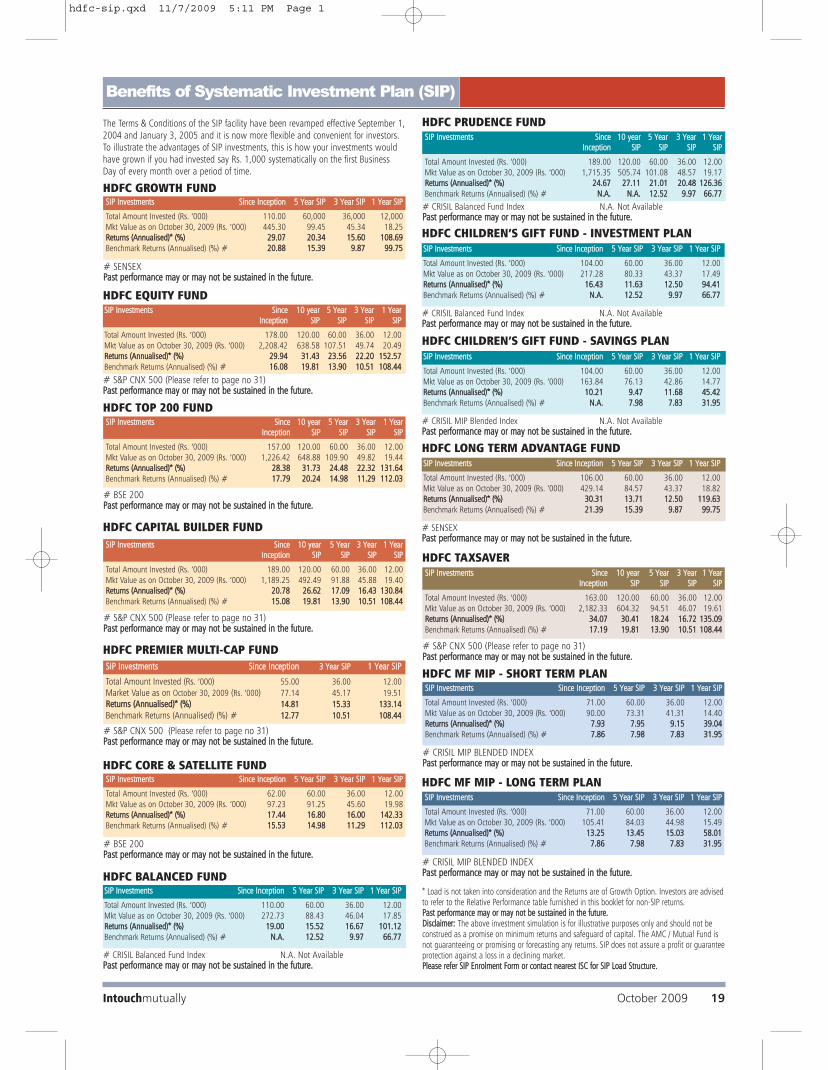
Benefits of Systematic Investment Plan (SIP)
# SENSEXPPaasstt ppeerrffoorrmmaannccee mmaayy oorr mmaayy nnoott bbee ssuussttaaiinneedd iinn tthhee ffuuttuurree..
SSIIPP IInnvveessttmmeennttss SSiinnccee IInncceeppttiioonn 55 YYeeaarr SSIIPP 33 YYeeaarr SSIIPP 11 YYeeaarr SSIIPP
Total Amount Invested (Rs. ‘000) 110.00 60,000 36,000 12,000Mkt Value as on October 30, 2009 (Rs. ‘000) 445.30 99.45 45.34 18.25 RReettuurrnnss ((AAnnnnuuaalliisseedd))** ((%%)) 2299..0077 2200..3344 1155..6600 110088..6699
Benchmark Returns (Annualised) (%) # 2200..8888 1155..3399 99..8877 9999..7755
HDFC GROWTH FUND
# BSE 200 PPaasstt ppeerrffoorrmmaannccee mmaayy oorr mmaayy nnoott bbee ssuussttaaiinneedd iinn tthhee ffuuttuurree..
SSIIPP IInnvveessttmmeennttss SSiinnccee IInncceeppttiioonn 55 YYeeaarr SSIIPP 33 YYeeaarr SSIIPP 11 YYeeaarr SSIIPP
Total Amount Invested (Rs. ‘000) 62.00 60.00 36.00 12.00Mkt Value as on October 30, 2009 (Rs. ‘000) 97.23 91.25 45.60 19.98RReettuurrnnss ((AAnnnnuuaalliisseedd))** ((%%)) 1177..4444 1166..8800 1166..0000 114422..3333
Benchmark Returns (Annualised) (%) # 1155..5533 1144..9988 1111..2299 111122..0033
HDFC CORE & SATELLITE FUND
# S&P CNX 500 (Please refer to page no 31)PPaasstt ppeerrffoorrmmaannccee mmaayy oorr mmaayy nnoott bbee ssuussttaaiinneedd iinn tthhee ffuuttuurree..
SSIIPP IInnvveessttmmeennttss SSiinnccee 1100 yyeeaarr 55 YYeeaarr 33 YYeeaarr 11 YYeeaarrIInncceeppttiioonn SSIIPP SSIIPP SSIIPP SSIIPP
Total Amount Invested (Rs. ‘000) 178.00 120.00 60.00 36.00 12.00Mkt Value as on October 30, 2009 (Rs. ‘000) 2,208.42 638.58 107.51 49.74 20.49RReettuurrnnss ((AAnnnnuuaalliisseedd))** ((%%)) 2299..9944 3311..4433 2233..5566 2222..2200 115522..5577
Benchmark Returns (Annualised) (%) # 1166..0088 1199..8811 1133..9900 1100..5511 110088..4444
HDFC EQUITY FUND
# BSE 200PPaasstt ppeerrffoorrmmaannccee mmaayy oorr mmaayy nnoott bbee ssuussttaaiinneedd iinn tthhee ffuuttuurree..
SSIIPP IInnvveessttmmeennttss SSiinnccee 1100 yyeeaarr 55 YYeeaarr 33 YYeeaarr 11 YYeeaarrIInncceeppttiioonn SSIIPP SSIIPP SSIIPP SSIIPP
Total Amount Invested (Rs. ‘000) 157.00 120.00 60.00 36.00 12.00Mkt Value as on October 30, 2009 (Rs. ‘000) 1,226.42 648.88 109.90 49.82 19.44 RReettuurrnnss ((AAnnnnuuaalliisseedd))** ((%%)) 2288..3388 3311..7733 2244..4488 2222..3322 113311..6644
Benchmark Returns (Annualised) (%) # 1177..7799 2200..2244 1144..9988 1111..2299 111122..0033
HDFC TOP 200 FUND
# S&P CNX 500 (Please refer to page no 31)PPaasstt ppeerrffoorrmmaannccee mmaayy oorr mmaayy nnoott bbee ssuussttaaiinneedd iinn tthhee ffuuttuurree..
SSIIPP IInnvveessttmmeennttss SSiinnccee 1100 yyeeaarr 55 YYeeaarr 33 YYeeaarr 11 YYeeaarrIInncceeppttiioonn SSIIPP SSIIPP SSIIPP SSIIPP
Total Amount Invested (Rs. ‘000) 189.00 120.00 60.00 36.00 12.00Mkt Value as on October 30, 2009 (Rs. ‘000) 1,189.25 492.49 91.88 45.88 19.40RReettuurrnnss ((AAnnnnuuaalliisseedd))** ((%%)) 2200..7788 2266..6622 1177..0099 1166..4433 113300..8844
Benchmark Returns (Annualised) (%) # 1155..0088 1199..8811 1133..9900 1100..5511 110088..4444
HDFC CAPITAL BUILDER FUND
# S&P CNX 500 (Please refer to page no 31)PPaasstt ppeerrffoorrmmaannccee mmaayy oorr mmaayy nnoott bbee ssuussttaaiinneedd iinn tthhee ffuuttuurree..
SSIIPP IInnvveessttmmeennttss SSiinnccee IInncceeppttiioonn 33 YYeeaarr SSIIPP 11 YYeeaarr SSIIPP
Total Amount Invested (Rs. ‘000) 55.00 36.00 12.00
Market Value as on October 30, 2009 (Rs. ‘000) 77.14 45.17 19.51
RReettuurrnnss ((AAnnnnuuaalliisseedd))** ((%%)) 1144..8811 1155..3333 113333..1144
Benchmark Returns (Annualised) (%) # 1122..7777 1100..5511 110088..4444
HDFC PREMIER MULTI-CAP FUND
# CRISIL MIP BLENDED INDEXPPaasstt ppeerrffoorrmmaannccee mmaayy oorr mmaayy nnoott bbee ssuussttaaiinneedd iinn tthhee ffuuttuurree..
SSIIPP IInnvveessttmmeennttss SSiinnccee IInncceeppttiioonn 55 YYeeaarr SSIIPP 33 YYeeaarr SSIIPP 11 YYeeaarr SSIIPP
Total Amount Invested (Rs. ‘000) 71.00 60.00 36.00 12.00Mkt Value as on October 30, 2009 (Rs. ‘000) 90.00 73.31 41.31 14.40RReettuurrnnss ((AAnnnnuuaalliisseedd))** ((%%)) 77..9933 77..9955 99..1155 3399..0044
Benchmark Returns (Annualised) (%) # 77..8866 77..9988 77..8833 3311..9955
HDFC MF MIP - SHORT TERM PLAN
# CRISIL MIP BLENDED INDEXPPaasstt ppeerrffoorrmmaannccee mmaayy oorr mmaayy nnoott bbee ssuussttaaiinneedd iinn tthhee ffuuttuurree..
SSIIPP IInnvveessttmmeennttss SSiinnccee IInncceeppttiioonn 55 YYeeaarr SSIIPP 33 YYeeaarr SSIIPP 11 YYeeaarr SSIIPP
Total Amount Invested (Rs. ‘000) 71.00 60.00 36.00 12.00Mkt Value as on October 30, 2009 (Rs. ‘000) 105.41 84.03 44.98 15.49RReettuurrnnss ((AAnnnnuuaalliisseedd))** ((%%)) 1133..2255 1133..4455 1155..0033 5588..0011
Benchmark Returns (Annualised) (%) # 77..8866 77..9988 77..8833 3311..9955
HDFC MF MIP - LONG TERM PLAN
# CRISIL Balanced Fund Index N.A. Not AvailablePPaasstt ppeerrffoorrmmaannccee mmaayy oorr mmaayy nnoott bbee ssuussttaaiinneedd iinn tthhee ffuuttuurree..
SSIIPP IInnvveessttmmeennttss SSiinnccee IInncceeppttiioonn 55 YYeeaarr SSIIPP 33 YYeeaarr SSIIPP 11 YYeeaarr SSIIPP
Total Amount Invested (Rs. ‘000) 110.00 60.00 36.00 12.00Mkt Value as on October 30, 2009 (Rs. ‘000) 272.73 88.43 46.04 17.85 RReettuurrnnss ((AAnnnnuuaalliisseedd))** ((%%)) 1199..0000 1155..5522 1166..6677 110011..1122
Benchmark Returns (Annualised) (%) # NN..AA.. 1122..5522 99..9977 6666..7777
HDFC BALANCED FUND
# CRISIL Balanced Fund Index N.A. Not AvailablePPaasstt ppeerrffoorrmmaannccee mmaayy oorr mmaayy nnoott bbee ssuussttaaiinneedd iinn tthhee ffuuttuurree..
SSIIPP IInnvveessttmmeennttss SSiinnccee 1100 yyeeaarr 55 YYeeaarr 33 YYeeaarr 11 YYeeaarrIInncceeppttiioonn SSIIPP SSIIPP SSIIPP SSIIPP
Total Amount Invested (Rs. ‘000) 189.00 120.00 60.00 36.00 12.00Mkt Value as on October 30, 2009 (Rs. ‘000) 1,715.35 505.74 101.08 48.57 19.17RReettuurrnnss ((AAnnnnuuaalliisseedd))** ((%%)) 2244..6677 2277..1111 2211..0011 2200..4488 112266..3366
Benchmark Returns (Annualised) (%) # NN..AA.. NN..AA.. 1122..5522 99..9977 6666..7777
HDFC PRUDENCE FUND
# CRISIL Balanced Fund Index N.A. Not AvailablePPaasstt ppeerrffoorrmmaannccee mmaayy oorr mmaayy nnoott bbee ssuussttaaiinneedd iinn tthhee ffuuttuurree..
SSIIPP IInnvveessttmmeennttss SSiinnccee IInncceeppttiioonn 55 YYeeaarr SSIIPP 33 YYeeaarr SSIIPP 11 YYeeaarr SSIIPP
Total Amount Invested (Rs. ‘000) 104.00 60.00 36.00 12.00Mkt Value as on October 30, 2009 (Rs. ‘000) 217.28 80.33 43.37 17.49 RReettuurrnnss ((AAnnnnuuaalliisseedd))** ((%%)) 1166..4433 1111..6633 1122..5500 9944..4411
Benchmark Returns (Annualised) (%) # NN..AA.. 1122..5522 99..9977 6666..7777
HDFC CHILDREN’S GIFT FUND - INVESTMENT PLAN
# CRISIL MIP Blended Index N.A. Not AvailablePPaasstt ppeerrffoorrmmaannccee mmaayy oorr mmaayy nnoott bbee ssuussttaaiinneedd iinn tthhee ffuuttuurree..
SSIIPP IInnvveessttmmeennttss SSiinnccee IInncceeppttiioonn 55 YYeeaarr SSIIPP 33 YYeeaarr SSIIPP 11 YYeeaarr SSIIPP
Total Amount Invested (Rs. ‘000) 104.00 60.00 36.00 12.00Mkt Value as on October 30, 2009 (Rs. ‘000) 163.84 76.13 42.86 14.77RReettuurrnnss ((AAnnnnuuaalliisseedd))** ((%%)) 1100..2211 99..4477 1111..6688 4455..4422
Benchmark Returns (Annualised) (%) # NN..AA.. 77..9988 77..8833 3311..9955
HDFC CHILDREN’S GIFT FUND - SAVINGS PLAN
# SENSEXPPaasstt ppeerrffoorrmmaannccee mmaayy oorr mmaayy nnoott bbee ssuussttaaiinneedd iinn tthhee ffuuttuurree..
SSIIPP IInnvveessttmmeennttss SSiinnccee IInncceeppttiioonn 55 YYeeaarr SSIIPP 33 YYeeaarr SSIIPP 11 YYeeaarr SSIIPP
Total Amount Invested (Rs. ‘000) 106.00 60.00 36.00 12.00Mkt Value as on October 30, 2009 (Rs. ‘000) 429.14 84.57 43.37 18.82RReettuurrnnss ((AAnnnnuuaalliisseedd))** ((%%)) 3300..3311 1133..7711 1122..5500 111199..6633
Benchmark Returns (Annualised) (%) # 2211..3399 1155..3399 99..8877 9999..7755
HDFC LONG TERM ADVANTAGE FUND
# S&P CNX 500 (Please refer to page no 31)PPaasstt ppeerrffoorrmmaannccee mmaayy oorr mmaayy nnoott bbee ssuussttaaiinneedd iinn tthhee ffuuttuurree..
SSIIPP IInnvveessttmmeennttss SSiinnccee 1100 yyeeaarr 55 YYeeaarr 33 YYeeaarr 11 YYeeaarrIInncceeppttiioonn SSIIPP SSIIPP SSIIPP SSIIPP
Total Amount Invested (Rs. ‘000) 163.00 120.00 60.00 36.00 12.00Mkt Value as on October 30, 2009 (Rs. ‘000) 2,182.33 604.32 94.51 46.07 19.61RReettuurrnnss ((AAnnnnuuaalliisseedd))** ((%%)) 3344..0077 3300..4411 1188..2244 1166..7722 113355..0099
Benchmark Returns (Annualised) (%) # 1177..1199 1199..8811 1133..9900 1100..5511 110088..4444
HDFC TAXSAVER
* Load is not taken into consideration and the Returns are of Growth Option. Investors are advisedto refer to the Relative Performance table furnished in this booklet for non-SIP returns. PPaasstt ppeerrffoorrmmaannccee mmaayy oorr mmaayy nnoott bbee ssuussttaaiinneedd iinn tthhee ffuuttuurree..DDiissccllaaiimmeerr:: The above investment simulation is for illustrative purposes only and should not beconstrued as a promise on minimum returns and safeguard of capital. The AMC / Mutual Fund isnot guaranteeing or promising or forecasting any returns. SIP does not assure a profit or guaranteeprotection against a loss in a declining market.PPlleeaassee rreeffeerr SSIIPP EEnnrroollmmeenntt FFoorrmm oorr ccoonnttaacctt nneeaarreesstt IISSCC ffoorr SSIIPP LLooaadd SSttrruuccttuurree..
The Terms & Conditions of the SIP facility have been revamped effective September 1,2004 and January 3, 2005 and it is now more flexible and convenient for investors.To illustrate the advantages of SIP investments, this is how your investments wouldhave grown if you had invested say Rs. 1,000 systematically on the first BusinessDay of every month over a period of time.
October 2009 19Intouchmutually
hdfc-sip.qxd 11/7/2009 5:11 PM Page 1

CCoommppaannyy // IIssssuueerr IInndduussttrryy++ // RRaattiinngg %% ttoo NNAAVV
EEQQUUIITTYY && EEQQUUIITTYY RREELLAATTEEDD
Zee Entertainment Enterprises Ltd. Media & Entertainment 0.89
Cipla Ltd. Pharmaceuticals 0.89
ITC Ltd. Consumer Non Durables 0.82
Sun Pharmaceutical Industries Ltd. Pharmaceuticals 0.75
Oil & Natural Gas Corporation Ltd. Oil 0.66
Larsen & Toubro Ltd. Construction Project 0.61
The Federal Bank Ltd. Banks 0.60
ICICI Bank Ltd. Banks 0.58
Procter & Gamble Hygiene and Health Care Ltd. Consumer Non Durables 0.54
Jagran Prakashan Ltd. Media & Entertainment 0.53
TToottaall ooff TToopp TTeenn EEqquuiittyy HHoollddiinnggss 66..8877
TToottaall EEqquuiittyy && EEqquuiittyy RReellaatteedd HHoollddiinnggss 1111..6655
MMoonneeyy MMaarrkkeett IInnssttrruummeennttss && OOtthheerr CCrreeddiitt EExxppoossuurreess
State Bank of Patiala P1+ 9.20
Shriram Transport Finance Co. Ltd. AA(ind)/AA+(SO) 9.04
Housing Development Finance Corporation Ltd. $ AAA 5.81
Tata Motors Ltd. (Guaranteed by SBI) AAA(SO) 4.09
Rural Electrification Corporation Ltd. AAA 3.98
Export-Import Bank Of India AAA 3.97
Bharat Petroleum Corporation Ltd. AAA 3.88
Indian Oil Corporation Ltd. AAA 3.80
Axis Bank Ltd. P1+ 3.78
Infrastructure Development Finance Co. Ltd. AAA 3.49
TToottaall ooff TToopp TTeenn MMoonneeyy MMaarrkkeett IInnssttrruummeennttss && OOtthheerr CCrreeddiitt EExxppoossuurreess((aaggggrreeggaatteedd hhoollddiinnggss iinn aa ssiinnggllee iissssuueerr)) 5511..0044
TToottaall MMoonneeyy MMaarrkkeett IInnssttrruummeennttss && OOtthheerr CCrreeddiitt EExxppoossuurreess 8811..1155
Cash Margin 0.12
Other Cash, Cash Equivalents and Net Current Assets 7.08
GGrraanndd TToottaall 110000..0000
NNeett AAsssseettss ((RRss.. IInn LLaakkhhss)) 2255,,888800..9988
Portfolio – Top 10 Holdings (as at October 31, 2009)CCoommppaannyy // IIssssuueerr IInndduussttrryy++ // RRaattiinngg %% ttoo NNAAVV
EEQQUUIITTYY && EEQQUUIITTYY RREELLAATTEEDDState Bank of India Banks 1.33 Oil & Natural Gas Corporation Ltd. Oil 1.03 Bank of Baroda Banks 1.01 Procter & Gamble Hygiene and Health Care Ltd. Consumer Non Durables 0.94 Tata Consultancy Services Ltd. Software 0.94 NTPC Ltd. Power 0.86 ICICI Bank Ltd. Banks 0.86 LIC Housing Finance Ltd. Finance 0.75 Page Industries Ltd. Textile Products 0.73 MRF Ltd. Auto Ancillaries 0.73 TToottaall ooff TToopp TTeenn EEqquuiittyy HHoollddiinnggss 99..1188 TToottaall EEqquuiittyy && EEqquuiittyy RReellaatteedd HHoollddiinnggss 2211..8888 GGoovveerrnnmmeenntt SSeeccuurriittiieess,, MMoonneeyy MMaarrkkeett IInnssttrruummeennttss && OOtthheerr CCrreeddiitt EExxppoossuurreessGovernment Securities Sovereign 10.21 Power Finance Corporation Ltd. AAA 7.75 Housing Development Finance Corporation Ltd.$ AAA 6.67 Rural Electrification Corporation Ltd. AAA 4.28 Export-Import Bank Of India AAA/P1+ 3.19 National Bank for Agriculture & Rural Development AAA 3.11 Bharat Petroleum Corporation Limited AAA 3.08 Shriram Transport Finance Co. Ltd. AA(ind)/AA+(SO) 2.76 LIC Housing Finance Ltd. AAA 2.23 Sundaram Finance Ltd. LAA+ 2.01 TToottaall ooff TToopp TTeenn GGoovveerrnnmmeenntt SSeeccuurriittiieess,, MMoonneeyy MMaarrkkeett IInnssttrruummeennttss && OOtthheerr CCrreeddiitt EExxppoossuurreess((aaggggrreeggaatteedd hhoollddiinnggss iinn aa ssiinnggllee iissssuueerr)) 4455..2299TToottaall GGoovveerrnnmmeenntt SSeeccuurriittiieess,, MMoonneeyy MMaarrkkeett IInnssttrruummeennttss && OOtthheerr CCrreeddiitt EExxppoossuurreess 6699..6633 Cash Margin 0.07 Other Cash, Cash Equivalents and Net Current Assets 8.42 GGrraanndd TToottaall 110000..0000NNeett AAsssseettss ((RRss.. IInn LLaakkhhss)) 224466,,555555..2255
Portfolio – Top 10 Holdings (as at October 31, 2009)
+ Industry Classification as recommended by AMFI, $ Sponsor✤ PPaasstt ppeerrffoorrmmaannccee iiss nnoo gguuaarraanntteeee ooff ffuuttuurree rreessuullttss..
� Please refer to page no 31 for details on the Rating Methodology
MMooddiiffiieedd DDuurraattiioonn ((DDeebbtt IInnssttrruummeennttss)) 22..1122 yyeeaarrss
AAvveerraaggee PPoorrttffoolliioo MMaattuurriittyy 22..8877 yyeeaarrss ((ootthheerr tthhaann eeqquuiittyy iinnvveessttmmeennttss))
+ Industry Classification as recommended by AMFI, $ Sponsor
MMooddiiffiieedd DDuurraattiioonn ((DDeebbtt IInnssttrruummeennttss)) 11..3300 yyeeaarrss
AAvveerraaggee PPoorrttffoolliioo MMaattuurriittyy 22..0000 yyeeaarrss ((ootthheerr tthhaann eeqquuiittyy iinnvveessttmmeennttss))
^̂PPaasstt PPeerrffoorrmmaannccee mmaayy oorr mmaayy nnoott bbee ssuussttaaiinneedd iinn tthhee ffuuttuurreePerformance of the Dividend Option for the investor would be net of Distribution Tax as applicable* Absolute Returns ** Compounded Annualised Returns #Crisil MIP Blended Index
NNAAVV (as at October 30, 2009) NAV per Unit (Rs.)
Growth Option 15.6311Monthly Dividend Option 11.0894Quarterly Dividend Option 11.3736
DDaattee PPeerriioodd NNAAVV RReettuurrnnss BBeenncchhmmaarrkkppeerr UUnniitt ((RRss..)) ((%%))^̂ RReettuurrnnss ((%%))##
Apr 29, 09 Last Six Months (184 days) 14.1620 10.37* 5.03*Oct 29, 08 Last 1 Year (366 days) 12.8937 21.17** 18.81**Oct 30, 06 Last 3 Years (1096 days) 12.7500 7.02** 7.35**Oct 29, 04 Last 5 Years (1827 days) 10.5560 8.16** 8.52**Dec 26, 03 Since Inception (2135 days) 10.0000 7.94** 7.08**
Relative Performance^(Growth Option)
^̂PPaasstt PPeerrffoorrmmaannccee mmaayy oorr mmaayy nnoott bbee ssuussttaaiinneedd iinn tthhee ffuuttuurreePerformance of the Dividend Option for the investor would be net of Distribution Tax as applicable* Absolute Returns ** Compounded Annualised Returns #Crisil MIP Blended Index
DDaattee PPeerriioodd NNAAVV RReettuurrnnss BBeenncchhmmaarrkkppeerr UUnniitt ((RRss..)) ((%%))^̂ RReettuurrnnss ((%%))##
Apr 29, 09 Last Six Months (184 days) 17.2035 16.82* 5.03*Oct 29, 08 Last 1 Year (366 days) 14.5800 37.72** 18.81**Oct 30, 06 Last 3 Years (1096 days) 14.4070 11.72** 7.35**Oct 29, 04 Last 5 Years (1827 days) 10.6500 13.53** 8.52**Dec 26, 03 Since Inception (2135 days) 10.0000 12.67** 7.08**
Relative Performance^(Growth Option)
NNAAVV (as at October 30, 2009) NAV per Unit (Rs.)
Growth Option 20.0979Monthly Dividend Option 12.3667Quarterly Dividend Option 12.7041
HDFC MF MIP - Short Term Plan
An open-ended income scheme. Monthly income is not assured and is subject to availability of distributable surplus
HDFC MF MIP - Long Term Plan
An open ended income scheme with no assured returns subject to availability of distributable profits
In Hybrid - Monthly Income Category(33 schemes) for 3 & 5 year periods
ending October 31, 2009
Intouchmutually20 October 2009
hdfc-dt.qxd 11/7/2009 5:13 PM Page 1
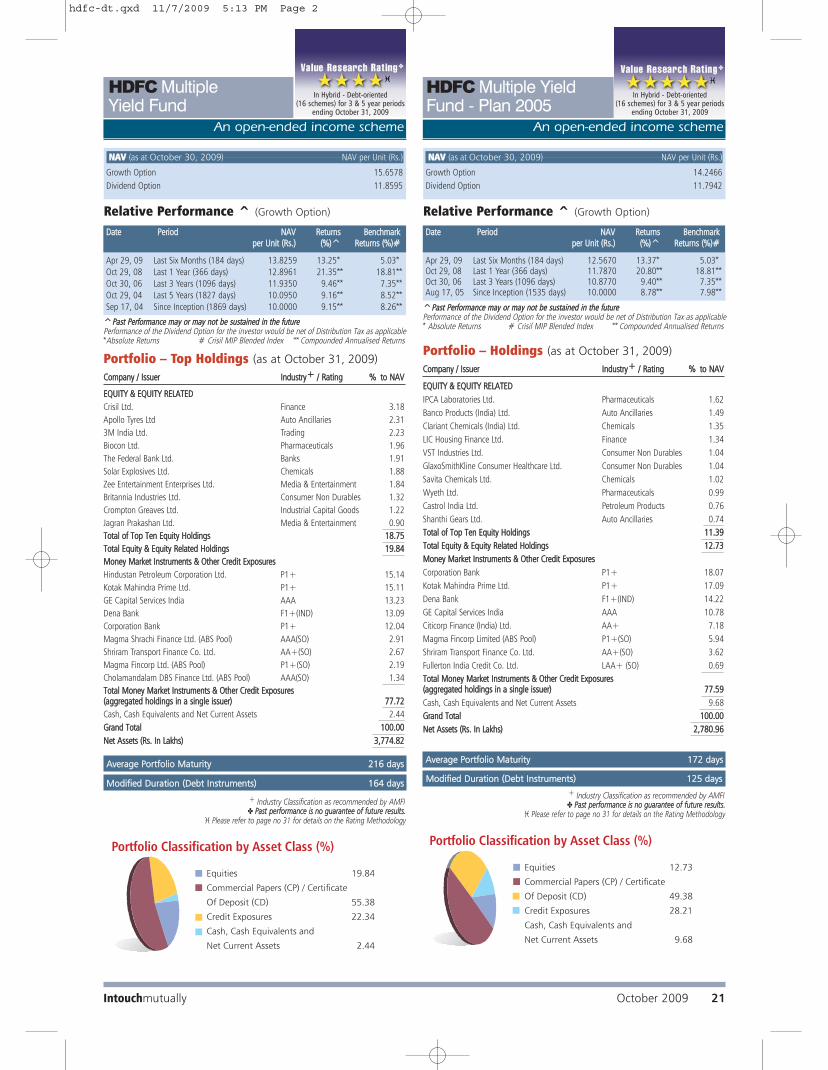
NNAAVV (as at October 30, 2009) NAV per Unit (Rs.)
Growth Option 15.6578
Dividend Option 11.8595
HDFC Multiple Yield Fund
An open-ended income scheme
^̂PPaasstt PPeerrffoorrmmaannccee mmaayy oorr mmaayy nnoott bbee ssuussttaaiinneedd iinn tthhee ffuuttuurreePerformance of the Dividend Option for the investor would be net of Distribution Tax as applicable*Absolute Returns # Crisil MIP Blended Index ** Compounded Annualised Returns
+ Industry Classification as recommended by AMFI✤ PPaasstt ppeerrffoorrmmaannccee iiss nnoo gguuaarraanntteeee ooff ffuuttuurree rreessuullttss..
� Please refer to page no 31 for details on the Rating Methodology
+ Industry Classification as recommended by AMFI✤ PPaasstt ppeerrffoorrmmaannccee iiss nnoo gguuaarraanntteeee ooff ffuuttuurree rreessuullttss..
� Please refer to page no 31 for details on the Rating Methodology
DDaattee PPeerriioodd NNAAVV RReettuurrnnss BBeenncchhmmaarrkkppeerr UUnniitt ((RRss..)) ((%%))^̂ RReettuurrnnss ((%%))##
Relative Performance ^ (Growth Option)
Apr 29, 09 Last Six Months (184 days) 13.8259 13.25* 5.03*Oct 29, 08 Last 1 Year (366 days) 12.8961 21.35** 18.81**Oct 30, 06 Last 3 Years (1096 days) 11.9350 9.46** 7.35**Oct 29, 04 Last 5 Years (1827 days) 10.0950 9.16** 8.52**Sep 17, 04 Since Inception (1869 days) 10.0000 9.15** 8.26**
NNAAVV (as at October 30, 2009) NAV per Unit (Rs.)
Growth Option 14.2466
Dividend Option 11.7942
HDFC Multiple YieldFund - Plan 2005
An open-ended income scheme
DDaattee PPeerriioodd NNAAVV RReettuurrnnss BBeenncchhmmaarrkkppeerr UUnniitt ((RRss..)) ((%%))^̂ RReettuurrnnss ((%%))##
Relative Performance ^ (Growth Option)
MMooddiiffiieedd DDuurraattiioonn ((DDeebbtt IInnssttrruummeennttss)) 116644 ddaayyss
AAvveerraaggee PPoorrttffoolliioo MMaattuurriittyy 221166 ddaayyss AAvveerraaggee PPoorrttffoolliioo MMaattuurriittyy 117722 ddaayyss
CCoommppaannyy // IIssssuueerr IInndduussttrryy++ // RRaattiinngg %% ttoo NNAAVV
EEQQUUIITTYY && EEQQUUIITTYY RREELLAATTEEDD
IPCA Laboratories Ltd. Pharmaceuticals 1.62
Banco Products (India) Ltd. Auto Ancillaries 1.49
Clariant Chemicals (India) Ltd. Chemicals 1.35
LIC Housing Finance Ltd. Finance 1.34
VST Industries Ltd. Consumer Non Durables 1.04
GlaxoSmithKline Consumer Healthcare Ltd. Consumer Non Durables 1.04
Savita Chemicals Ltd. Chemicals 1.02
Wyeth Ltd. Pharmaceuticals 0.99
Castrol India Ltd. Petroleum Products 0.76
Shanthi Gears Ltd. Auto Ancillaries 0.74
TToottaall ooff TToopp TTeenn EEqquuiittyy HHoollddiinnggss 1111..3399
TToottaall EEqquuiittyy && EEqquuiittyy RReellaatteedd HHoollddiinnggss 1122..7733
MMoonneeyy MMaarrkkeett IInnssttrruummeennttss && OOtthheerr CCrreeddiitt EExxppoossuurreess
Corporation Bank P1+ 18.07
Kotak Mahindra Prime Ltd. P1+ 17.09
Dena Bank F1+(IND) 14.22
GE Capital Services India AAA 10.78
Citicorp Finance (India) Ltd. AA+ 7.18
Magma Fincorp Limited (ABS Pool) P1+(SO) 5.94
Shriram Transport Finance Co. Ltd. AA+(SO) 3.62
Fullerton India Credit Co. Ltd. LAA+ (SO) 0.69
TToottaall MMoonneeyy MMaarrkkeett IInnssttrruummeennttss && OOtthheerr CCrreeddiitt EExxppoossuurreess((aaggggrreeggaatteedd hhoollddiinnggss iinn aa ssiinnggllee iissssuueerr)) 7777..5599
Cash, Cash Equivalents and Net Current Assets 9.68
GGrraanndd TToottaall 110000..0000
NNeett AAsssseettss ((RRss.. IInn LLaakkhhss)) 22,,778800..9966
Portfolio – Holdings (as at October 31, 2009)
MMooddiiffiieedd DDuurraattiioonn ((DDeebbtt IInnssttrruummeennttss)) 112255 ddaayyss
In Hybrid - Debt-oriented (16 schemes) for 3 & 5 year periods
ending October 31, 2009
In Hybrid - Debt-oriented (16 schemes) for 3 & 5 year periods
ending October 31, 2009
Apr 29, 09 Last Six Months (184 days) 12.5670 13.37* 5.03*Oct 29, 08 Last 1 Year (366 days) 11.7870 20.80** 18.81**Oct 30, 06 Last 3 Years (1096 days) 10.8770 9.40** 7.35**Aug 17, 05 Since Inception (1535 days) 10.0000 8.78** 7.98**
^̂PPaasstt PPeerrffoorrmmaannccee mmaayy oorr mmaayy nnoott bbee ssuussttaaiinneedd iinn tthhee ffuuttuurreePerformance of the Dividend Option for the investor would be net of Distribution Tax as applicable* Absolute Returns # Crisil MIP Blended Index ** Compounded Annualised Returns
CCoommppaannyy // IIssssuueerr IInndduussttrryy++ // RRaattiinngg %% ttoo NNAAVV
EEQQUUIITTYY && EEQQUUIITTYY RREELLAATTEEDD
Crisil Ltd. Finance 3.18
Apollo Tyres Ltd Auto Ancillaries 2.31
3M India Ltd. Trading 2.23
Biocon Ltd. Pharmaceuticals 1.96
The Federal Bank Ltd. Banks 1.91
Solar Explosives Ltd. Chemicals 1.88
Zee Entertainment Enterprises Ltd. Media & Entertainment 1.84
Britannia Industries Ltd. Consumer Non Durables 1.32
Crompton Greaves Ltd. Industrial Capital Goods 1.22
Jagran Prakashan Ltd. Media & Entertainment 0.90
TToottaall ooff TToopp TTeenn EEqquuiittyy HHoollddiinnggss 1188..7755
TToottaall EEqquuiittyy && EEqquuiittyy RReellaatteedd HHoollddiinnggss 1199..8844
MMoonneeyy MMaarrkkeett IInnssttrruummeennttss && OOtthheerr CCrreeddiitt EExxppoossuurreess
Hindustan Petroleum Corporation Ltd. P1+ 15.14
Kotak Mahindra Prime Ltd. P1+ 15.11
GE Capital Services India AAA 13.23
Dena Bank F1+(IND) 13.09
Corporation Bank P1+ 12.04
Magma Shrachi Finance Ltd. (ABS Pool) AAA(SO) 2.91
Shriram Transport Finance Co. Ltd. AA+(SO) 2.67
Magma Fincorp Ltd. (ABS Pool) P1+(SO) 2.19
Cholamandalam DBS Finance Ltd. (ABS Pool) AAA(SO) 1.34
TToottaall MMoonneeyy MMaarrkkeett IInnssttrruummeennttss && OOtthheerr CCrreeddiitt EExxppoossuurreess((aaggggrreeggaatteedd hhoollddiinnggss iinn aa ssiinnggllee iissssuueerr)) 7777..7722
Cash, Cash Equivalents and Net Current Assets 2.44
GGrraanndd TToottaall 110000..0000
NNeett AAsssseettss ((RRss.. IInn LLaakkhhss)) 33,,777744..8822
Portfolio – Top Holdings (as at October 31, 2009)
October 2009 21Intouchmutually
hdfc-dt.qxd 11/7/2009 5:13 PM Page 2

NNAAVV (as at October 30, 2009) NAV per Unit (Rs.)
Growth Option 20.9456
Dividend Option 10.8544
NNAAVV (as at October 30, 2009) NAV per Unit (Rs.)
Growth Option 30.3609
Quarterly Dividend Option 11.0876
Half-Yearly Dividend Option 10.7981
Yearly Dividend Option 11.5604
HDFC Income FundAn open-ended income scheme
^̂PPaasstt PPeerrffoorrmmaannccee mmaayy oorr mmaayy nnoott bbee ssuussttaaiinneedd iinn tthhee ffuuttuurreePerformance of the Dividend Option for the investor would be net of Distribution Tax as applicable* Absolute Returns ** Compounded Annualised Returns# Crisil Composite Bond Fund Index N.A. Not Available
DDaattee PPeerriioodd NNAAVV RReettuurrnnss BBeenncchhmmaarrkkppeerr UUnniitt ((RRss..)) ((%%))^̂ RReettuurrnnss ((%%))##
Apr 29, 09 Last Six Months (184 days) 21.0165 -0.34* -0.09*Oct 29, 08 Last 1 Year (366 days) 17.9602 16.57** 9.67**Oct 30, 06 Last 3 Years (1096 days) 16.5915 8.07** 6.26**Oct 29, 04 Last 5 Years (1827 days) 15.4699 6.24** 5.63**Sep 11, 00 Since Inception (3336 days) 10.0000 8.43** N.A.
Relative Performance^(Growth Option)
MMooddiiffiieedd DDuurraattiioonn 44..8888 yyeeaarrss
AAvveerraaggee PPoorrttffoolliioo MMaattuurriittyy 77..4444 yyeeaarrss
AAvveerraaggee PPoorrttffoolliioo MMaattuurriittyy 77..3399 yyeeaarrss
HDFC High Interest FundAn open-ended income scheme
^̂PPaasstt PPeerrffoorrmmaannccee mmaayy oorr mmaayy nnoott bbee ssuussttaaiinneedd iinn tthhee ffuuttuurreePerformance of the Dividend Option for the investor would be net of Distribution Tax as applicable* Absolute Returns ** Compounded Annualised Returns #CRISIL Composite Bond Fund Index N.A. Not Available
DDaattee PPeerriioodd NNAAVV RReettuurrnnss BBeenncchhmmaarrkkppeerr UUnniitt ((RRss..)) ((%%))^̂ RReettuurrnnss ((%%))##
Apr 29, 09 Last Six Months (184 days) 30.5698 -0.68* -0.09*Oct 29, 08 Last 1 Year (366 days) 26.8162 13.18** 9.67**Oct 30, 06 Last 3 Years (1096 days) 24.4540 7.47** 6.26**Oct 29, 04 Last 5 Years (1827 days) 22.5602 6.11** 5.63**Oct 29, 99 Last 10 Years (3654 days) 13.5978 8.35** N.A.Apr 28, 97 Since Inception (4568 days) 10.0000 9.28** N.A.
Relative Performance ^ (Growth Option)
MMooddiiffiieedd DDuurraattiioonn 44..6688 yyeeaarrss
IIssssuueerr RRaattiinngg %% ttoo NNAAVV
GGOOVVEERRNNMMEENNTT SSEECCUURRIITTIIEESS,, MMOONNEEYY MMAARRKKEETT IINNSSTTRRUUMMEENNTTSS && OOTTHHEERR CCRREEDDIITT EEXXPPOOSSUURREESS
Government Securities Sovereign 44.64
Indian Oil Corporation Ltd. LAA+ 9.37
State Bank of India AAA 9.21
National Bank for Agriculture & Rural Development AAA 5.64
National Housing Bank AAA 4.32
Power Finance Corporation Ltd. AAA 3.13
NTPC Ltd. AAA 2.90
Power Grid Corporation of India Ltd. AAA 2.40
HDFC Bank Ltd. AAA 1.24
Housing Development Finance Corporation Ltd. $ AAA 0.29
TToottaall ooff TToopp TTeenn GGoovveerrnnmmeenntt SSeeccuurriittiieess,,
MMoonneeyy MMaarrkkeett IInnssttrruummeennttss && OOtthheerr CCrreeddiitt EExxppoossuurreess
((aaggggrreeggaatteedd hhoollddiinnggss iinn aa ssiinnggllee iissssuueerr)) 8833..1144
Cash, Cash Equivalents and Net Current Assets 16.86
GGrraanndd TToottaall 110000..0000
NNeett AAsssseettss ((RRss.. IInn LLaakkhhss)) 8866,,116655..2255
Portfolio – Top 10 Holdings (as at October 31, 2009)
IIssssuueerr RRaattiinngg %% ttoo NNAAVV
GGOOVVEERRNNMMEENNTT SSEECCUURRIITTIIEESS,, MMOONNEEYY MMAARRKKEETT IINNSSTTRRUUMMEENNTTSS && OOTTHHEERR CCRREEDDIITT EEXXPPOOSSUURREESS
Government Securities Sovereign 45.12
Indian Oil Corporation Ltd. LAA+ 9.79
Power Grid Corporation of India Ltd. AAA 7.83
National Housing Bank AAA 6.89
Tata Motors Ltd. (Guaranteed by SBI) AAA(SO) 3.85
Punjab National Bank F1+(IND) 3.76
National Bank for Agriculture & Rural Development AAA 2.38
Power Finance Corporation Ltd. AAA 2.17
HDFC Bank Ltd. AAA 2.02
Neyveli Lignite Corporation Ltd. AAA 1.88
TToottaall ooff TToopp TTeenn GGoovveerrnnmmeenntt SSeeccuurriittiieess,,
MMoonneeyy MMaarrkkeett IInnssttrruummeennttss && OOtthheerr CCrreeddiitt EExxppoossuurreess
((aaggggrreeggaatteedd hhoollddiinnggss iinn aa ssiinnggllee iissssuueerr)) 8855..6699
TToottaall GGoovveerrnnmmeenntt SSeeccuurriittiieess,, MMoonneeyy MMaarrkkeett IInnssttrruummeennttss
&& OOtthheerr CCrreeddiitt EExxppoossuurreess 8877..6644
Cash, Cash Equivalents and Net Current Assets 12.36
GGrraanndd TToottaall 110000..0000
NNeett AAsssseettss ((RRss.. IInn LLaakkhhss)) 2266,,334422..5566
Portfolio – Holdings (as at October 31, 2009)
$ Sponsor
Intouchmutually22 October 2009
hdfc-dt.qxd 11/7/2009 5:13 PM Page 3

NNAAVV (as at October 30, 2009) NAV per Unit (Rs.)
Growth Option 17.5168
Dividend Reinvestment Option 10.3351
NNAAVV (as at October 30, 2009) NAV per Unit (Rs.)
Growth Option 17.8660
Dividend Option 10.6004
HDFC Short Term Plan
An open-ended income scheme
^̂PPaasstt PPeerrffoorrmmaannccee mmaayy oorr mmaayy nnoott bbee ssuussttaaiinneedd iinn tthhee ffuuttuurreePerformance of the Dividend Option for the investor would be net of Distribution Tax as applicable* Absolute Returns ** Compounded Annualised Returns # Crisil Short Term Bond Fund Index N.A. Not Available
DDaattee PPeerriioodd NNAAVV RReettuurrnnss BBeenncchhmmaarrkkppeerr UUnniitt ((RRss..)) ((%%))^̂ RReettuurrnnss ((%%))##
Apr 29, 09 Last Six Months (184 days) 17.1243 2.29* 1.79*Oct 29, 08 Last 1 Year (366 days) 15.3369 14.17** 10.12**Oct 30, 06 Last 3 Years (1096 days) 13.0770 10.22** 7.92**Oct 29, 04 Last 5 Years (1827 days) 11.7056 8.39** 6.80**Feb 28, 02 Since Inception (2801 days) 10.0000 7.58** N.A.
Relative Performance ^ (Growth Option)
HDFC High Interest Fund - Short Term Plan
An open-ended income scheme
^̂PPaasstt PPeerrffoorrmmaannccee mmaayy oorr mmaayy nnoott bbee ssuussttaaiinneedd iinn tthhee ffuuttuurreePerformance of the Dividend Option for the investor would be net of Distribution Tax as applicable* Absolute Returns ** Compounded Annualised Returns# Crisil Short Term Bond Fund Index N.A. Not Available
DDaattee PPeerriioodd NNAAVV RReettuurrnnss BBeenncchhmmaarrkkppeerr UUnniitt ((RRss..)) ((%%))^̂ RReettuurrnnss ((%%))##
Apr 29, 09 Last Six Months (184 days) 17.3528 2.96* 1.79*Oct 29, 08 Last 1 Year (366 days) 15.7737 13.23** 10.12**Oct 30, 06 Last 3 Years (1096 days) 13.2605 10.44** 7.92**Oct 29, 04 Last 5 Years (1827 days) 11.8874 8.48** 6.80**Feb 06, 02 Since Inception (2823 days) 10.0000 7.79** N.A.
Relative Performance ^ (Growth Option)
MMooddiiffiieedd DDuurraattiioonn 11..2222 yyeeaarrss
AAvveerraaggee PPoorrttffoolliioo MMaattuurriittyy 11..4411 yyeeaarrssMMooddiiffiieedd DDuurraattiioonn 11..4466 yyeeaarrss
AAvveerraaggee PPoorrttffoolliioo MMaattuurriittyy 11..8844 yyeeaarrss
Portfolio – Top 10 Holdings (as at October 31, 2009)
IIssssuueerr RRaattiinngg %% ttoo NNAAVV
MMOONNEEYY MMAARRKKEETT IINNSSTTRRUUMMEENNTTSS && OOTTHHEERR CCRREEDDIITT EEXXPPOOSSUURREESS
Power Finance Corporation Ltd. AAA 9.50
LIC Housing Finance Ltd. AAA/P1+ 8.42
Indian Railways Finance Corporation Ltd. AAA/AAA(Ind)(SO) 6.62
Kotak Mahindra Prime Ltd. LAA/P1+ 5.47
Tata Motors Ltd. (Guaranteed by SBI) AAA(SO) 5.31
Rural Electrification Corporation Ltd. AAA 4.66
Tata Sons Ltd AAA 4.17
Housing Development Finance Corporation Ltd. $ AAA 3.58
National Bank for Agriculture & Rural Development AAA 3.23
Carol Info Services Ltd. UNRATED 3.20
TToottaall ooff TToopp TTeenn MMoonneeyy MMaarrkkeett IInnssttrruummeennttss
&& OOtthheerr CCrreeddiitt EExxppoossuurreess ((aaggggrreeggaatteedd hhoollddiinnggss iinn aa ssiinnggllee iissssuueerr)) 5544..1166
TToottaall MMoonneeyy MMaarrkkeett IInnssttrruummeennttss && OOtthheerr CCrreeddiitt EExxppoossuurreess 9966..1188
Cash, Cash Equivalents and Net Current Assets 3.82
GGrraanndd TToottaall 110000..0000
NNeett AAsssseettss ((RRss.. IInn LLaakkhhss)) 116611,,779999..5511
Portfolio – Top 10 Holdings (as at October 31, 2009)IIssssuueerr RRaattiinngg %% ttoo NNAAVV
MMOONNEEYY MMAARRKKEETT IINNSSTTRRUUMMEENNTTSS && OOTTHHEERR CCRREEDDIITT EEXXPPOOSSUURREESS
LIC Housing Finance Ltd. AAA/P1+ 9.76
Indian Oil Corporation Ltd. AAA/LAA+ 8.60
Tata Motors Ltd. (Guaranteed by SBI) AAA(SO) 7.40
Housing Development Finance Corporation Ltd. $ AAA 6.94
ICICI Bank Ltd. P1+ 6.28
Indian Railways Finance Corporation Ltd. AAA/AAA(Ind)(SO) 5.75
Power Finance Corporation Ltd. AAA 5.45
Infrastructure Development Finance Co. Ltd. AAA/AA+ 5.00
Rural Electrification Corporation Ltd. AAA 4.81
National Bank for Agriculture & Rural Development AAA 4.74
TToottaall ooff TToopp TTeenn MMoonneeyy MMaarrkkeett IInnssttrruummeennttss &&
OOtthheerr CCrreeddiitt EExxppoossuurreess((aaggggrreeggaatteedd hhoollddiinnggss iinn aa ssiinnggllee iissssuueerr)) 6644..7733
TToottaall MMoonneeyy MMaarrkkeett IInnssttrruummeennttss && OOtthheerr CCrreeddiitt EExxppoossuurreess 9911..8866
Cash, Cash Equivalents and Net Current Assets 8.14
GGrraanndd TToottaall 110000..0000
NNeett AAsssseettss ((RRss.. IInn LLaakkhhss)) 225533,,002211..6666
$ Sponsor
In Debt - Short-term Category(19 schemes) for 18 months period
ending October 31, 2009
$ Sponsor✤ PPaasstt ppeerrffoorrmmaannccee iiss nnoo gguuaarraanntteeee ooff ffuuttuurree rreessuullttss..
� Please refer to page no 31 for details on the Rating Methodology
Intouchmutually October 2009 23
hdfc-dt.qxd 11/7/2009 5:13 PM Page 4

An open-ended income scheme
^̂PPaasstt PPeerrffoorrmmaannccee mmaayy oorr mmaayy nnoott bbee ssuussttaaiinneedd iinn tthhee ffuuttuurreePerformance of the Dividend Option for the investor would be net of Distribution Tax as applicable* Absolute Returns ** Compounded Annualised Returns#I-Sec Si-Bex N.A. Not Available
DDaattee PPeerriioodd NNAAVV RReettuurrnnss BBeenncchhmmaarrkkppeerr UUnniitt ((RRss..)) ((%%))^̂ RReettuurrnnss ((%%))##
Apr 29, 09 Last Six Months (184 days) 15.6178 -1.23* 0.45*Oct 29, 08 Last 1 Year (366 days) 15.0575 2.44** 9.04**Oct 30, 06 Last 3 Years (1096 days) 13.4220 4.74** 8.65**Oct 29, 04 Last 5 Years (1827 days) 12.3328 4.57** 7.44**Jul 25, 01 Since Inception (3019 days) 10.0000 5.38** N.A.
Relative Performance^(Growth Option)
HDFC Gilt Fund
Short Term Plan
^̂PPaasstt PPeerrffoorrmmaannccee mmaayy oorr mmaayy nnoott bbee ssuussttaaiinneedd iinn tthhee ffuuttuurreePerformance of the Dividend Option for the investor would be net of Distribution Tax as applicable* Absolute Returns ** Compounded Annualised Returns#I-Sec Li-Bex N.A. Not Available
DDaattee PPeerriioodd NNAAVV RReettuurrnnss BBeenncchhmmaarrkkppeerr UUnniitt ((RRss..)) ((%%))^̂ RReettuurrnnss ((%%))##
Apr 29, 09 Last Six Months (184 days) 18.8971 -3.20* -3.97*Oct 29, 08 Last 1 Year (366 days) 17.2916 5.77** 7.03**Oct 30, 06 Last 3 Years (1096 days) 15.5190 5.63** 8.49**Oct 29, 04 Last 5 Years (1827 days) 14.6016 4.60** 8.10**Jul 25, 01 Since Inception (3019 days) 10.0000 7.57** N.A.
Relative Performance^(Growth Option)
Long Term Plan
MMooddiiffiieedd DDuurraattiioonn 22..6611 yyeeaarrss MMooddiiffiieedd DDuurraattiioonn 44..5511 yyeeaarrss
AAvveerraaggee PPoorrttffoolliioo MMaattuurriittyy 33..1199 yyeeaarrss AAvveerraaggee PPoorrttffoolliioo MMaattuurriittyy 77..6699 yyeeaarrss
IIssssuueerr RRaattiinngg %% ttoo NNAAVV
GGOOVVEERRNNMMEENNTT SSEECCUURRIITTIIEESS
6.07% GOI 2014 Sovereign 39.27
9.39% GOI 2011 Sovereign 19.83
7.27% GOI 2013 Sovereign 19.00
6.49% GOI 2015 Sovereign 5.40
TToottaall GGoovveerrnnmmeenntt SSeeccuurriittiieess 8833..5500
Cash, Cash Equivalents and Net Current Assets 16.50
GGrraanndd TToottaall 110000..0000
NNeett AAsssseettss ((RRss.. IInn LLaakkhhss)) 11,,332299..1177
Portfolio – Holdings (as at October 31, 2009)IIssssuueerr RRaattiinngg %% ttoo NNAAVV
GGOOVVEERRNNMMEENNTT SSEECCUURRIITTIIEESS
6.07% GOI 2014 Sovereign 16.76
6.49% GOI 2015 Sovereign 14.67
7.02% GOI 2016 Sovereign 13.69
8.24% GOI 2027 Sovereign 9.30
6.90% GOI 2019 Sovereign 9.04
6.83% GOI 2039 Sovereign 7.77
9.39% GOI 2011 Sovereign 4.90
7.32% GOI 2014 Sovereign 4.69
TToottaall GGoovveerrnnmmeenntt SSeeccuurriittiieess 8800..8822
Cash, Cash Equivalents and Net Current Assets 19.18
GGrraanndd TToottaall 110000..0000
NNeett AAsssseettss ((RRss.. IInn LLaakkhhss)) 55,,338800..7711
Portfolio – Holdings (as at October 31, 2009)
NNAAVV (as at October 30, 2009) NAV per Unit (Rs.)
Growth Option 15.4261
Dividend Option 10.5031
NNAAVV (as at October 30, 2009) NAV per Unit (Rs.)
Growth Option 18.2918
Dividend Option 10.3276
Intouchmutually24 October 2009
hdfc-dt.qxd 11/7/2009 5:13 PM Page 5

^̂PPaasstt ppeerrffoorrmmaannccee mmaayy oorr mmaayy nnoott bbee ssuussttaaiinneedd iinn tthhee ffuuttuurreePerformance of the Dividend Option for the investor would be net of Distribution Tax as applicable* Absolute Returns ** Compounded Annualised Returns #Crisil Liquid Fund Index
DDaattee PPeerriioodd NNAAVV RReettuurrnnss BBeenncchhmmaarrkkppeerr UUnniitt ((RRss..)) ((%%))^̂ RReettuurrnnss ((%%))##
Apr 29, 09 Last Six Months (184 days) 14.9307 2.45* 1.48*Oct 29, 08 Last 1 Year (366 days) 14.3693 6.43** 6.27**Oct 30, 06 Last 3 Years (1096 days) 12.2125 7.79** 7.12**Oct 29, 04 Last 5 Years (1827 days) 10.8938 7.02** 6.35**Jan 16, 03 Since Inception (2479 days) 10.0101 6.44** 5.78**
Relative Performance^- Retail Option (Growth Option)
MMooddiiffiieedd DDuurraattiioonn 112233 ddaayyss $ Sponsor
Short Term Plan
GGOOVVEERRNNMMEENNTT SSEECCUURRIITTIIEESS,, MMOONNEEYY MMAARRKKEETT IINNSSTTRRUUMMEENNTTSS && OOTTHHEERR CCRREEDDIITT EEXXPPOOSSUURREESS
Treasury Bills Sovereign 21.37 Indian Oil Corporation Ltd P1+ 4.22 Government Securities Sovereign 3.95 Punjab National Bank F1+(IND) 3.58 Andhra Bank F1+(IND) 2.57 Hindustan Petroleum Corporation Ltd. P1+ 2.28 State Bank Of Hyderabad P1+ 2.25 State Bank of Travancore P1+ 2.24 Canara Bank P1+ 2.04 Kotak Mahindra Bank Ltd. P1+ 1.89 TToottaall ooff TToopp TTeenn GGoovveerrnnmmeenntt SSeeccuurriittiieess,, MMoonneeyy MMaarrkkeett IInnssttrruummeennttss && OOtthheerr CCrreeddiitt EExxppoossuurreess ((aaggggrreeggaatteedd hhoollddiinnggss iinn aa ssiinnggllee iissssuueerr)) 4466..3399 TToottaall GGoovveerrnnmmeenntt SSeeccuurriittiieess,, MMoonneeyy MMaarrkkeett IInnssttrruummeennttss && OOtthheerr CCrreeddiitt EExxppoossuurreess 7700..1199
Cash, Cash Equivalents and Net Current Assets 29.81GGrraanndd TToottaall 110000..0000NNeett AAsssseettss ((RRss.. IInn LLaakkhhss)) 11,,001177,,337777..8822
Portfolio – Top 10 Holdings (as at October 31, 2009)
IIssssuueerr RRaattiinngg %% ttoo NNAAVV
MMOONNEEYY MMAARRKKEETT IINNSSTTRRUUMMEENNTT && OOTTHHEERR CCRREEDDIITT EEXXPPOOSSUURREESS
IDBI Bank Ltd. A1+ 12.83
Indian Railways Finance Corporation Ltd. AAA(Ind)(SO)/AAA 10.59
Housing Development Finance Corporation Ltd. $ AAA 10.35
Power Finance Corporation Ltd. AAA 10.13
Indian Oil Corporation Ltd. P1+ 9.15
Rural Electrification Corporation Ltd. AAA 8.78
Punjab National Bank F1+(IND) 8.36
National Bank for Agriculture & Rural Development AAA 7.38
Infrastructure Development Finance Co. Ltd. AA+ 7.36
LIC Housing Finance Ltd. AAA 4.63
TToottaall ooff TToopp TTeenn MMoonneeyy MMaarrkkeett IInnssttrruummeennttss &&
OOtthheerr CCrreeddiitt EExxppoossuurreess
((aaggggrreeggaatteedd hhoollddiinnggss iinn aa ssiinnggllee iissssuueerr)) 8899..5566
TToottaall MMoonneeyy MMaarrkkeett IInnssttrruummeennttss && OOtthheerr CCrreeddiitt EExxppoossuurreess 9977..2288
Cash, Cash Equivalents and Net Current Assets 2.72
GGrraanndd TToottaall 110000..0000
NNeett AAsssseettss ((RRss.. IInn LLaakkhhss)) 7755,,994499..6644
Portfolio – Top 10 Holdings (as at October 31, 2009)
IIssssuueerr RRaattiinngg %% ttoo NNAAVV
HDFC Floating Rate Income Fund
An open-ended income scheme
HDFC Floating Rate Income Fund
An open-ended income scheme
^̂PPaasstt ppeerrffoorrmmaannccee mmaayy oorr mmaayy nnoott bbee ssuussttaaiinneedd iinn tthhee ffuuttuurreePerformance of the Dividend Option for the investor would be net of Distribution Tax as applicable* Absolute Returns ** Compounded Annualised Returns #Crisil Liquid Fund Index
DDaattee PPeerriioodd NNAAVV RReettuurrnnss BBeenncchhmmaarrkkppeerr UUnniitt ((RRss..)) ((%%))^̂ RReettuurrnnss ((%%))##
Apr 29, 09 Last Six Months (184 days) 14.8711 4.10* 1.48*Oct 29, 08 Last 1 Year (366 days) 14.2052 8.95** 6.27**Oct 30, 06 Last 3 Years (1096 days) 12.0670 8.65** 7.12**Oct 29, 04 Last 5 Years (1827 days) 10.8160 7.43** 6.35**Jan 16, 03 Since Inception (2479 days) 10.0104 6.63** 5.78**
Relative Performance^(Growth Option)
Long Term Plan
MMooddiiffiieedd DDuurraattiioonn 221177 ddaayyssAAvveerraaggee PPoorrttffoolliioo MMaattuurriittyy 115566 ddaayyss
AAvveerraaggee PPoorrttffoolliioo MMaattuurriittyy 224488 ddaayyss
NNAAVV (as at October 30, 2009) NAV per Unit (Rs.)
RReettaaiill OOppttiioonnGrowth Option 15.2958Daily Dividend Reinvestment Option 10.0809Weekly Dividend Option 10.1402Monthly Dividend Option 10.1489WWhhoolleessaallee OOppttiioonnGrowth Option 15.3854Daily Dividend Reinvestment Option 10.0809Weekly Dividend Option 10.1407Monthly Dividend Option 10.1493
NNAAVV (as at October 30, 2009) NAV per Unit (Rs.)
Growth Option 15.4806Dividend Reinvestment Option 10.1860
WHOLESALE OPTION IN DEBT: LIQUID PLUS INSTITUTIONAL
(24 schemes) for 18 month period ending October 31, 2009
✤ PPaasstt ppeerrffoorrmmaannccee iiss nnoo gguuaarraanntteeee ooff ffuuttuurree rreessuullttss.. � Please refer to page no 31 for details on the Rating Methodology
Intouchmutually October 2009 25
hdfc-dt1.qxd 11/7/2009 5:14 PM Page 1

DDaattee PPeerriioodd NNAAVV RReettuurrnnss BBeenncchhmmaarrkkppeerr UUnniitt ((RRss..)) ((%%))^̂ RReettuurrnnss ((%%))##
LLiiqquuiidd FFuunnddOct 23, 09 Last 7 days 17.9348 0.08* 0.05*Oct 15, 09 Last 15 days 17.9183 0.17* 0.12*Sep 30, 09 Last 1 Month (30 days) 17.8859 0.35* 0.22*Jul 30, 09 Last 3 Months (92 days) 17.7579 1.08* 0.67*Apr 29, 09 Last 6 Months (184 days) 17.5419 2.32* 1.48*Oct 29, 08 Last 1 Year (366 days) 16.9220 6.05** 6.27**Oct 30, 06 Last 3 Years (1096 days) 14.4102 7.59** 7.12**Oct 29, 04 Last 5 Years (1827 days) 12.8926 6.83** 6.35**Oct 17, 00 Since Inception (3300 days) 10.0000 6.68** N.A.
Relative Performance^(Growth Option)
^̂PPaasstt ppeerrffoorrmmaannccee mmaayy oorr mmaayy nnoott bbee ssuussttaaiinneedd iinn tthhee ffuuttuurree N.A. Not AvailablePerformance of the Dividend Option for the investor would be net of Distribution Tax as applicable* Absolute Returns ** Compounded Annualised Returns # Crisil Liquid Fund Index
Portfolio – Top 10 Holdings (as at October 31, 2009)IIssssuueerr RRaattiinngg %% ttoo NNAAVV
HDFC
Liquid Fund
An open-ended liquid income scheme
HDFCCashManagement Fund
An open-ended high liquidity income scheme
PREMIUM PLAN - IN DEBT: ULTRA SHORT-
TERM INSTITUTIONAL
(45 schemes) for 18 month period ending October 31, 2009
HDFC LIQUID FUND
IN DEBT: ULTRA SHORT-TERM CATEGORY(40 schemes) for 18 month period
ending October 31, 2009
✤ PPaasstt ppeerrffoorrmmaannccee iiss nnoo gguuaarraanntteeee ooff ffuuttuurree rreessuullttss.. � Please refer to page no 31 for details on the Rating Methodology
AAvveerraaggee PPoorrttffoolliioo MMaattuurriittyy 4466 ddaayyss
AAvveerraaggee PPoorrttffoolliioo MMaattuurriittyy 5533 ddaayyss
MMooddiiffiieedd DDuurraattiioonn 3366 ddaayyss
MMooddiiffiieedd DDuurraattiioonn 3399 ddaayyss
IN DEBT: ULTRA SHORT-TERM CATEGORY(40 schemes) for 18 month period
ending October 31, 2009
Portfolio – Top 10 Holdings (as at October 31, 2009)
IIssssuueerr RRaattiinngg %% ttoo NNAAVV
Savings Plan
DDaattee PPeerriioodd NNAAVV RReettuurrnnss BBeenncchhmmaarrkkppeerr UUnniitt ((RRss..)) ((%%))^̂$$$$ RReettuurrnnss ((%%))##
Relative Performance^(Growth Option)
Oct 23, 09 Last 7 days 18.9003 0.08* 0.05*Oct 15, 09 Last 15 days 18.8819 0.18* 0.12*Sep 30, 09 Last 1 Month (30 days) 18.8462 0.37* 0.22*Jul 30, 09 Last 3 Months (92 days) 18.7032 1.14* 0.67*Apr 29, 09 Last 6 Months (184 days) 18.4699 2.42* 1.48*Oct 29, 08 Last 1 Year (366 days) 17.7985 6.26** 6.27**Oct 30, 06 Last 3 Years (1096 days) 15.1345 7.71** 7.12**Oct 29, 04 Last 5 Years (1827 days) 13.5001 6.97** 6.35**Nov 18, 99 Since Inception (3634 days) 10.0000 6.65** N.A.
^̂PPaasstt ppeerrffoorrmmaannccee mmaayy oorr mmaayy nnoott bbee ssuussttaaiinneedd iinn tthhee ffuuttuurreePerformance of the Dividend Option for the investor would be net of Distribution Tax as applicable* Absolute Returns ** Compounded Annualised Returns #Crisil Liquid Fund Index$$ Adjusted for the dividends declared under the scheme prior to its splitting into the Dividendand Growth Options N.A. Not Available
NNAAVV (as at October 30, 2009) NAV per Unit (Rs.)
Growth Option 18.9160
Daily Dividend Reinvestment Option 10.6364
Weekly Dividend Option 10.6336
NNAAVV (as at October 30, 2009) NAV per Unit (Rs.)
HHDDFFCC LLiiqquuiidd FFuunnddGrowth Option 17.9490Daily Dividend Reinvestment Option 10.1982Weekly Dividend Option 10.3149Monthly Dividend Option 10.2676HHDDFFCC LLiiqquuiidd FFuunndd -- PPrreemmiiuumm PPllaannGrowth Option 18.1426Daily Dividend Reinvestment Option 12.2598HHDDFFCC LLiiqquuiidd FFuunndd -- PPrreemmiiuumm PPlluuss PPllaannGrowth Option 18.1804Weekly Dividend Option 12.4341
GGOOVVEERRNNMMEENNTT SSEECCUURRIITTIIEESS,, MMOONNEEYY MMAARRKKEETT IINNSSTTRRUUMMEENNTTSS && OOTTHHEERR CCRREEDDIITT EEXXPPOOSSUURREESS
Treasury Bills Sovereign 14.40
Reliance Petroleum Ltd. P1+ 4.04
Global Trade Finance Ltd. P1+ 3.86
United Bank Of India A1+ 3.85
National Bank for Agriculture & Rural Development P1+ 3.84
Andhra Bank F1+(IND) 3.83
State Bank of Mysore A1+ 3.81
Union Bank of India A1+ 3.81
Canara Bank P1+ 3.17
Punjab National Bank F1+(IND) 2.98
TToottaall ooff TToopp TTeenn GGoovveerrnnmmeenntt SSeeccuurriittiieess,,
MMoonneeyy MMaarrkkeett IInnssttrruummeennttss && OOtthheerr CCrreeddiitt EExxppoossuurreess((aaggggrreeggaatteedd hhoollddiinnggss iinn aa ssiinnggllee iissssuueerr)) 4477..5599
TToottaall GGoovveerrnnmmeenntt SSeeccuurriittiieess,, MMoonneeyy MMaarrkkeett IInnssttrruummeennttss
&& OOtthheerr CCrreeddiitt EExxppoossuurreess 7700..0000
Cash, Cash Equivalents and Net Current Assets 30.00
GGrraanndd TToottaall 110000..0000
NNeett AAsssseettss ((RRss.. IInn LLaakkhhss)) 551188,,770066..3311
$ Sponsor✤ PPaasstt ppeerrffoorrmmaannccee iiss nnoo gguuaarraanntteeee ooff ffuuttuurree rreessuullttss..
� Please refer to page no 31 for details on the Rating Methodology
GGOOVVEERRNNMMEENNTT SSEECCUURRIITTIIEESS,, MMOONNEEYY MMAARRKKEETT IINNSSTTRRUUMMEENNTTSS && OOTTHHEERR CCRREEDDIITT EEXXPPOOSSUURREESS Treasury Bills Sovereign 14.63 ICICI Bank Ltd. P1+ 4.24 Reliance Petroleum Ltd. P1+ 3.61 The Federal Bank Ltd. P1+ 3.52 United Bank Of India A1+ 3.28 ONGC Videsh Ltd. P1+(SO) 3.25 Housing Development Finance Corporation Ltd. $ AAA 2.48 Global Trade Finance Ltd. P1+ 2.47 ICICI Securities Primary Dealership Ltd. P1+ 2.46 Union Bank of India A1+ 2.28 TToottaall ooff TToopp TTeenn GGoovveerrnnmmeenntt SSeeccuurriittiieess,, MMoonneeyy MMaarrkkeett IInnssttrruummeennttss && OOtthheerr CCrreeddiitt EExxppoossuurreess ((aaggggrreeggaatteedd hhoollddiinnggss iinn aa ssiinnggllee iissssuueerr)) 4422..2222 TToottaall GGoovveerrnnmmeenntt SSeeccuurriittiieess,, MMoonneeyy MMaarrkkeett IInnssttrruummeennttss && OOtthheerr CCrreeddiitt EExxppoossuurreess 6600..9933 Cash, Cash Equivalents and Net Current Assets 39.07 GGrraanndd TToottaall 110000..0000NNeett AAsssseettss ((RRss.. IInn LLaakkhhss)) 991111,,448888..3366
Intouchmutually26 October 2009
hdfc-dt1.qxd 11/7/2009 5:14 PM Page 2

Portfolio – Top 10 Holdings (as at October 31, 2009)
AAvveerraaggee PPoorrttffoolliioo MMaattuurriittyy 6655 ddaayyss
MMooddiiffiieedd DDuurraattiioonn 4455 ddaayyss
HDFC Cash Management Fund HDFC Cash Management Fund
DDaattee PPeerriioodd NNAAVV RReettuurrnnss BBeenncchhmmaarrkkppeerr UUnniitt ((RRss..)) ((%%))^̂ RReettuurrnnss ((%%))##
Relative Performance^(Growth Option)
Call Plan
NNoottee ffoorr AAllll OOppeenn--EEnnddeedd SScchheemmeess ((aass aatt OOccttoobbeerr 3311,, 22000099))i) Total NPAs provided for and its percentage to NAV : Nil
ii) Investment in ADR/GDR/Foreign Securities : Nil
iii) Total outstanding exposure in derivative instruments (Gross Notional) :
a) Equity :
HDFC Growth Fund (Suzlon NSE November 2009 Futures) Rs. 753.19 lakhs
HDFC Top 200 Fund (UBI NSE November 2009 Futures) Rs. 724.48 lakhs
HDFC Top 200 Fund (Bank of Baroda
NSE November 2009 Futures) Rs. 3,149.36 lakhs
HDFC Top 200 Fund (M&M Ltd.
NSE November 2009 Futures) Rs. 2,402.22 lakhs
TToottaall RRss.. 77,,002299..2255 llaakkhhss
b) Debt : Interest Rates Swaps / Forward Rate Agreement
HDFC Cash Management Fund (Treasury Advantage Plan) Rs. 40,000.00 lakhs
TToottaall RRss.. 4400,,000000..0000 llaakkhhss
DDaattee PPeerriioodd NNAAVV RReettuurrnnss BBeenncchhmmaarrkkppeerr UUnniitt ((RRss..)) ((%%))^̂ RReettuurrnnss ((%%))##
Relative Performance^- Retail Plan (Growth Option)
Treasury Advantage Plan*
Oct 23, 09 Last 7 days 15.0493 0.06* 0.05*Oct 15, 09 Last 15 days 15.0391 0.13* 0.12*Sep 30, 09 Last 1 Month (30 days) 15.0228 0.23* 0.22*Jul 30, 09 Last 3 Months (92 days) 14.9550 0.69* 0.67*Apr 29, 09 Last 6 Months (184 days) 14.8533 1.38* 1.48*Oct 29, 08 Last 1 Year (366 days) 14.4944 3.88** 6.27**Oct 30, 06 Last 3 Years (1096 days) 12.5185 6.34** 7.12**Oct 29, 04 Last 5 Years (1827 days) 11.2841 5.93** 6.35**Feb 06, 02 Since Inception (2823 days) 10.0000 5.44** N.A.
An open-ended income scheme An open-ended high liquidity income scheme
^̂PPaasstt ppeerrffoorrmmaannccee mmaayy oorr mmaayy nnoott bbee ssuussttaaiinneedd iinn tthhee ffuuttuurree N.A. Not AvailablePerformance of the Dividend Option for the investor would be net of Distribution Tax as applicable* Absolute Returns ** Compounded Annualised Returns #Crisil Liquid Fund Index
Oct 23, 09 Last 7 days 19.6116 0.08* 0.05*Oct 15, 09 Last 15 days 19.5929 0.18* 0.12*Sep 30, 09 Last 1 Month (30 days) 19.5519 0.39 0.22*Jul 30, 09 Last 3 Months (92 days) 19.4073 1.14* 0.67*Apr 29, 09 Last 6 Months (184 days) 19.1696 2.39* 1.48*Oct 29, 08 Last 1 Year (366 days) 18.4804 6.19** 6.27**Oct 30, 06 Last 3 Years (1096 days) 15.7371 7.63** 7.12**Oct 29, 04 Last 5 Years (1827 days) 14.0454 6.91** 6.35**Nov 18, 99 Since Inception (3634 days) 10.0000 7.01** N.A.
^̂PPaasstt ppeerrffoorrmmaannccee mmaayy oorr mmaayy nnoott bbee ssuussttaaiinneedd iinn tthhee ffuuttuurree N.A. Not AvailablePerformance of the Dividend Option for the investor would be net of Distribution Tax as applicable* Absolute Returns ** Compounded Annualised Returns #Crisil Liquid Fund Index
AAvveerraaggee PPoorrttffoolliioo MMaattuurriittyy 111188 ddaayyss
MMooddiiffiieedd DDuurraattiioonn 9955 ddaayyss
IIssssuueerr RRaattiinngg %% ttoo NNAAVV
NNAAVV (as at October 30, 2009) NAV per Unit (Rs.)
RReettaaiill OOppttiioonnGrowth Option 19.6277Daily Dividend Reinvestment Option 10.0315Weekly Dividend Option 10.0257Monthly Dividend Option 10.0548WWhhoolleessaallee OOppttiioonnGrowth Option 19.8030Daily Dividend Reinvestment Option 10.0315Weekly Dividend Option 10.0210Monthly Dividend Option 10.0550
NNAAVV (as at October 30, 2009) NAV per Unit (Rs.)
Growth Option 15.0581Daily Dividend Reinvestment Option 10.4266
$ SponsorTotal outstanding position (as at October 31, 2009) in Derivative Instruments
(Interest Rate Swaps) (Notional) Rs. 40,000 lakhs.
GGOOVVEERRNNMMEENNTT SSEECCUURRIITTIIEESS,, TTRREEAASSUURRYY BBIILLLLSS,, MMOONNEEYY MMAARRKKEETT IINNSSTTRRUUMMEENNTTSS && OOTTHHEERR CCRREEDDIITT EEXXPPOOSSUURREESS
Treasury Bills Sovereign 12.89Government Securities Sovereign 5.08Canara Bank P1+ 4.83ICICI Bank Ltd. P1+ 4.19Punjab National Bank F1+ (ind) 3.18Housing Development Finance Corporation Ltd. $ AAA 2.35Andhra Bank F1+ (ind)/PR1+ 1.97Corporation Bank P1+ 1.36Reliance Industries Ltd. P1+ 1.27Power Finance Corporation Ltd. AAA/AAA (SO) 1.17 TToottaall ooff TToopp TTeenn GGoovveerrnnmmeenntt SSeeccuurriittiieess,, TTrreeaassuurryy BBiillllssMMoonneeyy MMaarrkkeett IInnssttrruummeennttss && OOtthheerr CCrreeddiitt EExxppoossuurreess ((aaggggrreeggaatteedd hhoollddiinnggss iinn aa ssiinnggllee iissssuueerr)) 3388..2299 TToottaall GGoovveerrnnmmeenntt SSeeccuurriittiieess,, TTrreeaassuurryy BBiillllss MMoonneeyy MMaarrkkeett IInnssttrruummeennttss && OOtthheerr CCrreeddiitt EExxppoossuurreess 6666..7799
Cash, Cash Equivalents and Net Current Assets 33.21GGrraanndd TToottaall 110000..0000NNeett AAsssseettss ((RRss.. IInn LLaakkhhss)) 33,,887711,,443344..4400
* erstwhile HDFC Cash Management Fund - Savings Plus Plan
Portfolio – Holdings (as at October 31, 2009)IIssssuueerr RRaattiinngg %% ttoo NNAAVV
CCRREEDDIITT EEXXPPOOSSUURREESS
Tata Sons Ltd. AAA 7.35
TToottaall CCrreeddiitt EExxppoossuurreess 77..3355
Cash, Cash Equivalents and Net Current Assets 92.65
GGrraanndd TToottaall 110000..0000NNeett AAsssseettss ((RRss.. IInn LLaakkhhss)) 22,,771188..6655
Intouchmutually October 2009 27
hdfc-dt1.qxd 11/7/2009 5:14 PM Page 3

Monthly (Dividend Option)(Past 3 months)
RReeccoorrdd CCuumm DDiivv DDiivviiddeenndd PPeerr uunniitt ((RRee..)) FFoorr
DDaattee NNAAVV ((RRss..)) IInnddiivviidduuaallss && HHUUFF OOtthheerrssAug 25, 09 10.9954 0.0500 0.0465Sep 25, 09 11.1501 0.0500 0.0465Oct 26, 09 11.1723 0.0500 0.0465
Quarterly (Dividend Option)(Past 3 quarters)
RReeccoorrdd CCuumm DDiivv DDiivviiddeenndd PPeerr uunniitt ((RRee..)) FFoorr
DDaattee NNAAVV ((RRss..)) IInnddiivviidduuaallss && HHUUFF OOtthheerrssSep 25, 09 11.4908 0.1500 0.1396
Jun 25, 09 10.6225 0.0392 0.0364
Jul 10, 09 10.6466 0.0603 0.0561
Jul 27, 09 10.6183 0.0355 0.0330
Sep 25, 09 10.6368 0.0517 0.0481
Oct 26, 09 10.6461 0.0598 0.0557
RReeccoorrdd CCuumm DDiivv DDiivviiddeenndd PPeerr uunniitt ((RRee..)) FFoorr DDaattee NNAAVV ((RRss..)) IInnddiivviidduuaallss && HHUUFF OOtthheerrss
RReeccoorrdd CCuumm DDiivv DDiivviiddeenndd PPeerr uunniitt ((RRee..)) FFoorr DDaattee NNAAVV ((RRss..)) IInnddiivviidduuaallss && HHUUFF OOtthheerrss
Dividend Option (Past 6 months)
HDFC High Interest Fund - Short Term Plan
HDFC High Interest Fund
Mar 25, 09 11.0349 0.1500 0.1396
Jun 25, 09 11.2902 0.1500 0.1396
Sep 25, 09 11.1258 0.0500 0.0465
Mar 25, 08 10.7407 0.3500 0.3258
Sep 25, 08 10.3777 0.1000 0.0931
Mar 25, 09 11.2151 0.5500 0.5119
Sep 25, 09 11.0080 0.2000 0.1861
RReeccoorrdd CCuumm DDiivv DDiivviiddeenndd PPeerr uunniitt ((RRee..)) FFoorr DDaattee NNAAVV ((RRss..)) IInnddiivviidduuaallss && HHUUFF OOtthheerrss
RReeccoorrdd CCuumm DDiivv DDiivviiddeenndd PPeerr uunniitt ((RRee..)) FFoorr DDaattee NNAAVV ((RRss..)) IInnddiivviidduuaallss && HHUUFF OOtthheerrss
Quarterly (Dividend Option)(Past 3 quarters)
Half-yearly (Dividend Option)(Past 2 years)
Yearly (Dividend Option) (Past 3 years)
Sep 25, 08 10.2658 0.1000 0.0931
Dec 26, 08 11.5435 0.4000 0.3723
Mar 25, 09 10.8160 0.1500 0.1396
Jun 25, 09 11.0688 0.1500 0.1396
Sep 25, 09 10.9548 0.1000 0.0931
RReeccoorrdd DDaattee CCuumm DDiivviiddeenndd NNAAVV ((RRss..)) DDiivviiddeenndd PPeerr uunniitt ((RRee..)) FFoorr IInnddiivviidduuaallss && HHUUFF OOtthheerrss
Dividend Option (Since September 2008)
Mar 26, 07 10.8913 0.2500 0.2328Mar 25, 08 11.5996 0.7000 0.6515Mar 25, 09 11.8425 0.6500 0.6050
RReeccoorrdd DDaattee CCuumm DDiivviiddeenndd NNAAVV ((RRss..)) DDiivviiddeenndd PPeerr uunniitt ((RRee..)) FFoorr IInnddiivviidduuaallss && HHUUFF OOtthheerrss
HDFC Income Fund
Short Term Plan (Dividend Option)
HDFC MF Monthly Income Plan (MIP)(An open-ended income scheme. Monthly income is not assured and is subject to availability of distributable surplus)
Long Term Plan (Dividend Option)
Monthly (Dividend Option) (Past 3 months)
RReeccoorrdd CCuumm DDiivv DDiivviiddeenndd PPeerr uunniitt ((RRee..)) FFoorr
DDaattee NNAAVV ((RRss..)) IInnddiivviidduuaallss && HHUUFF OOtthheerrss
Aug 25, 09 12.1918 0.0600 0.0558Sep 25, 09 12.4312 0.0600 0.0558Oct 26, 09 12.5196 0.0600 0.0558
Quarterly (Dividend Option)(Past 3 quarters)
RReeccoorrdd CCuumm DDiivv DDiivviiddeenndd PPeerr uunniitt ((RRee..)) FFoorr
DDaattee NNAAVV ((RRss..)) IInnddiivviidduuaallss && HHUUFF OOtthheerrss
Mar 25, 09 10.4822 0.1800 0.1675Jun 25, 09 12.2318 0.1800 0.1675Sep 25, 09 12.8357 0.1800 0.1675
HDFC Multiple Yield Fund (Past 3 years)
Oct 12, 06 10.7938 0.6700 0.6240 Dec 12, 07 11.2528 1.0000 0.9307
RReeccoorrdd CCuumm DDiivv DDiivviiddeenndd PPeerr uunniitt ((RRee..)) FFoorr DDaattee NNAAVV ((RRss..)) IInnddiivviidduuaallss && HHUUFF OOtthheerrss
RReeccoorrdd CCuumm DDiivv DDiivviiddeenndd PPeerr uunniitt ((RRee..)) FFoorr DDaattee NNAAVV ((RRss..)) IInnddiivviidduuaallss && HHUUFF OOtthheerrss
(Dividend Option)
HDFC Multiple Yield Fund - Plan 2005
Nov 16, 06 10.9001 0.7500 0.6985 Dec 12, 07 11.2388 1.0000 0.9307
RReeccoorrdd CCuumm DDiivv DDiivviiddeenndd PPeerr uunniitt ((RRee..)) FFoorr DDaattee NNAAVV ((RRss..)) IInnddiivviidduuaallss && HHUUFF OOtthheerrss
RReeccoorrdd CCuumm DDiivv DDiivviiddeenndd PPeerr uunniitt ((RRee..)) FFoorr DDaattee NNAAVV ((RRss..)) IInnddiivviidduuaallss && HHUUFF OOtthheerrss
(Dividend Option)
^̂ PPaasstt ppeerrffoorrmmaannccee mmaayy oorr mmaayy nnoott bbee ssuussttaaiinneedd iinn tthhee ffuuttuurree.. All dividends are on face value of Rs.10 per Unit. After payment of the dividend, the per Unit NAV will fall tothe extent of the payout and statutory levy, if any.
Dividend History ^
^̂ PPaasstt ppeerrffoorrmmaannccee mmaayy oorr mmaayy nnoott bbee ssuussttaaiinneedd iinn tthhee ffuuttuurree.. All dividends are on face value of Rs.10 per Unit. After payment of the dividend, the per Unit NAV will fall tothe extent of the payout and statutory levy, if any.
Jan 11, 07 22.610 3.00 3.00
Jan 10, 08 28.229 3.00 3.00
RReeccoorrdd CCuumm DDiivv DDiivviiddeenndd PPeerr uunniitt ((RRss..)) FFoorr DDaattee NNAAVV ((RRss..)) IInnddiivviidduuaallss && HHUUFF OOtthheerrss
HDFC Core & Satellite Fund
Mar 07, 07 40.352 5.00 5.00
Mar 07, 08 45.4470 5.50 5.50
RReeccoorrdd CCuumm DDiivv DDiivviiddeenndd PPeerr uunniitt ((RRss..)) FFoorr DDaattee NNAAVV ((RRss..)) IInnddiivviidduuaallss && HHUUFF OOtthheerrss
RReeccoorrdd CCuumm DDiivv DDiivviiddeenndd PPeerr uunniitt ((RRss..)) FFoorr DDaattee NNAAVV ((RRss..)) IInnddiivviidduuaallss && HHUUFF OOtthheerrss
HDFC Equity Fund (Past 3 years)
Feb 07, 07 42.968 5.00 5.00
Feb 07, 08 48.129 5.00 5.00
Mar 05, 09 23.364 3.00 3.00
RReeccoorrdd CCuumm DDiivv DDiivviiddeenndd PPeerr uunniitt ((RRss..)) FFoorr DDaattee NNAAVV ((RRss..)) IInnddiivviidduuaallss && HHUUFF OOtthheerrss
RReeccoorrdd CCuumm DDiivv DDiivviiddeenndd PPeerr uunniitt ((RRss..)) FFoorr DDaattee NNAAVV ((RRss..)) IInnddiivviidduuaallss && HHUUFF OOtthheerrss
HDFC Top 200 Fund (Past 3 years)
Feb 07, 07 26.389 3.00 3.00
Feb 07, 08 30.891 3.50 3.50
RReeccoorrdd CCuumm DDiivv DDiivviiddeenndd PPeerr uunniitt ((RRss..)) FFoorr DDaattee NNAAVV ((RRss..)) IInnddiivviidduuaallss && HHUUFF OOtthheerrss
HDFC Capital Builder Fund (Past 3 years)
Dec 28, 06 29.681 3.50 3.50
Dec 27, 07 42.928 4.00 4.00
Feb 26, 09 17.9490 2.25 2.25
RReeccoorrdd CCuumm DDiivv DDiivviiddeenndd PPeerr uunniitt ((RRss..)) FFoorr DDaattee NNAAVV ((RRss..)) IInnddiivviidduuaallss && HHUUFF OOtthheerrss
HDFC Growth Fund
Mar 19, 09 23.2530 3.00 3.00
RReeccoorrdd CCuumm DDiivv DDiivviiddeenndd PPeerr uunniitt ((RRss..)) FFoorr DDaattee NNAAVV ((RRss..)) IInnddiivviidduuaallss && HHUUFF OOtthheerrss
Mar 05, 09 12.9360 2.00 2.00
HDFC Balanced Fund (Past 3 years)
RReeccoorrdd CCuumm DDiivv DDiivviiddeenndd PPeerr uunniitt ((RRss..)) FFoorr DDaattee NNAAVV ((RRss..)) IInnddiivviidduuaallss && HHUUFF OOtthheerrss
Dec 28, 06 20.588 2.50 2.50Dec 27, 07 22.7440 2.50 2.50
RReeccoorrdd CCuumm DDiivv DDiivviiddeenndd PPeerr uunniitt ((RRss..)) FFoorr DDaattee NNAAVV ((RRss..)) IInnddiivviidduuaallss && HHUUFF OOtthheerrss
Feb 26, 09 12.3260 1.50 1.50
Feb 21, 07 32.483 5.00 5.00Feb 21, 08 33.503 5.00 5.00
RReeccoorrdd DDaattee NNAAVV ppeerr UUnniitt ((RRss..)) DDiivviiddeennddCCuumm DDiivviiddeenndd PPeerr UUnniitt ((RRss..))
RReeccoorrdd CCuumm DDiivv DDiivviiddeenndd PPeerr uunniitt ((RRss..)) FFoorr DDaattee NNAAVV ((RRss..)) IInnddiivviidduuaallss && HHUUFF OOtthheerrss
HDFC Prudence Fund (Past 3 years)
Mar 19, 09 17.3930 2.50 2.50
RReeccoorrdd CCuumm DDiivv DDiivviiddeenndd PPeerr uunniitt ((RRss..)) FFoorr DDaattee NNAAVV ((RRss..)) IInnddiivviidduuaallss && HHUUFF OOtthheerrss
Dividend Option
Dividend Option
Dividend Option
Dividend Option
Dividend Option
Dividend Option
Dividend Option HDFC Premier Multi-Cap Fund
Dividend Option
Feb 21, 07 16.654 2.00 2.00
Feb 21, 08 17.516 2.00 2.00
RReeccoorrdd CCuumm DDiivv DDiivviiddeenndd PPeerr uunniitt ((RRss..)) FFoorr DDaattee NNAAVV ((RRss..)) IInnddiivviidduuaallss && HHUUFF OOtthheerrss
(Past 3 years)
Jan 11, 07 46.468 6.00 6.00Jan 10, 08 56.171 6.00 6.00
RReeccoorrdd CCuumm DDiivv DDiivviiddeenndd PPeerr uunniitt ((RRss..)) FFoorr DDaattee NNAAVV ((RRss..)) IInnddiivviidduuaallss && HHUUFF OOtthheerrss
HDFC Long Term Advantage Fund (Past 3 years)
(An open-ended equity linked savings scheme with a lock-in period of 3 years)
RReeccoorrdd CCuumm DDiivv DDiivviiddeenndd PPeerr uunniitt ((RRss..)) FFoorr DDaattee NNAAVV ((RRss..)) IInnddiivviidduuaallss && HHUUFF OOtthheerrss
Feb 26, 09 21.6980 3.50 3.50
Dividend Option
Mar 07, 07 60.360 7.50 7.50Mar 07, 08 66.092 8.00 8.00
RReeccoorrdd CCuumm DDiivv DDiivviiddeenndd PPeerr uunniitt ((RRss..)) FFoorr DDaattee NNAAVV ((RRss..)) IInnddiivviidduuaallss && HHUUFF OOtthheerrss
RReeccoorrdd CCuumm DDiivv DDiivviiddeenndd PPeerr uunniitt ((RRss..)) FFoorr DDaattee NNAAVV ((RRss..)) IInnddiivviidduuaallss && HHUUFF OOtthheerrss
HDFC TaxSaver (Past 3 years)
(An open-ended equity linked savings scheme with a lock-in period of 3 years)
Mar 05, 09 31.155 5.00 5.00
Dividend Option
RReettaaiill OOppttiioonn
Dec 26, 08 10.2890 0.2890 0.2890
Mar 25, 09 10.1120 0.1120 0.1120
WWhhoolleessaallee OOppttiioonn
Dec 26, 08 10.2950 0.2950 0.2950
Mar 25, 09 10.1190 0.1190 0.1190
RReeccoorrdd CCuumm DDiivv DDiivviiddeenndd PPeerr uunniitt ((RRee..)) FFoorr DDaattee NNAAVV ((RRss..)) IInnddiivviidduuaallss && HHUUFF OOtthheerrss
RReeccoorrdd CCuumm DDiivv DDiivviiddeenndd PPeerr uunniitt ((RRee..)) FFoorr DDaattee NNAAVV ((RRss..)) IInnddiivviidduuaallss && HHUUFF OOtthheerrss
Quarterly (Dividend Option) (Past 3 quarters)
HDFC Arbitrage Fund
WWhhoolleessaallee OOppttiioonn
Jun 25, 09 10.1320 0.1320 0.1320
Sep 25, 09 10.1240 0.1240 0.1240
RReeccoorrdd CCuumm DDiivv DDiivviiddeenndd PPeerr uunniitt ((RRee..)) FFoorr DDaattee NNAAVV ((RRss..)) IInnddiivviidduuaallss && HHUUFF OOtthheerrss
RReeccoorrdd CCuumm DDiivv DDiivviiddeenndd PPeerr uunniitt ((RRee..)) FFoorr DDaattee NNAAVV ((RRss..)) IInnddiivviidduuaallss && HHUUFF OOtthheerrss
Dividend Option (erstwhile monthly dividend option (Past 3 months)
Dividend History ^
28 October 2009 Intouchmutually
hdfc-div.qxd 11/7/2009 5:15 PM Page 1
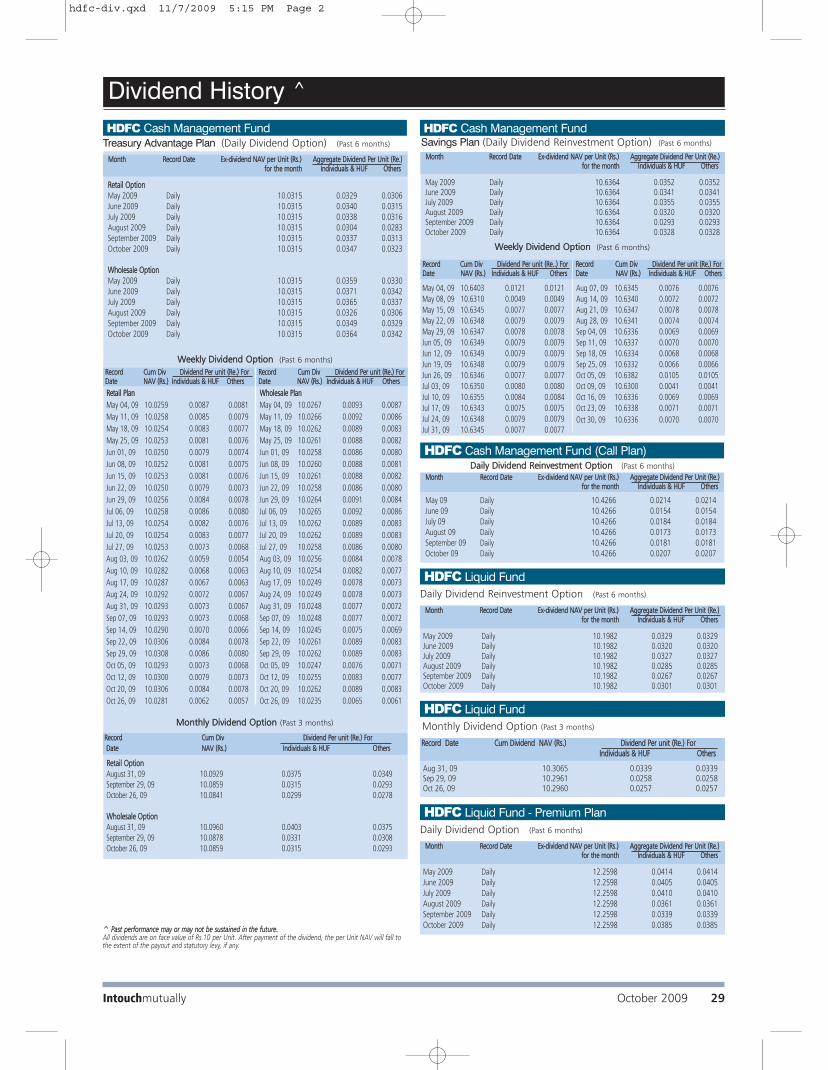
Dividend History ^
HDFC Cash Management Fund
RReettaaiill PPllaann
May 04, 09 10.0259 0.0087 0.0081
May 11, 09 10.0258 0.0085 0.0079
May 18, 09 10.0254 0.0083 0.0077
May 25, 09 10.0253 0.0081 0.0076
Jun 01, 09 10.0250 0.0079 0.0074
Jun 08, 09 10.0252 0.0081 0.0075
Jun 15, 09 10.0253 0.0081 0.0076
Jun 22, 09 10.0250 0.0079 0.0073
Jun 29, 09 10.0256 0.0084 0.0078
Jul 06, 09 10.0258 0.0086 0.0080
Jul 13, 09 10.0254 0.0082 0.0076
Jul 20, 09 10.0254 0.0083 0.0077
Jul 27, 09 10.0253 0.0073 0.0068
Aug 03, 09 10.0262 0.0059 0.0054
Aug 10, 09 10.0282 0.0068 0.0063
Aug 17, 09 10.0287 0.0067 0.0063
Aug 24, 09 10.0292 0.0072 0.0067
Aug 31, 09 10.0293 0.0073 0.0067
Sep 07, 09 10.0293 0.0073 0.0068
Sep 14, 09 10.0290 0.0070 0.0066
Sep 22, 09 10.0306 0.0084 0.0078
Sep 29, 09 10.0308 0.0086 0.0080
Oct 05, 09 10.0293 0.0073 0.0068
Oct 12, 09 10.0300 0.0079 0.0073
Oct 20, 09 10.0306 0.0084 0.0078
Oct 26, 09 10.0281 0.0062 0.0057
WWhhoolleessaallee PPllaann
May 04, 09 10.0267 0.0093 0.0087
May 11, 09 10.0266 0.0092 0.0086
May 18, 09 10.0262 0.0089 0.0083
May 25, 09 10.0261 0.0088 0.0082
Jun 01, 09 10.0258 0.0086 0.0080
Jun 08, 09 10.0260 0.0088 0.0081
Jun 15, 09 10.0261 0.0088 0.0082
Jun 22, 09 10.0258 0.0086 0.0080
Jun 29, 09 10.0264 0.0091 0.0084
Jul 06, 09 10.0265 0.0092 0.0086
Jul 13, 09 10.0262 0.0089 0.0083
Jul 20, 09 10.0262 0.0089 0.0083
Jul 27, 09 10.0258 0.0086 0.0080
Aug 03, 09 10.0256 0.0084 0.0078
Aug 10, 09 10.0254 0.0082 0.0077
Aug 17, 09 10.0249 0.0078 0.0073
Aug 24, 09 10.0249 0.0078 0.0073
Aug 31, 09 10.0248 0.0077 0.0072
Sep 07, 09 10.0248 0.0077 0.0072
Sep 14, 09 10.0245 0.0075 0.0069
Sep 22, 09 10.0261 0.0089 0.0083
Sep 29, 09 10.0262 0.0089 0.0083
Oct 05, 09 10.0247 0.0076 0.0071
Oct 12, 09 10.0255 0.0083 0.0077
Oct 20, 09 10.0262 0.0089 0.0083
Oct 26, 09 10.0235 0.0065 0.0061
RReeccoorrdd CCuumm DDiivv DDiivviiddeenndd PPeerr uunniitt ((RRee..)) FFoorr DDaattee NNAAVV ((RRss..)) IInnddiivviidduuaallss && HHUUFF OOtthheerrss
RReeccoorrdd CCuumm DDiivv DDiivviiddeenndd PPeerr uunniitt ((RRee..)) FFoorr DDaattee NNAAVV ((RRss..)) IInnddiivviidduuaallss && HHUUFF OOtthheerrss
WWeeeekkllyy DDiivviiddeenndd OOppttiioonn (Past 6 months)
MMoonntthhllyy DDiivviiddeenndd OOppttiioonn (Past 3 months)
^̂ PPaasstt ppeerrffoorrmmaannccee mmaayy oorr mmaayy nnoott bbee ssuussttaaiinneedd iinn tthhee ffuuttuurree.. All dividends are on face value of Rs.10 per Unit. After payment of the dividend, the per Unit NAV will fall tothe extent of the payout and statutory levy, if any.
Treasury Advantage Plan (Daily Dividend Option) (Past 6 months)
HDFC Cash Management FundSavings Plan (Daily Dividend Reinvestment Option) (Past 6 months)
HDFC Cash Management Fund (Call Plan)
MMoonntthh RReeccoorrdd DDaattee EExx--ddiivviiddeenndd NNAAVV ppeerr UUnniitt ((RRss..)) AAggggrreeggaattee DDiivviiddeenndd PPeerr UUnniitt ((RRee..)) ffoorr tthhee mmoonntthh IInnddiivviidduuaallss && HHUUFF OOtthheerrss
WWeeeekkllyy DDiivviiddeenndd OOppttiioonn (Past 6 months)
May 04, 09 10.6403 0.0121 0.0121
May 08, 09 10.6310 0.0049 0.0049
May 15, 09 10.6345 0.0077 0.0077
May 22, 09 10.6348 0.0079 0.0079
May 29, 09 10.6347 0.0078 0.0078
Jun 05, 09 10.6349 0.0079 0.0079
Jun 12, 09 10.6349 0.0079 0.0079
Jun 19, 09 10.6348 0.0079 0.0079
Jun 26, 09 10.6346 0.0077 0.0077
Jul 03, 09 10.6350 0.0080 0.0080
Jul 10, 09 10.6355 0.0084 0.0084
Jul 17, 09 10.6343 0.0075 0.0075
Jul 24, 09 10.6348 0.0079 0.0079
Jul 31, 09 10.6345 0.0077 0.0077
Aug 07, 09 10.6345 0.0076 0.0076
Aug 14, 09 10.6340 0.0072 0.0072
Aug 21, 09 10.6347 0.0078 0.0078
Aug 28, 09 10.6341 0.0074 0.0074
Sep 04, 09 10.6336 0.0069 0.0069
Sep 11, 09 10.6337 0.0070 0.0070
Sep 18, 09 10.6334 0.0068 0.0068
Sep 25, 09 10.6332 0.0066 0.0066
Oct 05, 09 10.6382 0.0105 0.0105
Oct 09, 09 10.6300 0.0041 0.0041
Oct 16, 09 10.6336 0.0069 0.0069
Oct 23, 09 10.6338 0.0071 0.0071
Oct 30, 09 10.6336 0.0070 0.0070
RReeccoorrdd CCuumm DDiivv DDiivviiddeenndd PPeerr uunniitt ((RRee....)) FFoorr DDaattee NNAAVV ((RRss..)) IInnddiivviidduuaallss && HHUUFF OOtthheerrss
RReeccoorrdd CCuumm DDiivv DDiivviiddeenndd PPeerr uunniitt ((RRee..)) FFoorr DDaattee NNAAVV ((RRss..)) IInnddiivviidduuaallss && HHUUFF OOtthheerrss
May 2009 Daily 10.6364 0.0352 0.0352June 2009 Daily 10.6364 0.0341 0.0341July 2009 Daily 10.6364 0.0355 0.0355August 2009 Daily 10.6364 0.0320 0.0320September 2009 Daily 10.6364 0.0293 0.0293October 2009 Daily 10.6364 0.0328 0.0328
MMoonntthh RReeccoorrdd DDaattee EExx--ddiivviiddeenndd NNAAVV ppeerr UUnniitt ((RRss..)) AAggggrreeggaattee DDiivviiddeenndd PPeerr UUnniitt ((RRee..)) ffoorr tthhee mmoonntthh IInnddiivviidduuaallss && HHUUFF OOtthheerrss
RReettaaiill OOppttiioonn
May 2009 Daily 10.0315 0.0329 0.0306June 2009 Daily 10.0315 0.0340 0.0315July 2009 Daily 10.0315 0.0338 0.0316August 2009 Daily 10.0315 0.0304 0.0283September 2009 Daily 10.0315 0.0337 0.0313October 2009 Daily 10.0315 0.0347 0.0323
WWhhoolleessaallee OOppttiioonn
May 2009 Daily 10.0315 0.0359 0.0330June 2009 Daily 10.0315 0.0371 0.0342July 2009 Daily 10.0315 0.0365 0.0337August 2009 Daily 10.0315 0.0326 0.0306September 2009 Daily 10.0315 0.0349 0.0329October 2009 Daily 10.0315 0.0364 0.0342
May 09 Daily 10.4266 0.0214 0.0214June 09 Daily 10.4266 0.0154 0.0154July 09 Daily 10.4266 0.0184 0.0184August 09 Daily 10.4266 0.0173 0.0173September 09 Daily 10.4266 0.0181 0.0181October 09 Daily 10.4266 0.0207 0.0207
MMoonntthh RReeccoorrdd DDaattee EExx--ddiivviiddeenndd NNAAVV ppeerr UUnniitt ((RRss..)) AAggggrreeggaattee DDiivviiddeenndd PPeerr UUnniitt ((RRee..)) ffoorr tthhee mmoonntthh IInnddiivviidduuaallss && HHUUFF OOtthheerrss
RReeccoorrdd CCuumm DDiivv DDiivviiddeenndd PPeerr uunniitt ((RRee..)) FFoorr
DDaattee NNAAVV ((RRss..)) IInnddiivviidduuaallss && HHUUFF OOtthheerrss
RReettaaiill OOppttiioonn
August 31, 09 10.0929 0.0375 0.0349
September 29, 09 10.0859 0.0315 0.0293
October 26, 09 10.0841 0.0299 0.0278
WWhhoolleessaallee OOppttiioonn
August 31, 09 10.0960 0.0403 0.0375
September 29, 09 10.0878 0.0331 0.0308
October 26, 09 10.0859 0.0315 0.0293
DDaaiillyy DDiivviiddeenndd RReeiinnvveessttmmeenntt OOppttiioonn (Past 6 months)
Aug 31, 09 10.3065 0.0339 0.0339Sep 29, 09 10.2961 0.0258 0.0258Oct 26, 09 10.2960 0.0257 0.0257
RReeccoorrdd DDaattee CCuumm DDiivviiddeenndd NNAAVV ((RRss..)) DDiivviiddeenndd PPeerr uunniitt ((RRee..)) FFoorr IInnddiivviidduuaallss && HHUUFF OOtthheerrss
Monthly Dividend Option (Past 3 months)
HDFC Liquid Fund
May 2009 Daily 10.1982 0.0329 0.0329June 2009 Daily 10.1982 0.0320 0.0320July 2009 Daily 10.1982 0.0327 0.0327August 2009 Daily 10.1982 0.0285 0.0285September 2009 Daily 10.1982 0.0267 0.0267October 2009 Daily 10.1982 0.0301 0.0301
MMoonntthh RReeccoorrdd DDaattee EExx--ddiivviiddeenndd NNAAVV ppeerr UUnniitt ((RRss..)) AAggggrreeggaattee DDiivviiddeenndd PPeerr UUnniitt ((RRee..)) ffoorr tthhee mmoonntthh IInnddiivviidduuaallss && HHUUFF OOtthheerrss
Daily Dividend Reinvestment Option (Past 6 months)
HDFC Liquid Fund
May 2009 Daily 12.2598 0.0414 0.0414June 2009 Daily 12.2598 0.0405 0.0405July 2009 Daily 12.2598 0.0410 0.0410August 2009 Daily 12.2598 0.0361 0.0361September 2009 Daily 12.2598 0.0339 0.0339October 2009 Daily 12.2598 0.0385 0.0385
MMoonntthh RReeccoorrdd DDaattee EExx--ddiivviiddeenndd NNAAVV ppeerr UUnniitt ((RRss..)) AAggggrreeggaattee DDiivviiddeenndd PPeerr UUnniitt ((RRee..)) ffoorr tthhee mmoonntthh IInnddiivviidduuaallss && HHUUFF OOtthheerrss
Daily Dividend Option (Past 6 months)
HDFC Liquid Fund - Premium Plan
October 2009 29Intouchmutually
hdfc-div.qxd 11/7/2009 5:15 PM Page 2

Dividend History ^
^̂ PPaasstt ppeerrffoorrmmaannccee mmaayy oorr mmaayy nnoott bbee ssuussttaaiinneedd iinn tthhee ffuuttuurree.. All dividends are on face value of Rs.10 per Unit. After payment of the dividend, the per Unit NAV will fall tothe extent of the payout and statutory levy, if any.
HDFC Liquid Fund
Weekly Dividend Option (Past 6 months)
RReeccoorrdd CCuumm DDiivv DDiivviiddeenndd PPeerr uunniitt ((RRee..)) FFoorr RReeccoorrdd CCuumm DDiivv DDiivviiddeenndd PPeerr uunniitt ((RRee..)) FFoorr DDaattee NNAAVV ((RRss..)) IInnddiivviidduuaallss && HHUUFF OOtthheerrss DDaattee NNAAVV ((RRss..)) IInnddiivviidduuaallss && HHUUFF OOtthheerrss
LLiiqquuiidd FFuunndd PPrreemmiiuumm PPlluuss PPllaann
May 04, 09 10.3210 0.0083 0.0083 May 04, 09 12.4312 0.0106 0.0106
May 11, 09 10.3200 0.0076 0.0076 May 11, 09 12.4298 0.0095 0.0095
May 18, 09 10.3194 0.0071 0.0071 May 18, 09 12.4292 0.0090 0.0090
May 25, 09 10.3197 0.0073 0.0073 May 25, 09 12.4299 0.0096 0.0096
Jun 01, 09 10.3198 0.0074 0.0074 Jun 01, 09 12.4297 0.0094 0.0094
Jun 08, 09 10.3196 0.0072 0.0072 Jun 08, 09 12.4294 0.0092 0.0092
Jun 15, 09 10.3196 0.0072 0.0072 Jun 15, 09 12.4293 0.0091 0.0091
Jun 22, 09 10.3197 0.0073 0.0073 Jun 22, 09 12.4294 0.0092 0.0092
Jun 29, 09 10.3208 0.0082 0.0082 Jun 29, 09 12.4308 0.0103 0.0103
Jul 06, 09 10.3198 0.0074 0.0074 Jul 06, 09 12.4219 0.0090 0.0090
Jul 13, 09 10.3195 0.0072 0.0072 Jul 13, 09 12.4219 0.0090 0.0090
Jul 20, 09 10.3198 0.0074 0.0074
Jul 27, 09 10.3198 0.0074 0.0074
Aug 03, 09 10.3195 0.0072 0.0072 Aug 03, 09 12.4528 0.0274 0.0274
Aug 10, 09 10.3188 0.0066 0.0066 Aug 10, 09 12.4284 0.0084 0.0084
Aug 17, 09 10.3187 0.0065 0.0065
Aug 24, 09 10.3191 0.0069 0.0069
Aug 31, 09 10.3191 0.0069 0.0069
Sep 07, 09 10.3181 0.0061 0.0061
Sep 14, 09 10.3181 0.0061 0.0061
Sep 22, 09 10.3196 0.0072 0.0072
Sep 29, 09 10.3186 0.0065 0.0065
Oct 05, 09 10.3179 0.0059 0.0059
Oct 12, 09 10.3188 0.0066 0.0066
Oct 20, 09 10.3201 0.0076 0.0076 Oct 20, 09 12.5263 0.0847 0.0847
Oct 26, 09 10.3175 0.0056 0.0056
RReettaaiill OOppttiioonnMay 04, 09 10.1459 0.0092 0.0863May 11, 09 10.1461 0.0094 0.0087May 18, 09 10.1455 0.0089 0.0083May 25, 09 10.1451 0.0085 0.0079Jun 01, 09 10.1448 0.0083 0.0077Jun 08, 09 10.1450 0.0084 0.0078Jun 15, 09 10.1450 0.0084 0.0078Jun 22, 09 10.1447 0.0082 0.0076Jun 29, 09 10.1458 0.0091 0.0085Jul 06, 09 10.1457 0.0090 0.0084Jul 13, 09 10.1452 0.0086 0.0080Jul 20, 09 10.1453 0.0087 0.0081Jul 27, 09 10.1453 0.0086 0.0080Aug 03, 09 10.1453 0.0087 0.0081Aug 10, 09 10.1450 0.0084 0.0078Aug 17, 09 10.1437 0.0073 0.0068Aug 24, 09 10.1440 0.0076 0.0070Aug 31, 09 10.1440 0.0075 0.0070Sep 07, 09 10.1435 0.0071 0.0066Sep 14, 09 10.1435 0.0071 0.0066Sep 22, 09 10.1449 0.0083 0.0078Sep 29, 09 10.1452 0.0086 0.0080Oct 05, 09 10.1438 0.0074 0.0069Oct 12, 09 10.1440 0.0075 0.0070Oct 20, 09 10.1447 0.0082 0.0076Oct 26, 09 10.1424 0.0062 0.0057
WWhhoolleessaallee OOppttiioonnMay 04, 09 10.1465 0.0097 0.0090May 11, 09 10.1466 0.0098 0.0092May 18, 09 10.1459 0.0092 0.0086May 25, 09 10.1456 0.00907 0.0083Jun 01, 09 10.1454 0.0087 0.0081Jun 08, 09 10.1455 0.0088 0.0082Jun 15, 09 10.1455 0.0088 0.0082Jun 22, 09 10.1453 0.0086 0.0080Jun 29, 09 10.1463 0.0096 0.0089Jul 06, 09 10.1462 0.0094 0.0088Jul 13, 09 10.1457 0.0090 0.0084Jul 20, 09 10.1457 0.0091 0.0084Jul 27, 09 10.1456 0.0089 0.0083Aug 03, 09 10.1452 0.0086 0.0080Aug 10, 09 10.1450 0.0085 0.0079Aug 17, 09 10.1442 0.0077 0.0071Aug 24, 09 10.1446 0.0080 0.0075Aug 31, 09 10.1447 0.0081 0.0076Sep 07, 09 10.1442 0.0077 0.0072Sep 14, 09 10.1443 0.0078 0.0072Sep 22, 09 10.1458 0.0091 0.0085Sep 29, 09 10.1459 0.0092 0.0086Oct 05, 09 10.1443 0.0078 0.0072Oct 12, 09 10.1448 0.0082 0.0077Oct 20, 09 10.1456 0.0089 0.0083Oct 26, 09 10.1431 0.0067 0.0062
RReeccoorrdd CCuumm DDiivv DDiivviiddeenndd PPeerr uunniitt ((RRee..)) FFoorr DDaattee NNAAVV ((RRss..)) IInnddiivviidduuaallss && HHUUFF OOtthheerrss
RReeccoorrdd CCuumm DDiivv DDiivviiddeenndd PPeerr uunniitt ((RRee..)) FFoorr DDaattee NNAAVV ((RRss..)) IInnddiivviidduuaallss && HHUUFF OOtthheerrss
RReeccoorrdd CCuumm DDiivv DDiivviiddeenndd PPeerr uunniitt ((RRee..)) FFoorr DDaattee NNAAVV ((RRss..)) IInnddiivviidduuaallss && HHUUFF OOtthheerrss
RReeccoorrdd CCuumm DDiivv DDiivviiddeenndd PPeerr uunniitt ((RRee..)) FFoorr DDaattee NNAAVV ((RRss..)) IInnddiivviidduuaallss && HHUUFF OOtthheerrss
Short Term Plan (Weekly Dividend Option) (Past 6 months)
HDFC Floating Rate Income Fund
May 04, 09 10.1835 0.0111 0.0103
May 11, 09 10.1860 0.0133 0.0124
May 18, 09 10.1888 0.0157 0.0146
May 25, 09 10.1814 0.0092 0.0086
Jun 01, 09 10.1805 0.0084 0.0078
Jun 08, 09 10.2114 0.0355 0.0330
Jun 15, 09 10.2068 0.0314 0.0293
Jun 22, 09 10.1885 0.0154 0.0143
Jun 29, 09 10.1834 0.0109 0.0102
Jul 06, 09 10.1991 0.0247 0.0230
Jul 13, 09 10.1930 0.0194 0.0180
Jul 20, 09 10.1800 0.0080 0.0074
Aug 17, 09 10.2006 0.0260 0.0242
Aug 31, 09 10.1833 0.0109 0.0101
Sep 07, 09 10.1887 0.0156 0.0145
Sep 14, 09 10.1882 0.0152 0.0141
Sep 22, 09 10.1906 0.0173 0.0161
Sep 29, 09 10.1946 0.0208 0.0193
Oct 05, 09 10.1789 0.0070 0.0065
Oct 12 09 10.1744 0.0031 0.0029
Oct 20, 09 10.1876 0.0146 0.0136
Oct 26, 09 10.1895 0.0163 0.0152
Long Term Plan (Weekly Dividend Reinvestment Option) (Past 6 months)
RReettaaiill OOppttiioonn
Aug 31, 09 10.1893 0.0396 0.0368
Sep 29, 09 10.1797 0.0312 0.0291
Oct 26, 09 10.1776 0.0293 0.0273
WWhhoolleessaallee OOppttiioonn
Aug 31, 09 10.1910 0.0411 0.0382
Sep 29, 09 10.1829 0.0339 0.0316
Oct 26, 09 10.1856 0.0363 0.0338
RReeccoorrdd DDaattee CCuumm DDiivviiddeenndd NNAAVV ((RRss..)) DDiivviiddeenndd PPeerr uunniitt ((RRee..)) FFoorr IInnddiivviidduuaallss && HHUUFF OOtthheerrss
Short Term Plan (Monthly Dividend Option) (Past 3 months)
HDFC Floating Rate Income Fund
RReettaaiill OOppttiioonn
May 2009 Daily 10.0809 0.0349 0.0323June 2009 Daily 10.0809 0.0354 0.0327July 2009 Daily 10.0809 0.0356 0.0329August 2009 Daily 10.0809 0.0318 0.0294September 2009 Daily 10.0809 0.0331 0.0309October 2009 Daily 10.0809 0.0339 0.0314WWhhoolleessaallee OOppttiioonn
May 2009 Daily 10.0809 0.0368 0.0339June 2009 Daily 10.0809 0.0373 0.0345July 2009 Daily 10.0809 0.0370 0.0343August 2009 Daily 10.0809 0.0335 0.0311September 2009 Daily 10.0809 0.0358 0.0334October 2009 Daily 10.0809 0.0370 0.0345
MMoonntthh RReeccoorrdd DDaattee EExx--ddiivviiddeenndd NNAAVV ppeerr UUnniitt ((RRss..)) AAggggrreeggaattee DDiivviiddeenndd PPeerr UUnniitt ((RRee..)) ffoorr tthhee mmoonntthh IInnddiivviidduuaallss && HHUUFF OOtthheerrss
Short Term Plan (Daily Dividend Option) (Past 6 months)
HDFC Floating Rate Income Fund
HDFC Short Term PlanDividend Reinvestment Option (Past 6 months)
RReeccoorrdd CCuumm DDiivv DDiivviiddeenndd PPeerr uunniitt ((RRee..)) FFoorr DDaattee NNAAVV ((RRss..)) IInnddiivviidduuaallss && HHUUFF OOtthheerrss
RReeccoorrdd CCuumm DDiivv DDiivviiddeenndd PPeerr uunniitt ((RRee..)) FFoorr DDaattee NNAAVV ((RRss..)) IInnddiivviidduuaallss && HHUUFF OOtthheerrss
Jul 27, 09 10.4219 0.0917 0.0854
Sep 29, 09 10.3608 0.0382 0.0355
Oct 26, 09 10.3796 0.0547 0.0509
HDFC Gilt Fund (Since June 2007)
Sep 25, 07 10.6616 0.1000 0.0931Dec 26, 07 10.6982 0.1000 0.0931Mar 25, 08 10.8113 0.1000 0.0931Jun 25, 08 10.6134 0.1000 0.0931Sep 25, 08 10.7745 0.1500 0.1396Dec 26, 08 10.9701 0.2500 0.2327Mar 25, 09 10.7128 0.1000 0.0931Jun 25, 09 10.7100 0.1000 0.0931
Jun 25, 07 10.2828 0.1000 0.0931Sep 25, 07 10.3120 0.1500 0.1396Dec 26, 07 10.4530 0.1500 0.1396Mar 25, 08 10.5135 0.1500 0.1396Sep 25, 08 10.4374 0.1500 0.1396Dec 26, 08 11.8667 0.4500 0.4188Mar 25, 09 10.4851 0.1000 0.0931Jun 25, 09 10.5328 0.1000 0.0931
RReeccoorrdd CCuumm DDiivv DDiivviiddeenndd PPeerr uunniitt ((RRee..)) FFoorr DDaattee NNAAVV ((RRss..)) IInnddiivviidduuaallss && HHUUFF OOtthheerrss
RReeccoorrdd CCuumm DDiivv DDiivviiddeenndd PPeerr uunniitt ((RRee..)) FFoorr DDaattee NNAAVV ((RRss..)) IInnddiivviidduuaallss && HHUUFF OOtthheerrss
Short Term Plan (Dividend Option) Long Term Plan (Dividend Option)
30 October 2009 Intouchmutually
hdfc-div.qxd 11/7/2009 5:15 PM Page 3

Methodology
Value Research Fund Ratings are a composite measure of historical risk-adjusted returns. In the case of equity and hybrid funds this rating is based on the weighted aver-
age monthly returns for the last 3 and 5-year periods. In the case of debt funds this rating is based on the weighted average weekly returns for the last 18 months and 3-year
periods and in case of short-term debt funds - weekly returns for the last 18 months. These ratings do not take into consideration any entry or exit load. Each category must
have a minimum of 10 funds for it to be rated. Effective, July 2008, we have put an additional qualifying criteria, whereby a fund with less than Rs 5 crore of average AUM in
the past six months will not be eligible for rating.
Five-stars indicate that a fund is in the top 10% of its category in terms of historical risk-adjusted returns. Four stars indicate that a fund is in the next 22.5%, middle 35%
receive three stars, the next 22.5% are assigned two stars while the bottom 10% receive one star. The number of schemes in each category is mentioned along side the cate-
gories name. Equity Diversified (149), Equity : Index (19), Equity Tax Planning (24), Hybrid Equity Oriented (28), Hybrid: Monthly Income (33), Debt: Medium-term (38), Gilt:
Medium and Long-term (29), Gilt: Short-term (13), Debt: Ultra Short-term (40), Debt: Ultra Short-term Institutional (45), Debt: Short-term (19), Debt: Floating Rate Short-term
(13),Debt: Floating Rate Long-term (10), Hybrid: Debt-oriented (16), Debt: Liquid Plus: (26), Debt: Liquid Plus Institutional:(24). These Fund Ratings are as on October 31, 2009.
The Value Research Ratings are published in Monthly Mutual Fund Performance Report and Mutual Fund Insight. The Ratings are subject to change every month. The Rating
is based on primary data provided by respective funds, Value Research does not guarantee the accuracy.
Value Research Ratings
Disclaimer:
The information contained herein should not be altered in any way, transmitted to, copied or distributed, in part or in whole, to any other person or to the media or repro-
duced in any form, without prior written consent of HDFC Asset Management Company Limited (HDFC AMC) or the relevant owner of the intellectual property, as the case may
be. All Intellectual property and intellectual property rights belong to the relevant owner of the intellectual property, and “Intouch Mutually” is a trademark of HDFC AMC.
Any information herein contained does not constitute and shall be deemed not to constitute an advice, an offer to sell/ purchase or as an invitation or solicitation to do so
for any securities of any entity, and further, HDFC AMC / its subsidiaries / affiliates / sponsors / trustee (HDFC AMC Group) or their officers, employees, personnel, directors may
be associated in a commercial, professional or personal capacity or may have a commercial interest including as proprietary traders in or with the securities and/ or companies
or issues or matters as contained in this publication and such commercial capacity or interest whether or not differing with or conflicting with this publication, shall not make or
render (HDFC AMC Group) liable in any manner whatsoever & (HDFC AMC Group) or any of their officers, employees, personnel, directors shall not be liable for any loss, dam-
age, liability whatsoever for any direct or indirect loss arising from the use or access of any information that may be displayed in this publication from time to time. Recipients
of the information contained herein should exercise due care and caution and read the Scheme Information Document(s) and Statement of Additional Information (including if
necessary, obtaining the advice of tax / legal / accounting / financial / other professionals) prior to taking of any decision, acting or omitting to act, on the basis of the informa-
tion contained herein. The printing and mailing cost of this newsletter is charged to the respective schemes subject to Securities & Exchange Board of India (Mutual Funds)
Regulations, 1996.
Editorial opinions expressed in Intouch Mutually (Page no. 3 & 4) are not necessarily those of HDFC AMC Group, or any of their officers, employees, personnel, directors and
HDFC AMC Group and their officers, employees, personnel, directors do not accept responsibility for the editorial content. HDFC AMC Group or any of their officers, employees,
personnel, directors make no representation as to the accuracy, completeness or reliability of the editorial content and hereby disclaim any liability with regard to the same.
HDFC Equity Fund, HDFC Capital Builder Fund, HDFC TaxSaver and HDFC Premier Multi-Cap Fund benchmarked to S&P CNX 500 Index, are not sponsored, endorsed, sold
or promoted by India Index Services & Products Limited (IISL). IISL is not responsible for any errors or omissions or the results obtained from the use of such index and in no
event shall IISL have any liability to any party for any damages of whatsoever nature (including lost profits) resulted to such party due to purchase or sale or otherwise of such
product benchmarked to such index.
“Standard & Poor’s® and “S&P® are trademarks of The McGraw-Hill Companies, Inc. and have been licensed for use by India Index Services & Products Limited (IISL), which
has sublicensed such marks to the HDFC Asset Management Company Limited. The S&P CNX Nifty is not compiled, calculated or distributed by Standard & Poor’s and Standard &
Poor’s and IISL make no representation regarding the advisability of investing in products that utilize any such Index as a component. All rights in the SENSEX vest in Bombay Stock
Exchange Ltd. (“BSE”). BSE and SENSEX are trademarks of BSE and are used by HDFC Asset Management Company Limited under license. BSE shall not be liable in any manner what-
soever (including in negligence) for any loss arising to any person whosoever out of use of or reliance on the SENSEX by any person.
# S&P CNX 500 / S&P CNX NIFTY / BSE SENSEX
October 2009 31Intouchmutually
hdfc-bk1.qxd 11/7/2009 5:17 PM Page 1

Intouchmutually, September 2009, RNI Regd. No. MAHENG/2003/10804
WANT TO HAVE THE LATEST INFORMATION ABOUT US ?
INVESTOR SERVICE CENTRES (ISCs)
Toll-free number : 1800 233 6767
Dedicated number : 60006767
AANNDDHHRRAA PPRRAADDEESSHHHDFC AMC Ltd., 6-3-883/7, 2nd Floor, Saphire Square, Somajiguda, HHyyddeerraabbaadd -- 500 282. Tel: 040 - 2341 7401-05, Fax: 040 - 2341 7407.HDFC AMC Ltd., 18-2-299/B,1st Floor,Leela Mahal Circle, Tirumala Bypass Road,TTiirruuppaattii - 517507. Tel: 0877-2222871 & 72, Fax: 0877-2222689.HDFC AMC Ltd., 2nd Floor, Centurion Bank Complex, Near Benz Circle, M. G. Road, VViijjaayyaawwaaddaa - 520 010. Tel: No: (0866)-3988029.HDFC AMC Ltd., Ground Floor, Saigopal Arcade, Opp Waltair Club, Waltair Main Road, Siripuram, VViissaakkhhaappaattnnaamm - 530 003. Tel: 0891- 276 9636, Fax: 0891 - 255 0411.HDFC AMC Ltd., #2-5-83/84, 1st floor, Mitra Lakshminarayana Arcade, Nakkala gutta, Hanmakonda, WWaarraannggaall - 506002. Tel: 0870-2566005/06, Fax: 0870-2566010.AASSSSAAMMHDFC AMC Ltd., Premises- 1C, 1st Floor, Ganpati Enclave, G.S.Road, GGuuwwaahhaattii -781 007. Tel: (0361)-2464759/60 Fax: (0361)-2464758. BBIIHHAARRHDFC AMC Ltd., Ishwari Complex, 1st Floor, Dr. Rajendra Prasad Road, BBhhaaggaallppuurr - 812 002. Tel No: (0641) 2300 390 Fax: (0641) 2300391.HDFC AMC Ltd., C/o. Hera Enclave (adjacent to Sahara Unique Showroom),Mezzanine Floor, New Dak Bungalow Road, PPaattnnaa - 800 001. Tel: 0612 - 2230540. 3201439, 2200747, 9931770771 Fax: 0612 - 2200747.CCHHHHAATTTTIISSGGAARRHHHDFC AMC Ltd., Chawla Complex, Ground Floor, Near Vanijya Bhavan, Devendra Nagar Road, Sai Nagar, RRaaiippuurr . 492 001. Tel: 0077 - 14020167.DDEELLHHIIHDFC AMC Ltd., 4th Floor, Mohan Dev Bldg., 13, Tolstoy Marg, Connaught Place,NNeeww DDeellhhii - 110 001. Tel: 011 - 6632 4000. Fax: 011 - 2335 1317. HDFC AMC Ltd.,* 14th Floor, Mohan Dev Bldg., 13, Tolstoy Marg, ConnaughtPlace, NNeeww DDeellhhii - 110 001. Tel: 011 - 6632 4000. Fax: 011 - 2335 1317. GGOOAAHDFC AMC Ltd., Ground Floor, G3 & G4 Jivottam, Minguel Miranda Road, Off. Abade Faria Road, MMaarrggaaoo - 403 601. Tel: 0832 - 2737410 / 2737411,Fax: 0832-2736477.HDFC AMC Ltd., S1, Second Floor, Above Axis Bank, Edcon Centre, Angod,MMaappuussaa - 403 507, Bardez. Tel: 0832 - 2253 460 / 461, Fax: 0832 - 2253 465.HDFC AMC Ltd., A3, First Floor, Krishna Building, Opp. Education Dept, BehindSusheela Building, G.P. Road, PPaannaajjii -- 403 001. Tel: 0832 - 242 5609, 242 5610, Fax: 0832 - 242 5614.HDFC AMC Ltd., 6, Ground Floor, Pereira Chambers, Padre Jose Vaz Road, VVaassccoo - 403 802, Mormugao. Tel: 0832 - 2513 402 / 406, Fax: 0832 - 2513 448.GGUUJJAARRAATTHDFC AMC Ltd., 2nd Floor, Megha House, Besides Gruh House, Mithakhali Six Roads, AAhhmmeeddaabbaadd - 380 009. Tel: (B) 079 - 4005 0055/66 Telefax: 079 - 4005 0506.HDFC AMC Ltd., Maruti Sharanam, No.117, 1st Floor, Anand-Vidhyanagar Road,Opposite Nandbhumi Party Plot, AAnnaanndd - 388 001. Tel : (02692) - 398200 Fax: (02692) - 398222.HDFC AMC Ltd., 2nd Floor, Gangotri Plaza, Opposite Daxinamurty School,Waghawadi Road, BBhhaavvnnaaggaarr - 364 001. Tel : (0278) - 3988029 Fax: (0278) - 3984039.HDFC AMC Ltd., 1st Floor, B Wing, Katira Complex, RTO Circle, BBhhuujj - 370 001. Tel No: (02832) 223 223. Fax: (02832) 251 946.HDFC AMC Ltd., 2nd Floor, Keshav Complex, P N Marg, Opposite Dhanvantry,JJaammnnaaggaarr - 361 001. Tel : (0288) - 3988029 Fax: (0288) - 3982426.HDFC AMC Ltd., 2nd Floor, Rajendra Estate, State Highway, MMeehhssaannaa - 384 002.Tel: 60006767 Fax: 02762 - 302020. HDFC AMC Ltd., 2nd Floor, Shiv Darshan,Dr Radha Krishnan Road, 5, JagnathPlot Corner, RRaajjkkoott - 360 001. Tel: 0281 662 4881/82. Fax: 0281 662 4883.HDFC AMC Ltd., U1 - U3, Jolly Plaza, Opp Athwa Gate Police Station, AthwaGate, SSuurraatt -- 395 001. Tel: 0261 - 246 0082 / 83. Fax: 0261 - 246 0091. HDFC AMC Ltd., Upper Ground Floor, Gokulesh, R C Dutt Road, VVaaddooddaarraa - 390 007. Tel: 0265 6621110, 6621120, Fax: 0265 6621150.HDFC AMC Ltd., 5-B, 2nd Floor, Sapphire Building, Daulatnagar, Chala-Vapi Road,VVaappii - 396 191. Tel No: (0260) 3983900 Fax: (0260) 3983908.HHAARRYYAANNAAHDFC AMC. Ltd., TA - 12A, 15-18, Third Floor, Crown Plaza, Sector 15A, Mathura Road, FFaarriiddaabbaadd - 121001.Tel : (0129) 2221 338 / 339 / 341 / 342 / 343 Fax: (0129) 2221 340. HDFC AMC Ltd., Premises 102, 1st Floor, Vipul Agora, MG Road, GGuurrggaaoonn - 122 002. Tel No: (0124) 2560 450 - 54 Fax: (0124) 2560455. HDFC AMC Ltd., 1175 B Royal 1, 1st Floor, Adjoining Gurudawara, G.T Road,PPaanniippaatt -- 113322 110033.. Tel: (0180) 3985400/ 01 Fax: (0180) 3985403. JJAAMMMMUU && KKAASSHHMMIIRRHDFC AMC Ltd., Hall No-102 A/2, South Block, Bahu Plaza, Gandhi Nagar,JJaammmmuu - 180 012. Tel: (0191)-2477911/12/13 (0191) 2474297/98/99. JJHHAARRKKHHAANNDDHDFC AMC Ltd., Vardhan Complex, 1st Floor, Opp. Sreeleathers Showroom, BankMore, DDhhaannbbaadd -- 826 001. Tel: (0326) 3205352, 2301756 Fax: (0326) 2300552. HDFC AMC Ltd., Gayatri Enclave, “K” Road, Bistupur, JJaammsshheeddppuurr - 831 001.Tel: 0657 - 2426730. Telefax: 0657 - 3291826. HDFC AMC Ltd., Pradhan Towers, 1st Floor, 5, Main Road, RRaanncchhii - 834 001. Tel: (0651) 6003358 Fax: (0651) 3242077. KKAARRNNAATTAAKKAAHDFC AMC Ltd., No.114, 1st Floor, Prestige Towers, 99 & 100, Residency Road,BBaannggaalloorree - 560 025. Tel: 080 - 6620 5300, Fax: 080 - 4112 5255.HDFC AMC Ltd., # 145,1st Floor, 60ft Road, 5th Block, Koramangala,BBaannggaalloorree - 560034. Ph: 080-30922720, Fax: 080 - 30922728.HDFC AMC Ltd., Premises No. 4830 / B, First Floor, Dr. Ambedkar Road, Opp. Civil Medical College, BBeellggaauumm - 590 002.Tel No: (0831) 4206 915 / 916 / 918 Fax: (0831) 4206919.HDFC AMC Ltd., # 63, Upper Ground Floor, Opposite Bellary Gas Agency,
Anantapura Cross Road, BBeellllaarryy - 583 103. Tel: (08392) 276576 Fax: (08392) 276580.HDFC AMC Ltd., 190/3, 1st Floor, S.V.C. Plaza, Opposite Mothi Talkies, Gandhi Circle, DDaavvaannggeerree - 577 002. Tel No: (08192) 250 240 / 241 / 242Fax: (08192) 250243.HDFC AMC Ltd., Plot # 8 & 73, 3rd Floor, Rajesh Building, Super Market, Main Road, GGuullbbaarrggaa - 585 101. Tel: (08472) 399910 Fax: (08472) 271041.HDFC AMC Ltd., No. 1, First Floor, Revankar Comforts, Vivekanand Road, Court Circle, HHuubbllii - 580 029. Tel: (0836) 4252 294 / 95 Fax: (0836) 4252 290.HDFC AMC Ltd., # 493,1st Floor, 4th Cross, 2nd Main, Sampige Road,Malleshwaram, BBaannggaalloorree - 560003. Ph: 080- 30922750, Fax: 080 - 30922753.HDFC AMC Ltd., UG - II, 6 & 7, Upper Ground Floor, Maximus CommercialComplex, Light House Hill Road, Opp. KMC, MMaannggaalloorree -- 575 001. Tel: 0824 428 5333 (B), 428 5337 (D) Fax: 0824 - 428 5336. HDFC AMC Ltd., No. 2918, CH 51 / 1 B, 1st Floor, Patel Mansion, Kantharaj Urs Road, Saraswathipuram, MMyyssoorree - 570 009. Tel: (0821) 4000 530 Fax: (0821) 4000 535.KKEERRAALLAAHDFC AMC Ltd., 3rd Floor, City Mall, Opposite YMCA, Kannur Road, CCaalliiccuutt - 673 001. Tel: (0495) - 4099222 / 333, 3982310 Fax: (0495) - 3982330.HDFC AMC Ltd., Second Floor, Down Town Complex , Near Koyili Hospital,KKaannnnuurr - 670004. Tel: 0497-6450489, 2762045, 2762044, Fax: 0497-2762046.HDFC AMC Ltd., Ground Floor, Cinema Cum Commercial Complex, Behind Ravipuram Bus Stop, M.G. Road, KKoocchhii - 682 016. Tel: 0484 - 235 7707 / 08, 324 3058 / 059, 235 8462. Telefax: 0484 - 235 8462.HDFC AMC Ltd., 1st Floor Sofia Complex, Near Andamukkam Bus Stand, Beach Road, KKoollllaamm - 691001. Tel: 0474-2752070/71, Fax: 0474-2752073.HDFC AMC Ltd., 1st Floor, Kaniamparambil Arcade, G S Junction, Shasthri Road,KKoottttaayyaamm - 686001. Tel: 0481-3018392/93/94/95, Fax: 0481-3018397. HDFC AMC Ltd., 14/868, Ground Floor, Sri Krishna Complex, Coimbatore Road,PPaallgghhaatt - 678 001. Tel: 0491 2548300. Fax: 0491 2548303.HDFC AMC Ltd., 2nd Floor,E-Town Shopping, College Road, East Fort, TThhrriissssuurr - 680005. Tel: 0487-2441976, Fax: 0487-2441976.HDFC AMC Ltd., Ground Floor, Bhadra Tower, Cotton Hill Road, Vazhuthacaud,Thycaud PO, TTrriivvaannddrruumm - 695 014. Tel: 0471 - 3983 730 / 731 / 732, Fax: 0471 - 3983 738.MMAADDHHYYAA PPRRAADDEESSHHHDFC AMC Ltd.,1st Floor, Ranjeet Tower, 8, Zone-II, M.P. Nagar, BBhhooppaall - 462 011.Tel: 0755 - 428 5385, 424 6995 Fax: 0755 - 405 8890. HDFC AMC Ltd., First Floor, Alakhnanda Towers, Shrimant Madhav Rao Scindia Marg, City Centre, GGwwaalliioorr - 474 001. Tel: (0751) - 4066060, 3988029 Fax: (0751) - 3982803. HDFC AMC Ltd., 15/3, Sterling Arcade, Race Course Rd., IInnddoorree - 452 001. Tel: 0731 - 424 5434 / 35 (B) Fax: 0731 - 424 5436.HDFC AMC Ltd., First Floor, Muthye Udyog Bhawan,1039, Wright Town, Opp. Telephone Exchange, JJaabbaallppuurr - 482 002. Tel: (0761) - 4049800, 3988029 Fax: (0761) - 4068814. MMAAHHAARRAASSHHTTRRAAHDFC AMC Ltd., 2nd Floor, Renuka Commercial Complex, Samarth Nagar, Nirala Bazar,Nageshwar Wadi Road, AAuurraannggaabbaadd - 431 001. Tel: (0240) - 3988029 Fax: (0240) - 3982068.HDFC AMC Ltd.,** Patkar Bldg, 1st Floor, Opp. Kalyan Dombivli Municipal Corpn., Manpada Road, DDoommbbiivvllii - 421 201.Tel: +91 (251) 286 1474, 286 1473. Fax: +91 (251) 286 1375HDFC AMC Ltd., 138, Ground Floor, Kavya Ratnavali Chowk, Omkareshwar Road,JJaallggaaoonn – 425 002. Tel: (0257) 3982100/ 01 Fax: (0257) 3982114. HDFC AMC Ltd., Royal Prestige, C1/C9, 1st Floor, E - Ward, Sykes Extension,Rajarampuri Road, KKoollhhaappuurr - 416 008. Tel : (0231) - 3988029 Fax: (0231) - 3982060.HDFC AMC Ltd.,** Shop No. 3, Abhishek Building, Ground Floor, Next to Vijay Sales, S.V. Road, Andheri (W), MMuummbbaaii - 400 058. Tel: (022) 26285389, 26708239, 32157334/332 Fax: (022) 26241131.HDFC AMC Ltd.,** Unit No. 101, First Floor,Landmark Building, 136 HillRoad,Opp. St. Peters Church, Bandra (West), MMuummbbaaii - 400 050. Tel: (022) 26434760/1/2/3/4 Fax: (022) 26434768HDFC AMC Ltd.,** Shop # 7, Abhilasha Building, Punjabi Lane, Borivali (W),MMuummbbaaii - 400 092. Tel: (022) 28952702 / 28901497 Fax: (022) 32719222.HDFC AMC Ltd., Mistry Bhavan, 1st Flr, 122, Backbay Reclamation, Dinsha Vachha Road, Churchgate, MMuummbbaaii - 400 020. Tel: 022 - 6000 6767 Fax: 022 - 2282 1144.HDFC AMC Ltd.,* Ramon House, 3rd Flr, H. T. Parekh Marg, 169, Backbay Reclamation, Churchgate, MMuummbbaaii - 400 020. Tel: 022 - 6631 6333.HDFC AMC Ltd.,** Shop No. 1 & 2, Ground Floor, Atlantic Tower, R B Mehta Road, Near Railway Station, Ghatkopar (East), MMuummbbaaii - 400 077. Tel: (022) 25011507/0805/1664/2486 Fax: (022) 25116805. HDFC AMC Ltd., 106-110, Shriram Shyam Towers, 2nd Floor, Next to NIT Building, Kingsway, Sadar, NNaaggppuurr - 440 001. Tel: 0712 - 663 0301 / 04, Fax: 0712 - 663 0302. HDFC AMC Ltd., G-1 & G-2, Ground Floor, Suyojit Heights, Opp. Rajiv Gandhi Bhavan, Sharanpur Road, NNaasshhiikk 422 002. Tel: 0253 - 661 1831/32 (B), 661 1835 (D) Fax: 0253 - 661 1836.HDFC AMC Ltd., HDFC House, 2nd Floor, Shivaji Nagar, University Road, PPuunnee - 411 005. Tel: 020 - 2552 1680 / 2552 1681, Fax: 020 - 2552 1683.HDFC AMC Ltd.,** Shop No. 21/22, Ground Floor, Rajdeep CHS, Near Malhar Cinema, Gokhale Road, TThhaannee ((WWeesstt)) - 400 602. Tel: (022) 67124172/73/74/75/76 Fax: (022) 67124177 HDFC AMC Ltd.,** BSE 1, Tech Building, 109, A Wing, 1st Floor, Opposite VashiRailway Station, Sector 30, VVaasshhii - 400 703. Tel: (022) - 39880299.OORRIISSSSAAHDFC AMC Ltd., Sri Jagannath Complex, 1st Floor, Opposite Hari - Omm Bhawan, BBaarrbbiill - 758 035. Tel No: 09238106515 / 09238106525 Fax: (06767) 277565.
HDFC AMC Ltd., 2nd Floor, Vinayak 96, Janpath, BBhhuubbaanneesshhwwaarr 751 001.Tel: 0674 - 645 0502, 645 1502, Telefax: 0674 - 253 1483.HDFC AMC Ltd., 1st Floor, Plot No. 2690 (P) Bajrakabati Road, Ranihat, CCuuttttaacckk – 753 001. Tel: (0671) 2323724/ 725 Fax: (0671) 2324741.HDFC AMC Ltd., Praful Tower, 1st Floor, Panposh Road, RRoouurrkkeellaa - 769 004. Tel: (0661) 3988029,3982060/70 Fax: (0661) 3982068. HDFC AMC Ltd., Kadambari Complex, 1st Floor, Unit - 4, Nayapara, Golbazar,SSaammbbaallppuurr - 768 001. Tel No: (0663) 2400 323 / 339 Fax: (0663) 2400324. PPOONNDDIICCHHEERRRRYYHDFC AMC Ltd., No.17, I Floor, Sree Velayudham Complex, Near Indhira Gandhi Square, Natesan Nagar, PPoonnddiicchheerrrryy - 605 005. Tel: (0413) 3043 293 / 500 / 600 Fax: (0413) 2206776.PPUUNNJJAABB HDFC AMC Ltd., SCO-28, 1st Floor, Taneja Towers, District Shopping Complex,Ranjit Avenue, AAmmrriittssaarr -- 143 001. Tel: (0183) 3988029 / 2570 Fax: (0183) 3982599. HDFC AMC Ltd., SCO 375-376, Ground Floor, Sector 35-B, CChhaannddiiggaarrhh -- 160 022. Tel: 0172 - 262 3397, 262 4497, Fax: 0172 - 301 3839. HDFC AMC Ltd., 2nd Floor, Above ING Vysya Bank, Adjacent to Sekhon GrandHotel, Namdev Chowk, G T Road, JJaallaannddhhaarr CCiittyy -- 144 001. Tel: (0181) 3988029 / 970 Fax: (0181) 3982966. HDFC AMC Ltd., SCO 122, Feroze Gandhi Market, LLuuddhhiiaannaa - 141 001.Tel: 0161 - 277 4321, 501 4321, Fax: 0161 - 301 3838.RRAAJJAASSTTHHAANNHDFC AMC Ltd., Unit Nos. 72-75, 4th Floor, K C Complex, Daulatbagh Road, AAjjmmeerr.. Tel: 0145 - 3099 000.HDFC AMC Ltd., Moondhra Bhavan, 3 Ajmer Rd, JJaaiippuurr - 302 001.Tel: 0141 - 511 1125, 237 4968, Fax: 0141 - 511 1126.HDFC AMC Ltd., Gulab Singh Building, 11, Chopasani Road, JJooddhhppuurr -- 342 003.Tel: (0291) - 510 1927, 510 1937. Fax: 0291 - 5105919HDFC AMC Ltd., 1st Floor, Gowardhan Plaza, 25, Trench Colony, Opposite LokKalamandal, UUddaaiippuurr - 313 001. Tel: (0294) 3988029 Fax: (0294) 3982000.TTAAMMIILL NNAADDUUHDFC AMC Ltd., ITC Centre, 1st Floor, 760 Anna Salai, CChheennnnaaii -- 600 002.Tel: 044 - 4397 9797, Fax: 044 - 2841 5855. HDFC AMC Ltd., 1st Floor, No1 Bhimsena Garden Street, Royapettah High Road,Mylapore, CChheennnnaaii – 600 004. Tel: (044) 30913060 Fax: (044) 30913082. HDFC AMC Ltd., 1371A, Ground Floor, Nadar Building Trichy Road, CCooiimmbbaattoorree - 641 018. Tel: 0422 - 439 1861 / 62 / 63, Fax: 0422 - 439 1714. HDFC AMC Ltd., Investor Service Centre No 127C/3 East Veli Street,MMaadduurraaii.. Tel: 0452 - 3988029.HDFC AMC Ltd., First floor, Ram Complex, No. 454/3, Meyanoor Main Road,SSaalleemm - 636 009. Tel : (0427) 3982680/700 Fax: (0427) 233361. HDFC AMC Ltd., No. 60, Sri Krishna Arcade, First Floor, Tennur High Road,Tennur, TTrriicchhyy -- 662200 001177.. Tel: (0431) 3982830 Fax: (0431) 3982835. UUTTTTAARRAANNCCHHAALLHDFC AMC Ld., 76, Rajpur Road, Near RTO, DDeehhrraadduunn -- 224488 000011.. Tel: (0135) 3988029/ 7434 Fax: (0135) 3987444.UUTTTTAARR PPRRAADDEESSHHHDFC AMC Ltd., B2, 1st Floor, 9/4, Shankar Point, Sanjay Place, AAggrraa - 282 002. Tel: (0562) 3984761-73 Fax: (0562) 3984777. HDFC AMC Ltd., 3/260 – A Arena Complex, Laxmibai Marg,Marris Road, AAlliiggaarrhh - 202001. Tel: (0571) – 2740770/771/772. Fax: (0571) – 2740772.HDFC AMC Ltd., Agarwal Arcade, 4 Sardar Patel Marg, 3rd Floor, AAllllaahhaabbaadd – 211001. Tel: 0532 – 2561035/36/38.HDFC AMC Ltd., 146 Civil Lines, 1st Floor, Gupta Complex, Near Circuit HouseChouraha, BBaarreeiillllyy - 243 001. Tel: (0581) 2510 749 / 759 Fax: (0581) 2510709.HDFC AMC Ltd., D-2, 1st Floor, Raj Nagar District Centre, Raj Nagar, GGhhaazziiaabbaadd - 201010. Tel No - 0120 - 3010635, Fax: 0120 - 3010636.HDFC AMC Ltd., 1st Floor, 16/80 D, Behind SBI Main, Civil Lines, KKaannppuurr - 208 001. Tel: 0512 - 233 1484-87, Fax: 0512 - 233 1487.HDFC AMC Ltd., 4 Shahnajaf Road, LLuucckknnooww -- 226 001. Tel: 0522 - 220 7591, 220 0163, Fax: 0522 - 223 0408. HDFC AMC Ltd., 143/145/1 Ganpati Plaza, Ground Floor, Magal Pandey Road, MMeeeerruutt – 250 005. Tel No: (0121) – 2602380/2601964. Fax: (0121) -2602380,HDFC AMC Ltd., Parsvnath Plaza-II, UGF Hall No.4, Delhi Road, MMoorraaddaabbaadd - 244 001. Tel: (0591) 3988029 / 3982131 Fax: (0591) 3982137. HDFC AMC Ltd., K-24/25, Premises No. 36 & 37, Pearl Plaza, Sector-18, NNooiiddaa - 201 301. Tel: (0120) 3988029 Fax: (0120) 3980610.HDFC AMC Ltd., D-64/127, 4th Floor, Arihant Complex, Sigra, VVaarraannaassii - 221010. Tel: 9935177068, 9935147068.WWEESSTT BBEENNGGAALLHDFC AMC Ltd., City Plaza, City Centre, 1st Floor, DDuurrggaappuurr - 713 216. Tel: (0343) 3982150 Fax: (0343) 3982153.HDFC AMC Ltd., MS Towers, 2nd Floor, OT Road, Inda (Opposite Kharagpur College) KKhhaarraaggppuurr - 721305. Tel: (03222) 227627 / 227657 Ext: 101, Fax: (03222) 227683.HDFC AMC Ltd., Menaka Estate, 1st Floor, 3 Red Cross Place, KKoollkkaattaa - 700 001. Tel: 033 - 2242 7849/53/56/59. Fax: 033 - 2243 9582.HDFC AMC Ltd., Gitanjali Complex, 2nd Floor, Above Corporation Bank, Sevoke Road, SSiilliigguurrii - 734 001. Tel: (0353) - 6453474 Fax: (0353) 2545270.
* This is not an Investor Service Centre for HDFC Mutual Fund. However, this is an Official Point of acceptance for acceptance of all on-going transactions fromInstitutional Investors only i.e. broadly covering all entities other than resident /non-resident individuals. Institutional Investors are free to lodge their applicationsat any other official point of acceptance also.
**Official points of acceptance of transactions for schemes of HDFC Mutual Fundexcept purchase transactions of Liquid Schemes / Plans viz. HDFC Liquid Fund,HDFC Liquid Fund - Premium Plan and Premium Plus Plan and HDFC CashManagement Fund - Savings Plan & Call Plan.
RReeggiisstteerreedd OOffffiiccee:: Ramon House, 3rd Floor, H.T. Parekh Marg, 169, Backbay Reclamation, Churchgate, Mumbai 400 020.RRiisskk FFaaccttoorrss:: Mutual Funds and securities investments are subject to market risks and there can be no assurance or guarantee that the Scheme’s objective will be achieved and the NAV of the Schemes may go up or down depending upon thefactors and forces affecting the securities market. Past performance of the Sponsors and their affiliates / AMC / Mutual Fund and its Scheme(s) do not indicate the future performance of the Scheme(s) of the Mutual Fund. IInnvveessttoorrss iinn tthheeSScchheemmee((ss)) aarree nnoott bbeeiinngg ooffffeerreedd aannyy gguuaarraanntteeeedd//aassssuurreedd rreettuurrnnss.. The names of the Scheme(s) do not in any manner indicate either the quality of the Scheme(s) or their future prospects and returns. Please read the respective Scheme InformationDocument(s) and Statement of Additional Information carefully before investing. Each investor should before investing in the Scheme(s) make his/her own investigation and seek appropriate professional advice. Applications would be accept-ed at Investor Service Centres (ISCs) and on-going Redemptions ((ssuubbjjeecctt ttoo ccoommpplleettiioonn ooff LLoocckk--iinn--PPeerriioodd,, iiff aannyy)) can be made at the ISCs on all Business Days. The AMC will calculate and publish NAVs on all Business Days. This monthly newslet-ter contains unaudited figures. SSttaattuuttoorryy DDeettaaiillss:: HDFC Mutual Fund has been set up as a trust sponsored by Housing Development Finance Corporation Limited and Standard Life Investments Limited (liability restricted to their contribution ofRs 1 lakh each to the corpus) with HDFC Trustee Company Limited as the Trustee (Trustee under the Indian Trusts Act, 1882) and with HDFC Asset Management Company Limited as the Investment Manager.
For any query or suggestions:-
Investors may contact us at: [email protected]
Distributors may contact us at: [email protected]
SMS: HDFCMF to 56767
Published and printed by Shailendra Sharad Kalelkar for and on behalf of Business Standard Limited from H4, Paragon Condominium, Opposite Century Mills, P B Marg, Worli, Mumbai 400013, and printed at Print House India Private Limited, 6, Datta Mandir Road, Bhandup (W), Mumbai 400 078. Editor: Rajiv Shirali.
Telephone Services
Visit us at www.hdfcfund.com
hdfc-bk.qxd 11/7/2009 5:17 PM Page 2