october 2002 demand forecasting done right - k2b · demand forecasting done right ... often the...
TRANSCRIPT

October 2002
Demand ForecastingDone Right
O C T O B E R 2 0 0 2
Demand Forecasting Done Right
Manufacturers are embarking on POS and RFID projects
to factor in consumer demand. But first they must unify
internal demand forecasts, hone POS accuracy, and tighten
distribution links.
M A R K E T O V E RV I E W• Shorter product life cycles and fresher consumption data
are forcing firms to revisit current demand managementpractices.
• But firms struggle with store-level consumption signalaccuracy and widespread use.
A N A LY S I S• Firms must first clean up messy internal demand practices.• Firms should expect consumption-driven production to be
only a pilot.
W H AT I T M E A N S• CPFR becomes irrelevant.
R E L AT E D M AT E R I A L
G R A P E V I N E
E N D N OT E S11
10
9
8
3
2
By Navi Radjou
With Stacie S. Kilgore
Laurie M. Orlov
Marli Porth
Ryan Hudson
© 2002, Forrester Research, Inc. All rights reserved. Forrester, Forrester eResearch, Forrester Wave, WholeView, Technographics,TechStrategy, and TechRankings are trademarks of Forrester Research, Inc. All other trademarks are the property of their respectivecompanies. Forrester clients may make one attributed copy or slide of each figure contained herein. Additional reproduction is strictlyprohibited. For additional reproduction rights and usage information, go to www.forrester.com. Information is based on best availableresources. Opinions reflect judgment at the time and are subject to change.
Headquarters
Forrester Research, Inc.
400 Technology Square
Cambridge, MA 02139
USA
+1 617/613-6000
Fax: +1 617/613-5000
www.forrester.com
The TechStrategyTM Report
M A R K E T O V E R V I E W
DEMAND-MANAGEMENT TUNING EXERCISE MEETS LIMITED SUCCESSForrester recently surveyed 18 experts in distribution, retail, and manufacturing tounderstand their practices for managing demand information. Facing increasing uncertaintyand inventory write-offs, our respondents told us they’re focused on improving demandforecasting and distribution strategies. Why now? Firms are driven as a result of:
• Readily available point-of-consumption signals. Manufacturers are increasinglyapprised of retail-store-level consumption -- through retail link, Wal-Mart nowmakes store-level data available to suppliers every 15 minutes. By regularlyreceiving this store-level demand, firms like Black & Decker can positioninventory regionally to meet real demand. The University of Tennessee estimatesthat manufacturers can eliminate 40% of the inventory they currently hold.1
• Shorter product life cycles. Procter & Gamble now offers 46 different types ofTide, while the average CPG firm now introduces 70 to 80 new products everyyear. With short product life cycles no longer limited to the high-tech industry,traditional make-to-stock firms like Kimberly-Clark must adjust production andinventory levels on the fly for all existing and new products -- or face excessinventory and lost sales. But to do so, these firms must shorten typical quarterlyplanned forecasting cycles to weeks to reduce error and improve asset use.
• More flexible manufacturing. Firms like Delphi and POSCO have redesignedtheir manufacturing facilities to handle shorter production runs and quickerchangeover -- enabling them to respond faster to demand changes (see the May 2002Forrester Report “The X Internet Makes Manufacturing Flexible”).2 As a result,firms like TRW Automotive want to trim forecasting horizons and manufacturingplanning cycles -- rather than producing well in advance of consumption.
But Existing Demand Practices Fail To Deliver . . . Firms’ efforts to improve demand management by replacing historical-data-basedforecasts with actual consumption signals are stymied by their existing processes since:
• Building forecast consensus is time-consuming. To agree on a forecast, firmsmust reach a consensus across sales, marketing, production, and finance -- a taskthat’s not easy when each group has its own objectives and demand streams, makingunification a battle each time. One CPG firm told us it takes them five days oflong meetings to agree on a forecast across the organization. The problem? They begin this cycle again each week.
2
OCTOBER 2002 © 2002, Forrester Research, Inc. Reproduction Prohibited
Demand Forecasting Done RightM A R K E T O V E R V I E W
• VMI doesn’t get to the point of consumption. While VMI signals arecompletely accurate, they don’t get firms much closer to the point of consumptionthan ASNs do. Instead, most VMI initiatives plan off consumption that occurs atthe regional distribution center -- not the local stores. This often results in hugediscrepancies between actual consumption timing and replenishment orders.
. . . And Technologies For Capturing Consumption Are ImmatureWhile manufacturers are eagerly piloting new technologies to build a true picture ofconsumption, these technologies are still immature and ineffective. In particular:
• Legacy point-of-sale (POS) systems generate inaccurate data. POS data is historically 6% wrong. Why? Scan-based errors and theft contribute to aninaccurate picture of merchandise availability, sales, and promotion trends.3 Forexample, when a consumer buys eight different types of Campbell’s soup in a singlepurchase, often the cashier rings up all eight cans as the same item -- even if theconsumer purchased chicken noodle and tomato rice (see the November 2001Forrester Report “Picking A POS System”).4
• RFID is an experiment at best. While RFID promises to help CPG and retailclients, it’s not yet ready for item-level tracking (see the August 2002 ForresterReport “RFID: The Smart Product (R)evolution”).5 Why? Low-cost tags are justnow in their first production run, and industrialized scanners and antennas are stillin test mode. With these issues to work out, most firms are experimenting withlimited pilots and locations -- making incorporation of this consumption data intoa meaningful forecast impossible today.
A N A L Y S I S
FIRMS NEED A PRAGMATIC APPROACH FOR FORECASTING DEMANDAccess to accurate real-time consumption data in theory would let manufacturerseliminate inventory stockpiles, tuning production to fluctuating consumer demand. But this pipe dream is far from a reality. Until store-level consumption signals like RFID initiatives and POS upgrades improve beyond pilots, firms must take a pragmaticapproach to demand forecasting by executing three steps (see Figure 1):
3
© 2002, Forrester Research, Inc. Reproduction Prohibited OCTOBER 2002
Demand Forecasting Done RightA N A L Y S I S
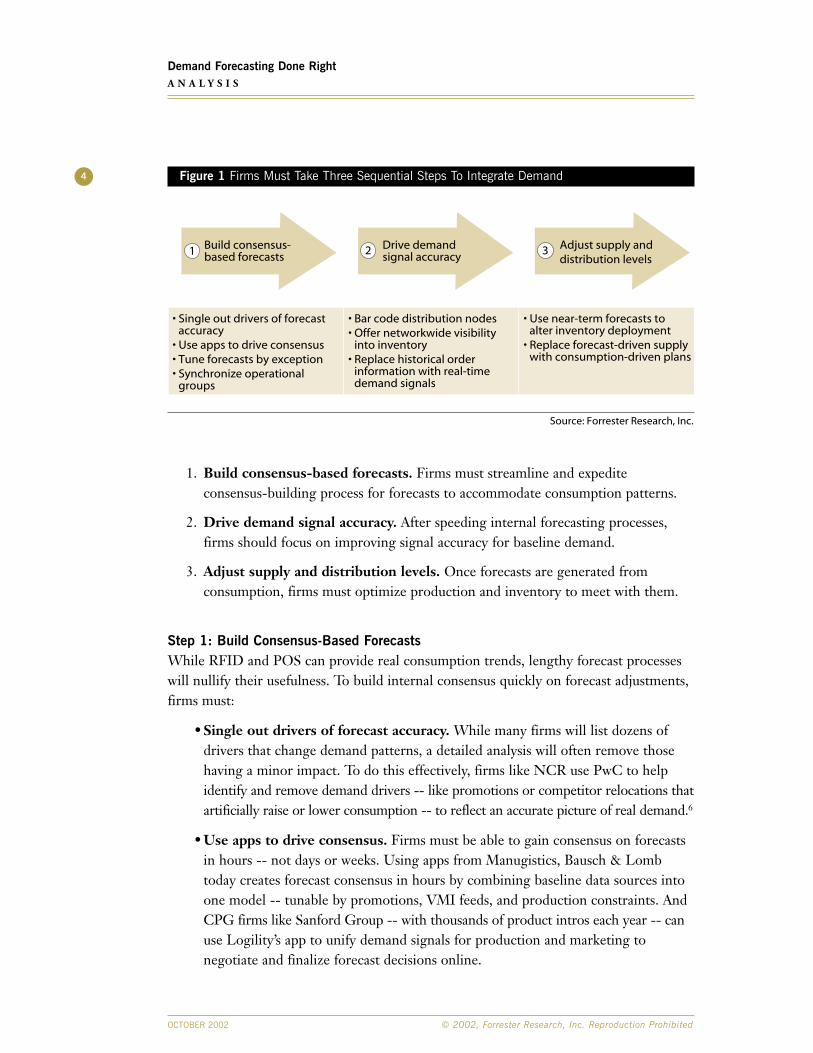
Figure 1 Firms Must Take Three Sequential Steps To Integrate Demand
1. Build consensus-based forecasts. Firms must streamline and expediteconsensus-building process for forecasts to accommodate consumption patterns.
2. Drive demand signal accuracy. After speeding internal forecasting processes, firms should focus on improving signal accuracy for baseline demand.
3. Adjust supply and distribution levels. Once forecasts are generated fromconsumption, firms must optimize production and inventory to meet with them.
Step 1: Build Consensus-Based ForecastsWhile RFID and POS can provide real consumption trends, lengthy forecast processeswill nullify their usefulness. To build internal consensus quickly on forecast adjustments,firms must:
• Single out drivers of forecast accuracy. While many firms will list dozens ofdrivers that change demand patterns, a detailed analysis will often remove thosehaving a minor impact. To do this effectively, firms like NCR use PwC to helpidentify and remove demand drivers -- like promotions or competitor relocations thatartificially raise or lower consumption -- to reflect an accurate picture of real demand.6
• Use apps to drive consensus. Firms must be able to gain consensus on forecastsin hours -- not days or weeks. Using apps from Manugistics, Bausch & Lombtoday creates forecast consensus in hours by combining baseline data sources intoone model -- tunable by promotions, VMI feeds, and production constraints. AndCPG firms like Sanford Group -- with thousands of product intros each year -- canuse Logility’s app to unify demand signals for production and marketing tonegotiate and finalize forecast decisions online.
4
OCTOBER 2002 © 2002, Forrester Research, Inc. Reproduction Prohibited
Demand Forecasting Done RightA N A L Y S I S
Source: Forrester Research, Inc.
Build consensus-based forecasts
Drive demandsignal accuracy
Adjust supply anddistribution levels
1 2 3
• Single out drivers of forecastaccuracy
• Use apps to drive consensus• Tune forecasts by exception• Synchronize operational
groups
• Use near-term forecasts toalter inventory deployment
• Replace forecast-driven supplywith consumption-driven plans
• Bar code distribution nodes• Offer networkwide visibility
into inventory• Replace historical order
information with real-timedemand signals
• Tune forecasts by exception. Firms need collaborative tools that track relevantchanges in demand patterns, signals, and drivers. So rather than routinely replanningeach week, firms like Whirlpool can use Oracle’s multidimensional app to gainvisibility and reforecast on an exception basis -- like when the difference betweenthe forecast and actual demand exceeds a certain percent. And firms like Unilevercan tap SAP tools that mine actual sales data to warn marketing of significantforecast variations for an individual brand.
• Synchronize operational groups. New consensus processes won’t work ifdepartments are out of sync. One CPG firm implemented consensus forecasting,but finance overrode it to meet its own goals, reducing accuracy by 30%. To keepbusiness units from focusing on their individual metrics, firms like Minor HealthProducts use i2’s Demand Planner to benchmark key metrics against “best-practice”workflows. This ensures that their consensus forecast becomes operational realityfor operations, finance, and sales.
Step 2: Drive Demand Signal AccuracyFirms can’t migrate from a forecast-based to consumption-driven supply network untilthey can rely on accurate demand signals. Since POS data is often inaccurate, firms mustfirst gain demand visibility at upstream distribution nodes in the supply chain. How?
• Bar code distribution nodes. CPG firms like P&G want to use real-timedemand data to shrink production-to-consumption cycles to less than a week. Butbefore RFID-tagging every physical asset in their supply networks, firms shouldtackle the basics of bar coding at DCs and regional centers -- using receiving anddelivery data at regional DCs and cross-docks until accuracy improves. Firms thathave invested in warehouse management apps from vendors like EXE can usewireless bar coding technologies -- and later transition to RFID without a systemoverhaul.
• Offer networkwide visibility into inventory. Once firms begin collecting actualdemand data, they need to expose it to brand, production, and inventory managersto adjust forecasts and drive replenishment. Using an adaptive logistics management(ALM) app from WorldChain or Savi Technology, firms can use both static andin-transit inventory data to feed daily forecasts (see the July 2002 Forrester Report“Grading Apps For Inventory And Order Visibility”).7 One MRO supplier wasable to feed inventory receipts into forecasts and adjust replenishment needs daily --shortening its forecasting horizon from eight to two weeks.
• Replace historical order information with real-time demand signals. Fashionretailers like Gap struggle to get the right inventory on store shelves because currentand past sales data sit in different systems -- making it impossible to form a true
5
© 2002, Forrester Research, Inc. Reproduction Prohibited OCTOBER 2002
Demand Forecasting Done RightA N A L Y S I S

picture of changing demand. But European clothing retailer Zara -- which introducesmore than 10,000 new SKUs each year -- uses a wireless system to place orders fromthe store floors directly to the plant floor.8
Step 3: Adjust Supply And Distribution LevelsOnce baseline forecasts embrace real-time demand, firms must use those consumption-driven forecasts to shape inventory and production decisions. Firms should:
• Use near-term forecasts to alter inventory deployment. Firms can’t driveproduction directly from consumption data -- long production lead times depend on forecasts. Instead, firms should emulate Kimberly-Clark, which is using DC-based consumption-driven forecasts to alter inventory placement -- moving a shipment of shampoo from one regional DC to another to take advantage of a successful weekend promotion. While underlying data feeds will have someerrors, inventory movement will lower overall supply chain costs.
• Replace forecast-driven supply with consumption-driven plans. Starting in2003 as manufacturing becomes more flexible, firms can pilot consumption-drivenproduction instead of building inventories. First, with VMI orders of short-cyclere-occurring goods, manufacturers like HP can link specific orders to productionchangeover and ship product from the production line to retailer stores directly(see the February 22, 2002 Forrester Brief “Executive Overview: Adaptive SupplyNetworks”).9
WHERE TO LOOK FOR HELPRestructuring entire supply and demand processes and experimenting with newtechnology will push firms to seek help from (see Figure 2):
• Sales and operations planning (S&OP) consultants. Firms need key partners,like IBM Global Services, Accenture, and Kurt Salmon Associates, that can developan overall strategy for their entire supply-demand process change. These firms notonly have experience with industry-specific implementations of consensus forecasting,supply planning, and forecast normalization, but they also have benchmarks andwell-defined KPIs that let firms quantify their success.
• Demand management vendors. In addition to process change, many firms willneed new collaborative forecasting engines that let them bring in forecast datafrom different sources -- like stores, accounts, or DCs -- and view by formats likestore-level, brand, or monthly account status. Likely candidates? i2 Technologies,Logility, Mercia Software, Manugistics, and Prescient Systems.
6
OCTOBER 2002 © 2002, Forrester Research, Inc. Reproduction Prohibited
Demand Forecasting Done RightA N A L Y S I S

Figure 2 Vendors Can Help Firms Overhaul Demand Forecasting
• RFID and POS data mining technologists. As firms begin to experiment withreal-time consumption data, they’ll need analytic apps from vendors like Teradataor SAS Institute or agent-based solutions like SAP’s Inventory Early WarningAgent. These tools can quickly convert petabytes of real-time RFID and POS datainto aggregate-level demand signals that offer users insights into actual customerbehavior and inventory positions (see the May 6, 2002 Forrester Brief “RFIDRedefines The Retail Supply Chain”).10
7
© 2002, Forrester Research, Inc. Reproduction Prohibited OCTOBER 2002
Demand Forecasting Done RightA N A L Y S I S
Source: Forrester Research, Inc.
Category Capabilities Example vendors
Sales/operations
• Industry-specific process/methodology• Benchmark of KPIs• Alignment of practice with
consumption-basedtechnology
Demandmanagementvendors
• Multidimensional planning• Forecast personalization• Support for new-product life cycles
RFID
AccentureInforteIBM Global ServicesKurt Salmon Associates
i2 TechnologiesLogilityManugisticsMercia SoftwareNONSTOP SolutionsOracle
AdexaSavi TechnologySAP (Inventory EarlyWarning Agent)Teradata
• RFID and POS support• Analysis and data
PipeChainPrescient SystemsRetekSupplyChaingeSyncra SystemsWorldChain
W H A T I T M E A N S
Inventory planning apps become more dynamic.Renewed interest in forecasting and shortening the cycle will have a huge impact on inventory applications. In the past, firms have bought DRP systemsfrom vendors like Manugistics that support static replenishment -- so min/maxboundaries are set once, and when inventory falls below the minimum level, it is replenished. In the future, as forecasts are updated by exception, inventoryplanning apps from vendors like NONSTOP Solutions and Retek willdynamically set replenishment levels to reflect changes in consumption trends.The overall impact? Inventory turns improve by 30%.
Consumption-based demand management stifles CPFR.As firms continue to improve internal forecasting consensus processes andinternal business group collaboration, they will de-emphasize CPFR initiatives --which are still mostly pilot projects today. As manufacturers improve internalcycles, replace distribution with store-level demand data, and drive productiondirectly from consumption, the need to share and agree upon forecasts withcustomers will be unnecessary. As a result, retail customers will shelve CPFRprojects and instead invest the money in RFID and flexible manufacturing apps.
8
OCTOBER 2002 © 2002, Forrester Research, Inc. Reproduction Prohibited
Demand Forecasting Done RightW H A T I T M E A N S
R E L A T E D M A T E R I A L
Companies Interviewed For This Report
Related Research
August 2002 Forrester Report “RFID: The Smart Product (R)evolution”July 2002 Forrester Report “Grading Apps For Inventory And Order Visibility”May 6, 2002 Forrester Brief “RFID Redefines The Retail Supply Chain”May 2002 Forrester Report “The X Internet Makes Manufacturing Flexible”February 22, 2002 Forrester Brief “Executive Overview: Adaptive Supply Networks”November 2001 Forrester Report “Picking A POS System”
Cott Corp. www.cott.comi2 Technologies www.i2.comIBM Global Serviceswww.ibm.com/servicesInfortewww.inforte.comK2Bwww.k2b.netKimberly-Clarkwww.kimberly-clark.comLogilitywww.logility.comManugistics www.manu.comMercia Softwarewww.mercia.com
Miller Brewing Companywww.millerbrewing.comNONSTOP Solutionswww.nonstop.comOraclewww.oracle.comPrescient Systemswww.prescientsystems.comRetekwww.retek.comSAPwww.sap.comSavi Technologywww.savi.comSyncra Systemswww.syncra.comUnilever www.unilever.com
9
© 2002, Forrester Research, Inc. Reproduction Prohibited OCTOBER 2002
Demand Forecasting Done RightR E L A T E D M A T E R I A L
G R A P E V I N E
Making sure Sally gets that Mustang.The benefits of demand management don’t stop with supply chain and logistics. Forresterrecently spoke with Trilogy, a vendor of customer-facing apps that handle sales, marketing,and service. Trilogy customer Ford Motor Company has a nifty search feature on its sitethat lets potential buyers find the vehicle model and color they want at a convenientdealership; if you want a green Explorer, you’ll find the closest one available. Demand forgreen Explorers goes back to Ford folks in both manufacturing and marketing -- enablingcorrect inventory stocks but also showcasing searched terms for future marketingstrategies. If candy-apple-red Mustangs are a hot search ticket, Ford’s marketing gurushave their next campaign theme ready to go.
……
Forecast errors are okay . . . really.According to a conversation with Inforte, one of the reasons that CRM hasn’t yieldedbenefit is that it doesn’t solve the problems of the future. The goal is not to achieve zeroerror but to achieve a consistent error every time so you can predict it. If you are always30% wrong with the forecast, then you can be 100% right because you can adjust.Sounds like fuzzy math, but it makes sense to us.
……
It’s a good thing sales and marketing aren’t in charge of chemicals.Manugistics told us about a personal-care products company that tried using differentkinds of histories to come up with a unified forecast. By using one history stream, eachgroup created a forecast and looked at which one was the closest. The core operationsgroup tended to be the most accurate; marketing and sales the least . . . and when theywere wrong, they were highly inaccurate. At least they were forecasting sales volumesand not volumes of peroxide to add to lens solution.
10
OCTOBER 2002 © 2002, Forrester Research, Inc. Reproduction Prohibited
Demand Forecasting Done RightG R A P E V I N E
E N D N O T E S1 Kahn, Kenneth B. and John T. Mentzer, “EDI and EDI Alliances: Implications for the Sales
Forecasting Function,” Journal of Marketing Theory and Practice, (No. 2, 1996), pp. 72-78.
2 Delphi’s Oak-Creek (WI) plant has curbed its order-to-delivery cycle from 21 days to four days,whereas POSCO can today promise a two-week delivery window -- a record within the steelindustry. Both companies heavily leverage X Internet technologies like RFID and sensor-enabledshop-floor equipment to make their manufacturing flexible.
3 One CPG firm was experiencing a 50% theft rate of its top seller in a retail chain, meaning on-hand retailer inventory doesn’t match projected inventory half of the time.
4 POS terminals have been optimized for a single purpose -- processing a transaction -- but retailtoday requires more than current POS systems deliver. They’re isolated, expensive to maintain, and can’t be upgraded to meet the increasingly sophisticated needs of retailers.
5 RFID is today what the bar code was in the early 70s -- a promising technology with narrow exposure.At present, RFID is limited to a handful of pilots and an even smaller number of full-blowndeployments -- amounting to around 1 million tagged objects in the CPG industry. But just as ittook only three key events to drive the worldwide adoption of the bar code, it will take only a fewdrivers -- occurring in 2003 and 2004 -- to ignite RFID expansion.
6 PwC Consulting was acquired October 2, 2002 by IBM for approximately $3.5 billion in cash andstock, creating IBM Business Consulting Services, which is a part of IBM Global Services.
7 ALM apps help firms: 1) sense and interpret, by providing visibility into shared processes; 2) decideand act, by aggregating, syndicating, and transacting data across multiple firms; and 3) learn andtransform, by recommending corrective action and redirecting resources.
8 Helft, Miguel, “Fashion Fast Forward,” Business 2.0, May 2002. The firm has tripled profits overthe past three years by producing to order.
9 Growing uncertainty and variability in supply and demand will drive firms to migrate their staticsupply chains to adaptive supply networks, which are event-driven, real-world aware, and self-regulating.
10 Because of cross-border tracking issues, Europe has been more aggressive in piloting RFID, but it looks attractive to retailers in the US because of its declining costs and increasing competitivepressure.
11
© 2002, Forrester Research, Inc. Reproduction Prohibited OCTOBER 2002
Demand Forecasting Done RightE N D N O T E S

Upcom
ing E
vents
ww
w.f
orr
este
r.com
Whole
Vie
w™
Forrester Events
Technographics® Travel WorkshopOnline Travel: Outlook For 2003
San Francisco, Calif.November 12, 2002
Consumer Forum EuropeEngaging Consumers With Technology
LondonNovember 25-26, 2002
Web Site Review Boot CampHow To Evaluate And Fix Your Web Site
Cambridge, Mass.December 3-4, 2002
AutomotiveDistribution, Suppliers, Retail
Consumer Devices &ServicesBroadband, Consumer Electronics, Devices, PCs, Mobile Devices, PCs & Peripherals
Consumer PackagedGoodsMerchandising, Distributors, Logistics, Retail
Content ManagementWeb Content, Enterprise Content, Digital Assets, Digital Asset Management, Document Management
Customer Relationship ManagementSales, Marketing, & Service, Call Centers, Email, Email Management
Enterprise ApplicationsERP, Enterprise Services Automation, B2B Sell-Side, MRP
Financial ServicesBanking, Insurance, Investment, Credit
HealthcareHealth Plans, Pharmaceuticals, Healthcare Providers, Biotechnology
InfrastructurePortals, Servers, Corporate Wireless, Storage, Tools
Integration & Web ServicesMiddleware, EAI/B2B Integration Tools
Manufacturing & B2BCollaboration, Trade Forecasts, Energy, Chemicals, New Business Models
Marketing Branding, Promotion, Cross-Media Marketing, Advertising
Media & EntertainmentPublishing, Television, Music, Content Syndication
Networks & Security Enterprise Network Management, Equipment, Services
Procurement & Sourcing Purchasing, Supplier Management, Marketplaces, Direct/Indirect Purchasing
RetailManufacturers, Retailers, Channels, Operations
ServicesASPs, Hosting, Outsourcing, Systems Integrators
Site Technology & Design Site Design, Commerce Platforms, Measurement, User Experience
Supply Chain Planning & Execution, Logistics,Product Design, Distribution
Technology Leadership Budgeting, Organization, Staffing, Partnerships
TelecomTelecom Services, Mobile Services, Carrier Strategy, Communications Infrastructure
TravelAirlines, Hotels, Business & Leisure Travel, Travel Agencies, Rental Cars
Forrester’s WholeViewTM Research provides clients with unified guidance on customer trends,
business strategy, and technology investments through Technographics®, TechStrategyTM, and
TechRankingsTM. WholeView Research drills down into the most important details of an issue
while maintaining a holistic perspective of the impact of technology change on business.
Forrester also offers Events and Strategic Services that further enhance the WholeView. Each
Event provides new ideas, clear direction, and innovative strategies with a WholeView perspective.
Strategic Services deliver custom guidance for the complex business decisions that drive your
company’s success.