oct. 3, 2013 special report education understanding ... · illinois policy institute special report...
TRANSCRIPT

ILLINOIS POLICY INSTITUTE
SPECIAL REPORT
Understanding Illinois’ broken education funding system: a primer on General State Aid
EDUCATION
OCT. 3, 2013
By Ted Dabrowski, Vice President of Policy | Josh Dwyer, Director of Education Reform | John Klingner, Policy Research Analyst
Additional resources: illinoispolicy.org190 S. LaSalle St., Suite 1630, Chicago, IL 60603 | 312.346.5700 | 802 S. 2nd St., Springfield, IL 62704 | 217.528.8800

The problem................................................................................................................................................................................................ 3
Overview of Illinois’ education budget......................................................................................................................................................... 5
Education spending is on the rise..................................................................................................................................................................... 5Distribution of state funds................................................................................................................................................................................... 6State spending breakdown................................................................................................................................................................................ 7
Understanding General State Aid (GSA)..................................................................................................................................................... 8
Formula Grant........................................................................................................................................................................................................ 8Poverty Grant......................................................................................................................................................................................................... 9General State Aid funds combined................................................................................................................................................................... 9
General State Aid subsidies............................................................................................................................................................................ 11
Lower-reported property wealth equals extra subsidies............................................................................................................................. 11An increase in poverty count means a larger grant...................................................................................................................................... 11Chicago GSA funding grows five times faster than downstate................................................................................................................ 11
Property Tax Extension Limitation Law (PTELL) subsidy..................................................................................................................... 12
Introduction of property tax caps.................................................................................................................................................................... 12Property Tax Extension Limitation Law adjustment...................................................................................................................................... 12Why the Property Tax Extension Limitation Law adjustment is harmful................................................................................................... 13
Tax Increment Financing (TIF) subsidies................................................................................................................................................... 16
Special tax zones and their effect on General State Aid............................................................................................................................ 16Why Tax Increment Financing subsidies are harmful................................................................................................................................... 17
Poverty Grant..................................................................................................................................................................................................... 19
Changes in the Poverty Grant formula........................................................................................................................................................... 19The low-income student boom................................................................................................................................................................... 19As low-income population grows, poverty funding grows exponentially........................................................................................... 19
The boom in Poverty Grant spending............................................................................................................................................................. 20The Poverty Grant’s flaws................................................................................................................................................................................. 21
The solution.............................................................................................................................................................................................. 23
Why it works.............................................................................................................................................................................................. 23
Appendix....................................................................................................................................................................................................... 24
1. State, local and federal resources for elementary and secondary education, fiscal years 1993-2012..................... 24
2. State General State Aid methodology.................................................................................................................................................. 25
Calculation of General State Aid.................................................................................................................................................................... 25Property Tax Extension Limitation Law methodology.................................................................................................................................. 26Poverty Grant methodology.............................................................................................................................................................................. 27
3. State aid to Chicago under different subsidy scenarios............................................................................................................... 28
3.1 Chicago fiscal year 2013 General State Aid entitlement................................................................................................................... 303.2 Chicago fiscal year 2013 General State Aid entitlement without Property Tax Extension Limitation Law adjustment.......... 313.3 Chicago fiscal year 2013 General State Aid entitlement with Property Tax Extension Limitation Law adjustment and Tax Increment Financing property value included...............................................................................................................................................323.4 Chicago fiscal year 2013 General State Aid entitlement without Property Tax Extension Limitation Law adjustment and Tax Increment Financing property value include..................................................................................................................................................33
Endnotes........................................................................................................................................................................................................34

illinoispolicy | 3
The problem
The focus of Illinois’ current education funding system is not what’s best for students – it’s who controls the flow and distribution of taxpayer money.
Nowhere is this more evident than in the state’s General State Aid, or GSA, for education Illinois’ largest single education appropriation for K-12 education.
Originally intended to support the state’s neediest school districts, the $4.8 billion GSA has become, in a single decade, a twisted mess of formulas that provide large, special subsidies to a few select districts.1
Because of changes to GSA formulas, billions of dollars in special subsidies are flowing to Chicago and districts in Cook County and its collar counties.
As recently as 2000, the vast majority of GSA funds were distributed to school districts that demonstrated need. Nearly 90 percent of aid went to districts that lacked the local funds to meet the state’s minimum funding standards.2
Graphic 1. Funding for needy school districts dramatically reduced Distribution of General State Aid funds* (in billions of $)
11%
89%
Fiscal year 2000Total $2.96B
Need-based $2.62B
Other $0.34B
48%
52%Fiscal year 2013
Total $4.78BNeed-based $2.51BOther $2.28B
*Total net claim before adjustments Source: Illinois State Board of Education
Today, all that has changed. Only half of every GSA dollar goes to districts that demonstrate need.
This dramatic drop is the result of gamed and degraded funding formulas that have created new winners and unwitting losers as the state’s education bureaucrats fight for control over money.
To appreciate who’s winning, it’s important to understand the two main factors that determine where GSA money goes: the amount of property wealth and the number of low-income children each district has.
Property wealth
The amount of property wealth in each school district determines the amount of taxes it can raise locally to finance its education needs. The less property wealth a district has, the more state funds it receives.
Take, for example, East St. Louis School District 189. It receives more than 70 percent of its funding from the state because it lacks adequate property wealth. On the other hand, New Trier School District 203, a property-wealthy district, receives only 3 percent of its funding from the state.3
But laws created in 2000 allowed some districts the opportunity to receive more GSA funding than they otherwise would. The laws allow a district, under certain conditions, to underreport the true amount of its property wealth. Lower property wealth means more GSA subsidies.
The problem is only a few districts can actually benefit from the law to receive more funds.
Since 2000, those changes have sent more than $6.4 billion in extra funding to the few districts that can take advantage of the law.
In 2013 alone, GSA will dole out more than $500 million of such subsidies, with just 40 districts – all of them in Cook County and the collar counties – grabbing almost the entire subsidy. Chicago’s take is more than $280 million. In contrast, downstate districts receive just 3 percent of the total subsidies.
Low-income population
The second major factor driving the flow of GSA funds is the number of low-income children located in a district. The more low-income students a district has, the more state funds it receives, regardless of the district’s ability to pay for education.
In 2000, the amount of GSA funds dedicated to support low-income children was just less than $300 million, or 10 percent of the total GSA. Today, support for low-income students has skyrocketed to $1.8 billion, or 37 percent of GSA.
Much like the previous case, GSA formulas were altered, dramatically increasing the number of children who are considered low-income.

illinoispolicy | 4
These formula changes caused nearly all of Chicago and Rockford’s student populations to be considered low-income. In 2000, 44 percent of students were considered poor in Chicago. Today that number exceeds 90 percent.
The low-income populations in Cook County, excluding Chicago, and the collar counties have increased more than 600 percent as a result of the changed methodology. That’s driven increases in low-income funding to those regions at an extraordinary rate of more than 30 percent a year since 2000.
Meanwhile, low-income funding for downstate districts has grown at less than half the rate of Cook County and the collar counties.
Losing districts
Not every district receives subsides from changes made to education-funding laws.
Needy districts, such as Petersburg’s Porta Community School District 202, which rely heavily on state funding, do not benefit from subsidies related to property wealth and low-income populations.
Comparing Petersburg’s Porta Community School District 202 to Chicago School District 299 reveals the kind of funding disparities that are created by the current funding laws. Chicago receives more than $800 per student in subsidies related to changes in reporting property wealth. School District 202 receives no such subsidies.4
In addition, Chicago receives more than $2,500 in subsidies for every low-income student it has, while School District 202 receives only a quarter of that amount.
This isn’t uncommon for downstate districts. These districts can’t benefit from the formula changes in the same way Chicago, Cook County and its collar counties can.
The way forward
A system that benefits a few districts at the expense of all others can never work. And neither can a system in which the politically powerful control the flow and distribution of education dollars.
That’s why solving this problem isn’t about tweaking the formulas and making fixes so that political power can be equalized. To fix Illinois’ broken education system, control over the flow and distribution of money needs to be taken away from politicians and given back to parents.
As long as bureaucrats control the system, it won’t be about accountability or children – it will be about dollars and who gets them.

illinoispolicy | 5
Education spending is on the rise
Over the past two decades, education spending in Illinois has grown at a rapid pace. Since fiscal year 1993, state, local and federal spending has grown by nearly 200 percent, reaching $28.7 billion in fiscal year 2012 (see Appendix 1).5 When adjusted for inflation, education funding grew by more than 73 percent during that period.
Education’s three main funding sources have all contributed to the growth in funding since 1993:6
• Federal funding has grown 4.1 times to $3.6 billion.
• State funding has grown 2.7 times to $9.3 billion.
• Local spending has grown 2.6 times to $15.8 billion.
Overview of Illinois’ education budget
Total per-student spending is now at $13,748 – a 148 percent increase over the past 20 years. It has grown at an average rate of nearly 5 percent a year – faster than the 3.5 percent average annual inflation rate over the same time period.7
In 2011, Illinois had the 21st-highest per student spending in the nation.8
0
$3,000
$6,000
$9,000
$12,000
$15,000
2012201020082006200420022000199819961994
-2
0
2
4
6
8
10
2012201020082006200420022000199819961994
3.5% inflation avg.
Growth (%)
Graphic 2. Nominal Illinois per student funding has increased 148 percent over the last 20 years Fiscal years 1993-2012Local, state and federal funds
Note: Number of students based on total enrollment Source: Illinois State Board of Education
Graphic 3. Nominal Illinois per student funding growth averaged nearly 5 percent annually Fiscal years 1993-2012
Local, state and federal funds
Note: Number of students based on total enrollment Source: Illinois State Board of Education

illinoispolicy | 6
As Illinois dedicates increasingly more resources to education, it’s important to understand how these funds are distributed.
Distribution of state funds
The state has 862 school districts with varying amounts of local resources available to fund education. These districts
Table 1. Basic Illinois school district data Fiscal year 2013
Region Number of districts Number of students Percent of total studentsChicago 1 349,470 18.4Other Cook 143 355,884 18.7Collar 143 547,141 28.8Downstate 575 647,278 34.1Total: 862 1,899,773 100
are typically divided into four key geographic areas: Chicago; Other (suburban) Cook County; the collar counties (DuPage, Kane, Lake, McHenry and Will counties); and downstate.9
Note: Number of students based on Average Daily Attendance Source: Illinois State Board of Education
Critics of Illinois’ education funding system often claim that school districts depend too much on local tax dollars to finance education. But the reality is districts unable to adequately fund education through local resources receive significant financial support from federal and state sources.
The amount of property wealth in each school district determines the amount of taxes it can raise locally to finance its education needs. The less property wealth a district has, the more state funds it receives.
The neediest districts, then, receive a majority of funding from state and federal sources (see Graphic 4).
Graphic 4. Property-poor districts receive majority of funding from state and federal sources (Number of districts in parentheses) Fiscal year 2011
0
$200,000
$400,000
$600,000
$800,000
$1,000,000
$1,200,000
90-100%80-90%70-80%60-70%50-60%40-50%30-40%20-30%10-20%0-10%
(54)
(157)
(103) (111) (124) (111)(106) (78) (18) (1)Av
erage
prop
erty w
ealth
per s
tuden
t
Source: Illinois State Board of Education
In contrast, wealthier school districts receive much less. The 211 districts that have the capacity to fund the majority of their education through local means, as measured by the amount of property wealth available, receive less than 20 percent of their funding from state and federal sources.10
For example, East St. Louis School District 189, one of the most property-poor districts in the state, receives 93 percent of its funding from federal (23 percent) and state (70 percent) sources. On the other hand, New Trier High School District 203, one of the state’s most property-rich districts, receives only 4.5 percent of its funding from federal (1.2 percent) and state (3.3 percent) governments.
Percent funding from state and federal sources

illinoispolicy | 7
But Graphic 4 does not tell how the distribution of GSA funds has changed over time, or which districts are benefiting from changes in education-funding laws.
State spending breakdown
State spending makes up nearly a third of Illinois’ total expenditure on education.
In addition to General State Aid, or GSA – the state’s largest single appropriation for education – other state funds provide support in the form of grants for special education, transportation, orphanage tuition, early childhood education and more.
The $9 billion in fiscal year 2013 state spending also includes $2.7 billion in teacher pension contributions for downstate and suburban school districts (the rising costs of pensions and its crowd-out effect on funds for operations is not discussed in this paper. For details on the issue, please see the Illinois Policy Institute’s Pensions vs. Schools series).11
Table 2. Illinois’ state government appropriations for K-12 education – fiscal year 2013 Pro-rated enacted budget
(in millions of $)
General State Aid 4,287Special education categoricals 1,523
Transportation 441Personnel reimbursements 440Children services 314Private tuition 207Orphanage tuition 111Summer school 10
Other mandated categoricals 506Early childhood education 300Regular/vocational transportation 206
Teachers' Retirement System 2,714Total state spending 9,030
Note: This is the pro-rated enacted budget for 2013. The non-prorated 2013 GSA equals $4.8 billion. In all other sections of this report, GSA numbers are not prorated. Non-prorated numbers are used to show how GSA funds would be distributed if the GSA had been fully funded. Source: ISBE fiscal year 2013 operating budget
By far, the state’s largest appropriation is GSA. At $4.29 billion in fiscal year 2013, it makes up 47 percent of total K-12 state education appropriations.12
Within GSA are two separate funding formulas: the Formula Grant and the Poverty Grant. These two formulas determine how GSA money is distributed to districts across the state.

illinoispolicy | 8
Understanding General State Aid (GSA)
Formula Grant
Not every district has the ability to pay for its own education expenses. Districts such as East St. Louis School District 189, Cicero School District 99 and Joliet School District 86 are unable to raise enough property tax revenue to meet state-mandated education funding levels.
That’s where General State Aid, or GSA, steps in.
The goal of GSA, through the Formula Grant, is to ensure that every child in the state has access to a minimal level of education dollars. To accomplish this goal, the state sets a minimum level of spending per student. This is called the Foundation Level.
For fiscal year 2013, the Foundation Level was set at $6,119 per student.13
The state distributes GSA funds according to each district’s ability to reach the Foundation Level. That ability is based on how much property value the district has within its borders and, at an assumed tax rate, how much it can generate in property tax revenues.14
If a district, such as East St. Louis or Joliet, is not fully able to generate enough local property tax revenue per student to reach the $6,119 Foundation Level, the state makes up the difference on a per-pupil basis.
The state also provides limited GSA funds even for districts that can raise more than $6,119 locally.
To determine how much each district receives, the state has separated districts into three distinct categories (see Appendix 2.1 for detailed methodology on the Foundation Level grant).
1. Foundation districts – Foundation formula districts are those that cannot raise enough local property tax revenue per student to reach the Foundation Level. These districts receive GSA funding to make up the difference between what the state assumes they can raise and the Foundation Level.15
East St. Louis School District 189 is an example of a foundation district. It disproportionately depends on the state for its funding. Since the district is only able to raise $891 per student in local property tax revenue in fiscal year 2013, it receives the $5,228 difference per student in state funding.16
2. Alternate districts – Alternate formula districts have available local tax revenue per student between 93 percent and 175 percent of the Foundation Level. These districts receive significantly less state support than foundation formula districts, between $305 to $428 per student.
3. Flat grant districts – Flat grant districts have available local tax revenue per student that is 175 percent or greater than the Foundation Level. These districts almost exclusively pay for their own education expenses through locally raised property tax revenues. These districts receive $218 per student from GSA.
New Trier High School District 203 is an example of a flat grant district. It raises $14,716 in local property taxes per student, which is more than two times the Foundation Level. It receives $218 per student from the state.17
The total amount of funds allocated by the Formula Grant portion of GSA in fiscal year 2013 totaled almost $3 billion, or nearly 63 percent of total GSA funds.18
As shown in Table 3, nearly all Formula Grant funds are distributed to the state’s foundation districts.
Table 3. Formula Grant distributionFiscal year 2013
Region Number of districts Percent of total studentsFormula Grant funds received
(in millions of $) Percent of Formula Grant fundsFoundation districts 620 71 2,781 93.5Alternate districts 170 23 171 5.7Flat grant districts 72 6 23 0.8Total: 862 100 2,975 100
Note: Number of students based on Average Daily Attendance Source: Illinois State Board of Education

illinoispolicy | 9
Poverty Grant
The second element of GSA funding involves state grants for districts with low-income children. Known as Poverty Grants, this money is provided because the state believes low-income students require more resources to educate.19
Poverty Grants are not distributed to districts based on their ability to pay for education. Instead, districts are given a certain amount of funding per low-income student based on the percentage of low-income students in the district’s total student population.
The number of low-income children is determined by the Department of Human Services (see Appendix 2.3 for detailed methodology on the Poverty Grant).
The total amount of funds allocated to the Poverty Grant in fiscal year 2013 totaled nearly $1.8 billion, or 37 percent of GSA. Almost all of the funds were destined for the state’s foundation districts.20
Table 4. Poverty Grant distributionFiscal year 2013
Region Number of districts Percent of total studentsPoverty Grant funds recieved
(in millions of $) Percent of Poverty Grant fundsFoundation districts 620 71 1,617 91.2Alternate districts 170 23 134 7.5Flat grant districts 72 6 22 1.3Total: 862 100 1,774 100
Note: Number of students based on Average Daily Attendance Source: Illinois State Board of Education
General State Aid funds combined
Table 5, which combines both the Formula and Poverty grants, shows that 93 percent of the $4.8 billion GSA was allocated to foundation districts. These districts have the largest share of
the student population, at 71 percent. The remainder went to districts that have the local means to pay for a majority of their own education expenses.21
Table 5. Most GSA funds flow to foundation districts GSA funding distribution, fiscal year 2013
Region Number of districts Percent of total studentsGSA funds received (in millions of $) Percent of total GSA funds
Foundation districts 620 71 4,398 92.6Alternate districts 170 23 305 6.4Flat grant districts 72 6 46 1.0Total: 862 100 4,749 100
Note: Number of students based on Average Daily Attendance Source: Illinois State Board of Education

illinoispolicy | 10
A look at Table 6 below shows how total GSA funds are distributed geographically. Chicago School District 299
receives the most GSA funds per student; more than $400 more per student than downstate districts receive.
Table 6. Chicago receives the most GSA funding per studentFiscal year 2013
Region Number of districts Number of studentsPercent of total
studentsGSA funds received (in millions of $)
Percent of GSA funds received
GSA funds per student ($)
Chicago 1 349,470 18.4 1,209 25.5 3,461Other Cook 143 355,884 18.7 776 16.3 2,180Collar 143 547,141 28.8 792 16.7 1,447Downstate 575 647,278 34.1 1,972 41.5 3,047Total: 862 1,899,773 100 4,749 100 2,500
Note: Number of students based on Average Daily Attendance Source: Illinois State Board of Education – 2012 Annual Report
But these numbers don’t tell the whole story. GSA contains loopholes, which create subsidies that substantially increase the amount of funding certain districts receive. For example,
Chicago School District 299, without these loopholes, would be considered an alternate district and receive far less funding (see Appendix 3.2).
illinoispolicy | 11
General State Aid subsidies
Because of changes to General State Aid, or GSA, laws over the past 15 years, billions in special subsidies are flowing to Chicago and districts in Cook County and its collar counties.
Some of these are the result of laws passed in 2000 that grant extraordinary subsidies to school districts whose revenues are negatively affected by both local property tax caps and special economic zones.
A second set of subsidies impacts how much a district receives in funding for its low-income students.
Lower-reported property wealth equals extra subsidies
Changes to the GSA formula allow certain districts to exclude significant amounts of property wealth when applying for GSA funding. Lower-reported property wealth means more GSA subsidies for those districts.
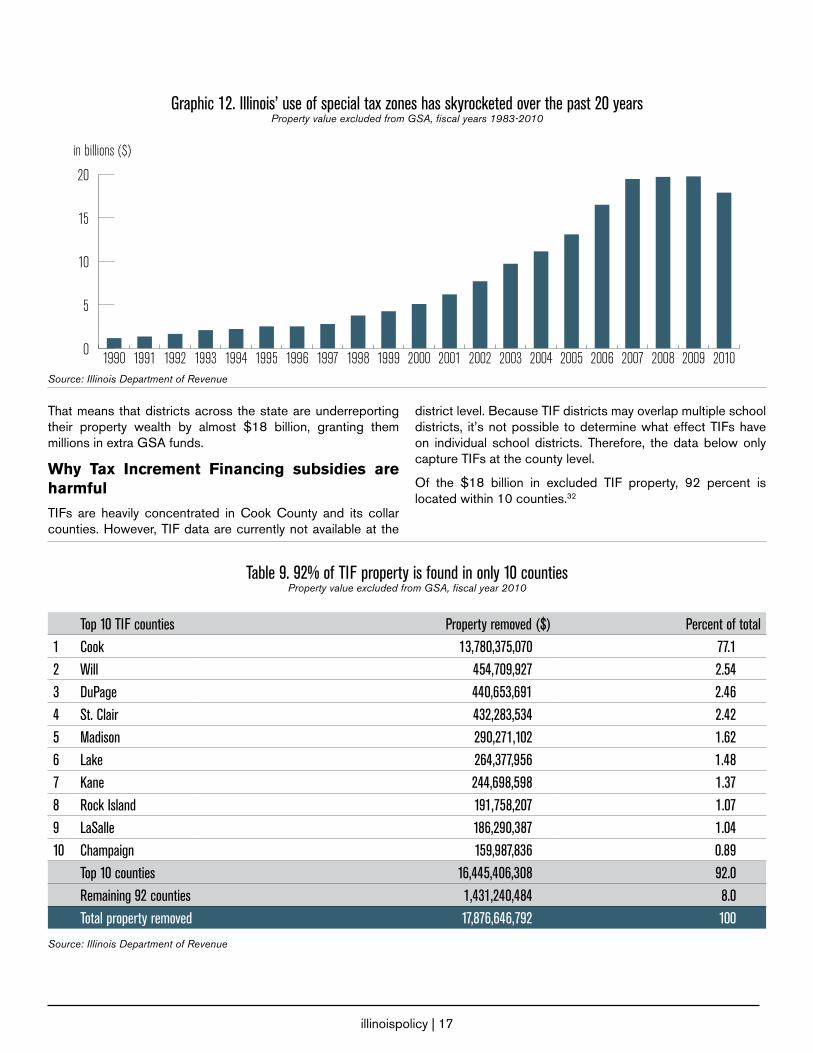
Graphic 5. Total property wealth excluded from GSA formulas by region Fiscal year 2013
$40.4B
Chicago
$33.1B
Other Cook
$14.9B
Collar
$4.3B
Downstate
Note: Cook County 7% percent property exclusion not includedSource: Illinois State Board of Education
The region that benefits the most is Chicago, which excludes nearly 10 times the amount of property wealth downstate does, and more than twice as much as the collar counties. 22
An increase in poverty count means a larger grant
The more low-income students a district has, the more state funds it receives, regardless of the district’s ability to pay for its own educational expenses.
In 1999, the methodology to determine the number of low-income children in each district changed, leading to a dramatic increase in the number of Illinois children considered poor for GSA purposes. These changes, coupled with the fact that districts receive increasingly greater per-student funding as their low-income student population increases, have dramatically increased funding across all state regions.
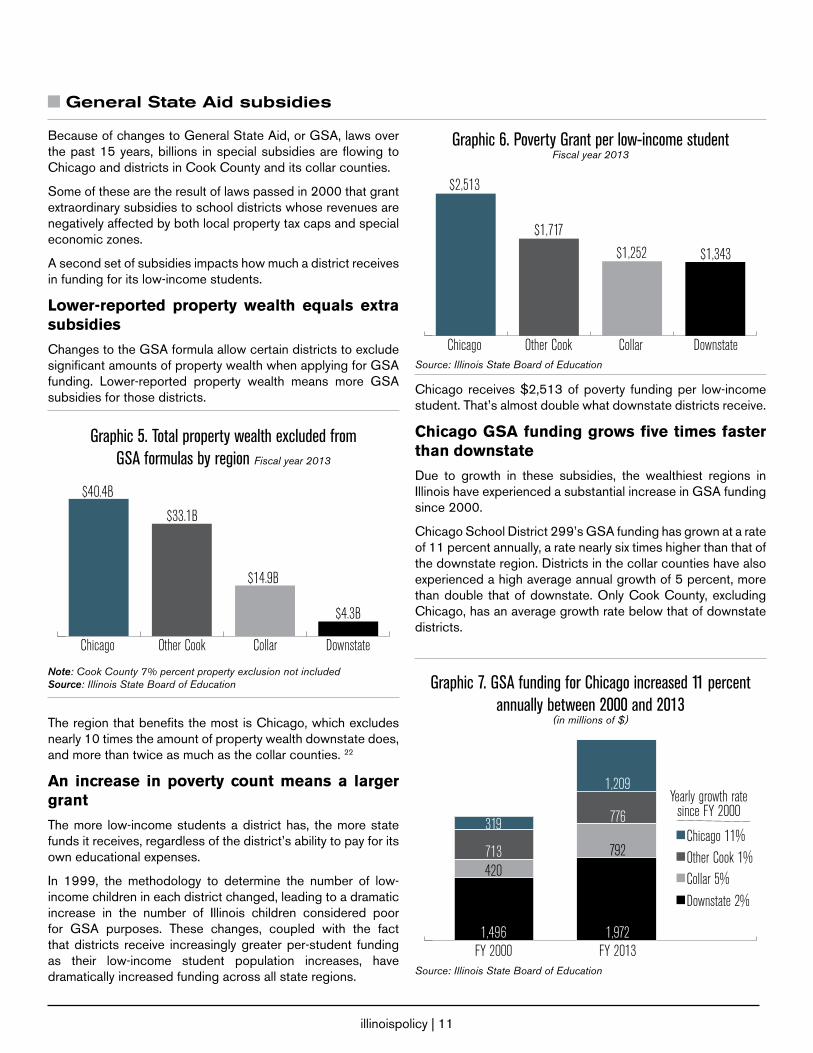
Graphic 6. Poverty Grant per low-income studentFiscal year 2013
$2,513
Chicago
$1,717
Other Cook
$1,252
Collar
$1,343
DownstateSource: Illinois State Board of Education
Chicago receives $2,513 of poverty funding per low-income student. That’s almost double what downstate districts receive.
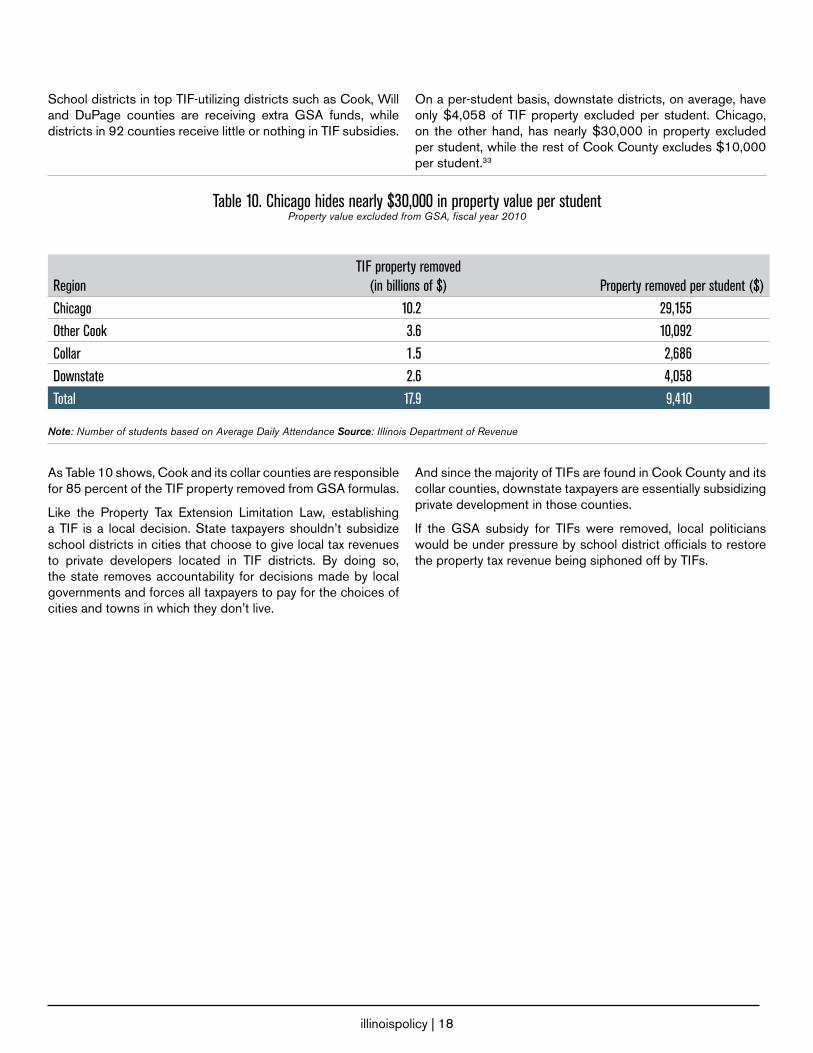
Chicago GSA funding grows five times faster than downstate
Due to growth in these subsidies, the wealthiest regions in Illinois have experienced a substantial increase in GSA funding since 2000.
Chicago School District 299’s GSA funding has grown at a rate of 11 percent annually, a rate nearly six times higher than that of the downstate region. Districts in the collar counties have also experienced a high average annual growth of 5 percent, more than double that of downstate. Only Cook County, excluding Chicago, has an average growth rate below that of downstate districts.
Graphic 7. GSA funding for Chicago increased 11 percent annually between 2000 and 2013
(in millions of $)
Chicago 11%Other Cook 1%Collar 5%Downstate 2%
319
713420
1,496
1,209
776
792
1,972
Yearly growth ratesince FY 2000
FY 2000 FY 2013Source: Illinois State Board of Education

illinoispolicy | 12
Property Tax Extension Limitation Law (PTELL) subsidy
Legislative adjustments to the General State Aid, or GSA, formula gives a district operating under property tax caps the opportunity to underreport its total property wealth. This results in a subsidy that only some districts can take advantage of. This subsidy is known as the Property Tax Extension Law Limit Adjustment.
Introduction of property tax caps
In the late 1980s – as home values rose – Illinois residents saw their property taxes increase substantially year to year.
To limit property tax growth, legislators passed a law that would limit a local government’s ability to raise property tax revenues.
This law, passed in 1991, was called the Property Tax Extension Limitation Law, or PTELL. Initially, this law affected the collar counties (DuPage, Kane, Lake, McHenry and Will). In 1994, it was extended to Cook County. Since then, all Illinois counties have been able to hold referendums to determine whether or not to cap countywide property tax growth.23
PTELL limits a local government’s increase in yearly tax revenues to 5 percent or the rate of inflation, whichever is lower. Tax levies greater than the capped amount can occur only through the passage of a local tax referendum.
Today, nearly 40 percent of Illinois counties are under tax caps.24
Property Tax Extension Limitation Law Adjustment
PTELL was successful in capping the growth of property tax revenues.
School districts in property tax-capped counties, however, complained that the PTELL laws limited their access to property tax revenues.
To compensate for this, the state created the PTELL Adjustment.
The PTELL adjustment allows districts operating under property tax caps to underreport the true amount of their property values by using a complex series of calculations reflecting the impact of the property tax caps. And since state aid goes up the more property poor a district is, the GSA amount to that district increases (For a complete examination of PTELL and the PTELL Adjustment, please consult Appendix 2.2).
This particular GSA subsidy sends hundreds of millions of dollars yearly to a small group of school districts affected by self-imposed property tax caps.
For example, Chicago School District 299 has more than $88 billion worth of property within its borders. But because the district has a property tax cap, the funding formula assumes that Chicago has only $54 billion. This difference results in a $284 million GSA subsidy for the district (see Appendix 3 to see how the PTELL adjustment applies to Chicago District 299).25
The Chicago example highlights the dramatic shift of GSA funds toward property tax-capped districts. State funding for these districts has grown an alarming 991 percent since the law was enacted, to $502 million in fiscal year 2013 from $46 million in fiscal year 2000.26
Graphic 8. The PTELL adjustment has grown an average of 26 percent a yearFiscal years 2000-2013
0
200
400
600
800
1,000
20132012201120102009200820072006200520042003200220012000Source: Illinois State Board of Education
While the PTELL adjustment has declined in recent years as a result of falling property values due to the housing crisis, it can
be expected to increase as housing prices recover.

illinoispolicy | 13
Why the Property Tax Extension Limitation Law Adjustment is harmful
The money Chicago School District 299 and other PTELL districts like it receive is nothing more than a multimillion-dollar subsidy.
It’s understandable if residents of local governments don’t want to pay higher property taxes. But these governments shouldn’t expect a backdoor subsidy from state taxpayers if
these governments refuse to manage spending under the limits imposed by local property tax caps.
In fiscal year 2013, 34 percent of all districts received a PTELL Adjustment subsidy. A majority of these districts, however, received only a small benefit.
But 54 districts received more than 90 percent of the $502 million subsidy in fiscal year 2013.27
Table 7. Number of districts benefiting from PTELL AdjustmentFiscal year 2013
PTELL subsidy received Number of districts Total received (in millions of $) Percent share of total$1 million or more 54 459 91Greater than zero but less than $1 million 238 43 9No subsidy received 570 0 0Total: 862 502 100
Source: Illinois State Board of Education
Table 8. 54 districts receive more than 90 percent of $502M PTELL subsidiesPTELL subsidy by district, fiscal year 2013
District name County Total GSA claim with PTELL ($) Total GSA claim without PTELL ($) Embedded PTELL subsidy ($)
1 CITY OF CHICAGO SCHOOL DIST 299 COOK 1,209,433,450 925,881,071 283,552,379
2 CICERO SCHOOL DISTRICT 99 COOK 91,885,008 80,796,761 11,088,247
3 J S MORTON H S DISTRICT 201 COOK 38,172,958 27,553,970 10,618,988
4 BREMEN COMM H S DISTRICT 228 COOK 20,056,343 11,350,822 8,705,522
5 OAK PARK ELEM SCHOOL DIST 97 COOK 9,343,688 2,273,117 7,070,571
6 MAYWOOD-MELROSE PARK-BROADVIEW-89 COOK 34,195,828 27,175,895 7,019,933
7 ELMWOOD PARK C U SCH DIST 401 COOK 9,593,595 3,157,227 6,436,368
8 BERWYN SOUTH SCHOOL DISTRICT 100 COOK 16,714,283 10,373,512 6,340,771
9 AURORA WEST UNIT SCHOOL DIST 129 KANE 35,353,196 29,378,699 5,974,496
10 AURORA EAST UNIT SCHOOL DIST 131 KANE 91,368,393 85,767,521 5,600,872
11 INDIAN SPRINGS SCHOOL DIST 109 COOK 10,183,593 4,791,928 5,391,665
12 THORNTON TWP H S DIST 205 COOK 30,553,817 26,091,355 4,462,462
13 LINCOLN WAY COMM H S DIST 210 WILL 7,593,236 3,211,754 4,381,482
14 BERWYN NORTH SCHOOL DIST 98 COOK 20,474,002 16,098,743 4,375,259
15 PRAIRIE-HILLS ELEM SCH DIST 144 COOK 15,132,259 10,778,543 4,353,716
16 VALLEY VIEW CUSD #365U WILL 20,948,190 16,929,426 4,018,765
17 JOLIET SCHOOL DIST 86 WILL 58,445,377 54,632,992 3,812,386
18 BELLWOOD SCHOOL DIST 88 COOK 11,778,733 8,417,471 3,361,262
continued on page 14

illinoispolicy | 14
District name County Total GSA claim with PTELL ($) Total GSA claim without PTELL ($) Embedded PTELL subsidy ($)
19 RICH TWP H S DISTRICT 227 COOK 11,840,626 8,506,256 3,334,371
20 BERKELEY SCHOOL DIST 87 COOK 8,450,437 5,246,828 3,203,609
21 DOLTON SCHOOL DISTRICT 149 COOK 17,875,525 14,679,772 3,195,753
22 FLOSSMOOR SCHOOL DISTRICT 161 COOK 4,513,684 1,437,945 3,075,739
23 HOMEWOOD SCHOOL DISTRICT 153 COOK 4,052,430 1,093,467 2,958,963
24 MIDLOTHIAN SCHOOL DIST 143 COOK 8,544,453 5,698,672 2,845,781
25 THORNTON FRACTIONAL T H S D 215 COOK 14,516,623 11,695,544 2,821,079
26 FOREST RIDGE SCHOOL DIST 142 COOK 3,629,034 1,020,799 2,608,235
27 HOMEWOOD FLOSSMOOR C H S D 233 COOK 7,378,634 4,822,194 2,556,441
28 HARVEY SCHOOL DISTRICT 152 COOK 17,959,119 15,443,996 2,515,123
29 MATTESON ELEM SCHOOL DIST 162 COOK 8,257,064 5,794,515 2,462,548
30 COUNTRY CLUB HILLS SCH DIST 160 COOK 6,602,077 4,191,826 2,410,251
31 ARBOR PARK SCHOOL DISTRICT 145 COOK 3,914,241 1,579,351 2,334,889
32 CHICAGO HEIGHTS SCHOOL DIST 170 COOK 20,613,285 18,356,689 2,256,596
33 CHICAGO RIDGE SCHOOL DIST 127-5 COOK 5,736,121 3,499,307 2,236,814
34 COOK COUNTY SCHOOL DIST 130 COOK 11,069,445 8,867,460 2,201,985
35 COMMUNITY HIGH SCHOOL DIST 155 MCHENRY 7,562,640 5,411,357 2,151,282
36 SUNNYBROOK SCHOOL DISTRICT 171 COOK 3,852,352 1,919,001 1,933,351
37 BLOOM TWP HIGH SCH DIST 206 COOK 13,138,933 11,241,682 1,897,252
38 POSEN-ROBBINS EL SCH DIST 143-5 COOK 12,476,421 10,592,335 1,884,086
39 SCHAUMBURG C C SCHOOL DIST 54 COOK 8,282,877 6,534,472 1,748,406
40 GRAYSLAKE C C SCHOOL DISTRICT 46 LAKE 7,039,053 5,319,893 1,719,160
41 CONS HIGH SCHOOL DISTRICT 230 COOK 5,556,834 3,838,082 1,718,752
42 BROOKWOOD SCHOOL DIST 167 COOK 3,886,795 2,333,556 1,553,240
43 ROUND LAKE AREA SCHS - DIST 116 LAKE 37,861,329 36,418,073 1,443,256
44 BOURBONNAIS SCHOOL DIST 53 KANKAKEE 6,003,421 4,593,038 1,410,383
45 PARK FOREST SCHOOL DIST 163 COOK 10,537,218 9,216,134 1,321,084
46 COMMUNITY HIGH SCHOOL DIST 218 COOK 6,964,364 5,645,026 1,319,338
47 CALUMET CITY SCHOOL DISTRICT 155 COOK 7,531,881 6,280,212 1,251,670
48 GAVIN SCHOOL DIST 37 LAKE 2,027,411 798,884 1,228,527
49 STEGER SCHOOL DISTRICT 194 COOK 4,916,936 3,702,145 1,214,791
50 BIG HOLLOW SCHOOL DIST 38 LAKE 1,988,876 827,070 1,161,806
51 CALUMET PUBLIC SCHOOLS DIST 132 COOK 7,184,060 6,035,420 1,148,640
52 EVANSTON C C SCHOOL DIST 65 COOK 4,545,126 3,403,903 1,141,224
53 WOODSTOCK C U SCHOOL DIST 200 MCHENRY 5,966,189 4,840,850 1,125,340
54 LA GRANGE SCHOOL DIST 102 COOK 2,246,503 1,174,773 1,071,730
Total: 2,045,747,970 1,586,721,334 459,026,636
continued from page 13
Source: Illinois State Board of Education

illinoispolicy | 15
All but one of those 54 districts are located in Cook County and its collar counties. Districts in these regions received 97 percent of the subsidy, with only 3 percent dedicated to downstate school districts.
Graphic 9. Nearly 97 percent of 2013 PTELL subsidies went to Cook County and collar counties (in millions of $)
32%
57%Total $502 million
Chicago $284 Other Cook $160 Collar $42 Downstate $16
8%
3%
Source: Illinois State Board of Education
The biggest beneficiary, by far, was Chicago School District 299. In fiscal year 2013 alone, the district received $284 million, or 57 percent, of the PTELL Adjustment.
The PTELL Adjustment subsidy has sent more than $6.4 billion over the past 13 years to districts with property tax caps, with a majority dedicated to Chicago, Cook County and its collar counties.
Downstate districts fare poorly when measuring PTELL subsides per student. Chicago School District 299 receives more than $800 per student while downstate districts receive only $25 per student.28
Graphic 10. Downstate districts receive an average PTELL subsidy of $25 per student Average 2013 PTELL subsidy per student
$811
Chicago
$449
Other Cook
$78
Collar$25
Downstate
Note: Number of students based on Average Daily AttendanceSource: Illinois State Board of Education
Having the state subsidize any county’s decision to cap its local property taxes removes any accountability for local government actions. It also forces taxpayers who live outside property-tax capped districts to subsidize the lower tax rates that residents inside those districts enjoy.
.

illinoispolicy | 16
Tax Increment Financing (TIF) subsidies
Current law permits school districts located in areas with special economic zones to underreport their actual property wealth, which allows them to receive more General State Aid, or GSA, funding than these districts would otherwise. The result is a GSA subsidy that only some districts can benefit from.
Special tax zones and their effect on General State Aid
Tax Increment Financing, or TIF, districts are special economic zones that were created to help cities and towns improve “blighted” neighborhoods.
City and village governments with TIFs use a portion of the property tax revenues generated in the special economic zone to give tax incentives to private developers located in these districts.
But the establishment of a TIF drains the amount of property tax revenue that a school district has available for education.
For example, in fiscal year 2011 Chicago’s 169 TIF districts controlled more than $450 million in property tax revenues – revenues that are used to fund development projects and are off limits to school, park and library districts.29
Graphic 11. Chicago TIFs control $450 million in tax revenue Tax revenue from Chicago TIF districts, Fiscal years 1990-2011
0
100
200
300
400
500
600
2011201020092008200720062005200420032002200120001999199819971996199519941993199219911990
in millions ($)
Source: Office of the Cook County Clerk
But the GSA formula partially refunds the cost of TIFs by providing extra funding to school districts to make up for lost property tax revenue. It does this by allowing a district to exclude the property wealth located in these special economic zones, thereby making the districts appear more property poor than they actually are.
This lowers the districts’ total reported property wealth, which results in greater GSA funding than these districts would otherwise receive.
For example, under the current GSA formula, Chicago currently reports $52 billion of total property wealth. This excludes $10.1 billion in property located in TIF districts. Due to this underreporting of property wealth, Chicago receives $264 million more in GSA funds than it otherwise would (see Appendix 3 to see how TIFs apply to Chicago District 299).30
But Chicago School District 299 is not the only district utilizing TIFs. The property values that are not included in GSA calculations statewide now equal almost $18 billion.31
illinoispolicy | 17
Graphic 12. Illinois’ use of special tax zones has skyrocketed over the past 20 yearsProperty value excluded from GSA, fiscal years 1983-2010
0
5
10
15
20
201020092008200720062005200420032002200120001999199819971996199519941993199219911990
in billions ($)
Source: Illinois Department of Revenue
That means that districts across the state are underreporting their property wealth by almost $18 billion, granting them millions in extra GSA funds.
Why Tax Increment Financing subsidies are harmful
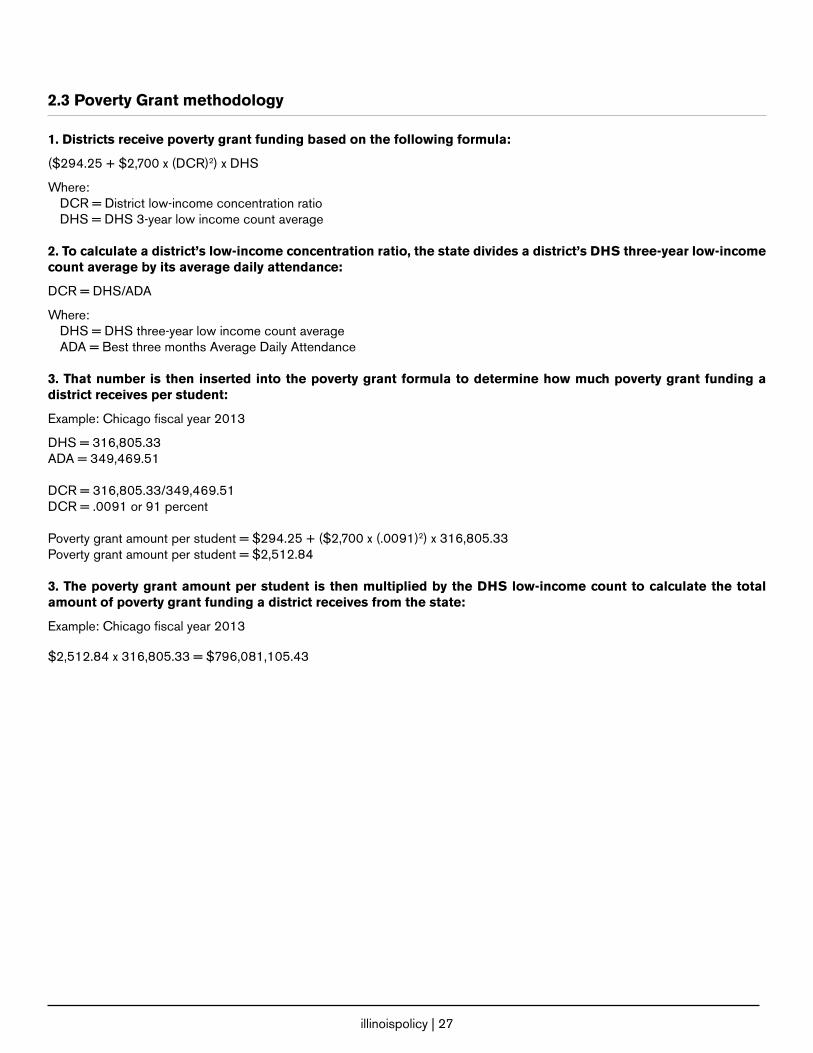
TIFs are heavily concentrated in Cook County and its collar counties. However, TIF data are currently not available at the
district level. Because TIF districts may overlap multiple school districts, it’s not possible to determine what effect TIFs have on individual school districts. Therefore, the data below only capture TIFs at the county level.
Of the $18 billion in excluded TIF property, 92 percent is located within 10 counties.32
Top 10 TIF counties Property removed ($) Percent of total 1 Cook 13,780,375,070 77.12 Will 454,709,927 2.543 DuPage 440,653,691 2.464 St. Clair 432,283,534 2.425 Madison 290,271,102 1.626 Lake 264,377,956 1.487 Kane 244,698,598 1.378 Rock Island 191,758,207 1.079 LaSalle 186,290,387 1.0410 Champaign 159,987,836 0.89
Top 10 counties 16,445,406,308 92.0Remaining 92 counties 1,431,240,484 8.0Total property removed 17,876,646,792 100
Table 9. 92% of TIF property is found in only 10 countiesProperty value excluded from GSA, fiscal year 2010
Source: Illinois Department of Revenue
illinoispolicy | 18
School districts in top TIF-utilizing districts such as Cook, Will and DuPage counties are receiving extra GSA funds, while districts in 92 counties receive little or nothing in TIF subsidies.
On a per-student basis, downstate districts, on average, have only $4,058 of TIF property excluded per student. Chicago, on the other hand, has nearly $30,000 in property excluded per student, while the rest of Cook County excludes $10,000 per student.33
Table 10. Chicago hides nearly $30,000 in property value per student Property value excluded from GSA, fiscal year 2010
Region TIF property removed
(in billions of $) Property removed per student ($)Chicago 10.2 29,155Other Cook 3.6 10,092Collar 1.5 2,686Downstate 2.6 4,058Total 17.9 9,410
Note: Number of students based on Average Daily Attendance Source: Illinois Department of Revenue
As Table 10 shows, Cook and its collar counties are responsible for 85 percent of the TIF property removed from GSA formulas.
Like the Property Tax Extension Limitation Law, establishing a TIF is a local decision. State taxpayers shouldn’t subsidize school districts in cities that choose to give local tax revenues to private developers located in TIF districts. By doing so, the state removes accountability for decisions made by local governments and forces all taxpayers to pay for the choices of cities and towns in which they don’t live.
And since the majority of TIFs are found in Cook County and its collar counties, downstate taxpayers are essentially subsidizing private development in those counties.
If the GSA subsidy for TIFs were removed, local politicians would be under pressure by school district officials to restore the property tax revenue being siphoned off by TIFs.

illinoispolicy | 19
Poverty Grant
The second major factor determining the flow of General State Aid, or GSA, funds is the number of low-income children located in a school district and what share those children represent of the district’s total student population. GSA funding dedicated to supporting low-income students is called the Poverty Grant.
Changes in the Poverty Grant formula
The low-income student boom
One component of the Poverty Grant formula is a district’s number of low-income children – often referred to as the low-income count. This helps to determine how much funding a district receives.
Until fiscal year 2004, the state used the U.S. Census to figure out how many low-income children lived within a district. That year, the state began using the Illinois Department of Human Services, or DHS, as its source.34
This change resulted in a dramatic increase in the number of students considered low-income in Illinois. The state’s low-income count has tripled since 2000, while certain regions of the state have seen their low-income count jump sevenfold.
Graphic 13. Share of low-income students doubled in Chicago and tripled statewide since 2000 Low-income students as a percent-
age of average daily attendance, fiscal year 2000 vs. 2013
Chicago Other Cook Collar Downstate Statewide
44%
91%
8%
52%
5%
36%
18%
48% 53%
18%
FY 2000 FY 2013
Source: Illinois State Board of Education
This sharp increase occurred because DHS has more lenient guidelines about who qualifies as low-income.
According to DHS, children in a district who are enrolled in Medicaid, the Children’s Health Insurance Program (CHIP), the Temporary Assistance for Needy Families Program (TANF) and/or the Supplemental Nutrition Assistance Program (SNAP) count as low-income.35
Since CHIP is the most expansive program in terms of income eligibility – 200 percent of the federal poverty level – a family of four can make up to $46,100 and still be counted as low-income under the Poverty Grant formula.
Under the current census guidelines, however, that same family (assuming it consists of two parents and two children) can only earn up to $22,811 and still be considered low-income.36
While a portion of the rise in the low-income population is due to the sluggish economy and changes in demographics, a majority of it has been caused by the change in the way the state calculates how many low-income children there are in the state.
As the low-income population grows, poverty funding grows exponentially
In addition to the swell in the number of low-income students, the state’s method for calculating the per-student Poverty Grant has also contributed to its rapid increase.
With Poverty Grants, districts are given a certain amount of funding per student based on how many low-income students live in a district. Unlike other education funding items where districts receive a flat grant for each student, Illinois’ Poverty Grant formula gives districts increasingly more money per student as their poverty concentration grows. (See Appendix 2.3 for detailed methodology on the Poverty Grant).37
To determine a district’s poverty concentration ratio, the state divides the number of low-income students in a district by the amount of students who attend school on an average daily basis.
Where a district falls on Graphic 14 is extremely important – it dictates how much funding the district will receive per student. As Graphic 14 shows, as a district’s low-income concentration increases, it receives more money per student.

illinoispolicy | 20
Graphic 14. Poverty Grant aid increases as concentration of low-income students increases
0
500
$1,000
$1,500
$2,000
$2,500
$3,000
100%95%90%85%80%75%70%65%60%55%50%45%40%35%30%25%20%15%
$355
$2,994Chicago SD 299$2,513 per student
Quincy SD 172$1,076 per studentPorta SD 202
$629 per student
District poverty concentration ratioSource: Illinois State Board of Education
For example, Chicago School District 299’s low-income population now totals 91 percent of its total average daily attendance. That means the school district receives $2,513 in poverty grant funding for every low-income student living in its district. Rockford School District 205 has a similar profile to Chicago, and receives nearly $2,300 per student.
By comparison, Quincy School District 172, with a 54 percent poverty concentration, receives $1,076 per student, while Petersburg’s Porta Community School District 202, with a 35 percent poverty concentration, receives just $629 per student.38
The boom in Poverty Grant spending
Increasing numbers of children considered low-income across the state, combined with the new poverty concentration formula, have led to a rapid increase in the amount of funding diverted to the Poverty Grant.
In 2000, that amount was just less than $300 million, or 10 percent of the total GSA.
Since then, funding to districts with low-income populations has skyrocketed. The total amount allocated in fiscal year 2013 was nearly $1.8 billion, or 37 percent of total GSA funds.39
Graphic 15. Poverty Grant funding has increased sixfold since 2000Poverty Grant funding, fiscal years 2000-2013
0
500
1,000
1,500
2,000
20132012201120102009200820072006200520042003200220012000
15% annual growth
In millions ($)
Source: Illinois State Board of Education
And Poverty Grant growth shows no signs on stopping. It has grown an average of 15 percent annually since 2000 – in good economic times and in bad.
At this rate of growth, the Poverty Grant could comprise the majority of GSA funds within the next few years.

illinoispolicy | 21
The Poverty Grant’s flaws
GSA formula changes have caused the Poverty Grant to grow dramatically.
Graphic 16. Poverty Grant has expanded to encompass more than 37% of GSA (in billions of $)
10%
90%
Fiscal year 2000Total $2.96B Rest of GSA $2.67B
Poverty grant $.29B
37%
63%
Fiscal year 2013Total $4.78B Rest of GSA $3.01B
Poverty grant $1.77B
Source: Illinois State Board of Education
Graphic 15 reveals that the majority of the Poverty Grant funding growth is going to Cook County (excluding Chicago) and the collar counties. With annual growth rates above 30 percent, districts in those counties are attracting greater amounts of funding.40
Graphic 17. Other Cook County and collar counties experienced more than 30% annual growth in
Poverty Grant funding Fiscal years 2000 – 2013 (in millions of $)
Chicago 11%Other Cook 31%Collar 35%Downstate 14%
319713
Yearly growth ratesince FY 2000
FY 2000
796
202
78
105
315
78
244
418FY 2013
Source: Illinois State Board of Education
The problem with Poverty Grant funds is that the money is not distributed based on the demonstrable need of individual districts. The grant’s formulas do not take into account a district’s ability to pay for its own education expenses. This means that property-rich districts may receive Poverty Grant funding even though these areas have the ability to pay.
Because of this quirk in the Poverty Grant formula, downstate districts are receiving, on average, far less Poverty Grant funding per student than the wealthier Cook County and its collar counties. Chicago School District 299 receives $2,513 in Poverty Grant funding due to its high poverty concentration ratio. Other districts in Cook County receive a high $1,717 per low-income student, despite the fact these districts have the local means to pay for education.

illinoispolicy | 22
Table 11. Chicago receives the most Poverty Grant funding per student Fiscal year 2013
Region DHS low-income student population Total Poverty Grant claim ($) Avg Poverty Grant claim per low-income student ($)Chicago 316,805 796,081,105 2,513Other Cook 183,743 315,545,973 1,717Collar 194,802 205,793,257 1,252Downstate 311,398 456,302,618 1,343Total: 1,006,749 1,773,722,953 1,762
Note: Number of students based on Average Daily Attendance Source: Illinois State Board of Education
The Poverty Grant was designed by the state to provide districts extra funding to educate their low-income students. Unfortunately, like Property Tax Extension Limitation Law and
TIF subsidies, the Poverty Grant is now providing extraordinary subsidies to Chicago and Cook county.

illinoispolicy | 23
The solution
All special General State Aid subsidies need to be ended immediately — the solution isn’t about tweaking the formulas and making fixes so that political power between different regions in the state can be temporarily equalized. To fix Illinois’ broken education system, financial power needs to be taken away from the politicians and special interests. As long as they direct the system, it won’t be about accountability – it will be about dollars and who controls them.
The only real solution is to transition to a new education funding system – one that provides parents with increasing control over the flow and distribution of money.
When it comes to creating a new education-funding system, Illinois doesn’t need to start from scratch. Alternatives already exist and have proven effective in other states across the country, including Wisconsin and Indiana.
Why it works
A system where parents control the flow and distribution of money empowers families to hold schools accountable. They, and not the educational establishment, will decide the future of their children. And with more alternatives, parents can determine which school is best for their children’s needs.
Parental control also means fewer winners and losers based on political influence and financial manipulations. Children will no
longer find themselves in the middle of funding battles between the politically powerful, be it the Chicago Teachers Union and the Chicago Education Board, or downstate and Chicago politicians.
It’s time for parents to control the flow and distribution of money in education. Only then will the struggle be about what really matters – how to educate the children of Illinois.

illinoispolicy | 24
Appendix 1
State, local and federal resources for elementary and secondary education, fiscal years 1993 - 2012 (in millions of $)41
Year $ % $ % $ % $1993 3,475.4 33.4 6,078.1 58.4 862.9 8.3 10,416.41994 3,611.5 32.9 6,453.4 58.9 901.0 8.2 10,965.91995 3,792.6 32.4 6,841.0 58.4 1,080.6 9.2 11,714.21996 3,994.8 32.1 7,339.8 58.9 1,123.7 9 12,458.31997 4,307.1 32.7 7,700.9 58.5 1,152.9 8.8 13,160.91998 4,849.3 33.9 8,052.0 56.2 1,417.9 9.9 14,319.21999 5,654.4 36.1 8,571.1 54.7 1,434.3 9.2 15,659.82000 6,354.0 37.8 8,907.0 52.9 1,565.8 9.3 16,826.82001 6,785.1 37.7 9,331.6 51.9 1,868.0 10.4 17,984.72002 7,181.1 38.8 9,724.0 52.5 1,623.0 8.8 18,528.12003 6,873.2 36.1 10,226.2 53.7 1,952.1 10.2 19,051.52004 7,206.1 35.9 10,805.3 53.8 2,073.8 10.3 20,085.22005 6,955.7 33.7 11,456.7 55.5 2,219.3 10.8 20,631.72006 6,875.5 32.3 12,226.1 57.5 2,163.1 10.2 21,264.72007 7,492.1 33.1 12,982.2 57.3 2,174.1 9.6 22,648.42008 8,519.6 34.6 13,903.7 56.5 2,165.7 8.8 24,589.02009 7,992.7 30.4 14,488.5 55.1 3,812.7 14.5 26,293.92010 9,897.3 34.6 15,037.0 52.6 3,637.4 12.7 28,571.72011 9,286.8 33.1 15,344.1 54.6 3,460.8 12.3 28,091.72012 9,328.8 32.5 15,791.2 55 3,580.8 12.5 28,700.8
Fiscal State Local Federal Total
Source: ISBE Annual Report 2012
Notes: • Fiscal years and school years start July 1 and end June 30. Tax years start Jan. 1 and end Dec. 31. The state and federal funds shown are based on fiscal years, while local funds are based on tax (calendar) years. For example, the 2011-12 year includes actual state and federal appropriations for state fiscal year 2012 and local revenues accruing to school districts from the 2010 tax year. 2010 property taxes are payable to the districts in calendar year 2011, usually after July 1.
• Local includes local real property tax revenues as estimated by the total property tax extension of districts and Corporate Personal Property Replacement Funds. Not included as local revenue are proceeds from investment income, income from school food services and revenue generated through fees and assessments.
• State includes appropriated amount with original appropriations, supplementals and teachers’ retirement and pension contributions.
• Fiscal year 2010 federal sources include $1.5 billion in federal funds received through the American Recovery and Reinvestment Act (ARRA).

illinoispolicy | 25
State General State Aid methodology42
2.1 Calculation of General State Aid
1. To determine the amount of Foundation Level grant funding a district receives, the state first looks at its avail-able local resources using this formula:
Available local resources = (GSA EAV x RATE + CPPRT)
Where:RATE = 2.30% for an elementary school1.05% for a high school3.00% for a unit schoolCPPRT = Corporate Personal Property Replacement TaxesGSA EAV = Equalized Assessed Valuation
2. The state then calculates how much property tax revenue it assumes a district can collect per student:
Available local resources per student = available local resources/ADA
Where:ADA = Best 3 Months Average Daily Attendance
3. The state then determines what percentage this value is of the Foundation Level:
Local percentage = Available local resources / FLEVEL
Where:Foundation Level (FLEVEL) = $6,119 for fiscal year 2013
4. Depending on what percentage of the Foundation Level a district is able to fund, it falls into one of the three district categories and receives the appropriate funding:
Foundation formulaGSA is calculated using the Foundation formula if the district’s local percentage is less than 93 percent. The grant is calculated as:
GSA Foundation = (FLEVEL–available local resources per pupil) x ADA
Alternate formulaGSA is calculated using the Alternate formula if the district’s local percentage is at least 93 percent but less than 175 percent. This formula provides between 7 percent and 5 percent of the FLEVEL per ADA. The grant is calculated as:
GSA Alternate = FLEVEL x ADA x (.07–[(Local Percentage–.93) / .82] x .02)
Flat grant formula
GSA is calculated using the Flat Grant if the district’s local percentageis at least 175 percent. The grant is calculated as:
GSA Flat Grant = ADA x $218
Appendix 2

illinoispolicy | 26
2.2 Property Tax Extension Limitation Law (PTELL) methodology
1. For districts subject to PTELL, GSA calculations assume the lesser of either the district’s real EAV or its Extension Limitation EAV. For many PTELL districts, the Extension Limitation EAV is less than its actual EAV, resulting in a greater GSA formula payment.
2. To determine a district’s Extension Limitation EAV, the state uses the following formula:
Extension limitation EAV = Prior Year EAV x Extension Limitation Ratio (ELR)
Where:ELR = (Budget Year EAV x Budget Year Limiting Rate) / (Prior Year EAV x Prior Year OTR)
3. If the Extension Limitation EAV is less than the real EAV, the state uses the Extension Limitation EAV in the Foundation Level Grant funding formula to determine a district’s available local resources:
Available local resources = (Extension Limitation EAV x RATE + CPPRT)
Where:
RATE = 2.30% for an elementary school1.05% for a high school3.00% for a unit school
CPPRT = Corporate Personal Property Replacement TaxesGSA EAV = Equalized Assessed Valuation
4. The state then calculates how much property tax revenue it assumes a district can collect per student:
Available local resources per student = Available local resources/ADA
Where:ADA = Best 3 Months Average Daily Attendance
5. The state then determines what percentage this value is of the Foundation Level:
Local percentage = available local resources per student / FLEVEL
Where:Foundation Level (FLEVEL) = $6,119 for fiscal year 2013
6. Depending on what percentage of the Foundation Level a district is able to fund, it falls into one of the three district categories and receives the appropriate funding:
Foundation formula
If the district is only able to fund 93 percent of the Foundation Level, the grant is calculated as:GSA Foundation = (FLEVEL–available local resources per student) x ADA
Alternate formula
If the district is able to fund at least 93 percent but less than 175 percent of the Foundation Level, the grant is calculated as:GSA Alternate = FLEVEL x ADA x (.07–[(Local Percentage–.93) / .82] x .02)
Flat Grant formula
If the district is able to fund at least 175 percent of the Foundation Level, the grant is calculated as:GSA Flat Grant = ADA x $218
illinoispolicy | 27
2.3 Poverty Grant methodology
1. Districts receive poverty grant funding based on the following formula:
($294.25 + $2,700 x (DCR)2) x DHS
Where:DCR = District low-income concentration ratioDHS = DHS 3-year low income count average
2. To calculate a district’s low-income concentration ratio, the state divides a district’s DHS three-year low-income count average by its average daily attendance:
DCR = DHS/ADA
Where:DHS = DHS three-year low income count averageADA = Best three months Average Daily Attendance
3. That number is then inserted into the poverty grant formula to determine how much poverty grant funding a district receives per student:
Example: Chicago fiscal year 2013
DHS = 316,805.33ADA = 349,469.51
DCR = 316,805.33/349,469.51DCR = .0091 or 91 percent
Poverty grant amount per student = $294.25 + ($2,700 x (.0091)2) x 316,805.33Poverty grant amount per student = $2,512.84
3. The poverty grant amount per student is then multiplied by the DHS low-income count to calculate the total amount of poverty grant funding a district receives from the state:
Example: Chicago fiscal year 2013
$2,512.84 x 316,805.33 = $796,081,105.43

illinoispolicy | 28
Appendix 3
State aid to Chicago under different subsidy scenarios
Appendix 3.1
Appendix 3.1 is the actual amount of GSA funding Chicago received in fiscal year 2013.
Chicago’s actual EAV, excluding the property value located in TIF districts, is the value in 1A – but the state uses the value in 1 to make its calculations about how much property revenue it believes Chicago is able to raise per student. The value in 1 is the PTELL adjusted EAV.
To determine the total available resources that Chicago has available to fund its schools, the state multiplies the PTELL Adjusted EAV in 1 by the state’s assumed property tax rate for the district, located in 4. The CPPRT amount located in 3 is then added to that total. This number is then divided by the ADA used for GSA in 2 to determine the local resources per student.
With the PTELL Adjustment, and the exclusion of property value located in TIF districts, the state assumes Chicago can raise only $4,936.20 in property tax revenue per student, or 80.67 percent of the Foundation Level. This value is located in 8.
Because of this, Chicago receives the difference in funding between the Foundation Level – $6,119 – and the how much property tax revenue the state assumes it can raise.
When that difference – $1,182.80 – is multiplied by the city’s average daily attendance, located in 2, it entitles Chicago to more than $413 million in funding.
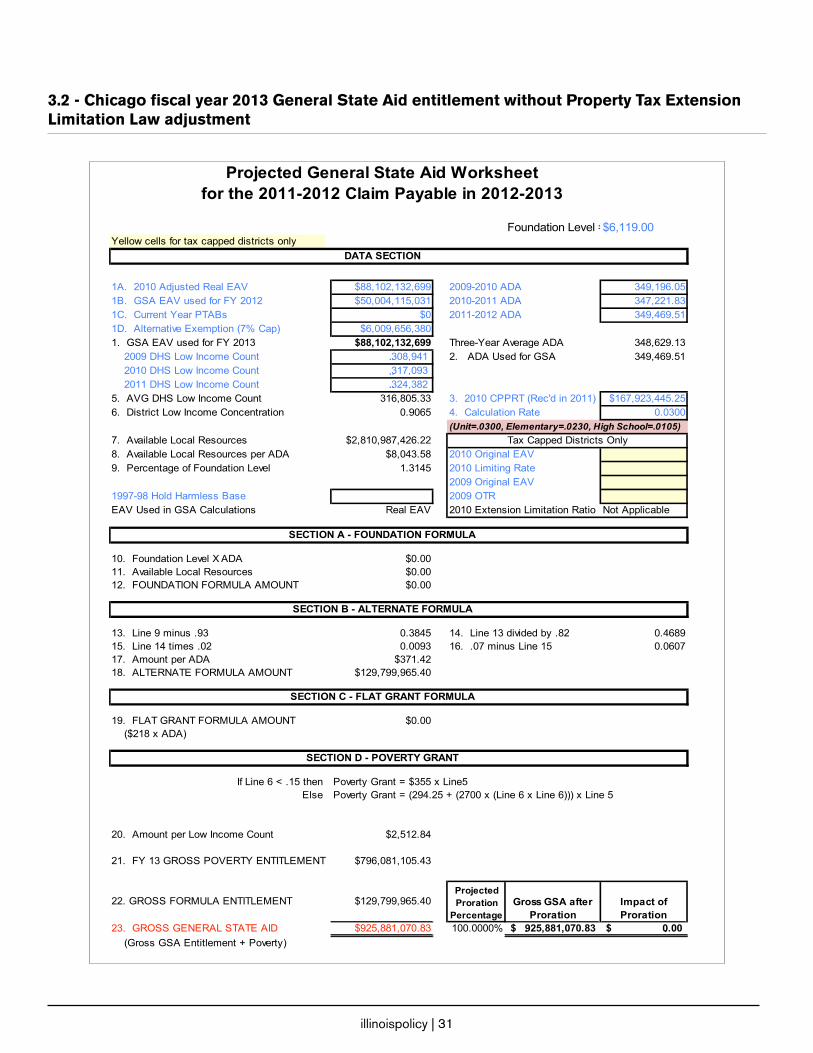
Appendix 3.2
Appendix 3.2 is the amount of GSA funding Chicago would have received in fiscal year 2013 if the PTELL Adjustment had been repealed.
The number in 1A is the actual EAV that Chicago has within its borders, excluding the property value located in TIF districts. In order to determine how much revenue Chicago can raise from that amount of property, the state multiplies the value in 1 by the state’s assumed property tax rate for the district, located in 4. The CPPRT amount located in 3 is then added to that total.
It then divides that value, which is located in 7, by the average daily attendance in 2 to get the available local resources per student.
Since this amount – $8,043.58 – is more than the Foundation Level, Chicago becomes an Alternate District and receives significantly less funding than it would if the PTELL Adjustment had been in place ($371.42 vs. $1,182.8 per student with the PTELL Adjustment).
The total difference in funding is drastic as well. Chicago receives a little more than $413 million with the PTELL Adjustment in place, and only about $130 million without it.
This subsidy of $283 million is paid for by all Illinois taxpayers.
Appendix 3.3
Appendix 3.3 is the amount of GSA funding Chicago would have received in fiscal year 2013 if the PTELL Adjustment was still in place, but all the property value currently in TIF districts was included in the city’s total property value, but not affected by the PTELL Adjustment formula.
Chicago’s actual EAV, excluding the property value located in TIF districts, is the value in 1A – but the state uses the value in 1 to make its calculations about how much property revenue it believes Chicago is able to raise per student. The value in 1 is the PTELL Adjusted EAV.
However, under this scenario, the $10.1 billion in property value in TIFs is then added on to the PTELL Adjusted value located in 1. Therefore, instead of being more than $51.9 billion the actual value in 1 is $62 billion.
illinoispolicy | 29
To determine the total available resources that Chicago has available to fund its schools, the state multiplies this value by the state’s assumed property tax rate for the district, located in 4. The CPPRT amount located in 3 is then added to that total. This number is then divided by the ADA used for GSA in 2 to determine the local resources per student.
With the PTELL Adjustment, and the inclusion of property value located in TIF districts, the state assumes Chicago can raise only $5,803.22 in property tax revenue per student, or 94.96 percent of the Foundation Level. This value is located in 8.
Because of this, Chicago receives the difference in funding between the Foundation Level – $6,119 – and the how much property tax revenue the state assumes it can raise.
When that difference – $425.88 – is multiplied by the city’s average daily attendance, located in 2, it entitles Chicago to nearly $149 million in funding.
Since this amount is less than the city would receive under a situation where the property value located in TIF districts was excluded from the funding formula, the city receives a subsidy totaling more than $265 million from all Illinois taxpayers.
Appendix 3.4
Appendix 3.4 is the amount of GSA funding Chicago would have received in fiscal year 2013 if the PTELL Adjustment was repealed and all of the property value in TIF districts was included in the city’s total property value.
The number in 1A is the actual EAV that Chicago has within its borders. To determine how much revenue Chicago can raise from that amount of property, the state multiplies the value in 1 by the state’s assumed property tax rate for the district, located in 4. The CPPRT amount located in 3 is then added to that total.
It then divides that value, which is located in 7, by the average daily attendance in 2 to get the available local resources per student.
Since this amount – $8,402.33 – is more than the Foundation Level, Chicago becomes an Alternate District and receives significantly less funding than it would if the PTELL Adjustment had been in place ($348.17 vs. $1,182.8 per student with the PTELL Adjustment and TIF property value excluded).
The total difference in funding is drastic as well. Chicago receives a little more than $413 million with the PTELL Adjustment in place and TIF property value excluded from the GSA funding formula and only $122 million without the two carve-outs.
This subsidy of $291 million is paid for by all Illinois taxpayers.

illinoispolicy | 30
3.1 - Chicago fiscal year 2013 General State Aid entitlement
illinoispolicy | 31
3.2 - Chicago fiscal year 2013 General State Aid entitlement without Property Tax Extension Limitation Law adjustment

illinoispolicy | 32
3.3 - Chicago fiscal year 2013 General State Aid entitlement with Property Tax Extension Limitation Law Adjustment and tax increment financing property value included
Projected General State Aid WorksheetProjected General State Aid WorksheetProjected General State Aid WorksheetProjected General State Aid WorksheetProjected General State Aid WorksheetProjected General State Aid Worksheetfor the 2011-2012 Claim Payable in 2012-2013for the 2011-2012 Claim Payable in 2012-2013for the 2011-2012 Claim Payable in 2012-2013for the 2011-2012 Claim Payable in 2012-2013for the 2011-2012 Claim Payable in 2012-2013for the 2011-2012 Claim Payable in 2012-2013
Foundation Level = $6,119.00Yellow cells for tax capped districts only
DATA SECTION
1A. 2010 Adjusted Real EAV $62,004,271,402 2009-2010 ADA2009-2010 ADA 349,196.051B. GSA EAV used for FY 2012 $0 2010-2011 ADA2010-2011 ADA 347,221.831C. Current Year PTABs $0 2011-2012 ADA2011-2012 ADA 349,469.511D. Alternative Exemption (7% Cap) $01. GSA EAV used for FY 2013 $62,004,271,402 Three-Year Average ADAThree-Year Average ADA 348,629.13 2009 DHS Low Income Count - 2. ADA Used for GSA2. ADA Used for GSA 349,469.51 2010 DHS Low Income Count - 2011 DHS Low Income Count - 5. AVG DHS Low Income Count 0.00 3. 2010 CPPRT (Rec'd in 2011)3. 2010 CPPRT (Rec'd in 2011) $167,923,445.256. District Low Income Concentration 0.0000 4. Calculation Rate4. Calculation Rate 0.0300
(Unit=.0300, Elementary=.0230, High School=.0105)(Unit=.0300, Elementary=.0230, High School=.0105)(Unit=.0300, Elementary=.0230, High School=.0105)7. Available Local Resources $2,028,051,587.31 Tax Capped Districts OnlyTax Capped Districts OnlyTax Capped Districts Only8. Available Local Resources per ADA $5,803.22 2010 Original EAV2010 Original EAV $09. Percentage of Foundation Level 0.9483 2010 Limiting Rate2010 Limiting Rate 0.00000
2009 Original EAV2009 Original EAV $01997-98 Hold Harmless Base 2009 OTR 0.00000EAV Used in GSA Calculations Real EAV 2010 Extension Limitation Ratio2010 Extension Limitation Ratio Not Applicable
SECTION A - FOUNDATION FORMULASECTION A - FOUNDATION FORMULASECTION A - FOUNDATION FORMULASECTION A - FOUNDATION FORMULASECTION A - FOUNDATION FORMULA
10. Foundation Level X ADA $0.0011. Available Local Resources $0.0012. FOUNDATION FORMULA AMOUNT $0.00
SECTION B - ALTERNATE FORMULASECTION B - ALTERNATE FORMULASECTION B - ALTERNATE FORMULASECTION B - ALTERNATE FORMULASECTION B - ALTERNATE FORMULA
13. Line 9 minus .93 0.0183 14. Line 13 divided by .8214. Line 13 divided by .82 0.022315. Line 14 times .02 0.0004 16. .07 minus Line 1516. .07 minus Line 15 0.069617. Amount per ADA $425.8818. ALTERNATE FORMULA AMOUNT $148,832,074.91
SECTION C - FLAT GRANT FORMULASECTION C - FLAT GRANT FORMULASECTION C - FLAT GRANT FORMULASECTION C - FLAT GRANT FORMULASECTION C - FLAT GRANT FORMULA
19. FLAT GRANT FORMULA AMOUNT $0.00 ($218 x ADA)
SECTION D - POVERTY GRANTSECTION D - POVERTY GRANTSECTION D - POVERTY GRANTSECTION D - POVERTY GRANTSECTION D - POVERTY GRANT
If Line 6 < .15 then Poverty Grant = $355 x Line5Poverty Grant = $355 x Line5Poverty Grant = $355 x Line5Else Poverty Grant = (294.25 + (2700 x (Line 6 x Line 6))) x Line 5Poverty Grant = (294.25 + (2700 x (Line 6 x Line 6))) x Line 5Poverty Grant = (294.25 + (2700 x (Line 6 x Line 6))) x Line 5Poverty Grant = (294.25 + (2700 x (Line 6 x Line 6))) x Line 5
20. Amount per Low Income Count $355.00
21. FY 13 GROSS POVERTY ENTITLEMENT $0.00
22. GROSS FORMULA ENTITLEMENT $148,832,074.91Projected Proration
PercentageGross GSA after
ProrationImpact of Proration
Projected Proration
PercentageGross GSA after
ProrationImpact of Proration
23. GROSS GENERAL STATE AID $148,832,074.91 100.0000% $ 148,832,074.91 $ 0.00

illinoispolicy | 33
3.4- Chicago fiscal year 2013 General State Aid entitlement without Property Tax Extension Limitation Law Adjustment with tax increment financing property value included
Projected General State Aid WorksheetProjected General State Aid WorksheetProjected General State Aid WorksheetProjected General State Aid WorksheetProjected General State Aid WorksheetProjected General State Aid Worksheetfor the 2011-2012 Claim Payable in 2012-2013for the 2011-2012 Claim Payable in 2012-2013for the 2011-2012 Claim Payable in 2012-2013for the 2011-2012 Claim Payable in 2012-2013for the 2011-2012 Claim Payable in 2012-2013for the 2011-2012 Claim Payable in 2012-2013
Foundation Level = $6,119.00Yellow cells for tax capped districts only
DATA SECTION
1A. 2010 Adjusted Real EAV $99,102,132,699 2009-2010 ADA2009-2010 ADA 349,196.051B. GSA EAV used for FY 2012 $50,004,115,031 2010-2011 ADA2010-2011 ADA 347,221.831C. Current Year PTABs $0 2011-2012 ADA2011-2012 ADA 349,469.511D. Alternative Exemption (7% Cap) $6,009,656,3801. GSA EAV used for FY 2013 $99,102,132,699 Three-Year Average ADAThree-Year Average ADA 348,629.13 2009 DHS Low Income Count 308,941 2. ADA Used for GSA2. ADA Used for GSA 349,469.51 2010 DHS Low Income Count 317,093 2011 DHS Low Income Count 324,382 5. AVG DHS Low Income Count 316,805.33 3. 2010 CPPRT (Rec'd in 2011)3. 2010 CPPRT (Rec'd in 2011) $167,923,445.256. District Low Income Concentration 0.9065 4. Calculation Rate4. Calculation Rate 0.0300
(Unit=.0300, Elementary=.0230, High School=.0105)(Unit=.0300, Elementary=.0230, High School=.0105)(Unit=.0300, Elementary=.0230, High School=.0105)7. Available Local Resources $3,140,987,426.22 Tax Capped Districts OnlyTax Capped Districts OnlyTax Capped Districts Only8. Available Local Resources per ADA $8,987.87 2010 Original EAV2010 Original EAV $09. Percentage of Foundation Level 1.4688 2010 Limiting Rate2010 Limiting Rate 0.00000
2009 Original EAV2009 Original EAV $01997-98 Hold Harmless Base 2009 OTR 0.00000EAV Used in GSA Calculations Real EAV 2010 Extension Limitation Ratio2010 Extension Limitation Ratio Not Applicable
SECTION A - FOUNDATION FORMULASECTION A - FOUNDATION FORMULASECTION A - FOUNDATION FORMULASECTION A - FOUNDATION FORMULASECTION A - FOUNDATION FORMULA
10. Foundation Level X ADA $0.0011. Available Local Resources $0.0012. FOUNDATION FORMULA AMOUNT $0.00
SECTION B - ALTERNATE FORMULASECTION B - ALTERNATE FORMULASECTION B - ALTERNATE FORMULASECTION B - ALTERNATE FORMULASECTION B - ALTERNATE FORMULA
13. Line 9 minus .93 0.5388 14. Line 13 divided by .8214. Line 13 divided by .82 0.657015. Line 14 times .02 0.0131 16. .07 minus Line 1516. .07 minus Line 15 0.056917. Amount per ADA $348.1718. ALTERNATE FORMULA AMOUNT $121,674,799.29
SECTION C - FLAT GRANT FORMULASECTION C - FLAT GRANT FORMULASECTION C - FLAT GRANT FORMULASECTION C - FLAT GRANT FORMULASECTION C - FLAT GRANT FORMULA
19. FLAT GRANT FORMULA AMOUNT $0.00 ($218 x ADA)
SECTION D - POVERTY GRANTSECTION D - POVERTY GRANTSECTION D - POVERTY GRANTSECTION D - POVERTY GRANTSECTION D - POVERTY GRANT
If Line 6 < .15 then Poverty Grant = $355 x Line5Poverty Grant = $355 x Line5Poverty Grant = $355 x Line5Else Poverty Grant = (294.25 + (2700 x (Line 6 x Line 6))) x Line 5Poverty Grant = (294.25 + (2700 x (Line 6 x Line 6))) x Line 5Poverty Grant = (294.25 + (2700 x (Line 6 x Line 6))) x Line 5Poverty Grant = (294.25 + (2700 x (Line 6 x Line 6))) x Line 5
20. Amount per Low Income Count $2,512.84
21. FY 13 GROSS POVERTY ENTITLEMENT $796,081,105.43
22. GROSS FORMULA ENTITLEMENT $121,674,799.29Projected Proration
PercentageGross GSA after
ProrationImpact of Proration
Projected Proration
PercentageGross GSA after
ProrationImpact of Proration
23. GROSS GENERAL STATE AID $917,755,904.72 100.0000% $ 917,755,904.72 $ 0.00
illinoispolicy | 34
Endnotes
1 GSA’s actual appropriation is $4.3 billion after proration.2 Data directly from the Illinois State Board of Education (ISBE).3 Ibid.4 ISBE, General State Aid Entitlement for 2011-2012 – Payable 2012-2013, Chicago School District 299 ISBE, General State Aid Entitlement for 2011-2012 – Payable 2012-2013, Porta Community School District 2025 Illinois State Board of Education, “Annual Report 2012,” http://www.isbe.state.il.us/reports/annual12/report.pdf6 Ibid.7 Ibid.8 U.S. Census Bureau, “2011 Annual Survey of Local Government Finances-School Systems” http://www.census.gov/govs/school/9 Excluding alternative, laboratory and safe school districts.10 Illinois Local Education Agency Retrieval Network, http://webprod1.isbe.net/ilearn/ASP/index.asp.11 “Pensions vs. schools,” Illinois Policy Institute (January 2012), http://illinoispolicy.org/news/article.asp?ArticleSource=4597.12 ISBE, “FY2013 Enacted Operating Budget,” http://www.isbe.state.il.us/budget/fy13/fy13_budget.pdf.13 ISBE, “Overview of General State Aid,” http://www.isbe.state.il.us/funding/pdf/gsa_overview.pdf.14 For the GSA budget, the state assumes that property tax rates are set at 2.30 percent for elementary districts, 1.05 percent for high school districts and 3.00 percent for unit districts.15 Foundation Districts have local property tax revenue per student below 93 percent of the Foundation Level.16 ISBE, General State Aid Entitlement for 2011-2012 – Payable 2012-2013, East St Louis School District 18917 ISBE, General State Aid Entitlement for 2011-2012 – Payable 2012-2013, New Trier High School District 20318 Data directly from ISBE.19 Illinois State Board of Education, “Annual Report 2012,” http://www.isbe.state.il.us/reports/annual12/report.pdf.20 Education Funding Advisory Board, “Illinois Education Funding Recommendations” (January 2011), http://www.isbe.state.il.us/efab/pdf/final_report_1-11.pdf.21 Data directly from ISBE.22 These values consists of all property wealth in each region, including all property underreported to the state due to subsidies included in the education funding formula. This includes $17 billion in excluded property wealth from TIF districts and $75 billion in excluded property wealth in property tax-capped districts.23 Illinois Department of Revenue, http://tax.illinois.gov/localgovernment/PropertyTax/ptell.htm24 Illinois Department of Revenue, “History of PTELL” (Aug. 2012), http://tax.illinois.gov/LocalGovernment/PropertyTax/PTELLcounties.pdf25 This does not include nearly $11 billion of property located in Tax Increment Financing districts26 Data directly from ISBE.27 Ibid.28 Ibid.29 Cook County Clerk’s Office, “2012 TIF Revenue Report” (July, 2013), http://www.cookcountyclerk.com/tsd/DocumentLibrary/2012%20TIF%20Revenue%20Report.pdf30 Illinois Compiled School Code, http://www.ilga.gov/legislation/ilcs/fulltext.asp?DocName=010500050K18-8.05
illinoispolicy | 35
31 Data directly from the Illinois Department of Revenue32 Ibid.33 Ibid.34 Education Funding Advisory Board, “Illinois Education Funding Recommendations” (Jan. 2011), http://www.isbe.state.il.us/efab/pdf/final_report_1-11.pdf35 Ibid.36 U.S. Census Bureau, “Poverty Thresholds 2012,” http://www.census.gov/hhes/www/poverty/data/threshld/, Median household income in Illinois is $56,576.37 ISBE, “Overview of General State Aid,” http://www.isbe.state.il.us/funding/pdf/gsa_overview.pdf38 ISBE, General State Aid Entitlement for 2011-2012 – Payable 2012-2013, Quincy School District 172 ISBE, General State Aid Entitlement for 2011-2012 – Payable 2012-2013, Porta Community School District 20239 Data directly from ISBE.40 Ibid.41 Illinois State Board of Education, “Annual Report 2012,” http://www.isbe.state.il.us/reports/annual12/report.pdf42 ISBE, Overview of General State Aid,” http://www.isbe.state.il.us/funding/pdf/gsa_overview.pdf
Guarantee of quality scholarshipThe Illinois Policy Institute is committed to delivering the highest quality and most reliable research on matters of public policy.
The Institute guarantees that all original factual data (including studies, viewpoints, reports, brochures and videos) are true and correct, and that information attributed to other sources is accurately represented.
The Institute encourages rigorous critique of its research. If the accuracy of any material fact or reference to an independent source is questioned and brought to the Institute’s attention in writing with supporting evidence, the Institute will respond. If an error exists, it will be corrected in subsequent distributions. This constitutes the complete and final remedy under this guarantee.