oci tracker benchmark study - home - ofcom tracker benchmark study ‘deep dive’ analysis report...
TRANSCRIPT

OCI Tracker Benchmark Study
‘Deep Dive’ Analysis Report
Prepared for Ofcom
By Kantar Media
www.kantarmedia.com

1 | P a g e
Contents
1. Key findings .................................................................................................................................................... 3
2. Research overview ......................................................................................................................................... 6
2.1 Background and objectives ............................................................................................................................................... 6
3. Decile analysis: A more detailed look at the Top 20% Infringers .................................................................... 7
3.1 Overview and summary of decile analysis ....................................................................................................................... 7
3.2 Decile breakdown .............................................................................................................................................................. 7
3.3 Demographic profiles ........................................................................................................................................................ 8
3.4 Digital content consumption ............................................................................................................................................ 9
3.5 Spend ............................................................................................................................................................................... 11
3.6 Attitudes towards infringement ..................................................................................................................................... 12
4. Segmentation of infringers ........................................................................................................................... 15
4.1 Overview and summary of infringing segments ............................................................................................................ 15
4.2 Reason for infringing ....................................................................................................................................................... 16
4.3 Levels of copyright infringement .................................................................................................................................... 17
4.4 Demographic profiles ...................................................................................................................................................... 18
4.5 Digital content consumption .......................................................................................................................................... 19
4.6 Spend among infringing segments ................................................................................................................................. 22
4.7 Other attitudes towards infringement ........................................................................................................................... 23
5. Segmentation of non-infringers ................................................................................................................... 25
5.1 Overview and summary of non-infringing segments .................................................................................................... 25
5.2 Reasons for downloading and streaming ....................................................................................................................... 26
5.3 Demographic profiles ...................................................................................................................................................... 27
5.4 Digital content consumption levels ................................................................................................................................ 27
5.5 Spend among non-infringing segments ......................................................................................................................... 29
6. Comparing the infringing and non-infringing segments ............................................................................... 31
6.1 Overview and summary of segment comparison .......................................................................................................... 31
6.2 Distribution of segments within total volume of digital consumption ......................................................................... 32
6.3 Digital content consumption .......................................................................................................................................... 33
6.4 Spend ............................................................................................................................................................................... 34
6.5 Attitudes towards infringement ..................................................................................................................................... 35
7. Infringement of multiple content types ....................................................................................................... 38
7.1 Overview and summary of infringement of multiple content types ............................................................................ 38
7.2 Breakdown of groups ...................................................................................................................................................... 38
7.3 Volume of infringement .................................................................................................................................................. 39
7.4 Demographic profiles ...................................................................................................................................................... 39
7.5 Attitudes .......................................................................................................................................................................... 40
7.6 Spend ............................................................................................................................................................................... 42

2 | P a g e
8. Spend analysis among infringers .................................................................................................................. 43
8.1 Overview and summary of spend analysis among infringers ........................................................................................ 43
8.2 Top-level relationship between infringement and spend ............................................................................................. 44
8.3 Willingness to pay - music............................................................................................................................................... 46
9. Technical appendix ....................................................................................................................................... 48
9.1 The database used for all analysis .................................................................................................................................. 48
9.2 Analysis methods ............................................................................................................................................................ 48
9.3 Significance testing .......................................................................................................................................................... 50

3 | P a g e
1. Key findings
We conducted a series of in-depth analyses using the combined data sets from the first two waves of the Online Copyright Infringement tracking study. The purpose was to examine in more detail the complex relationship between general consumption, infringement, attitudes, and spend across six key content types. The work revealed the following: Decile analysis: A more detailed look at the Top 20% Infringers
Infringers were segmented into 10% groups according to the overall volume of content they indicated they had accessed illegally. The main findings were as follows:
The Top 10% Infringers accounted for just 1.6% of the 12+ internet user population, but were responsible for 79% of infringed content. The Top 20% infringers, accounting for 3.2% of 12+ internet users, were responsible for 88% of infringements.
Infringers were more male, 16-34 and ABC1 than the general internet population. However, the Top 20% Infringers were even more likely to be male and 16-34 than the Bottom 80%. (We used the Top 20% Infringers rather than the Top 10% Infringers as the larger sample size makes comparisons more robust).
Despite their high levels of infringement, the Top 20% Infringers also accounted for 11% of the legal content consumed.
The Top 20% Infringers also spent significantly more across all content types on average than either the Bottom 80% Infringers or the non-infringing consumers (£168 vs. £105 vs. £54 over the six month period covered)1.
Infringing segments
As well as segmenting by volume of content infringed, we also segmented infringers by their reasons for doing it. This resulted in four distinct infringing groups:
1. Justifying Infringers (9% of infringers, 24% of infringed volume, 2% of total digital consumers): This group had the highest levels of infringement. They felt they had spent enough on content already, and this sentiment was confirmed by their high total spend offline. Most of their digital consumption was streamed and primarily related to music, though they also consumed the highest proportion of illegal books across the segments. Generally, they like to try before they buy (related to their willingness to spend) and appear to be the most receptive to good/well-priced legal alternatives.
2. Digital Transgressors (9% of infringers, 22% of infringed volume, 2% of total digital consumers): This was the youngest infringing group, with the majority in education. They had the highest levels of downloading behaviour and had higher consumption of films and TV programmes than the other high infringing group (Justifying Infringers). This group showed the least remorse about infringing material, but also had the highest fear of getting caught. In fact, they appeared to be the most receptive to receiving letters from ISPs alleging infringement.
1 It’s important to bear in mind that the data in this analysis were collected three months apart. Respondents were asked about their consumption levels over the past 3 months and therefore any respondent level calculations (e.g. mean scores) reflect that three month period. However, as the data set is combined over 2 waves (each pertaining to the previous 3 months) any incidences where the consumption volume has been aggregated (e.g. volume) reflects 6 months’ worth of consumption.
4 | P a g e
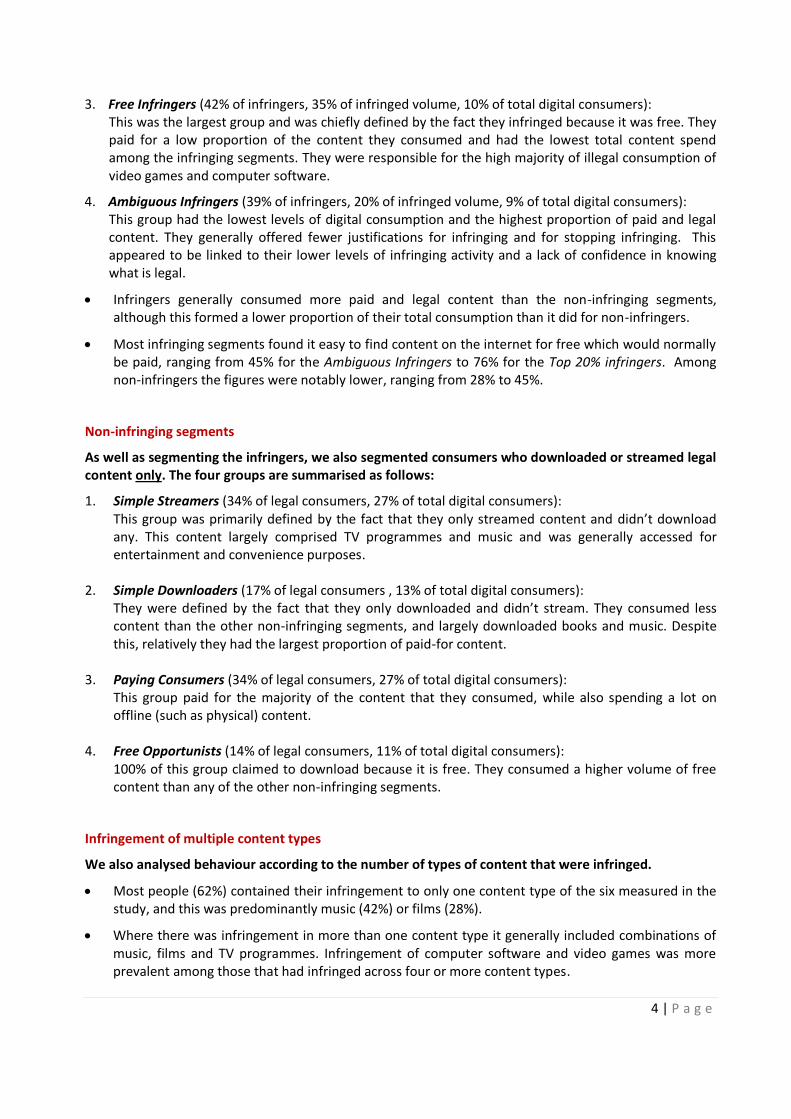
3. Free Infringers (42% of infringers, 35% of infringed volume, 10% of total digital consumers): This was the largest group and was chiefly defined by the fact they infringed because it was free. They paid for a low proportion of the content they consumed and had the lowest total content spend among the infringing segments. They were responsible for the high majority of illegal consumption of video games and computer software.
4. Ambiguous Infringers (39% of infringers, 20% of infringed volume, 9% of total digital consumers): This group had the lowest levels of digital consumption and the highest proportion of paid and legal content. They generally offered fewer justifications for infringing and for stopping infringing. This appeared to be linked to their lower levels of infringing activity and a lack of confidence in knowing what is legal.
Infringers generally consumed more paid and legal content than the non-infringing segments, although this formed a lower proportion of their total consumption than it did for non-infringers.
Most infringing segments found it easy to find content on the internet for free which would normally be paid, ranging from 45% for the Ambiguous Infringers to 76% for the Top 20% infringers. Among non-infringers the figures were notably lower, ranging from 28% to 45%.
Non-infringing segments
As well as segmenting the infringers, we also segmented consumers who downloaded or streamed legal content only. The four groups are summarised as follows:
1. Simple Streamers (34% of legal consumers, 27% of total digital consumers): This group was primarily defined by the fact that they only streamed content and didn’t download any. This content largely comprised TV programmes and music and was generally accessed for entertainment and convenience purposes.
2. Simple Downloaders (17% of legal consumers , 13% of total digital consumers):
They were defined by the fact that they only downloaded and didn’t stream. They consumed less content than the other non-infringing segments, and largely downloaded books and music. Despite this, relatively they had the largest proportion of paid-for content.
3. Paying Consumers (34% of legal consumers, 27% of total digital consumers):
This group paid for the majority of the content that they consumed, while also spending a lot on offline (such as physical) content.
4. Free Opportunists (14% of legal consumers, 11% of total digital consumers):
100% of this group claimed to download because it is free. They consumed a higher volume of free content than any of the other non-infringing segments.
Infringement of multiple content types
We also analysed behaviour according to the number of types of content that were infringed.
Most people (62%) contained their infringement to only one content type of the six measured in the study, and this was predominantly music (42%) or films (28%).
Where there was infringement in more than one content type it generally included combinations of music, films and TV programmes. Infringement of computer software and video games was more prevalent among those that had infringed across four or more content types.
5 | P a g e
Those that infringed across multiple content types also infringed a higher volume of content on average.
Category spend was highest for those that infringed in three content types.
Spend analysis among infringers
Further analysis was undertaken to assess the complex relationship between infringement and spend on content, and to assess the revenue potential if infringement could be converted to legal consumption:
Generally, the data from the survey showed that as people consumed more infringed files they also consumed more legal files, and spent more on legal content.
Further assessment on price-sensitivity for music showed that the optimum price infringers were willing to pay (either for single downloadable tracks, or for particular premium subscriptions) generally increased as the volume of infringed content increased. (Although the optimum subscription price was below that currently charged for the first premium tier of a number of UK music streaming services, many also offer free versions, albeit with some service restrictions or limitations).
This optimum music price was mapped alongside banded illegal consumption in order to estimate potential additional monthly spend (lost revenue) if all infringed content was paid for at this price.
The data suggest that improvements to legal alternatives could potentially convert some music infringers to pay for their content (either by track or monthly) if the price was right. However, the relationship between infringement and spend is complex and the claims people make when asked questions about their likely future behaviour given changes to their options do not always closely reflect their real-life behaviour.

6 | P a g e
2. Research overview
2.1 Background and objectives
In early 2012 Ofcom commissioned research designed to track consumers’ behaviour and attitudes towards both lawful and unlawful access of copyright material using the internet, relating to six content types; music, films, TV programmes, computer software, books and video games. The primary objective of this research was to gather data and generate insight by establishing initial benchmarks and trends that could be used to assist policy making related to online copyright enforcement. This followed the adoption by Government of a recommendation made in the Hargreaves Review of Intellectual Property and Growth that Ofcom should not wait until its progress-reporting duties under the Digital Economy Act came into force to begin gathering trends and benchmarks related to consumption of content online.
The research universe for this study was all adults aged 12+ in the UK. The survey used a mixed methodology approach whereby data was collected using both an online and offline sample. All material relating to the main tracking study, including key findings and full technical details, can be found at:
http://stakeholders.ofcom.org.uk/market-data-research/other/telecoms-research/copyright-infringement-tracker/
The total sample achieved from the first two waves of the tracking study (covering the period May-October 2012) was 10,594, and this provided a robust and substantial base for the further statistical analysis in this report. The main aim of this analysis was to examine in more detail the complex relationship between general consumption, infringement, attitudes, and spend across six key content types of interest. There was a particular interest in understanding content infringers in more detail. The following streams of ‘deep dive’ analysis were undertaken:
1) Decile behavioural analysis among infringers This analysis segmented infringers into bands of 10% based on volume of content consumed illegally. This allows insight into the proportion of illegal content for which each decile of infringers is responsible. It is effectively a simple ‘behavioural’ segmentation based on the volume of infringement. In-depth profiling of the highest infringing decile groups (the top 20%) was then undertaken to allow greater understanding of high-volume infringers.
2) Attitudinal segmentations amongst infringers and non-infringers In addition to the decile behavioural analysis which segmented infringers on volume of illegal content consumed, we conducted an ‘attitudinal’ segmentation. The key inputs for this segmentation were motivations for infringing. Non-infringing consumers were also segmented separately according to their motivations for general online behaviour. Both the behavioural and the attitudinal segmentations can be used to help target groups of consumers based on their motivations.
3) Infringement of multiple content types The reports for the tracking study concentrated on general online behaviour and infringement per content type, and across all types. This extra layer of analysis was conducted in order to examine behaviour according to the number of types of content that were infringed i.e. are people actively infringing across multiple categories, and in what category combinations?
4) Spend analysis among infringers Additional analysis was undertaken to assess the complex relationship between infringement and spend on content.
Further details of the specific analysis methodologies employed can be found in the Technical Appendix at the end of this document.

7 | P a g e
3. Decile analysis: A more detailed look at the Top 20% Infringers
3.1 Overview and summary of decile analysis
For this analysis infringers were segmented into 10% groups according to the overall volume of content they indicated they had accessed illegally. The main findings were as follows:
The Top 10% Infringers accounted for just 1.6% of the 12+ internet user population, but were responsible for 79% of infringed content. The Top 20% infringers, accounting for 3.2% of 12+ internet users, were responsible for 88% of infringements.
Infringers were more male, 16-34 and ABC1 than the general internet population. However, the Top 20% Infringers were even more likely to be male and 16-34 than the Bottom 80%. (We used the Top 20% Infringers rather than the Top 10% Infringers as the larger sample size makes comparisons more robust).
Despite their high levels of infringement, the Top 20% Infringers also accounted for 11% of the legal content consumed.
The Top 20% Infringers also spent significantly more across all content types on average than either the Bottom 80% Infringers or the non-infringing consumers (£168 vs. £105 vs. £54 over the six month period covered)2.
3.2 Decile breakdown
Chart 3.2a shows the proportion of the total volume of all infringed content (consumed across all six content types) accounted for by the cumulative decile groups of infringers. The numbers below each bar show the incremental proportion of the 12+ internet population accounted for by each decile.
Chart 3.2a Proportion of total infringed volume accounted for by cumulative proportion of infringers
2 It’s important to bear in mind that the data in this analysis were collected three months apart. Respondents were asked about their consumption levels over the past 3 months and therefore any respondent level calculations (e.g. mean scores) reflect that three month period. However, as the data set is combined over 2 waves (each pertaining to the previous 3 months) any incidences where the consumption volume has been aggregated (e.g. volume) reflects 6 months’ worth of consumption.
79% 88% 92% 95% 97% 98% 99% 99% 100% 100%
10% 20% 30% 40% 50% 60% 70% 80% 90% 100%
Pro
po
rtio
n o
f to
tal i
nfi
nge
d c
on
ten
t ac
cou
ntb
ale
for
Proportion of infringers % of 12+ internet 1.6% 1.6% 1.3% 1.8% 1.6% 1.4% 1.8% 1.0% 1.6% 2.0% population (44.5m) Cumulative %: 1.6% 3.2% 4.5% 6.3% 7.9% 9.3% 11.1% 12.1% 13.7% 15.7%

8 | P a g e
Base: All infringers 12+ W1 and W2 2012 (1547)
Seventy-nine per cent of all infringed content was consumed by only 10% of infringers; this increased to 88% among 20% of infringers. The remaining 80% of infringers accounted for only 12% of infringements by volume.
Each individual content type was also examined separately, and this is shown in Table 3.2a below.
Table 3.2a Proportion of total infringed volume accounted for by cumulative proportion of infringers, by type
Base: infringers
10% 20% 30% 40% 50% 60% 70% 80% 90% 100%
Total 1547 79% 88% 92% 95% 97% 98% 99% 99% 100% 100%
Music 851 78% 88% 92% 95% 97% 98% 99% 99% 100% 100%
Films 539 72% 83% 86% 91% 94% 96% 98% 98% 100% 100%
TV programmes 568 57% 75% 84% 90% 93% 96% 97% 99% 100% 100%
Software 225 89% 93% 96% 96% 97% 99% 100% 100% 100% 100%
Books 120 68% 78% 87% 92% 94% 95% 98% 100% 100% 100%
Video Games 209 90% 93% 95% 97% 99% 100% 100% 100% 100% 100%
For all content types the top 10% accounted for well over half the volume of all infringed content. The volume attributable to this group of people was lowest for TV programmes (57%) and highest for video games (90%) and software (89%). For all content types the bottom 20% contributed to just 1-2% of overall content infringed, whereas the top 20% were responsible for at least three-quarters of it.
3.3 Demographic profiles
In order to profile those accountable for the largest proportion of illegal consumption within each content type, the top two deciles were combined to provide a robust sample size for analysis, and these are known as the ‘Top 20% Infringers.’ Throughout this analysis the Top 20% Infringers are compared against the bottom 80% in order to explore any distinguishing characteristics. As we have seen, this group accounted for three-quarters or more of the illegally consumed content for each type. However, the sample sizes for video games, computer software and books among the Top 20% Infringers were still too low (<50) to analyse by themselves.
Table 3.3a shows the demographic profile of the Top 20% Infringers compared to the bottom 80% (and infringers in general).
Table 3.3a Demographic breakdown of top 20% and bottom 80% infringers
ANY MUSIC FIMS TV PROGRAMMES
All Infringers
Top 20%
Bottom 80%
Top 20%
Bottom 80%
Top 20%
Bottom 80%
Top 20%
Bottom 80%
Base 1547 311 1236 175 676 129 410 100 468
Male 58% 65%* 56% 65% 59% 64% 62% 63% 53% Female 42% 35% 54% 35% 41% 36% 38% 37% 47%
12-15 11% 11% 11% 14% 13% 10% 9% 3% 8% 16-34 61% 74%* 57% 75%* 63% 73% 69% 74%* 57% 35-54 22% 15% 23%* 11% 20%* 15% 17% 20% 25% 55+ 7% 0% 9%* 0% 5%* 2% 5% 3% 10%
ABC1 60% 61% 60% 61% 60% 56% 60% 63% 64% C2DE 40% 39% 40% 39% 40% 44% 40% 37% 36%
Full time 40% 37% 41% 34% 41% 38% 36% 46% 39%
Part time 14% 12% 14% 12% 12% 12% 14% 13% 18%
Retired 3% 0% 3%* 0% 1% 1% 2% 2% 4%
In education 12% 14% 11% 17% 14% 10% 11% 3% 9%
Not working not looking 32% 37% 31% 37% 32% 38% 38% 36% 32%
*indicates significantly higher at the 99% level
9 | P a g e
Infringers in general were shown to skew towards males, 16-34s, and ABC1s.
Aggregating all six content types (‘Any’ including video games, computer software and books), the Top 20% Infringers were more male-skewed than the Bottom 80% Infringers (65% vs. 56%), and leaned more towards the 16-34 age bracket (74% vs. 57%). It is worth noting that less than 0.5% were aged over 55 (which shows up as zero in the table). There were no significant differences between the two groups in terms of socio-economic group.
In terms of music infringement, the top 20% infringers were more likely than the bottom 80% of infringers, to be aged 16-34 (75% vs. 63%); the same applied to TV programmes where 74% of the top 20% were aged 16-34, compared to 57% of the bottom 20%. The top 20% film infringers were not significantly demographically different to the bottom 80%.
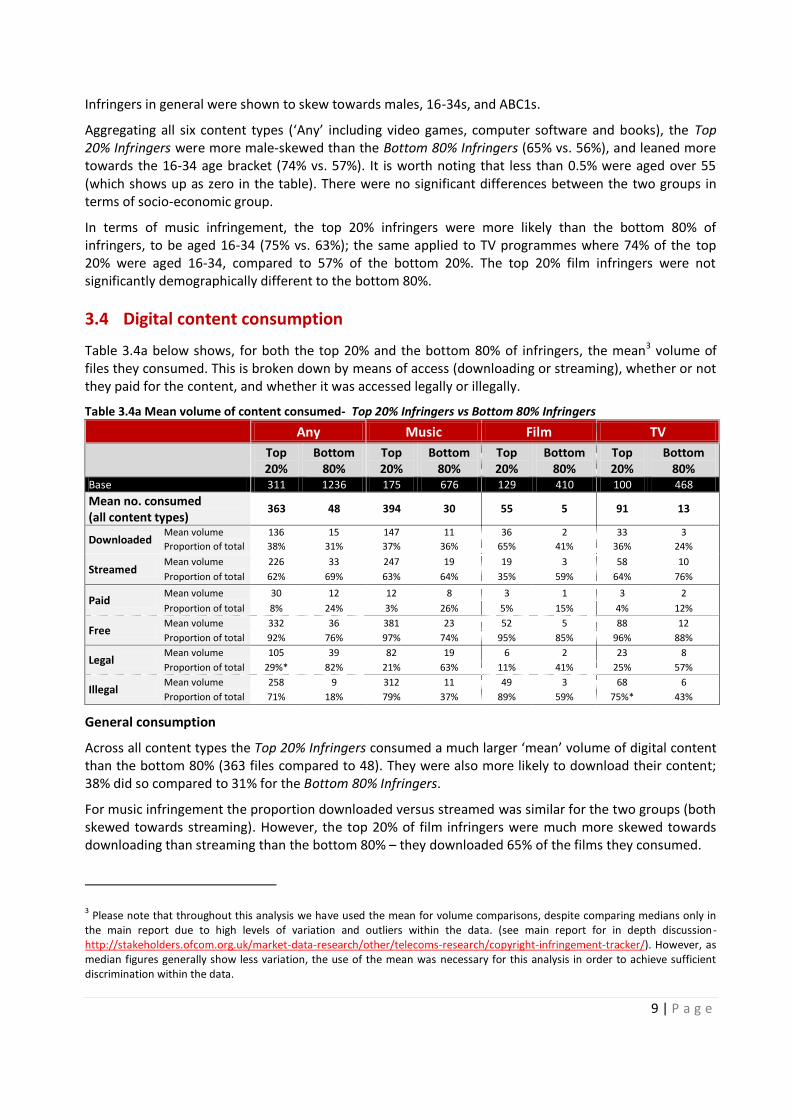
3.4 Digital content consumption
Table 3.4a below shows, for both the top 20% and the bottom 80% of infringers, the mean3 volume of files they consumed. This is broken down by means of access (downloading or streaming), whether or not they paid for the content, and whether it was accessed legally or illegally.
Table 3.4a Mean volume of content consumed- Top 20% Infringers vs Bottom 80% Infringers
Any Music Film TV
Top 20%
Bottom 80%
Top 20%
Bottom 80%
Top 20%
Bottom 80%
Top 20%
Bottom 80%
Base 311 1236 175 676 129 410 100 468
Mean no. consumed (all content types)
363 48 394 30 55 5 91 13
Downloaded Mean volume 136 15 147 11 36 2 33 3
Proportion of total 38% 31% 37% 36% 65% 41% 36% 24%
Streamed Mean volume 226 33 247 19 19 3 58 10
Proportion of total 62% 69% 63% 64% 35% 59% 64% 76%
Paid Mean volume 30 12 12 8 3 1 3 2
Proportion of total 8% 24% 3% 26% 5% 15% 4% 12%
Free Mean volume 332 36 381 23 52 5 88 12
Proportion of total 92% 76% 97% 74% 95% 85% 96% 88%
Legal Mean volume 105 39 82 19 6 2 23 8
Proportion of total 29%* 82% 21% 63% 11% 41% 25% 57%
Illegal Mean volume 258 9 312 11 49 3 68 6
Proportion of total 71% 18% 79% 37% 89% 59% 75%* 43%
General consumption
Across all content types the Top 20% Infringers consumed a much larger ‘mean’ volume of digital content than the bottom 80% (363 files compared to 48). They were also more likely to download their content; 38% did so compared to 31% for the Bottom 80% Infringers.
For music infringement the proportion downloaded versus streamed was similar for the two groups (both skewed towards streaming). However, the top 20% of film infringers were much more skewed towards downloading than streaming than the bottom 80% – they downloaded 65% of the films they consumed.
3 Please note that throughout this analysis we have used the mean for volume comparisons, despite comparing medians only in
the main report due to high levels of variation and outliers within the data. (see main report for in depth discussion- http://stakeholders.ofcom.org.uk/market-data-research/other/telecoms-research/copyright-infringement-tracker/). However, as median figures generally show less variation, the use of the mean was necessary for this analysis in order to achieve sufficient discrimination within the data.

10 | P a g e
Payment
For all content types there were differences in terms of payment between the two groups; the large majority (92% overall) of content consumed by the Top 20% Infringers was free. This compared to 76% among the Bottom 80% Infringers. However, because they consumed more content in total, the Top 20% purchased more ‘paid for’ digital files in absolute terms than the Bottom 80%.
Infringement
Legality of consumption varied heavily between the two groups – 71% of the content consumed by the Top 20% Infringers was done so illegally, compared to 18% for the bottom 80%. Films showed the highest proportion consumed illegally for both groups at 89% and 59% respectively.
Legal consumption
Chart 3.4a shows the proportion of the total volume of legal digital content accounted for by the Top 20% Infringers in comparison to the bottom 80%.
Chart 3.4a Percentage of legal volume accounted for by Top 20% Infringers
We saw previously that the Top 20% Infringers accounted for 88% of infringed content. However, they also indicated that they had consumed 11% of all the legally consumed content, despite making up only 3% of all digital consumers.
For music the Top 20% Infringers accounted for 7% of the legal content consumed but only 1% of consumers. This was similar for films and TV programmes where they accounted for 7% and 6% of legal content consumption respectively.
11% 7% 7% 6%
17% 6% 8% 8%
72% 87% 85% 86%
Total Music Films TV programmes pro
po
tio
n o
f to
tal l
egal
co
nte
nt
ac
cou
ntb
ale
for
100% legal consumers
Bottom 80% infringers
Top 20% infringers

11 | P a g e
Online services used
Table 3.4b below shows the Top 10 services used by the Top 20% and Bottom 80% Infringers over the last 3 months to download, stream or share content over all the different content types.
Table 3.4b Top 10 services used in the last 3 months for downloading, streaming or sharing content
Top 20% Infringers Bottom 80% Infringers
Base: 311 Base: 1236 YouTube 78% YouTube 59%
BBC iPlayer 51% BBC iPlayer 41%
Google(Search Engine) 42% Amazon/Kindle 31%
4OD 40% iTunes or other Apple sites 26%
Amazon/Kindle 38% Facebook 26%
uTorrent 37% Google (Search Engine) 25%
iTunes or other Apple sites 36% ITV Player 23%
Facebook 34% 4OD 22%
ITV Player 29% uTorrent 18%
Pirate Bay 29% Email 15%
Mean number of services used: 8 Mean number of services used: 5
YouTube and BBC iPlayer were the most used services for both groups. However, the Top 20% Infringers
claimed to use more services on average (8 vs. 5) than the bottom 80%, and were significantly more likely
to use peer-to-peer and cyberlocker services.4 As well as uTorrent (37% vs. 18%), which appeared in the
top 10 for both, the differences were also notable for Pirate Bay (29% vs. 9%), Isohunt (18% vs. 6%),
MediaFire (16% vs. 5%), and Rapidshare (19% vs. 6%). (The Pirate Bay figures are particularly interesting in
the context of the blocks imposed by larger ISPs following a court order in 2012).
3.5 Spend
Chart 3.5a shows total spend across all content types split by physical copies, digital content and ‘other’5.
Chart 3.5a Mean spend on physical, digital and ‘other’ content in the last three months
Base: Top 20% Infringers (311) Bottom 80% infringers (1236) Non infringers (3974)
The Top 20% Infringers indicated that they had spent significantly more in total in the past three months (£168) than both the Bottom 80% Infringers (£105) and the non-infringing consumers (£54). In fact they spent more on all categories - digital content, physical content and ‘other’.
4 Peer-to-peer (net) consists of Bittorrent software, uTorrent, Pirate Bay, Isohunt, Limewire, eDonkey/eMule, Gnutella, KickAssTorrents, and Torrentz. Cyberlockers consists of Rapidshare, MediaFire and YouSendit. 5 Other category spend includes: Music = Concerts/gigs and Music merchandise, Films = Cinema, Physical rentals,
and Pay-TV purchases, TV programmes = Physical rentals
£77 £56 £50
£29
£13 £11
£61
£37 £34
£168
£105 £95
Top 20% infringers Bottom 80% infrnigers 100% legal consumers
Mea
n s
pen
d in
th
e la
st 3
m
on
ths Other
Digital
Physcial

12 | P a g e
3.6 Attitudes towards infringement
Respondents who specifically indicated that they had infringed were asked: You indicated you have downloaded or streamed the following types of files in the past three months which you think may have been done so illegally [CONTENT TYPES]. What are your personal reasons for doing this?
Table 3.6a summarises the responses among the Top 20% Infringers and Bottom 80% Infringers. The colour coding represents the relative percentages between the statements, and the two groups - dark green indicates a relatively high percentage. Red indicates a relatively low percentage.
Table 3.6a Reasons for infringing Top 20% Bottom 80%
Base 311 1236
It's free 70%* 48%
It's quick 61%* 38%
It's easy\convenient 59%* 44%
I think legal content is too expensive 37%* 11%
It means I can try something before I buy it 36%* 23%
Because I can 35%* 16%
I can't afford to pay 33%* 14%
I already spend enough on content 21%* 8%
I already owned content in another format 19%* 12%
I don't want to wait for content to become available on legal services 19%* 8%
The files I want are not available on legal services 18%* 9%
The Industry makes too much money 20%* 9%
It's what my friends or family do 18%* 6%
I've already paid to see it\them at the cinema\in concert, etc 17%* 8%
I don't think I should have to pay for content online 13%* 5%
No one suffers 13%* 4%
No one ever gets caught 8%* 2%
I think legal content is too poor quality 5%* 2%
*indicates significantly higher at the 99% level
The Top 20% Infringers had more strength of response across the board, with a higher percentage citing all reasons for infringing content. Both the Top 20% Infringers and the Bottom 80% Infringers specified ‘its quick’ ‘it’s free’ and ‘it’s easy’ as their top reasons for infringing, but the actual proportions were higher among the former group. The most significant differences between the two groups were for the responses - ‘I think legal content is too expensive’ (37% vs. 11%), ‘I can’t afford to pay’ (33% vs. 14%), and ‘Because I can’ (35% vs. 16%).

13 | P a g e
Infringers were also asked the following question:
And which, if any, of the following do you think would make you stop downloading or streaming files illegally?
Table 3.6b summarises the responses among the Top 20% Infringers and Bottom 80% Infringers:
Table 3.6b Factors that would encourage infringers to stop Top 20% Bottom 80%
Base 311 1236
If legal services were cheaper 46%* 31%
If everything I wanted was available legally 34%* 26%
If a subscription service I was interested in became available 31%* 14%
If legal services were more convenient\flexible 29%* 14%
If everything I wanted was available legally online as soon as released elsewhere 29%* 20%
If my ISP sent me a letter saying they would suspend my internet access 28%* 18%
If legal services were better 27%* 16%
If it is clearer what is legal and what isn't 27% 26%
If I thought I might be sued 25% 19%
If I thought I might be caught 23%* 15%
If friends or family were caught 23%* 12%
If my ISP sent me a letter saying they would restrict my internet speed 18%* 12%
If my ISP sent me a letter informing me my account had been used to infringe 16% 12%
If everyone else stopped doing it 15% 11%
If I knew where to go to see if something was illegal or not 12% 14%
If there were articles in the media about people being caught 10% 6%
Nothing would make me stop 5% 6%
Other reason 1% 2%
*indicates significantly higher at the 99% level
Again, the Top 20% Infringers scored higher on most responses related to factors that would encourage
them to stop infringing. Almost half of the Top 20% Infringers claimed they would stop if legal services
were cheaper (46%). The most notable difference between the top 20% and the bottom 80% was for ‘If a
subscription service I was interested in became available’ (31% vs. 14%). Around a quarter of both groups
said they would stop if it was clearer what was and wasn’t legal (27% among the Top 20% Infringers
versus 26% among the Bottom 80%).

14 | P a g e
All internet users were asked the following question:
How confident are you that you know what is legal and what isn’t in terms of downloading, streaming/accessing, and sharing content through the internet?
Chart 3.6a illustrates the relative confidence levels of the Top 20% infringers, Bottom 80% infringers, and 100% legal consumers:
Chart 3.6a Confidence in knowing what is legal and what isn’t
Base: Top 20% Infringers (311) Bottom 80% Infringers (1236) 100% legal consumers (3974) Internet users who haven’t consumed any content (3462) Note: Rebased to exclude don’t know answers
Although the Top 20% Infringers were more likely to claim to be ‘very confident’ in knowing what is legal, the difference was not significant at the 99% level. The same was true when including those who stated they were ‘slightly confident’ (71% vs. 65%).
31% 25% 30% 12%
40% 40%
42%
25%
22% 26%
21%
33%
7% 9% 8%
30%
Top 20% infringers
Bottom 80% infringers
100% legal consumers
Internet users who haven't
consumed any content
Not at all confident
Not particularly confident
Slightly confident
Very confident

15 | P a g e
4. Segmentation of infringers
4.1 Overview and summary of infringing segments
The decile behavioural analysis outlined in the previous section identified a core group of high infringers by volume of activity. However, the lack of demographic differentiation between the Top 20% and bottom 80% of infringers may make it is difficult to use that particular segmentation to target high infringers. To help with this we developed an attitudinal segmentation analysis in order to provide an alternative grouping of infringers.
Infringers were segmented by their reasons for infringing, as well as by the volume of content they infringed. This resulted in four distinct infringing groups, largely distinguished by their digital consumption and infringement behaviour, along with their attitudes towards these. In essence, this gave two smaller-sized/high-volume infringing groups (1 and 2 below), and two larger-sized/low-volume infringing groups (3 and 4 below)6:
1. Justifying Infringers (9% of infringers, 24% of infringed volume, 2% of total digital consumers7): This group had the highest levels of infringement. They felt they had spent enough on content already, and this sentiment was confirmed by their high total spend offline. Most of their digital consumption was streamed and primarily related to music, though they also consumed the highest proportion of illegal books across the segments. Generally, they like to try before they buy (related to their willingness to spend) and appear to be the most receptive to good/well-priced legal alternatives.
2. Digital Transgressors (9% of infringers, 22% of infringed volume, 2% of total digital consumers): This was the youngest infringing group, with the majority in education. They had the highest levels of downloading behaviour and had higher consumption of films and TV programmes than the other high infringing group (Justifying Infringers). This group showed the least remorse about infringing material, but also had the highest fear of getting caught. In fact, they appeared to be the most receptive to receiving letters from ISPs alleging infringement.
3. Free Infringers (42% of infringers, 35% of infringed volume, 10% of total digital consumers): This was the largest group and was chiefly defined by the fact they infringed because it was free. They paid for a low proportion of the content they consumed and had the lowest total content spend among the infringing segments. They were responsible for the high majority of illegal consumption of video games and computer software.
4. Ambiguous Infringers (39% of infringers, 20% of infringed volume, 9% of total digital consumers): This group had the lowest levels of digital consumption and the highest proportion of paid and legal content. They generally offered fewer justifications for infringing and for stopping infringing. This appeared to be linked to their lower levels of infringing activity and a lack of confidence in knowing what is legal.
6 There were approximately 7% of digital consumers (including infringers) missing from the segmentations as only complete data could be used in the cluster analysis; therefore people who did not answer the relevant questions or answered with undefinable responses such as DK, N/A ad ‘other’ had to be excluded from the analysis.
7 Digital consumers in this sense are people that have claimed to have downloaded or streamed content in the last 3
months.

16 | P a g e
4.2 Reason for infringing
The primary input for the segmentation of infringers was ‘reasons for infringing’, taken from the question:
1) You indicated you have downloaded or streamed the following types of files in the past three months which you think may have been done so illegally [CONTENT TYPES]. What are your personal reasons for doing this?
The responses to this question were shown to be good discriminators between infringing groups, so using them as the basis for the segmentation may help with targeting infringers.
Table 4.2 summarises the proportion of each group that cited each reason for infringing. Again, the colours compare the relative percentages within statements and between the groups i.e. dark green indicates a relatively high percentage. Red indicates a relatively low percentage.
Table 4.2 Reasons for infringing content
Justifying Infringers
Digital Transgressors
Free Infringers
Ambiguous Infringers
Base 105 133 498 439
I've already paid to see it\them at the cinema\in concert, etc 84% 14% 2% 3%
It's easier\convenient 74% 75% 51% 39%
It means I can try something before I buy it 73% 58% 21% 19%
It's free 71% 80% 100% 3%
It's quick 68% 69% 55% 28%
I already owned content in another format 64% 18% 4% 14%
I think legal content is too expensive 55% 53% 14% 6%
I can't afford to pay 47% 50% 17% 8%
I already spend enough on content 44% 21% 6% 9%
The Industry makes too much money 37% 32% 6% 9%
Because I can 33% 63% 17% 14%
The files I want are not available on legal services 28% 15% 9% 11%
I don't think I should have to pay for content online? 21% 26% 5% 3%
I don't want to wait for content to become available on legal services 18% 27% 9% 8%
No one ever gets caught 13% 27% 2% 4%
It's what my friends or family do 9% 88% 1% 1%
No one suffers 2% 29% 0% 2%
Note: Full significance testing (at the 99% level) is detailed in the appendix – Section 9.3
As shown above, all four segments cited ‘ease\convenience’ as a key reason for infringing. However, they can also be differentiated according to the degree of variation for the other responses:
The Justifying Infringers were six times more likely to give the reason ‘I’ve already paid to see it\them at the cinema\ in concert etc.’ compared to Digital Transgressors – the group with the next highest score on this statement (84% vs. 14%). Another defining reason for this group was ‘I can try something before I buy it’ (73%).
The Digital Transgressors were around eight times more likely to give the reason ‘it’s what my friends or family do’ (88%) than any other segment; their highest claimed reason for infringing.
The main motivation of the Free Infringers was because it is free: 100% of this group gave this as a reason for infringing.
The Ambiguous Infringers generally gave comparatively fewer reasons for infringing. For example, only 39% gave ‘because it is easy\convenient’ as a reason, the lowest of all groups (despite this being their top answer).
17 | P a g e
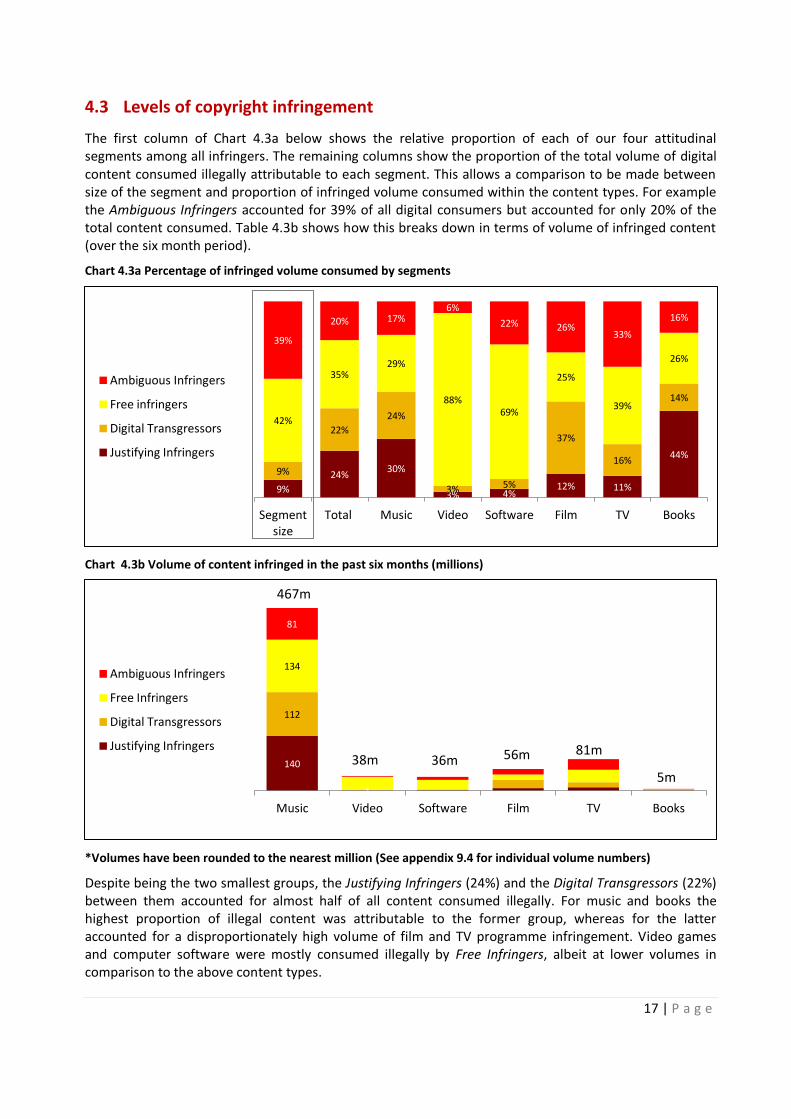
4.3 Levels of copyright infringement
The first column of Chart 4.3a below shows the relative proportion of each of our four attitudinal segments among all infringers. The remaining columns show the proportion of the total volume of digital content consumed illegally attributable to each segment. This allows a comparison to be made between size of the segment and proportion of infringed volume consumed within the content types. For example the Ambiguous Infringers accounted for 39% of all digital consumers but accounted for only 20% of the total content consumed. Table 4.3b shows how this breaks down in terms of volume of infringed content (over the six month period).
Chart 4.3a Percentage of infringed volume consumed by segments
Chart 4.3b Volume of content infringed in the past six months (millions)
*Volumes have been rounded to the nearest million (See appendix 9.4 for individual volume numbers)
Despite being the two smallest groups, the Justifying Infringers (24%) and the Digital Transgressors (22%) between them accounted for almost half of all content consumed illegally. For music and books the highest proportion of illegal content was attributable to the former group, whereas for the latter accounted for a disproportionately high volume of film and TV programme infringement. Video games and computer software were mostly consumed illegally by Free Infringers, albeit at lower volumes in comparison to the above content types.
9%
24% 30%
3% 4% 12% 11%
44%
9%
22%
24%
3% 5%
37%
16%
14%
42%
35% 29%
88% 69%
25%
39%
26%
39%
20% 17% 6%
22% 26% 33%
16%
Segment size
Total Music Video Software Film TV Books
Ambiguous Infringers
Free infringers
Digital Transgressors
Justifying Infringers
140
1
112
134
81
Music Video Software Film TV Books
Ambiguous Infringers
Free Infringers
Digital Transgressors
Justifying Infringers
467m
38m 36m 56m 81m
5m

18 | P a g e
Table 4.3a below shows the mean volume of content consumed legally and illegally, along with the relative proportion of all content consumed by that particular segment.
Table 4.3a Mean volume of content consumed by infringing segments Volume of content consumed Justifying
Infringers Digital
Transgressors Free
Infringers Ambiguous Infringers
Base 105 133 498 439
Total Mean volume 279 257 113 86
Legal Mean volume 106 103 59 54
Proportion of total 38% 40% 52% 63%
Illegal Mean volume 173 155 54 32
Proportion of total 62% 60% 48% 37%
The Justifying Infringers obtained the lowest proportion of content legally (38%), but nevertheless accounted for the highest number of legal files (106). Conversely, the Ambiguous Infringers obtained the highest proportion (63%) of their files legally, but accounted for the smallest number of files (54).
Table 4.3b below shows the proportional breakdown of the top 20% of infringers by the infringing segments:
Table 4.3b Proportion of each infringing segment in Top 20% Infringers Top 20% Infringers
Proportion of infringers
Total Top 20%
Music Top 20%
Film Top 20%
TV Programmes Top 20%
Justifying Infringers 9% 16% 15% 12% 13%
Digital Transgressors 9% 19% 19% 22% 19%
Free Infringers 42% 41% 42% 41% 44%
Ambiguous Infringers 39% 24% 24% 25% 24%
Across all content types the Justifying infringers and the Digital Transgressors account for a larger proportion of top 20% infringers relative to their penetration in the total infringing population. For example, the Digital transgressors account for 22% of the top 20% of film infringers despite accounting for only 9% of all infringers.
4.4 Demographic profiles
Table 4.4 shows the demographic profiles of the infringing segments:
Table 4.4 Demographic profiles of infringing segments
Justifyng Infringers
Digital Transgressors
Free Infringers
Ambiguous Infringers
All infringers
All internet users (12+)
Base 105 133 498 439 1175 9138
Male 58% 57% 64% 57% 60% 49% Female 42% 43% 36% 43% 40% 51%
12-15 10% 21% 11% 9% 11% 7% 16-34 70% 65% 65% 61% 64% 35% 35-54 19% 14% 20% 24% 21% 34% 55+ 2% 0% 4% 7% 5% 24%
ABC1 58% 59% 62% 60% 60% 57%
C2DE 42% 41% 39% 40% 40% 36%
Full Time 27% 33% 39% 44% 40% 40% Part Time 19% 13% 13% 13% 14% 15% Retired - - 1% 2% 1% 12% In education 11% 21% 12% 10% 12% 7% Not working not looking 44% 32% 36% 30% 34% 27%

19 | P a g e
The proportions of males and females within all the infringing groups were generally in line with the total infringing population, showing a bias towards males (60%). However, the segments became more distinct when looking at age - The Justifying Infringers and the Digital Transgressors had a higher proportion aged under 35 (80% and 86% respectively), with the latter having significantly more infringers aged 12-15 (21%). These two groups had a lower proportion in work in comparison to the other infringing groups (46%). For the Digital Transgressors a relatively high proportion were in education (21%).
4.5 Digital content consumption
Table 4.5a shows the mean volume of content consumed (including both legal and illegal content) among the different infringing segments. This is broken down by means of access (streaming or downloading) and by how much of the content was paid for.
Table 4.5a Mean volume of content consumed by infringing segments
Justifying Infringers
Digital Transgressors
Free Infringers
Ambiguous Infringers
Base 105 133 498 439
Total Mean volume 279 257 113 86
Downloaded Mean volume 68 132 34 28 Proportion of total 24% 51% 31% 33%
Streamed Mean volume 211 125 78 58 Proportion of total 76% 49% 69% 67%
Paid Mean volume 27 39 11 20 Proportion of total 10% 15% 10% 23%
Free Mean volume 252 218 102 66 Proportion of total 90% 85% 90% 77%
General consumption The Justifying Infringers streamed a higher proportion of the content they consumed (76%) than the other infringing groups, While the Digital Transgressors had the largest proportion of downloaded content (51%). But in volume terms both groups downloaded and streamed substantially more than either the Free Infringers or the Ambiguous Infringers.
Payment
Despite having high levels of infringement the Digital Transgressors consumed the highest mean volume of paid-for digital content (39 files). Conversely, the Free Infringers consumed only 11 paid files on average, equating to 10% of their total consumption. The Ambiguous Infringers had the highest proportion of paid content (23%).
Content types Chart 4.5a and chart 4.5b show how total digital content consumption (lawful and unlawful, streamed and downloaded) for each of the infringing segments is split between the six content types.

20 | P a g e
Chart 4.5a Digital consumption among infringers split by content type
Chart 4.5b Volume of content consumed in the past six months (millions)
*Volumes have been rounded to the nearest million (See appendix 9.4 for individual volume numbers)
For all infringing segments, music made up the largest proportion of total digital volume consumed (ranging from 62% for Free Infringers to 80% for Justifying Infringers). This was largely because we treat a single music track as a single digital file, equivalent to a film or book. Across the segments, the Free Infringers accounted for the largest proportion of TV programmes (17%) and video games (8%) consumed, while the Ambiguous Infringers had the highest proportion attributed to films (16%).
80% 71%
62% 68%
5% 12%
5%
16%
9% 11%
17%
7% 7% 5% 8%
Justifying Infringers Digital Transgressors Free Infringers Ambiguous Infringers
Books
Video games
Software
TV
Film
Music
210 177
313 242
84
58
Justifying Infringers Digital Transgressors Free Infringers Ambiguous Infringers
Books
Video games
Software
TV
Film
Music
262m 254m
503m
357m

21 | P a g e
Services used Table 4.5b shows the top 10 services used to download, stream, access or share content across all content types for each of the infringing segments.
Table 4.5b Top 10 services used in the last 3 months for downloading, streaming or sharing content
Justifying Infringers Digital Transgressors Free Infringers Ambiguous Infringers
Base = 105 Base = 133 Base = 498 Base=439
YouTube 78% YouTube 84% YouTube 68% YouTube 60%
BBC iPlayer 60% BBC iPlayer 49% BBC iPlayer 50% BBC iPlayer 41%
Google (Search) 53% Facebook 47% 4OD 32% Amazon/Kindle 35%
4OD 52% iTunes 44% Amazon/Kindle 30% iTunes 29%
iTunes 46% ITV Player 42% iTunes 30% Google (Search) 29%
Amazon/Kindle 45% Google (Search) 40% Google (Search) 29% Facebook 26%
Facebook 41% uTorrent 38% Facebook 27% ITV Player 24%
uTorrent 40% Amazon/Kindle 35% ITV Player 25% 4OD 22%
ITV Player 34% 4OD 35% uTorrent 24% Email 19%
Spotify 31% BitTorrent software 31% BitTorrent software 18% uTorrent 18%
Mean number used: 9 Mean number used: 9 Mean number used: 6 Mean number used: 5
Over 60% of all infringing segments claimed to use YouTube, more than any other digital content service Mainstream services such as BBC iPlayer, iTunes, Amazon and Facebook also featured highly for all segments.
However, the two higher-end infringing segments - the Justifying Infringers (40%) and the Digital Transgressors (38%) were much more likely to use uTorrent than the Free Infringers (24%) and the Ambiguous Infringers (18%).
There were also significant differences between the segments for some of the cyber-locker services8 (not shown on chart). For example, 23% of the Justifying Infringers and 18% of the Digital Transgressors claimed to have used Rapidshare, compared to 10% of Free Infringers and 7% of Ambiguous Infringers. Mediafire (21%) was also higher for the Justifying Infringers than for any other group.
8 Peer-to-peer (net) consists of Bittorrent software, uTorrent, Pirate Bay, Isohunt, Limewire, eDonkey/eMule, Gnutella,
KickAssTorrents, and Torrentz. Cyberlockers consists of Rapidshare, MediaFire and YouSendit.

22 | P a g e
4.6 Spend among infringing segments
Chart 4.6 shows total spend by each infringing segment across all content types, split by spend on physical copies, digital content and ‘other’9.
Chart 4.6 Spend among infringing segments
Base: Justifying Infringers (105) Digital Transgressors (498) Free Infringers (439) Ambiguous Infringers (133)
The Justifying Infringers had the highest average spend in total across the segments (£167), with the Free Infringers spending the least (£120). For all the infringing groups, physical content accounted for around half of total spend. The Justifying Infringers had the highest spend on ‘other.’ This seems to fit with their general attitude of justification.
For all infringing segments spend was highest on music, with few differences between the proportional spend on the other categories. There was evidence that the Justifying Infringers spent more on books and less on TV programmes than the other infringing groups.
9 Other category spend includes: Music = Concerts/gigs and Music merchandise, Films = Cinema, Physical rentals,
and Pay-TV purchases, TV programmes = Physical rentals
£73 £75 £58 £71
£25 £20 £16
£20
£69 £58
£46 £44
Justifying Infringers Digital Transgressors Free Infringers Ambiguous Infringers
Mea
n s
pen
d in
th
e la
st 3
m
on
ths
Other
Digital
Physcial
£167 £153
£120 £135

23 | P a g e
4.7 Other attitudes towards infringement
Respondents who specifically indicated that they had infringed were asked:
And which, if any, of the following do you think would make you stop downloading or streaming content illegally?
Table 4.7 summarises the responses among the infringing segments. The colours compare the relative percentages within statements and between the groups. Dark green indicates a strong high percentage .Red indicates a strong low percentage.
Table 4.7 Factors that would encourage infringers to stop
Justifying Infringers
Digital Transgressors
Free Infringers
Ambiguous Infringers
Base 105 133 498 439
If legal services were cheaper 83% 47% 36% 24%
If everything I wanted was available legally 47% 39% 26% 24%
If legal services were more convenient\flexible 47% 32% 16% 12%
If everything I wanted was available legally online as soon as it was released elsewhere
44% 36% 21% 17%
If it is clearer what is legal and what isn't 42% 44% 27% 23%
If legal services were better 42% 29% 16% 13%
If a subscription service I was interested in became available
37% 31% 14% 15%
If my ISP sent me a letter saying they would suspend my internet access
36% 44% 20% 14%
If I thought I might be sued 29% 39% 23% 14%
If I knew where to go to see if something was illegal or not
27% 27% 13% 13%
If my ISP sent me a letter saying they would restrict my internet speed
25% 34% 13% 9%
If my ISP sent me a letter informing me my account had been used to infringe
24% 31% 13% 9%
If friends or family were caught 21% 37% 14% 8%
If I thought I might be caught 20% 36% 22% 13%
If everyone else stopped doing it 18% 31% 13% 10%
If there were articles in the media about people being caught
16% 19% 6% 5%
Nothing would make me stop 0% 5% 6% 8%
Note: Full significance testing (at the 99% level) is detailed in the appendix – Section 9.3
For all segments the factor which most people claimed would make them stop infringing was: ‘if legal
services were cheaper’. The Justifying Infringers were over twice as likely (83%) to make this claim as the
less infringing Free Infringer (36%) and Ambiguous Infringer groups (24%).
Almost half the Justifying Infringers claimed that improvements to legal services would stop them
infringing - ‘If legal services were more convenient’ (47%) and ‘If everything I wanted was available legally’
(47%). A distinctly higher proportion of Digital Transgressors claimed that fear of repercussions and
getting caught would make them stop. Forty-four per cent of this group claimed they would stop ‘if my
ISP sent me a letter saying they would suspend my internet access’, with 37% also citing ‘if friends or
family were caught.’

24 | P a g e
Free Infringers and Ambiguous Infringers both tended to cite relatively few factors which would make
them stop infringing; probably because they infringed comparatively little. Free Infringers were most likely
to claim the availability of cheaper legal services (36%), and nearly a quarter cited the fear of being sued
(23%). For the Ambiguous Infringers the availability of legal content (24%) and subscription services (15%)
were distinctive drivers of behavioural change.
‘If it is clearer what is legal and what isn't’ was a significantly higher motive for change for Digital
Transgressors and Ambiguous Infringers than the other groups. For the latter this is in line with their
claimed levels of confidence in knowing what is legal and what isn’t; they had the largest percentage
claiming to be ‘not at all confident’ (10%, see Chart 4.7). However, a third of Digital Transgressors claimed
to be ‘very confident’ in knowing what is legal (33%).
Chart 4.7 Confidence in knowing what is legal online
Base: Justifying Infringers (105) Digital Transgressors (133) Free Infringers (498) Ambiguous Infringers (439) 100% legal consumers (3974) Internet users who haven’t consumed any content (3462) Note: Rebased to exclude don’t know answers
25% 33%
25% 26% 30% 12%
44% 34% 41% 39%
42%
25%
28% 26% 28% 25% 21%
33%
4% 7% 6% 10% 8%
30%
Justifying Infringers
Digital Transgressors
Free Infringers
Ambiguous Infringers
100% Legal Consumers
Internet users who
haven't consumed
any content
Not at all confident
Not particularly confident
Slightly confident
Very confident

25 | P a g e
5. Segmentation of non-infringers
5.1 Overview and summary of non-infringing segments
As well as segmenting the infringers, we segmented consumers who downloaded or streamed all of their content legally. This exercise was intended to help generate a wider understanding of all digital consumers. The four segments are summarised as follows10:
5. Simple Streamers (34% of legal consumers, 27% of total digital consumers11): This group was primarily defined by the fact that they streamed content but didn’t download any. This content largely consisted of TV programmes and music and they were generally consuming for entertainment and convenience purposes.
6. Simple Downloaders (17% of legal consumers , 13% of total digital consumers):
They were defined by the fact that they only downloaded and didn’t stream. They consumed less content than the other non-infringing segments, and largely downloaded books and music. They had the largest proportion of paid-for content.
7. Paying Consumers (34% of legal consumers, 27% of total digital consumers):
This group paid for the majority of the content they consumed, while also spending a lot on offline (such as physical) content.
8. Free Opportunists (14% of legal consumers, 11% of total digital consumers):
100% of this group claimed to download because it is free, and indeed they consumed the highest volume of free content within the legal segments.
10 There were approximately 7% of digital consumers (including infringers) missing from the segmentations as only complete data could be used in the cluster analysis; therefore people who did not answer the relevant questions or answered with undefinable responses such as DK, N/A ad ‘other’ had to be excluded from the analysis. 11
Digital consumers in this sense are people that have claimed to have downloaded or streamed content in the last 3 months.

26 | P a g e
5.2 Reasons for downloading and streaming
Reasons for downloading and streaming were used as the primary input for this segmentation, gauged from the following questions:
1) You indicated you have downloaded [CONTENT TYPES] in the past three months. Generally, what would you say are your personal reasons for downloading these types of content rather than buying a physical version such as a CD, DVD, Blu-ray, paper, etc.?
2) You indicated you have accessed or streamed [CONTENT TYPES] in the past three months. What are your personal reasons for doing this?
Table 5.2 summarises the proportion of each segment that cited each reason:
Table 5.2 Reasons for downloading and streaming (non-infringing segments)
Simple
Streamers Simple
downloaders Paying
consumers Free
Opportunists
Base 1338 649 1394 593
Reasons for downloading
More convenient
N/A
64% 70% 70%
Quicker 53% 56% 57%
Cheaper 43% 43% 54%
Access more easily on devices I have 29% 38% 44%
I can get them for free 15% 2% 100%
Quality isn't notably different 12% 15% 27%
More up to date 12% 15% 19%
No physical version available 12% 13% 11%
It’s what everyone does 5% 7% 12%
Reasons for streaming
It’s easy/convenient 53%
N/A
64% 67%
It’s free 46% 39% 61%
It’s quick 37% 52% 57%
It’s easy to do 35% 40% 52%
For entertainment 34% 28% 39%
To watch programmes have missed 24% 15% 18%
Means don’t have to download them 21% 23% 32%
Quicker than downloading 14% 20% 28%
Try before buy 12% 20% 29%
Cheaper than downloading 11% 12% 18%
Some content is too expensive to buy 4% 4% 9%
It’s what my friends or family do 4% 4% 8%
Note: Full significance testing (at the 99% level) is detailed in the appendix – Section 9.3
The Simple Streamers only streamed content and didn’t download any; the main reason cited for doing so was that it is ‘easy\convenient’ (53%). This group also had the largest proportion claiming to stream ‘to watch programmes I have missed’ (24%).
The Simple Downloaders claimed to download content rather than buy physical versions as it was ‘more convenient’ (64%) and ‘quicker’ (53%).
While the Paying Consumers gave the same top reasons for downloading as the Simple Downloaders they were distinct from this group in that only a very small percentage claimed to download because it was

27 | P a g e
free (2%). Similarly, their reasons for streaming were in line with the Simple Streamers but with a lower proportion claiming to stream because was is free (39%).
The Free Opportunists had the highest proportion claiming to download and stream for price reasons, with all Free Opportunists claiming to download because it was free to do so.
5.3 Demographic profiles
Table 5.3 shows the demographic profiles of the non-infringing segments:
Table 5.3 Demographic profiles of non-infringing segments
Simple Streamers
Simple Downloaders
Paying Consumers
Free Opportunists
All non-infringers
All internet users (12+)
Base 1338 649 1349 593 3974 9138
Male 44% 48% 57% 52% 50% 49% Female 57% 52% 43% 48% 50% 51%
12-15 8% 6% 10% 10% 9% 7% 16-34 39% 34% 46% 42% 41% 35% 35-54 34% 41% 32% 33% 34% 34% 55+ 20% 18% 12% 15% 16% 24%
ABC1 68% 70% 74% 69% 71% 57%
C2DE 32% 30% 26% 31% 30% 36%
Full Time 43% 46% 50% 43% 46% 40% Part Time 16% 16% 14% 15% 15% 15% Retired 7% 5% 2% 2% 4% 12% In education 8% 7% 10% 10% 9% 7% Not working not looking 26% 27% 24% 31% 26% 27%
Note: Full significance testing (at the 99% level) is detailed in the appendix – Section 9.3
Generally, there were few differences between the segments in terms of gender but the Paying Consumers had the highest proportion of males (57%).
The two segments with only one type of consumption activity (Simple Streamers and Simple Downloaders) were generally older, with fewer under 35’s than the Paying Consumers or the Free Opportunists. Although the Paying Consumers and the Free Opportunists were similar in terms of age profile, half of the former were in full time work (50%) While a third (31%) of Free Opportunists were out of work (not looking).
5.4 Digital content consumption levels
Table 5.4a shows the mean volume of content consumed by the different non infringing segments, along with the proportion of total content consumed. This is broken down by the means of accessing the content (downloading or streamed) and by whether or not the content was paid for.
Table 5.4a Mean volume of content consumed by non-infringing segments
Simple Streamers
Simple Downloaders
Paying consumers
Free Opportunists
Base 1338 649 1394 593
Total Mean volume 27 13 92 63
Downloaded Mean volume 0 13 21 23
Proportion of total - 100% 23% 37%
Streamed Mean volume 27 0 71 40
Proportion of total 100% - 77% 63%
Paid Mean volume 5 8 53 16
Proportion of total 18% 64% 57% 26%
Free Mean volume 22 5 39 47
Proportion of total 82% 36% 43% 64%

28 | P a g e
General consumption The segments that consumed content using only one means of access (downloading or streaming) consumed far fewer files on average than those who used both. Of the two groups that used both methods of consumption - Paying Consumers and the Free Opportunists - both streamed more than they downloaded, but the proportion was higher for the former (77% v 63%).
Payment The Simple Streamers consumed proportionally more (82%) of their content for free than the other legal segments. The Simple Downloaders, on the other hand, consumed the largest proportion of paid-for content (64%). However, the actual volume of paid for content among this group was relatively low (eight files on average in the last three months). The Paying Consumers had the highest mean volume in total, and also paid for over half of these (57%); this was in contrast to the Free Opportunists who also consumed a relatively high volume of content (63), but two thirds (64%) of this was obtained for free.
Content types
Chart 5.4a shows how content consumption breaks down by content type for each of the non-infringing segments:
Chart 5.4a Digital consumption among non-infringers by content type
Chart 5.4b Volume of content consumed in the past six months (millions)
*Volumes have been rounded to the nearest million (See appendix 9.4 for individual volume numbers)
57% 62% 76%
62%
5% 4% 5%
35% 12%
15% 4%
3%
4%
4%
23%
4% 11%
Simple Streamers Simple Downloader Paying Consumers Free Opportunists
Books
Video games
Software
TV
Film
Music
187 48
881
198
116
134
Simple Streamers Simple Downloader Paying Consumers Free Opportunists
Books
Video games
Software
TV
Film
Music
330m
77m
1156mm
326mm

29 | P a g e
For all of the legal segments music made up the majority of content consumed. However, the segments did differ with respect to the other content types; the Simple Streamers consumed proportionally more TV programmes (35%), the Simple Downloaders more e-books (23%), while the Free Opportunists consumed the greatest variety of content types.
Services used Table 4.5b shows the top 10 services used to download, stream or access content in the last 3 months among each non-infringing group:
Table 5.5b Top 10 services used in the last 3 months for downloading, streaming or sharing content
Simple Streamers Simple Downloaders Paying Consumers Free Opportunists Base=1338 Base=649 Base=1394 Base=593
BBC iPlayer 55% Amazon/Kindle 44% YouTube 51% YouTube 53%
YouTube 45% iTunes 30% BBC iPlayer 49% BBC iPlayer 50%
ITV Player 25% YouTube 16% iTunes 47% Amazon/Kindle 46%
4OD 22% Google (Search) 8% Amazon/Kindle 46% Google (Search) 28%
Facebook 11% Email 7% 4OD 27% Facebook 27%
Amazon/Kindle 11% Facebook 6% ITV Player 25% iTunes 25%
Google (Search) 10% BBC iPlayer 5% Facebook 18% ITV Player 24%
iTunes 9% Microsoft 4% Google (Search) 16% 4OD 22%
Demand 5 8% Play.com 3% Spotify 15% Email 15%
Spotify 7% Spotify 2% Lovefilm 11% Microsoft 12%
Mean number used:3 Mean number used: 2 Mean number used:4 Mean number used: 5
As with the infringing segments, YouTube and BBC iPlayer feature highly as services used for online content consumption for all non-infringing segments. Simple Downloaders were the only group across all infringing and non-infringing segments where these services did not make up the top two; with Amazon (44%) and iTunes (30%) used instead.
The most noticeable differences between the two segments that both downloaded and streamed content - the Paying Consumers and the Free Opportunists - were for paid services such as iTunes (47% vs. 25%) and Spotify (15% vs. 9%).
5.5 Spend among non-infringing segments
Chart 5.5 shows total spend across all content types split by physical copies, digital content and ‘other’12.
Chart 5.5 Spend among non-infringing segments
Base: Simple Streamers (1338) Simple Downloaders (649) Paying Consumers (1394) Free Opportunists (593)
12
Other category spend includes: Music = Concerts/gigs and Music merchandise, Films = Cinema, Physical rentals, and Pay-TV purchases, TV programmes = Physical rentals
£37 £44 £67 £50
£2 £10
£19 £11 £26
£28
£45
£33 £65 £82
£131
£94
Simple Streamers Simple Downloaders Paying Consumers Free Opportunists
Mea
n s
pen
d in
th
e la
st 3
m
on
ths Other
Digital
Physcial

30 | P a g e
Paying Consumers had the highest total spend (£131) across the segments, with Simple Streamers spending the least (£65). Simple Downloaders (£82) and Free Opportunists total spend stood in between these two amounts.
There was a similar pattern for spend on digital content; again it was highest among the Paying Consumers (£19) and lowest among the Simple Streamers. Despite consuming over four times as much digital content online, the Free Opportunists (£10) claimed to spend a similar amount on online content to the Simple Downloaders (£11).

31 | P a g e
6. Comparing the infringing and non-infringing segments
6.1 Overview and summary of segment comparison
This section examines all the segments (infringing and non-infringing) covered in the previous three sections alongside each other.
The groups who indicated lower (or no) levels of infringement accounted for a disproportionately low proportion of the total volume of files consumed, compared to those with high levels of infringement. In terms of individual content types, this was particularly the case for computer software and video games (where total file volumes were generally lower across the board than other content types).
While there was some differentiation between the segments, the large majority of content consumed by all groups was music (although this is driven by the fact that we treat one music track as one file).
Infringers generally consumed more paid and legal content than the non-infringing segments, although this formed a lower proportion of their total consumption than it did for non-infringers.
Total content spend was higher for all the infringing groups than for non-infringing groups, except the Paying Consumers who spent more than the Free Infringers (£131 v £120). Spend was highest for the Top 20% Infringers.
Most infringing segments found it easy to find content on the internet for free which would normally be paid, ranging from 45% for the Ambiguous Infringers to 76% for the Top 20% infringers. Among non-infringers the figures were notably lower, ranging from 28% to 45%.

32 | P a g e
6.2 Distribution of segments within total volume of digital consumption
The first column of Chart 6.2 below shows the relative proportion of each of the segments among all digital consumers. The remaining columns show the proportion of the total volume of content attributable to each segment. This allows a comparison to be made between size of the segment and proportion consumed within the content types. For example the Simple Streamers accounted for 27% of all digital consumers but accounted for only 10% of the total content consumed. Table 4.3a shows how this breaks down in terms of total volume of infringed content (over the six month period).
Chart 6.2 Proportion of volume consumed by legal and non-legal segments
Base: Simple Streamers (1338) Simple Downloaders (649) Paying Consumers (1394) Free Opportunists (593) Justifying Infringers (105) Digital Transgressors (133) Free Infringers (498) Ambiguous Infringers (439)
Table 6.2 Volume of content consumed in the past six months NON-INFRINGING SEGMENTS INFRINGING SEGMENTS
Simple streamers
Simple Downloaders
Paying Consumers
Free Opportunists
Justifying Infringers
Digital Transgressors
Free Infringers
Ambiguous Infringers
Total 330m 78m 1,155m 321m 262m 250m 503m 257m
Music 187m 48m 881m 198m 210m 177m 313m 242m
Video 3m 3m 27m 9m 3m 3m 41m 9m
Software 2m 3m 33m 12m 6m 4m 33m 17m
Film 17m 3m 32m 16m 14m 28m 24m 24m
TV programmes 116m 2m 134m 49m 24m 36m 84m 58m
Books 5m 18m 49m 37m 5m 7m 8m 8m
*Volumes have been rounded to the nearest million
The infringing segments accounted for a disproportionately high volume of overall content consumed, considering the size of the segments. This was most prominent for video games, computer software and
27%
10% 8% 3% 1%
11%
23%
4%
13%
2% 2%
3% 3%
2% 13%
27%
35% 39%
27% 30% 20%
27% 36%
11%
10% 9%
9% 11% 10%
10%
27%
2%
8% 9%
3% 5% 9%
5%
4% 2%
8% 8%
3%
4%
18%
6%
5% 10%
15% 14%
42% 30%
15% 17%
6% 9% 11% 11% 9%
15% 15% 12% 6%
Segment size
Total Music Video Software Film TV Books
Ambiguous Infringers
Free Infringers
Digital Transgressors
Justifying Infringers
Free Opportunists
Paying Consumers
Simple Downloaders
Simple Streamers
Infringing segments
Non-Infringing segments

33 | P a g e
films, where the infringing segments accounted for over half of the total content consumed. A higher volume of books, on the other hand, was mostly attributable to the non-infringing segments. Computer software (30%) and video games (42%) had high proportions of content attributed to Free Infringers. This disproportionate difference is similar to that seen for the Top 20% Infringers, where they accounted for 88% of all infringed content, and 11% of all legal content.
6.3 Digital content consumption
Table 6.3a shows the mean volume of files consumed by each segment (including the Top 20% Infringers)
along with the proportion of total consumption accounted for by each content type.
Table 6.3a Mean volume of content consumed (legally and illegally) by infringing segments, by content type
NON-INFRINGING SEGMENTS INFRINGING SEGMENTS
Simple
Streamers Simple
Downloaders Paying
consumers Free
Opportunists Justifying Infringers
Digital Transgressors
Free Infringers
Ambiguous Infringers
Top 20% Infringers
Base 1338 649 1394 593 105 133 498 439 311 Total Mean volume 27 13 92 63 279 257 113 86 363
Music Mean volume 15 8 70 39 223 182 70 58 249 Proportion 57% 62% 76% 62% 80% 65% 68% 71% 69%
Video Games Mean volume 0 1 2 2 4 3 9 2 16
Proportion 1% 4% 2% 3% 1% 8% 2% 1% 4%
Software Mean volume 0 1 2 2 6 4 8 4 21
Proportion 0% 4% 3% 4% 2% 7% 5% 2% 6%
Films Mean volume 1 1 3 3 15 30 5 6 26 Proportion 5% 4% 3% 5% 5% 5% 7% 11% 7%
TV Programmes
Mean volume 9 0 11 10 26 32 19 14 44 Proportion 35% 2% 12% 15% 9% 17% 16% 12% 12%
Books Mean volume 0 3 4 7 6 7 2 2 7 Proportion 1% 23% 4% 11% 2% 2% 2% 3% 2%
Across all content types, the infringing segments generally consumed much higher volumes than the non-
infringing ones. That said the Ambiguous Infringers consumed less content on average (86) than the non-
infringing Paying Consumers (92). The Justifying Infringers (279) and Digital Transgressors (257) consumed
far more files than any other segment, albeit not as many as the Top 20% Infringers (363). (We expected
this due to the way the latter group is defined i.e. according to volumes of content consumed).
The breakdown of files consumed by content type was fairly similar for all segments; music consumption
accounted for over half in all cases. However, music tracks were less prominent among Simple Streamers
(57%), who consumed proportionally more TV programmes (35%) than the other segments. The Simple
Downloaders had downloaded the largest proportion of e-books (21%).
Payment
Table 6.3b below shows the mean volumes of content consumed by each of the segments – split between
paid and free. The mean scores are also shown as a proportion of the total volume consumed for each of
the segments and the Top 20% Infringers.

34 | P a g e
Table 6.3b Mean volume of content consumed by infringing segments, by payment NON-INFRINGING SEGMENTS INFRINGING SEGMENTS
Simple
Streamers Simple
Downloaders Paying
consumers Free
Opportunists Justifying Infringers
Digital Transgressors
Free Infringers
Ambiguous Infringers
Top 20% Infringers
Base 1338 649 1394 593 105 133 498 439 311
Total Mean volume 27 13 92 63 279 257 113 86 363
Paid Mean volume 5 8 53 16 27 39 11 20 30
Proportion 18% 64% 57% 26% 10% 15% 10% 23% 8%
Free Mean volume 22 5 39 47 252 218 102 66 332
Proportion 82% 36% 43% 64% 90% 85% 90% 77% 92%
Mean number of services used
3 2 4 5 9 9 6 5 8
The Paying Consumers consumed more paid content than any other segment, while Simple Streamers
consumed the least. Among the infringing groups the Digital Transgressors consumed the most paid
content, although this accounted for just 15% of the total volume they consumed. Although they had
similarly high levels of infringing as the Top 20% Infringers, they paid for more content, both in actual and
proportional terms.
Number of services used
As shown in table 6.3b the infringing groups generally claimed to use more online services on average to
access their content than the non-infringing groups. The Free Infringers and Digital Transgressors claimed
to use the most (9) and the Simple Downloaders used the least (2). As already discussed in Section 4.5 the
infringing groups had much higher claimed use of ‘peer-to-peer’ and ‘cyberlocker’ services13.
6.4 Spend
Chart 6.4 shows the mean spend across all content types for all segments including the Top 20%
Infringers:
Chart 6.4 Mean spend by segments
13
Peer-to-peer (net) consists of Bittorrent software, uTorrent, Pirate Bay, Isohunt, Limewire, eDonkey/eMule, Gnutella, KickAssTorrents, and Torrentz. Cyberlockers consists of Rapidshare, MediaFire and YouSendit.
£37 £44 £67
£50 £73 £75
£58 £71 £77 £2 £10
£19
£11
£25 £20 £16
£20 £29
£26 £28
£45
£33
£69 £58
£46 £44
£61
£65 £82
£131
£94
£167 £153
£120 £135
£168
Mea
n s
pen
d in
th
e la
st 3
mo
nth
s
Other
Digital
Physical
Non-infringing segments Infringing segments

35 | P a g e
Base: Simple Streamers (1338) Simple Downloaders (649) Paying Consumers (1394) Free Opportunists (593) Justifying Infringers (105) Digital Transgressors (133) Free Infringers (493) Ambiguous Infringers (439) Top 20% Infringers (311)
The Top 20% Infringers claimed to spend much more on average than all the non-infringing groups, but had a similar high spend (£168) to the Justifying Infringers (£167) and the Digital Transgressors (£153). The segments most highly motivated by free content - the Free Opportunists (£94) and Free Infringers (£120) - spent relatively less than the others.
6.5 Attitudes towards infringement
Each segment showed differing attitudes towards online consumption and copyright infringement, and Chart 6.5a shows the relative agreement levels between the infringing and non-infringing segments for three attitude statements:
Chart 6.5a Proportion agree (strongly or slightly) with statements
Base: Simple Streamers (1338) Simple Downloaders (649) Paying consumers (1394) Free Opportunists (593) Justifying Infringers (105) Digital Transgressors (133) Free Infringers (493) Ambiguous Infringers (439) Top 20% Infringers (311)
“I think that you should be able to download or access the content you want for free from the internet”
Digital Transgressors (78%) and Simple Downloaders (27%) had the most contrasting agreement levels in terms of the right to consume free content on the internet. In contrast to the other infringement groups (and more in line with the opinions of the non-infringing segments), less than half of Ambiguous Infringers (43%) agreed with the sentiment. The agreement level among the Top 20% Infringers was the same as that among Justifying Infringers (62%)
“It is easy to find content on the internet for free that would usually be paid for”
The Top 20% Infringers had higher levels of agreement than all of the other infringing segments in terms of easily being able to find paid content for free (76%). The closest to this were the Digital Transgressors at 70%. At the other end of the scale, again, Simple Downloaders had the lowest agreement levels (27%).
38% 35%
46%
27% 28%
48%
33% 34%
48% 50% 45%
51%
62% 67%
37%
78%
70%
39%
57% 56%
39% 43% 45%
36%
62%
76%
32%
I think that you should be able to download or access the content you want
for free from the internet
It is easy to find content on the internet for free that would usually be paid for
It is wrong to access content online without the creators\artists permission
Simple Streamers Simple Downloaders Paying Consumers Free Opportunists Column2
Justifyng Infringers Digital Transgressors Free Infringers Ambiguous Infringers Top 20% Infringers

36 | P a g e
And, consistent with the previous findings, the Ambiguous Infringers were the only infringing segment with less than 50% agreement with this statement; a similar agreement level to the Paying Consumers (45%).
“It is wrong to access content online without the creators\artists permission”
Compared to the previous two statements, each of the segments showed less variation in terms of agreement with the notion that is wrong to access content without the creator’s permission. Naturally, the agreement among the non-infringing segments was generally higher than the infringing ones. However, the only segment where more than half agreed was Paying Consumers (51%). The Top 20% Infringers had lower agreement than all infringing segment with 32%.
Table 6.5 below shows the reasons given for consuming illegal content among the infringing segments, compared to the Top 20% Infringers:
Table 6.5 Reasons for infringing content
Justifying Infringers
Digital Transgressors
Free Infringers
Ambiguous Infringers
Top 20% Infringers
BASE 105 133 498 439 311
It's free 71% 80% 100% 3% 70%
It's quick 68% 69% 55% 28% 61%
It's easier/convenient 74% 75% 51% 39% 59%
I think legal content is too expensive 55% 53% 14% 6% 37%
It means I can try something before I buy it 73% 58% 21% 19% 36%
Because I can 33% 63% 17% 14% 35%
I can't afford to pay 47% 50% 17% 8% 33%
I already spend enough on content 44% 21% 6% 9% 21%
The Industry makes too much money 37% 32% 6% 9% 20%
I don't want to wait for content to become available on legal services
18% 27% 9% 8% 19%
I already owned content in another format 64% 18% 4% 14% 19%
The files I want are not available on legal services 28% 15% 9% 11% 18%
It's what my friends or family do 9% 88% 1% 1% 18%
I've already paid to see it\them at the cinema, in concert, etc
84% 14% 2% 3% 17%
I don't think I should have to pay for content online 21% 26% 5% 3% 13%
No one suffers 2% 29% 0% 2% 13%
No one ever gets caught 13% 27% 2% 4% 8%
Generally the Top 20% Infringers had less distinctive reasons for doing it than the infringing segments did. Despite sharing similar behaviours, the Top 20% Infringers were less likely to cite the majority of reasons compared to the two segments that also had high levels of infringement - the Justifying Infringers and the Digital Transgressors. They were much less likely than the latter to give the reasons ‘It's what my friends or family do’ (18% v 88%), and ‘because I can’ (35% v 63%). They were also much less likely than the former to cite ‘I've already paid to see it/them at the cinema/in concert, etc’ (17% v 84%) and ‘I already owned content in another format’ (19% versus 64%).
Chart 6.5b below shows the responses that showed the most differentiation between the segments in terms of factors that would encourage each of the infringing groups to stop:

37 | P a g e
Chart 6.5b Aspects that would encourage stopping accessing content illegally online
Base: Justifying Infringers (105) Digital Transgressors (133) Free Infringers (498) Ambiguous Infringers (439) Top 20% Infringers (311)
In comparison to the infringing segments the Top 20% Infringers were generally closest to the Digital Transgressors; for example, 46% of the former said they would be likely to stop infringing if legal services were cheaper, compared to 47% of the latter.
Chart 6.5c shows the relative confidence levels in terms of knowing what is legal online and what isn’t:
Chart 6.5c Confidence in knowing what is legal online
Base: Justifying Infringers (105) Digital Transgressors (133) Free Infringers (498) Ambiguous Infringers (439) Top 20% Infringers (311) All internet users (12+) (8945) Note: Rebased to exclude ‘don’t know’ answers
Generally, the non-infringing segments showed higher confidence levels in knowing what is legal online. Paying Consumers had the highest overall claimed confidence (very or slightly confident) of all the groups, with 77%. Among the infringing groups, although the Digital Transgressors had the highest proportion claiming to be ‘very confident’ (33%), this was not significantly higher than other segments at the 99% confidence level.
83%
47%
36% 42%
21%
47%
32%
44%
29% 37% 36%
16% 20% 16% 14% 24%
12% 14% 13% 8%
46%
29% 28% 27% 23%
If legal services were cheaper
If legal services were more
convenient\flexible
If my ISP sent me a letter saying they would
suspend my internet access
If legal services were better
If friends or family were caught
Justifying Infringers Digital Transgressors Free Infringers Ambigous Infringers Top 20% Infingers
25% 26% 35% 33%
25% 33%
25% 26% 31% 22%
40% 47%
42% 39% 44% 34%
41% 39% 40%
34%
66% 73% 77%
72% 69% 67% 66% 65% 71%
56%
Slightly Confident
Very Confident
Non-Infringing segments Infringing segments

38 | P a g e
7. Infringement of multiple content types
7.1 Overview and summary of infringement of multiple content types
The main reports for our Online Copyright Infringement tracking study concentrated on general online behaviours and consumption by content type, and across all types. We have conducted an extra layer of analysis in this section to examine the degree to which there is crossover between infringement of different content types.
Infringement was generally confined to just one of the six content types measured in the study; 62% of infringers indicated infringement within only one type, and this was predominantly music (42%) or films (28%).
Where there was infringement in more than one content type it generally included combinations of music, films and TV programmes. Infringement of computer software and video games was more prevalent among those who had infringed across four or more content types.
Those who had infringed across multiple content types had also infringed a higher volume of content on average.
Category spend was highest for those who infringed in three content types.
7.2 Breakdown of groups
The six content types covered by the tracking survey were music, video games, computer software, films, TV programmes and books. Chart 7.2a shows a breakdown of infringers according to the number of content types they infringed.
Chart 7.2a Proportion who infringed specific numbers of content types
Around six in ten (62%) of those who consumed any content illegally did so for one content type only. An additional 22% of people were active across two content types. Less than 1% infringed across all six.
The breakdown among those who infringed just one content type was as follows: music 42%, films 26%, TV programmes 18%, computer software 6%, e-books 6%, and video games 4%.
For those who infringed two types, the most prevalent combinations were as follows: TV programmes and films 25%, music and films 24%, and music and TV programmes 21%.
Infringers of three content types tended to include music (82%), films (76%) and TV programmes (73%) within their mix. Less than a third of this group also infringed computer software (27%) or video games (29%).
62% 22% 10% 4% 2%
1 2 3 4 5 6 Number of content types infringed

39 | P a g e
7.3 Volume of infringement
Chart 7.3a shows how the average volume of content files consumed varies according to the number of content types infringed, and splits these files into legal and illegal, paid and free:
Chart 7.3a Mean number of content files
Base: 1 content type (963) 2 content types (342) 3 content types (144) 4+ content types (98)
The mean volume of illegal content consumed increased according to the number of different types infringed - from 20 for those who infringed only one type, to 307 for those who infringed four or more types; this correlated with the volume of free content, which also rose with number of infringed content types. The volume of legal and paid content files also tended to rise, although the relationship was not as pronounced.
7.4 Demographic profiles
Table 7.4a shows the demographic profiles of the four groups:
Table 7.4a Demographic profiles according to number of content types infringed
Number of content types infringed
1 2 3 4+
Base 963 342 144 98 Male 56% 58% 65% 70%
Female 44% 42% 35% 30%
12-15 11% 11% 10% 13%
16-34 56% 62% 82% 68%
35-54 24% 22% 7% 18%
55+ 10% 4% 1% 2%
ABC1 60% 64% 57% 60%
C2DE 40% 36% 43% 40%
Full time 41% 36% 41% 39%
Part time 14% 15% 13% 10%
Retired 3% 2% 0% 0%
In education 12% 12% 12% 13%
Not working not looking 31% 34% 34% 38%
50 50 60 78
20
76
111
307
14 10 24 31
55
116
147
355
0
50
100
150
200
250
300
350
400
1 content type 2 content types 3 content types 4+ content types
Legal
Illegal
Paid
Free

40 | P a g e
Generally the more content types infringed, the greater the male bias, rising from 56% for one content type to 70% for four or more. This pattern was not replicated in terms of age or social-economic group; although the proportion aged 16-34 did increase from one (56%) up to three content types (82%), it then fell to 68% for the 4+ group.
7.5 Attitudes
Table 7.5a shows the cited reasons for infringing as a proportion of those who infringed across specific numbers of content types:
Table 7.5a Reasons for infringing by number of content types infringed
Number of content types infringed 1 2 3 4+ Base 963 342 144 98
It's easy/convenient 40% 54% 62% 65%
It's quick 36% 46% 56% 69%
It's free 46% 60% 66% 72%
It means I can try something before I buy it 23% 28% 32% 41%
It's what my friends or family do 6% 12% 13% 19%
Because I can 15% 23% 26% 40%
I already owned content in another format 12% 9% 22% 22%
I've already paid to see it/them at the cinema/in concert, etc 7% 10% 17% 20%
I don't want to wait for content to become available on legal services 7% 14% 14% 20%
I can't afford to pay 12% 24% 28% 29%
I think legal content is too expensive 10% 23% 29% 40%
I think legal content is too poor quality 2% 2% 4% 6%
The files I want are not available on legal services 9% 12% 14% 20%
I don't think I should have to pay for content online? 5% 10% 8% 16%
The industry makes too much money 7% 15% 16% 25%
I already spend enough on content 8% 11% 16% 24%
No one suffers 4% 6% 10% 13%
No one ever gets caught 2% 2% 10% 10%
It gives me status 1% 0% 1% 2%
The top three reasons given for infringing were the same according to the number of types infringed - ‘easy/convenient’, ‘it’s quick’ and ‘it’s free’. However, other reasons for infringing became more differentiated as the number of content types infringed increased. Those who infringed in four types or more were significantly more likely than those who infringed three types to cite ‘because I can’ (40% v 26%), and ‘I think legal content is too expensive’ (40% v 29%).

41 | P a g e
Chart 7.5b below shows the range of responses in terms of factors that would encourage each of the infringing groups to stop:
Table 7.5b Factors that would encourage infringers to stop by number of content types infringed
Number of content types infringed 1 2 3 4+ Base 963 342 144 98
If legal services were cheaper 30% 36% 39% 51%
If everything I wanted was available legally 26% 31% 26% 31%
If everything I wanted was available legally online as soon as it was released elsewhere
19% 28% 20% 24%
If it is clearer what is legal and what isn't 26% 28% 25% 19%
If legal services were more convenient/flexible 13% 23% 23% 28%
If my ISP sent me a letter saying they would suspend my internet access 18% 23% 27% 23%
If I thought I might be sued 18% 22% 25% 28%
If legal services were better 15% 20% 22% 33%
If a subscription service I was interested in became available 16% 20% 20% 23%
If everyone else stopped doing it 8% 17% 19% 17%
If I thought I might be caught 14% 17% 26% 24%
If my ISP sent me a letter informing me my account had been used to infringe 11% 15% 19% 15%
If my ISP sent me a letter saying they would restrict my internet speed 11% 14% 20% 18%
If friends or family were caught 13% 14% 21% 15%
If I knew where to go to see if something was illegal or not 13% 14% 14% 15%
If there were articles in the media about people being caught 6% 7% 10% 8%
Nothing would make me stop 6% 5% 6% 6%
Again, the primary factor that all groups of infringers claimed would encourage them to stop was -‘if legal services were cheaper’. ‘If everything I wanted was available legally’ was also relatively high across all four groups. However, other reasons did differ according to the number of content types:
‘If it is clearer what is legal and what isn’t’ was a key reason for infringers of up to 3 content types, but was less so for those that infringed four or more. For those who only infringed in one content type this is the third most cited reason (26%)
For those who infringed two content types ‘If everything I wanted was available legally online as soon as it was released elsewhere’ (28%) carried more importance.
Infringers of three content types appeared more afraid of repercussions, with a quarter claiming ‘If it thought I might be caught’ (26%) and ‘If my ISP sent me a letter saying they would suspend my internet access’ (27%).
For those who infringed four or more types it was ‘If legal services were better’ (33%) was the second most cited reason.

42 | P a g e
Respondents with internet access were asked the following question:
How confident are you that you know what is legal and what isn’t in terms of downloading, streaming/accessing, and sharing content through the internet?
Chart 7.5c shows the relative confidence levels of each group in terms of knowing what is legal online and what isn’t:
Chart 7.5c Confidence in knowing what is legal online
The single content infringers showed least confidence in knowing what is legal and what isn’t (61% were either very or quite confident). By contrast, those who infringed in four or more types showed the highest confidence levels (84%, including 39% who claimed to be ‘very confident’ in knowing what is legal).
7.6 Spend
Chart 7.6 shows total spend across all content types split by physical copies, digital content and ‘other’14:
Chart 7.4a Mean spend for different content infringers
Base: 1 content type (963) 2 content types (342) 3 content types (144) 4+ contents (98)
Those who infringed in only one content type claimed to spend the least in total (£104). Spend increased as the number of content types infringed increased, but peaked at those who infringed in only three categories (£190) before falling to £147 for four or more types. 14
Other category spend includes: Music = concerts/gigs and music merchandise, Films = cinema, physical rentals, and pay-TV purchases, TV programmes = physical rentals
23% 28% 31% 39%
38% 44% 39%
45%
28% 22% 22%
9% 10% 6% 7% 7%
1 2 3 4+
Number of content types infringed
Not at all confident
Not particularly confident
Slightly confident
Very confident
£56 £66 £68 £62
£12 £21 £27 £24
£36 £43
£95 £61
£104 £130
£190
£147
1 Content type 2 Content types 3 Content types 4+ Content types
Mea
n s
pen
d in
th
e la
st 3
m
on
ths Other
Digital
Physcial

43 | P a g e
8. Spend analysis among infringers
8.1 Overview and summary of spend analysis among infringers
We undertook further analysis was undertaken to assess the complex relationship between infringement and spend on content, and assess the revenue potential if infringement could be converted to legal consumption:
Generally, the data from the survey showed that as people consumed more infringed files they also consumed more legal files, and spent more on legal content.
Further assessment on price-sensitivity for music showed that the optimum price infringers were willing to pay (either for single downloadable tracks, or for particular premium subscriptions) generally increased as the volume of infringed content increased. (Although the optimum subscription price was below that currently charged for the first premium tier of a number of UK music streaming services, many also offer free versions, albeit with some service restrictions or limitations).
This optimum music price was mapped alongside banded illegal consumption in order to estimate potential additional monthly spend (lost revenue) if all infringed content was paid for at this price.
The data suggest that improvements to legal alternatives could potentially convert some music infringers to pay for their content (either by track or monthly) if the price was right. However, the relationship between infringement and spend is complex and the claims people make when asked questions about their likely future behaviour given changes to their options do not always closely reflect their real-life behaviour.

44 | P a g e
8.2 Top-level relationship between infringement and spend
The data collection method involved in the Online Copyright Infringement Tracker resulted in ‘continuous variables’ for all key volume metrics. In other words, respondents provided their own file consumption estimates, with no upper limits caps/restrictions on data ranges. While this is valuable for estimating the level of copyright file consumption, it makes the data vulnerable to outliers; a small number of respondents in each wave provide extremely large volume estimates out of range of the general frequency distribution15. Therefore, to examine the relationships further, the numbers of infringed files consumed by individuals were sensibly banded to provide evenly-sized groups of infringers for analysis (the bands are based on the relative distribution and so are unequal in size).
Chart 8.2a below shows the mean volume of legal content (red line) consumed by those in each illegal banded group, against the number of consumers that fall into each of these bands (yellow area).
Chart 8.2a Illegal vs. legal consumption behaviour
Base: All who downloaded or streamed any content in the past three months (0=3974, 1=195, 2=161, 3-5=265, 6-10=268, 11-20=214, 21-50=199, 50+=245)
This shows that legal consumption was lower among those who also consumed up to 10 illegal files than it was among those who acquired their content exclusively legally. Past this point (for those who consumed 11 or more illegal files), the number of legal files consumed exceeded that of the 100% legal group.
15 See main report for discussion on the effect of outliers - http://stakeholders.ofcom.org.uk/market-data-
research/other/telecoms-research/copyright-infringement-tracker/
52
30 21
30 43
70 60
105
0
1000
2000
3000
4000
5000
0
20
40
60
80
100
120
0 1 2 3-5 6-10 11-20 21-50 50+
Nu
mb
er o
f co
nsu
mer
s
Mea
n v
olu
me
of
lega
l co
nte
nt
Volume of illegal content consumed
No. of consumers mean volume of legal content
Infringers

45 | P a g e
Chart 8.2b shows the mean number of paid-for files for the illegal consumption bands, and the total spend over all six categories, including physical, digital and other related purchases.
Chart 8.2b Illegal vs. legal consumption behaviour
Base: All who downloaded or streamed any content in the past three months (0=3974, 1=195, 2=161, 3-5=265, 6-10=268, 11-20=214, 21-50=199, 50+=245)
The pattern here is similar to that in the previous chart. Those who didn’t infringe at all paid for more files (24, shown on the red line) than those who infringed just one file (7). However, as infringement increased so did the number of paid files, and once consumers exceeded 50 infringing files they paid for more (32) than those who did not infringe.
However, at almost all levels of infringement, infringers spent more per quarter than the £95 spent by those whose activity was entirely legal. For the 21-50 and 50+ infringement bands they spent substantially more: £141 and £170 respectively.
These findings indicate that the high infringers contribute significantly to industry spend as their high infringing is coupled with high levels of consumption and spend. With this in mind, we examined the price sensitivity data which formed part of the main Online Copyright Infringement tracker to see what conclusions we could draw about the likely impact of converting infringers to pay for their content.
£95 £105 £101 £104
£95 £108
£141
£170
24 7 10 12 15 13 15
32
0 1 2 3-5 6-10 11-20 21-50 50+
Number of illegal files consumed
Total spend across content types Mean volume of paid content
Infringers

46 | P a g e
8.3 Willingness to pay - music
Within the survey we set out to assess at what price people would be willing to pay for individual downloads or for an ‘all-you-can-eat’ subscription service. This was repeated for three of the content types – music, films and books. For this particular analysis we concentrate on the former only as this content type was found to be relevant to the largest proportion of digital consumers and has the largest volume of infringed files. A Gabor-Granger price sensitivity model was used for this purpose; an approach which delivers price elasticity to examine the likely effect on demand of price changes. It is important to note that the price points used in the survey were pre-determined i.e. they were not spontaneously offered by survey respondents.
With regard to a download service, the following question was asked:
Assuming you saw a single music track on an online service that you wanted to own. The track would be high quality, and you knew it was a reputable and reliable service. How likely would you be to download it if it was the following prices?
Focusing on a subscription service we asked the following question:
Assume that the following online service became available…
A monthly subscription service allowing you to stream/access unlimited music from any internet-connected device. All the music you want would be available in high quality. The service would allow you to access the files offline. You would be allowed to cancel the service at any time
How likely would you be to subscribe at the following prices per month?
An optimum ‘willingness to pay’ price was calculated by working out the average price point at which each individual said they would be likely to buy either a single music track or a music subscription service. These optimum price points are displayed for each illegal content consumption band in chart 8.3a.
Chart 8.3a Mean optimum willing-to-pay price
£-
£0.20
£0.40
£0.60
£0.80
£1.00
£-
£1
£2
£3
£4
£5
£6
£7
0 1 2 3-5 6-10 11-20 21-50 50+
Op
tim
um
pri
ce w
illin
g to
pay
- S
ING
LE M
USI
C T
RA
CK
Op
tim
um
pri
ce w
illin
g to
pay
- S
UB
SCR
IPTI
ON
SER
VIC
E
Volume of illegal content consumed
subscription Single music track
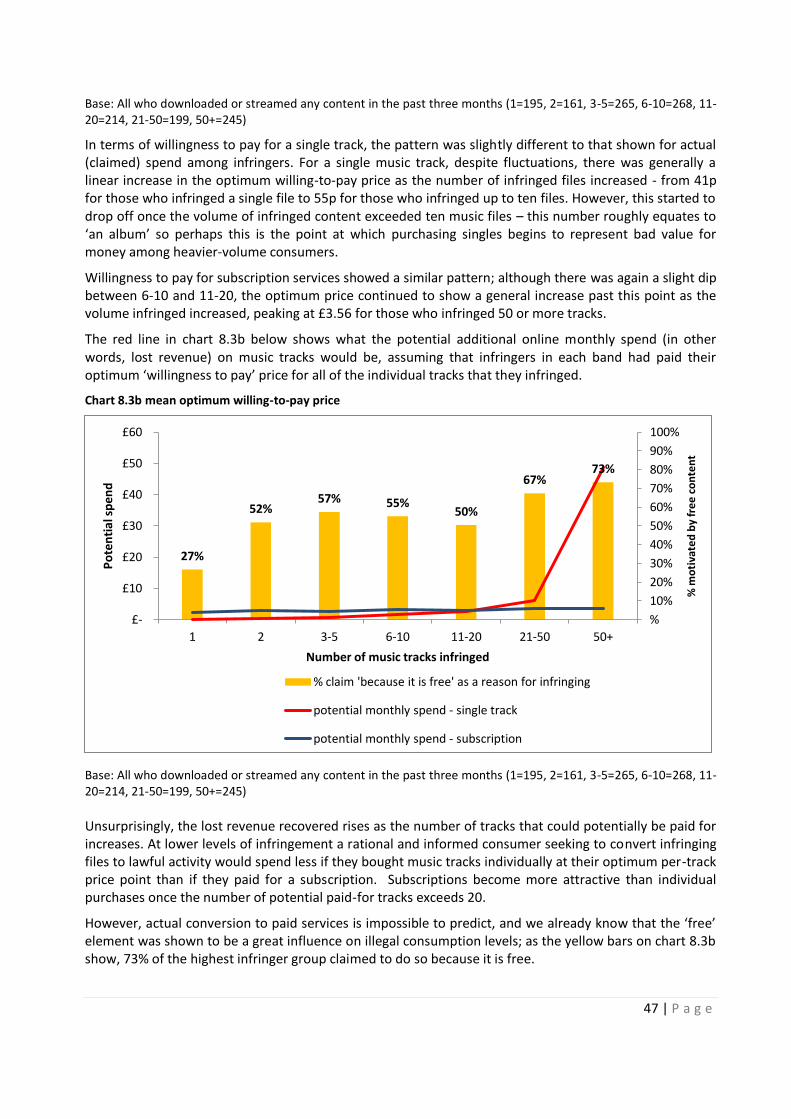
47 | P a g e
Base: All who downloaded or streamed any content in the past three months (1=195, 2=161, 3-5=265, 6-10=268, 11-20=214, 21-50=199, 50+=245)
In terms of willingness to pay for a single track, the pattern was slightly different to that shown for actual (claimed) spend among infringers. For a single music track, despite fluctuations, there was generally a linear increase in the optimum willing-to-pay price as the number of infringed files increased - from 41p for those who infringed a single file to 55p for those who infringed up to ten files. However, this started to drop off once the volume of infringed content exceeded ten music files – this number roughly equates to ‘an album’ so perhaps this is the point at which purchasing singles begins to represent bad value for money among heavier-volume consumers.
Willingness to pay for subscription services showed a similar pattern; although there was again a slight dip between 6-10 and 11-20, the optimum price continued to show a general increase past this point as the volume infringed increased, peaking at £3.56 for those who infringed 50 or more tracks.
The red line in chart 8.3b below shows what the potential additional online monthly spend (in other words, lost revenue) on music tracks would be, assuming that infringers in each band had paid their optimum ‘willingness to pay’ price for all of the individual tracks that they infringed.
Chart 8.3b mean optimum willing-to-pay price
Base: All who downloaded or streamed any content in the past three months (1=195, 2=161, 3-5=265, 6-10=268, 11-20=214, 21-50=199, 50+=245)
Unsurprisingly, the lost revenue recovered rises as the number of tracks that could potentially be paid for increases. At lower levels of infringement a rational and informed consumer seeking to convert infringing files to lawful activity would spend less if they bought music tracks individually at their optimum per-track price point than if they paid for a subscription. Subscriptions become more attractive than individual purchases once the number of potential paid-for tracks exceeds 20.
However, actual conversion to paid services is impossible to predict, and we already know that the ‘free’ element was shown to be a great influence on illegal consumption levels; as the yellow bars on chart 8.3b show, 73% of the highest infringer group claimed to do so because it is free.
27%
52% 57% 55%
50%
67% 73%
%
10%
20%
30%
40%
50%
60%
70%
80%
90%
100%
£-
£10
£20
£30
£40
£50
£60
1 2 3-5 6-10 11-20 21-50 50+
% m
oti
vate
d b
y fr
ee
co
nte
nt
Po
ten
tial
sp
end
Number of music tracks infringed
% claim 'because it is free' as a reason for infringing
potential monthly spend - single track
potential monthly spend - subscription

48 | P a g e
9. Technical appendix
9.1 The database used for all analysis
The database used for the analysis in this report combined data sets from the first two waves of the online copyright infringement tracker (covering the period May-October 2012). Details of the data collection method and weighting can be found in the main report:
http://stakeholders.ofcom.org.uk/market-data-research/other/telecoms-research/copyright-infringement-tracker/
The total sample of the database was 10,594.
In terms of volumes all respondents were asked about their behaviour during the past three months. However, as the database is combined from two separate waves these two periods differ (May-July and August-October 2012). Therefore, all aggregated volumes are indicative of this six-month period.
9.2 Analysis methods
Decile analysis
The estimated volume of illegal content was derived for each respondent using the equation:
16
Respondents were grouped into 10% bands using their respective illegal volumes for each content type and at a total level.
The cumulative volume of illegal content for each decile band was then calculated and divided by the total number in order to create a percentage of total illegal content accountable for.
Segmentation of infringers
The total sample was split into its four natural groupings: non internet users, non-digital consumers (i.e. consumers who do not download, stream or share on line), 100% legal consumers and any illegal consumers.
The segments were derived from a factor-cluster analysis using responses to ‘reasons for infringing’17 as well as the volume of infringement.
An eight-factor solution was then chosen on the basis of Eigen values and factor comprehension.
A two-stage cluster analysis was used to create the cluster seeds While the final cluster solution was created using a K-means cluster analysis.
A four-cluster solution was chosen on the basis of cluster membership homogeneity, cluster heterogeneity and cluster comprehension.
16 In wave 2 a change was made to the questionnaire where we included the number of paid illegal content for music and films. While this did result in some differences, paid illegal content have not been included in the calculations of illegal content for this analysis so the calculations are consistent across the dataset. 17 The question used to gauge ‘reasons for infringing’ was – “You indicated you have downloaded or streamed the
following types of files in the past three months which you think may have been done so illegally [CONTENT TYPES]. What are your personal reasons for doing this?”

49 | P a g e
Segmentation of non-infringers
The 100% legal consumers were analysed separately from the non-internet users, non-digital consumers and infringing consumers.
The segments were created using a similar factor-cluster analysis process as the infringing segmentation. However, the inputs here were the reasons for downloading rather than buying a physical version, and the reasons for streaming or accessing content.
A four- and a three-factor solution were chosen, again, on the basis of Eigen values and factor comprehension.
A two-stage cluster analysis was used to create the cluster seeds while the final cluster solution was created using a K-means cluster analysis.
A four-cluster solution was chosen on the basis of cluster membership homogeneity, and cluster heterogeneity, as well as cluster comprehension.
A count variable was created on respondent level data for the number of content types for which the individual consumed infringed content, using the derived illegal file calculation outline in section 3.2:
This was repeated for 100% illegal consumption over the different content types.
The attitudes and behaviours of the different platform groups were then further analysed.

50 | P a g e
9.3 Significance testing
The following shows the complete significance testing between the segments (at the 99% level) for tables contained in the main report:
Table 4.2 Reasons for infringing content (including Top 20% infringers from table 3.6a)
Justifying Infringers
Digital Transgressors
Free Infringers
Ambiguous Infringers
Top 20% Infringers
BASE 105 133 498 439 311
COLUMN A B C D E
It's free 71%D 80%D 100%ABDE 3% 70%D
It's quick 68%D 69%CD 55%D 28% 61%D It's easier/ convenient 74%CDE 75%CDE 51%D 39% 59% I think legal content is too expensive 55%CDE 53%CDE 14%D 6% 37%CD
It means I can try something before I buy it 73%CDE 58%CDE 21% 19% 36%CD Because I can 33%CD 63%ACDE 17% 14% 35%CD I can't afford to pay 47%CD 50%CDE 17%D 8% 33%CD
I already spend enough on content 44%BCDE 21%CD 6% 9% 21%CD The Industry makes too much money 37%CDE 32%CDE 6% 9% 20%CD
I don't want to wait for content to become available on legal services
18%CD 27%CDE 9% 8% 19%CD
I already owned content in another format 64%BCDE 18%C 4% 14%C 19%C The files I want are not available on legal services
28%CD 15% 9% 11% 18%CD
It's what my friends or family do 9%CD 88%ACDE 1% 1% 18%CD I've already paid to see it/ them at the cinema/ in concert, etc
84%ACDE 14%CD 2% 3% 17%CD
I don't think I should have to pay for content online
21%CD 26%CDE 5% 3% 13%CD
No one suffers 2%CE 29%ACDE 0% 2%C 13%CD
No one ever gets caught 13%CD 27%ACDE 2% 4% 8%C
Table 4.4 Demographic profiles of infringing segments Justifyng
Infringers Digital
Transgressors Free
Infringers Ambiguous Infringers
Base 105 133 498 439
COLUMN A B C D Male 58%E 57%E 64%EFGH 57%EF Female 42% 43% 36% 43%
12-15 10% 21%CDEFGH 11% 9% 16-34 70%EFGH 65%EFGH 65%EFGH 61%EFGH 35-54 19% 14% 20% 24%I 55+ 2% 0% 4%I 7%BI
ABC1 58% 59% 62% 60%
C2DE 42%G 41%G 39%FG 40%EFGH
Full-time 27% 34% 39% 44%A Part-time 19% 13% 13% 13% Retired - - 1% 2% In education 11% 21%C 12% 10% Not working not looking 44%D 32% 36%EFG 30%

51 | P a g e
Table 5.3 Demographic profiles of non-infringing segments Simple
Streamers Simple
Downloaders Paying
Consumers Free
Opportunists
Base 1338 649 1349 593
COLUMN E F G H Male 44% 48% 57%EF 52%E Female 57%ABCDGHI 52%CDGI 43%CI 48%CI
12-15 8% 6% 10%F 10%F 16-34 39% 34% 46%EF 42%F 35-54 34%ABCDI 41%ABCDEGHI 32%ABCDI 33%ABCDI 55+ 20%ABCDGHI 18%ABCDGI 12%ABCDI 15%ABCDI
ABC1 68% 70%CDI 74%ABCDEI 69%D
C2DE 32%G 30% 26% 31%
Full-time 43%A 46%AI 50%ACEHI 43%A Part-time 16% 16% 14% 15% Retired 7%ABCGHI 5%I 2% 2% In education 8% 7% 10% 10% Not working not looking 26%C 27% 24% 31%G
Table 4.7 Aspects that would encourage infringers to stop (including Top 20% infringers from table 3.6a)
Justifying Infringers
Digital Transgressors
Free Infringers
Ambiguous Infringers
Top 20%
Base 105 133 498 439 311 COLUMN A B C D E
If legal services were cheaper 83%BCDE 47%D 36%D 24% 46%CD
If everything I wanted was available legally 47%CD 39%CD 26% 24% 34%D
If legal services were more convenient/ flexible 47%CDE 32%CDE 16% 12% 29%CD
If everything I wanted was available legally online as soon as it was released elsewhere
44%CDE 36%CD 21% 17% 29%CD
If it is clearer what is legal and what isn't 42%CDE 44%DE 27% 23% 27%D
If legal services were better 42%CDE 29%CD 16% 13% 27%CD
If a subscription service I was interested in became available
37%CD 31%CD 14% 15% 31%CD
If my ISP sent me a letter saying they would suspend my internet access
36%CD 44%CDE 20% 14% 28%CD
If I thought I might be sued 29%D 39%CDE 23%D 14% 25%D
If I knew where to go to see if something was illegal or not
27%CDE 27%CDE 13% 13% 12%
If my ISP sent me a letter saying they would restrict my internet speed
25%CD 34%CDE 13% 9% 18%D
If my ISP sent me a letter informing me my account had been used to infringe
24%CD 31%CDE 13% 9% 16%D
If friends or family were caught 21%D 37%ACDE 14%D 8% 23%CD
If I thought I might be caught 20% 36%ACDE 22%D 13% 23%D
If everyone else stopped doing it 18% 31%CDE 13% 10% 15%
If there were articles in the media about people being caught
16%CD 19%CDE 6% 5% 10%D
Nothing would make me stop 0% 5% 6% 8%A 5%

52 | P a g e
Table 5.2 Reasons for downloading and streaming (non-infringing segments)
Simple
Streamers Simple
downloaders Paying
consumers Free
Opportunists
Base 1338 649 1394 593
COLUMN A B C D Reasons for downloading
More convenient
N/A
64% 70%B 70%
Quicker 53% 56% 57%
Cheaper 43% 43% 54%BC
Access more easily on devices I have 29% 38%B 44%B
I can get them for free 15%C 2% 100%BC
Quality isn't notably different 12% 15% 27%BC
More up to date 12% 15% 19%B
No physical version available 12% 13% 11%
It’s what everyone does 5% 7% 12%BC
Reasons for streaming
It’s easy/convenient 53%
64%A 67%A
It’s free 46%A
39% 61%AC
It’s quick 37%
52%A 57%A
It’s easy to do 35%
40%A 52%AC
For entertainment 34%C
28% 39%C
To watch programmes have missed 24%C
15% 18%A
Means don’t have to download them 21%
23% 32%AC
Quicker than downloading 14%
20%A 28%AC
Try before buy 12%
20%A 29%C
Cheaper than downloading 11%
N/A
12% 18%AC
Some content is to expensive to buy 4% 4% 9%AC
It’s what my friends or family do 4% 4% 8%AC
Table 7.4a Demographic profiles according to number of content types infringed
Number of content types infringed
1 2 3 4+
Base 963 342 144 98
COLUMN A B C D
Male 56% 58% 65% 70%A
Female 44%D 42% 35% 30%
12-15 11% 11% 10% 13%
16-34 56% 62% 82%AB 68%
35-54 24%C 22%C 7% 18%C
55+ 10%BCD 4% 1% 2%
ABC1 60% 64% 57% 60%
C2DE 40% 36% 43% 40%
Full-time 41% 36% 41% 39%
Part-time 14% 15% 13% 10%
Retired 3% 2% 0% 0%
In education 12% 12% 12% 13%
Not working not looking 31% 34% 34% 38%

53 | P a g e
Table 7.5a Reasons for infringing by number of content types infringed
Number of content types infringed 1 2 3 4+ Base 963 342 144 98
COLUMN A B C D
It's easy/ convenient 40% 54%A 62%A 65%A
It's quick 36% 46%A 56%A 69%AB
It's free 46% 60%A 66%A 72%A
It means I can try something before I buy it 23% 28% 32% 41%A
It's what my friends or family do 6% 12%A 13%A 19%A
Because I can 15% 23%A 26%A 40%AB
I already owned content in another format 12% 9% 22%AB 22%AB
I've already paid to see it/ them at the cinema/ in concert, etc 7% 10% 17%A 20%AB
I don't want to wait for content to become available on legal services
7% 14%A 14%A 20%A
I can't afford to pay 12% 24%A 28%A 29%A
I think legal content is too expensive 10% 23%A 29%A 40%AB
I think legal content is too poor quality 2% 2% 4% 6%
The files I want are not available on legal services 9% 12% 14% 20%A
I don't think I should have to pay for content online 5% 10%A 8% 16%A
The industry makes too much money 7% 15%A 16%A 25%A
I already spend enough on content 8% 11% 16%A 24%AB
No one suffers 4% 6% 10%A 13%A
No one ever gets caught 2% 2% 10%AB 10%AB
It gives me status 1% 0% 1% 2%B
Table 7.5b Aspects that would encourage infringers to stop by number of content types infringed
Number of content types infringed 1 2 3 4+ Base 963 342 144 98
COLUMN A B C D
If legal services were cheaper 30% 36% 39% 51%AB
If everything I wanted was available legally 26% 31% 26% 31%
If everything I wanted was available legally online as soon as it was released elsewhere
19% 28%A 20% 24%
If it is clearer what is legal and what isn't 26% 28% 25% 19%
If legal services were more convenient/ flexible 13% 23%A 23%A 28%A
If my ISP sent me a letter saying they would suspend my internet access 18% 23% 27% 23%
If I thought I might be sued 18% 22% 25% 28%
If legal services were better 15% 20% 22% 33%AB
If a subscription service I was interested in became available 16% 20% 20% 23%
If everyone else stopped doing it 8% 17%A 19%A 17%A
If I thought I might be caught 14% 17% 26%A 24%A
If my ISP sent me a letter informing me my account had been used to infringe
11% 15% 19%A 15%
If my ISP sent me a letter saying they would restrict my internet speed 11% 14% 20%A 18%
If friends or family were caught 13% 14% 21% 15%
If I knew where to go to see if something was illegal or not 13% 14% 14% 15%
If there were articles in the media about people being caught 6% 7% 10% 8%
Nothing would make me stop 6% 5% 6% 6%