ochratoxin a in freshly harvested and stored durum and h.r.s
TRANSCRIPT
Ochratoxin A In Freshly Harvested and Stored Durum and Hard Red Spring Wheat
Julie Kuruc, Ph.D. CandidateNDSU – Great Plains Institute of Food SafetyFebruary 12, 2013
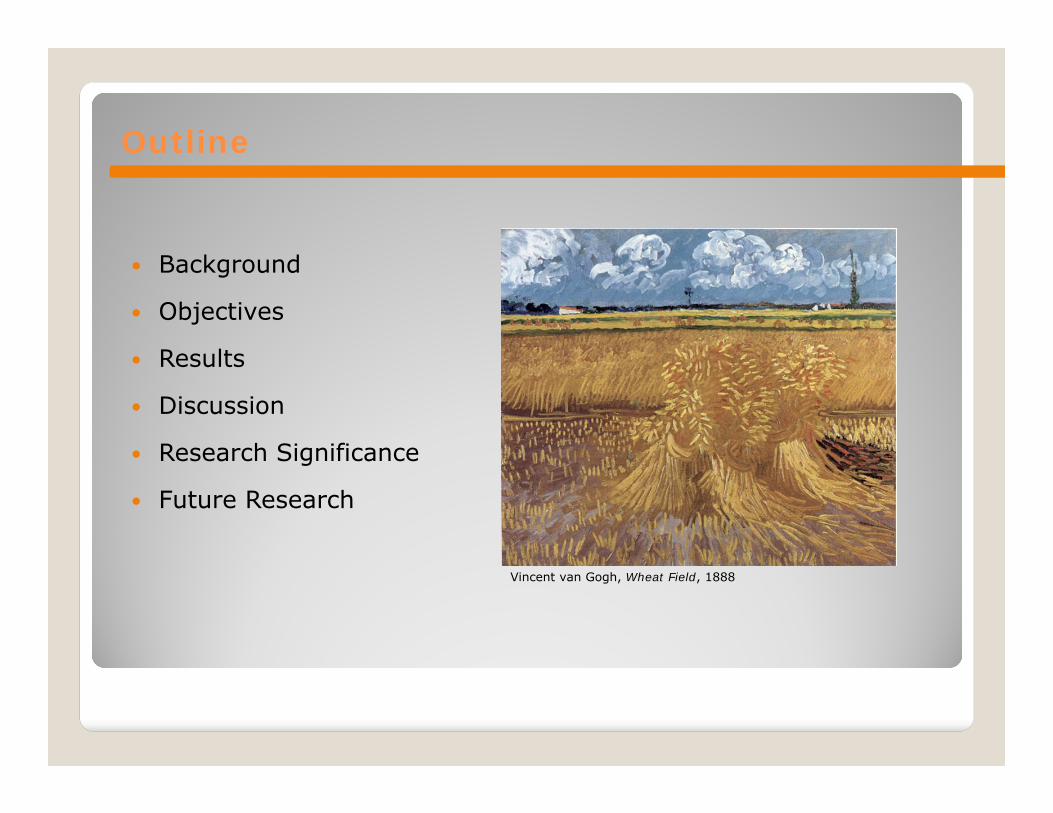
Outline
Background
Objectives
Results
Discussion
Research Significance
Future Research
Vincent van Gogh, Wheat Field, 1888

Background
Mycotoxins - secondary metabolites produced largely by Aspergillus, Fusarium, and Penicillium species◦ Produced on stored foods under sub-optimal storage conditions
otasens.it
Ochratoxin A
Ochratoxin A (OTA) - most common and potent◦ Toxic to kidney, liver, nerves, nerve cells◦ Immunosuppressant, possible human carcinogen
(Khoury and Atoui, 2010)
OTA is produced by: ◦ Penicillium (P. verrucosum, P. nordicum)
Temperate climates (<30°C) Cereals/cereal products
◦ Aspergillus (A. ochraceus, A. niger, A. carbonarius, others)
Tropical climates Coffee, wine, grape juice
(Bogs et al, 2006; Geisen et al, 2006; Mateo et al, 2011)

OTA contamination can occur prior to harvest◦ Environmental conditions◦ OTA-producing strain◦ Commodity
(Imperato et al, 2011; Sánchez-Hervás et al, 2008)
Grains are stored for a length of time prior to being sold and processed ◦ Insufficient drying◦ Improper air circulation ◦ Age of the grain
(Ozden et al, 2012)
nwnyteam.org allposters.comathomewiththefarmerswife.blogspot.com saintmarys-ohio.olx.com
Background

First report of OTA in foods – corn (Shotwell et al, 1969)
OTA is present in many types of commodities and foods
Country Product OTA Limit (ppb)
EU, Turkey, CanadaUnprocessed cereals 5
Products from unprocessed cereals, intended for human consumption 3
India Raw wheat, barley and rye 20
China Cereals 5
Israel Cereals, cereal products 50
Iran Wheat 5
USA, Japan, Mexico, Australia No advisory limits or action levels in any commodity
Adapted from: Canadian Grain Commission, 2011; European Commission, 2006; European Mycotoxins Awareness Network, 2012
Background
Current OTA Limits (ppb) for Cereal Products in Various Countries
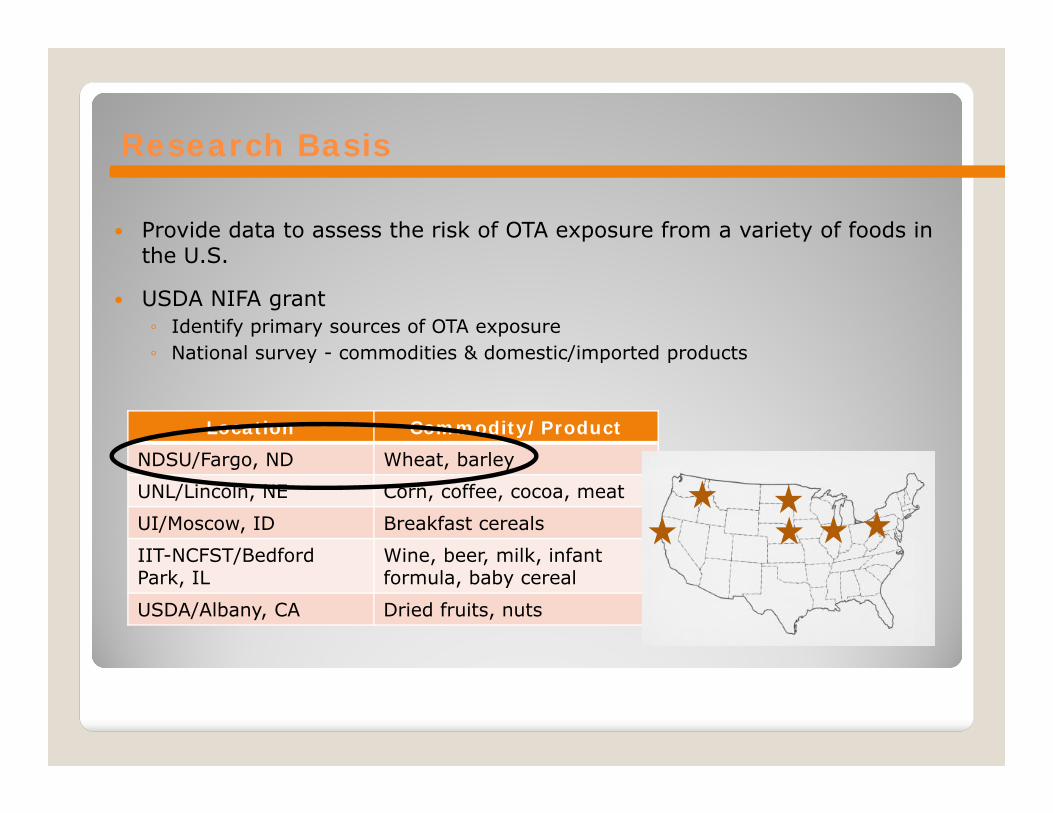
Provide data to assess the risk of OTA exposure from a variety of foods in the U.S.
USDA NIFA grant◦ Identify primary sources of OTA exposure◦ National survey - commodities & domestic/imported products
Location Commodity/ProductNDSU/Fargo, ND Wheat, barley
UNL/Lincoln, NE Corn, coffee, cocoa, meat
UI/Moscow, ID Breakfast cereals
IIT-NCFST/Bedford Park, IL
Wine, beer, milk, infantformula, baby cereal
USDA/Albany, CA Dried fruits, nuts
Research Basis
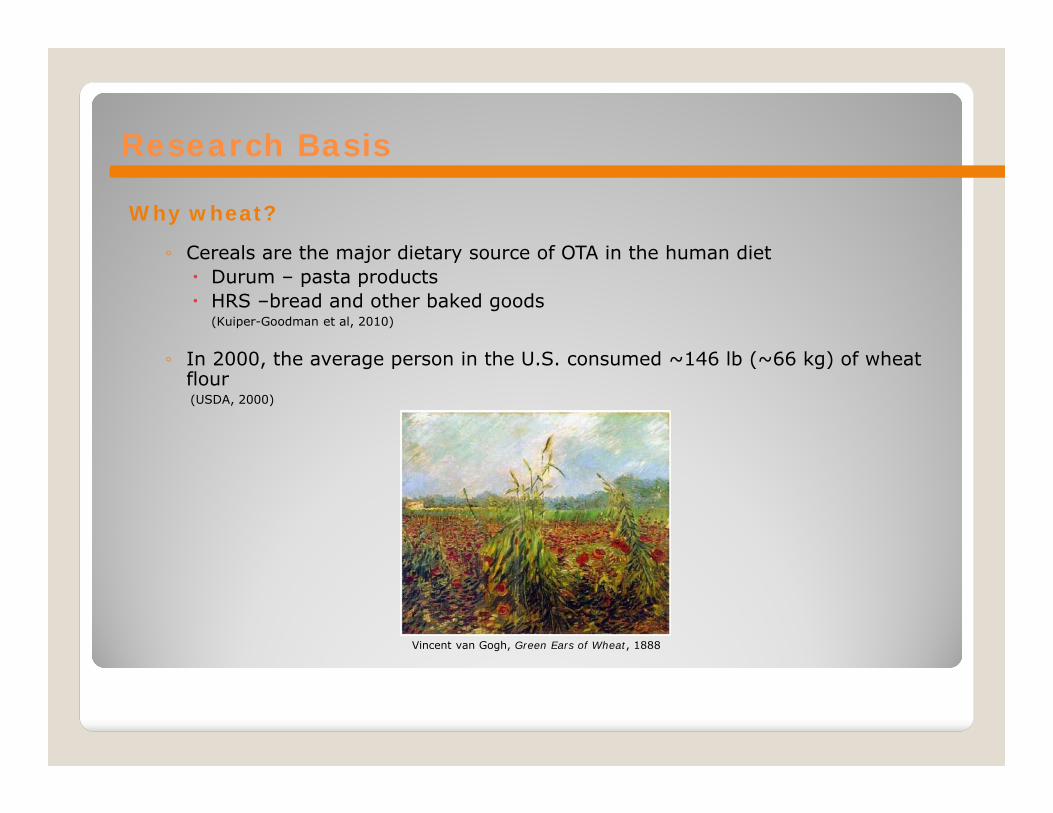
Why wheat?
◦ Cereals are the major dietary source of OTA in the human diet Durum – pasta products HRS –bread and other baked goods
(Kuiper-Goodman et al, 2010)
◦ In 2000, the average person in the U.S. consumed ~146 lb (~66 kg) of wheat flour (USDA, 2000)
Research Basis
Vincent van Gogh, Green Ears of Wheat, 1888

Determine the prevalence of and quantify OTA in freshly harvested durum and HRS
wheat
Objectives
www.providerpals.com
Determine the prevalence of and quantify OTA in stored durum and HRS
wheat

Freshly Harvested Wheat
2011 U.S. regional wheat surveys◦ 100 g sub-samples ◦ Stored at -18°C until analysis
Detection and quantification of OTA ◦ AOAC Official Method 991.44◦ HPLC with fluorescence detection
LOD= 0.06 ppb (durum)0.09 ppb (HRS)
Methodology
Wheat Type # Samples Location
Durum 103 ND, MT
HRS 457 MN, MT, ND, SD
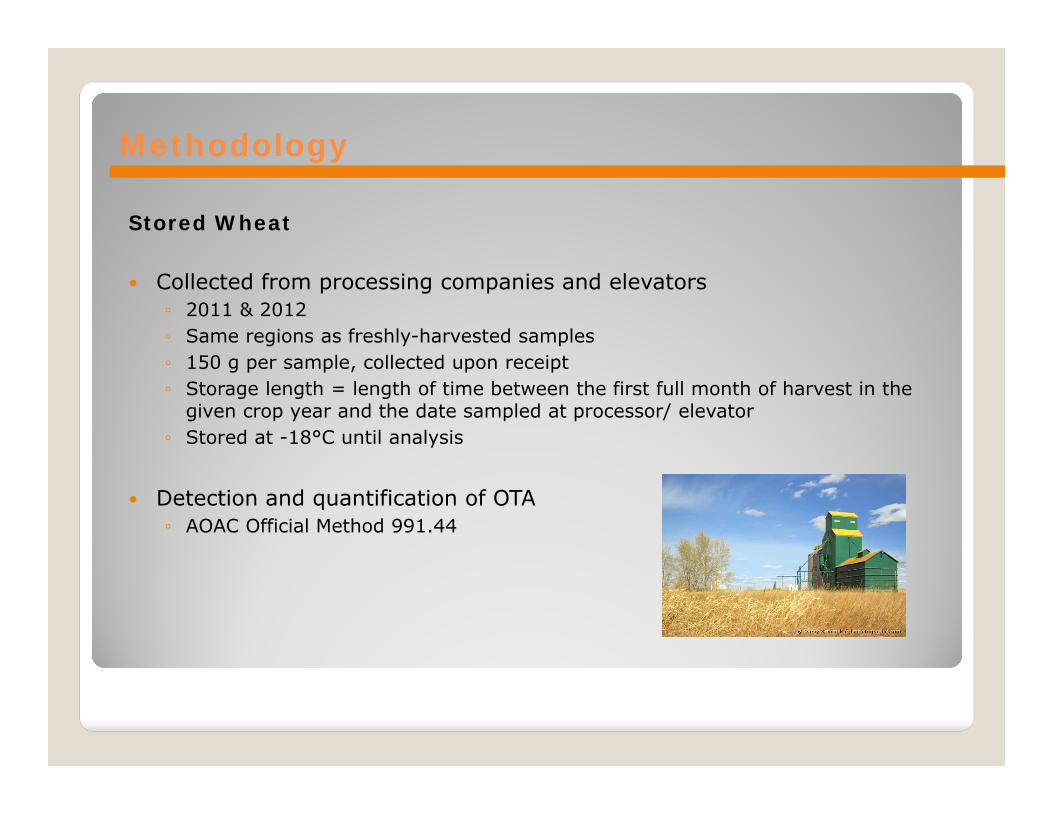
Stored Wheat
Collected from processing companies and elevators◦ 2011 & 2012◦ Same regions as freshly-harvested samples◦ 150 g per sample, collected upon receipt◦ Storage length = length of time between the first full month of harvest in the
given crop year and the date sampled at processor/ elevator ◦ Stored at -18°C until analysis
Detection and quantification of OTA ◦ AOAC Official Method 991.44
Methodology
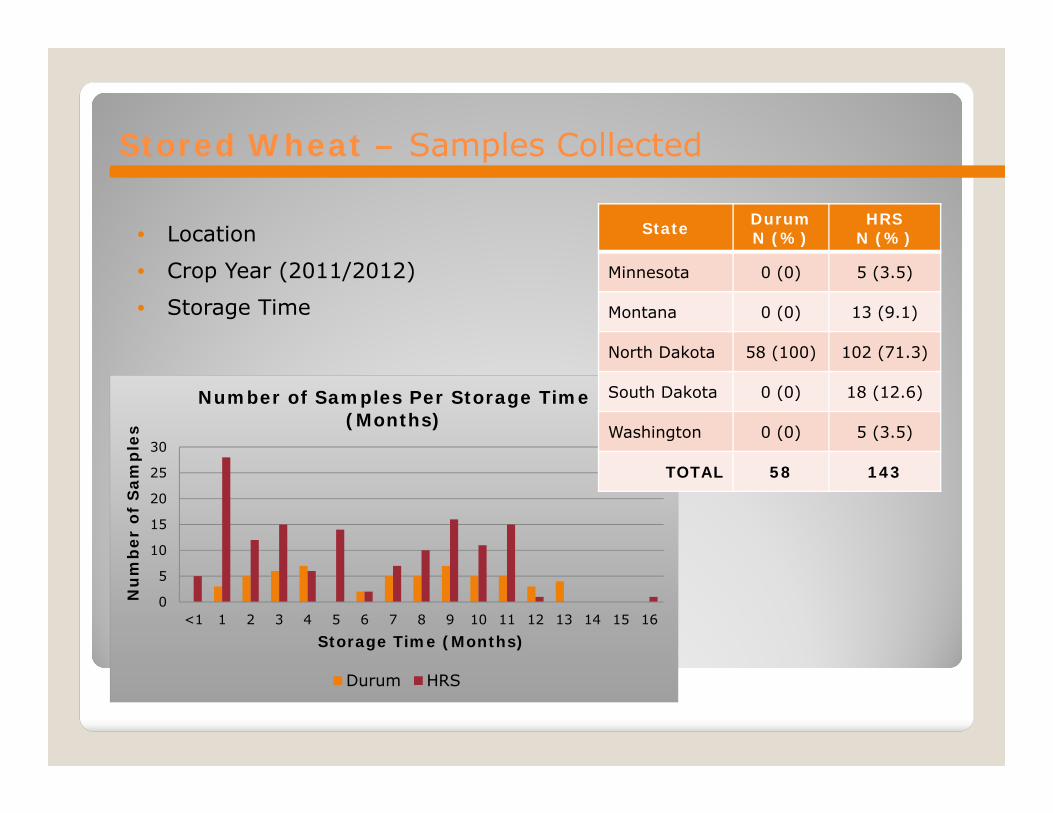
Stored Wheat – Samples Collected
0
5
10
15
20
25
30
<1 1 2 3 4 5 6 7 8 9 10 11 12 13 14 15 16
Nu
mb
er o
f S
amp
les
Storage Time (Months)
Number of Samples Per Storage Time (Months)
Durum HRS
State Durum N (%)
HRSN (%)
Minnesota 0 (0) 5 (3.5)
Montana 0 (0) 13 (9.1)
North Dakota 58 (100) 102 (71.3)
South Dakota 0 (0) 18 (12.6)
Washington 0 (0) 5 (3.5)
TOTAL 58 143
• Location
• Crop Year (2011/2012)
• Storage Time

Results
Freshly Harvested Wheat
Durum◦ 1 positive; 1/103 = 1.0%◦ 5.56 ppb
HRS◦ 0 positive out of 457
Stored Wheat
Durum◦ 13 positive; 13/58 = 22.4%◦ Range = 0.17-14.94 ppb◦ Median = 1.87 ppb ◦ Mean = 3.30 ppb◦ Storage length = 4-12 months
HRS◦ 13 positive; 13/143 = 9.1%◦ Range = 0.31-49.27 ppb◦ Median = 0.7 ppb◦ Mean = 6.07 ppb◦ Storage length = 1-11 months
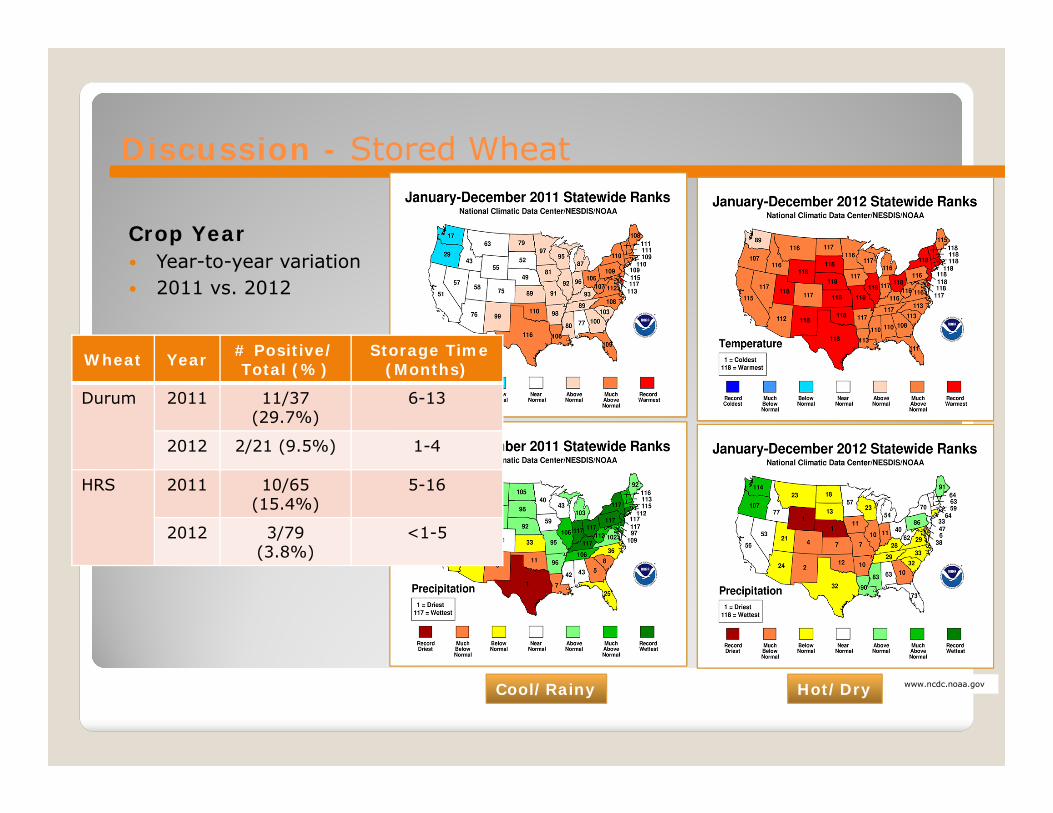
Discussion - Stored Wheat
Crop Year Year-to-year variation 2011 vs. 2012
Cool/Rainy www.ncdc.noaa.govHot/Dry
Wheat Year # Positive/ Total (%)
Storage Time (Months)
Durum 2011 11/37 (29.7%)
6-13
2012 2/21 (9.5%) 1-4
HRS 2011 10/65 (15.4%)
5-16
2012 3/79(3.8%)
<1-5

Discussion - Stored Wheat
Location Durum – all samples from ND HRS – 4/5 states had positives
State # Positive Total # of Samples
Positive(%)
Minnesota 3 5* 60.0
Montana 2 13 15.4
North Dakota 7 102 6.9
South Dakota 1 18 5.6
Washington 0 5 0
*All samples were from same location

Discussion - Stored Wheat
Storage Time
Positive samples stored for 4-12 months (durum); 1-11 months (HRS)◦ 20/26 positives (76.9%) were stored ≥7 months
Effect of temperature and moisture content
0123456
1 2 3 4 5 6 7 8 9 10 11 12Nu
mb
er o
f P
osit
ive
Sam
ple
s
Time (Months)
Number of OTA-Positive Samples Related to Storage Time (Months)
Durum HRS
Nithya et al (2011)

Discussion Freshly Harvested Wheat
One positive durum sample (5.56 ppb) Overall – 1/560 (0.2%) positive
◦ Shotwell et al (1976) - Hard red winter, hard red spring, and soft red winter wheat; 1970-1973; n=848 3 HRW (<15-35 ppb) and 8 HRS (15-115 ppb) were positive 11/848 = 1.3% LOD was >15 ppb
◦ Trucksess et al (1999) – Winter wheat (n=383); 1997; sampled from rail cars and trucks 36 winter wheat (0.03-31.4 ppb) were positive 36/383 = 9.4%
“Grain of Salt” – Or Wheat? Representative sample – “hot spots” No true standard method Recovery rates

First study in the U.S. that: ◦ Examines the incidence of OTA present in freshly harvested and stored durum
wheat ◦ Surveys for OTA at several different points of storage under natural conditions
Contribute to current knowledge of OTA prevalence in wheat produced in the United States
Confirm points at which prevention strategies would be most useful to limit OTA-infected wheat from entering the food chain
Research Significance

Future Research
Analyze 2012 survey samples
Test positive samples for OTA-producing fungi◦ Diversity
Quantify the number of possible OTA-producing fungi in composited samples of freshly harvested and stored wheat◦ Relation of biomass to presence of OTA
Utilize meteorological data and mapping tools to determine the effect of environmental factors on the presence of possible OTA-producing fungi ◦ HRS survey samples – 2011/2012 ◦ Long-term → possible predictive model

Questions