ocean and coastal management - cranfield university
TRANSCRIPT

Ocean and Coastal Management 185 (2020) 105004
Available online 7 October 20190964-5691/© 2019 The Authors. Published by Elsevier Ltd. This is an open access article under the CC BY license (http://creativecommons.org/licenses/by/4.0/).
The role of data within coastal resilience assessments: an East Anglia, UK, case study
Alexander G. Rumson a,*, Andres Payo Garcia b, Stephen H. Hallett a
a School of Water, Energy and Environment, Cranfield University, Bedford, UK b British Geological Survey, Keyworth, Notts, UK
A R T I C L E I N F O
Keywords: Coastal management Resilience metrics Geospatial data Open source data Big data
A B S T R A C T
Embracing the concept of resilience within coastal management marks a step change in thinking, building on the inputs of more traditional risk assessments, and further accounting for capacities to respond, recover and implement contingency measures. Nevertheless, many past resilience assessments have been theoretical and have failed to address the requirements of practitioners. Assessment methods can also be subjective, relying on opinion-based judgements, and can lack empirical validation. Scope exists to address these challenges through drawing on rapidly emerging sources of data and smart analytics. This, alongside the careful selection of the metrics used in assessment of resilience, can facilitate more robust assessment methods. This work sets out to establish a set of core metrics, and data sources suitable for inclusion within a data-driven coastal resilience assessment. A case study region of East Anglia, UK, is focused on, and data types and sources associated with a set of proven assessment metrics were identified. Virtually all risk-specific metrics could be satisfied using available or derived data sources. However, a high percentage of the resilience-specific metrics would still require human input. This indicates that assessment of resilience is inherently more subjective than assessment of risk. Yet resilience assessments incorporate both risk and resilience specific variables. As such it was possible to link 75% of our selected metrics to empirical sources. Through taking a case study approach and discussing a set of re-quirements outlined by a coastal authority, this paper reveals scope for the incorporation of rapidly progressing data collection, dissemination, and analytical methods, within dynamic coastal resilience assessments. This could facilitate more sustainable evidence-based management of coastal regions.
1. Introduction
Creation of resilience in coastal areas is now commonly acknowl-edged to be a core requirement of sustainable coastal management practices (Farhan and Lim, 2011; Karavokiros et al., 2016; Kim et al., 2014; McFadden, 2010; Nicholls and Branson, 1998; Viavattene et al., 2018). Resilience is itself a broad concept and can be defined in different ways depending on how the term is applied (i.e. ecological resilience, engineering resilience). Ecological resilience focuses on the functioning of a system and persistence of relationships, and recognises the possi-bility of a resilient system shifting between stable states (Holling, 1973). Engineering resilience differs in that it relates to stability near an equilibrium state, and the ability of a system to return to an original state following a disturbance or perturbation by external stresses (Hol-ling, 1996; Pimm, 1984). In general, resilience is associated with the capability to absorb and respond, and the existence of an internal
adaptive coping capacity (Gallopín, 2006). The Stockholm Resilience Centre (2015) define resilience as the capacity to deal with change and continue to develop. There is considerable discussion concerning how coastal resilience may be defined and measured (Coastal and Environ-mental Research Committee, 2015). Coastal resilience relates to societal, economic and ecological factors (NOAA, 2018a). In addressing coastal resilience, this article draws primarily on the ecological definition of resilience, focusing on the persistence of relationships, and the ability to shift to alternative stable states. Our main focus is the resilience of coastal communities to environmental hazards (particularly flooding and erosion).
Planning for resilience in coastal areas extends beyond assessment of vulnerability and risk. Resilience planning can be characterized by an iterative process involving preparation for hazard events, immediate responses, and recovery (NOAA, 2018b). To achieve resilience, it is inadequate to rely solely on reactive responses to hazard events, it is also
* Corresponding author. School of Water, Energy and Environment, Building 53, Cranfield University, Bedford, MK43 0AL, UK. E-mail address: [email protected] (A.G. Rumson).
Contents lists available at ScienceDirect
Ocean and Coastal Management
journal homepage: http://www.elsevier.com/locate/ocecoaman
https://doi.org/10.1016/j.ocecoaman.2019.105004 Received 2 August 2019; Received in revised form 22 September 2019; Accepted 25 September 2019

Ocean and Coastal Management 185 (2020) 105004
2
necessary to undertake proactive adaptations, increasing the ability of coastal communities to ‘bounce back’ following shock events (Kete et al., 2018; Leal Filho et al., 2018; NOAA, 2018a; Twigger-ross et al., 2015). Achievement of sustainable coastal management strategies therefore necessitates completion of evidence-based resilience assess-ments. To ensure these assessments generate usable outputs, they must address requirements outlined by coastal practitioners relating to vulnerability, impacts, and policy evaluation. This can contribute to the attainment of goals for sustainable economic development in coastal regions (DasGupta and Shaw, 2015).
There are many studies focusing on resilience which adopt a theo-retical approach, developing as a result, conceptual resilience assess-ment frameworks. Amongst studies focusing on resilience (both theoretically based and those more practical) there is no widely agreed definite framework. This is in contrast to risk where many risk based studies are centred on approximations of the standard risk equation: Risk ¼ Hazard x Consequences (Defra, 2009; Goverment Office for Sci-ence, 2004; Nicholls et al., 2015). This ambiguity surrounding the practical application of resilience assessments is a contributing factor to greater emphasis being placed on evaluation of risk, rather than resil-ience, by those tasked with managing vulnerable coastal regions. Yet resilience is increasingly acknowledged as a key discourse within coastal management studies and by the wider practitioner community (Cai et al., 2018a; Defra, 2016; Deutz et al., 2018; Karavokiros et al., 2016; National Infrastructure Commission, 2018; Viavattene et al., 2018; Word Bank, 2017). Given this, a requirement exists for a standardised methodological approach to coastal resilience assessment.
In addition to the lack of a single accepted methodology for coastal resilience assessment, many existing methodologies can be difficult for practitioners to apply, requiring high levels of specialist input. Assess-ments can also be subjective due to a reliance on expert opinion and value-based judgements. To overcome such limitations requires appli-cation of methodologies founded on analysis of empirical evidence. Today, a data-driven resilience assessment strategy is now a realistic possibility (Bellini et al., 2016) due to the ever expanding volumes of data being made available, much of which is obtainable open source, and has already been revealed as suitable for fulfilling coastal risk assessment requirements (Rumson and Hallett, 2018). Yet, under-standing coastal resilience requires consideration of a wider range of indicator variables than risk. Furthermore, general consensus is lacking, on the indicators or metrics that should be included within a resilience assessment. The requirement for such metrics, based on clear, simple data and information has been identified as forming the basis of long-term adaptation planning (Committee on Climate Change UK, 2018). In particular the need for indicators which can be based on Big Data and open source data is now being acknowledged (Jovanovic et al., 2016). In this paper, we set out to tackle the fundamental issue of the evidence base required for coastal resilience assessments. In doing so, we have drawn on a simple resilience assessment framework, populated by quantifiable assessment metrics. In addressing the requirement for empirical evidence, examples of data sources that could be drawn upon to address each metric are discussed, and example data sources are provided for a case study region in East Anglia, UK. Additionally, we identify areas where data is currently lacking, and where qualitative inputs must still be sought.
Recent, rapid progression in the methods utilised for collection and analysis of data underpin our ability to reduce uncertainty in coastal planning. This can provide opportunities to steer investment decisions on the coast towards profitable developments. The central objective of this study is to reveal how assessments of coastal resilience can be founded on smart analytics (Jovanovic et al., 2016; Lee et al., 2014; Marr, 2015) of diversified and robust datasets. Furthermore, this can allow identification of stakeholders who are vulnerable yet potentially unaware and unprepared. We explore how coastal practitioners can incorporate important missing aspects of coastal resilience within their decision-making processes at both local and regional scales. This may
provide opportunities to lessen impacts, enable bounce back and iden-tify contingencies. Moreover, it may permit future investments to be steered towards sustainable areas, creating economic development op-portunities, preserving and enhancing natural capital. Overall, the study’s intention is to contribute to furthering our understanding of the poorly known aspects of how to operationalize existing coastal resilience into every day decision-making.
2. Case study: East Anglia and Coastal Partnership East (CPE)
A case study region of East Anglia, in the East of England was selected for this study. The work benefited from input received from coastal practitioners tasked with managing this coastline: the key or-ganisations being CPE and the Environment Agency (EA). East Anglia is a highly vulnerable coastal region, experiencing both high levels of erosion and regular and extensive coastal flooding (Nicholls et al., 2015). The region comprises a diverse range of coastal environments and anthropogenic activities. A number of coastal towns, such as Low-estoft and Great Yarmouth, have experienced economic decline in recent times, as a result of a declining tourism industry (Agarwal and Brunt, 2006) and significant job losses in traditional industries such as fishing (Brookfield et al., 2005). This can result in densely populated and economically deprived communities, being exposed to hazard events, and with residents lacking the capacity to take mitigating actions or to finance recovery. Previous generations have responded to coastal hazard events, such as the 1953 storm surge, by installing hard engineered coastal adaptations (Mokrech et al., 2011). In many instances these measures have been associated with disruption of natural processes, such as alongshore sediment transport pathways, often resulting in exacerbated impacts in unprotected areas (Nicholls et al., 2015).
East Anglia is also home to a range of diversified natural environ-ments and complex ecosystems, such as the Norfolk Broads. Recent shifts in the dominant approach taken by governments in managing the coasts of England has resulted in a greater focus being placed on the impor-tance of natural systems and ecosystems services (Defra, 2006). As such, soft adaptation measures, designed to work with nature, are increasingly being implemented (Milligan et al., 2009). Managed realignment is a prominent example of a soft adaptation measure considered in East Anglia (Myatt et al., 2003), and in the future other methods such as sandscaping are set to be implemented (Vikolainen et al., 2017). Following a second round of Shoreline Management Plans (SMPs) (Defra, 2006), sections of the coastline of East Anglia were re-categorised. This has resulted in deteriorating hard adaptation mea-sures not being replaced, or in many locations being completely removed. Based on the reclassification of stretches of coastline as either, ‘No Active Intervention’ or ‘Managed Retreat’, projections have been made on sections of coast expected to erode, over the epochs of 20, 50 and 100 years. This has resulted in the creation of Coastal Change Management Areas (CCMAs) (Environment Agency, 2010), in which restrictions are placed on future developments due to anticipated high levels of coastal retreat. This has direct implications for resilience as-sessments for the region, as communities, businesses and infrastructure located within the CCMAs, may not be expected to bounce back, or fully recover, following hazard events.
Due to the range of unique contextual factors present in East Anglia, combined with high levels of vulnerability, the region has been moni-tored extensively. Large quantities of diversified datasets for the region are now freely available to the public, accessed via open source data portals (Rumson and Hallett, 2018). For this reason, the region proves especially suitable as a case study site for this research, as data sources associated with many of the selected assessment metrics (Appendix B), can easily be located. Additionally, the major stakeholder organisation, responsible for management of the eroding coastline of the region, CPE, agreed to provide input to this study. This input took the form of un-structured interviews, and questionnaire feedback, but most impor-tantly, a set of practitioner requirements were supplied, specifying
A.G. Rumson et al.

Ocean and Coastal Management 185 (2020) 105004
3
desirable outputs sought from resilience assessments for the region (Fig. 1).
CPE is a consortium of four coastal groups, representing Gt. Yar-mouth Borough Council, North Norfolk District Council, Suffolk Coastal District Council and Waveney District Council. In 2016 the coastal management resources from these respective councils amalgamated to share their resources to manage the region more effectively (Coastal Partnership East, 2019). The aim of this wider regional focus was to foster collaboration and knowledge sharing and to pool resources for a larger contiguous area, which can promote risk and resilience assess-ments for larger spatial scales. As a body representing district level councils, the main hazard CPE is concerned with is erosion, whilst the EA are responsible for managing the risk of coastal flooding (Environ-ment Agency, 2010). CPE’s bias towards erosion is reflected in the re-quirements set out above. However, flooding and erosion in coastal areas are closely interrelated, and can occur in tandem (Defra, 2005). As such assessments of coastal resilience will generally need to account for impacts from both. The requirements listed above were deemed neces-sary for a coastal resilience assessment by the practitioners questioned, yet are not sufficient to account for all forms of resilience. Primarily, this study sets out to reveal how the requirements can be addressed through consideration of the framework, metrics, and data sources outlined. We also expand upon these requirements, indicating how the approach could be applied to a broader context.
3. Quick scoping review (QSR)
Standardised resilience assessment methodologies have rarely been applied directly to coastal settings. As such, agreeing on acceptable quantitative resilience assessment metrics has proved prob-lematic and remains a challenge for the research and practitioner communities (Coastal and Environmental Research Committee, 2015). In an attempt to gain a more thorough understanding of this issue a QSR was undertaken to establish what methods, metrics and datasets have been applied within previous coastal resilience assessments. The QSR methodology and results are presented within Appendix A. Through undertaking this QSR and securing an understanding of what coastal resilience assessments are being completed, and the data and informa-tion sources utilised, the most suitable metrics, and data sources could be selected. Evidence extracted from the 8 practitioner reports and 29 academic articles, which passed through the QSR screening process, is presented in Tables 3 and 6 in Appendix A. Application of this evidence is discussed in the remainder of the paper.
4. Simple resilience assessment framework and metrics
Following completion of the QSR an extensive list of metrics, which can be drawn on within coastal resilience assessments, was established (Appendix B). This list is comprehensive yet not exhaustive. The metrics have been split into six categories, which comprise the framework pre-sented in Fig. 2. Four categories (1. Hazard Source, 2. Pathway, 3. Re-ceptor, and 5. Impacts/Consequence) are also common aspects
addressed by coastal risk assessments, in particular the SPRC (Source- Pathway-Receptor-Consequence) model (Gouldby and Samuels, 2005; Villatoro et al., 2014). However, aspects of category 4. Risk Reducing Measures, and Category 6. Recovery, are more exclusive to assessment of resilience. Stage 4.1. Adaptations, contains measures generally considered to be resilience increasing; yet it is common for adaptations to be accounted for within risk assessments, as adaptation can alter risk levels and defer impacts. However, the metrics contained within Stage 6. Recovery and Stage 4.1. Preparations and Contingencies, are not so frequently associated with risk. Inclusion of these additional metrics provides a means of progression from assessment of risk to resilience, revealing the capacity of coastal regions to continue to function and recover following hazard events.
The metrics were grouped into categories at the discretion of the authors. This drew primarily on the SPRC model (Gouldby and Samuels, 2005), in which the coastline is divided into homogenous pathway units, based on a limited number of typologies and the hinterland divided equally into receptor units, based on features such as: land use, elevation and geomorphology. In short, the metrics falling into Stage 1, largely represent physical conditions, relating to hazard sources (i.e. environ-mental parameters); Stage 2, pathways through which the hazards propagate (i.e. the coastline); and Stage 3, hazard receptors (i.e. people, property, infrastructure and the environment). Those attributed to Stage 4 were split between 4.1, Adaptations and 4.2, Preparations and Con-tingencies. Adaptations were either physical measures undertaken by humans to lessen impacts or services afforded by the natural environ-ment, whilst the metrics representing preparations and contingencies, are associated more with long term measures in place, potentially boosting resilience. The metrics assigned to Stage 5, represent the consequence aspect of the SPRC framework and give an indication of change associated with hazard propagation. Whilst Stage 6 metrics, represent how effectively communities have reacted to coastal hazards.
Previous studies focusing on coastal risk assessment reveal how as-pects we have included within categories 1, 2, 3, and 5, such as hazard probability, intensity, and consequences (relating to land use,
Fig. 1. CPE Practitioner requirements.
Fig. 2. Coastal resilience assessment framework.
A.G. Rumson et al.

Ocean and Coastal Management 185 (2020) 105004
4
populations, business and infrastructure), have formed core inputs to risk evaluations (Narayan et al., 2014; Villatoro et al., 2014). Other studies, such as that of Bheeroo et al. (2016) reveal how metrics asso-ciated with physical coastal impacts have also formed the basis of risk assessments. However, reactions to coastal hazards, in the form of ad-aptations have been noted as being absent from many previous risk as-sessments, especially from those based on the CVI (Coastal Vulnerability Index) approach (Ramieri et al., 2011). The Coastal Risk Assessment Framework (CRAF) developed as part of RISCKIT (Christie et al., 2018; Ferreira et al., 2016; Viavattene et al., 2018), typifies a common approach to risk assessment, in its identification of hazards and conse-quences allowing classification of stretches of coast as vulnerability hot spots. The CRAF approach, does include metrics representing recovery, however it lacks the diverse range of indicators representing adapta-tions, preventative measures, and contingencies required by a resilience assessment. Part of the novelty of this current study, is that it identifies the means to evaluate these factors systematically, alongside the core aspects associated with risk assessments.
The data and information requirements for each metric varied. For each metric, we indicate if it is possible to obtain the required datasets based on data available for the case study region. If so, example datasets, associated with East Anglia have been listed. A list of data sources is provided in Appendix C, and cross references to this are provided within a column, in each table of metrics, labelled ‘Available from’. The data sources detailed are only indicative and are not an exhaustive listing of those available. Both proprietary and open source datasets are listed in Appendix C; issues relating to the choice of open or proprietary data are further discussed in Section 4.2. 254 separate assessment metrics are listed in Appendix B. These metrics were mostly derived from the arti-cles, reviewed as part of the QSR, listed in Appendix A. For each metric, a cross reference is given in the respective table, in a column labelled ‘Paper Ref.’, indicating the academic article(s) which included similar metrics. This is given in the form of a letter or symbol associated with the respective paper #, as detailed in Appendix A.
5. Metric selection
In collating the diverse range of indicator metrics listed in Appendix B and summarised in Table 1, we aim to provide a range of options from which different groupings of indicators could be selected. The choice of metrics for a data-driven resilience assessment would depend on data and information availability, the type of area (urban/ rural), at what scale an assessment is carried out (local/regional/na-tional), and if an assessment is concerned with a specific kind of resil-ience i.e. community, infrastructure, ecosystem. It is not envisaged that a single resilience assessment would include all metrics, as this would prove time consuming and resource intensive. However, consideration of the large number of metrics we have presented, can allow coastal practitioners to select the factors they deem most significant for the coastal region under consideration. Many of the metrics listed cover a broad range of potential indicators, such as metric 8: Oceanographic/ meteorological sensor networks, records and projections. In an effort to provide more options, and limit the number of metrics, these broad categories were not broken down further. However, during practical application, the precise indicator to be used, within such metrics, would need to be defined. Confidence levels in the results obtained for each metric would depend on data source veracity. Table 1 identifies the subcategories for each stage of the assessment framework detailed in Fig. 2 with their respective metric numbers. The stages of the framework are closely interrelated, and feedback loops exist between each. This also fits with a whole systems approach (Narayan et al., 2014), which tran-scends the notion of impacts considered in isolation, and acknowledges the interrelated nature of the multitude of disparate factors which need to be monitored and analysed.
5.1. Stage 1–3 source – pathway – receptor
Stage 1 of the resilience assessment framework (Fig. 2) relates to hazards. The metrics included generally represent quantifiable param-eters, which can be obtained through analysis of environmental
Table 1 Summary of metric listing. The metrics were broken down into 6 stages, these have been divided further into subcategories. The column ‘Metrics’ details the metric numbers included within each stage and sub-category.
Stage Metric Sub-categories Metrics
1 Hazard Source General 1–13 Past environmental conditions during hazard events 14–16
2 Pathway N/A 17–38 3 Receptor General 39–44
Public Amenities 45–54 Economy & Business 55–71 People 72–87 Property 88–98 Infrastructure 99–121
4 Risk Reducing Measures 4.1 Adaptation Human Structural 122–127 Human Soft 128–133 Mitigation 134–143 Ecosystem Services 144–157 Planning 158–166 Financial 167–168
4.2 Preparation & Contingencies Monitoring/Warning Systems 169–174 Infrastructure 175–180 Drainage 181–184 Shelter/Housing 185–186 Emergency Relief 187–197 Societal 198–203 Hazard Awareness 204–207
5 Impacts/Consequence Environmental physical impacts 208–215 General 216–220 Business 221–223 People 224–227 Property 228–230 Infrastructure 231–237
6 Recovery N/A 238–254
A.G. Rumson et al.

Ocean and Coastal Management 185 (2020) 105004
5
monitoring data, geostatistical datasets, or a combination of both. Hazard prediction information is paramount for assessment of coastal resilience, it can permit communities and civil protection agencies to respond and put in place hazard reduction measures (Defra, 2016). In addition to naturally occurring hazards, human actions or hazard re-sponses, can also be looked on as hazards in their own right. These can take the form of maladaptive actions which can exacerbate impacts. For this study, the hazards are mainly weather induced, relating to coastal erosion and flooding (as is typical for many studies focusing on coastal resilience (Ellison et al., 2017; Karamouz and Zahmatkesh, 2017; Schultz and Smith, 2016). The propagation of these physical hazards through various pathways (Stage-2), such as wave overtopping and flood plain inundation (Reeve et al., 2012)), results in threats to re-ceptors (Stage 3) (i.e. households, businesses, infrastructure (Fekete et al., 2017), and the functioning of ecosystems (Ellison et al., 2017)), and can result in adverse consequences to human health, welfare, and the natural environment. Therefore, metrics representing receptors, such as those which can be derived from population statistics, have been included in Stage 3. For East Anglia, information is readily available from the Office for National Statistics (ONS) documenting such variables (Fig. 3).
5.2. Stage 4: risk reducing measures
The sequential progression of the stages in the framework (Fig. 2), are representative of the impacts experienced (Stage 5) being directly related to adaptations in place (Stage 4.1). These can take the form of large-scale structural adaptations, implemented through engineering projects, i.e. sea defences and dykes, or local/household level mitigation measures, i.e. retrofitting buildings or raised accommodation (as was recognised to be important by Kim et al. (2014) for Galveston, Texas). Alternatively, adaptations can involve working with nature, utilising ecosystem services, and natural capital (National Infrastructure Com-mission, 2018; NOAA Office for Coastal Management, 2015). This can
involve salt marsh restoration or preservation of woodland areas and pervious surfaces (which can limit flood water propagation and inun-dation extents). Such nature-based adaptations are increasingly looked to and are commonly implemented across the case study region of East Anglia. Many of these are termed soft adaptations and can take the form of green infrastructure (Song et al., 2018), beach nourishment, and managed realignment (Finkl, 2015). Measures such as insurance can also provide mechanisms to encourage resilience practices, increasing adaptive capacity, in its ability to distribute and communicate risk (Rumson and Hallett, 2019). These various modes of adaption are rec-ognised within the metrics included in Stage 4. Obtaining datasets to cover many of these metrics can be challenging. For example, details at a household (property) level, such as building attributes, or mitigating measures implemented, are difficult to obtain, yet are acknowledged as required (Bonfield, 2016), and are necessary to include in an assessment of resilience (Garvin et al., 2016).
The metrics for Stage 4.2 relate to preparations for hazard events and the contingencies put in place. These are biased towards flooding and disaster incidents (as in Bostick et al., 2017; Keating et al., 2017; Ola-dokun et al., 2017). This is reflected in a number of the sub-category groupings, including: emergency services, shelter/housing, monitoring and warning systems, and drainage (NOAA Office for Coastal Manage-ment, 2015). Not all metrics for Stage 4.2 are restricted to these forms of resilience though, and the remaining groupings of metrics (infrastruc-ture, societal, hazard awareness), are not constrained to flooding and relate to both short- and long-term resilience (short-term taken as the immediate ability to respond to hazard events, whilst long-term resil-ience is taken to be the ability recover from the wider aftermath of many such events).
The data/information requirements of Stage 4.2’s metrics, were not easily resolved (as was the case for Stage 6). Therefore, many of the required inputs would need to be derived directly from stakeholder or-ganisations (as in Bostick et al., 2017; Keating et al., 2017). The metrics included in Stage 4 are diversified, many of these differ substantially from those commonly found in a risk assessment. These metrics seek to represent societal capacity to cope with the unexpected. This requires incorporation of varied measures, representing planning and prepara-tions made at various levels of society, from the hazard awareness of individuals, to social groups and civil society organisations, government level planning, warning systems, emergency relief organisations and networks, and implementation of resilient infrastructure (Allen et al., 2018). The post-impact provision of basic services, such as food, water, communications, and waste removal/treatment (EPICURO, 2018), are especially important considerations within this stage of a resilience assessment, but are not factors commonly considered within coastal risk assessments. Human behaviour also stands out as an important element to include within an assessment of resilience. Human responses to recent hazard events (such as the 2013 Storm Surge in East Anglia (Brooks et al., 2016)) or hazard information can influence decisions to take mitigating actions, to undertake more sustainable practices, or to move from risk zones (Aerts et al., 2018; Jenkins et al., 2017).
5.3. Stage 5: impacts/consequence
Hazard receptors are numerous and diversified. Stage 5 includes metrics representing the impacts to and consequences upon receptors including: the natural and built environments, business and the econ-omy, and coastal populations. To account for human receptors many metrics are included representing the size, distribution, and composition of coastal populations, including social indicators, i.e. health and wealth. In addition to this, more diverse receptors are accounted for in metrics representing the distribution and concentration of physical as-sets, business activity, infrastructure dependencies, and ecosystem ser-vices. Inclusion of such can provide a means to quantify exposure across multiple spheres. The metrics selected for assessment of impacts seek to reveal both immediate and long-term impacts (or consequences)
Fig. 3. Example of data used to address metric 72: Poverty Levels. ONS data made available through Datashine. DataShine is produced by the BODMAS project at UCL (http://www.datashine.org.uk/). Households by deprivation dimension (Red – most deprived through to Green – least deprived) (University College London, n.d.; O’Brien and Cheshire, 2015). (For interpretation of the references to colour in this figure, the reader is referred to the Web version of this article.)
A.G. Rumson et al.

Ocean and Coastal Management 185 (2020) 105004
6
resulting from hazard propagation. Therefore, diverse elements are represented by the metrics associated with Stage-5’s subcategories (Table 1). Examples of these being: Environmental physical impacts - geomorphological change (i.e. shoreline recession such as that occurring in Norfolk, (Fig. 4), and extents of flooding (Fig. 5); General - physical
damage and financial loss; People - human health and socio-economic feedback, i.e. job losses, and crime; Property - house prices; and, Busi-ness - business activity. Coastal hazards can result in cascading conse-quences (Cutter and Derakhshan, 2018), due to disruptions to business and supply chain shocks (Papadopoulos et al., 2017). As such, identifiers
Fig. 4. Example of data used to address metric 210: Geomorphological change -records of beach/loss creation. Lidar data sourced from BGS and the EA, used to estimate coastal retreat at Sidestrand between 2005 and 2018, Norfolk. Measured retreat along the white line between red and yellow points ¼ 46m. (For inter-pretation of the references to colour in this figure legend, the reader is referred to the Web version of this article.)
Fig. 5. Data used to assess metric 216: Extents of flooding and impacts (physical and human). Geotagged flood related social media data: Tweet revealing coastal flooding extents in North Norfolk, made available by FloodTags and IVM (https://www.floodtags.com). Note, the area highlighted in blue, does not represent flooding extents, but indicates the geographical limits for which the search of social media data was completed.
A.G. Rumson et al.

Ocean and Coastal Management 185 (2020) 105004
7
have been compiled, to assist in the estimation of more far reaching effects resulting from short- and long-term hazard propagation. These can, for example, include infrastructure failures, related to roads, power stations, and water supply (Allen et al., 2018). Data detailing damages and loss can be difficult to obtain and may need to be sourced from specialist suppliers, such as those associated with insurance companies (Rumson and Hallett, 2019). Furthermore, in order for assessments to retain their validity, continually updated information detailing new developments must also be included.
5.4. Stage 6: recovery
The metrics included within Stage 6 can provide an overview of how effectively communities have reacted to and recovered from hazard events. In this, recovery is defined as the ability for communities and systems to return to a stable functioning state, not necessarily their original state. This fits with definitions of ecological resilience, based on systems shifting between stable states (Holling, 1973). In line with this, the metrics we have included cover factors which can provide an indi-cation of the functioning of communities following an impact, such as financial recovery, restoration of the functioning of infrastructure (Joyce et al., 2018), industrial resupply, and the performance of relief and emergency services (Papadopoulos et al., 2017). In addition to this, indirect indicators associated with recovery, revealing more immediate responses have been included, i.e. functioning of warning systems, and evacuation of homes. In this work, we have not stipulated specific thresholds or benchmarks related to the individual metrics, however in order to determine if a system or community had fully recovered, this would be desirable. To establish such benchmarks for recovery would require more extensive inputs from a range of stakeholders representing multiple sectors and interest groups. As such, more subjective inputs could prove necessary to fully appreciate a community’s capacity to recover. Data for the metrics included within Stage 6, were also found more difficult to obtain and quantify for the case study area, than in-dicators associated with the SPRC model. The majority of Stage 6 met-rics were deemed, by the authors, to require specialist input or derived data (such as that extracted from social media feeds revealing public sentiment in relation to government actions (Fig. 5)). Practitioners questioned in East Anglia concurred with this. Indicators relating to response and recovery times are not generally published, yet this may change in the future, if demand for these variables increases.
6. Data sources
Data forms the foundation of the knowledge base required for effective coastal zone management (Zanuttigh et al., 2014). The ability for coastal populations to deal with the diverse impacts resulting from environmental hazards, hinges on the availability and use of suitable datasets. This can allow appropriate planning decisions and adaptive measure to be implemented (Rumson et al., 2017). A wide range of data sources should be included within a coastal resilience assessment, this is represented in those associated with the selected metrics.
6.1. Evidence base for metric evaluation
In attempting to source data for so many separate metrics, we sought to provide an indication of the existing evidence base available for an assessment of coastal resilience. Of the 254 metrics selected for this study, 149 (59%) were linked with the data sources located for the East Anglia case study area (Appendix C). Another 39 metrics (16%) were categorised as requiring data derived through combination or analysis of the datasets available from these sources (as detailed in Section 4.2.5). Data sources addressing the requirements of all metrics could not be located though, and 44 metrics were categorised as requiring informa-tion sourced directly from stakeholder organisations. Furthermore, the
data sources required for 12 of the metrics were not defined. Of the 25% of the metrics for which more subjective, expert-based inputs were required, none were associated with aspects of the resilience assessment framework typically linked to risk assessments (Stages 1, 2, 3 & 5). Conversely, Stages 4 and 6, which are deemed more resilience specific by the authors, were revealed as the most difficult to satisfy through existing data sources. This implies that higher levels of subjectivity are associated with assessment of resilience than with risk. Nevertheless, this study indicates that the data requirements of 75% of a broad range of metrics, suitable for assessment of resilience, could be derived from empirical sources.
6.2. Evaluation of data sources
Due to the breadth of metrics selected, it was not possible to com-plete a comprehensive validation of all empirical data sources listed. This would need to be completed on a case by case basis. A single resilience assessment would require only a limited selection of the metrics listed, therefore at the application stage a more thorough eval-uation of data source suitability would be more feasible. The data source evaluation undertaken within this study, was limited and the sources associated with the metrics (Appendix C) are only indicative, not an exhaustive listing. Furthermore, the data sources which were selected for the case study area primarily act as a guide to the type of organisa-tion, which may hold data relevant to the selected metrics. This infor-mation can potentially allow similar organisational sources to be discovered for assessments undertaken in alternative locations.
6.3. The cost of data
Due to the diverse range of metrics included within this study, it was not possible to obtain data satisfying all their requirements from open sources. Therefore, proprietary data sources, and services were also included within the examples provided in Appendix C. There are mul-tiple issues which need consideration when making a choice to use either open or proprietary data sources. For East Anglia, a large volume and variety of open source data is available, however, this is not the case for many other parts of the world. The veracity of open data sources is also not guaranteed, and the data may require extensive processing and preparation before it can be utilised in assessment of the respective metrics. Given this, in many cases it can prove more effective to pur-chase data services or proprietary datasets, than attempt to locate and prepare the freely available sources which exist for an area. This deci-sion can also be dictated by technical operator skills, as many of the datasets associated with the selected metrics require specialist technical or scientific interpretation (especially many of the metrics associated with environmental monitoring data, included in Stage 1). Financial constraints imposed upon an organisation undertaking a resilience assessment can also affect the decision to include proprietary datasets. In such cases, using freely available data may appear logical, however, in some instances the use of open source data can actually result in higher costs internally than would be associated with using well calibrated and regulated proprietary sources. This can be due to the open sources which are available being incomplete, inconsistent, or error-bound. The ma-jority of open source datasets identified, for the case study region, are provided by public sector organisations, given this a question arises as to the potential future role of the public sector in imposing uniform data standards, and undertaking quality assurance of the datasets made available. This could potentially generate possibilities for more wide-spread assessments of resilience. Nevertheless, despite the concerns highlighted, an ever-increasing number of data sources are now being made available to the public at no cost; this alone can prove a decisive factor allowing evidence-based resilience assessments to be undertaken.
A.G. Rumson et al.

Ocean and Coastal Management 185 (2020) 105004
8
6.4. Emerging data sources
The emergence of a new generation of unconventional data sources is another pertinent issue. In addition to data made available via open source portals or by proprietary vendors, data is now frequently ac-quired through mining, or scraping websites, for example, using hash-tags or geotags (de Bruijn et al., 2018; Li et al., 2018). These processes can allow important information to be derived from social media data, for example (Fig. 5). More dynamic sources of data can also take the form of web feeds, this can be the case for real-time ocean sensor data, and other (real-time) environmental monitoring outputs. CCTV footage is another useful source, which has been drawn on in assessment of street level damage following coastal hazard events, such as those related to a number of recent consecutive hurricanes, which impacted the southern states of the USA and the Caribbean (Lloyd’s Market As-sociation, 2017). This is pertinent given that many resilience studies focus on such hazard events (Burton, 2015; Karamouz and Zahmatkesh, 2017; Kim et al., 2014; Lam et al., 2015).
Vulnerability arises as a consequence of what is sited in a hazard prone area, yet land use and land cover changes are frequent and continuous. Given this, images supplied regularly from earth observa-tion (EO) satellites, can prove invaluable in revealing changes in near real-time, contributing to dynamic, accurate assessment of exposure. Associated analytical techniques such as image segmentation and object recognition can also serve to automate and speed up this process. A range of EO data outputs are commonly used in flood detection, map-ping and impact assessments (Ellison et al., 2017; Jongman et al., 2015; Lavender et al., 2016). In addition to these sources, IoT sensors are capable of generating data in near real-time, such as river gauge data (Koduru et al., 2018; SmartBay, 2017). Information relating to human movements and traffic flows can also be extracted from archives of mobile phone location-based service data (ONS, 2016; Ratti et al., 2006), and many applications are emerging for crowd sourced data, which are relevant to assessment of risk and resilience (Loftis et al., 2018). The high velocity of the data which can be obtained from a number of these sources, can act as driving factors, allowing resilience assessments to transgress the limitations of a static exercise, to form instead dynamic representations of the ever-changing situations on the ground. Crucial to this, is confidence in data source reliability and data quality. As such, a requirement exists for comprehensive metadata list-ings for each dataset, providing assurances over data veracity. More-over, if such information is lacking, undocumented data sources should be discounted. Given the rapid emergence of so many novel data sour-ces, which are being utilised in an uncommon manner, a requirement for national standards and guidance on the use of such data has arisen. If addressed, this could work to increase confidence and raise awareness of the possibilities presented by these new sources of information.
6.5. Data derived through analytical methods
6.5.1. Big Data A number of issues relating to data volume, variety, velocity and
veracity, have been mentioned, these terms characterise the 4Vs of Big Data (Jagadish, 2015). The field of Big Data has been shown to be relevant to assessment of risk in coastal areas (Pollard et al., 2018; Rumson et al., 2017) and to the assessment of resilience (Bellini et al., 2016; Jovanovic et al., 2016; Papadopoulos et al., 2017). The notion of drawing from high volumes and varieties of data, available from archive and streaming sources, is central to data-driven assessments of resil-ience. The extensive number and diversity of metrics, which we have highlighted as applicable to coastal resilience assessments, is indicative of the high variety of data types and sources required. These can involve large volumes of data, especially if high density, attribute rich datasets are included within assessments, and where assessments are completed over large spatial scales. To permit completion of dynamic assessments, requires inclusion of both archive and streaming data sources. We have
discussed a range of data sources which should be considered within a resilience assessment, and now consider a number of advanced analyt-ical methods and processing technologies which can allow data to be combined, and to generate higher level derived outputs (which, in relation to this study, could potentially be drawn on when addressing the 39 metrics listed as requiring derived data inputs).
6.5.2. Advanced analysis The application of advanced analytical processes holds the potential
to allow unconventional data sources to be utilised, this can involve graph, text and time series analytics. Natural Language Processing (NLP), for example, can be used to derive meaning from unstructured and messy data, and for argument or location extraction (Gritta et al., 2018). Application of automated machine learning processes, and Artificial Neural Networks (ANNs) can allow: pattern discovery, feature detection, classification of land use/land cover, and change detection (Bezuglov et al., 2016; Chang et al., 2018; Joseph and Kakade, 2014; Pijanowski et al., 2014). Computer vision is another emerging method, which has been applied to video/image analysis to detect extents of damage post flood event (Wang, 2018). Application of such processes can potentially generate updates on disaster events in real-time. Furthermore advanced techniques, coupled with Big Data, have been shown suitable to coastal emergency incident response (Qadir et al., 2016). This indicates potential scope for using such methods to supply a number of the inputs required to assess the metrics outlined in Stage 6 of the framework (Fig. 2), relating to hazard event responses.
6.5.3. Agent based models Agent-Based Models (ABMs) allow consideration of phenomena
resulting from interactions between individual agents, with prescribed behavioural rules, in an evolving, shared spatial environment. This provides a bottom-up approach for understanding dynamic interactions in complex systems (Surminski and Oramas-Dorta, 2014), and feedback loops between humans and the environment. Outputs from ABMs can be used to add a layer of realism to assessments which have previously been based on static parameters. ABMs can achieve this through revealing hidden drivers that can alter outcomes, and in doing so uncover how human behaviour develops and evolves over time (both in the short and long term). ABMs can reveal how predictable human responses to situ-ations and information alters behaviour in ways that affect vulnerability and resilience. For example, ABMs have been used to reveal how exposure to flood events has resulted in more risk averse behaviour, which can take the form of implementation of mitigating measures and agents moving to less vulnerable locations (Han and Peng, 2019; Crick et al., 2018; Dawson et al., 2011; Dubbelboer et al., 2017; Haer et al., 2017; Jenkins et al., 2017; Yang et al., 2018). ABMs have also been reported a useful tool for ‘simulating the effects of different adaptation options on reducing vulnerability’ as they allow representation of dy-namic changes in climate, and of the adaptive processes of different groups (Acosta-Michlik and Espaldon, 2008). Factors such as these need to be (but in the past have not been) considered so as to ensure resilience analysis is representative.
The emergence of increasingly advanced ABM modelling processes focusing on human behaviour, can accommodate diverse ‘Big Data’ in-puts, representing a range of phenomena relating to environmental conditions and the human world. For example, mined social media data have recently been shown to form a valuable input to ABM processes. Du et al. (2017) demonstrate this in their model of individual flood evac-uation behaviour, in which they focus on transport networks. Outputs of such analysis could prove useful for revealing flood-related infrastruc-ture stresses and disruptions impacting supply chains. Analytical out-puts generated through ABM processes could form useful inputs to resilience assessments, also covering the wider consequences of infra-structure failures, for example, those related to roads, power stations, water supply, and port facilities (Kunreuther et al., 2016). In respect to this, a single flood event can potentially generate a multitude of
A.G. Rumson et al.

Ocean and Coastal Management 185 (2020) 105004
9
secondary impacts, such as disruptions to business, supply chains, and utilities failures. ABMs have been used for modelling such failures, and predicting the resulting duration of power outages (Walsh et al., 2018).
6.5.4. Impact analysis Quantification of physical change to coastal landforms can now be
undertaken more accurately due to advances in data collection and processing methods (Williams et al., 2018). This provides valuable in-puts to the estimation of physical impacts, such as geomorphological volumetric change of cliffs, beaches and nearshore areas. This has been required in resilience studies such as that undertaken by Ellison et al. (2017), and is crucial in the region of East Anglia where high rates of coastal erosion have been experienced (Nicholls et al., 2015). A range of techniques are available, which vary in complexity and data re-quirements (Rumson et al., 2019). Analysis conducted using data collected from Lidar (Caroti et al., 2018) and multibeam echo sounders (MBES), allows change estimates to be generated through surface cre-ation and comparison (Pollard et al., 2019; Williams, 2012). Alterna-tively, if high resolution scanning data is available, point cloud level change analysis can be completed, utilising advanced functionality (Lague et al., 2013) and automated processes (Kromer et al., 2017). Outputs generated from such analysis, can allow evidence-based as-sessments to be made of linear and volumetric change resulting from the propagation of coastal hazards (Fig. 4). Morphological change can also be derived from analysis of EO data; application of interferometric techniques, for example, can allow subsidence monitoring (Ramieri et al., 2011). The use of EO data also allows more general change analysis to be undertaken, allowing wider impacts from a hazard event to be revealed, such as flood extents/depths, and damage to infra-structure and property (Grason, 2018; Geller, 2017). Satellites have even been tasked to acquire images of flooded areas based on automated interpretation of social media data (Cervone et al., 2016). In respect of this, and of other opportunities presented by EO data, it could be pru-dent for coastal management organisations to complete a cost benefit analysis in relation to the use of EO datasets, as the cost of high-resolution EO data may be substantially offset by the reductions in economic losses on the ground made possible through having the ability to complete granular, up-to-date analyses. Furthermore, a range of op-tions now exist for obtaining EO data. Medium resolution data collected by miniaturised satellites can be obtained at a relatively low cost, whilst multiple possibilities exist for acquiring higher resolution imagery for specific locations, through tasking satellites (Rumson and Hallett, 2019).
6.5.5. Analysis of social media data The range of analytical methods making use of social media data is
expanding. A number of recent studies have focused on how these ad-vances can be applied to flooding (de Bruijn et al., 2018; Jongman et al., 2015; Smith et al., 2017; Wang et al., 2018). For example, techniques such as geoparsing have proved powerful in extraction of location data from flood/disaster related Tweets (de Bruijn et al., 2018). Twitter data has also been drawn on to determine flood extents (Li et al., 2018; Panteras and Cervone, 2018). Supply chain resilience and systemic risk modelling, is another area in which social media data has been applied (Papadopoulos et al., 2017). Within the metrics listed in Appendix B, a number of inputs are detailed as potentially being derived from analysis of social media data, these include tourism hotspot identification and traffic activity (Li et al., 2016), and flood extents (Fig. 5).
6.5.6. Scale dependent data requirements When planning a coastal resilience assessment, scale is an important
consideration. Depending on the scale of analysis (household/local/ regional/national), separate data sources may need to be drawn upon. This is apparent when contemplating the use of terrain data (Fig. 4). Localised analysis of granular cliff face deformations requires the use of high-resolution point cloud data, such as that acquired using Terrestrial
Laser Scanning (TLS) systems, whilst for analysis concerned with linear cliff retreat over a wider scale (multiple kilometres), data obtained through aerial Lidar surveys may be more appropriate (Young, 2018). This can also be the case for analysis using aerial photography or EO data. If granular details are required for damage assessments at a building level, then the high spatial and temporal resolutions provided by commercial EO data suppliers, such as DigitalGlobe (2017), may be required. Whilst for assessment of land use change at a smaller scale, open source EO data such as that available from Copernicus (2019) may be adequate.
Many of the variables relating to the metrics selected, are scale dependent. As a result, the availability of datasets at the required res-olution may place limitations on the scale at which an assessment can be undertaken. For example, the UK Office for National Statistic (ONS) hold many statistical datasets which are only decomposed by region, city or ward (Fig. 3). This precludes assessments to be undertaken at a sub- regional/city/ward level. When considering scale, it is also important to highlight how caution needs to be exercised when utilising aggre-gated land use data; past examples have revealed how this can prove unrepresentative (Jongman et al., 2012).
6.5.7. Data utilisation opportunities and constraints Technical expertise is required for analysis of social media feeds,
implementation of ABM processes, geomorphological change detection, EO data centred techniques, and application of the range of machine learning, NLP and ANN methods available. This short discussion of analytical techniques has highlighted methods which could potentially be drawn on within coastal resilience assessments, but so far it hasn’t covered the feasibility of these methods being utilised within assess-ments completed by coastal practitioners. It is likely that those organi-sations seeking to undertake resilience assessments may not hold the necessary technical skills to undertake such complex analyses, nor may they have adequate budgetary means to allow outsourcing of this analysis to external suppliers. This highlights the wider issue of increasing demands being placed on organisations, due to the rapid progression towards data-driven decision-making. Nevertheless, it has been revealed that techniques and methods do exist which can allow data to be generated, potentially providing answers to questions, which in the past could only be answered through more subjective expert in-puts. This marks an important progression, as expert opinion has pre-viously proven an inadequate method for capturing the dynamic nature of many coastal risks (Rumson and Hallett, 2019). Therefore, adoption of innovative data-driven methods within coastal management decision making practices should be prioritised, as they could prove cost-effective, allowing resources to be allocated more appropriately, so enabling more effective spatial planning.
7. Resilience assessment method
Once data inputs have been acquired, satisfying the requirements of the metrics selected for a resilience assessment, the data variables must be combined and analysed to expose the spatially variable levels of resilience. The studies reviewed as part of the QSR (Appendix A) employed a range of different analytical methods. These included probabilistic approaches, drawing on Bayesian techniques (Cai et al., 2018a; Schultz and Smith, 2016), and Copulas analysis (Joyce et al., 2018). Many drew on ‘composite indicator’ methods and ‘multi--variate/multi-criteria analyses (Abenayake et al., 2018a; Burton, 2015; Cai et al., 2018a,b, Lam et al., 2018; Hung et al., 2018; Joyce et al., 2018; Karamouz and Zahmatkesh, 2017). Geospatial analysis, using Geographical Information Systems (GIS), was the most common method utilised, and 9 of the 29 studies listed in Appendix A, incorporated this approach. An extensive evaluation of the various analytical methods available is beyond the scope of this current study; however, through consideration of the data types associated with the metrics we have compiled, and of the requirements detailed by CPE (Section 2), the
A.G. Rumson et al.

Ocean and Coastal Management 185 (2020) 105004
10
authors deem geospatial, GIS-based analysis the most suitable option for collation and analyses of the various metric datasets, and also a suitable medium for presentation of the results to stakeholders.
Most of the selected metrics are linked to data which can be spatially referenced, and many of the inputs required for a resilience assessment are frequently supplied as GIS datasets (Allen et al., 2018; Lam et al., 2015). Given this, it would be possible to represent individual metric variables as spatial attributes in vector datasets (shapefiles) or as raster layers. This would permit further geospatial analyses (Fekete et al., 2017; Lam et al., 2015), which could be used to: identify land use, natural habitats, terrain, land heights, water levels, the distribution of assets and resources, and many other features. Spatial analysis could be used to reveal vulnerable areas and populations which are unprepared (Lam et al., 2015; Szewra�nski et al., 2018). Also, the proximity of businesses, populations, and infrastructure, to hazards, emergency re-sources, and many other factors, could easily be determined (Hung et al., 2016; Johnson and McLean, 2008). This analysis could be undertaken manually through comparison of GIS layers, or through the automated application of spatial analysis tools.
Many of the resilience assessment methods highlighted within the QSR literature, rely on expert weighting of indicators (Abenayake et al., 2018a; Karamouz and Zahmatkesh, 2017), generating an index linked multi-criteria score. This is an inherently subjective process, not neces-sarily representative of the diverse range of interrelated factors requiring consideration. However, it could potentially be avoided through the application of a range of geospatial analytical techniques. Communication of resilience is also challenging, and the outputs generated by some purely statistical techniques, can be difficult to un-derstand and can oversimplify complex processes. GIS tools are capable of generating a diverse range of geostatistical output, which have been shown to engage coastal stakeholders (Allen et al., 2018; Hung et al., 2016; Wadey et al., 2015). These can prove particularly suited to communicating the outputs of a resilience assessment, and can be used to generate simulations of future scenarios (Allen et al., 2018). Furthermore, resilience related outputs, generated through GIS analysis, can be simplified and supplied to practitioners via configurable user interfaces, potentially accessed using web-mapping interfaces (Kar-avokiros et al., 2016).
8. Discussion
8.1. Operationalising the coastal resilience evidence base: Coastal Partnership East
This work has sought to reveal how the wide range of data sources and information outputs, derived through analytical processes, can be drawn on to address the multitude of factors requiring consideration when undertaking a coastal resilience assessment. In doing so, an extensive listing of assessment metrics has been compiled. This also addresses the issue of a lack of definitive metrics being agreed on for measuring coastal resilience (Burton, 2015; Cai et al., 2018a). The case study approach adopted has facilitated an evaluation of how resilience assessment metrics can be selected and grouped, and how data sources can be identified addressing these metrics. The work has addressed a previously acknowledged requirement to incorporate empirical evi-dence within coastal resilience assessments (Cai et al., 2018a), and to embrace a dynamic approach to such assessments (Cai et al., 2018a; Cutter and Derakhshan, 2018; Lloyd et al., 2013; Martinez et al., 2017; Song et al., 2018). In Sections 5 and 4.2, we discussed metric selection, data sources, and data analytics. This section focuses on how the evi-dence base identified for East Anglia could be utilised. In doing so, we refer back to the set of stakeholder requirements provided by CPE (Section 2), and evaluate how these could be addressed using the approach discussed in this study. The approach taken has sought to address the pressing issue of inadequate information flows between scientists, policy makers and practitioners (O’Mahony et al., 2015),
which can impair decision making by coastal practitioners. This has been acknowledged as a problem by those operating in the case study region of East Anglia. However, in addressing this issue we haven’t constrained our scope to East Anglia, and as such we have sought to provide an indication of the relevance of the approach to other areas, countries and to varying scales of application. In the following sections we discuss how the practitioner requirements outlined in Fig. 1 could be addressed using the metrics, framework, and data sources presented.
8.1.1. Practitioner requirement 1: review and incorporate data for SMP CCMAs within an assessment to identify and aggregate what is at risk over the next 100 years (given current SMP predictions)
In addressing this requirement, essentially data depicting SMP pre-dictions for the assessment area are required (metric #19) in addition to the spatial extents of the CCMAs. Following this a range of exposure data would need to be included, representing coastal populations, property, infrastructure, businesses, and local amenitites (similar analysis docu-mented in a recent study drew on the EA’s National Receptor Database and OS Mastermap datasets (Committee on Climate Change UK, 2018)). Given the need to predict vulnerability, planning information would also need to be included, along with information detailing any restrictions on land use or preservation orders. Hazardous areas sited within projected erosion zones would need to be identified, such as landfill, or other waste sites, along with any critical infrastructure. Metrics covering these information requirements are listed in Appendix B, with the majority of relevant metrics contained within Stages 1–3.
Evaluation of this requirement using empirical sources, could also result in questioning its basis. The governance regime’s requirement for using 20, 50 and 100 year time periods as an indicator of flood and erosion hazards may need to be revisited based on data revealing the extents of recent impacts. Climate change is resulting in an increased probability of extreme events occuring at more frequent intervals, and current erosion prediction methods have been associated with high levels of uncertainty (Committee on Climate Change UK, 2018). As such, the basis of predictions of change may need to alter. This could result in more immediate requirements to take action. In line with this, design criteria for critical coastal facilities may require modification, in addi-tion to expectations of the lifespan of buildings located in exposed areas.
8.1.2. Practitioner requirement 2: incorporation of outputs of the most appropriate and advanced methods for measuring and reporting on coastal change
This requirement was interpreted to represent multiple types of change (not just physical), including: geomorphological change (Fig. 4), land use change, loss/gain in natural capital and species, change in the adaptation measures implemented, socio-economic changes (population densities and distribution), change in economic activity and industry, land/house valuation changes, and change in recorded human behav-iour. Again, indicators addressing all these factors are contained within the metric listing. Metrics addressing the majority of such changes can be found within Stage 5, Impacts. However, other appropriate metrics are also found in Stages 3 and 4.1, such as socio-economic indicators, and the presence of structural and natural adaptation measures. EO data could prove especially useful in identifying physical changes relating to land use and land cover, however the resolution required to monitor more granular changes, may not be obtainable from open sources, so commercial EO data suppliers may need to be used. Solutions addressing this practitioner requirement would directly benefit from the increasing volumes of data now available, allowing analyses to be completed across a wider range of scales, than would be possible if only human input was relied upon.
8.1.3. Practitioner requirement 3: evaluate how prepared local authorities and communities are to respond to/recover from future coastal change and high intensity hazard events
In answering this requirement, the metrics listed in Stages 4.2 and 6
A.G. Rumson et al.

Ocean and Coastal Management 185 (2020) 105004
11
would need to be analysed. It is unlikely that this requirement could be fulfilled for East Anglia, based only on currently available datasets or analytical outputs (as described in Section 4.2.5). Input would need to be sought from stakeholder organisations, especially local authorities and other community level organisations. Given this, it is envisaged that it would prove time consuming to address this requirement and the re-sults obtained could be more subjective.
8.1.4. Practitioner requirement 4: identification of contingencies in place and adaptations
This could be tackled through analysis of the metrics contained in Stage 4. A broad range of measures would need to be considered in addressing this requirement: household level mitigation measures, hard and soft adaptations, ecosystem services, non-structural adaptation such as insurance, and a broad range of the contingency measures outlined in Stage 4.2. CPE is primarily concerned with the eroding coast. Given this, the metrics selected should be erosion specific, i.e. covering engineered sea defences, soft adaptations (beach nourishment/sandscaping), and contingencies such as resettlement sites, rather than those more specific to flooding, i.e. drainage. There are fewer measures documented within the metrics listed, offering preparation and contingencies against erosion. This is due to impacts from erosion offering fewer options for recovery, with assets and infrastructure generally being permanently destroyed. However, flooding impacts can be temporary, with more options presented to enable systems to resume operation.
In addressing both the third and fourth practitioner requirements, an alternative approach is to draw on the notion of adaptive capacity (Gallopín, 2006; Smit and Wandel, 2006). This places emphasis on the ecological definition of resilience (Holling, 1973), which centres on systems shifting between stable states. This is particularly suited to consideration of resilience in areas prone to erosion, where the status quo cannot be maintained. In assessing resilience based on adaptive capacity, metrics need to be drawn upon which are able to represent the capabilities of a coastal community to assume some form of functioning order, in the absence of options to return to a prior state following disturbance by a hazard event. To allow this, a complex range of mea-sures need to be in place, these must extend beyond planned or spon-taneous adaptations, such as sea defences or flood barriers, which aim to resist environmental change (Cooper and Pile, 2014). Metrics contained within Stages 4 and 6 are representative of some of the factors requiring consideration. These can relate to spatial planning, i.e. siting of gov-ernment offices, emergency services and critical infrastructure outside of hazard zones. Appropriate regulation and governance measures being in place, preventing maladaptive and unsustainable practices, and enforcing appropriate building codes. Long term measures such as preservation of wetlands and natural capital also factor into this, alongside installation and maintenance of sustainable infrastructure. Understanding the presence of societal capacity is also crucial, such as the presence of networks, groups and plans for coordination of the public. Public awareness of the proximity, probability, and magnitude of the hazards and potential impacts, also needs to be considered. In-dicators revealing past and projected responses to hazard events could also be included. Grouping metrics representing these diverse factors, within a single assessment, could prove instrumental in revealing the long-term resilience levels of vulnerable coastal communities. The re-sults of assessments, based on such metrics, could enable district level bodies such as CPE to greatly improve their adaptive capacity. It would also be beneficial to complete such assessments on a regular basis, allowing governance institutions and the public to track progress. Pos-itive results, from these routine assessments, could further act as an incentive or driver for economic development.
Within this study a limited amount of time was devoted to estab-lishing metrics which could prove relevant to a resilience assessment focusing on adaptive capacity. Given this, scope exists to refine these metrics further and to identify other, potentially more important, met-rics, which could allow forward planning in the face of potential chronic
or acute hazard damages. Evidence-based assessment of adaptive ca-pacity is crucial given the widespread policy resistance to adaptation (McGuire, 2018).
8.1.5. Practitioner requirement 5: enable sustainable planning leading to resilient outcomes
This is a comprehensive objective and necessitates consideration of metrics from all stages of the assessment framework (Fig. 2 and Table 1). The objective was interpreted as involving multiple aspects of planning, including spatial planning, therefore geospatial analysis, involving a GIS-based resilience assessment (as outlined in Section 4.3), is particu-larly suitable. Metrics which are especially relevant to this requirement are associated within Stage-4 of the framework, especially those detailed under the heading ‘planning’. Sustainable planning necessitates that all potential hazard sources and threats be considered. Given this, metrics covering hazards and environmental conditions (Stage 1) are relevant. A thorough appraisal is required of the role played by natural capital. This can potentially prevent approval of unsustainable future developments, which may result in destruction of natural systems and loss of ecosystem services. The role of structural adaptations would also need accounting for, especially their impact on natural systems, such as sediment budget distortion. Sustainable (whole shoreline) responses to erosion threats can be contentious and difficult to implement (Nicholls et al., 2015), metrics would need to be included revealing who and what would be exposed if proposed strategies were adopted. There can be options to repair flood damaged properties, so metrics related to insurance should be included, as appropriate cover could increase the resilience of those living in areas prone to flooding. Insurance covering erosion is not currently available, therefore alternative financial measures associated with erosion impacts, such as support for rollback schemes (Defra, 2012), should also be accounted for. Metrics detailing socio-economic and demographic factors should be included, as planners need to know what socio, cultural and economic gain future adaptations, miti-gations and planning options may generate. This could relate to trans-port links, population densities, income and dependency levels, potential options for regeneration, employment levels and business activity.
8.2. Wider application
Coastal flooding and erosion are global hazards, therefore the coastal management requirements addressed above, which were specific to East Anglia, are taken to be representative of the wider issues experienced in coastal regions globally. One potential key difference, in terms of assessment of resilience, is that data availability may be more limited for coastal areas in many other regions and countries. Therefore, this may result in a much higher number of metrics which cannot be satisfied using empirical data. However, alternative measures could be looked to in overcoming a lack of available datasets. For example, it may be possible to derive outputs through proxy measures or analytical methods, such as those highlighted in Section 4.2.5. This could act as a substitute for many of the preconfigured data sources listed in Appendix C. EO derived datasets have been recognised as providing such an alternative for analysis undertaken in developing countries where data sources are lacking, especially in relation to flooding (Ekeu-wei and Blackburn, 2018; OECD, 2016). The literature reviewed as part of the QSR (Appendix A), documented coastal resilience assessments under-taken in many different parts of the world, in varying contexts. The resilience assessment metrics listed in Appendix B were derived from these studies. Therefore, the methodology outlined in this current study, is representative of varying contextual factors, found in coastal regions across the world.
A.G. Rumson et al.

Ocean and Coastal Management 185 (2020) 105004
12
8.3. Novelty and limitations of the coastal resilience assessment framework, metrics, and evidence base approach
In summarising the approach adopted within this study, for selection of resilience assessment metrics and associated data sources, we have highlighted novel aspects which we believe contribute to the current academic discourse associated with this field. We have also highlighted a number of limitations of the approach employed within this paper. These are detailed in Table 2.
9. Conclusions
The ability to understand, assess, and monitor resilience is essential for decision makers tasked with management of coastal regions. In providing the capacity for such, it is possible to build on standard coastal risk assessment frameworks, which have focused on hazards and
vulnerabilities, and anthropogenic and ecological exposure. However, whilst risk assessments tend to limit their evaluation of hazard responses to a focus on physical adaptation mechanisms, an assessment of resil-ience must also account for more incident specific details, such as re-covery times, and the broad range of preparations and contingencies which have been implemented. As such, it is crucial for assessments to account for measures which minimise disruption, whilst maximising the ability of coastal systems (ecological, economic, infrastructure, and community) to continue to function following a hazard event. The concept of resilience is wide, assessment of resilience therefore requires a multifaceted approach, involving consideration of a range of holistic data and information sources. This paper has focused on the evidence base available for assessment of coastal resilience and the specific in-dicator metrics which should be included within a holistic assessment. Many previous examples of coastal resilience assessments have relied heavily on human, opinion-based, input (Abenayake et al., 2018a; Bostick et al., 2017; Keating et al., 2017). Reliance on such, can prove time consuming and subjective. In an attempt to address these issues, this work has sought to identify metrics which can be assessed using empirical evidence. Accordingly, a case study approach was adopted, and the region of East Anglia (UK) was focused on.
Through review of past studies covering coastal resilience, an extensive range of indicator metrics were selected. For each metric an indication has been provided of data sources, specific to the case study region, from which input variables could be obtained. It was not found possible to fulfil the input requirements of all metrics listed in Appendix B, through drawing on available preconfigured data sources. However, it was considered possible to satisfy the requirements of 75% of the proposed metrics, through utilisation of empirical sources. Some 16% of these metrics would require outputs derived through analytical processes, to satisfy their requirements. A clear divide was observed between levels of data available for the metrics associated with tradi-tional risk assessments (i.e. those related to hazard source, pathway, receptor, and consequence) and the metrics more unique to resilience assessment (representing hazard event response, recovery, preparations and contingencies). This revealed that, irrespective of data availability, assessment of resilience is inherently more subjective than assessment of risk. However, this study revealed how the number of metrics within a resilience assessment requiring such subjective inputs can be minimised.
Combining novel data sources, such as crowd sourced and EO data, can improve our ability to account for ecosystem services, land use change, impacts from hazard events, and system recovery. There are caveats associated with using information derived through such tech-niques, these include requirements for technical skills, time, and the ability to establish the veracity of data sources. The example data sources highlighted within this study, for the case study region of East Anglia (Appendix C), include both freely available and proprietary data sources. When planning a resilience assessment, it is necessary to consider the relative benefits of both open source and proprietary data. Time constraints, budget, and the internal capacity of the organisation seeking to undertake the resilience assessment, are all factors influ-encing the type of data sources used.
An extensive listing of metrics is provided in Appendix B, however, it is not intended that all of these metrics be utilised within a single resilience assessment. Separate indicators should be selected depending on the scale at which an assessment is undertaken (local/regional/na-tional), the type of area focussed on (rural/urban/mixed), and the spe-cific form of resilience considered (long-term/short-term/disaster). Grouping appropriate metrics, from those proposed, can provide the opportunity to track progress in the resilience of a coastal region or district. This could expose ineffective planning and hazard responses,
Table 2 Novelty and limitations of this research.
Contributions of the data-centric approach to the field of coastal resilience
1 An original approach was taken in grouping such an extensive range of indictor variables based on a simple resilience assessment framework (Fig. 2); consideration of the disparate data variables, highlighted as pertinent to coastal resilience, can aid identification of relationships between factors not obviously connected.
2 The approach presented within this study can form a basis for development of further, more refined, context specific, coastal resilience assessments.
3 The framework and metrics (Fig. 2 and Table 1) are founded on input parameters used in assessment of resilience in multiple contexts (as documented in previous research (Appendix A)), so are internationally representative.
4 The data-driven approach we advocate provides a means of operationalising the concept of resilience within coastal management for multiple settings.
5 Through revealing how existing datasets can be drawn on within resilience assessments, we present options for expanding awareness of the evidence base available to coastal management practitioners.
6 Derived data output from advanced analytical processes (Section 4.2.5) are shown to be capable of displacing more subjective methods used for obtaining the required inputs to resilience assessments.
7 Our data-centric approach builds on progress made in assessing coastal risk (especially in relation to the SPRC scheme), incorporating this within assessment of resilience.
8 A number of the data sources outlined and discussed are available as near real- time feeds, this potentially provides a means to allow dynamic assessment of resilience.
LIMITATIONS OF THIS RESEARCH 1 To date, the approach presented within this research lacks practical validation
within a complete resilience assessment. 2 The data source evaluation completed in this study was limited to one country
and region. 3 Due to the high number of metrics (Appendix B) and data sources (Appendix C),
only a limited review was undertaken of the suitability of the data sources outlined, for each metric they were associated with.
4 If the datasets and the associated variables, which are listed in Appendix C, were to be used within a resilience assessment, additional scrutiny of metadata, data consistency, validity and veracity, would need to be undertaken.
5 The number of metrics listed in Appendix B, could prove overwhelming, and may require significant levels of scrutiny to determine which are most suitable to any given context.
6 A hierarchy has been established (Table 1) to aid collation of factors represented by the selected metrics (Appendix B); some degree of flexibility exists in the categories assigned within this. The process of sorting the metrics into stages and sub-categories was inherently subjective.
7 This study has identified a list of metrics suited to assessment of coastal resilience, and revealed how these could be applied, however it has not discussed benchmarks related to the variables assessed within the metrics. Such benchmarks could prove important for charting progress.
8 The price tag associated with data sources required for evaluation of a number of the metrics may prove prohibitive for their utilisation within assessments completed by public sector/academic organisations.
A.G. Rumson et al.

Ocean and Coastal Management 185 (2020) 105004
13
and a lack of adaptive capacity, and holds the potential to improve future coastal management policy responses. Selection of appropriate indicator metrics forms only one part of a resilience assessment. How-ever, the variables considered are of crucial importance to later stages, involving analysis and communication of results. Application of the primarily data-driven mode of resilience analysis we suggest would require technical skills and an understanding of the input datasets. Stakeholder organisations, such as CPE, may not possess this. However, the main objective of this study was not to evaluate or propose a single method of resilience assessment, but to establish a set of metrics, and data sources suitable for inclusion within a data-driven coastal resilience assessment. In addressing this objective, we have presented options permitting emerging sources of data and analytics to be drawn on within a structured, holistic assessment of coastal resilience. Through careful selection of metrics that cover ecological, economic, and social aspects of resilience, this data-centric approach could assist coastal practitioners in achieving sustainable, resilient outcomes.
Declaration of competing interest
The work is original; accurate according to the best knowledge of the authors; does not include copyrighted materials; and is not submitted to
other journals for publication. All authors declare that we have no sig-nificant competing financial, professional or personal interests that might have influenced the performance or presentation of the work described in this manuscript.
Acknowledgements
The authors acknowledge the staff of Coastal Partnership East, Great Yarmouth Borough, North Norfolk, Suffolk Coastal and Waveney Dis-trict Councils and, in particular, Bill Parker and Paul Mackie for input and guidance to this work. British Geological Survey, in particular Anna Harrison and Katherine Lee, are acknowledged for their guidance. Timothy Brewer of Cranfield University is also acknowledged for the guidance and support provided. This work was supported by the UK Natural Environment Research Council [NERC Ref: NE/M009009/1], Suffolk Coastal District Council [VGP/00043027], and the British Geological Survey [GA/16S/010].
Data access statement
Data sharing is not applicable to this article as no new data were created in this study.
Appendix A
Quick Scoping Review
A QSR is a type of evidence review that aims to provide an informed conclusion on the volume and characteristics of an evidence base and a synthesis of what that evidence indicates in relation to a question (Collins et al., 2015). The QSR detailed here seeks to collate evidence from academic articles and grey literature, synthesising this in order to address the following questions:
1. What indicator metrics need to be included within a coastal resilience assessment? 2. What methodological approaches have been used to combine such metrics? 3. What data sources have been associated with these metrics?
Initially a wide search was completed of websites and grey literature. From this, a number of non-academic, sources were identified as particularly relevant to coastal resilience. The most prominent among these, and those specifically relevant to the UK and the case study region, are detailed in Table 3; in this some of the most prominent metrics referred to are detailed. Together, these documents provide material detailing the key resilience initiatives currently undertaken within the UK and select studies from further afield. The data sources and frameworks utilised were also detailed. Consideration of these sources contributed to the subsequent selection of assessment metrics and data sources detailed in Appendix B and C.
Table 3 Non-academic literatures sources, with prominent metrics mentioned in these detailed.
# Author and Publication Metrics
1 Defra (2016) National Flood Resilience Review. Flood hazard threat, past frequency of hazard events, flooding from other sources (pluvial, fluvial), extreme rainfall, past storm surge events, climate projections, river and estuarine data, inundation zones, flood risk exposure, key infrastructure at risk -rail, highways, ports, airports-, water supply and treatment, telecommunications, energy, medical facilities, assessment of flood defences, health, temporary defences, incident response, local planning, flood risk communication
2 The Environment Agency’s SMP Plans (Defra, 2006; Environment Agency, 2009);
Past frequency of hazard events, erosion prediction, flood risk exposure, main employers and sectors, land use, natural habitats, maladaptive practices, sediment supply, farming/agriculture, tourism, coastline length, urbanisation, distance from the coastline to major developments, presence/ functioning of coastal defences, natural capital, habitats/specie numbers, recreational use of the coast, port usage, critical infrastructure, highways, rail, assets in flood/erosion zones, funding for resilience measures
3 The Committee on Climate Change UK (2018) report ‘Managing the coast in a changing climate’
Climate change induced hazards, assets located in flood/erosion zones, distance from the coast of developments, predictions of weather and climate patterns, exposed infrastructure, spatial distribution of hazard events, functioning of coastal defences, property level mitigation, insurance coverage/ availability, tidal data, salinization, flood and erosion event casualties, financial impacts of flood and erosion damage, health impacts, housing density, inundation zones, flood hazard threat, principle arterial roads and rail miles in hazard zones, landfill sites, agriculture, population age dependency ratio, natural capital, habitats and species, governance, land use and urban planning, resettlement sites, funding for resilience measures, awareness of local population
4 Twigger-ross et al. (2015), Flood Resilience Community Pathfinder Evaluation
Awareness of local population, population distribution and structure, poverty levels, age dependency ratio, disability ratio, recent immigrants, employment, incomes, insurance coverage/availability, civil society groupings, informal coordination of citizens activities, resettlement sites, volunteer networks,
(continued on next page)
A.G. Rumson et al.

Ocean and Coastal Management 185 (2020) 105004
14
Table 3 (continued )
# Author and Publication Metrics
risk management plans, maintenance of storm sewers, availability of emergency aid, funding for resilience measures, household mitigation measures, exposed infrastructure
5 The National Infrastructure Commission’s (2018) National Infrastructure Assessment
Presence/functioning of coastal defences, inundation zones, natural flood buffers, natural capital, properties flooded, insurance coverage, insured losses, financial impacts of flooding, habitat creation, predictions of weather and climate patterns, exposed infrastructure, population change, assets in flood/ erosion zone, population density, funding for resilience measures, SMP erosion predictions, flooding from other sources, land use planning
6 NOAA Office for Coastal Management (2015) Coastal Community Resilience Indicators and Rating Systems;
Exposed critical infrastructure, critical facilities (i.e. emergency services) in hazard zones, assets in hazard zones, maintenance of adaptations -storm sewers etc, availability of potable water, ecosystems services, natural capital, habitats, impacts on tourism and recreation, business plans and equipment, existence of risk management plans, hazard awareness of local population, capacity of waste water treatment plants, climate change predictions, emergency services readiness, availability of flood maps, flood/erosion education, insurance cover, financial impacts of past events, early warning systems, availability of communication systems, business recovery times, population characteristics, public buildings and infrastructure locations, health impacts, evacuation plans, emergency response plans, stormwater management plans, implementation of building codes, community cohesion/social capital,
7 EPICURO (2018) European Partnership for Innovative Cities within an Urban Resilience Outlook, Best practice analysis.
Spatial planning, population structure, climate and weather predictions, waste water management, solid waste management, energy security, transport exposure, transportation access -port, rail, roads-, electricity outages, availability of resilience funding, effective leadership and management, continuity of critical services, communications reliability, alternative energy sources, building codes implementation, civil society participation, social capital
8 Resilience Alliance (2010) Assessing resilience in Social-Ecological Systems - A workbook for practitioners v.2.0
Ecosystem services, salinization, specie distribution, sediment distribution, climate variables, erosion/ accretion rates, health impacts, job losses related to hazard events, land cover, water quality, social networks, governance systems, incomes, soil type, funding for resilience measures
These reports represent a sample of only a limited body of work currently addressing issues relevant to coastal resilience beyond academia. The main body of information drawn upon in the QSR was sourced from academic journals. Yet due to the limited quantity of literature available, which is focused specifically on assessment of coastal resilience, search terminologies used were extended to include wider hazards and scenarios, such as inland flooding and disaster resilience. The academic literature search was undertaken primarily using Web of Science (https://apps.webofknowledge. com), and SCOPUS (https://www.scopus.com).
Table 4 indicates the original search terms applied and the number of results these generated, in the respective search engines. The search strategy ensured all aspects of the QSR questions were covered. A range of possible subject descriptors for each of the keywords in Table 4 were identified in order to ensure that useful references were not missed. A wildcard (*) was also used where possible to pick up multiple word endings.
Table 4 Keywords used in the literature search (noting ‘and’ qualifiers where considered important to focus search).
Search Terms # Results
Scopus WoS
“coast* resilience” 130 99 “coast* infrastructure*” AND “resilience” 22 16 “coast* area*” AND “Resilience” 268 536 “coast*” AND “resilience assessment” 26 18 “coast*” AND “resilience” AND “data source*” 13 6 “coastal resilience assessment” 1 0 “coast*” AND “flood” and “resilience” AND “assessment*” 125 62 “coast*” AND “flood” AND “resilience” AND “evaluation*” 26 14 “data” AND “resilience assessment*” 72 66 “climate change” AND “resilience assessment*” 46 57 “resilience assessment*” AND “disaster*” 118 82 “information” AND “resilience assessment*” 64 54 “method*” AND “resilience assessment*” AND “coast*” 16 13
The initial web search outputs were screened using the following steps:
1. Initial review of the article titles resulting from the searches based on key words. Where this screening provided material of interest then: 2. The material was screened at abstract/contents page level to determine if the material was of further interest. 3. After passing these two screening stages (and also if any uncertainty remained regarding the material’s value) then articles were consulted in full
to: a Confirm whether or not the document was of relevance to the questions being addressed, b Extract the required evidence.
From the original academic literature search results detailed in Table 4, 73 papers were selected for further review (screening stage-2). Following subsequent analysis of the material covered in these articles, the list of relevant papers was further reduced to the 29 listed in Table 6 (screening stage- 3). Selection of these articles was based principally on their content, covering explicit details of the methods, metrics and datasets used in resilience assessments. Efforts were made to include studies addressing a mix of spatial scales, those applied to both rural and urban settings, and those covering assessments of multiple types of resilience (including: social, economic, infrastructure, community, institutional, environmental, and structural (Burton, 2015)). The search results obtained, indicate an exponential increase in the number of papers published covering aspects of coastal resilience during the last 5 years. Furthermore, the majority of the works selected for further review (stage-2 and -3) were published during the last three years, and studies focusing on the USA represent over a third of those selected. Table 5 provides a summary of the number of works selected, by year
A.G. Rumson et al.

Ocean and Coastal Management 185 (2020) 105004
15
published. No time limit was imposed on the literature searches, yet no relevant works were located which were published earlier than 1998. Evidence extracted from the 29 articles, which passed through the QSR screening process is presented in Table 6.
Table 5 Academic articles reviewed, by year published. Those relating to the second review are listed in Table 6.
Year Number of Articles
First Review Second Review
2019 1 1 2018 31 12 2017 14 8 2016 9 3 2015 3 3 2014 3 1 2013 1 – 2012 1 1 2011 3 – 2010 2 – 2009 1 – 2008 1 – 2003 1 – 2001 1 – 1998 1 – Total 73 29
Table 6 The 29 most relevant studies identified in QSR, from which metric themes were derived. Details provided only indicate author(s) and year of study, full details of each study are found in the reference section. The table indicates study case study area (if appropriate), type of resilience or hazard focussed on, scale, nature of study, type of method used for resilience assessment, and mentions pertinent issues relating to metrics and data sources used.
# Paper Ref. Location Focus Scale/Area Details Resilience Assessment Method
Metrics and data
A Lam et al. (2018)
Mississippi River Delta
Community disaster resilience
Regional Social, economic, infrastructure, cultural and economic sectors considered.
Resilience Inference Measurement (RIM). ABM, Cellular Automata (CA)
2 main indicators: Coast hazard events -property damage; recovery- population change
B Cai et al., 2018b
Mississippi River Delta
Community resilience.
Regional, Urban and rural.
Variable identification –Population change an indicator. Complex assessment.
Bayesian Network Model: EM method –conditional probability, JT algorithm –posterior probabilities
Variables identified as important: Threat level to coastal hazards; hazard damage; employment rate; distance to coastline; % houses built before 1970; % HH containing females
C Song et al. (2018)
Busan, Republic of Korea.
Flooding damage and Socio- ecological resilience.
Urban Green Infrastructure. Quantitative results generated in study. System resilience ¼ system performance x cumulative value. Causal loop diagrams used.
System Resilience Dynamic Model (SRDM), 4 R model Simulation with spatial modeller in ArcGIS
Presence of impervious surfaces highlighted as important.
D Abenayake et al. (2018b)
Colombo Sri Lanka. Multi district
Community resilience Floods
Urban/ rural
Validation of geospatial indicators.
System Performance based method
Resilience capacities identified: transform, absorb, and recover. Metrics represents all 3 capacities. 16 indicators found to be pertinent.
E Joyce et al. (2018)
Florida, USA Flooding and engineering resilience
Mainly Urban, local scale
Drainage infrastructure. Look at physical adaptation measures. Resilience ¼ recovery time reduction. Exposure determined by adaptive measures
Multi-criteria method incorporating Copulas Analysis
Careful formulation of metrics around common vulnerability criteria. Hazard variables: wave, pressure, wind, rainfall, tides. Adaptive measure criteria outlined.
F Cutter & Derakhshan (2018)
Entire USA Community Disaster Resilience assessment
Urban/ rural National level
Cascading effect analysis flowchart. 3D visualisation. Basis of long terms spatial or development planning and emergency preparedness. Natural hazards.
Baseline Resilience Index for Communities (BRIC) (Cutter et al., 2014)
6 resilience categories represented: social, economic, environmental, housing/ infrastructure, community capital, institutional. Data sources outlined.
G Hung et al. (2018)
Taiwan. Flood, not total resilience
Household level focus, Communities
Public measures. Behaviour component. Focus on implementation of HH adaptive measures.
Multi-variate analysis. Resilience Framework of Household Autonomous Adaptation to Climate- and Weather- Related
Metrics representing: Risk information; Threat appraisal; Household attributes; Social capacity and participation; Adaptation appraisal; Adaptation actions
(continued on next page)
A.G. Rumson et al.

Ocean and Coastal Management 185 (2020) 105004
16
Table 6 (continued )
# Paper Ref. Location Focus Scale/Area Details Resilience Assessment Method
Metrics and data
Hazard Risks (ROHACHR)
H Ellison et al. (2017)
Tarawa, the republic of Kiribati.
physical shoreline change and ecological resilience
Satellite data used, sediment analysis, and beach surveys.
Spatial analysis using ArcGIS
Metrics including: vegetation condition, topography, spatial change analysis, sediment supply, human impacts
I Karamouz & Zahmatkesh (2017)
New York, Bronx
Flooding Impacts from Superstorm Sandy
Urban, local Identification and ranking of most important factors for increasing system resiliency based on decision makers’ judgements.
Multi-criteria decision making techniques, linear combination of metrics; Algorithm Workflow generated, incorporating ‘4Rs’.
Appropriate metric to enable ranking of factors: economic, social-political, hydrological, physical
J Bostick et al. (2017)
Mobile Bay, Alabama, USA
Disasters indirectly assess resilience, Stakeholder awareness raising
Urban, local Methodology developed addresses the stages of resilience—prepare, absorb, recover, and adapt—and integrates performance assessment with scenario analysis.
Multi-criteria decision analysis (MCDA), scenario-based preference process.
Stakeholder driven process of identifying and ranking factors impacting resilience. Problem: aggregation of data can blur vulnerability.
K Fekete et al. (2017)
Cologne Germany
Critical infrastructure, risk from flooding and blackouts.
Urban Combined vulnerability/ resilience assessment. Spatial and demographic data utilised. Analyse criticality of infrastructure. Not a static assessment.
4 R model; GIS method – inc. network analysis to determine optimal routes.
Use EO data to determine flood extents and Flood exposure maps. Critical infrastructure identified and interdependencies (i.e. Hospitals and fire stations). Criticality of rail, civil protection, electricity blackouts, routing constraints, emergency shelters, exposed population density, evacuation hotspots, use of civil protection authorities.
L Joyce et al. (2017)
Bayou watershed Florida USA
Coastal drainage infrastructure
Urban Watershed
Establishment of quantitative resilience metrics.
Informatics based Multi-scale Modelling; GIS.
Lidar Bathymetry included as data source.
M Schultz & Smith (2016)
New York. Response and recovery of infrastructure system following storms
Data requirements for resilience assessment addressed. Application to coastal management.
Bayesian probabilistic approach
Primary resilience indicator: time to recover system performance. 4 functional performance objectives represented by indicators: life safety, housing, utilities, transportation.
N Abenayake et al. (2018a)
Colombo, Sri Lanka
ecosystem flooding/services, link to community resilience
Not coastal specific, Regional scale
Main focus is physical environment. Aggregating proxy indicators for ecosystems. Expert opinion drawn on for utility scores of land use.
Composite environmental indicators, Weighted linear combination method (WLCM)
Ecosystem services indicators included: flood regulation, climate regulation, nutrient recycling. 4 proxy indicators: soil, hydraulic properties, slope, land use, precipitation factor. Land use parameters: density of land cover, surface roughness of cover, waste assimilation capacity of ecosystem, quantity and toxicity of waste.
O Karavokiros et al. (2016)
Rethymno, Greece
Preparing for Extreme and Rare Events
City level Documents the project outputs from PEARL, online tool developed. User self-quantifiable metrics and determined.
Pearl Flood Resilience Index Tool. Web GIS based collaboration toolbox
Filters-metrics employed in tool: flood problem type; measurement type; spatial scale; land use.
P DasGupta & Shaw (2015)
India (Asian mega deltas).
Community Socio- ecological system.
Developing world. Rural
Framework tool. Focus on development of dimensions, indicators and variables.
Coastal Communities resilience index (Composite resilience index)
Reference given to Indicators used in other studies. Requirement identified to integrate metrics representing: social, ecological, human and natural factors
Q Burton (2015) Mississippi coastal counties USA.
Disaster resilience. Incident specific - Hurricane Katrine
Urban/Rural Assesses the ability of Composite indicators enabling distinction between non-relevant and relevant data.
Multi-variate analysis drawing on composite indicators. GIS used in recovery analysis, and to represent resilience.
Recovery process monitored using repeat photography.
R Kim et al. (2014)
Texas USA. Disaster resilience. Flooding Incident specific Social ecological
Indicators focus Analytical Framework Metrics identified: flood plain area; wetlands; erosion rate; impervious surfaces; biodiversity; taxation and financial incentives;
(continued on next page)
A.G. Rumson et al.

Ocean and Coastal Management 185 (2020) 105004
17
Table 6 (continued )
# Paper Ref. Location Focus Scale/Area Details Resilience Assessment Method
Metrics and data
resilience to Hurricanes.
conservation and restoration of natural systems; Structural and non-structural hazard mitigation (natural capital); Land use planning; local infrastructure and public services; building and structural resilience; identification of resilient infrastructure, drainage; preservation and restoration of ecosystems and ecological infrastructure.
S Menoni et al. (2012)
Sondrio, Italy. Flash floods vulnerability of physical and socio-economic assets and systems
Local. Informs land use planning. Metric based on judgemental selection of aspects.
Resilience assessment matrix: ENSURE Framework
Metrics covering: natural environmental, physical, systemic, social, economic and institutional vulnerability. Lack of data identified. Generic or hazard specific vulnerability indicators used.
T Papadopoulos et al. (2017)
Nepal. supply chain networks Incident specific Nepal earthquake in 2015
Tests a theoretical framework using unstructured data (Tweets, news, Facebook, WordPress, Instagram, Google, and YouTube), and structured data, via responses from disaster relief managers
Big Data Framework Indicators: social media responses to distribution of aid and reconstruction.
U Oladokun et al. (2017)
Not Specified Flood property level Fuzzy logic (FL)-based resilience measuring model
Input factors: inherent resilience, supportive facilities and resident capacity. Property level factors, retrofitting.
V Garvin et al. (2016)
UK Flooding. Insurers structural and building adaptation measures
property level Combine environmental datasets on flood risk with resilience measures –allow insurance industry to account for investment in resilience
Property Flood Resilience Database
Indicators highlighted; geocoding; elevation; land use; rainfall; river geometry; flow rates; tidal data; flood depths; Flood protection work by councils, authorities, property owners (aggregated); retrofitting measures; Logistics; flood plan development, operation; post event barrier removal and cleaning site clearance, waste removal; suitable drainage; flood warning systems; local flood groups and forums, actions initiated in flood events.
W Lam et al. (2015)
Caribbean, 25 countries.
Hurricane Based on indices of three dimensions: exposure, damage, and recovery.
Resilience Inference Measurement (RIM) model. GIS analysis.
Metric indicating: Exposure: Hurricane recurrence; Damage: per capita; Recovery: population growth post event.
X Szewra�nski et al. (2018)
Poland. Environment, Social vulnerability Flood
Identification of areas populated by vulnerable social groups.
Location Intelligence System. GIS analysis.
Metrics including; Household vulnerability due to unemployment; flood hazard maps; age structure of population.
Y Keating et al. (2017)
75 communities across 8 countries
flooding Community level
Framework and tool developed https://floodresilience.net/frmc Comparing pre-flood characteristics, with post flood outcomes. Manual grading of resilience by an assessor
Zurich Alliance community flood resilience measurement framework and tool; 4R and 5C
Derived data used to populate metrics. Assessors assigned to collect data to grade resilience through: HH surveys, Community consultations, key informant interviews, interest group discussions, Third party sources deemed secondary –i.e. census data.
Z Zhang et al. (2019)
Shenzhen China.
Rainfall induced landslide resilience.
Urban Automated method. Data-driven study, weightings derived through analytical techniques. Resilience ratings derived through machine processes not subjectively.
Support Vector Machine (SVM) (physical resilience) & Delphi-analytic hierarchy process
Datasets covering: For physical resilience -meteorology, soil, terrain, slope vegetation cover and land use; for social resilience -socio economic statistics.
(continued on next page)
A.G. Rumson et al.

Ocean and Coastal Management 185 (2020) 105004
18
Table 6 (continued )
# Paper Ref. Location Focus Scale/Area Details Resilience Assessment Method
Metrics and data
(Delphi-AHP) (social resilience).
DEM Landsat data used to assess the capacity of urban physical system against rainstorms, and combined with feedback capacity of the human community when a landslide occurs.
Å Allen et al. (2018)
Carolina, USA. Resilient infrastructure.
Geospatial Simulation, combined with Table top exercises. Debate on scale.
GIS based method; Resilience matrix. Strom surge simulations from SLOSH display system to ArcGIS.
Indictors for human health impacts; damage to water infrastructure: sewage overflow, loss of potable water, health facilities closure, loss of running water. Geospatial data representing water infrastructure assets. Assimilated population and health care provider data for analysis of population susceptibility.
£ Cai et al., 2018a N/A Disaster Multiple Review of disaster resilience assessment methods and metrics, systematic review of 174 articles. Only 10.3% of these included empirical evaluation of indices.
Comparative study. Multi-variate regression most common quantitative method.
Metrics highlighted: income, employment, education, age, previous disaster experience, shelter capacity, social connectivity, municipal capacity, place attachment, transportation access, mitigation, housing capital, medical capacity recovery, civic involvement.
$ van Dongeren et al. (2018)
10 sites in Europe’s regional seas
Disaster Flood
Local, Urban/ Rural
Tools developed in project: Storm impact database, Coastal Risk Assessment Framework, Web-based management guide, Hotspot tool, Multi-Criteria Analysis
Multiple methods: storm impact DB.
Metrics highlighted: wave overtopping, flooding and shoreline erosion, land use, social, transport, utilities and economic activities, flood modelling outputs, flood depth and discharge.
Appendix B
Resilience assessment metrics
Stage 1 Hazard source
# Metric Available from Paper Ref.
General 1 Past frequency of hazard events 3,34,35,36 M,P,Q,Y 2 Climate change induced hazards -Sea-level Rise predictions, increased frequency and magnitude of extreme events 16,33 I,P,W 3 Extreme rainfall 3,30,34 D,N,T,Z,Å 4 Past storm surge events 35,36 Å 5 Rivers, estuaries –waterbody density (waterbody area/total land area), river miles 28,30 D,P 6 Predictions, short- and long-range projections of weather and climate patterns 3,16,33,57,58 N,S,Å 7 Archive climate data 34,13,16,3 N 8 Oceanographic/meteorological sensor networks, records and projections (including real time outputs) 2,3,5,7,10,13,14,27,34 S,W,Z 9 River and estuarine data (river levels, flow rates) 10,19,26,28,30,33,55 O 10 Tidal data 2,4,5,10,14,36 M,Å 11 Water Quality 5,6,7,14,29,30,33,38 P 12 Industrial pollutants (sources and impacts) 1,10,29,33 P 13 Quantity and toxicity of waste (solid waste and water waste) –generation potential by land use 10,12,19 M,N,P
Record of environmental conditions during hazard events 14 Maximum storm surge elevations 36 I 15 Maximum/average flood water levels –inundation depths 10,30,62,64,65 C,I 16 Flood water chemical contaminants 9,10,11,30 Y
Stage 2 Pathway
# Metric Available from Paper Ref.
17 Maladaptation practices and hazards generated through previous installation of protection structures 2,13,17 G,H,P 18 Flood hazard threat (warning zones - predictions), flood maps 10,55,62 I,O,W,Y,Å 19 Erosion prediction - SMP and academic modelling outputs 10,17 B,H,N,P,R,Z 20 Flooding from other sources pluvial/fluvial 3,6,10,30,34,62 O,N,V,X 21 2,10,6,12
(continued on next page)
A.G. Rumson et al.

Ocean and Coastal Management 185 (2020) 105004
19
(continued )
# Metric Available from Paper Ref.
Topography, slope, terrain data derived through laser scanning surveys - point cloud datasets, (Digital Terrain Models (DTMs), Digital Surface Models (DSM))
B,D,E,H,N, W,Z
22 Beach/cliff surveys, transects 2,6,10 H,M 23 Nearshore bathymetry –point cloud, or gridded data 2,4,10,12,14,18,38 Q 24 Sediment supply 2 H 25 Soil map and hydraulic properties 6,9,30,39 D,N,Z 26 Local geology 6,12 N 27 Geological stability, subsidence 6,9,30,39 A 28 Landslide subsidence areas 6 P,Q,T 29 Coastline length 28 I 30 Inundation zones –flood inundation maps (Inundation modelling outputs linked to forecasting and monitoring) 10,17,55 A,B,D,I,O,
Q,Y 31 Contaminant and pollution sources in flood plains 6,9,10,11,30 J,P 32 Flood risk exposure (modelling outputs) 10,17,55,63,64,65 E,I 33 Land cover 13,30,38,67 B,I,N,Q 34 Perviousness of land cover - percent of land areas that does not contain impervious surfaces EO Derived:
13,17,34,38,68,69,70,73,74 C,D,E,F,I
35 Surface roughness of land cover (material) EO Derived: 13,17,34,38,68,69,70,73,74
N
36 Percent deep permeable soil per ward 6,39 D,N 37 Land area that does not contain erodible soil 6,15,39 D,N,Q 38 Distance from coastline of major developments 28 B,E
Stage 3 Receptor
General # Metric Available from Paper Ref.
39 Land use classification (marsh/mangrove, abandoned paddy, playground, sports ground, park, cemetery, residential, commercial, industrial, hotel/condo, institutional, road, waterbodies, agriculture, forest)
8,9,13,15,28,30,31,33,37,38,67 B,D,N,O,P, Q,R,Z
40 Urbanisation/industrialisation 1,2,10,13 B,D,P 41 Percent of developed open spaces 13,28,37 D,Q 42 Uncontrolled planning zones 1 I 43 Geocoding data - boundary datasets, area codes, wards 1,4,25,28,29,59 M,V,W,Z,Å 44 Location of waste treatment works, sewage and landfill sites (in-use and historic) 1,10,12,19,33 M
Public amenities # Metric Available from Paper Ref.
45 Spatial density of schools, hospitals, emergency services, hotels location 1,28 B,D,F,I,Q,S,T,Y,Å,£ 46 Density of commercial infrastructure 1,28 D,Q 47 Percent of commercial establishments outside high hazard zones Derived: 1,28 D,Q 48 Number of food suppliers (local) 1,28 F,Y 49 Child care facility locations 1,28 Q 50 Location of care homes, assisted living, mental health care, drug treatment centres, pharmacies, prisons 1,28 F,S,Å 51 Retail centres per unit population 1,28 F,Q 52 Food security Derived: 42 F,Y 53 Doctors per 10,000 people 21,80 F,P,Q 54 Medical care capacity (number of hospital beds per 10,000 people) Derived: 21,80 F,Q,Z,£
Economy and business # Metric Available from Paper Ref.
55 Main employers and sectors 21,22 A 56 Employment rate 1,21,22 B,F,Q,R,S,U,£ 57 Dependency on primary industries (farming, fishing, forestry, extractive industries) or tourism 21 B,F,P,Q,T,Y 58 Income inequality/distribution 21 A,F,G,I,Q,R,U,W, Y,Z,£ 59 Economic diversification 1,21,22 P,Y 60 Business/industrial activity 1,21,22,60 Q,R 61 Business sizes –ratio of large to small businesses 21,60 F,Q,R 62 % of population who are government employed 21 F 63 Investment in coastal areas 1 I 64 Land/house prices –stability –change 25,66 B,I 65 Availability and accessibility of financial resources 60 O,U,Y 66 Supply chains -revealing complex risks Derived: 60 K,S 67 Farming/agricultural data –crop yields 9,11,15,33 O,P 68 Fisheries and aquaculture – resources and revenue 5,7,11,14,26,29 P 69 Tourism hotspots; tourist numbers (footfall) on beaches/coastal paths 1,21,19 T 70 Shipping cargo statistics 20,21 J 71 Number of businesses in risk zones Derived: 1,10,17 I
People
A.G. Rumson et al.

Ocean and Coastal Management 185 (2020) 105004
20
# Metric Available from Paper Ref.
72 Poverty levels 40,21,22 B,I,P,W 73 Spatial trends in human health 1,21,22 S,U,Y 74 Population density, distribution and structure 1,21,22 B,I,K,P,W,Å 75 Population age dependency ratio 21 B,F,I,P,Q,R,S,U,Z,£ 76 Split, urban/rural population Derived: 21,28 P 77 Population change (population stability) Derived: 1,19,28 B,F,I,P,S,W 78 Percent of the population living in high intensity urban areas Derived: 21,28,79 D,Q 79 Homeownership 21,22 B,F,G,P,Q,R,U,£ 80 Number of disabled/handicap people 21,22 B,F,I,Q,U,Z 81 Recent immigrants, asylum seekers, non-English speakers/language competency 21,22 A,B,F,I,Q,U 82 Visitors in an area; ability to respond –hotel numbers, proximity to hazards Derived: 21,41 K,Q 83 % population located within hazard zones Derived: 21,10 B,I,K,M,W 84 Immigration/emigration rates 21,22 Q,R 85 Criminality 21,50 S 86 Social cohesion/social capital 21,42 P,S,U,Y,£ 87 Recreational use of the coast 1,26,29 C,Å,H
Property # Metric Available from Paper Ref.
88 Housing density 1,67 A,B,S 89 Assets in flood/erosion zones (including the EA: National Receptor Database) Derived: 1,10, 28,55,63,64,65 I,K,P,Q,R 90 Housing types 1,21,67,78 B,F,Q,S,U 91 Construction quality 67,78 B,F,S,T,U 92 Building age 21,67,78 A,B,Q,R 93 Bungalows 21,67 R 94 Transportation access –households with cars 19,20,21 F,Q,S,£ 95 Number of multi-storey buildings 21,67,78 X 96 Vacant housing 1 Q,R 97 Building architecture –number of floors available to occupants 34,67 M,S,U 98 Households with basements 78? S
Infrastructure # Metric Available from Paper
Ref.
99 Transportation access and alternatives–roads, rail, ports, airports, bus routes –movement potential Derived: 28 D,S,Y 100 Principle arterial roads in hazard zones (traffic flow data) Derived: 20,28 A,D,Q,
W,Z 101 Rail miles in hazard areas Derived: 28 Q 102 Emergency road network accessibility Derived: 1,20,28 O 103 Determination of key infrastructure at risk: roads, rail, ports, water, energy, telecoms, undersea structures
(Identification drawing on automated processes or manual analysis) 1,10,12,20,24,28,32 Q,S
104 Infrastructure dependencies (electricity, water, drainage, food, hospitals, daily emergency management) Derived: 12,19,28,32,63
K,S
105 Spatial configuration of buildings and infrastructure in urban areas – which can constrict drainage Derived through spatial analysis: 10,28,38,68,69,70,73,74
S
106 Existence and location of critical infrastructure (communication and transport) (from traffic data and human movements, and supply chain data)
1,19,20 S,Y
107 Water sources, fresh (potable) water 6,11,30 M,P,Y,Å 108 Water treatment works 11 S 109 Percent of building infrastructure not in flood inundation zones Derived: 10,55,63,64,65 B,Q 110 High speed internet infrastructure 19,44 F,Q 111 Renewable energy sources 12,45,46 P 112 Energy efficiency (megawatt hours/consumer) 19 F,W 113 Efficient water use (water supply stress index) 10,30 F 114 Transformer stations 28 K 115 Operation of bridges and tunnels 28 S 116 Infrastructure condition 1,19 L 117 Strategic Water infrastructure 11 L,Å 118 Water supply, gas supply, and drains run under/along road corridors, dependency links Derived through spatial analysis:
10,28,32,47,48,72 S
119 Sanitation facilities 1,28,11 P,Y 120 Water, gas, petroleum, storage facilities 28,47 S 121 Future trends in infrastructure development - based on published plans, energy needs, and projected population 1,19,28,48,49 R,V
Stage 4 Risk reducing measures
Stage 4.1 Adaptation
A.G. Rumson et al.
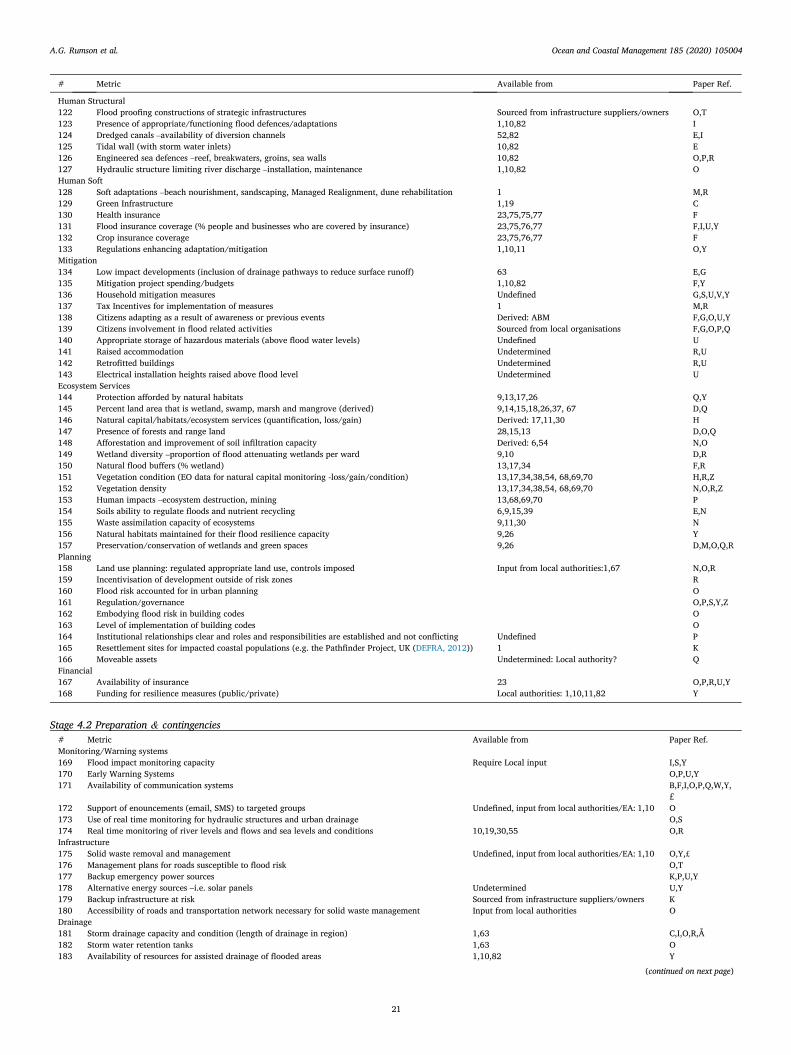
Ocean and Coastal Management 185 (2020) 105004
21
# Metric Available from Paper Ref.
Human Structural 122 Flood proofing constructions of strategic infrastructures Sourced from infrastructure suppliers/owners O,T 123 Presence of appropriate/functioning flood defences/adaptations 1,10,82 I 124 Dredged canals –availability of diversion channels 52,82 E,I 125 Tidal wall (with storm water inlets) 10,82 E 126 Engineered sea defences –reef, breakwaters, groins, sea walls 10,82 O,P,R 127 Hydraulic structure limiting river discharge –installation, maintenance 1,10,82 O Human Soft 128 Soft adaptations –beach nourishment, sandscaping, Managed Realignment, dune rehabilitation 1 M,R 129 Green Infrastructure 1,19 C 130 Health insurance 23,75,75,77 F 131 Flood insurance coverage (% people and businesses who are covered by insurance) 23,75,76,77 F,I,U,Y 132 Crop insurance coverage 23,75,76,77 F 133 Regulations enhancing adaptation/mitigation 1,10,11 O,Y Mitigation 134 Low impact developments (inclusion of drainage pathways to reduce surface runoff) 63 E,G 135 Mitigation project spending/budgets 1,10,82 F,Y 136 Household mitigation measures Undefined G,S,U,V,Y 137 Tax Incentives for implementation of measures 1 M,R 138 Citizens adapting as a result of awareness or previous events Derived: ABM F,G,O,U,Y 139 Citizens involvement in flood related activities Sourced from local organisations F,G,O,P,Q 140 Appropriate storage of hazardous materials (above flood water levels) Undefined U 141 Raised accommodation Undetermined R,U 142 Retrofitted buildings Undetermined R,U 143 Electrical installation heights raised above flood level Undetermined U Ecosystem Services 144 Protection afforded by natural habitats 9,13,17,26 Q,Y 145 Percent land area that is wetland, swamp, marsh and mangrove (derived) 9,14,15,18,26,37, 67 D,Q 146 Natural capital/habitats/ecosystem services (quantification, loss/gain) Derived: 17,11,30 H 147 Presence of forests and range land 28,15,13 D,O,Q 148 Afforestation and improvement of soil infiltration capacity Derived: 6,54 N,O 149 Wetland diversity –proportion of flood attenuating wetlands per ward 9,10 D,R 150 Natural flood buffers (% wetland) 13,17,34 F,R 151 Vegetation condition (EO data for natural capital monitoring -loss/gain/condition) 13,17,34,38,54, 68,69,70 H,R,Z 152 Vegetation density 13,17,34,38,54, 68,69,70 N,O,R,Z 153 Human impacts –ecosystem destruction, mining 13,68,69,70 P 154 Soils ability to regulate floods and nutrient recycling 6,9,15,39 E,N 155 Waste assimilation capacity of ecosystems 9,11,30 N 156 Natural habitats maintained for their flood resilience capacity 9,26 Y 157 Preservation/conservation of wetlands and green spaces 9,26 D,M,O,Q,R Planning 158 Land use planning: regulated appropriate land use, controls imposed Input from local authorities:1,67 N,O,R 159 Incentivisation of development outside of risk zones R 160 Flood risk accounted for in urban planning O 161 Regulation/governance O,P,S,Y,Z 162 Embodying flood risk in building codes O 163 Level of implementation of building codes O 164 Institutional relationships clear and roles and responsibilities are established and not conflicting Undefined P 165 Resettlement sites for impacted coastal populations (e.g. the Pathfinder Project, UK (DEFRA, 2012)) 1 K 166 Moveable assets Undetermined: Local authority? Q Financial 167 Availability of insurance 23 O,P,R,U,Y 168 Funding for resilience measures (public/private) Local authorities: 1,10,11,82 Y
Stage 4.2 Preparation & contingencies # Metric Available from Paper Ref. Monitoring/Warning systems 169 Flood impact monitoring capacity Require Local input I,S,Y 170 Early Warning Systems O,P,U,Y 171 Availability of communication systems B,F,I,O,P,Q,W,Y,
£ 172 Support of enouncements (email, SMS) to targeted groups Undefined, input from local authorities/EA: 1,10 O 173 Use of real time monitoring for hydraulic structures and urban drainage O,S 174 Real time monitoring of river levels and flows and sea levels and conditions 10,19,30,55 O,R Infrastructure 175 Solid waste removal and management Undefined, input from local authorities/EA: 1,10 O,Y,£ 176 Management plans for roads susceptible to flood risk O,T 177 Backup emergency power sources K,P,U,Y 178 Alternative energy sources –i.e. solar panels Undetermined U,Y 179 Backup infrastructure at risk Sourced from infrastructure suppliers/owners K 180 Accessibility of roads and transportation network necessary for solid waste management Input from local authorities O Drainage 181 Storm drainage capacity and condition (length of drainage in region) 1,63 C,I,O,R,Å 182 Storm water retention tanks 1,63 O 183 Availability of resources for assisted drainage of flooded areas 1,10,82 Y
(continued on next page)
A.G. Rumson et al.

Ocean and Coastal Management 185 (2020) 105004
22
(continued )
184 Maintaining storm sewers 1,10,82 R Shelter/Housing 185 Temporary Shelters/housing –availability/capacity Undefined, input from local authorities/EA: 1,10 B,F,O,P,T,Å,£ 186 Number of shelters per km2 (including, hospitals, schools, municipal buildings, and places of
worship) I,Q,Z
Emergency Relief 187 Emergency Services –locations, cover, backup, capacity Undefined, input from local authorities/EA: 1,10 P,Q,T 188 Crisis management centres sited outside of risk zones O 189 Additional resources in place supporting emergency and rescue services T 190 Evacuation routes and plans B,F,M,O,Y 191 Access to hospitals Derived: 28,20 D,P,T,Y 192 Relief organisation –red cross etc. Obtained from survey of local organisation G,I,£ 193 Availability of emergency vehicles and boats Undefined P,U 194 Availability of emergency aid (food, water, medicine) Undefined, input from local authorities/EA: 1,10 G,O,P,T,U 195 Flood emergency infrastructure Input from councils and infrastructure owners;
82 S,Y
196 Established evacuation zones Undefined, input from local authorities/EA: 1,10 U 197 Access to high axel vehicles Undefined U Societal 198 Civil Society grouping Obtained from survey of local organisation G,P,Q,T,U,Y,£ 199 Resident capacity Undetermined S 200 Hazard event alert exercise/training for residents in vulnerable areas Undefined, input from local authorities/EA: 1,10 F,O,P,T 201 Existence and implementation of risk management plans 1,10 I,O,R,Y 202 Informal coordination of citizens activities within communities Obtained locally O 203 Volunteer networks Obtained locally F,K,O Hazard Awareness 204 Awareness of local population (recent flood events, media, education) Survey input, or derived through ABM or similar F,G,I,O,P,U,Y,£ 205 Flood/erosion risk education and information 1,10,17,55 G,O,P,T,U,Y 206 Existence and availability of flood hazard maps 1,10 O,P 207 Flood water control and sanitation knowledge Undefined, require local input O,Y
Stage 5 Impacts/consequence
# Metric Available from Paper Ref.
Environmental physical impacts 208 Historic flood extents (taken from aerial imagery, EO data, water level gauges) 10,70 I 209 Salinization of freshwater bodies and soils 10 J,P,Å 210 Geomorphological change -records of beach/loss creation (change calculations) (derived from Lidar, EO data analysis,
terrestrial laser scanning) 2,6,10,13,14 P,Z
211 Decadal loss of shoreline, permanent inundation areas (from change detection, EO derived products) 13,17,34,38 P 212 Erosion/accretion rates (derived from aerial/EO images, transects, point clouds) 2,10,13 B,N,P,R 213 Natural habitats, specie distribution and stocks 7,9,14,15,18,26,29,30 Y 214 Soil fertility (change) 39 N,P 215 Groundwater levels 55,63 J,L,V,Å General 216 Extents of flooding and impacts (physical and human), as derived from flood specific geotagged social media data (text,
images, videos), crowd sourced Derived, 61, 68,69,70,71,81 P
217 Per capita damage Derived: 1,67,77 B,W 218 Spatial distribution of hazard events and losses Derived, 61, 68,69,70,71 K 219 Flood-related insurance claims 23,60,75,76,77 Q 220 Financial impacts of flood/erosion damage on people, property, business, government from reports and statistics 10,61 I,R,Y Business 221 Impact of events on tourism and production Derived: 21 T 222 Impacts on arable and livestock farming 9,11,15,33 F,O,P 223 Business and services disruption Derived: 3,21 P,Y People 224 Flood and erosion event casualties 1 I,M,Y 225 Health impacts from flood water contact and contamination –prevalence of post flood illness Derived: 1,10,21,22 Y 226 Job losses related to past hazard events Derived: 1,3,19,21,30,36 I 227 Recorded property crime and looting 50 Y Property 228 Property level damage - revealed through EO data imagery an SAR, drones, social media, CCTV Derived: 1,10,61,68,69,70,71 B,M,R,Y 229 Property claims 61,75,76,77 M 230 Property repair costs Derived: 51 V,M Infrastructure 231 Critical infrastructure damage 13,68,69,70,71 M 232 Functioning of drainage systems and waste water removal 63 M,R,Y,Å 233 Frequency of reported defence overtopping incidents 10 P 234 Groundwater contamination in coastal aquifers –population affected 6,11,30 P 235 Drowned technical infrastructure Derived:
10,28,32,47,48,49,51,72 K
236 Flooded roads and rail (image analysis and derived from social media, flood extent maps) Derived: 13, 68,69,70 K,P,T,Å 237 Non-functioning basic services –water, energy, blocked roads 1 K
Stage 6 Recovery
A.G. Rumson et al.

Ocean and Coastal Management 185 (2020) 105004
23
# Metric Available from Paper Ref.
238 Fraction of residents who were unable to occupy homes after a storm event Undefined, input from local authorities/EA: 1,10
M 239 Evacuations orders issues in response to storm events M 240 Evacuation order compliance rates M 241 Early warning system functioning Undefined Y 242 Past recovery times after events Input from local authorities I,Q,Y 243 Time to restore housing to habitable T 244 Utility restoration post event (% residents with potable water, wastewater and electricity services. M,T,Y 245 Time roads out of action (Derived from EO data analytics, social media data, CCTV footage, crowd sourced
data) Derived: 68,69,70,71,73,81 T
246 Coastal land rehabilitation 10,67 P 247 Industrial resupply potential Derived: 28,20,60 F 248 Ability to financially recover/availability of reserve funds Undefined O 249 Percent fire, police, emergency relief services and temporary shelters outside of hazard zones Derived: 1,10,28 D,K,Q,S 250 Government offices outside of flood inundation zones 10,55,63,64,65 D 251 Availability of temporary flood barriers Undefined, input from local authorities/EA:
1,10 G,V
252 Regulations governing sustainable reconstruction O 253 Population covered by recent hazard mitigation plans Q 254 Identification of past response problems and challenges (social media) Derived: Social Media, 71, and local authorities O
Appendix C
Data sources
Table 7 Data sources relevant to a resilience assessment for the case study area of East Anglia. Data source numbers are cross referenced in the metrics listings in Appendix B. Details also provided indicating if sources are Open (O) or Proprietary (P).
# Data Source URL Open (O)/ Priority (P)
1 District Councils https://www.suffolk.gov.uk/council-and-democracy/open-data-suffolk/ https://www.norfolk.gov.uk/what-we-do-and-how-we-work/open-data-fois-and-data-protection /open-data/ https://data.gov.uk/
O
2 CCO https://www.channelcoast.org/ O 3 MET Office https://www.metoffice.gov.uk/datapoint O/P 4 UKHO http://aws2.caris.com/ukho/mapViewer/map.action/ O 5 BODC https://www.bodc.ac.uk/ O 6 British Geological Survey https://www.bgs.ac.uk/data/home.html O/P 7 CEFAS https://www.cefas.co.uk/cefas-data-hub/ O 8 Historic England https://historicengland.org.uk/listing/the-list/data-downloads/ O 9 Natural England http://naturalengland-defra.opendata.arcgis.com/ O 10 Environment Agency http://apps.environment-agency.gov.uk/wiyby/151365.aspx O 11 DEFRA https://environment.data.gov.uk/ O 12 The Crown Estate https://www.thecrownestate.co.uk/en-gb/resources/maps-and-gis-data/ O 13 Copernicus (ESA) https://www.copernicus.eu/en O 14 MEDIN http://portal.oceannet.org/portal/start.php O 15 MAGIC https://magic.defra.gov.uk/ O 16 Intergovernmental Panel on Climate Change
(IPCC) http://www.ipcc-data.org/ O
17 Academia (e.g. iCOASST, RISC-KIT, FAST) https://www.channelcoast.org/iCOASST/pilotsites/ http://www.risckit.eu/np4/toolbox/https://fast.openearth.eu/
O
18 EMODNET http://www.emodnet.eu/ O 19 Data.Gov.UK (web portal) https://data.gov.uk/ O 20 Department for Transport (DFT) UK and
Highways England https://roadtraffic.dft.gov.uk/ http://tris.highwaysengland.co.uk/
O
21 The Office for National Statistics https://www.ons.gov.uk/; https://www.nomisweb.co.uk/ O 22 Datashine (University College London) http://datashine.org.uk/ O 23 ABI https://www.abi.org.uk/data-and-resources/industry-data/ O/P 24 UK OGA https://www.ogauthority.co.uk/data-centre/ O/P 25 Land Registry http://landregistry.data.gov.uk/ O 26 JNCC http://jncc.defra.gov.uk/opendata/ O 27 NOAA NCEI https://www.ncei.noaa.gov/ O 28 Ordnance Survey (OS) https://www.ordnancesurvey.co.uk/business-and-government/products/finder.html O/P 29 MMO https://ckan.publishing.service.gov.uk/publisher/marine-management-organisation/ O 30 Centre for Ecology and Hydrology https://www.ceh.ac.uk/data/ O 31 The National Trust https://uk-nationaltrust.opendata.arcgis.com/ O 32 National Grid https://www.nationalgridet.com/network-and-assets O 33 European Environment Agency https://www.thecrownestate.co.uk/en-gb/resources/maps-and-gis-data/ O 34 CEDA Archive http://data.ceda.ac.uk/ O 35 Surge Watch https://www.surgewatch.org/ O 36 National Tidal and Sea Level Facility https://www.ntslf.org/ O 37 UK land cover atlas https://figshare.shef.ac.uk/articles/A_Land_Cover_Atlas_of_the_United_Kingdom_Maps_/5219956 O
(continued on next page)
A.G. Rumson et al.

Ocean and Coastal Management 185 (2020) 105004
24
Table 7 (continued )
# Data Source URL Open (O)/ Priority (P)
38 Tcarta (satellite derived products) https://www.tcarta.com/products-and-services/ P 39 Cranfield University soil archive LandIS http://www.landis.org.uk/npd_insurance/ P 40 Experian https://old.datahub.io/dataset/poverty-in-england-experian-data/ O 41 Visit England https://www.visitbritain.org/official-statistics/ O 42 UK Data service https://www.ukdataservice.ac.uk/ O 43 Property Data https://propertydata.co.uk/ P 44 Ofcom https://www.ofcom.org.uk/research-and-data/data/ O 45 Renewable energy foundation https://www.ref.org.uk/generators/index.php O 46 UK data explorer https://ukdataexplorer.com/renewables/ O 47 GIE Gas infra Europe https://www.gie.eu/index.php/gie-publications/maps-data/bio-map/ O 48 Infrastructure and projects authority https://assets.publishing.service.gov.uk/government/uploads/system/uploads/attachment_data/fi
le/520086/2904569_nidp_deliveryplan.pdf O
49 National infrastructure commission https://www.nic.org.uk/ O 50 Police data UK https://data.police.uk/data/statistical-data/ O 51 Middlesex Multi-Coloured Manual https://www.mdx.ac.uk/our-research/centres/flood-hazard/flood-hazard-research-centre-publicatio
ns/ P
52 Canal and River Trust http://data-canalrivertrust.opendata.arcgis.com/ O 53 Marine Traffic https://www.marinetraffic.com/en/ais/home/centerx:-12.0/centery:25.0/zoom:4 O/P 54 Bluesky https://www.blueskymapshop.com/products/national-tree-map/ P 55 Check my flood risk https://www.checkmyfloodrisk.co.uk/ O 56 GaugeMap https://www.gaugemap.co.uk/#!About O 57 Weather Analytics https://www.weatheranalytics.com/industries/insurance/ P 58 Weather Net https://www.weathernet.co.uk/ P 59 Addresscloud https://www.addresscloud.com/ P 60 OpenCorporates https://opencorporates.com/ O 61 Perils https://www.perils.org/ P 62 Oasis Hub https://oasishub.co/ O/P 63 GeoSmart Information https://geosmartinfo.co.uk/reports/floodsmart/ P 64 JBA https://www.jbarisk.com/flood-services/catastrophe-models/flood-models/ P 65 Ambiental https://www.ambientalrisk.com/ P 66 Core logic https://www.corelogicsolutions.co.uk/products/ P 67 Verisk http://www.geoinformationgroup.co.uk/ukbuildings/ P 68 Planet https://www.planet.com/ P 69 Earthi https://earthi.space/ P 70 Digital Globe https://www.digitalglobe.com/ P 71 Social Media (mining) https://www.globalfloodmonitor.org/ O 72 Inspire Geoportal http://inspire-geoportal.ec.europa.eu/ O 73 NASA Worldview https://worldview.earthdata.nasa.gov/ O 74 USGS Earth Explorer https://earthexplorer.usgs.gov/ O 75 Crawfords https://www.crawco.com/services/data-and-analytics/ P 76 Cunningham Lindsey https://www.cunninghamlindsey.com/global/ P 77 LexisNexis https://risk.lexisnexis.co.uk/ P 78 Outra https://outra.co.uk/property-data-solutions/ P 79 City Population http://www.citypopulation.de/UK-EnglandUA.html O 80 NHS England https://www.england.nhs.uk/statistics/ O 81 University of Reading
Flood Crowdsourcing and CCTV sites https://research.reading.ac.uk/dare/2017/02/20/crowdsourcing-and-cctv-sites/ O
82 RFCC Decision Support Tool http://www.rfccobservatory.net/ O
References
Abenayake, C., Mikami, Y., Matsuda, Y., Jayasinghe, A., 2018a. Ecosystem services- based composite indicator for assessing community resilience to floods Abstract . Environ. Dev. 27, 34–46. https://doi.org/10.1016/j.envdev.2018.08.002.
Abenayake, C., Yoshiki, M., Yoko, M., 2018b. Validate geospatial indicators for assessing community resilience capacities to floods; a system-performance-based approach. J. Eng. Appl. Sci. 13, 4949–4960. https://doi.org/10.3923/jeasci.2018.4949.4960.
Acosta-Michlik, L., Espaldon, V., 2008. Assessing vulnerability of selected farming communities in the Philippines based on a behavioural model of agent’s adaptation to global environmental change. Glob. Environ. Chang. 18, 554–563. https://doi. org/10.1016/j.gloenvcha.2008.08.006.
Aerts, J.C.J.H., Botzen, W.J., Clarke, K.C., Cutter, S.L., Hall, J.W., Merz, B., Michel- Kerjan, E., Mysiak, J., Surminski, S., Kunreuther, H., 2018. Integrating human behaviour dynamics into flood disaster risk assessment/704/242/706/689/2788/ 706/2805 perspective. Nat. Clim. Chang. 8, 193–199. https://doi.org/10.103 8/s41558-018-0085-1.
Agarwal, S., Brunt, P., 2006. Social exclusion and English seaside resorts. Tour. Manag. 27, 654–670. https://doi.org/10.1016/j.tourman.2005.02.011.
Allen, T.R., Crawford, T., Montz, B., Whitehead, J., Lovelace, S., Hanks, A.D., Christensen, A.R., Kearney, G.D., 2018. Linking water infrastructure, public health, and sea level rise: integrated assessment of flood resilience in coastal cities. Public Work. Manag. Policy 24 (1), 110–139. https://doi.org/10.1177/1087724X1 8798380.
Bellini, E., Nesi, P., Ferreira, P., 2016. Operationalize data-driven resilience in urban transport systems. In: IRGC (2016). Resource Guide on Resilience. IRGC, Lausanne.
Bezuglov, A., Blanton, B., Santiago, R., 2016. Multi-Output Artificial Neural Network for Storm Surge Prediction. North Carolina.
Bheeroo, R.A., Chandrasekar, N., Kaliraj, S., Magesh, N.S., 2016. Shoreline change rate and erosion risk assessment along the Trou Aux Biches–Mont Choisy beach on the northwest coast of Mauritius using GIS-DSAS technique. Environ. Earth Sci. 75, 1–12. https://doi.org/10.1007/s12665-016-5311-4.
Bonfield, P., 2016. The Property Flood Resilience Action Plan. Bostick, T.P., Holzer, T.H., Sarkani, S., 2017. Enabling stakeholder involvement in
coastal disaster resilience planning. Risk Anal. 37, 1181–1200. https://doi.org /10.1111/risa.12737.
Brookfield, K., Gray, T., Hatchard, J., 2005. The concept of fisheries-dependent communities: a comparative analysis of four UK case studies: Shetland, Peterhead, North Shields and Lowestoft. Fish. Res. 72, 55–69. https://doi.org/10.1016/j.fishres. 2004.10.010.
Brooks, S.M., Spencer, T., Mcivor, A., M€oller, I., 2016. Reconstructing and understanding the impacts of storms and surges, southern North Sea. Earth Surf. Process. Landforms 864, 855–864. https://doi.org/10.1002/esp.3905.
Burton, C.G., 2015. A validation of metrics for community resilience to natural hazards and disasters using the recovery from hurricane Katrina as a case study. Ann. Assoc. Am. Geogr. 105, 67–86. https://doi.org/10.1080/00045608.2014.960039.
Cai, H., Lam, N.S.N., Qiang, Y., Zou, L., Correll, R.M., Mihunov, V., 2018a. A synthesis of disaster resilience measurement methods and indices. Int. J. Disaster Risk Reduct. 31, 844–855. https://doi.org/10.1016/j.ijdrr.2018.07.015.
Cai, H., Lam, N.S.N., Zou, L., Qiang, Y., 2018b. Modeling the dynamics of community resilience to coastal hazards using a Bayesian network. Ann. Assoc. Am. Geogr. 4452, 1–20. https://doi.org/10.1080/24694452.2017.1421896.
A.G. Rumson et al.

Ocean and Coastal Management 185 (2020) 105004
25
Caroti, G., Piemonte, A., Pieracci, Y., 2018. Low-altitude UAV-borne remote sensing in dunes environment: shoreline monitoring and coastal resilience. In: International Conference on Computational Science and its Applications. Springer International Publishing, Cham.
Cervone, G., Sava, E., Huang, Q., Schnebele, E., Harrison, J., Waters, N., 2016. Using Twitter for tasking remote-sensing data collection and damage assessment: 2013 Boulder flood case study. Int. J. Remote Sens. 37, 100–124. https://doi.org/10.1 080/01431161.2015.1117684.
Chang, L.C., Amin, M., Yang, S.N., Chang, F.J., 2018. Building ANN-based regional multi- step-ahead flood inundation forecast models. Water 10, 1283. https://doi.org/ 10.3390/w10091283.
Christie, E.K., Spencer, T., Owen, D., McIvor, A.L., M€oller, I., Viavattene, C., 2018. Regional coastal flood risk assessment for a tidally dominant, natural coastal setting: North Norfolk, southern North Sea. Coast. Eng. 134, 177–190. https://doi.org/10.10 16/j.coastaleng.2017.05.003.
Coastal and Environmental Research Committee, 2015. Understanding and Modeling Risk and Resilience in Complex Coastal Systems (Final Workshop Report). Washington, D.C.
Coastal Partnership East, 2019. Who is coastal Partnership East? [WWW Document]. URL. https://www.coasteast.org.uk/about-us/who-is-coastal-partnership-east/, 2, 19, 2019.
Collins, A., Miller, J., Coughlin, D., Kirk, S., 2015. The Production of Quick Scoping Reviews and Rapid Evidence Assessments A How to Guide Joint Water Evidence Group.
Committee on Climate Change UK, 2018. Managing the Coast in a Changing Climate Committee on Climate Change.
Cooper, J.A.G., Pile, J., 2014. The adaptation-resistance spectrum: a classification of contemporary adaptation approaches to climate-related coastal change. Ocean Coast Manag. 94, 90–98. https://doi.org/10.1016/j.ocecoaman.2013.09.006.
Copernicus, 2019. Copernicus Open Access Hub, 9, 16, 2017. Crick, F., Jenkins, K., Surminski, S., 2018. Strengthening insurance partnerships in the
face of climate change – insights from an agent-based model of flood insurance in the UK. Sci. Total Environ. 636, 192–204. https://doi.org/10.1016/j.scitotenv.2018.0 4.239.
Cutter, S.L., Derakhshan, S., 2018. Temporal and spatial change in disaster resilience in US counties, 2010–2015. Environ. Hazards 0, 1–20. https://doi.org/10.1080/17477 891.2018.1511405.
Cutter, S.L., Ash, K.D., Emrich, C.T., 2014. The geographies of community disaster resilience. Glob. Environ. Chang. 29, 65–77. https://doi.org/10.1016/j.gloenvch a.2014.08.005.
DasGupta, R., Shaw, R., 2015. An indicator based approach to assess coastal communities’ resilience against climate related disasters in Indian Sundarbans. J. Child Fam. Stud. 24, 85–101. https://doi.org/10.1007/s11852-014-0369-1.
Dawson, R.J., Peppe, R., Wang, M., 2011. An agent based model for risk-based flood incident management. Nat. Hazards 59, 167–189. https://doi.org/10.1007 /s11069-011-9745-4.
de Bruijn, J.A., de Moel, H., Jongman, B., Wagemaker, J., Aerts, J.C.J.H., 2018. TAGGS: grouping Tweets to improve global geoparsing for disaster response. J. Geovisualization Spat. Anal. 2, 2. https://doi.org/10.1007/s41651-017-0010-6.
Defra, 2005. Making Space for Water: Taking Forward a New Government Strategy for Flood and Coastal Erosion Risk Management. London.
Defra, 2006. Shoreline Management Plan Guidance Volume 1: Aims and requirements. London.
Defra, 2009. Appraisal of Flood and Coastal Erosion Risk Management. A DEFRA policy statement.
Defra, 2012. Coastal Pathfinder Evaluation: an Assessment of the Five Largest Pathfinder Projects.
Defra, 2016. National Flood Resilience Review 145. Deutz, A., Kellett, J., Zoltani, T., 2018. Innovative Finance for Resilient Coastal
Communities. DigitalGlobe, 2017. GBDX stories: building detection on Mosaics using deep learning
[WWW Document]. URL. http://gbdxstories.digitalglobe.com/building-detection-l arge-scale/, 9, 22, 2012.
Du, E., Cai, X., Sun, Z., Minsker, B., 2017. Exploring the role of social media and individual behaviors in flood evacuation processes: an agent-based modeling approach. Water Resour. Res. 53, 9164–9180. https://doi.org/10.1002/201 7WR021192.
Dubbelboer, J., Nikolic, I., Jenkins, K., Hall, J., 2017. An agent-based model of flood risk and insurance. J. Artif. Soc. Soc. Simul. 20. https://doi.org/10.18564/jasss.3135.
Ekeu-wei, I.T., Blackburn, G.A., 2018. Applications of open-access remotely sensed data for flood modelling and mapping in developing regions. Hydrology 5, 39. https://doi .org/10.3390/hydrology5030039.
Ellison, J.C., Mosley, A., Helman, M., 2017. Assessing atoll shoreline condition to guide community management. Ecol. Indicat. 75, 321–330. https://doi.org/10.1016/j. ecolind.2016.12.031.
Environment Agency, 2009. Shoreline management plans (SMPs) [WWW Document]. URL. https://www.gov.uk/government/publications/shoreline-management-pla ns-smps/shoreline-management-plans-smps, 2, 19, 2019.
Environment Agency, 2010. The Coastal Handbook: A Guide for All Those Working on the Coast. Bristol.
EPICURO, 2018. EPICURO European Partnership for Innovative Cities within an Urban Resilience Outlook: Best Practices Analysis.
Farhan, A.R., Lim, S., 2011. Resilience assessment on coastline changes and urban settlements: a case study in Seribu Islands, Indonesia. Ocean Coast Manag. 54, 391–400. https://doi.org/10.1016/j.ocecoaman.2010.12.003.
Fekete, A., Tzavella, K., Baumhauer, R., 2017. Spatial exposure aspects contributing to vulnerability and resilience assessments of urban critical infrastructure in a flood and blackout context. Nat. Hazards 86, 151–176. https://doi.org/10.1007/s11069-0 16-2720-3.
Ferreira, O., Viavattene, C., Jim�enez, J., Bole, A., Plomaritis, T., Costas, S., Smets, S., 2016. CRAF Phase 1, a framework to identify coastal hotspots to storm impacts. E3S Web Conf. 7, 1–9. https://doi.org/10.1051/e3sconf/20160711008.
Finkl, C.W., 2015. Managed realignment: a viable long-term coastal management Strategy? ; Esteves, L.S. J. Coast. Res. 313, 771, 771. https://doi.org/10.2112/JCOA STRES-D-14A-00008.1.
Gallopín, G.C., 2006. Linkages between vulnerability, resilience, and adaptive capacity. Glob. Environ. Chang. 16, 293–303. https://doi.org/10.1016/j.gloenvcha.2006.0 2.004.
Garvin, S., Hunter, K., Mcnally, D., Barnett, D., Dakin, R., Nexis, L., Street, D.O., 2016. Property Flood Resilience Database : an Innovative Response for the Insurance Market 22002. https://doi.org/10.1051/e3sconf/20160722002.
Geller, C., 2017. Automated flood extent identification using WorldView imagery for the insurance industry. Remote Sens. Agric. Ecosyst. Hydrol. XIX 10421. https://doi.org /10.1117/12.2278075.
Gouldby, B., Samuels, P., 2005. Language of Risk — Project Definitions. FLOODSite Consortium, UK.
Goverment Office for Science, 2004. Foresight Future Flooding, Future Flood and Coastal Defence.
Grason, D., 2018. How we use machine learning for targeted location monitoring [WWW Document]. DigitalGlobe. URL. http://blog.digitalglobe.com/developers/how-we- use-machine-learning-for-targeted-location-monitoring/, 9, 22, 2018.
Gritta, M., Pilehvar, M.T., Limsopatham, N., Collier, N., 2018. What’s missing in geographical parsing? Lang. Res. Eval. 52, 603–623. https://doi.org/10.1007/s10 579-017-9385-8.
Haer, T., Botzen, W.J.W., de Moel, H., Aerts, J.C.J.H., 2017. Integrating household risk mitigation behavior in flood risk analysis: an agent-based model approach. Risk Anal. 37, 1977–1992. https://doi.org/10.1111/risa.12740.
Han, Y., Peng, Z. ren, 2019. The integration of local government, residents, and insurance in coastal adaptation: an agent-based modeling approach. Comput. Environ. Urban Syst. 76, 69–79. https://doi.org/10.1016/j.compenvurbsys.2019.0 4.001.
Holling, C.S., 1973. Resilience and stability. Annu. Rev. Ecol. Systemat. 4, 1–23. htt ps://doi.org/10.1146/annurev.es.04.110173.000245.
Holling, C., 1996. Engineering resilience versus ecological resilience. In: Schulze, P. (Ed.), Engineering within Ecological Constraints.
Hung, H.C., Yang, C.Y., Chien, C.Y., Liu, Y.C., 2016. Building resilience: mainstreaming community participation into integrated assessment of resilience to climatic hazards in metropolitan land use management. Land Use Policy 50, 48–58. https://doi. org/10.1016/j.landusepol.2015.08.029.
Hung, H.C., Lu, Y.T., Hung, C.H., 2018. The determinants of integrating policy-based and community-based adaptation into coastal hazard risk management: a resilience approach. J. Risk Res. 9877, 1–19. https://doi.org/10.1080/13669877.2018.1 454496.
Jagadish, H.V., 2015. Big data and science: myths and reality. Big Data Res. 2, 49–52. htt ps://doi.org/10.1016/j.bdr.2015.01.005.
Jenkins, K., Surminski, S., Hall, J., Crick, F., 2017. Assessing surface water flood risk and management strategies under future climate change: insights from an agent-based model. Sci. Total Environ. 595, 159–168. https://doi.org/10.1016/j.scitotenv.20 17.03.242.
Johnson, C.W., McLean, K., 2008. Tools for local critical infrastructure protection: computational support for identifying safety and security interdependencies between local critical infrastructures. In: 3rd IET International Conference on System Safety 2008, p. 5A3, 5A3. https://doi.org/10.1049/cp:20080736.
Jongman, B., Kreibich, H., Apel, H., Barredo, J.I., Bates, P.D., Feyen, L., Gericke, A., Neal, J., Aerts, J.C.J.H., Ward, P.J., 2012. Comparative flood damage model assessment: towards a European approach. Nat. Hazards Earth Syst. Sci. 12, 3733–3752. https://doi.org/10.5194/nhess-12-3733-2012.
Jongman, B., Wagemaker, J., Romero, B., de Perez, E., 2015. Early flood detection for rapid humanitarian response: harnessing near real-time satellite and twitter signals. ISPRS Int. J. Geo-Inf. 4, 2246–2266. https://doi.org/10.3390/ijgi4042246.
Joseph, C.K., Kakade, S., 2014. Predicting impact of natural calamities in era of big data and data science. In: International Environmental Modelling and Software Society (IEMSs) 7th Intl. Congress on Env. Modelling and Software. San Diego, CA, USA.
Jovanovic, A.S., Schmid, N., Klimek, P., Choudhary, A., 2016. Use of indicators for assessing resilience of smart critical infrastructures. In: IRGC (2016) Resource Guide on Resilience. IRGC, Lausanne.
Joyce, J., Chang, N. Bin, Harji, R., Ruppert, T., Imen, S., 2017. Developing a multi-scale modeling system for resilience assessment of green-grey drainage infrastructures under climate change and sea level rise impact. Environ. Model. Softw. 90, 1–26. https://doi.org/10.1016/j.envsoft.2016.11.026.
Joyce, J., Chang, N. Bin, Harji, R., Ruppert, T., 2018. Coupling infrastructure resilience and flood risk assessment via copulas analyses for a coastal green-grey-blue drainage system under extreme weather events. Environ. Model. Softw. 100, 82–103. https:// doi.org/10.1016/j.envsoft.2017.11.008.
Karamouz, M., Zahmatkesh, Z., 2017. Quantifying resilience and uncertainty in coastal flooding events: framework for assessing urban vulnerability. J. Water Resour. Plan. Manag. 143, 04016071. https://doi.org/10.1061/(ASCE)WR.1943-5452.0000724.
Karavokiros, G., Lykou, A., Koutiva, I., Batica, J., Kostaridis, A., Alves, A., Makropoulos, C., 2016. Providing evidence-based, intelligent support for flood resilient planning and policy: the PEARL knowledge base. Water 8. https://doi. org/10.3390/w8090392.
A.G. Rumson et al.

Ocean and Coastal Management 185 (2020) 105004
26
Keating, A., Campbell, K., Szoenyi, M., McQuistan, C., Nash, D., Burer, M., 2017. Development and testing of a community flood resilience measurement tool. Nat. Hazards Earth Syst. Sci. 17, 77–101. https://doi.org/10.5194/nhess-17-77-2017.
Kete, N., Punzo, G., Linkov, I., 2018. Enhancing resilience within and between critical infrastructure systems. Environ. Syst. Decis. 38, 275–277. https://doi.org/10.100 7/s10669-018-9706-5.
Kim, H., Woosnam, K.M., Aleshinloye, K.D., 2014. Evaluating coastal resilience and disaster response: the case of Galveston and Texas gulf counties following hurricane ike. Coast. Manag. 42, 227–245. https://doi.org/10.1080/08920753.2014.904188.
Koduru, S., Reddy PVGD, P., Padala, P., 2018. Integrated disaster management and smart insurance using cloud and internet of things. Int. J. Eng. Technol. 7, 341. https://doi. org/10.14419/ijet.v7i2.6.10777.
Kromer, R.A., Abell�an, A., Hutchinson, D.J., Lato, M., Chanut, M.A., Dubois, L., Jaboyedoff, M., 2017. Automated terrestrial laser scanning with near-real-time change detection - monitoring of the S�echilienne landslide. Earth Surf. Dyn. 5, 293–310. https://doi.org/10.5194/esurf-5-293-2017.
Kunreuther, H., Michel-Kerjan, E., Tonn, G., 2016. Insurance, Economic Incentives and Other Policy Tools for Strengthening Critical Infrastructure Resilience: 20 Proposals for Action 56.
Lague, D., Brodu, N., Leroux, J., 2013. Accurate 3D comparison of complex topography with terrestrial laser scanner: application to the Rangitikei canyon (N-Z). ISPRS J. Photogrammetry Remote Sens. 82, 10–26. https://doi.org/10.1016/j.isprsjprs.20 13.04.009.
Lam, N.S.N., Qiang, Y., Arenas, H., Brito, P., Liu, K.B., 2015. Mapping and assessing coastal resilience in the Caribbean region. Cartogr. Geogr. Inf. Sci. 42, 315–322. https://doi.org/10.1080/15230406.2015.1040999.
Lam, N.S.-N., Qiang, Y., Li, K., Cai, H., Zou, L., Mihunov, V., 2018. Extending resilience assessment to dynamic system modeling: perspectives on human dynamics and climate change research. J. Coast. Res. 85, 1401–1405. https://doi.org/10.2112/S I85-281.1.
Lavender, S., Haria, K., Cooksley, G., Farman, A., Beaton, T., 2016. Understanding the future Market for NOVASAR-S flood mapping. In: Living Planet Symposium, p. 380.
Leal Filho, W., Modesto, F., Nagy, G.J., Saroar, M., YannickToamukum, N., Ha’apio, M., 2018. Fostering coastal resilience to climate change vulnerability in Bangladesh, Brazil, Cameroon and Uruguay: a cross-country comparison. Mitig. Adapt. Strategies Glob. Change 23, 579–602. https://doi.org/10.1007/s11027-017-9750-3.
Lee, J., Kao, H.A., Yang, S., 2014. Service innovation and smart analytics for Industry 4.0 and big data environment. Procedia CIRP 16, 3–8. In: https://doi.org/10.1016/j. procir.2014.02.001.
Li, Y., Zhang, X., Zhao, X., Ma, S., Cao, H., Cao, J., 2016. Assessing spatial vulnerability from rapid urbanization to inform coastal urban regional planning. Ocean Coast Manag. 123, 53–65. https://doi.org/10.1016/j.ocecoaman.2016.01.010.
Li, Z., Wang, C., Emrich, C.T., Guo, D., 2018. A novel approach to leveraging social media for rapid flood mapping: a case study of the 2015 South Carolina floods. Cartogr. Geogr. Inf. Sci. 45, 97–110. https://doi.org/10.1080/15230406.2016.1271 356.
Lloyd, M.G., Peel, D., Duck, R.W., 2013. Towards a social-ecological resilience framework for coastal planning. Land Use Policy 30, 925–933. https://doi.org/10.10 16/j.landusepol.2012.06.012.
Loftis, J.D., Forrest, D., Katragadda, S., Spencer, K., Organski, T., Rhee, S., Nguyen, C., 2018. StormSense : a new integrated network of IoT water level sensors in the smart cities of Hampton roads , VA. Mar. Technol. Soc. J. 52, 1–30. https://doi.org/ 10.4031/MTSJ.52.2.7.
Market Association, Lloyd’s, 2017. Market briefing: claims imagery & intelligence service [WWW Document]. URL. http://www.lmalloyds.com/LMA/News/Blog/Cl aims_Imagery___Intelligence_Service_-_4_September_2017.aspx. (Accessed 22 September 2018).
Marr, B., 2015. Big Data: Using SMART Big Data, Analytics and Metrics to Make Better Decisions and Improve Performance. Wiley, Cichester.
Martinez, M.L., Taramelli, A., Silva, R., 2017. Resistance and resilience: facing the multidimensional challenges in coastal areas. J. Coast. Res. 77, 1–6. https://doi.org /10.2112/SI77-001.1.
McFadden, L., 2010. Exploring system interactions for building resilience within coastal environments and communities. Environ. Hazards 9, 266–283. https://doi.org/10. 3763/ehaz.2010.0056.
McGuire, C.J., 2018. Examining legal and regulatory barriers to climate change adaptation in the coastal zone of the United States. Cogent Environ. Sci. 4, 1–11. https://doi.org/10.1080/23311843.2018.1491096.
Menoni, S., Molinari, D., Parker, D., Ballio, F., Tapsell, S., 2012. Assessing multifaceted vulnerability and resilience in order to design risk-mitigation strategies. Nat. Hazards 64, 2057–2082. https://doi.org/10.1007/s11069-012-0134-4.
Milligan, J., O’Riordan, T., Nicholson-Cole, S.A., Watkinson, A.R., 2009. Nature conservation for future sustainable shorelines: lessons from seeking to involve the public. Land Use Policy 26, 203–213. https://doi.org/10.1016/j.landusepol.2008.0 1.004.
Mokrech, M., Hanson, S., Nicholls, R.J., Wolf, J., Walkden, M., Fontaine, C.M., Nicholson-Cole, S., Jude, S.R., Leake, J., Stansby, P., Watkinson, A.R., Rounsevell, M. D. a, Lowe, J.a., Hall, J.W., 2011. The Tyndall coastal simulator. J. Coast. Conserv. 15, 325–335. https://doi.org/10.1007/s11852-009-0083-6.
Myatt, L.B., Scrimshaw, M.D., Lester, J.N., 2003. Public perceptions and attitudes towards a current managed realignment scheme: brancaster west marsh. Source J. Coast. Res. J. Coast. Res. 19, 278–286. https://doi.org/10.1016/S0964-5691(03) 00035-8.
Narayan, S., Nicholls, R.J., Clarke, D., Hanson, S., Reeve, D., Horrillo-Caraballo, J., le Cozannet, G., Hissel, F., Kowalska, B., Parda, R., Willems, P., Ohle, N., Zanuttigh, B., Losada, I., Ge, J., Trifonova, E., Penning-Rowsell, E., Vanderlinden, J.P., 2014. The
SPR systems model as a conceptual foundation for rapid integrated risk appraisals: lessons from Europe. Coast. Eng. 87, 15–31. https://doi.org/10.1016/j.coastaleng. 2013.10.021.
National Infrastructure Commission, 2018. National Infrastructure Assessment. Nicholls, R.J., Branson, J., 1998. Coastal resilience and planning for an uncertain future:
an introduction. Geogr. J. 164, 255–258. https://doi.org/10.2307/3060614. Broad scale coastal simulation. In: Nicholls, R.J., Dawson, R.J., Day, S.A. (Eds.), 2015.
Advances in Global Change Research. Springer Netherlands, Dordrecht. https://doi. org/10.1007/978-94-007-5258-0.
NOAA, 2018. What is resilience [WWW Document]. URL https://oceanservice.noaa. gov/facts/resilience.html. . (Accessed 2 September 2019).
NOAA, 2018. What is coastal resilience [WWW Document]. URL https://oceanservice.no aa.gov/ecosystems/resilience/. . (Accessed 2 September 2019).
NOAA Office for Coastal Management, 2015. Coastal Community Resilience Indicators and Rating Systems 63.
OECD, 2016. Financial Management of Flood Risk. Oladokun, V.O., Proverbs, D.G., Lamond, J., 2017. Measuring flood resilience: a fuzzy
logic approach. Int. J. Build. Pathol. Adapt. 35, 470–487. https://doi.org/10.1108 /IJBPA-12-2016-0029.
ONS, 2016. ONS Methodology Working Paper Series No. 8- Statistical Uses for Mobile Phone Data: Literature Review.
O’Brien, O., Cheshire, J., 2015. Interactive mapping for large, open demographic data sets using familiar geographical features. J. Maps 5647, 1–8. https://doi.org/ 10.1080/17445647.2015.1060183.
O’Mahony, C., Gray, S., Gault, J., Cummins, V., 2015. ICZM as a framework for climate change adaptation action – experience from Cork Harbour, Ireland. Mar. Policy 1–10. https://doi.org/10.1016/j.marpol.2015.10.008.
Panteras, G., Cervone, G., 2018. Enhancing the temporal resolution of satellite-based flood extent generation using crowdsourced data for disaster monitoring. Int. J. Remote Sens. 39, 1459–1474. https://doi.org/10.1080/01431161.2017.1400193.
Papadopoulos, T., Gunasekaran, A., Dubey, R., Altay, N., Childe, S.J., Fosso-Wamba, S., 2017. The role of Big Data in explaining disaster resilience in supply chains for sustainability. J. Clean. Prod. 142, 1108–1118. https://doi.org/10.1016/j.jclepro.20 16.03.059.
Pijanowski, B.C., Tayyebi, A., Doucette, J., Pekin, B.K., Braun, D., Plourde, J., 2014. A big data urban growth simulation at a national scale: configuring the GIS and neural network based Land Transformation Model to run in a High Performance Computing (HPC) environment. Environ. Model. Softw 51, 250–268. https://doi. org/10.1016/j.envsoft.2013.09.015.
Pimm, S.L., 1984. The complexity and stability of ecosystems. Nature 307, 321–326. Pollard, J.A., Spencer, T., Jude, S., 2018. Big Data Approaches for coastal flood risk
assessment and emergency response. Wiley Interdiscip. Rev. Clim. Change 9, 1–14. https://doi.org/10.1002/wcc.543.
Pollard, J.A., Brooks, S.M., Spencer, T., 2019. Harmonising topographic & remotely sensed datasets, a reference dataset for shoreline and beach change analysis. Sci. data 6, 42. https://doi.org/10.1038/s41597-019-0044-3.
Qadir, J., Ali, A., ur Rasool, R., Zwitter, A., Sathiaseelan, A., Crowcroft, J., 2016. Crisis analytics: big data-driven crisis response. J. Int. Humanit. Action 1, 12. https://doi. org/10.1186/s41018-016-0013-9.
Ramieri, Hartley, A., Barbanti, A., Santos, F.D., Gomes, A., Hilden, M., Laihonen, P., Marinova, N., Santini, M., 2011. Methods for Assessing Coastal Vulnerability to Climate Change. ETC CCA Technical Paper, Bologna (IT).
Ratti, C., Frenchman, D., Pulselli, R.M., Williams, S., 2006. Mobile landscapes: using location data from cell phones for urban analysis. Environ. Plan. Plan. Des. 33, 727–748. https://doi.org/10.1068/b32047.
Reeve, D., Horrillo-Caraballo, J.M., Fox, A., Simmonds, D., Kwan, S., Pan, S., Greaves, D., 2012. Coastal defence evaluation: an SPRC approach. Coast. Eng. Proc. 1, 37.
Resilience Alliance, 2010. Assessing resilience in social-ecological systems - a workbook for practitioners V 2.0. https://doi.org/10.1007/s11284-006-0074-0.
Rumson, A.G., Hallett, S.H., 2018. Opening up the coast. Ocean Coast Manag. 160. https://doi.org/10.1016/j.ocecoaman.2018.04.015.
Rumson, A.G., Hallett, S.H., 2019. Innovations in the use of data facilitating insurance as a resilience mechanism for coastal flood risk. Sci. Total Environ. 661, 598–612. https://doi.org/10.1016/j.scitotenv.2019.01.114.
Rumson, A.G., Hallett, S.H., Brewer, T.R., 2017. Coastal risk adaptation: the potential role of accessible geospatial Big Data. Mar. Policy 83, 100–110. https://doi.org/10 .1016/j.marpol.2017.05.032.
Rumson, A.G., Hallett, S.H., Brewer, T.R., 2019. The application of data innovations to geomorphological impact analyses in coastal areas: an East Anglia, UK, case study. Ocean Coast Manag. 104875. https://doi.org/10.1016/j.ocecoaman.2019.104875.
Schultz, M.T., Smith, E.R., 2016. Assessing the resilience of coastal systems: a probabilistic approach. J. Coast. Res. 321, 1032–1050. https://doi.org/10.2112/JCO ASTRES-D-15-00170.1.
SmartBay, 2017. Ireland [WWW Document]. URL. http://www.smartbay.ie/, 5, 15, 2017.
Smit, B., Wandel, J., 2006. Adaptation, adaptive capacity and vulnerability. Glob. Environ. Chang. 16, 282–292. https://doi.org/10.1016/j.gloenvcha.2006.03.008.
Smith, L., Liang, Q., James, P., Lin, W., 2017. Assessing the utility of social media as a data source for flood risk management using a real-time modelling framework. J. Flood Risk Manag. 10, 370–380. https://doi.org/10.1111/jfr3.12154.
Song, K., You, S., Chon, J., 2018. Simulation modeling for a resilience improvement plan for natural disasters in a coastal area. Environ. Pollut. 242, 1970–1980. https://doi. org/10.1016/j.envpol.2018.07.057.
Stockholm Resilience Centre Stockholm University, 2015. What is resilience [WWW Document]. URL. https://www.stockholmresilience.org/research/research-news /2015-02-19-what-is-resilience.html. (Accessed 11 November 2018).
A.G. Rumson et al.

Ocean and Coastal Management 185 (2020) 105004
27
Surminski, S., Oramas-Dorta, D., 2014. Flood insurance schemes and climate adaptation in developing countries. Int. J. Disaster Risk Reduct. 7, 154–164. https://doi.org/10 .1016/j.ijdrr.2013.10.005.
Szewra�nski, S., �Swiąder, M., Kazak, J.K., Tokarczyk-Dorociak, K., van Hoof, J., 2018. Socio-environmental vulnerability mapping for environmental and flood resilience assessment: the case of ageing and poverty in the city of Wrocław, Poland. Integr. Environ. Assess. Manag. 14, 592–597. https://doi.org/10.1002/ieam.4077.
Twigger-ross, C., Orr, P., Brooks, K., Sadauskis, R., Deeming, H., Fielding, J., Harries, T., Johnston, R., Kashefi, E., McCarthy, S., Rees, Y., Tapsell, S., 2015. Flood Resilience Community Pathfinder Evaluation 932.
University College London, n.d. DataShine: census [WWW Document]. URL http: //datashine.org.uk/(accessed 3.17.2017).
van Dongeren, A., Ciavola, P., Martinez, G., Viavattene, C., Bogaard, T., Ferreira, O., Higgins, R., McCall, R., 2018. Introduction to RISC-KIT: resilience-increasing strategies for coasts. Coast. Eng. 134, 2–9. https://doi.org/10.1016/j.coastaleng.20 17.10.007.
Viavattene, C., Jim�enez, J.A., Ferreira, O., Priest, S., Owen, D., McCall, R., 2018. Selecting coastal hotspots to storm impacts at the regional scale: a Coastal Risk Assessment framework. Coast. Eng. 134, 33–47. https://doi.org/10.1016/j.coasta leng.2017.09.002.
Vikolainen, V., Flikweert, J., Bressers, H., Lulofs, K., 2017. Governance context for coastal innovations in England: the case of sandscaping in North Norfolk. Ocean Coast Manag. 145, 82–93. https://doi.org/10.1016/j.ocecoaman.2017.05.012.
Villatoro, M., Silva, R., M�endez, F.J., Zanuttigh, B., Pan, S., Trifonova, E., Losada, I.J., Izaguirre, C., Simmonds, D., Reeve, D.E., Mendoza, E., Martinelli, L., Formentin, S. M., Galiatsatou, P., Eftimova, P., 2014. An approach to assess flooding and erosion risk for open beaches in a changing climate. Coast. Eng. 87, 50–76. https://doi. org/10.1016/j.coastaleng.2013.11.009.
Wadey, M.P., Cope, S.N., Nicholls, R.J., McHugh, K., Grewcock, G., Mason, T., 2015. Coastal flood analysis and visualisation for a small town. Ocean Coast Manag. 116, 237–247. https://doi.org/10.1016/j.ocecoaman.2015.07.028.
Walsh, T., Layton, T., Wanik, D., Mellor, J., 2018. Agent based model to estimate time to restoration of storm-induced power outages. Infrastructure 3, 33. https://doi.org/1 0.3390/infrastructures3030033.
Wang, R., 2018. Big data of urban Flooding : dance with social media , citizen science , and artificial intelligence. In: 20th EGU General Assembly, EGU2018, Proceedings from the Conference, p. 404.
Wang, R.Q., Mao, H., Wang, Y., Rae, C., Shaw, W., 2018. Hyper-resolution monitoring of urban flooding with social media and crowdsourcing data. Comput. Geosci. 111, 139–147. https://doi.org/10.1016/j.cageo.2017.11.008.
Williams, R., 2012. DEMs of difference. Geomorphol. Tech. 2, 1–17. https://doi.org/10 .1016/j.ympev.2009.06.014.
Williams, J.G., Rosser, N.J., Hardy, R.J., Brain, M.J., Afana, A.A., 2018. Optimising 4-D surface change detection: an approach for capturing rockfall magnitude–frequency. Earth Surf. Dyn. 6, 101–119. https://doi.org/10.5194/esurf-6-101-2018.
Word Bank, 2017. Coastal Resilience Assessment. http://documents.worldbank.org/c urated/en/684611538551863364/pdf/Suriname-Coastal-Resilience-Assessment-Fe b-9-Low-Res.pdf.
Yang, L.E., Scheffran, J., Süsser, D., Dawson, R., Chen, Y.D., 2018. Assessment of flood losses with household responses: agent-based simulation in an urban catchment area. Environ. Model. Assess. 1–20. https://doi.org/10.1007/s10666-018-9597-3.
Young, A.P., 2018. Decadal-scale coastal cliff retreat in southern and central California. Geomorphology 300, 164–175. https://doi.org/10.1016/j.geomorph.2017.10.010.
Zanuttigh, B., Simcic, D., Bagli, S., Bozzeda, F., Pietrantoni, L., Zagonari, F., Hoggart, S., Nicholls, R.J., 2014. THESEUS decision support system for coastal risk management. Coast. Eng. 87, 218–239. https://doi.org/10.1016/j.coastaleng.2013.11.013.
Zhang, X., Song, J., Peng, J., Wu, J., 2019. Landslides-oriented urban disaster resilience assessment—a case study in ShenZhen, China. Sci. Total Environ. 661, 95–106. https://doi.org/10.1016/j.scitotenv.2018.12.074.
A.G. Rumson et al.