occurrence of nitrate and pesticides in ground water beneath three
TRANSCRIPT
OCCURRENCE OF NITRATE AND PESTICIDES IN GROUND WATER BENEATH THREE AGRICULTURAL LAND-USE SETTINGS IN THE EASTERN SAN JOAQUIN VALLEY, CALIFORNIA, 1993-1995
By Karen R. Burow, Jennifer L. Shelton, andNell M. Dubrovsky
U.S. GEOLOGICAL SURVEY
Water-Resources Investigations Report 97-4284
NATIONAL WATER-QUALITY ASSESSMENT PROGRAM
Sacramento, California 1998

U.S. DEPARTMENT OF THE INTERIOR
BRUCE BABBITT, Secretary
U.S. GEOLOGICAL SURVEY
Thomas J. Casadevall, Acting Director
The use of firm, trade, and brand names in this report is for identification purposes only and does not constitute endorsement by the U.S. Geological Survey
For additional information write to:
District ChiefU.S. Geological SurveyWater Resources DivisionPlacer Hall6000 J StreetSacramento, CA 95819-6129
Copies of this report can be purchased from:
U.S. Geological Survey Information Services Box 25286 Federal Center Denver, CO 80225

FOREWORD
The mission of the U.S. Geological Survey (USGS) is to assess the quantity and quality of the earth resources of the Nation and to provide informa tion that will assist resource managers and policy mak ers at Federal, State, and local levels in making sound decisions. Assessment of water-quality conditions and trends is an important part of this overall mission.
One of the greatest challenges faced by water- resources scientists is acquiring reliable information that will guide the use and protection of the Nation's water resources. That challenge is being addressed by Federal, State, interstate, and local water-resource agencies and by many academic institutions. These organizations are collecting water-quality data for a host of purposes that include: compliance with permits and water-supply standards; development of remedia tion plans for specific contamination problems; opera tional decisions on industrial, wastewater, or water- supply facilities; and research on factors that affect water quality. An additional need for water-quality information is to provide a basis on which regional- and national-level policy decisions can be based. Wise decisions must be based on sound information. As a society we need to know whether certain types of water-quality problems are isolated or ubiquitous, whether there are significant differences in conditions among regions, whether the conditions are changing over time, and why these conditions change from place to place and over time. The information can be used to help determine the efficacy of existing water- quality policies and to help analysts determine the need for and likely consequences of new policies.
To address these needs, the U.S. Congress appropri ated funds in 1986 for the USGS to begin a pilot pro gram in seven project areas to develop and refine the National Water-Quality Assessment (NAWQA) Pro gram. In 1991, the USGS began full implementation of the program. The NAWQA Program builds upon an existing base of water-quality studies of the USGS, as well as those of other Federal, State, and local agencies. The objectives of the NAWQA Program are to:
Describe current water-quality conditions for a large part of the Nation's freshwater streams, rivers, and aquifers.
Describe how water quality is changing over time.
Improve understanding of the primary natural and human factors that affect water-quality conditions.
This information will help support the development and evaluation of management, regulatory, and moni toring decisions by other Federal, State, and local agencies to protect, use, and enhance water resources.
The goals of the NAWQA Program are being achieved through ongoing and proposed investigations of 60 of the Nation's most important river basins and aquifer systems, which are referred to as study units. These study units are distributed throughout the Nation and cover a diversity of hydrogeologic settings. More than two-thirds of the Nation's freshwater use occurs within the 60 study units and more than two- thirds of the people served by public water-supply sys tems live within their boundaries.
National synthesis of data analysis, based on aggregation of comparable information obtained from the study units, is a major component of the program. This effort focuses on selected water-quality topics using nationally consistent information. Comparative studies will explain differences and similarities in observed water-quality conditions among study areas and will identify changes and trends and their causes. The first topics addressed by the national synthesis are pesticides, nutrients, volatile organic compounds, and aquatic biology. Discussions on these and other water- quality topics will be published in periodic summaries of the quality of the Nation's ground and surface water as the information becomes available.
This report is an element of the comprehensive body of information developed as part of the NAWQA Program. The program depends heavily on the advice, cooperation, and information from many Federal, State, interstate, Tribal, and local agencies and the public. The assistance and suggestions of all are greatly appreciated.
Robert M. Hirsch Chief Hydrologist


CONTENTS
Abstract .....................................................................................................................................................................^ 1Introduction ................................................................................. 2
Purpose and Scope...................................................................................................................................................... 4Description of the Study Unit .................................................................................................................................... 4Acknowledgments ..................................................................................................................................................... 5
Study Design and Methods ................................................................................................................................................. 5Land-Use Selection .................................................................................................................................................... 5Domestic Well Network ............................................................................................................................................ 6Monitoring-Well Pairs ............................................................................................................................................... 8Water-Quality Data Collection and Analysis ............................................................................................................ 8Quality Control Data .................................................................................................................................................. 9
Nitrate ............................................................................................................................................................^ 9Pesticides .......................................................................................................................................................... 9Volatile Organic Compounds ........................................................................................................................... 12
Determination of Local-Scale Nitrogen Applications ............................................................................................... 13Determination of Hydrogeologic and Well-Construction Variables ......................................................................... 14Statistical Methods..................................................................................................................................................... 14
Occurrence of Nitrate .......................................................................................................................................................... 15Nitrate Concentrations ............................................................................................................................................... 15Sources of Nitrate ...................................................................................................................................................... 15Physical and Chemical Factors Related to Occurrence of Nitrate ............................................................................. 17
Hydrogeology and Well Construction .............................................................................................................. 18Water Chemistry .............................................................................................................................................. 20
Occurrence of Pesticides ..................................................................................................................................................... 24Pesticides Detected at Each Land-Use Setting .......................................................................................................... 24Pesticide Use .............................................................................................................................................................. 27Physical and Chemical Factors Related to Occurrence of Pesticides ........................................................................ 31
Hydrogeology and Well Construction .............................................................................................................. 31Water Chemistry .............................................................................................................................................. 32
Comparison of NAWQA Results to Historical Data for Citrus Crops....................................................................... 33Relations Between Dissolved Constituents and Physical Variables ................................................................................... 35
Relation Between Nitrate and Pesticides ................................................................................................................... 35Multivariate Analysis of Physical and Chemical Factors .......................................................................................... 35
Comparison of Domestic and Monitoring Well Results ..................................................................................................... 37Nitrate Concentrations ............................................................................................................................................... 39Pesticide Detections ................................................................................................................................................... 39
Summary and Conclusions .................................................................................................................................................. 44References ........................................................................................................................................................................... 47
Contents

FIGURES
1. Map showing study area and San Joaquin Valley physiographic regions............................................................ 32. Maps showing well networks within the three land-use settings, eastern San Joaquin Valley, California ......... 73. Graph showing normal probability of nitrate concentrations in ground-water samples from domestic wells
in the three land-use settings, eastern San Joaquin Valley, California ................................................................ 164. Graph showing nitrate concentration and estimated local-scale nitrogen applications around each well in each
of the three land-use settings, eastern San Joaquin Valley, California ................................................................ 185. Piper diagram showing major ion composition of ground-water samples collected from domestic wells
in the three land-use settings, eastern San Joaquin Valley, California ................................................................ 216. Graph showing relation between nitrate concentration and specific conductance in ground-water samples
collected from domestic wells in the three land-use settings, eastern San Joaquin Valley, California .............. 237. Bar chart showing number of domestic wells in each land-use setting affected by pesticides,
eastern San Joaquin Valley, California................................................................................................................. 258. Bar chart showing number of detections of selected pesticides in ground-water samples collected from
domestic wells in the three land-use settings, eastern San Joaquin Valley, California ....................................... 279.-11. Graphs showing:
9. Relation between the number of pesticide detections and depth-to-water in domestic wells in thethree land-use settings, eastern San Joaquin Valley, California .................................................................... 32
10. Variable scores for each ground-water sample collected from domestic wells in the three land-use settings for principal components I and II, eastern San Joaquin Valley, California .................................................. 38
11. Nitrate concentrations in paired ground-water samples collected from domestic wells in thethree land-use settings, eastern San Joaquin Valley, California .................................................................... 43
TABLES
1. Pesticides analyzed in ground-water samples collected from domestic wells in the three land-use settingsduring 1993-1995, eastern San Joaquin Valley, California.................................................................................. 10
2. Volatile organic compounds analyzed in ground-water samples collected from domestic wells in thethree land-use settings during 1993-1995, eastern San Joaquin Valley, California............................................. 11
3. Nitrate concentrations in ground-water samples collected from domestic wells in thethree land-use settings, eastern San Joaquin Valley, California........................................................................... 16
4. Physical characteristics of sediment texture and sampled domestic wells in thethree land-use settings, eastern San Joaquin Valley, California........................................................................... 19
5. Selected water chemistry characteristics of ground-water samples collected fromdomestic wells in the three land-use settings, eastern San Joaquin Valley, California........................................ 22
6. Pesticides detected in ground-water samples collected from domestic wells in thethree land-use settings, eastern San Joaquin Valley, California........................................................................... 26
7. Pesticides applied in the eastern alluvial fan physiographic region, San Joaquin Valley, California, 1993 ....... 288. Herbicide detections in the citrus, vineyard, almond, and corn, alfalfa, and vegetable
land-use settings, eastern San Joaquin Valley, California.................................................................................... 349. Correlation of variables with the first four principal components for ground-water samples collected from
domestic wells in the three land-use settings, eastern San Joaquin Valley, California........................................ 3710. Hydrologic and well construction data from domestic and monitoring wells in the
three land-use settings, eastern San Joaquin Valley, California........................................................................... 4011. Nitrate and pesticide concentrations in ground-water samples collected from domestic and monitoring wells
in the three land-use settings, eastern San Joaquin Valley, California................................................................. 4112. Number of pesticide detections in ground-water samples collected from domestic and monitoring wells
in the three land-use settings, eastern San Joaquin Valley, California................................................................. 44
vi Contents

CONVERSION FACTORS, VERTICAL DATUM, ABBREVIATIONS, AND ACRONYMS
Multiply By To obtain
acrefoot, feet (ft)
gallon (gal)inch (in.)mile (mi)
square mile (mi2)pound, avoirdupois (Ib)pound per acre (Ib/acre)
4,0470.30483.7852.541.60932.5900.453591.12
square meter (m2)meter (m)liter (L)centimeter (cm)kilometer (km)
f\
square kilometer (km )kilogram (kg)kilogram per hectare (kg/ha)
Temperature is given in degrees Celsius (°C) which can be converted to degrees Fahrenheit (°F) by the following equation: °F = (1.8 x °C) + 32
Vertical Datum
Sea level: In this report, "sea level" refers to the National Geodetic Vertical Datum of 1929 a geodetic datum derived from a general adjustment of the first-order level nets of both the United States and Canada, formerly called Sea Level Datum of 1929.
Abbreviations:
lb a.L, pound active ingredientIb/yr, pound per yearL, litermg/L, milligram per litermL, milliliterpCi/L, picocurie per literHg/L, microgram per literUrn, micrometer
Acronyms:
a, significance levelCDPR, California Department of Pesticide RegulationDBCP, 1,2-dibromo-3-chloropropaneDCPA (dacthal), terephthalic acid, tetra chloro-, dimethyl esterDNOC, 4,6-dinitro-o-cresolDWR, California Department of Water ResourcesEDB, ethylene dibromide, or 1,2-dibromoethaneGC/ECD, gas chromatography/electron-capture detectionGC/MS, gas chromatography/mass spectrometryGIRAS, Geographic Information Retrieval and Analysis SystemGIS, Geographic Information SystemGWSI, Ground Water Site InventoryHPLC, high performance liquid chromatographyMCL, maximum contaminant levelMCPB, 4-(4-chloro-2-methylphenoxy) butanoic acidMTBE, methyl tert-butyl etherNAWQA, National Water-Quality AssessmentNWQL, National Water Quality LaboratoryPT GC/MS, purge and trap gas chromatography/mass spectrometryPVC, polyvinyl chlorideQC, quality controlSTATSGO, State Soil Geographic Data BaseUSGS, U.S. Geological SurveyVOC, volatile organic compound
Contents vii

OCCURRENCE OF NITRATE AND PESTICIDES IN GROUND WATER BENEATH THREE AGRICULTURAL LAND-USE SETTINGS IN THE EASTERN SAN JOAQUIN VALLEY, CALIFORNIA, 1993-1995
By Karen R. Burow, Jennifer L Shelton, andNe\\ M. Dubrovsky
Abstract
The processes that affect nitrate and pesticide occurrence may be better understood by relating ground-water quality to natural and human factors in the context of distinct, regionally extensive, land-use settings. This study assesses nitrate and pesticide occurrence in ground water beneath three agricultural land-use settings in the eastern San Joaquin Valley, California. Water samples were collected from 60 domestic wells in vineyard, almond, and a crop grouping of corn, alfalfa, and vegetable land-use settings. Each well was sampled once during 1993-1995. This study is one element of the U.S. Geological Survey's National Water-Quality Assessment Program, which is designed to assess the status of, and trends in, the quality of the nation's ground- and surface-water resources and to link the status and trends with an understanding of the natural and human factors that affect the quality of water.
The concentrations and occurrence of nitrate and pesticides in ground-water samples from domestic wells in the eastern alluvial fan physiographic region were related to differences in chemical applications and to the physical and biogeochemical processes that characterize each of the three land-use settings. Ground water beneath the vineyard and almond land-use settings on the coarse-grained, upper and middle parts of the alluvial fans is more vulnerable to
nonpoint-source agricultural contamination than is the ground water beneath the corn, alfalfa, and vegetable land-use setting on the lower part of the fans, near the basin physiographic region.
Nitrate concentrations ranged from less than 0.05 to 55 milligrams per liter, as nitrogen. Nitrate concentrations were significantly higher in the almond land-use setting than in the vineyard land-use setting, whereas concentrations in the corn, alfalfa, and vegetable land-use setting were intermediate. Nitrate concentrations exceeded the maximum contaminant level in eight samples from the almond land-use setting (40 percent), in seven samples from the corn, alfalfa, and vegetable land-use setting (35 percent), and in three samples from the vineyard land-use setting (15 percent). The physical and chemical characteristics of the vineyard and the almond land-use settings are similar, characterized by coarse-grained sediments and high dissolved- oxygen concentrations, reflecting processes that promote rapid infiltration of water and solutes. The high nitrate concentrations in the almond land-use setting reflect the high amount of nitrogen applications in this setting, whereas the low nitrate concentrations in the vineyard land- use setting reflect relatively low nitrogen applications. In the corn, alfalfa, and vegetable land-use setting, the relatively fine-grained sediments, and low dissolved-oxygen concentrations, reflect processes that result in slow infiltration rates and longer ground-water
Abstract

residence times. The intermediate nitrate concentrations in the corn, alfalfa, and vegetable land-use setting are a result of these physical and chemical characteristics, combined with generally high (but variable) nitrogen applications.
Twenty-three different pesticides were detected in 41 of 60 ground-water samples (68 percent). Eighty percent of the ground-water samples from the vineyard land-use setting had at least one pesticide detection, followed by 70 percent in the almond land-use setting, and 55 percent in the corn, alfalfa, and vegetable land-use setting. All concentrations were less than state or federal maximum contaminant levels (only 5 of the detected pesticides have established maximum contaminant levels) with the exception of l,2-dibromo-3-chloropropane, which exceeded the maximum contaminant level of 0.2 micrograms per liter in 10 ground-water samples from vineyard land-use wells and in 5 ground-water samples from almond land-use wells. Simazine was detected most often, occurring in 50 percent of the ground-water samples from the vineyard land-use wells and in 30 percent of the ground-water samples from the almond and the corn, alfalfa, and vegetable land- use wells. Atrazine (or desethyl atrazine) was detected in 40 percent of ground-water samples from the vineyard and almond land-use wells and in 25 percent of the ground-water samples from the corn, alfalfa, and vegetable land-use wells. Diuron was detected most often in the corn, alfalfa, and vegetable land-use setting (35 percent). The occurrence of simazine, l,2-dibromo-3-chloropropane, and diuron in the three land-use settings was fairly consistent with recent or historical use of these pesticides. The occurrence of atrazine was not directly related to use on these crops; its occurrence may be linked to rights-of-way applications.
Five pairs of monitoring wells were installed near a subset of five domestic wells in each of the three land-use settings to define whether ground-water samples from shallow domestic wells were representative of recently recharged ground water beneath the targeted agricultural land uses. Although the number of
samples is small, the occurrence of nitrate and pesticides was not significantly different (at a significance level of 0.05) between the domestic well ground-water samples and the ground-water samples from shallow monitoring wells screened near the water table. Nitrate concentrations were significantly higher in the ground-water samples from the domestic wells than in the samples from monitoring wells screened at the same depth. Conversely, simazine and l,2-dibromo-3- chloropropane concentrations appeared to be higher in ground-water samples from these monitoring wells, though the sample size was too small to evaluate statistically.
INTRODUCTION
Ground water is the principal source of drinking water and a significant source of agricultural supply in the San Joaquin-Tulare Basins of the San Joaquin Valley of California (fig. 1). Most of the population and 96 percent of the ground-water use in 1988 within the San Joaquin Basin (north) and the hydrologically closed Tulare Basin (south) is in the eastern alluvial fan physiographic region (Fred Stumpf, California Department of Water Resources, written commun., 1990). This area has been intensively farmed and irrigated since the early 1900s. The large quantity of fertilizers and pesticides used and the generally permeable soils has resulted in a history of problems with ground-water contamination from nitrate and pesticides (Page and LeBlanc, 1969; Cohen, 1986; Troiano and Segawa, 1987; Anton and others, 1988; Domagalski and Dubrovsky, 1991; Miller and others, 1994; Pease and others, 1995).
Nitrate concentrations have increased over time in the San Joaquin Valley (Nightingale, 1970; Schmidt, 1972; Madison and Brunett, 1985; Lowry, 1987; Anton and others, 1988). In agricultural areas, such as the San Joaquin Valley, nitrate concentrations in ground water are greatly influenced by the use of nitrogen fertilizers (Nightingale, 1972; Owens and others, 1992). Nitrogen fertilizer use generally has increased since the 1950s (Alexander and Smith, 1990), though nitrate occurrence is also linked to other sources of nitrogen, such as confined animal feeding operations, rural septic systems, and other combined factors attributed to land use (Behnke and Haskell, 1968; Schmidt, 1972; Lowry, 1987; Davis, 1995;
Nitrate and Pesticides in Ground Water Beneath Three Agricultural Land-Use Settings, Eastern San Joaquin Valley

38
EXPLANATION
San Joaquin Valley Physiographic Regions:
[ I Eastern alluvial fansI I Western alluvial fansI | Basin
30 MILES
0 10 20 30 KILOMETERS
San Joaquin-TulareBasins
Study Unit
;field
Figure 1. Study area and San Joaquin Valley physiographic regions (Gronberg and others, 1998). The study area is the eastern alluvial fans physiographic region.
Introduction

MacLeod and others, 1995; Mueller and others, 1995; Vowinkel and Tapper, 1995).
Pesticides are widely used to control weeds, insects, and other organisms in agricultural and nonagricultural settings. Concern about pesticide contamination of ground water increased in the late 1970s following the detection of l,2-dibromo-3- chloropropane (DBCP) and aldicarb in several states (Cohen, 1990). Since then, at least 143 pesticides and 21 of their transformation products have been detected in ground water in more than 43 states (Barbash and Resek, 1996). In California, frequently detected pesticides include DBCP, 1,2-dibromoethane (EDB), 1,2-dichloropropane, 1,3-dichloropropene, simazine, atrazine, diuron, bromacil, and diazinon (Cohen, 1986; Domagalski and Dubrovsky, 1991; Miller and others, 1994; Pease and others, 1995). The state of California has implemented pesticide monitoring programs designed to assess and modify pesticide use in areas that are vulnerable to pesticide contamination in ground water. DBCP was banned from agricultural use in California in 1977, and EDB and 1,2- dichloropropane were banned in the early 1980s because of their presence in drinking water supply wells at concentrations exceeding the U.S. Environmental Protection Agency maximum contaminant level (MCL) or state action level (Mackay and Smith, 1990). Concentrations of most pesticides in ground water do not exceed drinking water standards (Barbash and Resek, 1996); however, the cumulative long-term effect on regional water quality is unknown, and the widespread, diffuse nature of the problem makes it difficult to address.
There have been numerous studies focusing on the distribution of nitrate and pesticides and the investigation of factors related to observed concentrations, but nitrate and pesticides have not been studied previously in the context of regionally extensive agricultural land-use settings in the eastern alluvial fan region of the San Joaquin Valley. The purpose of this study was to assess the quality of recently recharged ground water beneath regionally extensive combinations of land use and hydrogeologic conditions in the eastern alluvial fan region and to evaluate the factors in each land-use setting that affect ground-water quality. This study is part of the U.S. Geological Survey (USGS) National Water-Quality Assessment (NAWQA) Program ground-water studies in the San Joaquin-Tulare Basins. The NAWQA Program was designed to assess the status of, and
trends in the quality of the nation's ground- and surface-water resources, and to link the status and trends with an understanding of the natural and human factors that affect the quality of water (Gilliom and others, 1995).
Purpose and Scope
This report presents the results of analyses of nitrate and pesticides in shallow ground water beneath three agricultural land-use settings and relates the observed concentrations to various chemical, physical, and biological factors to better understand the processes that affect the occurrence of these compounds. During 1993-1995, ground-water samples were collected from domestic wells in three agricultural land-use settings: (1) vineyard, (2) almond, and (3) a crop grouping of corn, alfalfa, and vegetables. Ground-water samples also were collected from monitoring wells that were installed near some of the sampled domestic wells to evaluate the differences between samples from the domestic wells and monitoring wells.
In addition to a comparison between nitrate and pesticide concentrations and occurrence in the three land-use settings, other factors were evaluated in relation to nitrate and pesticide concentrations, including nitrogen sources (fertilizer and animal waste) and pesticide use; overall vulnerability to contamination, as indicated by characteristics such as depth-to-water, well depth, soils, and alluvial sediment texture; and biogeochemical processes, as indicated by water chemistry characteristics. The occurrence of selected herbicides in each of the three land-use settings also were compared to results from an earlier study of herbicides beneath citrus crops by the California Department of Pesticide Regulation (CDPR) (Troiano and Segawa, 1987).
Description of the Study Unit
The San Joaquin-Tulare Basins NAWQA Study Unit covers about 31,250 mi2 in central California (fig. 1). The San Joaquin Valley is a flat, structural trough filled with thousands of feet of sediment derived from the Sierra Nevada to the east and the Coast Ranges to the west. The sediments are composed of interlayered lenses of gravel, sand, silt, and clay (Dale and others, 1966; Croft and Gordon, 1968; Page and LeBlanc, 1969; Hotchkiss and Balding, 1971; Miller and others,
4 Nitrate and Pesticides in Ground Water Beneath Three Agricultural Land-Use Settings, Eastern San Joaquin Valley

1971; Bull, 1964a,b, 1972; Page, 1986; Laudon and Belitz, 1991).
There are three physiographic regions within the San Joaquin Valley (fig. 1): the western alluvial fan, the eastern alluvial fan, and the basin (Gronberg and others, 1998). Alluvial fan deposits on both sides of the valley are composed of predominantly coarse grained sediments near the head of each fan that become finer toward the valley trough. The sediments in the eastern alluvial fan region generally are more permeable than those of the western alluvial fan region because of the difference in source rocks and the size of the watersheds drained by the streams and rivers. The sediments in the eastern alluvial fan region were derived from the Sierra Nevada and were deposited by fluvial processes. These sediments have a low organic content, and consist of weathered granitic rocks with smaller amounts of metasedimentary and metavolcanic rocks. These Sierra Nevada sediments interfinger in the basin with the sediments derived from the Coast Ranges. The sediments in the western alluvial fan region generally are poorly sorted sediments derived from metamorphosed marine sedimentary rocks with lesser amounts of continental sedimentary and volcanic rocks, typically deposited by debris flows. The basin region is composed of continental (shallow) and marine (deeper) sediments that are overlain by fine-grained, moderately to densely compacted clays. These low permeability deposits restrict the downward movement of water. Prior to the development of the ground-water resource, ground water generally was recharged in the coarse grained, upper alluvial fan sediments along the edge of the valley. Ground water flowed toward the axis of the valley where it discharged in the basin region as evapotranspiration and to streams. Although the natural ground-water recharge and discharge areas have been disrupted by pumping for irrigation and public supply, regional ground-water movement is still toward the axis of the valley.
The chemistry of the ground water in the upper alluvial fan sediments has been influenced by the source of the water entering the ground-water system by natural recharge (Bertoldi and others, 1991). In the eastern alluvial fan region, recharge from precipitation is small compared to recharge from irrigation (derived from both surface and ground water), especially in the southern part of the region where annual rainfall averages less than 5 in. (Rantz, 1969). The concentration of dissolved solids in the shallow
ground water in this area is generally low to moderate, commonly less than 500 mg/L. The dominant anion is bicarbonate, with lesser amounts of chloride and sulfate. Cation concentrations are typically higher in calcium and sodium than in magnesium. In contrast, shallow ground water in the basin region is influenced by an increase in reducing conditions and by cation exchange processes as the water moves through the sediments (Bertoldi and others, 1991), as reflected by high dissolved-solids, chloride, and sulfate concentrations and by low dissolved-oxygen concentrations (Davis and others, 1959).
To focus on water quality differences between land-use settings, the study was confined to a contiguous area within the northern part of the eastern alluvial fan region that has similar sediment types, ground-water chemistry, and agricultural management practices. However, as discussed later in this report, the sediment types and ground-water chemistry within the eastern alluvial fan region, but near the basin region, are commonly characteristic of the basin region because the boundary between the regions is transitional. The southern part of the eastern alluvial fan region (Kern County; fig. 1) was not included in this study because, compared to the northern part, the depth-to-water generally was much greater, the farms were typically much larger, and few domestic wells existed that fit the criteria for well selection.
Acknowledgments
This study could not have been completed without the cooperation of landowners in the eastern San Joaquin Valley who allowed USGS access to their property. The California Department of Water Resources, the California Department of Pesticide Regulation (CDPR), various county health departments, and local irrigation districts also provided data in a wide variety of spatial scales and other services needed to complete this investigation.
STUDY DESIGN AND METHODS
Land-Use Selection
NAWQA Program goals require the use of a consistent classification of land use to facilitate aggregation of water-quality data at a national scale (Gilliom and others, 1995). In the national-scale
Study Design and Methods

classification, the general land-use distribution information from Geographic Information Retrieval and Analysis System (GIRAS) land image data was combined with crop pattern information from the county agricultural statistics and Anderson level II land-use data categories (Gilliom and Thelin, 1997). Two separate classifications were developed, one for row crops and another for orchards, vineyards, and nurseries. The GIRAS land-use data were used to locate agricultural land within each county, whereas the actual classification of agricultural land in each county was determined from census data on crop distribution. The areal extent of the harvested crops in each county was divided by the appropriate major land-use classification, total row-crop area or total orchard, vineyard, and nursery area. The land-use classification system was further refined to include combinations of one to three crops that accounted for 50 percent or more of harvested acreage in a county. In the San Joaquin-Tulare Basins study unit, five predominant agricultural land uses were identified using this approach: (1) vineyards, (2) almonds, (3) a crop grouping of corn, alfalfa, and vegetables, (4) citrus and vineyards, and (5) cotton.
Local-scale land-use information was then compiled and a detailed, field-verified network of land-use data was created for the entire San Joaquin Valley. County-level land-use maps were obtained from the California Department of Water Resources (DWR) (California Department of Water Resources, 1971) in various forms and compiled into a Geographic Information System land-use coverage a computer system capable of assembling, storing, manipulating, and displaying geographically referenced information. The most recent land-use data (1984-1993) for each county were used to determine the acreages of land use within the study area.
Three agricultural land-use settings were selected from the five NAWQA targeted land-use categories: (1) vineyards, (2) almonds, and (3) the crop grouping of corn, alfalfa, and vegetables (fig. 2). Of the 2,815,983 acres of agricultural land in the eastern alluvial fan region, vineyards cover 528,856 acres (19 percent), almond orchards cover 314,359 acres (11 percent), and corn, alfalfa, and vegetables cover 474,294 acres (17 percent). Together, these three land-use settings account for 47 percent of the agricultural land in the eastern alluvial fan region and for about 67 percent of the total ground-water use in the San Joaquin-Tulare Basins (Fred Stumpf,
California Department of Water Resources, written commun., 1990). Previous studies of the citrus land- use setting by the CDPR (Troiano and Segawa, 1987) and in the cotton land-use setting by the USGS (Domagalski and Dubrovsky, 1991), and the inclusion of cotton as a rotated crop in the corn, alfalfa, and vegetable crop category, led to the elimination of these two nationally targeted crops from the eastern San Joaquin Valley investigation.
Domestic Well Network
A random distribution of 20 domestic wells within each land-use setting were selected for sampling using NAWQA protocols and procedures as a guide (Lapham and others, 1995). The random distribution (fig. 2) was designed to minimize spatial bias in the data set. Domestic wells, rather than irrigation or public-supply wells, were sampled because domestic wells are generally shallower than irrigation or public-supply wells and, therefore, may represent recently recharged ground water. Additionally, most of the irrigation wells had oil- lubricated turbine pumps that could be a source of contamination, and ground-water samples from irrigation and public-supply wells would more likely represent a mixture of water over a larger volume of aquifer than would samples from domestic wells. Irrigation and public-supply wells typically have longer screened intervals than domestic wells, and irrigation and public-supply wells typically pump water at a much higher rate than domestic wells (Alley, 1993).
A computerized selection process was used to divide each digital land-use coverage into 20 equal- area parts or "cells" of the targeted crop (Scott, 1990; fig. 2). Using the equal-area cells as a guide to location, domestic wells were selected using criteria designed to obtain ground-water samples that best represented shallow ground-water quality underlying each land use to minimize the effects of factors unrelated to the targeted land-use setting. The criteria were (1) that wells be surrounded by at least 50 percent of the targeted land use within a 0.25-mi radius, (2) that wells be located in areas where the targeted crops had been cultivated for at least 10 years, (3) the top of the well screen be less than 150 ft below the water table, (4) that wells be downgradient from the targeted land-use setting (as determined from regional ground-water elevation maps; California
Nitrate and Pesticides in Ground Water Beneath Three Agricultural Land-Use Settings, Eastern San Joaquin Valley

Vin
eyar
dA
lmon
dC
orn,
Alfa
lfa,
and
Veg
etab
le
(fl to a.
0
EX
PLA
NA
TIO
N 3
6°
Hi
Targ
eted
land
use
D
omes
tic w
ell
o D
omes
tic w
ell w
ith
nest
ed m
onito
ring
wel
ls.
~ E
qual
-are
a ce
ll bo
unda
ry
20
40 M
ILE
S
119°
35'
0 20
40
KIL
OM
ET
ER
S
Figu
re 2
. Wel
l net
wor
ks w
ithin
the
thre
e la
nd-u
se s
ettin
gs, e
aste
rn S
an J
oaqu
in V
alle
y, C
alifo
rnia
. Num
bers
poi
ntin
g to
ope
n ci
rcle
s re
fer t
o si
te n
umbe
rs w
here
bot
h do
mes
tic a
nd m
onito
ring
wel
ls w
ere
sam
pled
. The
equ
al-a
rea
cell
boun
darie
s de
linea
te e
qual
are
as o
f eac
h ta
rget
ed c
rop.
Department of Water Resources, 1990a,b), and (5) that wells have submersible pumps. Additionally, wells were selected that were established in the USGS Ground Water Site Inventory database or from DWR drillers' log records. Wells were further prioritized for selection on the basis of additional characteristics. Wells that were preferentially selected were the shallowest wells, wells with the shortest screened intervals, and wells installed with surface seals. An attempt was made to select one well from each equal- area cell. When no suitable wells from these sources were found, other wells were selected at random for sampling. Wells suitable for sampling could not be obtained in every cell because of the limited availability of wells that fit the basic design criteria; therefore, some cells have more than one well.
Monitoring-Well Pairs
In addition to the domestic well network, monitoring-well pairs (30 monitoring wells; 2 moni toring wells each at 15 sites) were installed adjacent to 5 domestic wells from each of the three land-use settings (fig. 2). The monitoring wells were installed as close as possible to the crops adjacent to the domestic wells to determine whether ground-water samples from the domestic wells adequately repre sented the most recently recharged water beneath the targeted agricultural land use. At each site, one monitoring well was installed with the well screen at about the same depth as the domestic well screen, and the other monitoring well was installed with a well screen less than 20 ft below the water table. Wells were constructed using 2-in. polyvinyl chloride casing with 5-ft screens (Lapham and others, 1995). Results of nitrate and pesticide analyses of the ground- water samples were compared between the domestic and monitoring wells to determine whether ground- water samples from domestic wells represented the most recently recharged ground water and whether those samples were affected by factors other than those associated with the targeted land use.
Water-Quality Data Collection and Analysis
Ground-water samples were collected from the 60 domestic wells and the 30 monitoring wells (each well was sampled one time) using protocols developed by the NAWQA Program to minimize contamination during sampling and to promote the collection of
high-quality, consistent ground-water data among NAWQA study units throughout the nation (Koterba and others, 1995). Collection lines were attached to the sampling port that enabled collection of the sample before the water entered the pressure tank to minimize loss of volatile compounds and to reduce the chance of sample contamination from pressure tank liners or other materials that the sample water may contact prior to collection. Ground-water samples from moni toring wells were collected using a Grundfos redi-flow submersible impeller pump. Each well (both moni toring and domestic) was purged of water before the sample was collected until its pH, dissolved oxygen, specific conductance, redox, turbidity, and temper ature became stable. Generally, three casing volumes of water were extracted to ensure that the sample was obtained from ground water in the aquifer and not from water stored in the well. Sample collection, processing, storage, and shipment procedures mini mized changes in water chemistry until the sample could be analyzed in the laboratory. The lines (made of Teflon to minimize cross-contamination from organic compounds) used to collect the samples were attached to the well head with stainless steel fittings, and sample collection and preservation chambers were used to reduce contamination from airborne contaminants.
Ground-water samples were analyzed for a variety of constituents, including nitrate, pesticides, volatile organic compounds (VOCs), major ions, and tritium (Willie Kinsey and Mark Johnson, U.S. Geological Survey, written commun., 1997). Concen trations of nitrate plus nitrite are referred to as nitrate in this report because nitrite concentrations were very low (maximum of 0.1 mg/L), compared to nitrate concentrations, which ranged from 1.4 to 55 mg/L. Nitrite accounted for a maximum of 1.2 percent of the total nitrate plus nitrite concentration in the samples in which nitrite was detected. Most analyses were com pleted at the USGS National Water Quality Laboratory (NWQL); tritium was analyzed at the University of Miami Tritium Laboratory. Nitrate and major ion samples collected in 1993 were filtered using a 0.45-jim cellulose-nitrate plate filter, and 0.45-jim pleated capsule filters were used to filter samples collected in 1994-1995. Standard methods were used to analyze for nitrate and major ions (Fishman and Friedman, 1985). Pesticide samples were filtered using 0.7-jim glass-fiber filters to obtain approximately 1 L of sample for analysis. Two methods were used to
8 Nitrate and Pesticides in Ground Water Beneath Three Agricultural Land-Use Settings, Eastern San Joaquin Valley
analyze for pesticides: 46 compounds were analyzed using C-18 solid-phase extraction and capillary column gas chromatography/mass spectrometry (GC/MS) (Zaugg and others, 1995), and 41 com pounds were analyzed using Carbopak-B solid-phase extraction and high-performance liquid chromato- graphy (HPLC) (Werner and others, 1996). Carbaryl, carbofuran, and linuron were analyzed using both methods (table 1). Samples for a suite of 60 VOCs (table 2) were collected in 40-mL vials that were filled with unfiltered water, preserved with hydrochloric acid, and capped with lids designed to minimize loss from volatilization. The VOC samples were analyzed using purge and trap capillary GC/MS (Rose and Schroeder, 1995). Additional samples were collected for low-level analyses of EDB and DBCP using gas chromatography/electron-capture detection (GC/ECD) (Fishman, 1993). One liter of unfiltered water was collected for tritium samples and analyzed using electrolytic enrichment followed by gas counting (Ann Mullin, U.S. Geological Survey, written commun., 1996).
Quality Control Data
Quality control (QC) samples were collected to evaluate bias and precision in the process of obtaining environmental data. The QC sample results described below were aggregated from this study and from two other NAWQA ground-water studies (Willie Kinsey and Mark Johnson, U.S. Geological Survey, written commun., 1997) that were completed in the San Joaquin Valley during the same time period. The QC samples were collected, preserved, and analyzed using the same methods and equipment as the environmental ground-water samples.
Duplicate ground-water samples were collected to assess the combined effects of field and laboratory procedures on measurement precision. Duplicate samples were collected sequentially. Blank and field matrix spike samples (hereinafter referred to as blanks and spikes) were collected to estimate bias. Blanks were made up of blank solution water (that is, water that is free of the analytes of interest), that is pro cessed, preserved, and analyzed using the same methods used for the environmental sample. Three types of blanks were collected and analyzed: equip ment blanks, field blanks, and trip blanks. Equipment blanks were collected prior to each sampling season to determine whether the sampling equipment is a source
of contamination of the environmental samples. Field blanks were collected immediately following the collection of an environmental sample to determine whether the field cleaning procedure following each sample collection was adequate to prevent cross- contamination between wells and to determine whether the sample was exposed to atmospheric contamination during sampling. Trip blanks were collected in a controlled environment and then transported to the field and submitted to the laboratory with the environmental samples to determine whether samples were contaminated during travel or shipping. Spiked samples are environmental samples fortified in the field with a spike solution containing known concentrations of target analytes.
Nitrate
Twelve pairs of duplicate ground-water samples were analyzed for dissolved nitrate (nitrate plus nitrite, expressed as elemental nitrogen) (Willie Kinsey and Mark Johnson, U.S. Geological Survey, written commun., 1997). Concentrations were identical in 8 of 12 duplicate samples; concentrations were within 0.3 mg/L in 3 of the duplicate samples, and concentrations were within 1 mg/L in 1 pair of samples. The mean relative deviation for all 12 samples was 1.1 percent and the maximum deviation was 7.4 percent. The small relative percent deviation indicates a high degree of precision in the collection, processing, and analysis of the nitrate samples.
Pesticides
Twenty field blanks were analyzed for the GC/MS pesticide analytes: 12 samples were collected at the domestic well sites, and 8 samples were collected at the monitoring well sites. Seventeen field blanks were analyzed for the HPLC pesticide analytes: 10 samples were collected at the domestic well sites, and 7 samples were collected at the monitoring well sites. An equipment blank also was analyzed for both of these methods. No pesticides were detected in any of the blanks, which indicates that the sample collection, processing, and field-cleaning procedures were successful in minimizing environmental sample contamination or carryover of these pesticides.
Twelve spikes were analyzed using the GC/MS method. The mean recovery was high for most of the target analytes (Willie Kinsey and Mark Johnson, U.S. Geological Survey, written commun., 1997). All but 1
Study Design and Methods

Table 1. Pesticides analyzed in ground-water samples collected from domestic wells in the three land-use settings during 1993-1995, eastern San Joaquin Valley, California
[jig/L, microgram per liter]
Pesticides
AlachlorMetolachlor
AldicarbAldicarb sulfoneAldicarb sulfoxideButylateCarbarylCarbofuran
Total number
of samples
6060
595959606060
Method detection
limit(Wi/D
11
2
2
2
1
0.0020.002
0.0160.0160.0210.002
1>20.0031>20.028
Total t. . . number Pesticides . of
samples
AmidsNapropamidePronamide
CarbamatesCarbofuran, 3-hydroxy3EPTCMethiocarbMethomylMolinate1-Napthol3
6060
596059596059
Method detection
limit(\ig/L)
ii
2
1
2
2
1
2
0.0030.003
0.0140.0020.0260.0170.0040.007
Pesticides
PropachlorPropanil
OxamylPebulateProphamPropoxurThiobencarbTriallate
Total number
of samples
6060
596059596060
Method detection
limit(WI/L)
^.007^.(XM
20.01810.00420.03520.035^.002^.001
Chlorophenoxy Herbicides2,4-D (acid)2,4-DBDacthal, mono-acid
BenfluralinEthalfluralin
595959
6060
20.0352
2
1
1
0.0350.017
0.0020.004
Dichlorprop (2,4-DP)MCPAMCPB
DinitroanilinesOryzalinPendimethalin
595959
5960
20.032
220.050.035
20.019i0.004
Silvex (2,4,5-TP)2,4,5-TTriclopyr
Trifluralin
595959
60
20.02120.035
20.05
]0.002
OrganochlorinesChlorothalonilDacthal (DCPA)p,p'-DDE3
596060
20.035110.0020.006
DichlobenilDieldrina-HCH3
596060
20.020110.0010.002
y-HCH 60 ^.(XM
OrganophosphatesAzinphos-methylChlorpyrifosDiazinonDisulfoton
Esfenvalerate
56606060
59
l
11
0.001] 0.050.0020.017
20.019
EthopropFonofosMalathionMethyl parathion
Pyrethroidsds-Permethrin
60606060
60
1111
1
0.0030.0030.0050.006
0.005
ParathionPhorateTerbufos
606060
^0.004] 0.0021 0.013
Triazine HerbicidesAtrazineAtrazine, desethyl
6060
i10.0010.002
CyanazineMetribuzin
6060
110.0040.004
PrometonSimazine
6060
^.OIS^.005
BromacilUracils
59 20.035 Terbacil 56 0.007
10 Nitrate and Pesticides in Ground Water Beneath Three Agricultural Land-Use Settings, Eastern San Joaquin Valley

Table 1. Pesticides analyzed in ground-water samples collected from domestic wells in the three land-use settings during 1993-1995, eastern San Joaquin Valley, California Continued
Pesticides
Diuron
Fenuron
Totalnumber
ofsamples
58
59
Methoddetection .. . .
.. .. Pesticides limit
(ug/L)
Ureas
20.02 Fluometuron
20.013 Linuron
Totalnumber
ofsamples
59
60
Methoddetection
limit(Wl/L)
20.0351>20.018
Pesticides
Neburon
Tebuthiuron
Totalnumber
ofsamples
59
60
Methoddetection
limit(ug/L)
20.015
^.01
MiscellaneousAcifluorfenBentazonBromoxynilChloramben
59595959
20.03520.01420.03520.011
ClopyralidDicamba2,6-DiethylanalineDinoseb
59596059
20.0520.035^.00320.035
DNOCNorflurazonPicloramPropargite
59595960
20.03520.024
20.05kj.OlS
^olid-phase extraction and gas chromatography/mass spectrometry (GC/MS). Solid-phase extraction and high performance, liquid chromatography (HPLC).
^Transformation product.
Table 2. Volatile organic compounds analyzed in ground-water samples collected from domestic wells in the three land-use settings during 1993-1995, eastern San Joaquin Valley, California
[Unless otherwise noted, total number of samples for each compound listed is 60, and the method reporting limit is 0.2 micrograms per liter; purge and trap capillary gas chromatography/mass spectrometry, PT GC/MS, method of analysis used]
Compound Compound Compound
BenzeneBromobenzeneBromochloromethane
BromodichloromethaneBromomethanen-Butylbenzenesec-E utylbenzenetert-ButylbenzeneChlorobenzeneChlorodibromomethaneChloroethaneChloroetheneChloromethane2-Chlorotoluene4-Chlorotoluene1,2-Dibromo-3-chloropropane (DBCP) 11,2-Dibromoethane (EDB)2Dibromomethane1,2-Dichlorobenzene1,3 -Dichlorobenzene
1,4-Dichlorobenzene 1,1 -Dichloroethane 1,2-Dichloroethane 1,1 -Dichloroethene cis- 1,2-Dichloroethene tram- 1,2-Dichloroethene Dichlorodifluoromethane Dichloromethane 1,2-Dichloropropane 1,3 -Dichloropropene 2,2-Dichloropropane 1,1 -Dichloropropene cis- 1,3-Dichloropropene trans- 1,3-Dichloropropene Dimethylbenzene, total Ethylbenzene Hexachlorobutadiene Isopropylbenzene /?-Isopropyltoluene Methylbenzene
Methyl tert-butyl ether (MTBE)Naphthalenen-PropylbenzeneStyrene1,1,1,2-Tetrachloroethane1,1,2,2-TetrachloroethaneTetrachloroetheneTetrachloromethaneTribromomethane1,2,3 -Trichlorobenzene1,2,4-Trichlorobenzene1,1,1 -Trichloroethane1,1,2-TrichloroethaneTrichloroetheneTrichlorofluoromethaneTrichloromethane1,2,3-Trichloropropane1,1,2-Trichloro-1,2,2-trifluoroethane1,2,4-Trimethylbenzene1,3,5-Trimethylbenzene
Method detection limit is 0.03 micrograms per liter: gas chromatography/electron-capture detection, GC/ECD, method of analysis used. Method detection limit is 0.04 micrograms per liter: gas chromatography/electron-capture detection, GC/ECD, method of analysis used.
Study Design and Methods 11

(desethyl atrazine) of the 46 analytes had mean recovery values greater than 73 percent; the mean recovery for desethyl atrazine was 48 percent. The relative standard deviation of recoveries ranged from 11 to 50 percent. Recovery data for three surrogate analytes indicated that the GC/MS method performance was adequate for most samples. The mean recovery for diazinon-d 10 was 103 percent with a standard deviation of 34 percent. The mean recovery for alpha-HCH-d6 was 94 percent with a standard deviation of 23 percent, and the mean recovery for terbuthylazine was 103 percent with a standard deviation of 22 percent.
NWQL precision and recovery data (Zaugg and others, 1995) also were evaluated to aid in data interpretation. Data on several analytes indicate variable performance and low recoveries; these analytes include desethyl atrazine, dimethoate, methyl azinphos, carbaryl, carbofuran, and terbacil. Dimethoate was deleted from the method in 1994 because of poor performance; dimethoate results for ground-water samples collected prior to this time are not presented in this report. Because the concentrations of analytes with poor recovery may be biased low, the results should be interpreted with caution. Two of the most frequently detected pesticides, atrazine and simazine, had mean recoveries in spikes of 102 and 101 percent, respectively, and both had a relative standard deviation of 15 percent.
Eleven spikes were collected and analyzed using the HPLC method. The mean recoveries of these analytes were highly variable and ranged from 22 to 145 percent (Willie Kinsey and Mark Johnson, U.S. Geological Survey, written commun., 1997), with a relative standard deviation ranging from 6 to 40 percent. Precision and recovery for most HPLC analytes generally were consistent enough and high enough so that they could be used confidently in the data analysis. Several analytes, however, had poor overall precision and recovery rates: 1-naphthol, aldicarb, aldicarb sulfone, carbaryl, chlorothalonil, dichlobenil, 4,6-dinitro-o-cresol (DNOC), esfenvalerate, 4-(4-chloro-2-methylphenoxy) butanoic acid (MCPB), methiocarb, and oxamyl. These analytes have a greater chance of being reported as a "false negative" where a compound is not detected in samples containing concentrations at a detectable level. The HPLC analyte most frequently detected in this study was diuron. Diuron mean recovery in spikes was 50 percent, with a relative standard deviation of
14 percent. Recovery data for a surrogate analyte added to the samples indicate that the overall recovery using the HPLC method was lower than the recovery using the GC/MS method. The mean recovery for the "BDMC" surrogate (Werner and others, 1996) was 69 percent with a standard deviation of 28 percent.
Volatile Organic Compounds
Eighteen field blanks were analyzed for purge and trap capillary GC/MS VOCs: 12 blanks were collected at domestic well sites, and 6 blanks were collected at monitoring well sites. Chloromethane was detected in four blanks collected at the domestic well sites (concentrations ranged from 0.2 to 0.7 |lg/L) and in six blanks collected at the monitoring well sites (concentrations ranged from 0.3 to 1.0 |lg/L). Chloromethane was detected in 23 environmental samples from domestic wells at concentrations ranging from 0.2 to 0.7 |lg/L. Detections of this analyte were considered to be a result of systematic contamination, likely from the hydrochloric acid used for VOC preservation (John Zogorski, U. S. Geological Survey, written commun., 1996); thus, Chloromethane data were not interpreted in this report.
Dichloromethane was detected in six field blanks collected at domestic well sites (concentrations ranged from 0.3 to 5.6 |lg/L), in one field blank collected at a monitoring well site (0.7 |lg/L), and in one trip blank (1.4 |lg/L). This analyte was detected at a concentration of 0.4 |lg/L in one environmental sample from a domestic well. The detection of dichloromethane in the trip blank supports the possibility that it was introduced into the environ mental sample during travel or shipping. Two other analytes also were detected in both environmental samples and field blanks. Trichlorofluoromethane was detected in two field blanks collected at monitoring well sites in 1994 and in the 1994 equipment blank at concentrations ranging from 0.2 to 0.3 |lg/L. Trichlorofluoromethane also was detected in two environmental monitoring well water samples, both collected on the same day in 1995. Although the detections in the blanks and the detections in the environmental samples do not appear to be related, they could be the result of contamination. Trichloromethane was detected in three field blanks collected at domestic well sites (concentrations ranged from 0.2 to 0.4 (ig/L) and in one field blank from a monitoring well site (0.7 |lg/L). Trichloromethane was
12 Nitrate and Pesticides in Ground Water Beneath Three Agricultural Land-Use Settings, Eastern San Joaquin Valley

detected in one environmental domestic well sample (1.0 |Lig/L) and one environmental monitoring well water sample (0.5 |Ug/L). Trichloromethane may have resulted from chlorination of the well water; in the case of the monitoring well, the pump was rinsed in water that may have been chlorinated, and the carry over from the rinse may have contaminated the environmental sample. Because these three compounds dichloromethane, trichlorofluoro- methane, and trichloromethane were detected in blanks and probably were not derived from agricul tural use, they are not interpreted in this report. Six additional VOCs were detected in blanks, but were not detected in any environmental samples: benzene, bromodichloromethane, chlorodibromomethane, dimethylbenzene (that is, total dimethylbenzene), methylbenzene, and tribromomethane. These compounds may have been a component of the blank water used and do not affect the interpretation of the environmental data. Nineteen field blanks were collected for analysis of DBCP and EDB using the low-level GC/ECD method: 12 blanks were collected at domestic well sites, and 7 blanks were collected at monitoring well sites. DBCP or EDB was not detected in any of the blanks.
Other than the VOCs discussed above, only five different VOCs were detected in environmental ground-water samples from the domestic and monitoring wells. Three compounds are known to be associated with agricultural use and are interpreted in this report: DBCP, 1,2-dichloropropane, and 1,2,3-trichloropropane. However, trichloroethene (detected in one environmental domestic well water sample and one environmental monitoring well water sample) and tetrachloroethene (detected in two environmental domestic well water samples and one environmental monitoring well water sample) are not known to be associated with agricultural use. Because these compounds were detected together in two samples, and are used as solvents, their occurrence may be related to nonagricultural use, such as the cleaning or maintenance of farm machinery. For the purposes of this report, these two compounds are not interpreted as agriculturally derived compounds.
Seventeen VOC spikes were collected and analyzed using the purge and trap GC/MS method. VOC spike replicate samples also were collected at 13 of the 17 domestic and monitoring well sites where VOC spikes were collected. Because a micropipettor was used for spiking samples, the spike recoveries
were biased low; therefore, the field spike data do not accurately represent the performance of the GC/MS method. Recoveries of three surrogate analytes indicate that overall recovery was good for most samples. The mean recovery for 1,2-dichloroethane-d4 was 100 percent with a standard deviation of 6 percent. The mean recovery for toluene-d8 was 98 percent with a standard deviation of 2 percent, and the mean recovery for l-bromo-4-fluorobenzene was 100 percent with a standard deviation of 9 percent.
Determination of Local-Scale Nitrogen Applications
To evaluate the relation between local-scale applications of nitrogen and nitrate concentrations in ground water, the estimated amount of nitrogen from fertilizer and manure waste from confined animal feedlots (including dairies) was calculated for each sampling site and compared with the measured nitrate concentrations in the ground-water samples. The nitrogen contribution from septic systems was not included in this evaluation because the contribution was expected to be minor (7.5 Ib of nitrogen per person per year) relative to the contribution from the surrounding land use (Frimpter and others, 1990). Most of the domestic wells sampled during this study are in sparsely populated agricultural areas and are at least 100 ft from household septic systems.
Estimates of nitrogen fertilizer applications were determined for each well on the basis of estimates of annual nitrogen fertilizer application rates (Rauschkolb and Mikkelsen, 1978; National Agricultural Statistics Service and Economic Research Service, 1992a,b) for each crop type identified in the DWR digital land-use coverage within 0.25- or 0.5-mi radial distance from the well. The DWR digital land- use coverage included crop types present only when the land-use survey was performed and crop rotations were not taken into account. The estimated annual rate of nitrogen fertilizer applied to each crop was multi plied by the total area of that crop within 0.25- or 0.5- mi radial distance from the well. The total amount of nitrogen fertilizer applied was computed as the sum of the estimated application for all crops within the specified radial distance from the well.
An estimated nitrogen "application" from livestock and poultry feedlots was added to the estimated fertilizer application at every site where the well was less than 0.25- or 0.5-mi radial distance from
Study Design and Methods 13

a feedlot or dairy, as indicated by the DWR digital land-use coverage. The DWR feedlot designation includes beef cow, poultry, or hog farms. An average animal population for dairies and beef cow and/or poultry farms was estimated for each county using agricultural census data (U.S. Department of Commerce, 1989); the average population of hogs were not included because no well sites were near hog farms. From these data, an average farm size number of dairy cows, beef cows, and poultry per farm was estimated for each county. An amount of applied nitro gen was estimated for each animal (U.S. Soil Conser vation Service, 1992). The application amount for each animal was multiplied by the average number of animals on a farm in that county. The resulting confined animal feedlot application estimate was added to the nitrogen fertilizer application at each well site near a feedlot or dairy.
Determination of Hydrogeologic and Well-Construction Variables
Data on depth-to-water, well depth, alluvial sediment texture, and soil properties were compiled for each ground-water sampling site to determine whether differences in nitrate and pesticide occurrence can be attributed to differences in hydrogeologic or well-construction characteristics. The methods used to compile these variables are described below.
The depth-to-water was measured in 75 percent of the wells at the time of sample collection. When access to the well was not possible, water levels were (1) estimated by measuring the water level in nearby wells known to be screened at a similar depth (7 percent), (2) were obtained from the land owner (7 percent), (3) or were obtained from other forms of record, such as driller's records or regional water-level contour maps (11 percent; California Department of Water Resources, 1990a,b).
The well depths were obtained from drillers' logs, if available (logs were available for 80 percent of the wells sampled). The well depth was equivalent to the depth to the bottom of the screen if a screen was present. If a screen was not present, the well depth was equivalent to the depth to the bottom of the well casing. For wells that had no associated driller's log, the well depth was either sounded (7 percent), estimated by the pump company (8 percent), or estimated by the landowner (5 percent).
The "percent of coarse-grained textures" over the thickness of the borehole was calculated from the driller's logs as the total footage of sand or gravel in a borehole divided by the total depth. The "minimum soil permeability" was derived from county-level soil surveys (Arkley, 1962, 1964; Ulrich and Stromberg, 1962; Huntington, 1971; Stephens, 1982; Arroues and Anderson, 1986; Chang, 1988; Nazar, 1990; McElhiney, 1992). Generally, a range of permea bilities was given for each soil classification at different soil depths; the minimum soil permeability was chosen to reflect the most limiting soil layer that could have controlled the overall rate at which ground water was recharged.
The State Soil Geographic Data Base (STATSGO) digital soils coverage (1:250,000 scale) was used to obtain values of average soil permeability, clay content, and presence of hardpan at each well site (U.S. Soil Conservation Service, 1991). STATSGO soils maps are generalized map units derived from detailed (county level) soils maps and local data on geology, topography, vegetation, and climate. The generalized STATSGO map units depict the dominant soils occurring on the landscape; therefore, the detailed variability in soils types was not preserved. In many cases, several wells were within the same map unit. Average soil permeability was calculated at each site by first computing a logarithmic mean of the range of permeabilities within each soil horizon (vertical average). A geometric mean then was calculated between each soil type within the map unit (horizontal average). Clay content (percent of clay within each mapped unit) was calculated using the same algorithm as for average soil permeability. Hardpan presence is the percentage of the total map unit area that is underlain by hardpan.
Statistical Methods
Nonparametric statistical methods were used in this study because the data set is small and most of the data are not normally distributed. Nonparametric statistics are robust techniques that are generally unaffected by outlying values and do not require that the data follow any particular distribution (Helsel and Hirsch, 1992). The significance level (commonly referred to as a) used for hypothesis testing in this report is 5 percent (a=0.05).
14 Nitrate and Pesticides in Ground Water Beneath Three Agricultural Land-Use Settings, Eastern San Joaquin Valley
The Mann-Whitney test was used to test the difference between two groups of data, whereas the Kruskal-Wallis test, an analysis of variance, was used to test the differences among more than two groups of data (Conover, 1980). In the case where the Kruskal- Wallis test indicated a significant difference among the three groups, the multiple-stage Kruskal-Wallis test was subsequently used (Helsel and Hirsch, 1992) to determine whether a significant difference exists between two groups. The significance level used for the multiple-stage Kruskal-Wallis test in this report is Op=0.03. The Sign test (Zar, 1974) was used to evaluate the differences in matched pairs of data, and the Spearman's rho was used to evaluate the correlation of two variables (Lehmann and D'Abrera, 1975). The Chi-square statistic was used to evaluate contingency tables for categorical variables (Zar, 1974). For compounds with reported concentrations that were less than the detection limit, a concentration of one-half the minimum detection limit was used in the statistical analyses.
Multivariate statistical methods also were used in this study to determine which variables explain most of the variance in the data set. Principal components analysis involves interpretation of the eigenvalues and eigenvectors from the variance- covariance matrix (Davis, 1973). This method is described in more detail in the section on multivariate analysis of physical and chemical factors.
OCCURRENCE OF NITRATE
Nitrate Concentrations
Elevated concentrations of nitrate in ground water are a threat to human health because nitrate is a factor in the development of infant methemoglobi- nemia (Comly, 1945). The MCL for nitrate concen tration in drinking water supplied by public water suppliers is 10 mg/L (U.S. Environmental Protection Agency, 1996). This public health limit originally was chosen because it was the concentration below which there were no cases of infant methemoglobinemia. Nitrogen compounds that occur naturally in water include nitrite, nitrate, and ammonium, although nitrate is the dominant nitrogen species in oxygenated ground water. In this study, nitrite concentrations ranged from less than 0.01 to 0.1 mg/L, accounting for a maximum of 1.2 percent of the total nitrate plus
nitrite concentrations in samples where nitrite was detected. Concentrations of nitrate plus nitrite are hereinafter referred to as nitrate, expressed as elemental nitrogen.
Nitrate was detected in 58 of 60 domestic well ground-water samples from the three land-use settings; concentrations ranged from less than 0.05 to 55 mg/L (fig. 3). Nitrate concentrations in 75 percent of the ground-water samples exceeded 3.0 mg/L; nitrate concentrations below 3.0 mg/L may represent ground water that is unaffected by anthropogenic factors (Madison and Brunett, 1985; Mueller and Helsel, 1996). Eighteen ground-water samples (30 percent) had nitrate concentrations greater than the MCL of 10 mg/L eight in the almond land-use setting, seven in the corn, alfalfa, and vegetable land- use setting, and three in the vineyard land-use setting (table 3). Nitrate concentrations were significantly different among the three land-use settings (p=0.016; Kruskal-Wallis test). Concentrations in ground water in the almond land-use setting were significantly higher than concentrations in ground water beneath vineyards (p=0.005; multiple-stage Kruskal-Wallis test), although the difference in concentrations between the corn, alfalfa, and vegetable land-use setting and either the vineyard or almond land-use settings was not significant (p=0.18 and 0.11, respectively; multiple-stage Kruskal-Wallis test).
Sources of Nitrate
Because nitrate concentrations in ground water beneath the almond land-use setting are higher than those beneath the vineyard land-use setting, sources of nitrate were evaluated to determine whether they explain the differences in nitrate concentrations between the land-use settings. Statewide, vineyards received an estimated 59 Ib/acre of nitrogen fertilizer, whereas almond orchards received 191 Ib/acre for the 1991 crop year (National Agricultural Statistics Service and Economic Research Service, 1992a), indicating that the higher concentrations of nitrate in the almond land-use setting than in the vineyard land- use setting is probably the result of a higher appli cation rate of nitrogen fertilizer. The wide variability in estimated application rates for the crops included in the corn, alfalfa, and vegetable land-use setting made it difficult to compare rates between all three land-use settings. In the San Joaquin Valley in 1973, a common application rate for corn was 175 Ib/acre, the rate for
Occurrence of Nitrate 15

0.9
0.8
0.7
i" 0.6|QCD.a g 0.5Q_ " >w
"CDEo 0.4
0.3
0.2
0.1,
^n
,.,,.,,,,,
r
L ^; +L +
i +
: + A
i + A (
: + A (
: +A c; + A oL
E +A o
j + A 0
r -(-A 0
i +A o~ 4- o^- o
^0
irO
+ A 0 :
+ A 0 -i
+ A 0 i
A 0 j
A 0 :
A 0 j
0 A
O
)
)
)
_
_
-
MAXIMUM CONTAMINANT + Vineyard^^^ LEVEL o Almond
-^^ A Corn, alfalfa, and vegetable
. . , . , , , , . , , . . . i , . . , i . . , . i . , , , i , . . , i , . , , i . , , , i , , . . :
0 5 10 15 20 25 30 35 40 45 50 55 60Nitrate (as nitrogen), in milligrams per liter
Figure 3. Normal probability of nitrate concentrations in ground-water samples from domestic wells in the three land-use settings, eastern San Joaquin Valley, California.
Table 3. Nitrate concentrations in ground-water samples collected from domestic wells in the three land-use settings, eastern San Joaquin Valley, California.
[Nitrate concentrations are dissolved nitrate plus nitrite, as nitrogen; maximum contaminant level (MCL) of nitrate is 10 milligrams per liter (U.S. Environmental Protection Agency, 1996). <, less than]
Land-use setting
Vineyard
Almond
Cora, alfalfa, and vegetable
Number of samples with nitra concentrations above the Mt
(20 samples per land-use setting)
3
8
7
ite Nitrate concentrations, as nitrogen 1L (milligrams per liter)
Maximum
14
55
29
Median
4.6
10
6.2
Minimum
0.06
1.3
<0.05
alfalfa was 20 Ib/acre, and the rate for vegetable crops ranged from 80 to 153 Ib/acre (Rauschkolb and Mikkelsen, 1978). Statewide, the overall vegetable crop rate of application averaged 66 Ib/acre in 1990 (National Agricultural Statistics Service and Economic Research Service, 1992b). Although the application rates in 1973 may not represent the rates at
the time the sampled ground water was recharged, the relative application rates between crops may be similar. Additionally, the amount of nitrogen applied at land surface may not reflect the amount of nitrate that reaches the water table because other factors, such as infilitration rate and plant uptake, affect nitrate concentrations in recharge water.
16 Nitrate and Pesticides in Ground Water Beneath Three Agricultural Land-Use Settings, Eastern San Joaquin Valley
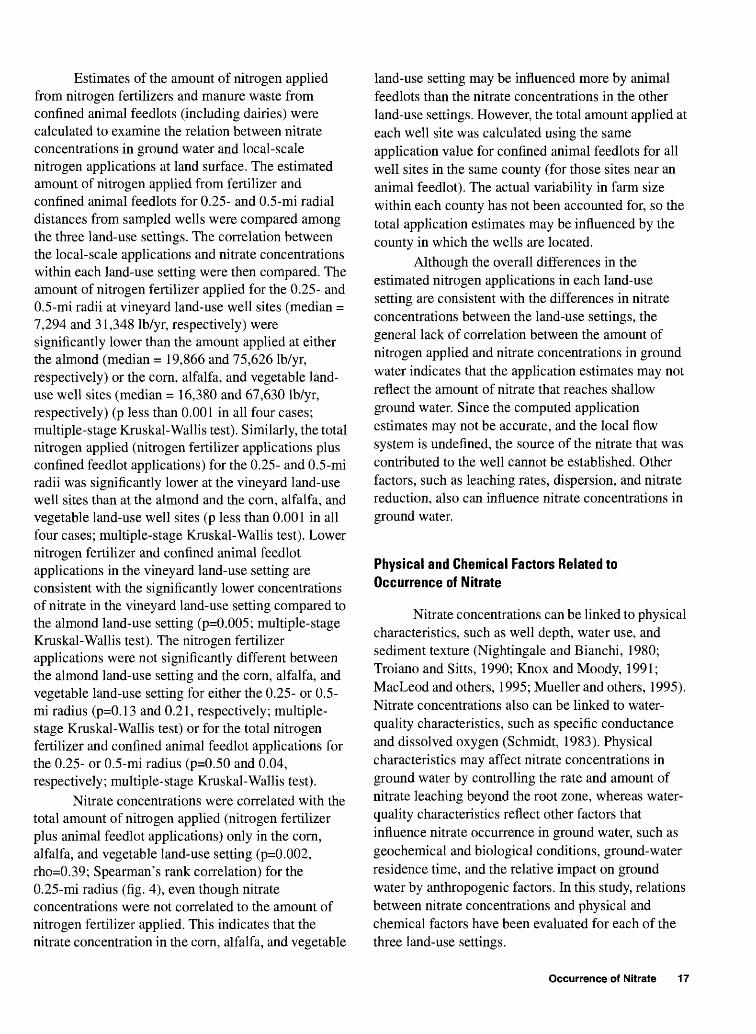
Estimates of the amount of nitrogen applied from nitrogen fertilizers and manure waste from confined animal feedlots (including dairies) were calculated to examine the relation between nitrate concentrations in ground water and local-scale nitrogen applications at land surface. The estimated amount of nitrogen applied from fertilizer and confined animal feedlots for 0.25- and 0.5-mi radial distances from sampled wells were compared among the three land-use settings. The correlation between the local-scale applications and nitrate concentrations within each land-use setting were then compared. The amount of nitrogen fertilizer applied for the 0.25- and 0.5-mi radii at vineyard land-use well sites (median = 7,294 and 31,348 Ib/yr, respectively) were significantly lower than the amount applied at either the almond (median = 19,866 and 75,626 Ib/yr, respectively) or the corn, alfalfa, and vegetable land- use well sites (median = 16,380 and 67,630 Ib/yr, respectively) (p less than 0.001 in all four cases; multiple-stage Kruskal-Wallis test). Similarly, the total nitrogen applied (nitrogen fertilizer applications plus confined feedlot applications) for the 0.25- and 0.5-mi radii was significantly lower at the vineyard land-use well sites than at the almond and the corn, alfalfa, and vegetable land-use well sites (p less than 0.001 in all four cases; multiple-stage Kruskal-Wallis test). Lower nitrogen fertilizer and confined animal feedlot applications in the vineyard land-use setting are consistent with the significantly lower concentrations of nitrate in the vineyard land-use setting compared to the almond land-use setting (p=0.005; multiple-stage Kruskal-Wallis test). The nitrogen fertilizer applications were not significantly different between the almond land-use setting and the corn, alfalfa, and vegetable land-use setting for either the 0.25- or 0.5- mi radius (p=0.13 and 0.21, respectively; multiple- stage Kruskal-Wallis test) or for the total nitrogen fertilizer and confined animal feedlot applications for the 0.25- or 0.5-mi radius (p=0.50 and 0.04, respectively; multiple-stage Kruskal-Wallis test).
Nitrate concentrations were correlated with the total amount of nitrogen applied (nitrogen fertilizer plus animal feedlot applications) only in the corn, alfalfa, and vegetable land-use setting (p=0.002, rho=0.39; Spearman's rank correlation) for the 0.25-mi radius (fig. 4), even though nitrate concentrations were not correlated to the amount of nitrogen fertilizer applied. This indicates that the nitrate concentration in the corn, alfalfa, and vegetable
land-use setting may be influenced more by animal feedlots than the nitrate concentrations in the other land-use settings. However, the total amount applied at each well site was calculated using the same application value for confined animal feedlots for all well sites in the same county (for those sites near an animal feedlot). The actual variability in farm size within each county has not been accounted for, so the total application estimates may be influenced by the county in which the wells are located.
Although the overall differences in the estimated nitrogen applications in each land-use setting are consistent with the differences in nitrate concentrations between the land-use settings, the general lack of correlation between the amount of nitrogen applied and nitrate concentrations in ground water indicates that the application estimates may not reflect the amount of nitrate that reaches shallow ground water. Since the computed application estimates may not be accurate, and the local flow system is undefined, the source of the nitrate that was contributed to the well cannot be established. Other factors, such as leaching rates, dispersion, and nitrate reduction, also can influence nitrate concentrations in ground water.
Physical and Chemical Factors Related to Occurrence of Nitrate
Nitrate concentrations can be linked to physical characteristics, such as well depth, water use, and sediment texture (Nightingale and Bianchi, 1980; Troiano and Sitts, 1990; Knox and Moody, 1991; MacLeod and others, 1995; Mueller and others, 1995). Nitrate concentrations also can be linked to water- quality characteristics, such as specific conductance and dissolved oxygen (Schmidt, 1983). Physical characteristics may affect nitrate concentrations in ground water by controlling the rate and amount of nitrate leaching beyond the root zone, whereas water- quality characteristics reflect other factors that influence nitrate occurrence in ground water, such as geochemical and biological conditions, ground-water residence time, and the relative impact on ground water by anthropogenic factors. In this study, relations between nitrate concentrations and physical and chemical factors have been evaluated for each of the three land-use settings.
Occurrence of Nitrate 17

0) Q.
60
50
40
300) O)o
20
10
+ Vineyard
O Almond
A Corn, alfalfa, and vegetable
A
A
O O
A
A A AA
O A
oA
2 4 5 6 8 10 20 40 50 60 80 100Total amount of nitrogen applied from fertilizer and confined animal feedlots
in one-quarter-mile radius around well, in pounds per year x 1,000
200
Figure 4. Nitrate concentration and estimated local-scale nitrogen applications around each well in each of the three land-use settings, eastern San Joaquin Valley, California.
Hydrogeology and Well Construction
Data on depth-to-water, well depth, soil permeability, and general alluvial sediment texture were compiled for each well site to determine whether the difference in nitrate concentrations between land uses can be attributed to differences in these characteristics (table 4). Well depth and depth-to- water were not significantly different between the three land-use settings (p=0.511 and 0.127, respectively; Kruskal-Wallis test). The well selection criteria were designed to reduce the dependence of water-quality results on well depth and depth-to-water. Similarly, neither well depth nor depth-to-water were significantly correlated to nitrate concentrations in the vineyard (p=0.74, rho=-0.08 and p=0.49, rho=0.16, respectively; Spearman's rank correlation), almond (p=0.31, rho=-0.24 and p=0.46, rho=0.17, respec tively; Spearman's rank correlation), or corn, alfalfa, and vegetable land-use settings (p=0.21, rho=-0.29
and p=0.15, rho=-0.33, respectively; Spearman's rank correlation).
Differences in alluvial sediment texture between the three land-use settings also may explain the differences in nitrate concentrations. All wells selected for this study lie within the eastern alluvial fan physiographic region (fig. 1); however, sediments within this area are variable. The alluvial fans of this region are characterized by (1) generally coarse grained sediments near the apex, where rivers enter the valley floor, and (2) an increasing proportion of fine grained sediments at greater distances from the apex, near the basin physiographic region. The vineyard and the almond land-use settings generally are located on the coarse-grained sediments of the upper and middle alluvial fans. The corn, alfalfa, and vegetable land-use setting lies closer to the basin region on relatively fine grained sediments. Coarse-grained sediments are more likely to permit rapid infiltration of water and solutes
18 Nitrate and Pesticides in Ground Water Beneath Three Agricultural Land-Use Settings, Eastern San Joaquin Valley
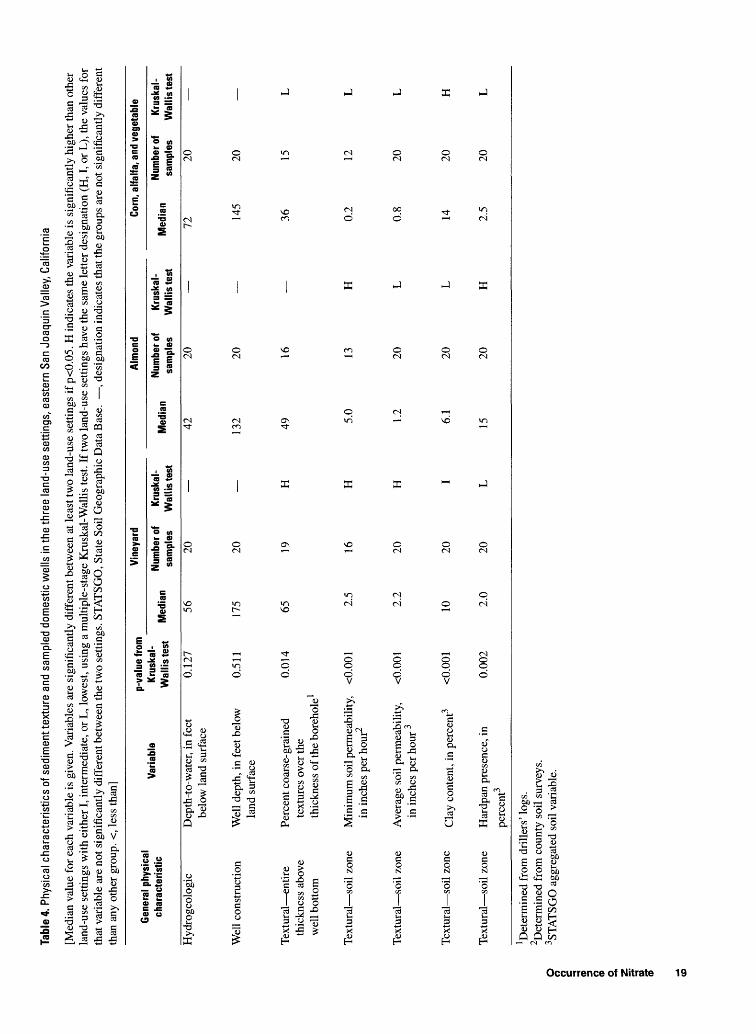
O
o 8 i
Tabl
e 4.
Phy
sica
l cha
ract
eris
tics
of s
edim
ent t
extu
re a
nd s
ampl
ed d
omes
tic w
ells
in th
e th
ree
land
-use
set
tings
, eas
tern
San
Joa
quin
Val
ley,
Cal
iforn
ia
[Med
ian
valu
e fo
r ea
ch v
aria
ble
is g
iven
. Var
iabl
es a
re s
igni
fica
ntly
dif
fere
nt b
etw
een
at l
east
two
land
-use
set
tings
if p
<0.
05.
H in
dica
tes
the
vari
able
is s
igni
fica
ntly
hig
her
than
oth
er
land
-use
set
tings
with
eit
her
I, in
term
edia
te,
or L
, low
est,
usin
g a
mul
tiple
-sta
ge K
rusk
al-W
allis
test
. If
two
land
-use
set
tings
hav
e th
e sa
me
lette
r de
sign
atio
n (H
, I, o
r L
), th
e va
lues
for
th
at v
aria
ble
are
not
sign
ific
antly
dif
fere
nt b
etw
een
the
two
setti
ngs.
ST
AT
SGO
, Sta
te S
oil
Geo
grap
hic
Dat
a B
ase.
, d
esig
natio
n in
dica
tes
that
the
grou
ps a
re n
ot s
igni
fica
ntly
dif
fere
nt
than
any
oth
er g
roup
. <,
les
s th
an]
Gen
eral
phy
sica
l ch
arac
teri
stic
Hyd
roge
olog
ic
Wel
l co
nstr
uctio
n
Tex
tura
l en
tire
thic
knes
s ab
ove
wel
l bot
tom
Tex
tura
l so
il zo
ne
Tex
tura
l so
il zo
ne
Tex
tura
l so
il zo
ne
Tex
tura
l so
il zo
ne
Var
iabl
e
Dep
th-t
o-w
ater
, in
fee
t be
low
lan
d su
rfac
e
Wel
l de
pth,
in
feet
bel
ow
land
sur
face
Perc
ent c
oars
e-gr
aine
d te
xtur
es o
ver
the
thic
knes
s of
the
bore
hole
1
Min
imum
soi
l per
mea
bilit
y,
in in
ches
per
hour
Ave
rage
soi
l per
mea
bilit
y,
in i
nche
s pe
r ho
ur
Cla
y co
nten
t, in
per
cent
Har
dpan
pre
senc
e, i
n
perc
ent
p-va
lue
from
Kru
skal
- W
allis
test
M
edia
n
0.12
7 56
0.51
1 17
5
0.01
4 65
<0.0
01
2.5
<0.0
01
2.2
<0.0
01
10
0.00
2 2.
0
Vin
eyar
d
Num
ber o
f K
rusk
al-
sam
ples
W
all i
s tes
t
20
20
19
H
16
H
20
H
20
I
20
L
Alm
ond
.,
.. N
umbe
r of
Kru
skal
- M
edia
n .
... .
.. .
. sa
mpl
es
Wal
hs te
st
42
20
132
20
49
16
5.0
13
H
1.2
20
L
6.1
20
L
15
20
H
Corn
, alfa
lfa, a
nd v
eget
able
-.
.. N
umbe
r of
Med
ian
. sa
mpl
es
72
20
145
20
36
15
0.2
12
0.8
20
14
20
2.5
20
Kru
skal
- W
allis
test
L L L H L
Det
erm
ined
fro
m d
rill
ers'
log
s.
Det
erm
ined
fro
m c
ount
y so
il su
rvey
s.
3ST
AT
SGO
agg
rega
ted
soil
vari
able
.

than fine-grained, low-permeability sediments; therefore, ground water in the vineyard and the almond land-use settings may be more vulnerable to contamination than ground water in the corn, alfalfa, and vegetable land-use setting.
The vineyard land-use setting is characterized by the highest percentage of coarse-grained textures over the thickness of the borehole, high average soil permeability, intermediate clay content, and the smallest area underlain by hardpan (table 4). The low concentrations of nitrate beneath the vineyard land-use setting are likely the result of the low amount of nitrogen applied because the sediment characteristics are conducive to rapid transport of solutes to ground water.
The almond land-use setting is characterized by generally high minimum soil permeability, low clay content, low average soil permeability, and a high percentage of area underlain by hardpan (table 4). The high concentrations of nitrate in the almond land-use setting are consistent with high nitrogen applications and generally coarse-grained soils, as indicated by high minimum soil permeability and low clay content. However, the low average soil permeability and the high percentage of area underlain by hardpan are not consistent with the high concentrations of nitrate in the almond land-use setting. The hardpan may have been removed or altered by deep plowing or "ripping" of the surface soils prior to the planting of the orchards, or the STATSGO aggregated variables may not reflect the actual soil type at each almond land-use well site.
The corn, alfalfa, and vegetable land-use setting is characterized by high clay content, low average soil permeability, and the lowest minimum soil permeability and percentage of coarse-grained textures over the thickness of the borehole (table 4). The nitrate concentrations in the corn, alfalfa, and vegetable land-use setting are intermediate and more variable than concentrations in the other two land-use settings (fig. 3), which is consistent with the variability in the amount of nitrogen applied. The predominance of fine-grained textures also may be important in restricting nitrate movement to ground water beneath this land use. The presence of clay-sized particles restricts infiltration of water and solutes, and also provides more time for other nitrate-removal processes to take place, such as nitrate reduction and nutrient uptake by plants.
Nitrate concentrations have a weak negative correlation with average soil permeability in the vineyard land-use setting (p=0.019, rho=-0.52; Spearman's rank correlation). In the corn, alfalfa, and vegetable land-use setting, nitrate concentrations have a weak positive correlation with the percentage of area underlain by hardpan (p=0.036, rho=0.47; Spearman's rank correlation). Both correlations are inconsistent with the understanding that higher nitrate concentrations are more likely to occur in areas where sediments enable more rapid infiltration. The correlation may be a result of the limitation of applying STATSGO aggregated soil variables to individual well locations. None of the other textural variables were correlated with nitrate concentrations.
Water Chemistry
Ground water on the east side of the San Joaquin Valley generally has low to moderate dissolved-solids concentrations, commonly less than 500 mg/L (Bertoldi and others, 1991). Characteristically, the dominant anion is bicarbonate, with lesser amounts of chloride and sulfate. The cation content is dominated by calcium and sodium concentrations, which are typically higher than magnesium concentrations. These major ion ratios resemble the ratios found in surface waters that drain the Sierra Nevada and recharge the ground-water system (Davis and others, 1959).
Trilinear charts of major ion composition are shown in figure 5. Three categories of nitrate concentrations are shown less than 3.0 mg/L, between 3.0 and 10.0 mg/L, and greater than 10.0 mg/L. Ground water with elevated nitrate concentrations tends to have similar major ion composition and, as nitrate concentrations increase, chloride increases and replaces bicarbonate as the dominant anion. Sulfate also increases, but to a lesser degree. Differences in the major ion composition of these categories likely indicate the relative degree to which these waters are affected by anthropogenic factors, such as agriculture. Agriculturally affected waters may be expected to have higher salinity, characterized by increased concentrations of chloride, sulfate, and nitrate as a result of leaching of nitrogen and potash fertilizers, and other agriculturally related compounds, than do nonaffected waters. As ground water is pumped and reapplied for irrigation, increased evaporation may also contribute to increased salinity
20 Nitrate and Pesticides in Ground Water Beneath Three Agricultural Land-Use Settings, Eastern San Joaquin Valley

EXPLANATION
A Nitrate (as nitrogen) concentration less than 3 milligrams per liter
+ Nitrate (as nitrogen) concentration greater than or equal to 3 and less than or equal to 10 milligrams per liter
Nitrate (as nitrogen) concentration greater than 10 milligrams per liter
CALCIUM CHLORIDE PLUS NITRATE
PERCENT
Figure 5. Major ion composition of ground-water samples collected from domestic wells in the three land-use settings, eastern San Joaquin Valley, California.
of these waters. These trends in major ion composition (fig. 5) support the relation between high levels of nitrate and agriculturally affected waters.
Although major ion composition of the ground water beneath the three land-use settings is similar, the concentrations of the major ions are more variable in the corn, alfalfa, and vegetable land-use setting than they are in the vineyard and almond land-use settings (table 5). Specific conductance is related to the total ion composition of ground water and is an indicator of salinity. As discussed above, increased salinity can be caused by the effects of agriculture. It also can occur naturally over time as ground water dissolves minerals as it travels through the system (increases in salinity may be associated with longer ground-water residence times). Specific conductance was correlated positively with nitrate concentrations in the vineyard (p less than 0.001 and rho=0.74; Spearman's rank correlation; fig. 6) and in the almond land-use settings (p=0.005, rho=0.60; Spearman's rank correlation), indicating
that higher nitrate concentrations are associated with agriculturally affected waters in these land-use settings, consistent with the overall relation between major ion concentrations and nitrate concentrations discussed above.
In contrast, nitrate concentrations and specific conductance were not correlated for the corn, alfalfa, and vegetable land-use setting, indicating that the occurrence of nitrate and salinity (as reflected by specific conductance) in this land-use setting may be influenced by different factors than it was in the vineyard and almond land-use settings. Although specific conductance is significantly higher (but more variable) in the corn, alfalfa, and vegetable land-use setting (table 5) than in the vineyard land-use setting (p=0.013; multiple-stage Kruskal-Wallis test), and chloride concentrations are significantly higher in the corn, alfalfa, and vegetable land-use setting than in the almond land-use setting (p=0.002; multiple-stage Kruskal-Wallis test), the elevated salinity in the corn,
Occurrence of Nitrate 21

Tabl
e 5.
Sel
ecte
d w
ater
che
mis
try c
hara
cter
istic
s of
gro
und-
wat
er s
ampl
es c
olle
cted
from
dom
estic
wel
ls in
the
thre
e la
nd-u
se s
ettin
gs, e
aste
rn S
an J
oaqu
in V
alle
y, C
alifo
rnia
[Con
stitu
ents
are
dis
solv
ed.
Tw
enty
sam
ples
wer
e co
llect
ed a
t ea
ch l
and-
use
setti
ng. V
aria
bles
are
sig
nifi
cant
ly d
iffe
rent
bet
wee
n la
nd-u
se s
ettin
gs i
f p<
0.05
. H
ind
icat
es v
aria
ble
is
sign
ific
antly
hig
her
than
oth
er l
and-
use
setti
ngs
and
L in
dica
tes
vari
able
is s
igni
fica
ntly
low
er, u
sing
the
mul
tiple
sta
ge K
rusk
al-W
allis
tes
t. If
two
land
-use
set
tings
hav
e th
e sa
me
lette
r
rate and
Pesticides in Ground
Wal CD Beneat
3" CD
CD <n o" i § Q. eg CD I at m to v> CD 1 c_
o 0) c 5' 2. io"
desi
gnat
ion
(H, L
), th
e va
lues
for
that
var
iabl
e ar
e no
t sig
nifi
cant
ly d
iffe
rent
bet
wee
n th
e tw
o se
tting
s. , d
esig
natio
n in
dica
tes
that
the
grou
ps a
re n
ot s
igni
fica
ntly
dif
fere
nt th
an a
ny
othe
r gr
oup.
mg/
L, m
illig
ram
s pe
r lit
er;
ug/L
, m
icro
gram
s pe
r lit
er;
pCi/L
, pi
cocu
ries
per
lite
r; <
, le
ss t
han;
>,
grea
ter
than
]
Wat
er c
hem
istry
ch
arac
teri
stic
Spec
ific
con
duct
ance
, in
mic
rosi
emen
s pe
rce
ntim
eter
at 2
5 de
gree
s C
elsi
us
Cal
cium
, in
mg/
L,
as C
a
Sodi
um,
in m
g/L
, as
Na
Mag
nesi
um,
in m
g/L
, as
M
g
Bic
arbo
nate
, in
mg/
L,
asH
CO
3
Chl
orid
e, i
n m
g/L
as
Cl
Sulf
ate,
in
mg/
L,
as S
O4
Dis
solv
ed o
xyge
n, i
n m
g/L
Iron
, in
|lg/
L,
as F
e
Man
gane
se,
in |i
g/L
as
Mn
Tri
tium
, in
pC
i/L
p-va
lue
from
Kru
skal
- W
allis
test
0.02
8
0.09
3
0.00
4
0.56
5
0.01
4
0.00
7
0.85
8
0.02
2
not
dete
rmin
ed;
>50
per
cent
no
ndet
ectio
ns
not d
eter
min
ed;
>50
per
cent
no
ndet
ectio
ns
0.82
3
Vin
eyar
d A
lmon
d Co
rn, a
lfalfa
, and
veg
etab
le
Kru
skal
- K
rusk
al-
Kru
skal
- W
allis
test
W
allis
test
W
allis
test
M
inim
um
Med
ian
resu
lts
Max
imum
M
inim
um
Med
ian
resu
lts
Max
imum
M
inim
um
Med
ian
resu
lts
Max
imum
(for
(for
(for
med
ian)
m
edia
n)
med
ian)
89
404
L
1,08
0 11
6 49
7
1,04
0 90
72
2 H
1,
990
7.3
37
110
9.1
49
120
6.6
68
170
3.1
22
L
94
8.5
26
L
79
5.5
56
H
250
3.4
10
32
3.2
16
35
0.75
16
50
45
169
L
492
54
173
L
442
48
313
H
650
2.2
17
130
1.5
8.6
L
39
2.0
36
H
170
2.4
28
100
3.0
30
160
3.8
29
300
0.2
5.4
H
9.5
0.6
3.9
6.7
0.1
1.7
L
8.2
<3.
0 <
3.0
11
<3.
0 <3
.0
5.0
<3.
0 <
3.0
140
<1.
0 <
1.0
5.0
<1.
0 <
1.0
<1.
0 <
1.0
<1.
0
700
0.7
42 83
5 36
110
6 38
78

60
55
50
45
- 40 oQ.
12 35.0)
1
~ 30
o>O)o1 25
-CO-
(D2 20 £;
iz
15
10
+ Vineyardo AlmondA Corn, alfalfa, and vegetable
A
A
AA A
A A
+ O 00o 0+
O
+
* A+
A+ o + AA A
A
500 1,000 1,500 2,000 Specific conductance, in microsiemens per centimeter at 25 degrees Celsius
2,500
Figure 6. Relation between nitrate concentration and specific conductance in ground-water samples collected from domestic wells in the three land-use settings, eastern San Joaquin Valley, California.
alfalfa, and vegetable land-use setting is not necessarily associated with elevated nitrate concentrations. Elevated salinity in the corn, alfalfa, and vegetable land-use setting may reflect longer ground-water residence times, which is consistent with the fine-grained textures and position in the regional ground-water flow system. A longer ground- water residence time would allow more time for processes to remove nitrate, which could explain the lower concentrations of nitrate; or the amount of nitrogen applied may not have been as high at the time the ground water was recharged, which also could result in lower nitrate concentrations in ground water.
Nitrate reduction is one process of nitrate removal in ground water. Dissolved-oxygen concentrations in ground water can be an indicator of whether reduced geochemical conditions exist. In waters with low dissolved-oxygen concentrations (typically less than 0.5 to 1.0 mg/L), nitrate may be reduced. Other characteristics that may indicate reduced geochemical conditions include relatively high concentrations of iron and manganese elements that typically become more soluble as waters become more reduced.
Dissolved-oxygen concentrations were significantly lower in the corn, alfalfa, and vegetable
Occurrence of Nitrate 23
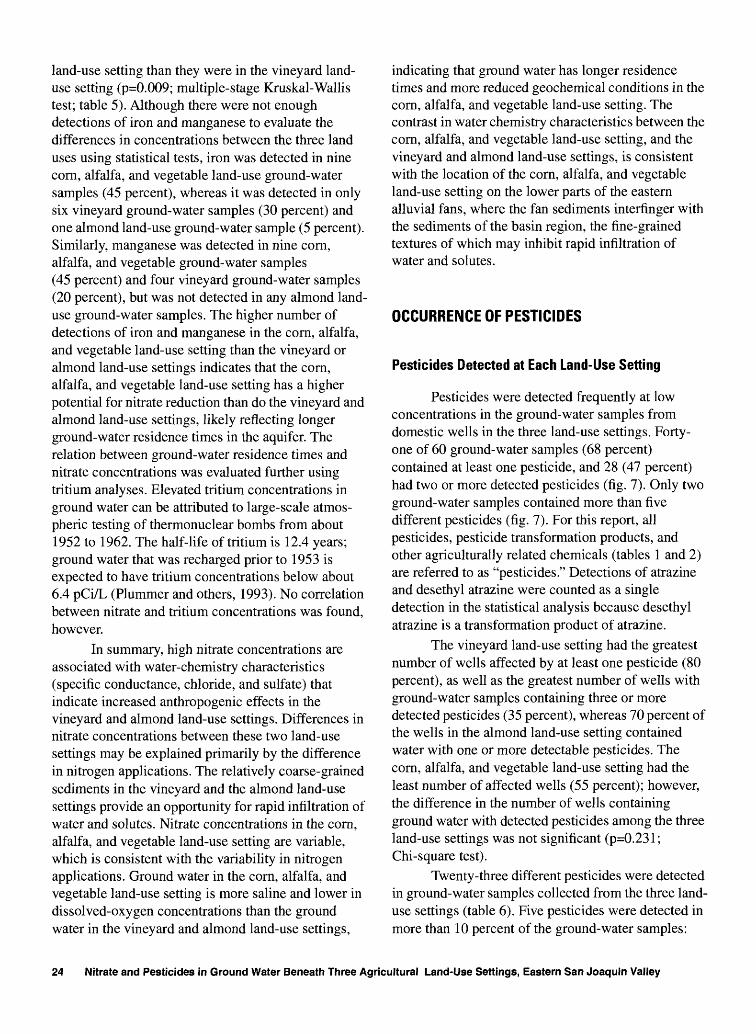
land-use setting than they were in the vineyard land- use setting (p=0.009; multiple-stage Kruskal-Wallis test; table 5). Although there were not enough detections of iron and manganese to evaluate the differences in concentrations between the three land uses using statistical tests, iron was detected in nine corn, alfalfa, and vegetable land-use ground-water samples (45 percent), whereas it was detected in only six vineyard ground-water samples (30 percent) and one almond land-use ground-water sample (5 percent). Similarly, manganese was detected in nine corn, alfalfa, and vegetable ground-water samples (45 percent) and four vineyard ground-water samples (20 percent), but was not detected in any almond land- use ground-water samples. The higher number of detections of iron and manganese in the corn, alfalfa, and vegetable land-use setting than the vineyard or almond land-use settings indicates that the corn, alfalfa, and vegetable land-use setting has a higher potential for nitrate reduction than do the vineyard and almond land-use settings, likely reflecting longer ground-water residence times in the aquifer. The relation between ground-water residence times and nitrate concentrations was evaluated further using tritium analyses. Elevated tritium concentrations in ground water can be attributed to large-scale atmos pheric testing of thermonuclear bombs from about 1952 to 1962. The half-life of tritium is 12.4 years; ground water that was recharged prior to 1953 is expected to have tritium concentrations below about 6.4 pCi/L (Plummer and others, 1993). No correlation between nitrate and tritium concentrations was found, however.
In summary, high nitrate concentrations are associated with water-chemistry characteristics (specific conductance, chloride, and sulfate) that indicate increased anthropogenic effects in the vineyard and almond land-use settings. Differences in nitrate concentrations between these two land-use settings may be explained primarily by the difference in nitrogen applications. The relatively coarse-grained sediments in the vineyard and the almond land-use settings provide an opportunity for rapid infiltration of water and solutes. Nitrate concentrations in the corn, alfalfa, and vegetable land-use setting are variable, which is consistent with the variability in nitrogen applications. Ground water in the corn, alfalfa, and vegetable land-use setting is more saline and lower in dissolved-oxygen concentrations than the ground water in the vineyard and almond land-use settings,
indicating that ground water has longer residence times and more reduced geochemical conditions in the corn, alfalfa, and vegetable land-use setting. The contrast in water chemistry characteristics between the corn, alfalfa, and vegetable land-use setting, and the vineyard and almond land-use settings, is consistent with the location of the com, alfalfa, and vegetable land-use setting on the lower parts of the eastern alluvial fans, where the fan sediments interfinger with the sediments of the basin region, the fine-grained textures of which may inhibit rapid infiltration of water and solutes.
OCCURRENCE OF PESTICIDES
Pesticides Detected at Each Land-Use Setting
Pesticides were detected frequently at low concentrations in the ground-water samples from domestic wells in the three land-use settings. Forty- one of 60 ground-water samples (68 percent) contained at least one pesticide, and 28 (47 percent) had two or more detected pesticides (fig. 7). Only two ground-water samples contained more than five different pesticides (fig. 7). For this report, all pesticides, pesticide transformation products, and other agriculturally related chemicals (tables 1 and 2) are referred to as "pesticides." Detections of atrazine and desethyl atrazine were counted as a single detection in the statistical analysis because desethyl atrazine is a transformation product of atrazine.
The vineyard land-use setting had the greatest number of wells affected by at least one pesticide (80 percent), as well as the greatest number of wells with ground-water samples containing three or more detected pesticides (35 percent), whereas 70 percent of the wells in the almond land-use setting contained water with one or more detectable pesticides. The corn, alfalfa, and vegetable land-use setting had the least number of affected wells (55 percent); however, the difference in the number of wells containing ground water with detected pesticides among the three land-use settings was not significant (p=0.231; Chi-square test).
Twenty-three different pesticides were detected in ground-water samples collected from the three land- use settings (table 6). Five pesticides were detected in more than 10 percent of the ground-water samples:
24 Nitrate and Pesticides in Ground Water Beneath Three Agricultural Land-Use Settings, Eastern San Joaquin Valley
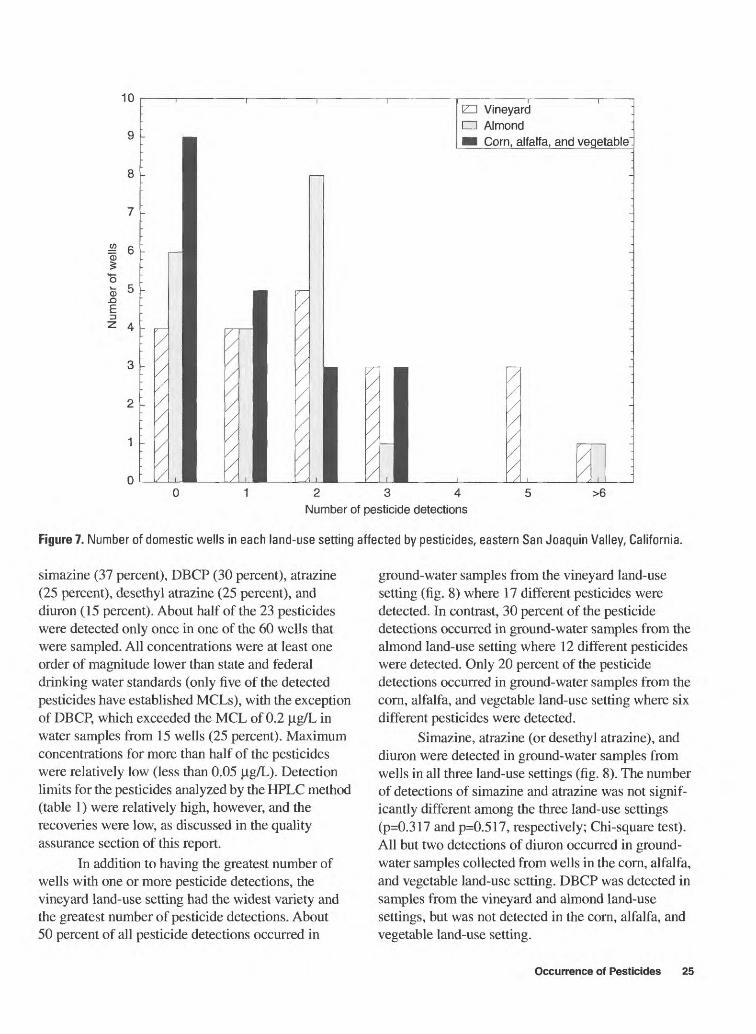
10
9
8
7
£? 60)
0) .QE
ZH Vineyardd3 AlmondBi Corn, alfalfa, and vegetable'
234 Number of pesticide detections
>6
Figure 7. Number of domestic wells in each land-use setting affected by pesticides, eastern San Joaquin Valley, California.
simazine (37 percent), DBCP (30 percent), atrazine (25 percent), desethyl atrazine (25 percent), and diuron (15 percent). About half of the 23 pesticides were detected only once in one of the 60 wells that were sampled. All concentrations were at least one order of magnitude lower than state and federal drinking water standards (only five of the detected pesticides have established MCLs), with the exception of DBCP, which exceeded the MCL of 0.2 jig/L in water samples from 15 wells (25 percent). Maximum concentrations for more than half of the pesticides were relatively low (less than 0.05 jig/L). Detection limits for the pesticides analyzed by the HPLC method (table 1) were relatively high, however, and the recoveries were low, as discussed in the quality assurance section of this report.
In addition to having the greatest number of wells with one or more pesticide detections, the vineyard land-use setting had the widest variety and the greatest number of pesticide detections. About 50 percent of all pesticide detections occurred in
ground-water samples from the vineyard land-use setting (fig. 8) where 17 different pesticides were detected. In contrast, 30 percent of the pesticide detections occurred in ground-water samples from the almond land-use setting where 12 different pesticides were detected. Only 20 percent of the pesticide detections occurred in ground-water samples from the corn, alfalfa, and vegetable land-use setting where six different pesticides were detected.
Simazine, atrazine (or desethyl atrazine), and diuron were detected in ground-water samples from wells in all three land-use settings (fig. 8). The number of detections of simazine and atrazine was not signif icantly different among the three land-use settings (p=0.317 and p=0.517, respectively; Chi-square test). All but two detections of diuron occurred in ground- water samples collected from wells in the corn, alfalfa, and vegetable land-use setting. DBCP was detected in samples from the vineyard and almond land-use settings, but was not detected in the corn, alfalfa, and vegetable land-use setting.
Occurrence of Pesticides 25

Tabl
e 6.
Pes
ticid
es d
etec
ted
in g
roun
d-w
ater
sam
ples
col
lect
ed fr
om d
omes
tic w
ells
in th
e th
ree
land
-use
set
tings
, eas
tern
San
Joa
quin
Val
ley,
Cal
iforn
ia
[Com
poun
ds a
re r
anke
d by
the
tota
l nu
mbe
r of
det
ectio
ns. C
ompo
unds
wer
e an
alyz
ed b
y fo
ur m
etho
ds:
solid
-pha
se e
xtra
ctio
n an
d ga
s ch
rom
atog
raph
y/m
ass
spec
trom
etry
(G
C/M
S);
solid
-pha
se e
xtra
ctio
n an
d hi
gh p
erfo
rman
ce li
quid
chr
omat
ogra
phy
(HPL
C);
gas
chr
omat
ogra
phy/
elec
tron
-cap
ture
det
ectio
n (G
C/E
CD
); a
nd p
urge
and
trap
GC
/MS
(PT
GC
/MS)
. An
*trate
am U
rn TJ
(0 (A o1 * (A 5'
0 O 3 a » ff i 5 H 1 CQ o' £ i. 5T 3 a
c 18 S CQ
W m D) (A ff 3 SP 3
C_ 1.Q C 5' » £
indi
cate
s th
e m
etho
d re
port
ing
limit.
Con
cent
ratio
ns n
oted
with
an
"E"
are
estim
ated
val
ues.
MC
L, m
axim
um c
onta
min
ant l
evel
(bl
ank
entr
ies
indi
cate
no
MC
L h
as b
een
esta
blis
hei
ug/L
, mic
rogr
ams
per
liter
. , n
o da
ta]
Com
poun
d
Sim
azin
e
l,2-D
ibro
mo-
3-ch
loro
prop
ane
(DB
CP)
Atr
azin
e
Atr
azin
e, d
eset
hyl
Diu
ron
1 ,2-
Dic
hlor
opro
-pa
ne
1,2,
3-T
rich
loro
pro-
pane
Die
ldri
n
Mal
athi
on
Met
olac
hlor
Tri
flur
alin
But
ylat
e
Car
bary
l
Chl
orpy
rifo
s
Cya
nazi
ne
Dac
thal
(D
CPA
)
p,p
'-DD
E
Din
oseb
EPT
C
Eth
alfl
ural
in
Eth
opro
p
Prom
eton
Ter
baci
l
Met
hod
of
anal
ysis
GC
/MS
GC
/EC
D
GC
/MS
GC
/MS
HPL
C
PT G
C/M
S
PT G
C/M
S
GC
/MS
GC
/MS
GC
/MS
GC
/MS
GC
/MS
GC
/MS
GC
/MS
GC
/MS
GC
/MS
GC
/MS
HPL
C
GC
/MS
GC
/MS
GC
/MS
GC
/MS
GC
/MS
Met
hod
dete
ctio
n ..
.. ..
Ml»
Llim
it(u
g/L)
0.00
5 4.
0
0.03
0.
2
0.00
1 3.
0
0.00
2
0.02
0.2*
5.
0
0.2*
0.00
1
0.00
5
0.00
2
0.00
2
0.00
2
0.00
8
0.00
4
0.00
4
0.00
2
0.00
6
0.03
5 7.
0
0.00
2
0.00
4
0.00
3
0.01
8
0.00
7
Total
num
ber
of
dete
c
tions 22 18 15 15 9 5 3 2 2 2 2 1 1 1 1 1 1 1 1 1 1 1 1
Vin
eyar
dTo
talnu
mbe
r of
sa
mpl
es
60 60 60 60 58 60 60 60 60 60 60 60 60 60 60 60 60 59 60 60 60 60 56
Num
ber o
f de
tec
tio
ns
10 12 8 3 1 4 2 2 1 0 2 1 1 1 0 1 1 0 0 1 1 0 0
Total
nu
mbe
r of
sa
mpl
es
20 20 20 20 20 20 20 20 20 20 20 20 20 20 20 20 20 20 20 20 20 20 20
Max
imum
co
ncen
tra
tion
(ug/
L)
0.28
3.2
0.05
6
0.03
E
0.34
1.5
0.8
0.01
8
0.00
4E 0.
007
0.00
2
0.01
3
0.00
6 0.
003
0.00
IE 0.
005
0.00
9
Num
ber
of
dete
c
tions 6 6 4 8 1 1 1 0 0 2 0 0 0 0 1 0 0 0 1 0 0 1 1
Alm
ond
Total
nu
mbe
r of
sa
mpl
es
20 19 20 20 19 20 20 20 20 20 20 20 20 20 20 20 20 19 20 20 20 20 16
Corn
, alfa
lfa, a
nd v
eget
able
Max
imum
co
ncen
tra
tion
(ug/
L)
0.03
8
2.60
0.06
9
0.0
19E
0.01
E
0.3
0.2
1.3
0.00
8 _ 0.
017
0.02
4
0.1 6
E
Num
ber
of
dete
c
tions 6 0 3 4 7 0 0 0 1 0 0 0 0 0 0 0 0 1 0 0 0 0 0
Total
nu
mbe
r of
sa
mpl
es
20 20 20 20 19 20 20 19 20 20 20 20 20 20 20 20 20 20 20 20 20 20 20
Max
imum
co
ncen
tra
tion
(ug/
L)
0.11
0.02
8
0.02
1
1.8E
0.1
0.08

50
40
30
EH VineyardAlmond
Corn, alfalfa, and vegetable
W 0 Q. 5 20CD .QE
10
Simazine DiuronAtrazine+ desethyl atrazine
Pesticides detected
DBCP All pesticides
Figure 8. Number of detections of selected pesticides in ground-water samples collected from domestic wells in the three land-use settings, eastern San Joaquin Valley, California. DBCP is 1,2-dibromo-3-chloropropane.
Pesticide Use
The presence of pesticides in ground water is a result of anthropogenic factors because pesticides do not occur naturally. The total reported application [all pesticide applications in this report refer to pounds active ingredient (Ib a.i.)] of pesticides to agricultural crops in the eastern San Joaquin Valley was 83 million Ib a.i. Sulfur, petroleum distillates, hydrocarbon, and oils account for about 60 percent of the total applications (California Department of Pesticide Regulation, 1993). Reported applications of pesticides analyzed for during this study and applied in the eastern alluvial fan physiographic region were compiled for 1993 (table 7; California Department of Pesticide Regulation, 1993) to examine the relation between pesticide use and the occurrence of pesticides in ground water. Reported applications of pesticides for 1993 does not necessarily correspond to the amount of pesticides applied at the land surface at the time the ground water in samples collected for this study was recharged, but the application data does provide some indication of the relative amounts and types of pesticides used. Most of the commonly used pesticides that were applied in these land-use settings were not detected. This lack of detection may be the
result of chemical properties of the pesticides or other physical and chemical factors affecting the transport and fate of these pesticides. For example, there may have been insufficient time for the pesticides to reach the well screen at the time of sampling, or the pesticides may have degraded before reaching the well screen. Pesticides applied to rights-of-way also were compiled, although the rights-of-way application data were reported at the county level (California Department of Pesticide Regulation, 1991) for the entire San Joaquin Valley (fig. 1); therefore, the area represented by the 1991 rights-of-way applications is larger than the area represented by the 1993 crop applications. In the discussion below on the relation between pesticide occurrence and use, 1993 crop applications and 1991 rights-of-way applications are considered separately.
Simazine was the most frequently detected pesticide in ground-water samples from the three land- use settings. The highest number of detections (10 samples) and concentration (0.28 |ig/L) of simazine occurred in ground-water samples from the vineyard land-use setting, which is consistent with the high amount of application (table 7). Simazine was applied to all three land-use settings, though only a small amount was applied in the corn, alfalfa, and vegetable
Occurrence of Pesticides 27
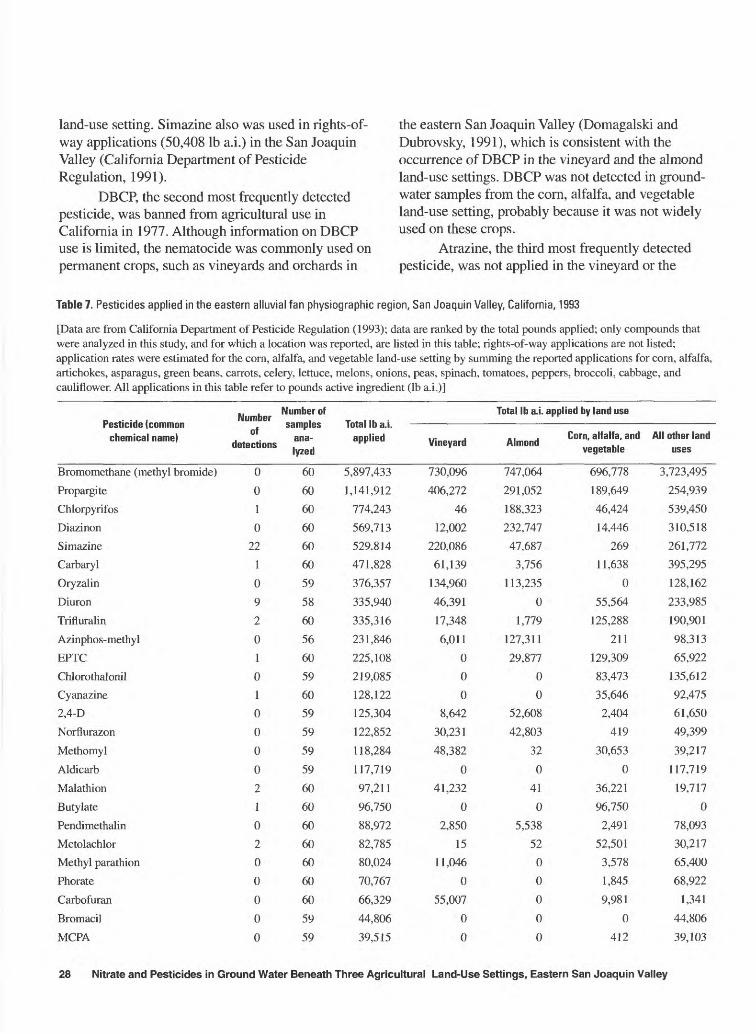
land-use setting. Simazine also was used in rights-of- way applications (50,408 Ib a.i.) in the San Joaquin Valley (California Department of Pesticide Regulation, 1991).
DBCP, the second most frequently detected pesticide, was banned from agricultural use in California in 1977. Although information on DBCP use is limited, the nematocide was commonly used on permanent crops, such as vineyards and orchards in
the eastern San Joaquin Valley (Domagalski and Dubrovsky, 1991), which is consistent with the occurrence of DBCP in the vineyard and the almond land-use settings. DBCP was not detected in ground- water samples from the corn, alfalfa, and vegetable land-use setting, probably because it was not widely used on these crops.
Atrazine, the third most frequently detected pesticide, was not applied in the vineyard or the
Table 7. Pesticides applied in the eastern alluvial fan physiographic region, San Joaquin Valley, California, 1993
[Data are from California Department of Pesticide Regulation (1993); data are ranked by the total pounds applied; only compounds that were analyzed in this study, and for which a location was reported, are listed in this table; rights-of-way applications are not listed; application rates were estimated for the corn, alfalfa, and vegetable land-use setting by summing the reported applications for corn, alfalfa, artichokes, asparagus, green beans, carrots, celery, lettuce, melons, onions, peas, spinach, tomatoes, peppers, broccoli, cabbage, and cauliflower. All applications in this table refer to pounds active ingredient (Ib a.i.)]
Pesticide (common chemical name)
Bromomethane (methyl bromide)
Propargite
Chlorpyrifos
Diazinon
Simazine
Carbaryl
Oryzalin
Diuron
Trifluralin
Azinphos-methyl
EPTC
Chlorothalonil
Cyanazine
2,4-D
Norflurazon
Methomyl
Aldicarb
Malathion
Butylate
Pendimethalin
Metolachlor
Methyl parathion
Phorate
Carbofuran
Bromacil
MCPA
.. . Number of Number ,
samples. . . ana-
detections . . lyzed
0
0
1
0
22
1
0
9
2
0
1
0
10
0
0
0
2
1
0
2
0
0
0
0
0
60
60
60
60
60
60
59
58
60
56
60
59
60
59
59
59
59
60
60
60
60
60
60
60
59
59
Total Ib a.i. applied
5,897,433
1,141,912
774,243
569,713
529.814
471,828
376,357
335,940
335,316
231,846
225,108
219,085
128,122
125,304
122,852
118,284
117,719
97,211
96,750
88,972
82,785
80,024
70,767
66,329
44,806
39,515
Total Ib a.i. applied by land use
Vineyard
730,096
406,272
46
12,002
220,086
61,139
134,960
46,391
17,348
6,011
0
0
0
8,642
30,231
48,382
0
41,232
0
2,850
15
11,046
0
55,007
0
0
Almond
747,064
291,052
188,323
232.747
47,687
3,756
113,235
0
1,779
127,311
29,877
0
0
52,608
42,803
32
0
41
0
5,538
52
0
0
0
0
0
Corn, alfalfa, and vegetable
696,778
189,649
46,424
14,446
269
11,638
0
55,564
125,288
211
129,309
83,473
35,646
2,404
419
30,653
0
36,221
96,750
2,491
52,501
3,578
1,845
9,981
0
412
All other land uses
3,723,495
254,939
539,450
310,518
261,772
395,295
128,162
233,985
190,901
98.313
65,922
135,612
92,475
61,650
49,399
39,217
117,719
19,717
0
78,093
30,217
65,400
68,922
1,341
44,806
39,103
28 Nitrate and Pesticides in Ground Water Beneath Three Agricultural Land-Use Settings, Eastern San Joaquin Valley

Table 7. Pesticides applied in the eastern alluvial fan physiographic region, San Joaquin Valley, California, 1993 Continued
Pesticide (common chemical name)
Linuron
Bromoxynil
Dacthal (DCPA)
Napropamide
c/5-Permethrin
Molinate
Pebulate
Ethoprop
Dicamba
Ethalfluralin
Benfluralin
Disulfoton
Oxamyl
Esfenvalerate
1 ,3-Dichloropropene
Alachlor
2,4-DB
Pronamide
Propanil
Parathion
Fonofos
Thiobencarb
Metribuzin
Atrazine 1
Dinoseb
Y-HCH (lindane)
1 ,2-Dichloropropane
Triclopyr
Methiocarb
Terbacil
Dichlobenil
Bentazon
Number of
detections
0
0
1
0
0
0
0
10
10
0
0
0
0
0
0
0
0
0
0
0
0
21
10
5
0
0
10
0
Number of samples
anal yzed
59
59
60
60
60
60
60
60
59
60
60
60
59
59
60
60
59
60
60
60
60
60
60
60
59
60
60
59
59
56
59
59
Total Ib a.i. applied
32,279
31,566
30,920
29,890
22,834
21,575
16,637
11,132
10,933
8,328
7,490
7,474
7,219
6,916
3,050
2,916
2,756
2,620
2,452
1,768
1,402
1,193
1,183
1,090
1,051
343
279
131
35
9
8
1
Total Ib a.i. applied by land use
Vineyard
0
0
0
2,653
0
0
0
0
0
0
0
0
0
0
245
0
0
3
0
1,130
0
0
0
0
826
0
270
0
0
0
0
0
., . Corn, alfalfa, and Almond . . , vegetable
0
0
0
11,991
8,815
0
0
0
0
0
0
3
0
1,415
363
0
0
0
0
64
0
0
0
0
70
0
0
0
0
0
0
0
32,165
5,738
28,840
3,233
4,485
0
15,297
0
7,038
1,155
7,473
2,317
3,204
1,293
2,420
1,383
2,756
215
0
157
1,402
0
1,145
139
0
288
9
0
0
0
0
0
All other land uses
114
25,828
2,080
12,013
9,534
21,575
1,340
11,132
3,895
7,173
17
5,154
4,015
4,208
22
1,533
0
2,402
2,452
417
0
1,193
38
951
155
55
0
131
35
9
8
1
The number of detections of atrazine includes atrazine or desethyl atrazine.
almond land-use settings, yet it was detected frequently in those areas (eight ground-water samples with atrazine or desethyl atrazine in each area; 40 percent). The concentrations of atrazine were low relative to the concentrations of simazine, DBCP, and diuron. In 1991, atrazine was applied on rights-of- ways (7,558 Ib a.i.) in the San Joaquin Valley, which could explain its occurrence in the vineyard and almond land-use settings. The total amount of atrazine
applied in 1993 agricultural applications was low (1,090 Ib a.i.); however, past atrazine use (commonly on corn and rights-of-way) could account for the relatively high number of detections. Atrazine also has been detected in rain and air in other parts of the country in proximity to where it has been widely used (Majewski and Capel, 1995).
Atrazine and simazine have similar chemical properties (Worthing, 1987), and both are used in
Occurrence of Pesticides 29

rights-of-way applications. Ground-water samples with detections of atrazine because of rights-of-way applications also might contain simazine from the same source. Fourteen of 22 (64 percent) ground- water samples that contained simazine also contained atrazine or desethyl atrazine. Statistically, simazine and atrazine detections are dependent (p less than 0.001; Chi-square test) and the number of detections of simazine are not significantly different than the number of detections of atrazine (p=1.0; Sign test).
The number of detections of diuron in ground- water samples was highest in the corn, alfalfa, and vegetable land-use setting (35 percent). Diuron was detected in only one vineyard ground-water sample, even though the amount applied was similar for both crop types in 1993 (table 7). Diuron was not applied in the almond land-use setting, although it was detected in one ground-water sample. The number of detections of diuron in this data set possibly reflects past diuron use that was significantly different than recent use. In 1986, diuron was applied to alfalfa at a higher rate than it was applied to vineyards (California Department of Food and Agriculture, 1986). Diuron also was one of the largest components of rights-of- way applications (313,754 Ib a.i.) in 1991. Because of the high rights-of-way applications of diuron, and the similar mobility and persistence of diuron and atrazine (Worthing, 1987), it might be expected that the number of diuron detections because of rights-of-way application would be the same, if not greater, than the number of atrazine detections (a small component of rights-of-way application) in the vineyard and the almond land-use settings. However, diuron was detected only in one ground-water sample from the vineyard land-use setting and in one sample from the almond land-use setting, whereas atrazine was detected in eight samples from the vineyard and eight samples from the almond land-use setting. Compar ison of the number of detections of diuron with other pesticides may be misleading, however, because the method detection limit for diuron (0.02 |ig/L) is more than one order of magnitude greater than for atrazine (0.001 |ig/L), and diuron recoveries were much less (mean spike recovery of 50 percent) than atrazine recoveries (mean spike recovery of 102 percent).
Eighteen other pesticides were detected in at least one ground-water sample (table 6). Twelve of the 18 pesticides were applied to crops in the eastern alluvial fans physiographic region in 1993 (table 7), although only 3 of the pesticides (malathion,
trifluralin, and carbaryl) were detected in a land-use setting in which they were applied. Five pesticides (butylate, chlorpyrifos, dacthal [DCPA], ethalfluralin, and ethoprop) that were detected in the vineyard land- use setting ground-water samples had little or no application to vineyards in the study area. Similarly, three pesticides (metolachlor, cyanazine, and terbacil) that were detected in the almond land-use setting ground-water samples were not applied to almonds. In the corn, alfalfa, and vegetable land-use setting, one pesticide (dinoseb) was detected that was not applied to crops included in that land-use setting. Metolachlor, cyanazine, and DCPA were used for rights-of-way applications in 1991, which could explain the occurrence of these pesticides in agricultural settings where they were not applied. Dinoseb (banned in the 1980s) was used in the past on alfalfa, vineyards, and orchards. Additionally, the area surrounding each well often included crops other than the targeted land-use crops, so the pesticides detected could be associated with land uses other than the targeted land use. Finally, the 1993 application of pesticides may not correspond to the specific pesticides or to the amount applied at the time the sampled ground water was recharged.
Five pesticides were detected that were not applied to crops in the study area in 1993: 1,2-dichloropropane, 1,2,3-trichloropropane, dieldrin, /?,/?'-DDE, and prometon. Although the number of detections was too low to make a statistical compar ison, 1,2-dichloropropane (four detections) and 1,2,3- trichloropropane (two detections) were detected most frequently in the vineyard land-use setting. Similarly, dieldrin and/?,/?'-DDE were detected only in the vineyard land-use setting. The almond land-use setting had the only detection of prometon, which is an herbicide applied for landscape maintenance and on rights-of-ways. The presence of some of these pesticides, such as 1,2-dichloropropane and 1,2,3- trichloropropane, could be the result of past use:1.2-dichloropropane was used as a nematocide, but was restricted from use in California during the 1980s; and 1,2,3-trichloropropane is a by-product of some of the formulations of 1,2-dichloropropane and1.3-dichloropropene. Another pesticide related to past use is/?,/?'-DDE, which is a transformation product of DOT. Many pesticides have been detected in air or rain (Majewski and Capel, 1995), supporting the possibility that some pesticides may be atmospher ically transported from other areas. In general, the detection of a pesticide in one or two ground-water
30 Nitrate and Pesticides in Ground Water Beneath Three Agricultural Land-Use Settings, Eastern San Joaquin Valley

samples provides little information about the mechanism of transport to the wells.
Three of the top five pesticides applied in the eastern alluvial fans physiographic region bromomethane, propargite, and diazinon (table 7) were not detected at any of the three land-use settings, even though they were applied at high rates, implying that the chemical properties of the pesticides and management practices are important in controlling the occurrence of pesticides in ground water.
Whereas the occurrence of simazine and DBCP is generally consistent with available information on the use of these pesticides, the occurrence of atrazine and diuron cannot be fully explained by data on their use in the recent past.
Physical and Chemical Factors Related to Occurrence of Pesticides
Pesticide occurrence has been related to factors other than pesticide use. Physical characteristics, such as well construction and hydrogeology, can have an important influence on the occurrence of pesticides. Pesticide transport to the water table can be inhibited by a number of factors, including sorption, volatilization, dispersion, and chemical or biological transformation. Many of these processes are probably most influential in the near surface. For example, microbial processes that may degrade pesticides are probably most active in the near-surface soils (Buyanovsky and others, 1993), and impeding clay or silt layers at the surface can retard the vertical movement of pesticides. Without these impeding layers, the infiltration rate may control the fate of pesticides below the root zone. Zalkin and others (1984) correlated the occurrence of EDB and simazine in the vadose zone to organic content in shallow soils (less than 8 ft) and to moisture content at greater depths at several sites in spite of the difference in chemical properties of the two pesticides. Koterba and others (1993) observed that ground-water samples from areas with well-drained soils had a higher frequency of pesticide detections than did samples from poorly drained settings. Higher pesticide detection frequencies also have been related to well- depth characteristics, such as screen depth below the water table (Koterba and others, 1993) or average well depth from land surface (Sievers and Fulhage, 1992). Studying the important factors related to pesticide occurrence can aid in identifying areas that are more
vulnerable to pesticide contamination, although establishing a causal relation between physical factors and pesticide occurrence in ground water is difficult. Barbash and Resek (1996) observed that more pesticides are detected in areas with higher soil permeability, rapid infiltration rates, and shallow wells than in other areas. Studies in California determined that greater pesticide frequency was related to shallow well depths, land use, and generally more coarse grained soil textures (Wilkerson and others, 1985; Troiano and others, 1994).
Hydrogeology and Well Construction
A series of comparisons were made to determine whether the occurrence of pesticides is related to physical characteristics, as indicated by variables such as well depth, depth-to-water, clay content, soil permeability, percent area underlain by hardpan, and percent of coarse-grained textures over the thickness of the borehole; descriptions of these variables were presented previously. Two groups were compared: ground-water samples with at least one pesticide detection and ground-water samples with no pesticide detections. Depth-to-water and percent of coarse-grained textures over the thickness of the borehole were the only physical variables that were significantly different between the ground-water samples with at least one pesticide detection and the ground-water samples with no pesticide detections (p=0.003 and p=0.001, respectively; Mann-Whitney test). Other physical variables, such as well depth, clay content, minimum soil permeability, average soil permeability, and percent area underlain by hardpan, were not significantly different between these two groups of ground-water samples (p=0.89, 0.42, 0.08, 0.52, and 0.81, respectively; Mann-Whitney test).
Depth-to-water was positively correlated with the number of pesticide detections in the ground-water samples (p=0.014, rho=0.32; Spearman's rank correlation). A positive correlation between the number of pesticides detected and the depth-to-water is counter to prevailing thought that pesticides commonly occur in greater frequency in areas where the water table is closer to the land surface (Barbash and Resek, 1996). This correlation may be an artifact of the wells with shallow depth-to-water (less than or equal to 20 ft) and corresponding ground-water samples with no detected pesticides in the almond (5 wells) and the corn, alfalfa, and vegetable (6 wells) land-use settings (fig. 9). These wells with a shallow
Occurrence of Pesticides 31

depth-to-water have significantly shallower well depths (p less than 0.001; Mann-Whitney test) and a lower percent of coarse-grained textures over the thickness of the borehole and average soil permea bility (p=0.027 and p=0.004, respectively; Mann- Whitney test). Samples from these wells also have lower dissolved-oxygen concentrations (p less than 0.001; Mann-Whitney test) and higher specific conductance (p=0.026; Mann-Whitney test) than samples from wells with a depth-to-water greater than 20 ft, indicating that the fine-grained textures at sites with a shallow water table may inhibit the transport of pesticides to ground water. Depth-to-water and the number of pesticide detections are not significantly correlated when the wells with shallow depth-to-water are removed from the data set (p=0.600, rho=-0.08; Spearman's rank correlation).
Similarly, a positive correlation between the number of pesticide detections and the percent of coarse-grained textures over the thickness of the borehole (p=0.002, rho=0.44; Spearman's rank
correlation) indicates that sediment texture is important in controlling pesticide occurrence in ground water. This relation between sediment texture and pesticide frequency is consistent with previous studies (Wilkerson and others, 1985; Koterba and others, 1993; Troiano and others, 1994), which indicate that, in areas with relatively fine-grained sediments, pesticide transport to ground water can be inhibited by slow infiltration rates and sorption. In areas with predominantly coarse-grained sediments, a rapid infiltration rate would be expected to transport more pesticides to the water table.
Water Chemistry
The relation between pesticide detections and various water chemistry characteristics was examined to identify processes that may affect pesticide trans port and fate. In particular, characteristics that indicate agricultural effects on water quality and geochemical indicators of the length of ground-water residence
201^
40
60
80
100
o 120
Q_
&
140
160
180
200
A
o o
o
A
+
O
A
A
+A
O
A
A
+ Vineyard
O Almond
A Corn, alfalfa, and vegetable
1 2 3 4 5 6 7 8 9 10 11 12 13 14 15 Number of pesticide detections in ground-water samples from each well
Figure 9. Relation between the number of pesticide detections and depth-to-water in domestic wells in the three land-use settings, eastern San Joaquin Valley, California.
32 Nitrate and Pesticides in Ground Water Beneath Three Agricultural Land-Use Settings, Eastern San Joaquin Valley

time were examined. Pesticide occurrence was analyzed in relation to specific conductance, major ions, dissolved oxygen, and tritium.
Dissolved oxygen and sulfate were the only characteristics that were significantly higher in ground-water samples with at least one pesticide detection versus samples with no pesticide detections (p=0.002 and 0.024, respectively; Mann-Whitney test). Dissolved-oxygen concentrations also were correlated positively to the number of pesticide detections (p=0.001, rho=0.41; Spearman's rank correlation). Significantly higher dissolved-oxygen concentrations were observed in the vineyard land-use setting than in the corn, alfalfa, and vegetable land-use setting (p=0.009; multiple-stage Kruskal-Wallis) (table 5). Furthermore, 80 percent of all pesticide detections came from ground-water samples in the vineyard and the almond land-use settings. Therefore, the higher frequency of pesticide detections may be governed by the same factors that result in higher concentrations of dissolved oxygen. Characteristics of the vineyard and almond land-use settings that promote high concentrations of dissolved oxygen include relatively coarse-grained sediments with low clay content, resulting in rapid infiltration of water and solutes and generally shorter ground-water residence times in the aquifer. In the corn, alfalfa, and vegetable land-use setting, low dissolved-oxygen concentrations may reflect longer ground-water residence times or higher organic carbon content of the soils because the relatively fine-grained sediments inhibit rapid infiltration of water and solutes and slow the rate of ground-water movement.
The relation between higher sulfate concentrations and the number of pesticide detections may be the result of increased agricultural effects, as indicated by the high number of pesticide detections in the vineyard and almond land-use settings, coupled with the application of sulfur in those land uses. Sulfur commonly is used as a miticide or fungicide, although it generally is insoluble unless it has undergone weathering. Sulfate is commonly applied as a soil acidifier. Slight increases in sulfate concentrations also were related to elevated nitrate concentrations, supporting a preliminary conclusion that increased concentrations of sulfate in this study area may correspond to increased agricultural effects on ground-water quality.
Chloride and sodium concentrations were correlated negatively with the number of pesticide
detections within the corn, alfalfa, and vegetable land- use setting (p less than 0.001, rho=-0.73 and p=0.014, rho=-0.54, respectively; Spearman's rank correlation). Higher concentrations of chloride and sodium could be associated with longer ground-water residence time (Bertoldi and others, 1991), which would allow more time for pesticides to degrade. The relation between ground-water residence time and the number of pesticide detections was evaluated further using tritium analyses; however, no correlation was found.
DBCP concentrations within the vineyard land- use setting were correlated positively with specific conductance and bicarbonate (p=0.018, rho=0.52 and p=0.027, rho=0.49, respectively; Spearman's rank correlation), indicating that increased salinity is associated with higher DBCP concentrations. Nitrate concentrations also were correlated to salinity in the vineyard land-use setting, and the highest number of pesticide detections was in this setting. Therefore, within the vineyard land-use setting, increasing salin ity of ground water indicates increasing vulnerability to contamination by nitrate and pesticides, likely a result of rapid infiltration of water and solutes through coarse-grained sediments.
In summary, the processes that control pesticide occurrence are different for the coarse-grained sediments and well-oxygenated waters of the vineyard and almond land-use settings, and for the fine-grained sediments and older, more saline waters of the corn, alfalfa, and vegetable land-use setting. Although the relation between land use and the number of pesticide detections is not statistically significant, ground water in the vineyard land-use setting may be the most vulnerable of the three land-use settings to contami nation by pesticides. In contrast, ground water in the corn, alfalfa, and vegetable land-use setting may be the least vulnerable to contamination by pesticides.
Comparison of NAWQA Results to Historical Data for Citrus Crops
In 1986, the CDPR studied herbicide occurrence in ground water in a citrus land-use setting (Troiano and Segawa, 1987). As described in the study design and methods section of this report, citrus was identified as a NAWQA targeted land use in the eastern San Joaquin Valley. Comparisons have been made between the number of pesticide detections in the CDPR study and the number of detections of those same pesticides in the vineyard, almond, and corn,
Occurrence of Pesticides 33

alfalfa, and vegetable land-use settings to determine whether differences in detections exist between the citrus land-use setting and the three agricultural land-use settings addressed in the NAWQA study.
The CDPR study used a random selection of wells in citrus groves in Tulare County. Citrus crops generally are located along the eastern edge of the San Joaquin Valley. Twelve relatively evenly spaced 4-mi2 cells were identified in the citrus land-use setting; 10 ground-water samples were collected from each cell. The 12 cells were oriented along a transect approxi mately parallel to the edge of the valley floor in Tulare County. To account for the spatial bias in the CDPR data set, the analyses of ground-water samples from wells within each cell in the CDPR data were con densed to represent a single representative sample for each of the 12 cells. If an individual pesticide was detected in samples from more than 50 percent of the wells sampled in a cell, it was considered to be "detected" in that cell. The analyses for the selected pesticides within the vineyard, almond, and corn, alfalfa, and vegetable land-use studies were censored at the CDPR reported detection levels to facilitate comparison between the CDPR and NAWQA results. The pesticides (and CDPR detection levels) considered were the herbicides atrazine (0.02 jig/L), bromacil (0.09 jig/L), diuron (0.03 jig/L), and simazine (0.01 jJ-g/L).
The presence of the herbicides was similar among the four land-use settings (table 8). The
number of herbicide detections was not significantly different between the four land-use settings (p=0.924; Kruskal-Wallis test) when using the adjusted detection frequencies. Atrazine was not detected in the adjusted data in the citrus land-use setting, and it was detected infrequently in the NAWQA data censored at the CDPR detection limit. Bromacil was not detected in the adjusted data for any land-use setting. Bromacil was applied primarily to citrus crops (Troiano and Segawa, 1987, table 6, p. 13) and was not applied in the vineyard, almond, or corn, alfalfa, and vegetable land-use settings in 1993 (tables 7 and 8). Diuron was detected most frequently in the citrus (25 percent) and corn, alfalfa, and vegetable (26 percent) land-use settings when using the adjusted data. Although the difference in the number of diuron detections among these four land-use settings was not significant, the higher number of detections in the citrus setting and in the corn, alfalfa, and vegetable settings are consistent with the relatively high amounts applied (table 7) in those settings (also see Troiano and Segawa, 1987, table 6, p. 13 for amounts applied in the citrus land-use setting). The 1993 pesticide application data indicate that the amount of diuron applied in the vineyard land-use setting was similar to the corn, alfalfa, and vegetable land-use setting, although diuron was only detected in one vineyard ground-water sample. In 1986, a greater amount of diuron was applied to alfalfa than to vineyards (California Department of Food and Agriculture,
Table 8. Herbicide detections in the citrus, vineyard, almond, and corn, alfalfa, and vegetable land-use settings, eastern San Joaquin Valley, California
[Citrus data compiled from Troiano and Segawa (1987). Concentrations were censored at the California Department of Pesticide Regulation's (CDPR) reported detection levels from Troiano and Segawa (1987). Number of samples or cells are shown in parentheses]
Number of detections in each land-use setting
Herbicide
Atrazine
Bromacil
Diuron
Simazine
Total number of sites or cells with a pesticide detection
Citrus, total number of
samples with a detection
11(120)
11(120)
36(122)
54 (122)
112
Citrus, number of cells with at
least one detection
7(12)
7(12)
8(12)
10(12)
12
Citrus, number of cells with more than 50
percent detections
0(12)
0(12)
3(12)
5(12)
5
Vineyard
1(20)
0(20)
1(20)
8(20)
8
Almond
2(20)
0(20)
0(19)
6(20)
7
Corn, alfalfa, and vegetable
1(20)
0(20)
5(19)
4(20)
5
34 Nitrate and Pesticides in Ground Water Beneath Three Agricultural Land-Use Settings, Eastern San Joaquin Valley

1986); therefore, the low detection rate in the vineyard land-use setting could be a result of relatively low past use. Simazine was detected most frequently in the citrus land-use setting (42 percent); however, it was also detected in the vineyard (40 percent), the almond (30 percent), and the corn, alfalfa, and vegetable (20 percent) land-use settings (using the adjusted data). Simazine occurrence in each of these land-use settings is consistent with the reported application of this herbicide in these land-use settings (tables 7 and 8; Troiano and Segawa, 1987, table 6, p. 13).
The wells in the citrus land-use setting were sampled 7 to 9 years before the current study, and it is not known whether these data represent current (1993-1995) herbicide occurrence in the citrus land- use setting. Furthermore, widespread application of these herbicides on rights-of-way may obscure the relation between herbicide application to agricultural crops and the spatial occurrence of these pesticides. However, similar conclusions were reached in both studies in that simazine and diuron were the most frequently detected of the four herbicides.
RELATIONS BETWEEN DISSOLVED CONSTITUENTS AND PHYSICAL VARIABLES
Relation Between Nitrate and Pesticides
The occurrence of nitrate and pesticides in ground water in the vineyard, almond, and corn, alfalfa, and vegetable land-use settings is related to various physical and chemical characteristics. Some processes that control the occurrence of nitrate can also control the occurrence of pesticides, and the co occurrence of these compounds can indicate an overall vulnerability to ground-water contamination. For example, Kolpin and others (1994) observed that similar aquifer characteristics are related to the presence of herbicides and excess nitrate concentra tions. A positive correlation between nitrate and herbicide concentrations enabled Istok and others (1993) to use nitrate concentrations to better predict the occurrence of the herbicide in ground water.
Comparisons were made between nitrate concentrations and pesticide detections. Nitrate con centrations were not significantly different between groups of wells with water samples containing at least one pesticide detection and those with no pesticide
detections (p=0.465; Mann-Whitney test). Similarly, the highest nitrate concentrations were not correlated with the detection of a pesticide (p=0.130; Chi-square test), even though 15 of the 18 (83 percent) samples with nitrate concentrations over the MCL also contained at least one detectable pesticide. Within the almond and corn, alfalfa, and vegetable land-use settings, nitrate concentrations were not significantly different between groups of wells with pesticide detections and those with no pesticide detections. However, nitrate concentrations were related to the occurrence of pesticides in the vineyard land-use setting. Within this setting, the difference in nitrate concentrations between wells with and without pesticides was significant (p=0.047; Mann-Whitney test), and nitrate concentrations were correlated positively to the total number of pesticide detections (p=0.010, rho=0.56; Spearman's rank correlation).
DBCP concentrations were correlated positively with nitrate concentrations in the vineyard land-use setting (p=0.010, rho=0.56; Spearman's rank correlation). DBCP was not detected frequently enough in the almond or corn, alfalfa, and vegetable land-use settings to statistically evaluate the correla tion with nitrate concentrations. As demonstrated previously, nitrate, DBCP, dissolved oxygen, and specific conductance are correlated positively within the vineyard land-use setting. Ground water in this setting may be more vulnerable to nonpoint-source agricultural contamination than in the other two land- use settings because of such characteristics as coarse grained sediments. A similar relationship between nitrate, DBCP, and specific conductance in ground water was observed by Schmidt (1983) in the central San Joaquin Valley.
Multivariate Analysis of Physical and Chemical Factors
Principal components analysis was used to investigate relations between dissolved constituents and physical variables. Principal components analysis expresses the total variance of a data set by computing components of the variance and covariance matrix of data (Davis, 1973). The first component explains the maximum variability in a data set, and the remaining components are numbered in decreasing amount of total variance explained. The magnitude of each variable "loading" expresses the relative contribution
Relations Between Dissolved Constituents and Physical Variables 35
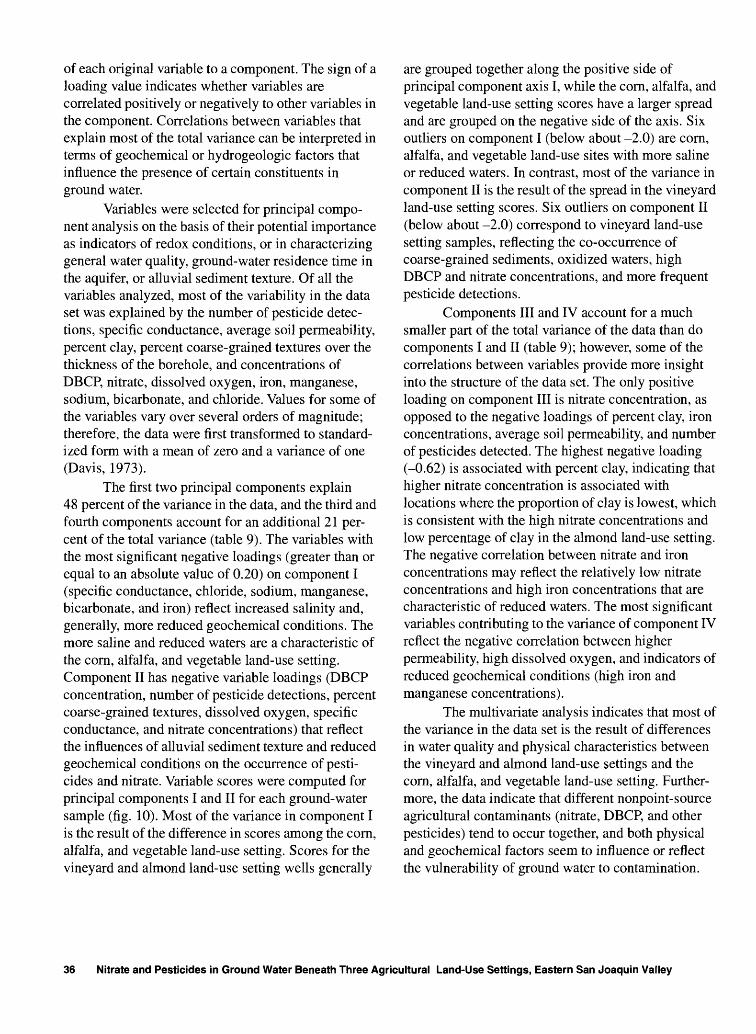
of each original variable to a component. The sign of a loading value indicates whether variables are correlated positively or negatively to other variables in the component. Correlations between variables that explain most of the total variance can be interpreted in terms of geochernical or hydrogeologic factors that influence the presence of certain constituents in ground water.
Variables were selected for principal compo nent analysis on the basis of their potential importance as indicators of redox conditions, or in characterizing general water quality, ground-water residence time in the aquifer, or alluvial sediment texture. Of all the variables analyzed, most of the variability in the data set was explained by the number of pesticide detec tions, specific conductance, average soil permeability, percent clay, percent coarse-grained textures over the thickness of the borehole, and concentrations of DBCP, nitrate, dissolved oxygen, iron, manganese, sodium, bicarbonate, and chloride. Values for some of the variables vary over several orders of magnitude; therefore, the data were first transformed to standard ized form with a mean of zero and a variance of one (Davis, 1973).
The first two principal components explain 48 percent of the variance in the data, and the third and fourth components account for an additional 21 per cent of the total variance (table 9). The variables with the most significant negative loadings (greater than or equal to an absolute value of 0.20) on component I (specific conductance, chloride, sodium, manganese, bicarbonate, and iron) reflect increased salinity and, generally, more reduced geochemical conditions. The more saline and reduced waters are a characteristic of the corn, alfalfa, and vegetable land-use setting. Component II has negative variable loadings (DBCP concentration, number of pesticide detections, percent coarse-grained textures, dissolved oxygen, specific conductance, and nitrate concentrations) that reflect the influences of alluvial sediment texture and reduced geochemical conditions on the occurrence of pesti cides and nitrate. Variable scores were computed for principal components I and II for each ground-water sample (fig. 10). Most of the variance in component I is the result of the difference in scores among the corn, alfalfa, and vegetable land-use setting. Scores for the vineyard and almond land-use setting wells generally
are grouped together along the positive side of principal component axis I, while the corn, alfalfa, and vegetable land-use setting scores have a larger spread and are grouped on the negative side of the axis. Six outliers on component I (below about -2.0) are corn, alfalfa, and vegetable land-use sites with more saline or reduced waters. In contrast, most of the variance in component II is the result of the spread in the vineyard land-use setting scores. Six outliers on component II (below about -2.0) correspond to vineyard land-use setting samples, reflecting the co-occurrence of coarse-grained sediments, oxidized waters, high DBCP and nitrate concentrations, and more frequent pesticide detections.
Components III and IV account for a much smaller part of the total variance of the data than do components I and II (table 9); however, some of the correlations between variables provide more insight into the structure of the data set. The only positive loading on component III is nitrate concentration, as opposed to the negative loadings of percent clay, iron concentrations, average soil permeability, and number of pesticides detected. The highest negative loading (-0.62) is associated with percent clay, indicating that higher nitrate concentration is associated with locations where the proportion of clay is lowest, which is consistent with the high nitrate concentrations and low percentage of clay in the almond land-use setting. The negative correlation between nitrate and iron concentrations may reflect the relatively low nitrate concentrations and high iron concentrations that are characteristic of reduced waters. The most significant variables contributing to the variance of component IV reflect the negative correlation between higher permeability, high dissolved oxygen, and indicators of reduced geochemical conditions (high iron and manganese concentrations).
The multivariate analysis indicates that most of the variance in the data set is the result of differences in water quality and physical characteristics between the vineyard and almond land-use settings and the corn, alfalfa, and vegetable land-use setting. Further more, the data indicate that different nonpoint-source agricultural contaminants (nitrate, DBCP, and other pesticides) tend to occur together, and both physical and geochemical factors seem to influence or reflect the vulnerability of ground water to contamination.
36 Nitrate and Pesticides in Ground Water Beneath Three Agricultural Land-Use Settings, Eastern San Joaquin Valley

Table 9. Correlation of variables with the first four principal components for ground-water samples collected from domestic wells in the three land-use settings, eastern Valley, California
[Only variable loadings with absolute values greater than or equal to 0.20 are reported. Concentrations were used for the variables DBCP, nitrate, chloride, sodium, manganese, bicarbonate, iron, and dissolved oxygen. DBCP, l,2-dibromo-3-chloropropane]
Variable loadings: Principal component I (32.8
percent of the total variance)
(No positive variable loadings)Specific conductance -0.43Chloride -0.42Sodium -0.41Manganese -0.39Bicarbonate -0.34Iron -0.29
Variable loadings: Principal component II (15.1
percent of the total variance)
(No positive variable loadings)DBCP
Pesticide detectionsPercent coarse-grained texturesDissolved oxygenSpecific conductanceNitrate
-0.50-0.46-0.45-0.44-0.22-0.21
Variable loadings: Principal component III (12.0 percent of the total variance)
NitratePercent clayIronAverage soil permeabilityPesticide detections
0.63-0.62-0.22-0.22-0.20
Variable loadings: Principal component IV (8.9
percent of the total variance)
Average soil permeabilityBicarbonateDissolved oxygenIronPesticide detectionsManganese
0.550.390.26
-0.46-0.28-0.26
The occurrence of nitrate and pesticides is favored at sites with a high proportion of coarse-grained sediments, a low percentage of clay in the soils, and oxidizing geochemical conditions. These conditions predominate in the vineyard and almond land-use settings on the upper and middle parts of the eastern alluvial fans of the San Joaquin Valley. However, the eastern alluvial fan region is less uniform near the basin region than it is on the coarse-grained upper and middle parts of the fans. The characteristics in the corn, alfalfa, and vegetable land-use setting range from those that are similar to the upper and middle alluvial fans to those that are more characteristic of the basin region fine-grained sediments, elevated salinity, low dissolved oxygen, and longer ground-water residence times.
COMPARISON OF DOMESTIC AND MONITORING WELL RESULTS
In many studies, production (existing) wells have been used to assess ground-water quality, but whether the type of well can affect water quality has not yet been established. Barbash and Resek (1996) investigated the distribution, trends, and governing factors related to pesticides in ground water of the United States and evaluated differences in well type in relation to the frequency of detected pesticides. Two studies (one local study in Illinois and an aggregated nationwide database study) described by Barbash and Resek (1996) indicated a higher percentage of pesticides detected in monitoring wells than in domestic wells. A higher number of pesticide detections in monitoring wells might be expected, because monitoring wells are typically shallow and often are installed in areas of known or suspected contamination. In two other studies, the correlation between the occurrence of nitrate and herbicides in ground water beneath active farm fields and in farm wells (including domestic wells) was observed (Rudolph and Goss, 1992, 1993). Comparisons were made between nitrate and herbicide concentrations in water samples from production wells and multilevel monitoring wells. Although overall contamination in the shallowest farm wells (production wells) was correlated strongly with the ground-water quality
Comparison of Domestic and Monitoring Well Results 37

oQ.
05g. 'oc -1
-2
-3
-4
+ Vineyardo AlmondA Corn, alfalfa, and vegetable
A
AA A
A
A
A+
A
A $
uA__°_Q.
o + +
Fine textured; more reduced; lower salinity;
lower DBCP, nitrate, and pesticides
Coarse textured;more oxidized;higher salinity;
higher DBCP, nitrate,and pesticides
-10 -8
Higher salinity; more reduced
-6 -4 -2 Principal component 1 Lower salinity;
more oxidized
Figure 10. Variable scores for each ground-water sample collected from domestic wells in the three land-use settings for principal components I and II, eastern San Joaquin Valley, California. The variables that have the highest variable loadings on each principal component are listed.
directly beneath cultivated fields, the correlation between nitrate concentrations and well type was not consistent. Barbash and Resek (1996) concluded that the number of pesticides detected may be better correlated with the method of well construction than the well type, implying that well depth and adequate well seals may be more important than the relative volume of water pumped in reducing the likelihood of contamination reaching a well.
The shallowest existing wells domestic wells were used in this study to assess the effects of overlying land use on the occurrence and distribution of nitrate and pesticides in ground water. However, whether the ground-water samples from domestic wells adequately represent the quality of water recently recharged beneath the targeted crops is not known. The effects of agricultural land use on ground- water quality may best be addressed by sampling shallow monitoring wells in the farmed fields that are screened near the water table. Shallow monitoring wells would be more suitable to capture water percolating past the root zone of overlying crops. However, the costs to drill and install monitoring wells
for ground-water assessment are often prohibitive, especially in areas where the depth-to-water is greater than about 20 ft. Domestic wells may be more vulnerable to local contamination from nearby household septic systems or by poor well construction, such as a gravel-packed annulus or an inadequate surface seal that allows contaminants at the land surface (from mixing or storage of agricultural chemicals, cleaning of farm equipment, or backyard gardens or lawns) to travel rapidly down the annular space and reach the well screen. Domestic wells are pumped more frequently and typically at higher rates than are monitoring wells, which may induce a sufficient vertical gradient to draw constituents in the shallow part of the aquifer vertically downward to the well screen, or it may draw in water that was recharged in an area overlain by a different land use.
In this study, a pair of monitoring wells was installed adjacent to five domestic wells in each of the three land-use settings (for a total of 15 monitoring well pairs) to investigate the possible differences in the concentration and occurrence of nitrate and pesticides as a function of well type and proximity to the targeted
38 Nitrate and Pesticides in Ground Water Beneath Three Agricultural Land-Use Settings, Eastern San Joaquin Valley
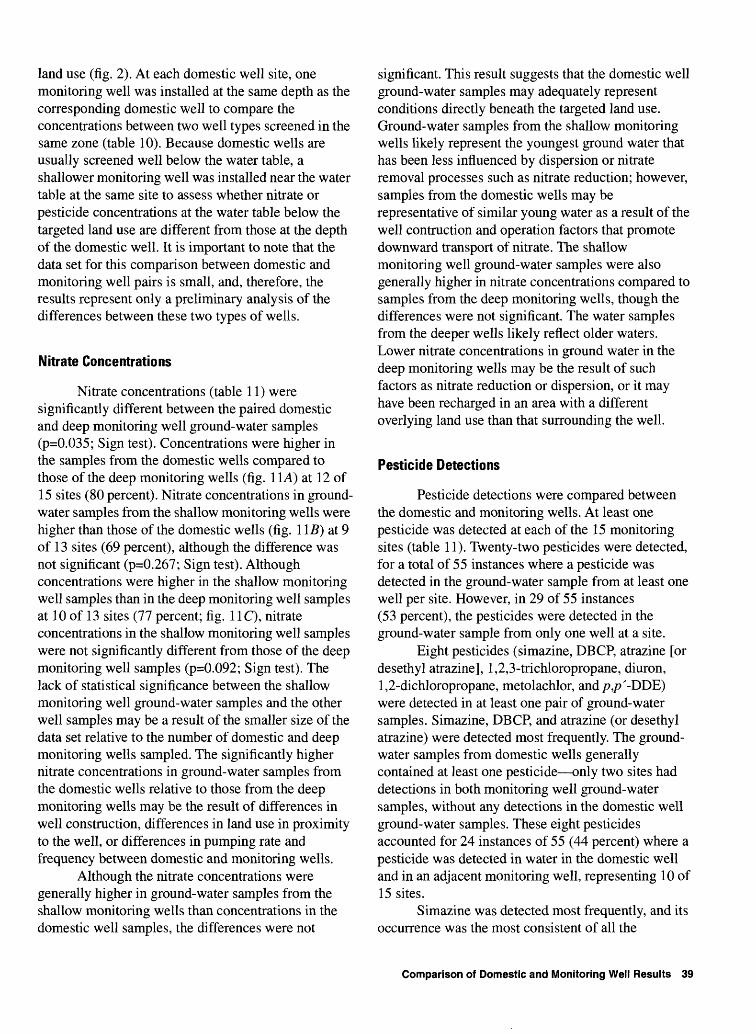
land use (fig. 2). At each domestic well site, one monitoring well was installed at the same depth as the corresponding domestic well to compare the concentrations between two well types screened in the same zone (table 10). Because domestic wells are usually screened well below the water table, a shallower monitoring well was installed near the water table at the same site to assess whether nitrate or pesticide concentrations at the water table below the targeted land use are different from those at the depth of the domestic well. It is important to note that the data set for this comparison between domestic and monitoring well pairs is small, and, therefore, the results represent only a preliminary analysis of the differences between these two types of wells.
Nitrate Concentrations
Nitrate concentrations (table 11) were significantly different between the paired domestic and deep monitoring well ground-water samples (p=0.035; Sign test). Concentrations were higher in the samples from the domestic wells compared to those of the deep monitoring wells (fig. 1 1 A) at 12 of 15 sites (80 percent). Nitrate concentrations in ground- water samples from the shallow monitoring wells were higher than those of the domestic wells (fig. 1 IB) at 9 of 13 sites (69 percent), although the difference was not significant (p=0.267; Sign test). Although concentrations were higher in the shallow monitoring well samples than in the deep monitoring well samples at 10 of 13 sites (77 percent; fig. 11C), nitrate concentrations in the shallow monitoring well samples were not significantly different from those of the deep monitoring well samples (p=0.092; Sign test). The lack of statistical significance between the shallow monitoring well ground-water samples and the other well samples may be a result of the smaller size of the data set relative to the number of domestic and deep monitoring wells sampled. The significantly higher nitrate concentrations in ground-water samples from the domestic wells relative to those from the deep monitoring wells may be the result of differences in well construction, differences in land use in proximity to the well, or differences in pumping rate and frequency between domestic and monitoring wells.
Although the nitrate concentrations were generally higher in ground-water samples from the shallow monitoring wells than concentrations in the domestic well samples, the differences were not
significant. This result suggests that the domestic well ground-water samples may adequately represent conditions directly beneath the targeted land use. Ground-water samples from the shallow monitoring wells likely represent the youngest ground water that has been less influenced by dispersion or nitrate removal processes such as nitrate reduction; however, samples from the domestic wells may be representative of similar young water as a result of the well contraction and operation factors that promote downward transport of nitrate. The shallow monitoring well ground-water samples were also generally higher in nitrate concentrations compared to samples from the deep monitoring wells, though the differences were not significant. The water samples from the deeper wells likely reflect older waters. Lower nitrate concentrations in ground water in the deep monitoring wells may be the result of such factors as nitrate reduction or dispersion, or it may have been recharged in an area with a different overlying land use than that surrounding the well.
Pesticide Detections
Pesticide detections were compared between the domestic and monitoring wells. At least one pesticide was detected at each of the 15 monitoring sites (table 11). Twenty-two pesticides were detected, for a total of 55 instances where a pesticide was detected in the ground-water sample from at least one well per site. However, in 29 of 55 instances (53 percent), the pesticides were detected in the ground-water sample from only one well at a site.
Eight pesticides (simazine, DBCP, atrazine [or desethyl atrazine], 1,2,3-trichloropropane, diuron, 1,2-dichloropropane, metolachlor, and/?,/?'-DDE) were detected in at least one pair of ground-water samples. Simazine, DBCP, and atrazine (or desethyl atrazine) were detected most frequently. The ground- water samples from domestic wells generally contained at least one pesticide only two sites had detections in both monitoring well ground-water samples, without any detections in the domestic well ground-water samples. These eight pesticides accounted for 24 instances of 55 (44 percent) where a pesticide was detected in water in the domestic well and in an adjacent monitoring well, representing 10 of 15 sites.
Simazine was detected most frequently, and its occurrence was the most consistent of all the
Comparison of Domestic and Monitoring Well Results 39
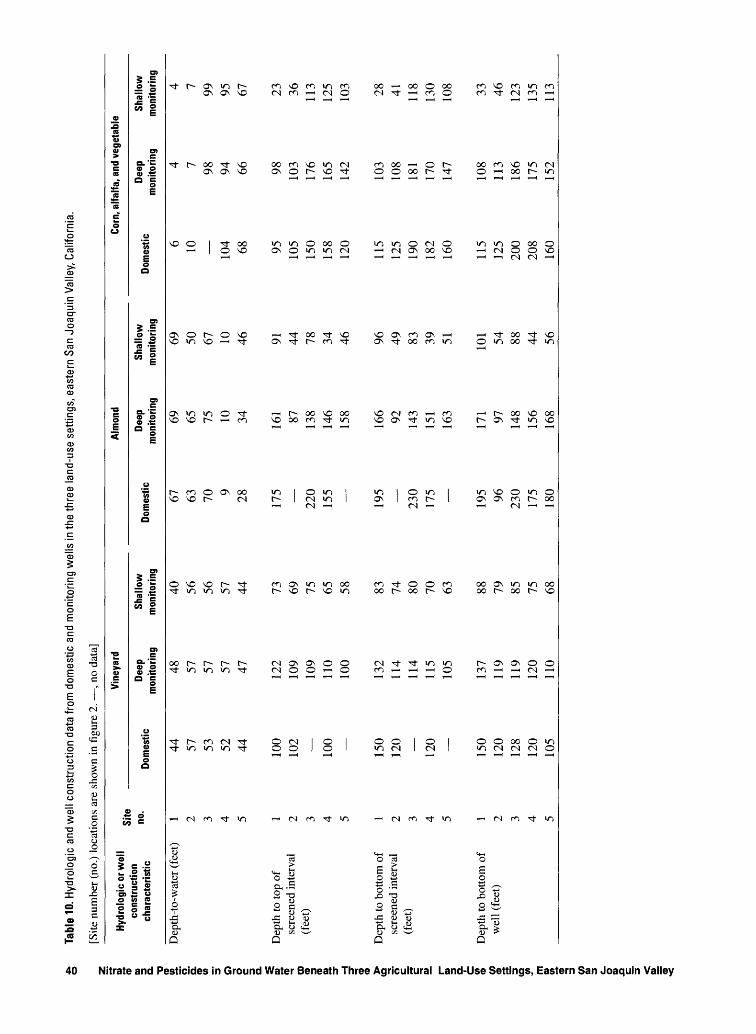
Tabl
e 10
. Hyd
rolo
gic
and
wel
l co
nstr
uctio
n da
ta fr
om d
omes
tic a
nd m
onito
ring
wel
ls in
the
thre
e la
nd-u
se s
ettin
gs,
east
ern
San
Joaq
uin
Val
ley,
Cal
iforn
ia.
[Site
num
ber
(no.
) lo
catio
ns a
re s
how
n in
fig
ure
2. , n
o da
ta]
litrate
and
P< w
CO o'
E (D <0 5' o o c 3 Q.
Q) 5 03 (D 3 (D 5 H (Q o' C_ i. Q) 3 Q.
C (0
(D S (Q JO m Q)
(0
Hyd
rolo
gic
or w
ell
cons
truct
ion
char
acte
rist
ic
Dep
th-t
o-w
ater
(fe
et)
Dep
th to
top
of
scre
ened
int
erva
l(f
eet)
Dep
th to
bot
tom
of
scre
ened
inte
rval
(fee
t)
Dep
th to
bot
tom
of
wel
l (f
eet)
Site
no
.
1 2 3 4 5 1 2 3 4 5 1 2 3 4 5 1 2 3 4 5
Dom
estic
44 57 53 52 44 100
102
100 150
120 120 150
120
128
120
105
Vin
eyar
d
Dee
p m
onito
ring
48 57 57 57 47 122
109
109
110
100
132
114
114
115
105
137
119
119
120
110
Shal
low
m
onito
ring
40 56 56 57 44 73 69 75 65 58 83 74 80 70 63 88 79 85 75 68
Dom
estic
67 63 70 9 28 175 _ 220
155 195 _ 230
175 195 96 230
175
180
Alm
ond
Dee
p m
onito
ring
69 65 75 10 34 161 87 138
146
158
166 92 143
151
163
171 97 148
156
168
Corn
, alfa
lfa, a
nd v
eget
able
Shal
low
m
onito
ring
69 50 67 10 46 91 44 78 34 46 96 49 83 39 51 101 54 88 44 56
Dom
estic 6 10 104 68 95 105
150
158
120
115
125
190
182
160
115
125
200
208
160
Dee
p m
onito
ring
4 7 98 94 66 98 103
176
165
142
103
108
181
170
147
108
113
186
175
152
Shal
low
m
onito
ring
4 7 99 95 67 23 36 113
125
103 28 41 118
130
108 33 46 123
135
113
o Q)
£>

Table 11. Nitrate and pesticide concentrations in ground-water samples collected from domestic and monitoring wells in the three land-use settings, eastern San Joaquin Valley, California
[Compounds are ranked by the total number of detections in domestic well samples. *, less than values are the method reporting limit; <, less than; E, estimated value; , no data. Site number (no.) locations are shown in figure 2. Nitrate concentrations are in milligrams per liter. All other compound concentrations are in micrograms per liter]
Compound
Nitrate
Simazine
1,2-Dibromo-3-chloro-propane (DBCP)
Atrazine
Desethyl atrazine
1,2,3-Trichlor-opropane*
Site no.
12
3
4
5
12
3
4
5
1
2
3
4
5
12
3
4
5
12
3
4
5
1
34
Domestic
2.00.70
9.8
6.1
11
0.0090.055
0.020
0.004E
0.200
<0.03
<0.03
0.09
3.2
1.9
0.0060.006
<0.001
0.003
0.004
<0.002<0.002
<0.002
<0.002
<0.002
<0.2
<0.20.3
Vineyard
Deep monitoring
0.240.32
22
5.9
9.4
0.0520.170
<0.005
0.008
0.230
0.04
<0.03
<0.03
4.0
2.5
<0.001<0.001
<0.001
<0.001
<0.001
<0.0020.006E
<0.002
0.002E
<0.002
<0.2
<0.20.4
Shallow monitoring
2.48.2
20
5.4
7.0
0.0150.054
0.006
0.110
<0.03
<0.03
<0.03
0.40
<0.03
<0.001<0.001
<0.001
<0.001
<0.002<0.002
<0.002
0.003E
<0.2
<0.2
Domestic
2037
10
9.9
2.9
0.023<0.005
<0.005
<0.005
<0.005
0.04
0.79
2.6
<0.03
<0.03
<0.001<0.001
<0.001
<0.001
<0.001
0.002E0.002E
<0.002
<0.002
<0.002
<0.2
0.2<0.2
Almond
Deep monitoring
9.132
7.1
4.8
3.0
<0.0050.500
<0.005
<0.005
<0.005
0.13
0.55
1.5
<0.03
<0.03
<0.0010.004
<0.001
<0.001
<0.001
<0.0020.006E
<0.002
<0.002
<0.002
<0.2
<0.2<0.2
Corn, alfalfa, and vegetable
Shallow monitoring
17
14
53
4.3
0.009
<0.005
<0.005
<0.005
0.12
3.3
<0.03
<0.03
<0.001
<0.001
<0.001
<0.001
<0.002 <0.002
<0.002
<0.002
0.4
<0.2<0.2
Domestic
294.0
14
4.8
1.4
<0.005<0.005
0.006
0.110
0.009
<0.03
<0.03
<0.03
<0.03
<0.03
<0.001
<0.001
<0.001
0.002
0.009
<0.002<0.002
<0.002
0.005E
<0.002
<0.2
<0.2<0.2
Deep monitoring
244.2
6.2
4.2
0.19
<0.005<0.005
0.003E
0.069
<0.005
<0.03
<0.03
<0.03
<0.03
<0.03
<0.001
<0.001
0.002
0.001E
<0.001
0.004E<0.002
<0.002
0.003E
<0.002
<0.2
<0.2<0.2
Shallow monitoring
3318
18
5.3
1.2
<0.005<0.005
<0.005
0.049
0.002E
<0.03
<0.03
<0.03
<0.03
<0.03
0.010<0.001
<0.001
<0.001
<0.001
0.014E<0.002
<0.002
0.002E
<0.002
<0.2
<0.2<0.2
Malathion 0.004 <0.005 <0.005 <0.005 <0.005 <0.005 0.100 <0.005 <0.005
Comparison of Domestic and Monitoring Well Results 41

Table 11. Nitrate and pesticide concentrations in ground-water samples collected from domestic and monitoring wells in the three land-use settings, eastern San Joaquin Valley, California Continued
Compound
Diuron
1,2-Dichloro-propane*
Metolachlor
Trifluralin
Butylate
Chlorpyrifos
Cyanazine
Dacthal (DCPA)
p,p'-DDE
Dieldrin
Ethalfluralin
Terbacil
Dinoseb
EPTC
Prometon
Triallate
Total number ofpesticide detections
Site no.
245
4
1
5
5
5
1
35
145
5
5
1
3
2
13
3
1
2
345
Domestic
<0.02<0.02<0.02
0.4
<0.002
0.007
0.002
0.006
<0.004
<0.0020.003
<0.006<0.006
0.001E
0.007
0.005
<0.007
<0.035
<0.002
<0.018<0.018
<0.001
2
22
511
Vineyard
Deep monitoring
<0.02<0.02
0.05
0.5
<0.002
<0.012
<0.008
<0.005
<0.004
<0.002<0.002
<0.0060.003E
<0.006
<0.008
<0.013
<0.007
<0.035
<0.002
<0.018<0.018
<0.001
2
2
063
Shallow monitoring
<0.02<0.02<0.02
_
<0.002
<0.012
<0.008
<0.005
<0.004
0.004<0.002
<0.006
0.003E
<0.008
<0.013
<0.007
<0.035
<0.002
<0.018<0.018
<0.001
1
1
213
Domestic
<0.02<0.02<0.02
<0.2
1.3
<0.012
<0.008
<0.005
0.008
<0.002<0.002
<0.006<0.006<0.006
<0.008
<0.013
0.160
<0.035
<0.002
<0.018<0.018
<0.001
6
2200
Almond
Deep monitoring
<0.02<0.02<0.02
<0.2
<0.002
<0.012
<0.008
<0.005
<0.004
<0.002<0.002
0.002E<0.006<0.006
<0.008
<0.013
<0.007
<0.035
0.091
0.009E0.009E
<0.001
3
42
00
Corn, alfalfa, and vegetable
Shallow monitoring
<0.02<0.02
<0.2
0.003
<0.012
<0.008
<0.005
<0.004
<0.002<0.002
<0.006<0.006<0.006
<0.008
<0.013
<0.007
0.060
<0.018<0.018
0.002
4
0300
Domestic
<0.020.05E
<0.2
<0.002
<0.012
<0.008
<0.005
<0.004
<0.002<0.002
<0.006<0.006<0.006
<0.008
<0.013
<0.007
<0.035
<0.002
<0.018<0.018
<0.001
0
0133
Deep monitoring
0.002E<0.02<0.02
<0.2
<0.002
<0.012
<0.008
<0.005
<0.004
<0.002<0.002
<0.006<0.006<0.006
<0.008
<0.013
<0.007
<0.035
<0.002
0.022<0.018
<0.001
2
1220
Shallow monitoring
0.002E0.25E
<0.02
<0.2
<0.002
<0.012
<0.008
<0.005
<0.004
<0.002<0.002
<0.006<0.006<0.006
<0.008
<0.013
<0.007
<0.035
<0.002
<0.018<0.018
<0.001
2
1031
42 Nitrate and Pesticides in Ground Water Beneath Three Agricultural Land-Use Settings, Eastern San Joaquin Valley

BCO
c -^IE £ 8
3 o>2 E±± o
0 5 10 15 20 25 30 35 40Nitrate concentration in deep monitoring
well samples, in milligrams per liter
40
35
30
25
20
15
10
5
0 5 10 15 29 25 30 35 40 Nitrate concentration in shallow monitoring
well samples, in milligrams per liter
0 5 10 15 20 25 30 35 40Nitrate concentration in deep monitoring
well samples, in milligrams per liter
Figure 11. Nitrate concentrations in paired ground-water samples collected from domestic wells in the three land-use settings, eastern San Joaquin Valley, California. A Domestic well and deep monitoring well; B. Domestic well and shallow monitoring well; C. Shallow and deep monitoring wells. Nitrate concentration is reported as nitrogen.
pesticides. At 9 of 10 sites where simazine was detected, it was found in ground-water samples from the domestic well and in at least one of the adjacent monitoring wells (table 12). The concentration of simazine was higher in the deep monitoring well ground-water sample than in the domestic well sample at four of six sites where it was detected; it was higher in the deep monitoring well sample than in the shallow monitoring well sample at four of four sites where it was detected in both wells, though the overall differ ences in concentrations were not statistically signifi cant (p=1.25 and 0.289, respectively; Sign test). Similarly, the differences in simazine concentrations were not significant between the domestic and shallow monitoring well ground-water samples (p=0.070; Sign test), though the domestic well samples had slightly higher concentrations at six of seven sites where it was detected in both the domestic and shallow monitoring wells.
DBCP detections in the domestic and moni toring wells were generally consistent. DBCP was detected in the domestic well ground-water samples and in at least one of the adjacent monitoring well samples at five of seven sites where it was detected. The DBCP concentration was higher in the deep monitoring well ground-water sample than in the domestic well sample at three of five sites, and higher in the deep monitoring well sample than in the shallow monitoring well sample at two of three sites. The concentration of DBCP was higher in the shallow monitoring well ground-water sample than in the domestic well sample at two of three sites. Statistical comparisons between the concentrations of DBCP were not made because of the high number of ground- water samples with concentrations below the detection limit.
Atrazine detections were not as consistent as simazine and DBCP detections, although at 5 of 10 sites where atrazine was detected, it was detected in the domestic well ground-water sample and in at least one adjacent monitoring well sample. In contrast to simazine and DBCP, the atrazine concentration was higher in the domestic well ground-water sample than it was in the deep monitoring well sample at two of four sites where it was detected in samples from both wells. Atrazine concentration was higher in the deep monitoring well ground-water sample than it was in the shallow monitoring well sample at one site, and higher in the shallow monitoring well sample than it was in the deep monitoring well sample at another site.
Comparison of Domestic and Monitoring Well Results 43

Table 12. Number of pesticide detections in ground-water samples collected from domestic and monitoring wells in the three land-use settings, eastern San Joaquin Valley, California
Total number of detections
Compound
Simazine
l,2-dibromo-3-chloropropane(DBCP)
Atrazine or desethylatrazine
Domestic well samples (total
number of samples, 15)
9
6
8
Deep monitoring well samples
(total number of samples, 15)
7
6
6
Shellow monitoring well samples (total
number of samples, 13)
7
3
3
Number of sites with pesticide detections
Domestic and deep monitoring well samples
2
2
3
Domestic and shallow
monitoring well samples
3
0
1
Deep and shallow monitoring well
samples
0
0
1
Domestic, deep and shallow
monitoring well samples
4
3
1
In general, the concentrations and frequencies of pesticide detections discussed previously indicate that the ground water sampled from domestic wells was not much different from the ground water sampled at the adjacent monitoring wells. At most sites where pesticides were detected in at least two wells, one well was a domestic well (92 percent of the sites with at least two pesticide detections). The deep monitoring well ground-water samples had higher concentrations of simazine and DBCP than the domestic or shallow monitoring well at most sites, in contrast to the nitrate concentrations, which were higher in samples from the domestic and shallow monitoring wells than from the deep monitoring wells. Because the deep monitoring well ground-water samples are more likely to represent older waters, the higher concentrations are possibly the result of larger application rates and higher leaching rates of the past. Currently, simazine is restricted from use in some areas in California, whereas DBCP was banned from use in the late 1970s. As noted earlier, the data set for this comparison between domestic and monitoring well pairs is small, and the results represent only a preliminary analysis of the differences between these two types of wells.
SUMMARY AND CONCLUSIONS
An assessment of the occurrence of nitrate and pesticides in shallow ground water in the eastern San Joaquin Valley was completed during 1993-1995. The results of this investigation were used to relate shallow ground-water quality in three regionally extensive agricultural land-use settings to natural and human factors in an attempt to understand the processes that govern the occurrence and concentrations of nitrate
and pesticides in ground water. A network of 60 domestic wells was sampled in three agricultural land- use settings: vineyards, almond orchards, and a crop grouping of corn, alfalfa, and vegetables. In addition to the domestic well network, a network of 30 moni toring wells was installed near some of the sampled domestic wells and sampled to determine whether water from domestic wells was representative of the most recently recharged ground water underlying the targeted land-use setting.
Nitrate concentrations (dissolved nitrate plus nitrite, as nitrogen) in water samples from the 60 domestic wells ranged from less than 0.05 to 55 milligrams per liter (mg/L). Nitrate concentrations exceeded the maximum contaminant level (MCL) in 18 of 60 (30 percent) ground-water samples. Concen trations in the almond land-use setting were signifi cantly higher than they were in the vineyard land-use setting. Nitrate concentrations exceeded the MCL in 8 of 20 (40 percent) ground-water samples from the almond land-use setting; in the vineyard land-use setting, the concentration of nitrate exceeded the MCL in only 3 of 20 (15 percent) ground-water samples. Nitrate concentrations in ground-water samples from the corn, alfalfa, and vegetable land-use setting were intermediate between those of the other two land uses; 7 of 20 samples (35 percent) exceeded the MCL.
Differences in nitrate concentrations have been linked to nitrogen applications, physical character istics of the alluvial sediments, and ground-water chemistry. High nitrate concentrations in ground water at the almond land-use setting are consistent with overall high nitrogen application rates, although nitrate concentrations in ground water from individual wells were not well correlated to local-scale estimates of the amount of nitrogen applied at the land surface. Local-scale application estimates for the wells in the
44 Nitrate and Pesticides in Ground Water Beneath Three Agricultural Land-Use Settings, Eastern San Joaquin Valley

vineyard land-use setting of nitrogen fertilizer, plus confined animal feedlots within 0.25- or 0.5-mile radii, were significantly lower than the application estimates for the almond and corn, alfalfa, and vegetable land-use well sites. The local-scale application estimates for the well sites in the corn, alfalfa, and vegetable land-use setting were similar to the application estimates for the well sites in the almond land-use setting.
Although nitrate concentrations were different between the vineyard and the almond land-use settings, these two settings have similar physical and chemical characteristics. All three land-use settings were within the eastern alluvial fan physiographic region; however, the vineyard and the almond land-use settings are on the coarse-grained, upper and middle parts of the alluvial fans, which probably provides an opportunity for rapid infiltration of water and solutes. Sediments in the corn, alfalfa, and vegetable land-use setting, on the lower parts of the alluvial fans near the basin region, are more variable and often are more fine grained than sediments in the vineyard and almond land-use settings. Analysis of the data indicates that the relatively fine-grained sediments associated with the corn, alfalfa, and vegetable land-use setting likely result in slower infiltration rates and longer ground- water residence times, allowing more time for nitrate to be affected by processes such as nitrate reduction.
Evaluation of major ion chemistry indicates that elevated nitrate concentrations are associated with increased proportions of chloride and sulfate, which are consistent with agriculturally affected waters. Specific conductance was correlated positively to nitrate concentrations in ground water in the vineyard and almond land-use settings, but not in the corn, alfalfa, and vegetable land-use setting. Lack of correlation between nitrate and specific conductance in this setting may be caused by other sources of salinity, as indicated by the greater variability and longer ground-water residence times in this land-use setting than the other two land-use settings. Also, dissolved-oxygen concentrations were significantly lower, and iron and manganese were detected more frequently, in water samples from the corn, alfalfa, and vegetable land-use setting, indicating that nitrate reduction may be an important factor in controlling nitrate concentrations in ground water in this land-use setting.
Pesticides were detected in 41 of 60 (68 percent) ground-water samples; 28 (47 percent)
samples contained two or more pesticides. The vineyard land-use setting had the greatest number of wells (80 percent) with at least one detection, followed by the almond land-use setting (70 percent) and the corn, alfalfa, and vegetable land-use setting (55 percent). The difference in the number of pesticide detections in each land-use setting was not significant. Although a total of 23 pesticides was detected among the three land-use settings, only 5 pesticides were detected in more than 10 percent of the samples: simazine (37 percent), DBCP (30 percent), atrazine (25 percent), desethyl atrazine (25 percent), and diuron (15 percent). All the concentrations were less than state and federal drinking water standards, with the exception of DBCP, which exceeded the MCL of 0.2 micrograms per liter (|Ug/L) in 15 wells (25 percent).
Simazine concentrations ranged from less than 0.005 to 0.28 |Lig/L. Simazine was detected in 50 percent of the vineyard land-use well ground-water samples, compared to 30 percent in both the almond and corn, alfalfa, and vegetable land-use settings. Simazine is widely used in the study area, and the relative frequency of simazine detections in the three land-use settings is consistent with the 1993 reported applications.
Atrazine concentrations ranged from less than 0.001 to 0.069 |Lig/L. Although atrazine was not applied in the vineyard or almond land-use setting (in 1993), atrazine (or desethyl atrazine) was detected in 40 percent of the ground-water samples from each of these land uses. Detection of atrazine may be the result of rights-of-way applications in the study area.
Diuron concentrations in the ground-water samples ranged from less than 0.020 to 1.8 |Ug/L. Diuron was detected more frequently in the corn, alfalfa, and vegetable land-use setting (35 percent) than in either the vineyard (5 percent) or almond (5 percent) land-use settings. The contrast in diuron occurrence cannot be explained by recent (1993) application data because the amount applied in the vineyard land-use setting is similar to that applied in the corn, alfalfa, and vegetable land-use setting. Diuron was also used as a large component of rights-of-way application, however.
DBCP concentrations ranged from less than 0.03 to 3.2 |ng/L. DBCP was detected in 60 percent of the vineyard land-use ground-water samples and in 30 percent of the almond land-use ground-water samples. DBCP was not detected in any corn, alfalfa, and
Summary and Conclusions 45

vegetable land-use ground-water samples. The occurrence of DBCP in ground water was consistent with the past use of this pesticide.
Although the number of pesticide detections was not statistically different (at oc=0.05) among the three land-use settings, pesticide detections were related to physical and chemical characteristics. The number of pesticide detections was correlated positively to the depth-to-water and to the percent of coarse-grained textures over the thickness of the borehole. This positive correlation between the number of pesticide detections and depth-to-water is influenced by 11 wells with very shallow (less than or equal to 20 feet) depth-to-water and fine-grained textures. At these sites, the fine-grained textures may inhibit the transport of pesticides to ground water. Dissolved-oxygen concentrations also were correlated positively to the number of pesticide detections. The highest dissolved-oxygen concentrations and the highest number of pesticide detections occurred in the vineyard land-use setting, consistent with rapid infiltration of water and solutes in this area. Chloride and sodium concentrations (indicators of salinity) were correlated negatively with the number of pesticide detections in the corn, alfalfa, and vegetable land-use setting. Increased salinity in this land-use setting may be associated with longer ground-water residence times, allowing more time for pesticides to degrade.
The results from a previous study on herbicides in ground water beneath a citrus land-use setting were compared to the occurrence of these pesticides beneath the vineyard, almond, and corn, alfalfa, and vegetable land-use settings. After adjusting the results to remove spatial bias and censoring the data at the highest detection limit, the number of herbicide detections (atrazine, bromacil, diuron, and simazine) was not significantly different among the four land-use settings. Simazine and diuron were detected more frequently in the citrus land-use setting than in the other land-use settings, and their occurrence was consistent with reported applications. Atrazine was not detected in the citrus land-use setting, but it was detected at least once in each of the other land-use settings. Bromacil was not detected in any of the land-use settings in the adjusted data.
The co-occurrence of nitrate and pesticides could be linked to processes that indicate increased vulnerability of ground water to agricultural nonpoint- source contamination. Fifteen of 18 (83 percent)
ground-water samples with nitrate concentrations greater than the MCL also had at least one pesticide detection. However, nitrate concentrations were not significantly different between groups of wells with water samples containing at least one pesticide detec tion and those with no pesticide detections, and the highest nitrate concentrations were not correlated with pesticide detections. Within the vineyard land-use setting, nitrate concentrations were correlated positively to pesticide occurrence; the nitrate concentrations in ground-water samples with at least one pesticide detection were significantly higher than concentrations in samples with no detected pesticides, and DBCP concentrations were positively correlated with nitrate concentrations.
Multivariate analysis indicated that most of the variability in the data set was explained by variables that indicate high salinity and reduced geochemical conditions both characteristics of the corn, alfalfa, and vegetable land-use setting. Nitrate, DBCP, and the number of pesticide detections were associated with the percentage of coarse-grained textures over the thickness of the borehole, dissolved oxygen, and specific conductance, reflecting the influence of rapid water infiltration on nitrate and pesticide occurrence.
The differences in water-quality results between ground-water samples from existing (domestic) wells and monitoring wells installed during this study were generally not significant, although some contrast in the occurrence and concentrations of nitrate and pesticides was observed. Nitrate concentrations in the domestic well ground-water samples were higher than in the adjacent deep monitoring well samples at 80 percent of the well sites, and the difference was statistically significant. Nitrate concentrations were higher in the shallow monitoring well ground-water samples than in the deep monitoring well samples at 77 percent of the sites, and higher than the domestic well samples at 69 percent of the sites, although the differences were not significant. Although a limited number of sites was used to compare domestic and monitoring well ground-water samples, the results indicate that samples from domestic wells in the eastern San Joaquin Valley may adequately represent nitrate concentrations in ground water associated with nearby agricultural land use.
Differences among the concentration and occurrence of nitrate and some pesticides in ground water at the three land-use settings studied can be
46 Nitrate and Pesticides in Ground Water Beneath Three Agricultural Land-Use Settings, Eastern San Joaquin Valley
attributed partially to the use of these agricultural compounds at the targeted land uses. Additionally, analysis of the physical and chemical factors indicate that ground water in the upper and middle parts of the eastern alluvial fans region is more vulnerable to contamination by nonpoint-source agricultural compounds than ground water in the lower part of the alluvial fans near the basin region. By inference, agricultural contamination of ground water is less likely in the basin region than in the eastern alluvial fans region because the basin region has a greater abundance of clay and more reduced geochemical conditions. These findings could be considered in the implementation of a coherent monitoring network for assessing nonpoint-source contamination of ground water by agricultural sources in the San Joaquin Valley.
The occurrence of pesticides in ground-water samples from the different wells indicates that ground water sampled from domestic wells was not much different from the ground water sampled in the adjacent monitoring wells. At most sites where pesticides were detected in at least two wells, one well was a domestic well (92 percent of the sites with at least two pesticide detections).
In conclusion, the concentrations and occurrence of nitrate and pesticides in ground-water samples from domestic wells in the eastern San Joaquin Valley are generally due to nearby agricultural use of these compounds. The data indicate that nitrate contamination is a greater threat to drinking water quality than the threat of pesticide contamination with the exception of DBCP (of the specific pesticides assessed), in terms of the number of exceedances of drinking water standards. The cumulative long-term effect of widespread, low concentrations of pesticides on regional ground-water quality is unknown, however.
REFERENCES
Alexander, R.B., and Smith, R.A., 1990, County-level estimates of nitrogen and phosphorus fertilizer use in the United States, 1945 to 1985: U.S. Geological Survey Open-File Report 90-130, 12 p.
Alley, W.M., ed., 1993, Regional ground-water quality: New York, Van Nostrand Reinhold, 634 p.
Anton, E.G., Barnickol, J.L., and Schnaible, D.R., 1988, Nitrate in drinking water: Report to the legislature: California Water Resources Control Board, Division of Water Quality Report 88-11WQ, 148 p.
Arkley, R.J., 1962, Soil survey of Merced area, California: U.S. Department of Agriculture, Soil Conservation Service, Soil Survey series 1950, no. 7, 131 p., 101 pis.
1964, Soil survey, eastern Stanislaus area, California: U.S. Department of Agriculture, Soil Conservation Service, Soil Survey series 1957, no. 20, 160 p.
Arroues, K.D., and Anderson, C.H., Jr., 1986, Soil survey of Kings county, California: U.S. Department of Agriculture, Soil Conservation Service, 212 p., 14 pis. in pocket.
Barbash, J.E., and Resek, E.A., 1996, Pesticides in ground water: Distribution, trends, and governing factors: Chelsea, Mich., Ann Arbor Press, Pesticides in the Hydrologic System series, v. 2, 590 p.
Behnke, J.J., and Haskell, E.E., 1968, Ground-water nitrate distribution beneath Fresno, California: Journal of the American Water Works Association, v. 60, no. 4, p. 477-480.
Bertoldi, G.L., Johnston, R.H., and Evenson, K.D., 1991, Ground-water in the Central Valley, California A summary report: U.S. Geological Survey Professional Paper 1401-A, 44 p.
Bull, W.B., 1964a, Geomorphology of segmented alluvial fans in western Fresno County, California, chap. E of Erosion and sedimentation in a semiarid environment: U.S. Geological Survey Professional Paper 352-E, p. E89-E129, 2 pis. in pocket.
1964b, Alluvial fans and near-surface subsidence in western Fresno County, California: U.S. Geological Survey Professional Paper 437-A, 71 p, 4 pis. in pocket.
1972, Prehistoric near-surface subsidence cracks in western Fresno County, California: U.S. Geological Survey Professional Paper 437-C, 85 p, 2 pis. in pocket.
Buyanovsky, G.A., Gajda, A.M., Kremer, R.J., and Pieczonka, G.J., 1993, Effect of soil depth on carbofuran and aldicarb degradation, chap. 5 in Linn, D.M., ed., Sorption and degradation of pesticides and organic chemicals in soil: Madison, Wise., American Society of Agronomy and Soil Science Society of America Special Publication 32, p. 65-72.
California Department of Food and Agriculture, 1986, Pesticide use data: Computer tapes available from California Department of Food and Agriculture, Sacramento, Calif. 95814.
California Department of Pesticide Regulation, 1991, Pesticide use data: computer tapes available from California Department of Pesticide Regulation, Sacramento, Calif.
References 47

1993, Pesticide use data: computer tapes available from California Department of Pesticide Regulation, Sacramento, Calif.
California Department of Water Resources, 1971, Land use in California: An index to surveys conducted by the California Department of Water Resources, 1950-1970: California Department of Water Resources Bulletin 176, 16 p.
1990a, Depth to water data for San Joaquin and Sacramento counties for 1989 [digital data]: Sacramento, Calif., California Department of Water Resources.
1990b, Depth to water data for San Joaquin Valley for 1989 [digital data]: Fresno, Calif., California Department of Water Resources.
Chang, K.K., 1988, Soil survey of Kern county, California, northwestern part: United States Department of Agriculture, Soil Conservation Service, 204 p.
Cohen, D.B., 1986, Ground water contamination by toxic substances: A California assessment, chap. 29 in Garner, W.Y., Honeycutt, R.C., and Nigg, H.N., eds., Evaluation of pesticides in ground water: American Chemical Society Symposium series, v. 315, p. 499-529.
Cohen, S.Z., 1990, Pesticides in ground water: An overview, chap. 2 in Hutson, D.H., and Roberts, T.R., eds., Environmental fate of pesticides: Chichester, England, Wiley, Progress and Pesticide Biochemistry and Toxicology series, v. 7, p. 13-25.
Comly, H.H., 1945, Cyanosis in infants caused by nitrates in well water: American Medical Association Journal, v. 129, no. 2, p. 112-116.
Conover, W.L., 1980, Practical nonparametric statistics (2d ed.): New York, Wiley, 493 p.
Croft, M.G., and Gordon, G.V., 1968, Geology, hydrology, and quality of water in the Hanford-Visalia area, San Joaquin Valley, California: U.S. Geological Survey Open-File Report [68-67], 63 p.
Dale, R.H., French, J.J., and Gordon G.V., 1966, Ground- water geology and hydrology of the Kern River alluvial-fan area, California: U.S. Geological Survey Open-File Report [66-21], 92 p.
Davis, G.H., Green, J.H., Olmsted, F.H., and Brown, D.W., 1959, Ground-water conditions and storage capacity in the San Joaquin Valley, California: U.S. Geological Survey Water-Supply Paper 1469, 287 p., 29 pis.
Davis, H.H., 1995, Monitoring and evaluation of waterquality under Central Valley dairy sites: Proceedings of the California Plant and Soil Conference: January 1995, Visalia, California, American Society of
Agronomy and California Fertilizer Association, p. 158-164.
Davis, J.C., 1973, Statistics and data analysis in geology: New York, John Wiley, 550 p.
Domagalski, J.L., and Dubrovsky, N.M., 1991, Regional assessment of nonpoint-source pesticide residues in ground water, San Joaquin Valley, California: U.S. Geological Survey Water-Resources Investigations Report 91-4027, 64 p.
Fishman, M.J., 1993, Methods of analysis by the U.S.Geological Survey National Water Quality Laboratory: Determination of inorganic and organic constituents in water and fluvial sediments: U.S. Geological Survey Open-File Report 93-125, 217 p.
Fishman, M.J., and Friedman, L.C., eds., 1985, Methods for determination of inorganic and organic substances in water and fluvial sediments: U.S. Geological Survey Techniques of Water-Resources Investigations, book 5, chap. Al, 545 p.
Frimpter, M.H., Donohue, J.J., and Rapacz, M.V., 1990, A mass-balance nitrate model for predicting the effects of land use on ground-water quality: U.S. Geological Survey Open-File Report 88-493, variously paged.
Gilliom, R.J., Alley, W.M., and Gurtz, M.E., 1995, Design of the National Water-Quality Assessment Program: Occurrence and distribution of water-quality condi tions: U.S. Geological Survey Circular 1112, 33 p.
Gilliom, R.J., andThelin, G.P., 1997, Classification and mapping of agricultural land for national water-quality assessment: U.S. Geological Survey Circular 1131, 70 p.
Gronberg, J.A., Dubrovsky, N.M., Kratzer, C.R.,Domagalski, J.L., Brown, L.R., and Burow, K.R., 1998, Environmental setting of the San Joaquin-Tulare Basins, California: U. S. Geological Survey Water- Resources Investigations Report 97-4205 [in press].
Helsel, D.R., and Hirsch, R.M., 1992, Statistical methods in water resources: Amsterdam, The Netherlands, Elsevier Science Publishers, Studies in Environmental Science series, v. 49, 522 p., software in pocket (5 1/4 diskette).
Hotchkiss, W.R., and Balding, G.O., 1971, Geology,hydrology, and water quality of the Tracy-Dos Palos area, San Joaquin Valley, California: U.S. Geological Survey Open-File Report [72-169], 107 p., 3 pis. in pocket.
Huntington, G.L., 1971, Soil survey, eastern Fresno area, California: United States Department of Agriculture, Soil Conservation Service, 323 p., 104 pis.
48 Nitrate and Pesticides in Ground Water Beneath Three Agricultural Land-Use Settings, Eastern San Joaquin Valley

Istok, J.D., Smyth, J.D., and Flint, A.L, 1993, Multivariate geostatistical analysis of ground-water contamination: A case history: Ground Water, v. 31, no. 1, p. 63-74.
Knox, E., and Moody, D.W., 1991, Influence of hydrology, soil properties, and agricultural land use on nitrogen in ground water: Proceedings of symposium, chap. 3 in Follett, R.F., Kenney, D.R., and Cruse, R.M., eds., Managing nitrogen for groundwater quality and farm profitability: Madison, Wise., Soil Science Society of America, p. 19-57.
Kolpin, D.W., Burkart, M.R., and Thurman, E.M., 1994, Herbicides and nitrate in near-surface aquifers in the midcontinental United States, 1991: U.S. Geological Survey Water-Supply Paper 2413, 34 p.
Koterba, M.T., Banks, W.S.L., and Shedlock, R.J., 1993, Pesticides in shallow groundwater in the Delmarva Peninsula: Journal of Environmental Quality, v. 22, no. 3, p. 500-518.
Koterba, M.T., Wilde, F.D., and Lapham, W.W, 1995,Ground-water data-collection protocols and procedures for the National Water-Quality Assessment Program: Collection and documentation of water-quality samples and related data: U.S. Geological Survey Open-File Report 95-399, 113 p.
Lapham, W.W., Wilde, F.D., and Koterba, M.T., 1995,Ground-water data-collection protocols and procedures for the National Water-Quality Assessment Program: Selection, installation and documentation of wells, and collection of related data: U.S. Geological Survey Open-File Report 95-398, 69 p.
Laudon, Julie, and Belitz, Kenneth, 1991, Texture and depositional history of late Pleistocene-Holocene alluvium in the central part of the western San Joaquin Valley, California: Bulletin of the Association of Engineering Geologists, v. 28, no. 1, p. 73-88.
Lehmann, E.L., and D'Abrera, H.J.M., 1975,Nonparametrics: Statistical methods based on ranks: Holden-Day, San Francisco, Calif., 457 p.
Lowry, P., 1987, Hilmar ground water study: California Regional Water Quality Control Board Central Valley Region files, variously paged [available from State of California, Central Valley Regional Water Quality Control Board, Sacramento, Calif.].
Mackay, D.M., and Smith, L.A., 1990, Agricultural chemicals in groundwater: Monitoring and management in California: Journal of Soil and Water Conservation, v. 45, no. 2, p. 253-255.
MacLeod, C.L., Barringer, T.H., Vowinkel, E.F., and Price, C.V, 1995, Relation of nitrate concentrations in ground water to well depth, well use, and land use in Franklin Township, Gloucester County, New Jersey,
1970-85: U.S. Geological Survey Water-Resources Investigations Report 94-4174, 29 p.
Madison, R.J., and Brunett, J.O., 1985, Overview of the occurrence of nitrate in ground water of the United States, in National water summary 1984, hydrologic events, selected water-quality trends, and ground-water resources: U.S. Geological Survey Water-Supply Paper 2275, p. 93-105.
Majewski, M.S., and Capel, P.D., 1995, Pesticides in the atmosphere: Distribution, trends, and governing factors: Chelsea, Mich., Ann Arbor Press, Pesticides in the Hydrologic System series, v. 1, 214 p.
McElhiney, M.A., 1992, Soil survey of San Joaquin county, California: U.S. Department of Agriculture, Soil Conservation Service, 480 p., 37 pis. in folder.
Miller, C., Newhart, K., Pepple, M., Troiano, J.J., and Weaver, D., 1994, Sampling for pesticide residues in California well water, 1994 update, well inventory data base: California Department of Pesticide Regulation, Environmental Hazards Assessment Program Report EH94-06, 151 p.
Miller, R.E., Green, J.H., andDavis, G.H., 1971, Geology of the compacting deposits in the Los Banos- Kettleman City subsidence area, California: U.S. Geological Survey Professional Paper 497-E, 46 p., 5 pis. in pocket.
Mueller, O.K., Hamilton, PH., Helsel, D.R., Hitt, K.J., and Ruddy, B.C., 1995, Nutrients in ground water and surface water of the United States: An analysis of data through 1992: U.S. Geological Survey Water- Resources Investigations Report 95-4031, 74 p.
Mueller, O.K., and Helsel, D.R., 1996, Nutrients in the Nation's water; too much of a good thing?: U.S. Geological Survey Circular 1136, 24 p.
National Agricultural Statistics Service and EconomicResearch Service, 1992a, Agricultural chemical usage: 1991 fruits and nuts summary: U.S. Department of Agriculture, Agricultural Statistics Board, 167 p.
1992b, Agricultural chemical usage: 1990 vegetables summary, California: U.S. Department of Agriculture, Agricultural Statistics Board, 18 p.
Nazar, P.G., 1990, Soil survey of Merced County, California, western part: U.S. Department of Agriculture, Soil Conservation Service, 468 p., 21 pis. in pocket.
Nightingale, H.I., 1970, Statistical evaluation of salinity and nitrate content and trends beneath urban and agricultural areas Fresno, California: Ground Water, v. 8, no. 1, p. 22-28.
References 49

1972, Nitrates in soil and ground water beneath irrigated and fertilized crops: Soil Science, v. 114, no. 4, p. 300-311.
Nightingale, H.I., and Bianchi, W.C., 1980, Correlation of selected well water quality parameters with soil and aquifer hydrologic properties: Water Resources Bulletin, v. 16, no. 4, p. 702-709.
Owens, L.B., Edwards, W.M., and Van Keuren, R.W., 1992, Nitrate levels in shallow groundwater under pastures receiving ammonium nitrate or slow-release nitrogen fertilizer: Journal of Environmental Quality, v. 21, no. 4., p. 607-613.
Page, R.W., 1986, Geology of the fresh ground-water basin of the Central Valley, California, with texture maps and sections: U.S. Geological Survey Professional Paper 1401-C, 54 p., 5 pis. in pocket.
Page, R.W., and LeBlanc, R.A., 1969, Geology, hydrology, and water quality in the Fresno area, California: U.S. Geological Survey Open-File Report, 70 p., 21 pis.
Pease, W.S., Albright, D., DeRoos, C., Gottsman, L., Kyle, A.D., Morello-Frosch, R., and Robinson, J.C., 1995, Pesticide contamination of groundwater in California: Berkeley, University of California, California Policy Seminar, 145 p.
Plummer, L.N., Michel, R.L., Thurman, E.M., and Glynn, P.D., 1993, Environmental tracers for age dating young ground water, chap. 11 in Alley, W.M., ed., Regional ground-water quality: New York, Van Nostrand Reinhold, p. 255-294.
Rantz, S.E., 1969, Mean annual precipitation in theCalifornia region, U.S. Geological Survey Basic-Data Compilation, scale 1:1,000,000, 5 p., 11 sheets.
Rauschkolb, R.S., and Mikkelsen, D.S., 1978, Survey of fertilizer use in California, 1973: Berkeley, University of California, Division of Agricultural Sciences, Cooperative Extension, U.S. Department of Agriculture Bulletin 1887, 27 p.
Rose, D.L., and Schroeder, M.P., 1995, Methods of analysis by the U.S. Geological Survey National Water Quality Laboratory: Determination of volatile organic compounds in water by purge and trap capillary gas chromatography/mass spectrometry: U.S. Geological Survey Open-File Report 94-708, 26 p.
Rudolph, D., and Goss, M., chairmen, 1992, Ontario farm groundwater quality survey, winter 1991/92: University of Waterloo, Waterloo Centre for Groundwater Research, 152 p.
1993, Ontario farm groundwater quality survey,summer 1992: University of Waterloo, Waterloo Centre for Groundwater Research, 162 p.
Schmidt, K.D., 1972, Nitrate in ground water of the Fresno- Clovis metropolitan area, California: Ground Water, v. 10, no. 1, p. 50-64.
1983, Management of groundwater quality beneath irrigated arid lands, in Proceedings of the National Water Well Association Western Regional Conference on Groundwater Management: October 1983, San Diego, California: Worthington, Ohio, National Well Water Association, p. 77-84.
Scott, J.C., 1990, Computerized stratified random site- selection approaches for design of a ground-water- quality sampling network: U.S. Geological Survey Water-Resources Investigations Report 90-4101, 109 p.
Sievers, D.M., and Fulhage, C.D., 1992, Survey of rural wells in Missouri for pesticides and nitrate: Ground Water Monitoring Review, v. 12, no. 4, p. 142-150.
Stephens, F.G., 1982, Soil survey of Tulare County, California, central part: U.S. Department of Agriculture, Soil Conservation Service, 165 p., 24 pis. in case.
Troiano, J.J., Johnson, B.R., Powell, Sally, and Schoenig, Steve, 1994, Use of cluster analysis and principal component analyses to profile areas in California where ground water has been contaminated by pesticides: Environmental Monitoring and Assessment, v. 32, p. 269-288.
Troiano, J.J., and Segawa, R.T., 1987, Survey for herbicides in well water in Tulare County: California Department of Food and Agriculture, Division of Pest Management, Environmental Protection, and Worker Safety, Environmental Hazards Assessment Program Report EH 87-01, 13 p.
Troiano, J.J., and Sitts, John, 1990, Survey for alachlor, atrazine, metolachlor and nitrate residues in well water in Merced County and their relation to soil and well characteristics: California Department of Food and Agriculture, Division of Pest Management, Environmental Protection, and Worker Safety, Environmental Hazards Assessment Program Report EH 90-3, 83 p.
Ulrich, R., and Stromberg, L.K., 1962, Soil survey of Madera area, California: U.S. Department of Agriculture, Soil Conservation Service, Soil Survey series 1951, no. 11, 155 p.
U.S. Department of Commerce, 1989, 1987 Census of agriculture, California state and county data: Washington, D.C., U.S. Government Printing Office, v. 1, part 5, Geographic Area series, p. 242-277.
50 Nitrate and Pesticides in Ground Water Beneath Three Agricultural Land-Use Settings, Eastern San Joaquin Valley

U.S. Environmental Protection Agency, 1996, Drinking water regulations and health advisories: U.S. Environmental Protection Agency Report EPA-822/B-96/002, lip.
U.S. Soil Conservation Service, 1991, State SoilGeographic Data Base (STATSGO): Data user's guide: U.S. Department of Agriculture Miscellaneous Publication 1492, 88 p.
1992, National engineering handbook: Part 651,Agricultural waste management field handbook: U.S. Department of Agriculture, variously paged.
Vowinkel, E.F., and Tapper, R.J., 1995, Indicators of the sources and distribution of nitrate in water from shallow domestic wells in agricultural area of the New Jersey Coastal Plain: U.S. Geological Survey Water- Resources Investigations Report 93-4178, 48 p.
Weraer, S.L., Burkhardt, M.R., and DeRusseau, S.N., 1996, Methods of analysis by the U.S. Geological Survey National Water Quality Laboratory: Determination of pesticides in water by carbopak-B solid-phase extraction and high performance liquid chromatography: U.S. Geological Survey Open-File Report 96-216, 42 p.
Wilkerson, M., Oshima, R.J., Younglove, T., Margolis, H., and Marade, S.J., 1985, Use of agronomic variables to predict ground water contamination in the San Joaquin Valley, California, v. 3 of Pesticide movement to
ground water: California Department of Food and Agriculture, Division of Pest Management, Environmental Protection, and Worker Safety, 62 p.
Worthing, C.R., ed., 1987, The pesticide manual: A world compendium (8th ed.): Thoraton Health, United Kingdom, The British Crop Protection Council, 1,081 p.
Zalkin, F, Wilkerson, M., and Oshima, R.J., 1984, Pesticide contamination in the soil profile at DBCP, EDB, simazine, and carbofuran application sites, v. 2 of Pesticide movement to ground water: California Department of Food and Agriculture, Division of Pest Management, Environmental Protection, and Worker Safety, 168 p.
Zar, J.H., 1974, Critical values of Spearman's rank correlation coefficient, table D.24 in Biostatistical analysis: Englewood Cliffs, N.J., Prentice-Hall, p. 498-^99.
Zaugg, S.D., Sandstrom, M.W, Smith, S.G., and Fehlberg, K.M., 1995, Methods of analysis by the U.S. Geological Survey National Water Quality Laboratory: Determination of pesticides in water by C-18 solid- phase extraction and capillary-column gas chromatography/mass spectrometry with selected-ion monitoring: U.S. Geological Survey Open-File Report 95-181, 49 p.
* U.S. GOVERNMHJT PRINTING OFFICE: 1998-685-177/99116 References 51