occupier and investment markets enjoy buoyant period as ... · pdf file... commercial real...
TRANSCRIPT

MARKETVIEW
China, Q2 2017
MARKET HIGHLIGHTS
OFFICE
Better-than-expected economic performance helped
drive solid office leasing activity in H1 2017.
However, market momentum is likely to be moderated
in H2 2017 amid the tighter credit environment.
RETAIL
The performance of bricks-and-mortar stores
improved this quarter, in spite of higher costs. The
China Chain Stores & Franchise Association reported
that sales of 2,300 retailers across China increased
significantly in H1 2017.
LOGISTICS
E-commerce businesses completed a number of
sizable leasing transactions in Q2 2017. Leasing
demand from 3PL companies also improved across a
number of cities. Vacancy remained low in tier I and
adjunct cities along with key tier II cities.
CAPITAL MARKET
Outbound investment continued to shrink following
the imposition of tighter capital controls at the end of
2016. This encouraged more investors to purchase
assets in the domestic market, which pushed up total
transaction volume to RMB 95 billion in Q2 2017,
marking a record high for the second quarter.
One Belt One Road initiative marks new
phase of regional development
Q2 2017 CBRE Research © CBRE Ltd. 2017 | 1
0%
10%
20%
30%
40%
0
3
6
9
12
2002
2003
2004
2005
2006
2007
2008
2009
2010
2011
2012
2013
2014
2015
2016
Q1 2
017
千
(RMB tn) Total Property Investment (LHS) y-o-y (RHS)
Source: National Bureau of Statistics of China, Q2 2017
Figure 1: Total Property Investment Volume
Occupier and investment markets
enjoy buoyant period as economic
growth exceeds expectations
*Arrows indicate change from previous quarter.
6.9%
H1 2017
1.5%
June
8.5%
H1 2017
51.7
June
10.4%
H1 2017

MARKETVIEW
| © CBRE Ltd. 2017
MACRO ECONOMY
MARKET PERFORMANCE
0%
4%
8%
12%
16%
0
20
40
60
80
2003
2004
2005
2006
2007
2008
2009
2010
2011
2012
2013
2014
2015
2016
H1 2
017
(RMB tn) GDP (LHS) y-o-y (RHS)
0%
5%
10%
15%
20%
25%
30%
35%
0
5
10
15
20
25
30
35
2003
2004
2005
2006
2007
2008
2009
2010
2011
2012
2013
2014
2015
2016
H1 2
017
(RMB tn) Retail Sales (LHS) y-o-y (RHS)
-20%
-10%
0%
10%
20%
30%
40%
50%
-2
-1
0
1
2
3
4
5
2003
2004
2005
2006
2007
2008
2009
2010
2011
2012
2013
2014
2015
2016
H1 2
017
(USD tn)Total Exports/Imports (LHS) Exports (LHS)
Total Exports/Imports y-o-y (RHS) Exports y-o-y (RHS)
0%
5%
10%
15%
20%
25%
30%
0
10
20
30
40
50
60
2003
2004
2005
2006
2007
2008
2009
2010
2011
2012
2013
2014
2015
2016
H1 2
017
(RMB tn) Fixed Asset Investment (LHS) y-o-y (RHS)
Source: National Bureau of Statistics of China, Q2 2017
Source: National Bureau of Statistics of China, Q2 2017
Source: National Bureau of Statistics of China, Q2 2017
Source: National Bureau of Statistics of China, Q2 2017
Figure 2: GDP
Figure 3: Retail Sales
Figure 4: Fixed Asset Investment
Figure 5: International Trade
Q2 2017 CBRE Research2

MARKETVIEW
80
100
120
140
160
180
Q1 2
003
Q1 2
004
Q1 2
005
Q1 2
006
Q1 2
007
Q1 2
008
Q1 2
009
Q1 2
010
Q1 2
011
Q1 2
012
Q1 2
013
Q1 2
014
Q1 2
015
Q1 2
016
Q1 2
017
Q1 2003 = 100
Overall Tier I Cities Tier II Cities
MARKET PERFORMANCE
Source: CBRE Research, Q2 2017 Source: CBRE Research, Q2 2017
Figure 6: Office Supply & Demand Figure 7: Office Rental Index
Q2 2017 CBRE Research © CBRE Ltd. 2017 | 3
OFFICE MARKET
0%
5%
10%
15%
20%
0.0
2.0
4.0
6.0
8.0
2003
2004
2005
2006
2007
2008
2009
2010
2011
2012
2013
2014
2015
2016
H1 2
017
(mn sq. m.) New Supply (LHS)
Net Absorptino (LHS)
Vacancy Rate (RHS)

MARKETVIEW MARKET PERFORMANCE
Source: CBRE Research, Q2 2017 Source: CBRE Research, Q2 2017
Figure 8: Retail Supply & Demand Figure 9: Shopping Mall Ground Floor Rental Index
Q2 2017 CBRE Research| © CBRE Ltd. 20174
RETAIL MARKET
0%
5%
10%
15%
20%
0.0
2.0
4.0
6.0
8.0
2003
2004
2005
2006
2007
2008
2009
2010
2011
2012
2013
2014
2015
2016
H1 2
017
(mn sq. m.) New Supply (LHS)
Net Absorptino (LHS)
Vacancy Rate (RHS)
70
90
110
130
150
170
190
210
230
Q1
2003
Q1
2004
Q1
2005
Q1
2006
Q1
2007
Q1
2008
Q1
2009
Q1
2010
Q1
2011
Q1
2012
Q1
2013
Q1
2014
Q1
2015
Q1
2016
Q1
2017
Q1 2003 = 100
Overall Tier I Cities Tier II Cities

MARKETVIEW
0%
10%
20%
30%
0.0
1.0
2.0
3.0
4.0
5.0
2009
2010
2011
2012
2013
2014
2015
2016
H1 2
017
(mn sq. m.) New Supply (LHS)
Net Absorptino (LHS)
Vacancy Rate (RHS)
MARKET PERFORMANCE
Source: CBRE Research, Q2 2017 Source: National Bureau of Statistics of China, Q2 2017
Figure 10: Logistics Supply & Demand
Q2 2017 CBRE Research © CBRE Ltd. 2017 | 5
INDUSTRIAL MARKET CAPITAL MARKET
-50%
-25%
0%
25%
50%
75%
100%
125%
150%
175%
-50
-25
0
25
50
75
100
125
150
175
2007
2008
2009
2010
2011
2012
2013
2014
2015
2016
H1 2
017
十亿
(RMB bn)GFA Sold of Commodity House (LHS) y-o-y (RHS)
Figure 11: Commercial Real Estate Investment Turnover

MARKETVIEW MARKET PERFORMANCE
Figure 12: CBRE Market Quick Stats Q2 2017
City q-o-q Office Retail* Logistics
Beijing Rental Growth 0.1% 0.2% 1.3%
Vacancy Rate Change 0.3 pps 0.2 pps
Tianjin Rental Growth -0.1% -0.4% 0.1%
Vacancy Rate Change 1.1 pps 0.5 pps
Dalian Rental Growth -0.3% 0.0% 0.0%
Vacancy Rate Change 7.4 pps 0.2 pps
Shenyang Rental Growth -2.5% 0.0% 0.0%
Vacancy Rate Change 0.2 pps 1.6 pps
Qingdao Rental Growth -0.2% 0.1% 0.0%
Vacancy Rate Change 0.5 pps 0.1 pps
Shanghai Rental Growth -0.1% 0.1% 0.1%
Vacancy Rate Change 2.6 pps 4.8 pps
Nanjing Rental Growth 0.2% 0.2% 0.0%
Vacancy Rate Change 0.2 pps 1.2 pps
Hangzhou Rental Growth 0.9% 0.2% 0.0%
Vacancy Rate Change 5.5 pps 2.1 pps
Ningbo Rental Growth -0.6% 0.0% 0.0%
Vacancy Rate Change 1.1 pps 2.4 pps
Suzhou Rental Growth -0.1% 0.0% 0.0%
Vacancy Rate Change 0.2 pps 0.7 pps
Wuxi Rental Growth 0.0% 0.0% 0.0%
Vacancy Rate Change 1.6 pps 1.0 pps
Guangzhou Rental Growth 1.5% 0.1% 0.0%
Vacancy Rate Change 1.2 pps 0.5 pps
Shenzhen Rental Growth -0.2% 0.0% 0.6%
Vacancy Rate Change 0.5 pps 0.6 pps
Chengdu Rental Growth 0.0% -0.2% -0.8%
Vacancy Rate Change 1.3 pps 0.9 pps
Chongqing Rental Growth -0.3% -0.1% -0.7%
Vacancy Rate Change 0.7 pps 0.7 pps
Wuhan Rental Growth -0.2% -0.5% -0.5%
Vacancy Rate Change 0.6 pps 0.9 pps
Changsha Rental Growth -0.5% 0.2%
Vacancy Rate Change 2.9 pps 0.7 pps
* Retail sector reports shopping mall ground floor rents.
Source: CBRE Research, Q2 2017
Q1 2017 CBRE Research| © CBRE Ltd. 20176

MARKETVIEW OUTLOOK IN SIX MONTHS
* Retail sector reports shopping mall ground floor rents.
Source: CBRE Research, Q2 2017
Q1 2017 CBRE Research © CBRE Ltd. 2017 | 7
Figure 13: CBRE Market Outlook (Six Months)
City Forecast Office Retail* Logistics
Beijing Rental Growth 0% 0%−1% 0%−1%
Vacancy Rate Change
Tianjin Rental Growth -1%− 0% -1%− 0% 0%−1%
Vacancy Rate Change
Dalian Rental Growth -2%− -1% 0%−1% 0%−1%
Vacancy Rate Change
Shenyang Rental Growth -3%−-1% 0%−1% 0%−1%
Vacancy Rate Change
Qingdao Rental Growth -1%−0% -1%− 0% 0%−1%
Vacancy Rate Change
Shanghai Rental Growth -3%−-1% 0%−1% 1%−3%
Vacancy Rate Change
Nanjing Rental Growth 0%−1% 0%−1% 0%−1%
Vacancy Rate Change −
Hangzhou Rental Growth 0%−2% 0% 0%−1%
Vacancy Rate Change
Ningbo Rental Growth 0%−1% 0%−1% 0%−1%
Vacancy Rate Change
Suzhou Rental Growth -1%− 0% 0%−1%
Vacancy Rate Change
Wuxi Rental Growth -1%− 0% 0%−1%
Vacancy Rate Change −
Guangzhou Rental Growth 1%−3% 0%−1% 0%
Vacancy Rate Change
Shenzhen Rental Growth -3%− 0% -1%−1% 1%−4%
Vacancy Rate Change −
Chengdu Rental Growth 0%− 1% -1%− 0% -3%−-1%
Vacancy Rate Change
Chongqing Rental Growth -1%− 0% -1%− 0% -3%−-1%
Vacancy Rate Change
Wuhan Rental Growth -1%− 0% -1%− 0% -1%− 0%
Vacancy Rate Change
Changsha Rental Growth -1%− 0% 0%−1%
Vacancy Rate Change

MARKETVIEW
BEIJING OFFICE MARKET
BEIJING RETAIL MARKET
NORTH CHINA, BEIJING
0
50
100
150
200
Q1 0
3
Q1 0
4
Q1 0
5
Q1 0
6
Q1 0
7
Q1 0
8
Q1 0
9
Q1 1
0
Q1 1
1
Q1 1
2
Q1 1
3
Q1 1
4
Q1 1
5
Q1 1
6
Q1 1
7
Inde
x (Q
1 20
03 =
100
)
Rental Index Grade A Rental Index
0
50
100
150
200
250
Q1 0
3
Q1 0
4
Q1 0
5
Q1 0
6
Q1 0
7
Q1 0
8
Q1 0
9
Q1 1
0
Q1 1
1
Q1 1
2
Q1 1
3
Q1 1
4
Q1 1
5
Q1 1
6
Q1 1
7
Inde
x (Q
1 20
03 =
100
)
Shopping Mall Ground Floor Rental Index
Office Retail Logistics
Rental Growth 0% 0%−1% 0%−1%
Vacancy Rate Change
Source: CBRE Research, Q2 2017
Source: CBRE Research, Q2 2017
Figure 14: CBRE’s View in Six Months
Figure 15: Beijing Office Market
Figure 16: Beijing Retail Market
Q2 2017 CBRE Research| © CBRE Ltd. 20178

MARKETVIEW NORTH CHINA, BEIJING
BEIJING LOGISTICS MARKET
0
40
80
120
160
Q1 0
9
Q1 1
0
Q1 1
1
Q1 1
2
Q1 1
3
Q1 1
4
Q1 1
5
Q1 1
6
Q1 1
7
Inde
x (Q
1 20
09 =
100
)
Rental Index
Source: CBRE Research, Q2 2017
Figure 17: Beijing Logistics Market
Q2 2017 CBRE Research © CBRE Ltd. 2017 | 9

MARKETVIEW
Figure 20: Tianjin Retail Market
TIANJIN OFFICE MARKET
TIANJIN RETAIL MARKET
NORTH CHINA, TIANJIN
Office Retail Logistics
Rental Growth -1%− 0% -1%− 0% 0%−1%
Vacancy Rate Change
0
50
100
150
Q1 0
3
Q1 0
4
Q1 0
5
Q1 0
6
Q1 0
7
Q1 0
8
Q1 0
9
Q1 1
0
Q1 1
1
Q1 1
2
Q1 1
3
Q1 1
4
Q1 1
5
Q1 1
6
Q1 1
7
Inde
x (Q
1 20
03 =
100
)
Rental Index Grade A Rental Index
0
50
100
150
200
Q1 0
4
Q1 0
5
Q1 0
6
Q1 0
7
Q1 0
8
Q1 0
9
Q1 1
0
Q1 1
1
Q1 1
2
Q1 1
3
Q1 1
4
Q1 1
5
Q1 1
6
Q1 1
7
Inde
x (Q
1 20
04 =
100
)
Shopping Mall Ground Floor Rental Index
0
50
100
150
Q1 0
9
Q1 1
0
Q1 1
1
Q1 1
2
Q1 1
3
Q1 1
4
Q1 1
5
Q1 1
6
Q1 1
7
Inde
x (Q
1 20
09 =
100
)
Rental Index
Source: CBRE Research, Q2 2017
Source: CBRE Research, Q2 2017
Source: CBRE Research, Q2 2017
Figure 18: CBRE’s View in Six Months
Figure 19: Tianjin Office Market
Figure 21: Tianjin Logistics Market
Q2 2017 CBRE Research| © CBRE Ltd. 201710

MARKETVIEW
Figure 25: Dalian Logistics Market
Figure 24: Dalian Retail Market
NORTH CHINA, DALIAN
DALIAN OFFICE MARKET
DALIAN RETAIL MARKET
Office Retail Logistics
Rental Growth -2%− -1% 0%−1% 0%−1%
Vacancy Rate Change
0
50
100
150
200
Q1 0
3
Q1 0
4
Q1 0
5
Q1 0
6
Q1 0
7
Q1 0
8
Q1 0
9
Q1 1
0
Q1 1
1
Q1 1
2
Q1 1
3
Q1 1
4
Q1 1
5
Q1 1
6
Q1 1
7
Inde
x (Q
1 20
03 =
100
)
Shopping Mall Ground Floor Rental Index
0
50
100
150
Q1 0
3
Q1 0
4
Q1 0
5
Q1 0
6
Q1 0
7
Q1 0
8
Q1 0
9
Q1 1
0
Q1 1
1
Q1 1
2
Q1 1
3
Q1 1
4
Q1 1
5
Q1 1
6
Q1 1
7
Inde
x (Q
1 20
03 =
100
)
Rental Index Grade A Rental Index
0
50
100
150
Q1 0
9
Q1 1
0
Q1 1
1
Q1 1
2
Q1 1
3
Q1 1
4
Q1 1
5
Q1 1
6
Q1 1
7
Inde
x (Q
1 20
09 =
100
)
Rental Index
Source: CBRE Research, Q2 2017
Source: CBRE Research, Q2 2017
Source: CBRE Research, Q2 2017
Figure 22: CBRE’s View in Six Months
Figure 23: Dalian Office Market
Q2 2017 CBRE Research © CBRE Ltd. 2017 | 11

MARKETVIEW
SHENYANG OFFICE MARKET
SHENYANG RETAIL MARKET
NORTH CHINA, SHENYANG
Office Retail Logistics
Rental Growth -3%− -1% 0%−1% 0%−1%
Vacancy Rate Change
0
50
100
150
200
Q1 0
3
Q1 0
4
Q1 0
5
Q1 0
6
Q1 0
7
Q1 0
8
Q1 0
9
Q1 1
0
Q1 1
1
Q1 1
2
Q1 1
3
Q1 1
4
Q1 1
5
Q1 1
6
Q1 1
7
Inde
x (Q
1 20
03 =
100
)
Rental Index Grade A Rental Index
0
30
60
90
120
Q1 0
8
Q1 0
9
Q1 1
0
Q1 1
1
Q1 1
2
Q1 1
3
Q1 1
4
Q1 1
5
Q1 1
6
Q1 1
7
Inde
x (Q
1 20
08 =
100
)
Shopping Mall Ground Floor Rental Index
0
50
100
150
Q1 1
1
Q1 1
2
Q1 1
3
Q1 1
4
Q1 1
5
Q1 1
6
Q1 1
7
Inde
x (Q
1 20
11 =
100
)
Rental Index
Source: CBRE Research, Q2 2017
Source: CBRE Research, Q2 2017
Source: CBRE Research, Q2 2017
Figure 26: CBRE’s View in Six Months
Figure 27: Shenyang Office Market
Figure 28: Shenyang Retail Market
Figure 29: Shenyang Logistics Market
Q2 2017 CBRE Research| © CBRE Ltd. 201712

MARKETVIEW
0
50
100
150
200
Q1 0
3
Q1 0
4
Q1 0
5
Q1 0
6
Q1 0
7
Q1 0
8
Q1 0
9
Q1 1
0
Q1 1
1
Q1 1
2
Q1 1
3
Q1 1
4
Q1 1
5
Q1 1
6
Q1 1
7
Inde
x (Q
1 20
03 =
100
)
Shopping Mall Ground Floor Rental Index
NORTH CHINA, QINGDAO
QINGDAO OFFICE MARKET
,
QINGDAO RETAIL MARKET
Office Retail Logistics
Rental Growth -1%− 0% -1%− 0% 0%−1%
Vacancy Rate Change
0
50
100
150
Q1 0
3
Q1 0
4
Q1 0
5
Q1 0
6
Q1 0
7
Q1 0
8
Q1 0
9
Q1 1
0
Q1 1
1
Q1 1
2
Q1 1
3
Q1 1
4
Q1 1
5
Q1 1
6
Q1 1
7
Inde
x (Q
1 20
03 =
100
)
Rental Index Grade A Rental Index
0
30
60
90
120
Q1 0
9
Q1 1
0
Q1 1
1
Q1 1
2
Q1 1
3
Q1 1
4
Q1 1
5
Q1 1
6
Q1 1
7
Inde
x (Q
1 20
09=
100
)
Rental Index
Source: CBRE Research, Q2 2017
Source: CBRE Research, Q2 2017
Source: CBRE Research, Q2 2017
Figure 30: CBRE’s View in Six Months
Figure 31: Qingdao Office Market
Figure 32: Qingdao Retail Market
Figure 33: Qingdao Logistics Market
Q2 2017 CBRE Research © CBRE Ltd. 2017 | 13

MARKETVIEW
SHANGHAI OFFICE MARKET
SHANGHAI RETAIL MARKET
EAST CHINA, SHANGHAI
Office Retail Logistics
Rental Growth -3%−-1% 0%−1% 1%−3%
Vacancy Rate Change
0
50
100
150
200
Q1 0
3
Q1 0
4
Q1 0
5
Q1 0
6
Q1 0
7
Q1 0
8
Q1 0
9
Q1 1
0
Q1 1
1
Q1 1
2
Q1 1
3
Q1 1
4
Q1 1
5
Q1 1
6
Q1 1
7
Inde
x (Q
1 20
03 =
100
)
Rental Index Grade A Rental Index
Source: CBRE Research, Q2 2017
Figure 34: CBRE’s View in Six Months
Figure 35: Shanghai Office Market
Q2 2017 CBRE Research| © CBRE Ltd. 201714
0
100
200
300
Q1 0
3
Q1 0
4
Q1 0
5
Q1 0
6
Q1 0
7
Q1 0
8
Q1 0
9
Q1 1
0
Q1 1
1
Q1 1
2
Q1 1
3
Q1 1
4
Q1 1
5
Q1 1
6
Q1 1
7
Inde
x (Q
1 20
03 =
100
)
Shopping Mall Ground Floor Rental Index
Figure 41: Shanghai Retail Market
Source: CBRE Research, Q2 2017

MARKETVIEW
SHANGHAI LOGISTICS MARKET
Q2 2017 CBRE Research
EAST CHINA, SHANGHAI
© CBRE Ltd. 2017 | 15
0
50
100
150
Q1 0
9
Q1 1
0
Q1 1
1
Q1 1
2
Q1 1
3
Q1 1
4
Q1 1
5
Q1 1
6
Q1 1
7
Inde
x (Q
1 20
09 =
100
)
Rental Index
Figure 36: Shanghai Logistics Market
Source: CBRE Research, Q2 2017

MARKETVIEW
Figure 40: Nanjing Logistics Market
NANJING OFFICE MARKET
NANJING RETAIL MARKET
EAST CHINA, NANJING
16
Office Retail Logistics
Rental Growth 0%−1% 0%−1% 0%−1%
Vacancy Rate Change −
0
50
100
150
200
Q1 0
3
Q1 0
4
Q1 0
5
Q1 0
6
Q1 0
7
Q1 0
8
Q1 0
9
Q1 1
0
Q1 1
1
Q1 1
2
Q1 1
3
Q1 1
4
Q1 1
5
Q1 1
6
Q1 1
7
Inde
x (Q
1 20
03 =
100
)
Rental Index Grade A Rental Index
0
50
100
150
200
Q2 0
6
Q3 0
7
Q4 0
8
Q1 1
0
Q2 1
1
Q3 1
2
Q4 1
3
Q1 1
5
Q2 1
6
Inde
x (Q
2 20
06 =
100
)
Shopping Mall Ground Floor Rental Index
0
50
100
150
Q1 0
9
Q1 1
0
Q1 1
1
Q1 1
2
Q1 1
3
Q1 1
4
Q1 1
5
Q1 1
6
Q1 1
7
Inde
x (Q
1 20
09 =
100
)
Rental Index
Source: CBRE Research, Q2 2017
Source: CBRE Research, Q2 2017
Source: CBRE Research, Q2 2017
Figure 38: Nanjing Office Market
Figure 39: Nanjing Retail Market
Figure 37: CBRE’s View in Six Months
Q2 2017 CBRE Research| © CBRE Ltd. 2017

MARKETVIEW
Figure 43: Hangzhou Retail Market
0
50
100
150
200
Q1 0
3
Q1 0
4
Q1 0
5
Q1 0
6
Q1 0
7
Q1 0
8
Q1 0
9
Q1 1
0
Q1 1
1
Q1 1
2
Q1 1
3
Q1 1
4
Q1 1
5
Q1 1
6
Q1 1
7
Inde
x (Q
1 20
03 =
100
)
Rental Index Grade A Rental Index
Figure 44: Hangzhou Logistics Market
EAST CHINA, HANGZHOU
Office Retail Logistics
Rental Growth 0%−2% 0% 0%
Vacancy Rate Change
0
200
400
600
800
Q1 0
3
Q1 0
4
Q1 0
5
Q1 0
6
Q1 0
7
Q1 0
8
Q1 0
9
Q1 1
0
Q1 1
1
Q1 1
2
Q1 1
3
Q1 1
4
Q1 1
5
Q1 1
6
Q1 1
7
Inde
x (Q
1 20
03 =
100
)
Shopping Mall Ground Floor Rental Index
0
50
100
150
Q1 0
9
Q1 1
0
Q1 1
1
Q1 1
2
Q1 1
3
Q1 1
4
Q1 1
5
Q1 1
6
Q1 1
7
Inde
x (Q
1 20
09 =
100
)
Rental Index
Source: CBRE Research, Q2 2017
Source: CBRE Research, Q2 2017
Source: CBRE Research, Q2 2017
Figure 41: CBRE’s View in Six Months
Figure 42: Hangzhou Office Market
© CBRE Ltd. 2017 | 17Q2 2017 CBRE Research
HANGZHOU OFFICE MARKET
HANGZHOU RETAIL MARKET

MARKETVIEW
Figure 48: Ningbo Logistics Market
NINGBO OFFICE MARKET
NINGBO RETAIL MARKET
EAST CHINA, NINGBO
Office Retail Logistics
Rental Growth 0%−1% 1%−3% 0%−1%
Vacancy Rate Change −
0
50
100
150
Q1 0
3
Q1 0
4
Q1 0
5
Q1 0
6
Q1 0
7
Q1 0
8
Q1 0
9
Q1 1
0
Q1 1
1
Q1 1
2
Q1 1
3
Q1 1
4
Q1 1
5
Q1 1
6
Q1 1
7
Inde
x (Q
1 20
03 =
100
)
Rental Index Grade A Rental Index
Note: Grade A Office: Q4 2005 = 100
0
100
200
300
Q2 0
3
Q2 0
4
Q2 0
5
Q2 0
6
Q2 0
7
Q2 0
8
Q2 0
9
Q2 1
0
Q2 1
1
Q2 1
2
Q2 1
3
Q2 1
4
Q2 1
5
Q2 1
6
Q2 1
7
Inde
x (Q
2 20
03 =
100
)
Shopping Mall Ground Floor Rental Index
0
50
100
150
Q1 0
9
Q1 1
0
Q1 1
1
Q1 1
2
Q1 1
3
Q1 1
4
Q1 1
5
Q1 1
6
Q1 1
7
Inde
x (Q
1 20
09 =
100
)
Rental Index
Source: CBRE Research, Q2 2017
Source: CBRE Research, Q2 2017
Source: CBRE Research, Q2 2017
Figure 45: CBRE’s View in Six Months
Figure 46: Ningbo Office Market
Figure 47: Ningbo Retail Market
Q2 2017 CBRE Research| © CBRE Ltd. 201718

MARKETVIEW
SUZHOU OFFICE MARKET
SUZHOU RETAIL MARKET
EAST CHINA, SUZHOU
Office Retail Logistics
Rental Growth -1%− 0% 0%−1%
Vacancy Rate Change
0
30
60
90
120
Q1 0
7
Q1 0
8
Q1 0
9
Q1 1
0
Q1 1
1
Q1 1
2
Q1 1
3
Q1 1
4
Q1 1
5
Q1 1
6
Q1 1
7
Inde
x (Q
1 20
07 =
100
)
Rental Index Grade A Rental Index
Source: CBRE Research, Q2 2017
Figure 49: CBRE’s View in Six Months
Figure 50: Suzhou Office Market
Q2 2017 CBRE Research © CBRE Ltd. 2017 | 19
0
50
100
150
200
250
Q1 0
7
Q1 0
8
Q1 0
9
Q1 1
0
Q1 1
1
Q1 1
2
Q1 1
3
Q1 1
4
Q1 1
5
Q1 1
6
Q1 1
7
Inde
x (Q
1 20
07 =
100
)
Shopping Mall Ground Floor Rental Index
Source: CBRE Research, Q2 2017
Figure 51: Suzhou Retail Market
MARKETVIEW
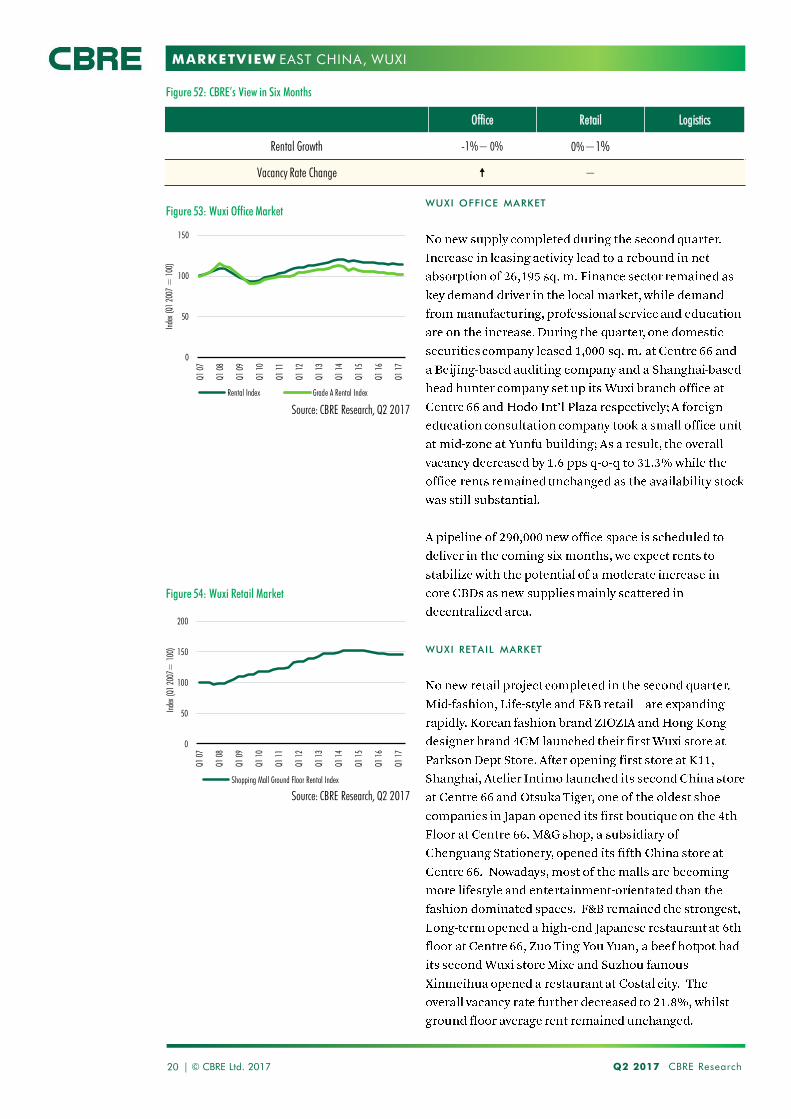
WUXI OFFICE MARKET
WUXI RETAIL MARKET
EAST CHINA, WUXI
Office Retail Logistics
Rental Growth -1%− 0% 0%−1%
Vacancy Rate Change −
0
50
100
150
Q1 0
7
Q1 0
8
Q1 0
9
Q1 1
0
Q1 1
1
Q1 1
2
Q1 1
3
Q1 1
4
Q1 1
5
Q1 1
6
Q1 1
7
Inde
x (Q
1 20
07 =
100
)
Rental Index Grade A Rental Index
0
50
100
150
200
Q1 0
7
Q1 0
8
Q1 0
9
Q1 1
0
Q1 1
1
Q1 1
2
Q1 1
3
Q1 1
4
Q1 1
5
Q1 1
6
Q1 1
7
Inde
x (Q
1 20
07=
100
)
Shopping Mall Ground Floor Rental Index
Source: CBRE Research, Q2 2017
Source: CBRE Research, Q2 2017
Figure 52: CBRE’s View in Six Months
Figure 54: Wuxi Retail Market
Figure 53: Wuxi Office Market
Q2 2017 CBRE Research| © CBRE Ltd. 201720

MARKETVIEW
GUANGZHOU OFFICE MARKET
SOUTH CHINA, GUANGZHOU
0
50
100
150
Q1 0
3
Q1 0
4
Q1 0
5
Q1 0
6
Q1 0
7
Q1 0
8
Q1 0
9
Q1 1
0
Q1 1
1
Q1 1
2
Q1 1
3
Q1 1
4
Q1 1
5
Q1 1
6
Q1 1
7
Inde
x (Q
1 20
03 =
100
)
Rental Index Grade A Rental Index
Source: CBRE Research, Q2 2017
Office Retail Logistics
Rental Growth 1%−3% 0%−1% 0%
Vacancy Rate Change
Figure 55: CBRE’s View in Six Months
Figure 56: Guangzhou Office Market
Q2 2017 CBRE Research © CBRE Ltd. 2017 | 21

MARKETVIEW
GUANGZHOU RETAIL MARKET
GUANGZHOU LOGISTICS MARKET
SOUTH CHINA, GUANGZHOU
0
40
80
120
160
Q1 0
9
Q1 1
0
Q1 1
1
Q1 1
2
Q1 1
3
Q1 1
4
Q1 1
5
Q1 1
6
Q1 1
7
Inde
x (Q
1 20
09 =
100
)
Rental Index
Source: CBRE Research, Q2 2017
Figure 58: Guangzhou Logistics Market
Q2 2017 CBRE Research| © CBRE Ltd. 201722
0
50
100
150
200
Q1 0
3
Q1 0
4
Q1 0
5
Q1 0
6
Q1 0
7
Q1 0
8
Q1 0
9
Q1 1
0
Q1 1
1
Q1 1
2
Q1 1
3
Q1 1
4
Q1 1
5
Q1 1
6
Q1 1
7
Inde
x (Q
1 20
03 =
100
)
Shopping Mall Ground Floor Rental Index
Source: CBRE Research, Q2 2017
Figure 57: Guangzhou Retail Market

MARKETVIEW
SHENZHEN OFFICE MARKET
SOUTH CHINA, SHENZHEN
Office Retail Logistics
Rental Growth -3%−0% -1%−1% 1%−4%
Vacancy Rate Change −
0
50
100
150
200
250
Q1 0
3
Q1 0
4
Q1 0
5
Q1 0
6
Q1 0
7
Q1 0
8
Q1 0
9
Q1 1
0
Q1 1
1
Q1 1
2
Q1 1
3
Q1 1
4
Q1 1
5
Q1 1
6
Q1 1
7
Inde
x (Q
1 20
03 =
100
)
Rental Index Grade A Rental Index
Source: CBRE Research, Q2 2017
Figure 59: CBRE’s View in Six Months
Figure 60: Shenzhen Office Market
Q2 2017 CBRE Research © CBRE Ltd. 2017 | 23

MARKETVIEW
SHENZHEN RETAIL MARKET
SHENZHEN LOGISTICS MARKET
SOUTH CHINA, SHENZHEN
0
50
100
150
Q1 0
9
Q1 1
0
Q1 1
1
Q1 1
2
Q1 1
3
Q1 1
4
Q1 1
5
Q1 1
6
Q1 1
7
Inde
x (Q
1 20
09 =
100
)
Rental Index
Source: CBRE Research, Q2 2017
Figure 62: Shenzhen Logistics Market
Q2 2017 CBRE Research| © CBRE Ltd. 201724
0
50
100
150
200
250
Q1 0
3
Q1 0
4
Q1 0
5
Q1 0
6
Q1 0
7
Q1 0
8
Q1 0
9
Q1 1
0
Q1 1
1
Q1 1
2
Q1 1
3
Q1 1
4
Q1 1
5
Q1 1
6
Q1 1
7
Inde
x (Q
1 20
03 =
100
)
Shopping Mall Ground Floor Rental Index
Source: CBRE Research, Q2 2017
Figure 61: Shenzhen Retail Market

MARKETVIEW
Figure 66: Chengdu Logistics Market
Figure 65: Chengdu Retail Market
CHENGDU OFFICE MARKET
CHENGDU RETAIL MARKET
WEST CHINA, CHENGDU
Office Retail Logistics
Rental Growth 0%− -1% -1%− 0% -3%−-1%
Vacancy Rate Change
0
50
100
150
Q1 0
3
Q1 0
4
Q1 0
5
Q1 0
6
Q1 0
7
Q1 0
8
Q1 0
9
Q1 1
0
Q1 1
1
Q1 1
2
Q1 1
3
Q1 1
4
Q1 1
5
Q1 1
6
Q1 1
7
Inde
x (Q
1 20
03 =
100
)
Rental Index Grade A Rental Index
0
50
100
150
200
Q2 0
4
Q2 0
5
Q2 0
6
Q2 0
7
Q2 0
8
Q2 0
9
Q2 1
0
Q2 1
1
Q2 1
2
Q2 1
3
Q2 1
4
Q2 1
5
Q2 1
6
Q2 1
7
Inde
x (Q
2 20
04 =
100
)
Shopping Mall Ground Floor Rental Index
0
50
100
150
200
Q1 0
9
Q1 1
0
Q1 1
1
Q1 1
2
Q1 1
3
Q1 1
4
Q1 1
5
Q1 1
6
Q1 1
7
Inde
x (Q
1 20
09 =
100
)
Rental Index
Source: CBRE Research, Q2 2017
Source: CBRE Research, Q2 2017
Source: CBRE Research, Q2 2017
Figure 63: CBRE’s View in Six Months
Figure 64: Chengdu Office Market
Q2 2017 CBRE Research © CBRE Ltd. 2017 | 25

MARKETVIEW
Figure 69: Chongqing Retail Market
Figure 70: Chongqing Logistics Market
CHONGQING OFFICE MARKET
CHONGQING RETAIL MARKET
WEST CHINA, CHONGQING
Office Retail Logistics
Rental Growth -1%− 0% 0%−1% -3%−-1%
Vacancy Rate Change
0
50
100
150
Q1 0
3
Q1 0
4
Q1 0
5
Q1 0
6
Q1 0
7
Q1 0
8
Q1 0
9
Q1 1
0
Q1 1
1
Q1 1
2
Q1 1
3
Q1 1
4
Q1 1
5
Q1 1
6
Q1 1
7
Inde
x (Q
1 20
03 =
100
)
Rental Index Grade A Rental Index
0
50
100
150
200
Q1 0
3
Q1 0
4
Q1 0
5
Q1 0
6
Q1 0
7
Q1 0
8
Q1 0
9
Q1 1
0
Q1 1
1
Q1 1
2
Q1 1
3
Q1 1
4
Q1 1
5
Q1 1
6
Q1 1
7
Inde
x (Q
1 20
03 =
100
)
Shopping Mall Ground Floor Rental Index
0
50
100
150
200
Q1 0
9
Q1 1
0
Q1 1
1
Q1 1
2
Q1 1
3
Q1 1
4
Q1 1
5
Q1 1
6
Q1 1
7
Inde
x (Q
1 20
09 =
100
)
Rental Index
Source: CBRE Research, Q2 2017
Source: CBRE Research, Q2 2017
Source: CBRE Research, Q2 2017
Figure 67: CBRE’s View in Six Months
Figure 68: Chongqing Office Market
Q2 2017 CBRE Research| © CBRE Ltd. 201726

MARKETVIEW
Figure 73: Wuhan Retail Market
WUHAN OFFICE MARKET
WUHAN RETAIL MARKET
Figure 74: Wuhan Logistics Market
0
100
200
300
Q3 0
4
Q3 0
5
Q3 0
6
Q3 0
7
Q3 0
8
Q3 0
9
Q3 1
0
Q3 1
1
Q3 1
2
Q3 1
3
Q3 1
4
Q3 1
5
Q3 1
6
Inde
x (Q
3 20
04 =
100
)
Shopping Mall Ground Floor Rental Index
CENTRAL CHINA, WUHAN
Office Retail Logistics
Rental Growth -1%−0% -1%− 0% -1%− 0%
Vacancy Rate Change
0
50
100
150
200
250
Q1 0
3
Q1 0
4
Q1 0
5
Q1 0
6
Q1 0
7
Q1 0
8
Q1 0
9
Q1 1
0
Q1 1
1
Q1 1
2
Q1 1
3
Q1 1
4
Q1 1
5
Q1 1
6
Q1 1
7
Inde
x (Q
1 20
03 =
100
)
Rental Index Grade A Rental Index
0
30
60
90
120
Q3 1
3
Q4 1
3
Q1 1
4
Q2 1
4
Q3 1
4
Q4 1
4
Q1 1
5
Q2 1
5
Q3 1
5
Q4 1
5
Q1 1
6
Q2 1
6
Q3 1
6
Q4 1
6
Q1 1
7
Q2 1
7
Inde
x (Q
3 20
13 =
100
)
Rental Index
Source: CBRE Research, Q2 2017
Source: CBRE Research, Q2 2017
Source: CBRE Research, Q2 2017
Figure 71: CBRE’s View in Six Months
Figure 72: Wuhan Office Market
Q2 2017 CBRE Research © CBRE Ltd. 2017 | 27

MARKETVIEW
CHANGSHA OFFICE MARKET
CHANGSHA RETAIL MARKET
CENTRAL CHINA, CHANGSHA
Office Retail Logistics
Rental Growth -1%− 0% 0%−1%
Vacancy Rate Change
0
50
100
150
200
Q1 0
8
Q1 0
9
Q1 1
0
Q1 1
1
Q1 1
2
Q1 1
3
Q1 1
4
Q1 1
5
Q1 1
6
Q1 1
7
Inde
x (Q
1 20
08 =
100
)
Rental Index Grade A Rental Index
0
50
100
150
Q1 0
8
Q1 0
9
Q1 1
0
Q1 1
1
Q1 1
2
Q1 1
3
Q1 1
4
Q1 1
5
Q1 1
6
Q1 1
7
Inde
x (Q
1 20
08 =
100
)
Shopping Mall Ground Floor Rental Index
Source: CBRE Research, Q2 2017
Source: CBRE Research, Q2 2017
Figure 75: CBRE’s View in Six Months
Figure 76: Changsha Office Market
Figure 77: Changsha Retail Market
Q2 2017 CBRE Research| © CBRE Ltd. 201728

MARKETVIEW
Rental Decline SlowingRental Decline Accelerating Rental Growth SlowingRental Growth Accelerating
Figure 79: Retail Rent Cycle
RENT/PRICE CYCLE
Figure 78: Office Rent Cycle
Figure 80: Logistics Rent Cycle
Q2 2017 CBRE Research © CBRE Ltd. 2017 | 29
Rental Decline SlowingRental Decline Accelerating Rental Growth SlowingRental Growth Accelerating
Rental Decline SlowingRental Decline Accelerating Rental Growth SlowingRental Growth Accelerating
S Suzhou
W Wuxi
S Shenyang
C Changsha
C Chengdu
C Chongqing
GGuangzhouS Shanghai
HHangzhou
WWuhan
BBeijing
T Tianjin
D Dalian
Q Qingdao
S Shenzhen
NNingbo
SShenyang
S Suzhou
Q Qingdao GGuangzhou
BBeijing
DDalian
SShanghai
NNanjing
NNingbo
WWuhanC Chengdu
CChangsha TTianjin
HHangzhouW Wuxi
S Shenzhen
CChongqing
W Wuhan SShenzhen
C Chengdu
C ChongqingBBeijing
TTianjin
SShenyang
QQingdao
SShanghai
NNingbo
NNanjingHHangzhou
GGuangzhou
DDalian
NNanjing
Source: CBRE Research, Q2 2017

MARKETVIEW
MAJOR LUXURY RESIDENTIAL
AND OFFICE AREAS
MAJOR INDUSTRIAL AREAS
MAJOR OFFICE, LUXURY
RESIDENTIAL AND
RETAIL AREAS
MAJOR OFFICE AND
RETAIL AREAS
MAJOR OFFICE AREAS
MAJOR RETAIL AREAS
MAJOR LUXURY RESIDENTIAL
AREAS
MAJOR INDUSTRIAL AREAS
NORTH CHINA SUBMARKETS
TIANJIN MAJOR SUBMARKETS
DALIAN MAJOR SUBMARKETS
Q2 2017 CBRE Research| © CBRE Ltd. 201730
MAJOR OFFICE, LUXURY
RESIDENTIAL , RETAIL
AND INDUSTRIAL AREAS
MAJOR OFFICE AND
RETAIL AREAS
MAJOR RETAIL AND
LUXURY RESIDENTIAL
AREAS
MAJOR OFFICE AREAS
BEIJING MAJOR SUBMAKETS
1
102
849
3
5
1112
13
17
16
14
15
18
7
6
THIRD RING ROAD
310
11
2
68
4
5
9
7
12
1315
1
16
14
17
4
1
2
63
57
8
9
1011
MAJOR LUXURY RESIDENTIAL
AREAS
MAJOR INDUSTRIAL AREAS
MAJOR OFFICE, LUXURY
RESIDENTIAL AND
RETAIL AREAS
MAJOR OFFICE AND
RETAIL AREAS
MAJOR OFFICE AREAS
MAJOR RETAIL AREAS

MARKETVIEW NORTH CHINA SUBMARKETS
Q2 2017 CBRE Research © CBRE Ltd. 2017 | 31
3
1
2
7
5
8
9
10
11
6
4
10 11
9
8
1213
14
15
1
2
6
4
7
5
3
SHENYANG MAJOR SUBMAKETS
MAJOR LUXURY RESIDENTIAL
AREAS
MAJOR INDUSTRIAL AREAS
MAJOR OFFICE, LUXURY
RESIDENTIAL AND
RETAIL AREAS
MAJOR RETAIL AREAS
QINGDAO MAJOR SUBMARKETS
MAJOR INDUSTRIAL AREASMAJOR OFFICE, LUXURY
RESIDENTIAL AND
RETAIL AREAS
MAJOR OFFICE AREAS
MAJOR RETAIL AREAS
MAJOR LUXURY
RESIDENTIAL AREAS

MARKETVIEW
EMERGING OFFICE AND RETAIL
AREAS
EMERGING RETAIL AREAS
EAST CHINA SUBMARKETS
Q2 2017 CBRE Research| © CBRE Ltd. 201732
3
1
11
25
8
4
10
6
9
7
13
1415
12
錢塘
江
1
1211
3
6
4
97
10
8
2
5 13
13
14
15
16
17
3
1
11
25
8
4
10
6
9
7
13
1415
12
3
1
15
16
14
2
674
5
10
11
17
12
13
89
18
2527
28
29
30
22
23
19
20
21
24
31
32
26
SHANGHAI MAJOR SUBMAKETS
MAJOR LUXURY RESIDENTIAL
AREAS
MAJOR INDUSTRIAL AREAS
MAJOR OFFICE, LUXURY
RESIDENTIAL AND
RETAIL AREAS
MAJOR OFFICE AREAS
MAJOR RETAIL AREAS
HANGZHOU MAJOR SUBMARKETS
MAJOR LUXURY RESIDENTIAL
AREAS
MAJOR INDUSTRIAL AREAS
MAJOR OFFICE, LUXURY
RESIDENTIAL AND
RETAIL AREAS
MAJOR OFFICE AND
LUXURY RESIDENTIAL
AREAS
MAJOR RETAIL AND
LUXURY RESIDENTIAL
AREAS
NANJING MAJOR SUBMARKETS
MAJOR LUXURY RESIDENTIAL
AREAS
MAJOR INDUSTRIAL AREAS
MAJOR OFFICE, LUXURY
RESIDENTIAL AND
RETAIL AREAS
MAJOR RETAIL AREAS

MARKETVIEW EAST CHINA SUBMARKETS
Q2 2017 CBRE Research © CBRE Ltd. 2017 | 33
4
6
7
2
3
5
1
2
1
3
5
4
6
NINGBO MAJOR SUBMAKETS
MAJOR LUXURY RESIDENTIAL
AREAS
MAJOR INDUSTRIAL AREAS
MAJOR OFFICE, LUXURY
RESIDENTIAL AND
RETAIL AREAS
MAJOR RETAIL AND
LUXURY RESIDENTIAL
AREAS
MAJOR OFFICE AREAS
SUZHOU MAJOR SUBMARKETS
WUXI MAJOR SUBMARKETS
MAJOR OFFICE, LUXURY
RESIDENTIAL AND
RETAIL AREAS
MAJOR OFFICE AREAS
MAJOR RETAIL AREAS
MAJOR OFFICE, LUXURY
RESIDENTIAL AND
RETAIL AREAS
MAJOR OFFICE AREAS
MAJOR RETAIL AREAS
MARKETVIEW SOUTH CHINA SUBMARKETS
Q2 2017 CBRE Research| © CBRE Ltd. 201734
11
17
1612
1314
15
5
6
4
2
7
1
3
8
10
9
HONG KONG S.A.R.
3
1
10
11
2
6
13
4
5
7
12
8
9
14
1516
17
DEEP BAY
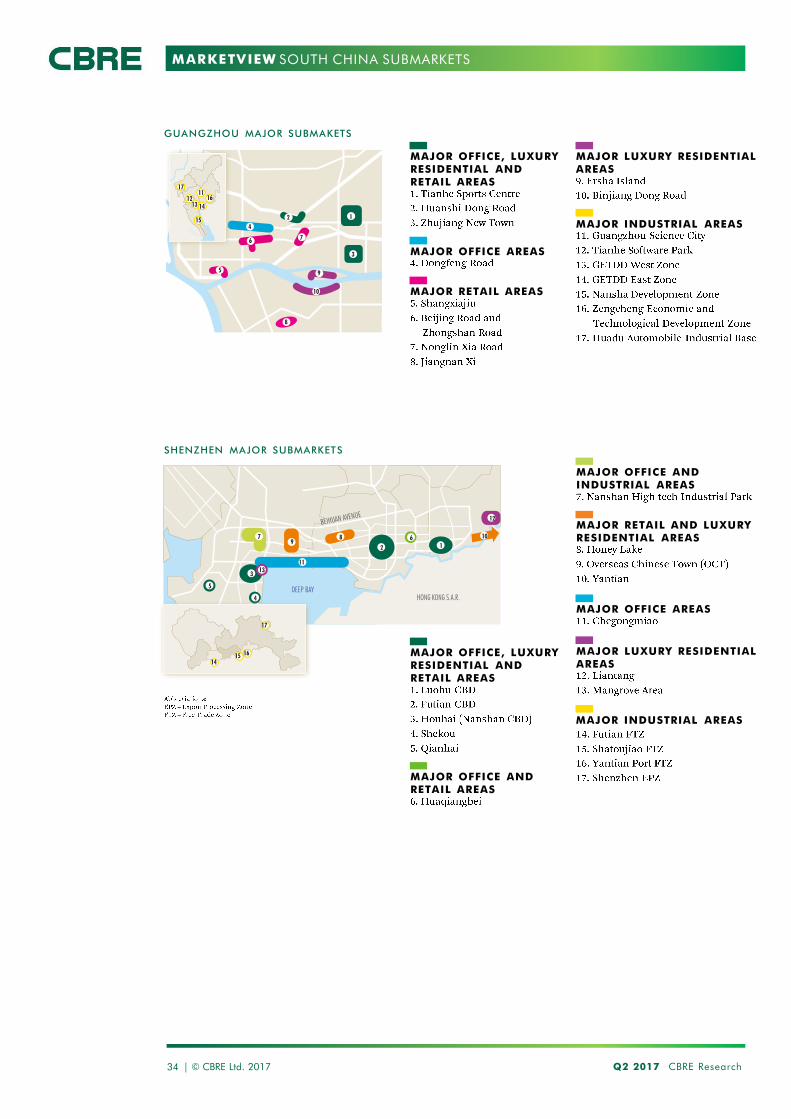
GUANGZHOU MAJOR SUBMAKETS
MAJOR LUXURY RESIDENTIAL
AREAS
MAJOR INDUSTRIAL AREAS
MAJOR OFFICE, LUXURY
RESIDENTIAL AND
RETAIL AREAS
MAJOR OFFICE AREAS
MAJOR RETAIL AREAS
SHENZHEN MAJOR SUBMARKETS
MAJOR OFFICE AND
INDUSTRIAL AREAS
MAJOR RETAIL AND LUXURY
RESIDENTIAL AREAS
MAJOR OFFICE AREAS
MAJOR LUXURY RESIDENTIAL
AREAS
MAJOR INDUSTRIAL AREAS
MAJOR OFFICE, LUXURY
RESIDENTIAL AND
RETAIL AREAS
MAJOR OFFICE AND
RETAIL AREAS
MARKETVIEW WEST CHINA SUBMARKETS
Q2 2017 CBRE Research © CBRE Ltd. 2017 | 35
3
45
1
7
2
11
12
6
8
9
10
YANGTZE RIVER
1
SECOND RING ROAD
5
2
3
7
4
6
910
8
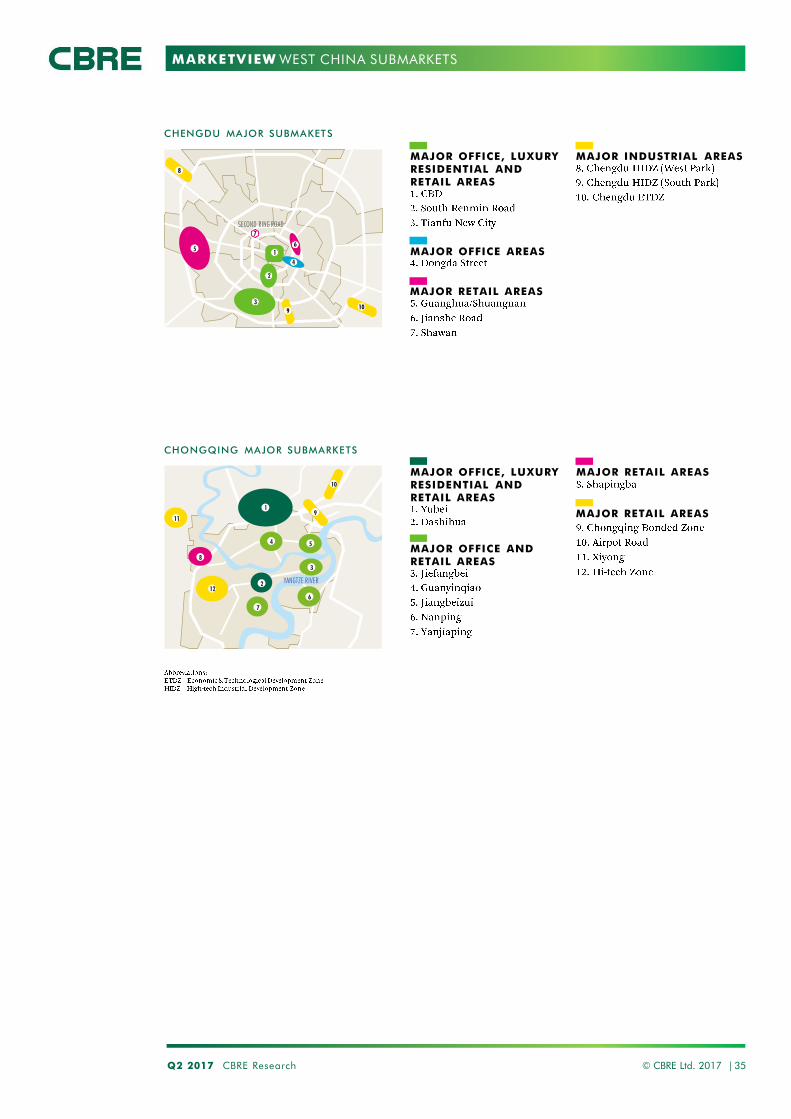
CHONGQING MAJOR SUBMARKETS
CHENGDU MAJOR SUBMAKETS
MAJOR OFFICE, LUXURY
RESIDENTIAL AND
RETAIL AREAS
MAJOR OFFICE AREAS
MAJOR RETAIL AREAS
MAJOR OFFICE, LUXURY
RESIDENTIAL AND
RETAIL AREAS
MAJOR OFFICE AND
RETAIL AREAS
MAJOR RETAIL AREAS
MAJOR RETAIL AREAS
MAJOR INDUSTRIAL AREAS

MARKETVIEW
MAJOR OFFICE, LUXURY
RESIDENTIAL AND
RETAIL AREAS
MAJOR OFFICE AND
LUXURY RESIDENTIAL
AREAS
MAJOR OFFICE AND
RETAIL AREAS
CENTRAL CHINA SUBMARKETS
Q2 2017 CBRE Research| © CBRE Ltd. 201736
8
1
2
7
6
1618 17
3
9
10
11
4
512
13
14 15
5
1
2
13
3
4
8 11
12
9
6
7
10
CHANGSHA MAJOR SUBMARKETS
WUHAN MAJOR SUBMAKETS
MAJOR OFFICE AND RETAIL
AREAS
MAJOR RETAIL AREAS
MAJOR RETAIL AND LUXURY
RESIDENTIAL AREAS
MAJOR RETAIL AREAS
MAJOR LUXURY RESIDENTIAL
AREAS
MAJOR INDUSTRIAL AREAS
EMERGING RETAIL AREAS

MARKETVIEW CONTACT US
BEIJING
SHENZHEN
HANGZHOU
SHANGHAI
CHENGDU
GUANGZHOU
WUHAN
Q2 2017 CBRE Research © CBRE Ltd. 2017 | 37
• 5 REGIONAL HUBS
• MORE THAN 30 SERVICE LOCATIONS
• COVERS MORE THAN 100 CITIES ACROSS CHINA

MARKETVIEW NOTES
Q2 2017 CBRE Research| © CBRE Ltd. 201738

MARKETVIEW NOTES
Q2 2017 CBRE Research © CBRE Ltd. 2017 | 39

MARKETVIEW
Disclaimer: Information contained herein, including projections, has been obtained from sources believed to be reliable. While we do not doubt its accuracy, we have not verified it and make no guarantee, warranty or representation about it. It is your responsibility to confirm independently its accuracy andcompleteness. This information is presented exclusively for use by CBRE clients and professionals and all rights to the material are reserved and cannot be reproduced without prior written permission of CBRE.
CBRE GLOBAL RESEARCH
This report was prepared by China team which forms part of CBRE Global
Research – a network of preeminent researchers who collaborate to provide
real estate market research and econometric forecasting to real estate.
CBRE CHINA RESEARCH
CONTACTS
OUR OFFICES IN CHINA