occupational health indicators · the average workers compensation award per covered worker for the...
TRANSCRIPT

Occupational HealthIndicatorsFlorida, 2000–2007
Florida Department of Health, Division of Environmental Health—2011

Highlights, 2
Introduction, 3
Florida Employment Demographics 2000–2007, 4
Workforce Distribution, 5
Indicators, 6Indicator 1: Non-fatal Work-related Injuries and Illnesses Reported by Employers, 6Indicator 2: Work-related Hospitalizations, 7Indicator 3: Fatal Work-related Injuries, 8Indicator 4: Work-related Amputations with Days Away from Work Reported by Employers, 9Indicator 5: State Workers’ Compensation Claims for Amputations with Lost Work-Time, 10Indicator 6: Hospitalizations for Work-related Burns, 11Indicator 7: Work-related Musculoskeletal Disorders with Days Away from Work Reported byEmployers, 12Indicator 8: State Workers’ Compensation Claims for Carpal Tunnel Syndrome with Lost Work-Time, 14Indicator 9: Hospitalizations from or with Pneumoconiosis, 15Indicator 10: Mortality from or with Pneumoconiosis, 17Indicator 11: Acute Work-related Pesticide-associated Illness and Injury Reported to PoisonControl Centers, 19Indicator 12: Incidence of Malignant Mesothelioma, 20Indicator 13: Elevated Blood Lead Levels Among Adults, 21Indicator 14: Workers Employed in Industries at High Risk for Occupational Morbidity, 23Indicator 15: Workers Employed in Occupations at High Risk for Occupational Morbidity, 25Indicator 16: Workers Employed in Industries and Occupations at High Risk for OccupationalMortality, 27Indicator 17: Occupational Safety and Health Professionals, 29Indicator 18: OSHA Enforcement Activities, 30Indicator 19: Workers’ Compensation Awards, 31
References, 32
1
Tab
le o
f co
nte
nts

2
1. The number and rate of non-fatal work-related injuries and illnessesreported by private sector employers steadily declined from 2000 to2007, including for the more serious cases involving days away fromwork. (Indicator 1)
2. The work-related hospitalization rate declined 44% during the time-period2000–2007. (Indicator 2)
4. The rate of all work-related musculoskeletal disordersdeclined 49.6% from 2000 to 2007. (Indicator 7)
5. More than 300,000 workers were employed in industries with a high risk of work-related injury orillness. (Indicator 14)
Hig
hlig
hts
7. The average workers compensation award per covered worker for the period2000–2007 was $391. (Indicator 19)
6. More than 1 million workers were employed in occupations with ahigh risk of mortality. (Indicator 16)
3. On average 369 work-relateddeaths occurred each year. (Indicator 3)

Each year many of these workers experience work-related injuries, illnesses, or fatalities. Work-relatedaccidents result in pain, lost work-time, lost wagesand result in an emotional and economic toll onworkers and their families. Businesses are impactedthrough lost productivity. Fortunately, work-relatedinjuries and illnesses are largely preventablethrough a variety of efforts aimed at controllingworkplace hazards.
Identification of risk factors for work-relatedinjuries and illnesses is important in designingtargeted interventions to reduce workplace hazardsand improve safety. Surveillance data aid inidentifying risk factors such as high-risk industriesand occupations. Surveillance also monitors thegeneral levels of injury and illness so that increasesover baseline are apparent.
A set of surveillance measures calledoccupational health indicators have been designedthrough a joint effort between the Council of Stateand Territorial Epidemiologists (CSTE) and theNational Institute of Occupational Safety andHealth (NIOSH). These occupational healthindicators are a set of 19 measures by which statescan monitor the health of their workforce. Thepurpose of the indicators is to allow uniformexamination over time, comparison betweenindividual states and the nation, and to highlightareas that may need additional exploration.Although comparisons can be helpful, care must betaken due to individual state differences in theindustry mix, workforce demographics, reportingguidelines, and reporting quality.
The data for indicators is drawn from amultitude of sources including national surveys,census, hospitalization data, and health registrydata. The specific sources for each indicator arelisted in the footnote section. Detailed methods on
how the indicators were calculated can be found inthe CSTE guidance document Occupational HealthIndicators: A Guide for Tracking OccupationalHealth Conditions and Their Determinants,available at www.cste.org.
This surveillance report contains Florida’soccupational health indicators for the years 2000–2007. Due to the time lag in all the necessary datasources being made available for analyses theoccupational indicators are calculated several yearsbehind the current year.
The purpose of this report is to provide anoverview of the occupational health status of thestate of Florida. Examining Florida’s indicatorsover-time provides information on which workerhealth issues need further analyses. The results ofthis surveillance will help guide interventions andeducation efforts aimed at reducing occupationalinjury and illness. Although this report commentson whether the measure appears to be increasing ordeclining over time no statistical analyses was usedto assess the significance of the trend. Whereappropriate, Florida’s measures are compared tothat of the nation. Differences among age groups,races, ethnicities and genders may be obscured inthese summary statistics and will be furtherexplored in future reports.
Intr
odu
ctio
n
3
The data for indicators isdrawn from a multitudeof sources includingnational surveys, census,hospitalization data,and health registry data.
A LARGE WORKFORCE OF APPROXIMATELY 8.9 MILLION WORKERS SUPPORTSFLORIDA’S ECONOMY.

FLORIDA IS THE FOURTH MOST POPULOUSSTATE IN THE NATION. The population wasestimated to be over 18 million in 2007 (USCensus Bureau). Between 2000 and 2007 theFlorida workforce increased by over 1 millionpeople (Table A). The majority of these workerswere employed full-time and 75% worked a 40-hour workweek or more.
From 2000 to 2007 the percentage of theworkforce that is over age 65 increased. The racialand ethnic makeup of the workforce also shiftedslightly and there was a notable increase in thepercentage of Hispanic workers.D
emog
rap
hics
4
Table A.Employment Profileof FloridaWorkforce, Age 16year and older,2000–2007
Data Source: Bureau of Labor Statistics Current Population Survey
Florida Employment Demographics, 2000–2007
Employment Profile 2000 2001 2002 2003 2004 2005 2006 2007
Number employed Age 16 and older (in thousands) 7,221 7,309 7,642 7,744 8,021 8,390 8,762 8,861
% Workforce unemployed 3.6 4.8 5.5 5.1 4.6 3.6 3.2 4.1
% Self-employed 6.0 6.0 6.0 6.6 5.9 6.1 5.7 6.0
% Employed in part-time jobs 14.0 14.4 15.1 15.4 14.9 14.0 14.3 14.9
% <40 hours/week 26.6 28.8 29.2 28.5 29.4 27.6 27.5 27.4
% 40 hours/week 47.7 44.5 45.0 46.2 44.8 47.0 47.8 49.3
% 41+ hours/week 28.1 26.7 25.7 25.3 25.7 25.5 24.7 23.3
% Males 54.0 54.2 54.1 53.4 53.6 53.7 53.0 53.2
% Females 46.0 45.8 45.9 46.6 46.4 46.3 47.0 46.8
% Age 16 to 17 1.8 1.7 1.5 1.5 1.2 1.3 1.3 1.1
% Age 18 to 64 94.8 94.6 94.6 94.5 94.6 94.3 94.3 94.0
% Age 65+ 3.5 3.8 3.8 4.0 4.2 4.5 4.4 4.8
% White Race 83.7 83.9 83.0 81.6 82.2 82.8 82.2 82.1
% Black Race 13.9 14.1 14.3 14.5 14.2 13.8 14.1 14.3
% Other Race 2.4 2.0 2.7 3.9 3.7 3.4 3.7 3.6
% Hispanic Origin 18.3 18.2 19.9 19.2 19.6 20.1 21.5 22.2
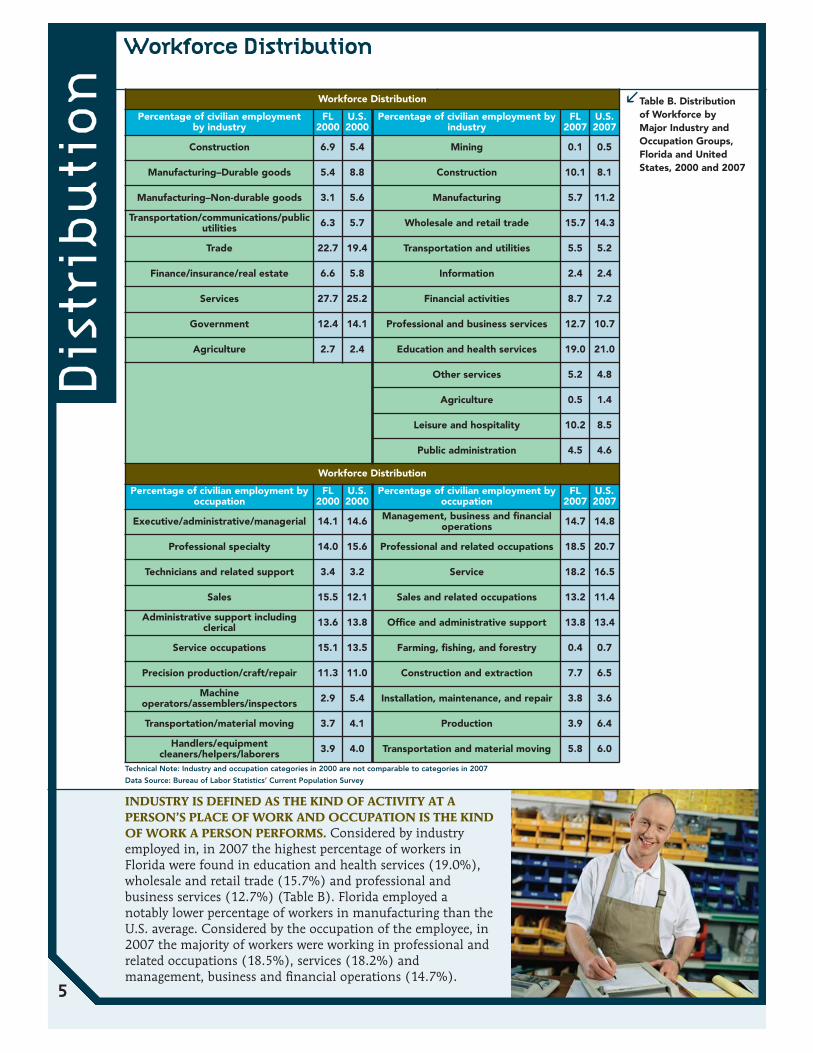
INDUSTRY IS DEFINED AS THE KIND OF ACTIVITY AT APERSON’S PLACE OF WORK AND OCCUPATION IS THE KINDOF WORK A PERSON PERFORMS. Considered by industryemployed in, in 2007 the highest percentage of workers inFlorida were found in education and health services (19.0%),wholesale and retail trade (15.7%) and professional andbusiness services (12.7%) (Table B). Florida employed anotably lower percentage of workers in manufacturing than theU.S. average. Considered by the occupation of the employee, in2007 the majority of workers were working in professional andrelated occupations (18.5%), services (18.2%) andmanagement, business and financial operations (14.7%).
Dis
trib
uti
on
5
Table B. Distributionof Workforce byMajor Industry andOccupation Groups,Florida and UnitedStates, 2000 and 2007
Workforce Distribution
Technical Note: Industry and occupation categories in 2000 are not comparable to categories in 2007
Data Source: Bureau of Labor Statistics’ Current Population Survey
Workforce Distribution
Percentage of civilian employmentby industry
FL2000
U.S.2000
Percentage of civilian employment byindustry
FL2007
U.S.2007
Construction 6.9 5.4 Mining 0.1 0.5
Manufacturing–Durable goods 5.4 8.8 Construction 10.1 8.1
Manufacturing–Non-durable goods 3.1 5.6 Manufacturing 5.7 11.2
Transportation/communications/publicutilities 6.3 5.7 Wholesale and retail trade 15.7 14.3
Trade 22.7 19.4 Transportation and utilities 5.5 5.2
Finance/insurance/real estate 6.6 5.8 Information 2.4 2.4
Services 27.7 25.2 Financial activities 8.7 7.2
Government 12.4 14.1 Professional and business services 12.7 10.7
Agriculture 2.7 2.4 Education and health services 19.0 21.0
Other services 5.2 4.8
Agriculture 0.5 1.4
Leisure and hospitality 10.2 8.5
Public administration 4.5 4.6
Workforce Distribution
Percentage of civilian employment byoccupation
FL2000
U.S.2000
Percentage of civilian employment byoccupation
FL2007
U.S.2007
Executive/administrative/managerial 14.1 14.6 Management, business and financialoperations 14.7 14.8
Professional specialty 14.0 15.6 Professional and related occupations 18.5 20.7
Technicians and related support 3.4 3.2 Service 18.2 16.5
Sales 15.5 12.1 Sales and related occupations 13.2 11.4
Administrative support includingclerical 13.6 13.8 Office and administrative support 13.8 13.4
Service occupations 15.1 13.5 Farming, fishing, and forestry 0.4 0.7
Precision production/craft/repair 11.3 11.0 Construction and extraction 7.7 6.5
Machineoperators/assemblers/inspectors 2.9 5.4 Installation, maintenance, and repair 3.8 3.6
Transportation/material moving 3.7 4.1 Production 3.9 6.4
Handlers/equipmentcleaners/helpers/laborers 3.9 4.0 Transportation and material moving 5.8 6.0

BACKGROUND Work-related injuries generallyresult from one-time events such as cuts, falls,burns and amputations. Work-related illnesses areabnormal conditions or disorders that most oftenresult from cumulative exposures or repetitivemotion, and include illnesses such as respiratoryconditions, skin diseases, poisoning, hearing loss,and carpal tunnel syndrome. Work-related illnessesare often more difficult to associate with work thanwork-related injuries due to their long developmentperiod.
Indicator 1 utilized data from the Bureau ofLabor Statistics’ annual Survey of OccupationalInjury and Illness (SOII). The SOII estimates thenumber of work-related injuries and illnesses forthe state based on logs kept by employers surveyed.Requirements for the log are set forth by theOccupational Safety and Health Administration(OSHA). OSHA requires that employers log work-related injuries and illness that result in medicaltreatment beyond first aid, loss of consciousness,restricted work, transfer to another job, days awayfrom work (one or more) or death.
The survey covers the majority of private sectorindustries; however, the military, federal agencies,farms with fewer than 11 employees, self-employedworkers, and household workers are excluded. Theexcluded workers comprise approximately 21% ofthe U.S. workforce.1 Additional limitations include
that the survey is subject to sampling error and notall qualifying events are captured in the logs.Employers may not be aware of work-relatedconditions if the employee seeks treatment fromtheir personal healthcare provider. Work-relatedillnesses in particular are not well documented.2
RESULTS In Florida, the number and rate of non-fatal work-related injuries and illnesses reported byprivate sector employers steadily declined from2000–2007, including among more serious casesinvolving days away from work. This decline wasalso seen nationally.
Table 1 shows the number of work-relatedinjuries and illnesses reported for the period 2000to 2007. In 2000, there were an estimated 288,200work-related injuries and illnesses, but by 2007, thereported number had dropped to 216,800. Onaverage 27% of these injuries and illness requireddays away from work and 11% required at least 10days away from work.
Figure 1 shows the rate of work-related injuriesand illnesses per 100,000 employed persons. From2000–2007 the rate declined 32.7% for all work-related injuries and illnesses and 37.5% for casesinvolving days away from work. For all years,Florida’s rate of work-related injuries and illnesseswas at or below the national average.
Ind
icato
r 1
Cas
es p
er 1
00,0
00 f
ull-t
ime
equi
vale
nts
(fte
s)
7,000
6,000
5,000
4,000
3,000
2,000
1,000
0
� All cases of work-related injuries & illnesses� Cases involving days away from work/ U.S.
5,8005,700
5,100
2000 2001 2002 2003 2004 2005 2006 2007
5,0004,900
4,5004,400
3,900
1,6001,500 1,500
1,300 1,300 1,200 1,2001,000
2000 2001 2002 2003 2004 2005 2006 2007
All cases of work-related injuries
& illnesses288,200 287,400 245,900 247,300 254,900 246,300 244,400 216,800
Cases involving daysaway from work 80,600 77,800 71,400 64,800 68,900 67,300 67,600 57,800
Cases involving morethan 10 days away
from work28,524 29,867 26,188 26,100 28,480 27,640 27,820 23,040
6
Table 1. Number ofNon-Fatal Work-Related Injuries andIllnesses Reported byPrivate SectorEmployers, Florida,2000–2007
Figure 1. Number ofNon-Fatal Work-Related Injuries andIllnesses Reported byPrivate SectorEmployers, Florida,2000–2007
Data Source: Bureau of Labor Statistics’ Annual Survey of Occupational Injuries and Illnesses (SOII)
Non-fatal Work-related Injuries and IllnessesReported by Employers
BACKGROUND Most work-related injuries andillnesses do not result in hospitalizations. Only themost severe injuries and illnesses result inadmissions to a hospital. The data source for thisindicator was the Florida Agency for Health CareAdministration (AHCA) hospital discharge dataset.Hospitalizations were considered work-related ifworkers compensation was listed as the principalpayer. Only cases who were 16 years of age or olderwere included. Workers compensation varies bystate and care should be taken when comparingFlorida to other states or the nation.
The results of this indicator are likely to be anunderestimate of the true burden of work-relatedinjuries and illnesses that are severe enough torequire hospitalization. A major limitation of thisindicator is its reliance on payor source (workerscompensation) to determine work-relatedness. Alarge proportion of individuals that are potentiallyeligible for workers compensation do not file forvarious reasons and are thus not captured by thisindicator.3,4,5 Changes in the number of employerswho carry workers compensation or in practicesrelated to employee filing of workers compensationare not able to be captured in these data sources.
Additionally not all employed persons arecovered by state workers compensation. Federalworkers and self-employed persons are not covered.Also, employers of small farms and small non-
construction industry businesses are not requiredto carry workers compensation coverage. See thefollowing link for Florida specific information onworkers compensation (http://www.myfloridacfo.com/wc/employer/coverage.html).
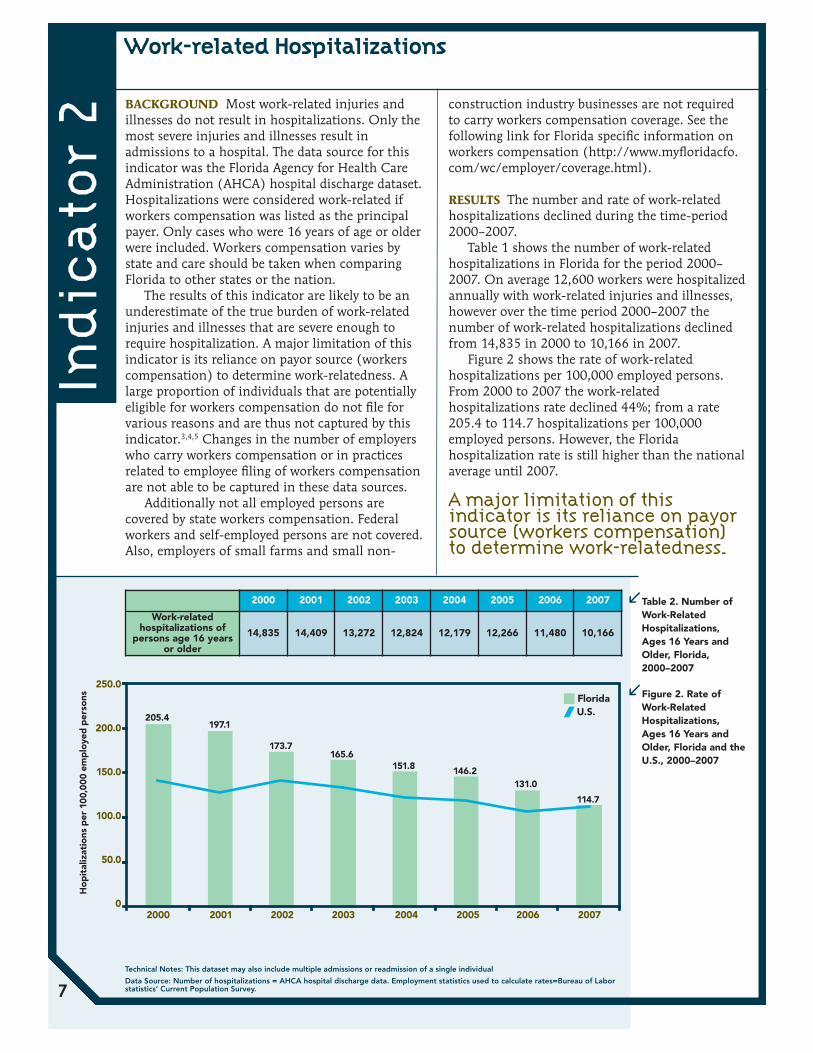
RESULTS The number and rate of work-relatedhospitalizations declined during the time-period2000–2007.
Table 1 shows the number of work-relatedhospitalizations in Florida for the period 2000–2007. On average 12,600 workers were hospitalizedannually with work-related injuries and illnesses,however over the time period 2000–2007 thenumber of work-related hospitalizations declinedfrom 14,835 in 2000 to 10,166 in 2007.
Figure 2 shows the rate of work-relatedhospitalizations per 100,000 employed persons.From 2000 to 2007 the work-relatedhospitalizations rate declined 44%; from a rate205.4 to 114.7 hospitalizations per 100,000employed persons. However, the Floridahospitalization rate is still higher than the nationalaverage until 2007.
Ind
icato
r 2
7
Work-related Hospitalizations
250.0
200.0
150.0
100.0
50.0
0
Ho
pit
aliz
atio
ns p
er 1
00,0
00 e
mp
loye
d p
erso
ns
2000 2001 2002 2003 2004 2005 2006 2007
� Florida/ U.S.205.4
197.1
173.7165.6
151.8 146.2131.0
114.7
2000 2001 2002 2003 2004 2005 2006 2007
Work-relatedhospitalizations of
persons age 16 yearsor older
14,835 14,409 13,272 12,824 12,179 12,266 11,480 10,166
Figure 2. Rate ofWork-RelatedHospitalizations,Ages 16 Years andOlder, Florida and theU.S., 2000–2007
A major limitation of thisindicator is its reliance on payorsource (workers compensation)to determine work-relatedness.
Technical Notes: This dataset may also include multiple admissions or readmission of a single individual
Data Source: Number of hospitalizations = AHCA hospital discharge data. Employment statistics used to calculate rates=Bureau of Laborstatistics’ Current Population Survey.
Table 2. Number ofWork-RelatedHospitalizations,Ages 16 Years andOlder, Florida,2000–2007
BACKGROUND Fatal work-related injuries aredefined as injuries that occur at work and result indeath. The data source for this indicator is theBureau of Labor Statistics, Census (annualcomprehensive count) of Fatal OccupationalInjuries (CFOI). CFOI utilizes multiples sourcessuch as death certificates, State workers’compensation records, news media, and OSHAreports to ensure an accurate count of all work-related deaths. CFOI includes deaths from bothunintentional injuries (i.e. falls, electrocutions,caught in machinery, highway accidents, etc.) andintentional injuries (suicide and homicide). Deathscaused by work-related illnesses are not counted.
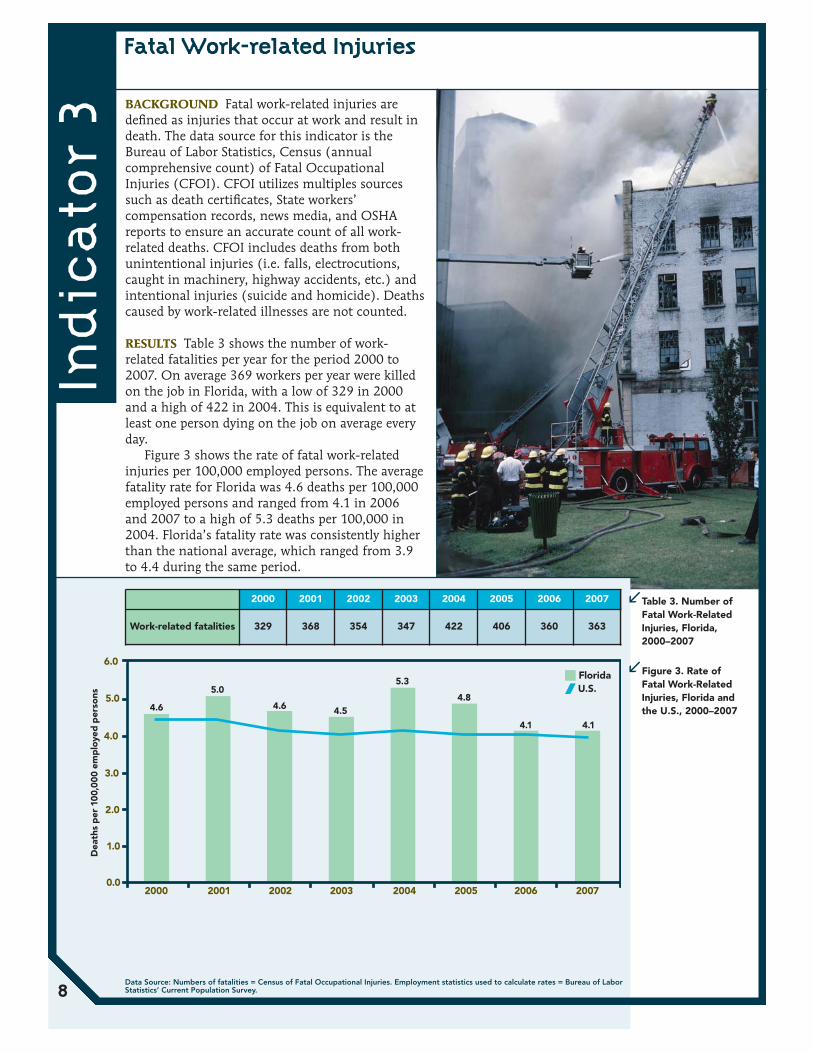
RESULTS Table 3 shows the number of work-related fatalities per year for the period 2000 to2007. On average 369 workers per year were killedon the job in Florida, with a low of 329 in 2000and a high of 422 in 2004. This is equivalent to atleast one person dying on the job on average everyday.
Figure 3 shows the rate of fatal work-relatedinjuries per 100,000 employed persons. The averagefatality rate for Florida was 4.6 deaths per 100,000employed persons and ranged from 4.1 in 2006and 2007 to a high of 5.3 deaths per 100,000 in2004. Florida’s fatality rate was consistently higherthan the national average, which ranged from 3.9to 4.4 during the same period.
Ind
icato
r 3
2000 2001 2002 2003 2004 2005 2006 2007
� Florida/ U.S.
4.6
5.0
4.6 4.5
5.3
4.8
4.1 4.1
0.0
1.0
2.0
3.0
4.0
5.0
6.0
Dea
ths
per
100
,000
em
plo
yed
per
sons
2000 2001 2002 2003 2004 2005 2006 2007
Work-related fatalities 329 368 354 347 422 406 360 363
8
Table 3. Number ofFatal Work-RelatedInjuries, Florida,2000–2007
Figure 3. Rate ofFatal Work-RelatedInjuries, Florida andthe U.S., 2000–2007
Data Source: Numbers of fatalities = Census of Fatal Occupational Injuries. Employment statistics used to calculate rates = Bureau of LaborStatistics’ Current Population Survey.
Fatal Work-related Injuries

BACKGROUND An amputation is defined as thetraumatic loss of a limb or other external body partin which bone loss occurs. This indicator utilizesdata from the Bureau of Labor Statistics annualSurvey of Occupational Injury and Illness (SOII).The SOII estimates the number of work-relatedinjuries and illnesses based on logs kept byemployers surveyed. Requirements for the log areset forth by the Occupational Safety and HealthAdministration (OSHA). OSHA requires thatemployers log work-related injuries and illness thatresult in medical treatment beyond first aid, loss ofconsciousness, restricted work, transfer to anotherjob, days away from work or death.
Indicator 4 counts those cases that involveddays away from work. The cases that involve daysaway from work are typically more severe in naturethan those that do not require time away fromwork.
The SOII covers the majority of private sectorindustries; however, the military, federal agencies,farms with fewer than 11 employees, self-employedworkers, and household workers are excluded. Theexcluded workers comprise approximately 21% ofthe U.S. workforce.1 Additional limitations includethat the survey is subject to sampling error and notall qualifying events are captured in the logs.Employers may not be aware of work-relatedconditions if the employee seeks treatment fromtheir personal healthcare provider. Work-relatedillnesses in particular are not well documented.2
RESULTS Table 4 shows the number ofamputations involving days away from work thatoccurred in 2000–2007. On average, there were335 amputations per year involving days from workamong Florida workers. The number ofamputations ranged from a high of 430 in 2006 to220 in 2003 and 2004.
Figure 4 shows the rate of amputationsinvolving days away from work per 100,000 full-time equivalents (ftes). The rate in Florida hasranged from 4.0–8.0 amputations per 100,000 ftes.The rate of work-related amputations in Floridawas below the national average for all years. Thismay reflect Florida’s lower occurrence ofmanufacturing, production and farming facilities
Ind
icato
r 4
� Florida/ U.S.
8.0 8.0
7.0
4.0 4.0
6.0
8.0
5.0
0.0
2.0
4.0
6.0
8.0
10.0
12.0
2000 2001 2002 2003 2004 2005 2006 2007
Cas
es p
er 1
00,0
00 f
ull-t
ime
equi
vale
nts
(fte
s)
2000 2001 2002 2003 2004 2005 2006 2007
Amputations involvingdays away from work 417 410 354 220 220 350 430 280
9
Table 4. Number ofWork-RelatedAmputationsInvolving Days awayfrom Work Reportedby Private SectorEmployers, Florida,2000–2007
Figure 4. Rate ofWork-RelatedAmputationsInvolving Days awayfrom Work Reportedby Private SectorEmployers, Floridaand the U.S.,2000–2007
Data Source: Bureau of Labor Statistics’ Annual Survey of Occupational Injuries and Illnesses (SOII)
Work-related Amputations with Days Away fromWork Reported by Employers
Additional limitations includethat the survey is subject tosampling error and not allqualifying events are captured inthe logs.
AT THE TIME OF THIS REPORT, STATE WORKERS COMPENSATION CLAIMS DATAWERE NOT AVAILABLE.
Ind
icato
r 5
10
State Workers’ Compensation Claims forAmputations with Lost Work-Time

BACKGROUND Work-related burns can be causedby dry heat (fire), moist heat (steam), electricity,chemicals, radiation, or friction. The data sourcefor this indicator was the Florida Agency for HealthCare Administration (AHCA) hospital dischargedataset. Hospitalizations were considered work-related if workers compensation was listed as theprincipal payer. Only cases who were 16 years ofage or older were included. Burns were identified byICD-9 codes 940 through 949.
The results of this indicator are likely to be anunderestimate of the true burden of work-relatedburns. A limitation of this indicator is its relianceon payor source (workers compensation) todetermine work-relatedness. A large proportion ofindividuals that are potentially eligible for workerscompensation do not file and are thus not capturedby this indicator.3,4,5
Additionally not all employed persons arecovered by state workers compensation. Federalworkers and self-employed persons are not covered.Also, employers of small farms and small non-construction industry businesses are not requiredto carry workers compensation coverage. See thefollowing link for Florida specific information onworkers compensation (http://www.myfloridacfo.com/wc/employer/coverage.html).
RESULTS Table 5 shows the number of work-related burn hospitalizations that occurred 2000–2007. On average, 172 workers in Florida werehospitalized each year for serious burns. Thenumber of burns per year ranged from 149 in 2007to 216 in 2000.
Figure 5 shows the hospitalization rate forburns per 100,000 employed persons. The rate ofhospitalizations for burns ranged from 1.7–3.0 per100,000 employed persons. Although Florida had ahigher overall work-related hospitalization ratethan the national average (Figure 2), this was notthe case for work-related burns. Florida’s work-related burn hospitalizations were below thenational average and showed a decreasing trend.
Ind
icato
r 6
� Florida/ U.S.
0.0
1.0
2.0
3.0
4.0
5.0
6.0
7.0
2000 2001 2002 2003 2004 2005 2006 2007
Ho
spit
aliz
atio
ns p
er 1
00,0
00 e
mp
loye
d p
erso
ns
3.0
2.12.3
2.0 2.0 1.91.7
2.5
2000 2001 2002 2003 2004 2005 2006 2007
Work-related burnhospitalizations 216 186 157 175 161 167 167 149
11
Table 5. Number ofHospitalizations forWork-Related Burns,Ages 16 Years andOlder, Florida,2000–2007
Figure 5. Number ofHospitalizations forWork-Related Burns,Ages 16 Years andOlder, Florida,2000–2007
Data Source: Number of hospitalizations = AHCA hospital discharge data. Employment statistics used to calculate rates = Bureau of LaborStatistics’ Current Population Survey.
Hospitalizations for Work-related Burns
Work-related burns can becaused by dry heat (fire), moistheat (steam), electricity,chemicals, radiation, or friction
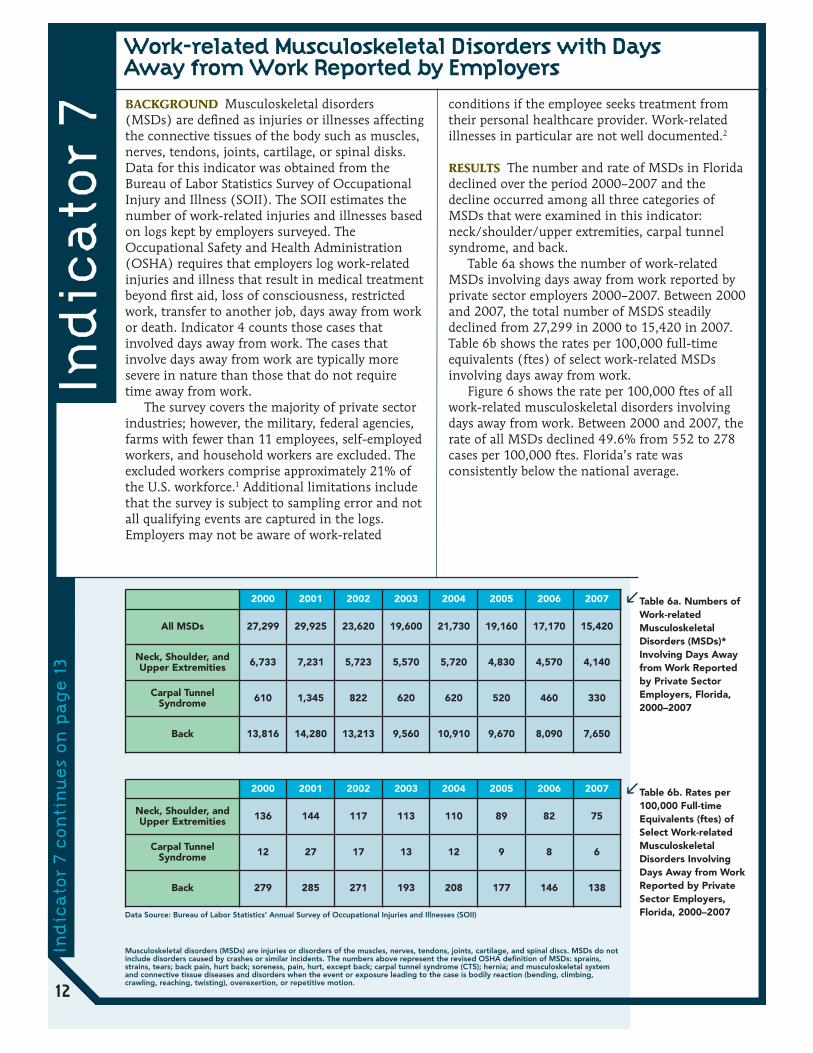
BACKGROUND Musculoskeletal disorders(MSDs) are defined as injuries or illnesses affectingthe connective tissues of the body such as muscles,nerves, tendons, joints, cartilage, or spinal disks.Data for this indicator was obtained from theBureau of Labor Statistics Survey of OccupationalInjury and Illness (SOII). The SOII estimates thenumber of work-related injuries and illnesses basedon logs kept by employers surveyed. TheOccupational Safety and Health Administration(OSHA) requires that employers log work-relatedinjuries and illness that result in medical treatmentbeyond first aid, loss of consciousness, restrictedwork, transfer to another job, days away from workor death. Indicator 4 counts those cases thatinvolved days away from work. The cases thatinvolve days away from work are typically moresevere in nature than those that do not requiretime away from work.
The survey covers the majority of private sectorindustries; however, the military, federal agencies,farms with fewer than 11 employees, self-employedworkers, and household workers are excluded. Theexcluded workers comprise approximately 21% ofthe U.S. workforce.1 Additional limitations includethat the survey is subject to sampling error and notall qualifying events are captured in the logs.Employers may not be aware of work-related
conditions if the employee seeks treatment fromtheir personal healthcare provider. Work-relatedillnesses in particular are not well documented.2
RESULTS The number and rate of MSDs in Floridadeclined over the period 2000–2007 and thedecline occurred among all three categories ofMSDs that were examined in this indicator:neck/shoulder/upper extremities, carpal tunnelsyndrome, and back.
Table 6a shows the number of work-relatedMSDs involving days away from work reported byprivate sector employers 2000–2007. Between 2000and 2007, the total number of MSDS steadilydeclined from 27,299 in 2000 to 15,420 in 2007.Table 6b shows the rates per 100,000 full-timeequivalents (ftes) of select work-related MSDsinvolving days away from work.
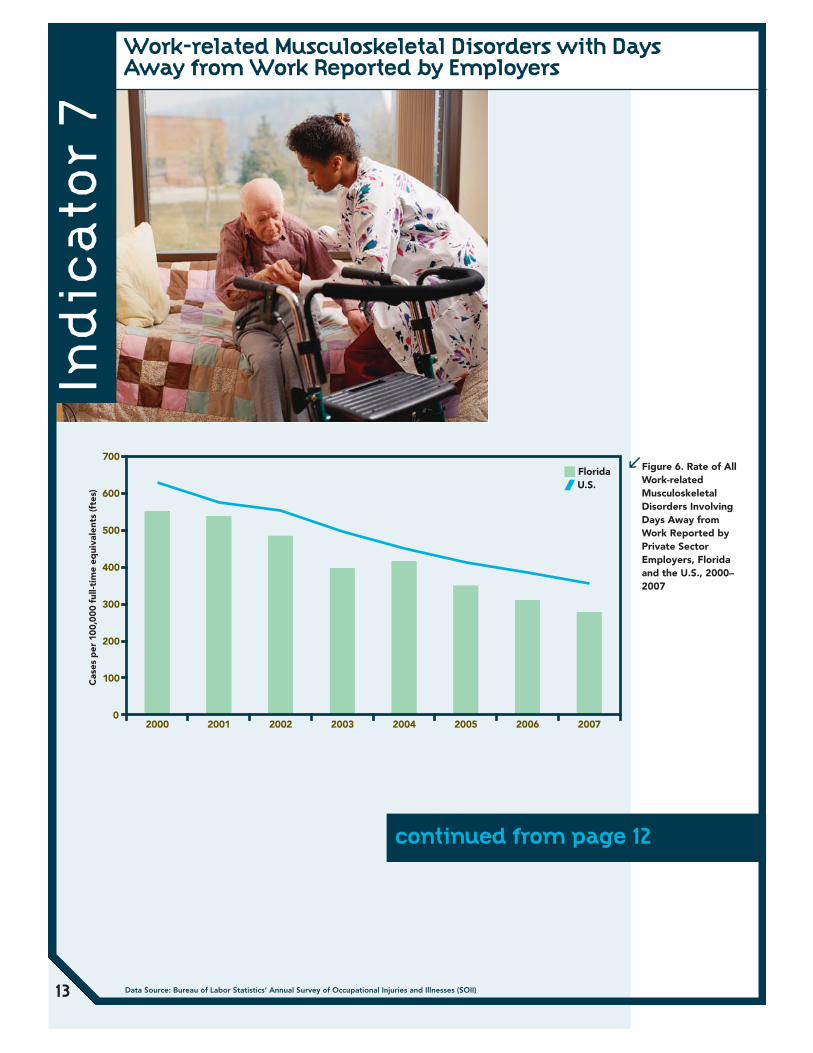
Figure 6 shows the rate per 100,000 ftes of allwork-related musculoskeletal disorders involvingdays away from work. Between 2000 and 2007, therate of all MSDs declined 49.6% from 552 to 278cases per 100,000 ftes. Florida’s rate wasconsistently below the national average.
Ind
icato
r 7
2000 2001 2002 2003 2004 2005 2006 2007
All MSDs 27,299 29,925 23,620 19,600 21,730 19,160 17,170 15,420
Neck, Shoulder, andUpper Extremities 6,733 7,231 5,723 5,570 5,720 4,830 4,570 4,140
Carpal TunnelSyndrome 610 1,345 822 620 620 520 460 330
Back 13,816 14,280 13,213 9,560 10,910 9,670 8,090 7,650
2000 2001 2002 2003 2004 2005 2006 2007
Neck, Shoulder, andUpper Extremities 136 144 117 113 110 89 82 75
Carpal TunnelSyndrome 12 27 17 13 12 9 8 6
Back 279 285 271 193 208 177 146 138
12
Table 6a. Numbers ofWork-relatedMusculoskeletalDisorders (MSDs)*Involving Days Awayfrom Work Reportedby Private SectorEmployers, Florida,2000–2007
Table 6b. Rates per100,000 Full-timeEquivalents (ftes) ofSelect Work-relatedMusculoskeletalDisorders InvolvingDays Away from WorkReported by PrivateSector Employers,Florida, 2000–2007Data Source: Bureau of Labor Statistics’ Annual Survey of Occupational Injuries and Illnesses (SOII)
Work-related Musculoskeletal Disorders with DaysAway from Work Reported by Employers
Ind
icato
r 7
con
tin
ues
on
pag
e 13
Musculoskeletal disorders (MSDs) are injuries or disorders of the muscles, nerves, tendons, joints, cartilage, and spinal discs. MSDs do notinclude disorders caused by crashes or similar incidents. The numbers above represent the revised OSHA definition of MSDs: sprains,strains, tears; back pain, hurt back; soreness, pain, hurt, except back; carpal tunnel syndrome (CTS); hernia; and musculoskeletal systemand connective tissue diseases and disorders when the event or exposure leading to the case is bodily reaction (bending, climbing,crawling, reaching, twisting), overexertion, or repetitive motion.
Ind
icato
r 7
� Florida/ U.S.
0
100
200
300
400
500
600
700
2000 2001 2002 2003 2004 2005 2006 2007
Cas
es p
er 1
00,0
00 f
ull-t
ime
equi
vale
nts
(fte
s)
13
Figure 6. Rate of AllWork-relatedMusculoskeletalDisorders InvolvingDays Away fromWork Reported byPrivate SectorEmployers, Floridaand the U.S., 2000–2007
Data Source: Bureau of Labor Statistics’ Annual Survey of Occupational Injuries and Illnesses (SOII)
Work-related Musculoskeletal Disorders with DaysAway from Work Reported by Employers
continued from page 12

AT THE TIME OF THIS REPORT, STATE WORKERS COMPENSATION CLAIMS DATAWERE NOT AVAILABLE.
Ind
icato
r 8
14
State Workers’ Compensation Claims for CarpalTunnel Syndrome with Lost Work-Time

BACKGROUND Pneumoconioses are a group ofnon-malignant lung diseases caused by inhalationof mineral dusts. Some of these dusts include silica,coal, asbestos, talc, aluminum, bauxite, andgraphite. The dust exposure is usuallyoccupationally related and generally develops fromcumulative exposure over a long time period. Dueto the long latency, most cases are diagnosed inolder individuals. Florida is a popular retirementstate and many of the cases that are diagnosed inFlorida may have been exposed decades earlierwhile working in other states. In particular, coalmining is not present in Florida so it is unlikelythat the cases of coal workers’ pneumoconiosiswere acquired in state.
The data source for this indicator was theFlorida Agency for Health Care Administration(AHCA) hospital discharge dataset.Hospitalizations were considered work-related ifworkers compensation was listed as the principalpayer. Only cases who were 15 years of age or olderwere included. Pneumoconioses were identified byICD-9 codes 500 through 505. The primarypneumoconioses are coal workers’ pneumoconiosis(black lung disease), asbestosis, and silicosis. Anindividual could be diagnosed with more than onetype of pneumoconiosis.
RESULTS Table 7a shows the number ofhospitalizations from or with pneumoconiosis. Thetotal number of pneumoconiosis cases has rangedfrom 1,856 in 2004 to a high of 2,518 in 2006.Asbestosis was the most common type ofpneumoconiosis in Florida requiringhospitalization.
Table 7b shows the age-standardized rates ofhospitalizations per million residents from or withselect types of pneumoconiosis. Coal workerspneumoconiosis and silicosis hospitalizations wererare, on average 17.5 and 3.9 millionhospitalizations per millions residents, respectively.
Figure 7 shows the age-standardized rate ofhospitalizations from or with total pneumoconiosisand asbestosis. The average hospitalization rate fortotal pneumoconiosis was 120.5 per millionresidents; the average hospitalizations rate forasbestosis was 97.8 per million residents. In 2006and 2007, Florida’s rates for both totalpneumoconiosis and asbestosis greatly exceededthe national rate. It is difficult to assess thepatterns of Florida’s pneumoconiosis rates giventhat it is a popular retirement destination.
Ind
icato
r 9
2000 2001 2002 2003 2004 2005 2006 2007
Total pneumoconiosis 2,051 2,148 2,284 2,119 1,856 2,068 2,518 2,209
Coal workers’pneumoconiosis 406 396 455 281 231 263 228 161
Asbestosis 1,564 1,625 1,739 1,748 1,553 1,718 2,196 1,965
Silicosis 63 74 65 56 54 71 80 63
Other and unspecifiedpneumoconiosis 32 57 37 38 31 25 30 30
15
Table 7a. Numberof Hospitalizationsfrom or withPneumoconiosis,Ages 15 Years andOlder, Florida,2000–2007
Table 7b. Age-standardized Rates ofHospitalizations perMillion Residents fromor with Select Typesof Pneumoconiosis,Ages 15 Years andOlder, Florida,2000–2007
Data Source: Number of hospitalizations for Florida = ACHA hospital discharge data. Number of hospitalization for US = National HospitalDischarge Survey. Employment statistics used to calculate rates = Bureau of Labor Statistics’ Current Population Survey
Hospitalizations from or with Pneumoconiosis
2000 2001 2002 2003 2004 2005 2006 2007
Coal workers’pneumoconiosis
FL 24.8 24.3 27.1 16.1 13.0 14.1 11.9 8.4
U.S. 44.9 28.0 40.1 30.3 24.6 39.0 15.4 8.6
SilicosisFL 4.0 4.5 3.9 3.4 3.2 4.1 4.5 3.7
U.S. 5.2 1.3 8.2 4.1 5.2 3.1 4.1 2.5
Other & unspecifiedpneumoconiosis
FL 2.0 3.5 2.3 2.2 1.8 1.5 1.6 1.6
U.S. 4.4 3.2 0.6 1.9 0.9 7.4 5.7 5.9
Ind
icato
r 9
con
tin
ues
on
pag
e 16

� FL—Total pneumoconiosis � FL—Asbestosis/ U.S.—Total pneumoconiosis/ U.S.—Asbestosis
123.5 126.0132.8
120.0
103.6111.5
131.8
114.6
101.5
114.7
92.386.3
100.295.293.6
0.0
20.0
40.0
60.0
80.0
100.0
120.0
140.0
160.0
2000 2001 2002 2003 2004 2005 2006 2007
Ho
spit
aliz
atio
ns p
er 1
,000
,000
res
iden
ts
98.5
Figure 7. Age-Standardized Rate ofHospitalizations fromor with TotalPneumoconiosis andAsbestosis, Ages 15Years and Older,Florida and the U.S,2000–2007
Ind
icato
r 9
16Data Source: Number of hospitalizations = AHCA hospital discharge data. Employment statistics used to calculate rates = Bureau of LaborStatistics’ Current Population Survey.
Hospitalizations from or with Pneumoconiosis
continued from page 15
BACKGROUND Pneumoconioses are a group ofnon-malignant lung diseases caused by inhalationof mineral dusts. Some of these dusts include silica,coal, asbestos, talc, aluminum, bauxite, andgraphite. The dust exposure is usuallyoccupationally related and generally develops fromcumulative exposure over a long time period. Dueto the long latency, most cases are diagnosed inolder individuals. Florida is a popular retirementstate and many of the cases that are diagnosed inFlorida may have been exposed decades earlierwhile working in other states. In particular, coalmining is not present in Florida so it is unlikelythat the cases of coal workers’ pneumoconiosiswere acquired in state.
Death certificate data was obtained fromFlorida Vital Records. Pneumoconiosis wasidentified as the underlying or contributing causeof death by ICD-10 codes J60–J66. The primarypneumoconioses are coal workers’ pneumoconiosis(black lung disease), asbestosis, and silicosis. Anindividual could be diagnosed with more than onetype of pneumoconiosis.
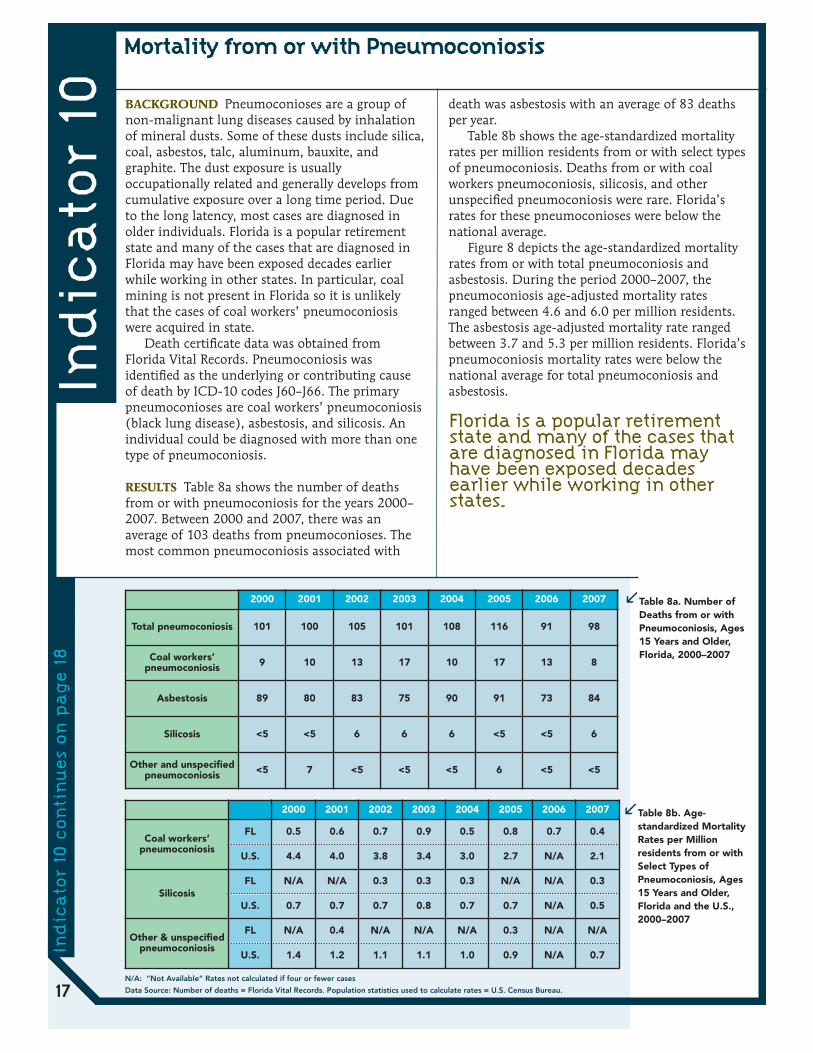
RESULTS Table 8a shows the number of deathsfrom or with pneumoconiosis for the years 2000–2007. Between 2000 and 2007, there was anaverage of 103 deaths from pneumoconioses. Themost common pneumoconiosis associated with
death was asbestosis with an average of 83 deathsper year.
Table 8b shows the age-standardized mortalityrates per million residents from or with select typesof pneumoconiosis. Deaths from or with coalworkers pneumoconiosis, silicosis, and otherunspecified pneumoconiosis were rare. Florida’srates for these pneumoconioses were below thenational average.
Figure 8 depicts the age-standardized mortalityrates from or with total pneumoconiosis andasbestosis. During the period 2000–2007, thepneumoconiosis age-adjusted mortality ratesranged between 4.6 and 6.0 per million residents.The asbestosis age-adjusted mortality rate rangedbetween 3.7 and 5.3 per million residents. Florida’spneumoconiosis mortality rates were below thenational average for total pneumoconiosis andasbestosis.In
dic
ato
r 10
N/A: “Not Available” Rates not calculated if four or fewer cases
Data Source: Number of deaths = Florida Vital Records. Population statistics used to calculate rates = U.S. Census Bureau.
Mortality from or with Pneumoconiosis
Florida is a popular retirementstate and many of the cases thatare diagnosed in Florida mayhave been exposed decadesearlier while working in otherstates.
2000 2001 2002 2003 2004 2005 2006 2007
Total pneumoconiosis 101 100 105 101 108 116 91 98
Coal workers’pneumoconiosis 9 10 13 17 10 17 13 8
Asbestosis 89 80 83 75 90 91 73 84
Silicosis <5 <5 6 6 6 <5 <5 6
Other and unspecifiedpneumoconiosis <5 7 <5 <5 <5 6 <5 <5
Table 8a. Number ofDeaths from or withPneumoconiosis, Ages15 Years and Older,Florida, 2000–2007
Table 8b. Age-standardized MortalityRates per Millionresidents from or withSelect Types ofPneumoconiosis, Ages15 Years and Older,Florida and the U.S.,2000–2007
2000 2001 2002 2003 2004 2005 2006 2007
Coal workers’pneumoconiosis
FL 0.5 0.6 0.7 0.9 0.5 0.8 0.7 0.4
U.S. 4.4 4.0 3.8 3.4 3.0 2.7 N/A 2.1
SilicosisFL N/A N/A 0.3 0.3 0.3 N/A N/A 0.3
U.S. 0.7 0.7 0.7 0.8 0.7 0.7 N/A 0.5
Other & unspecifiedpneumoconiosis
FL N/A 0.4 N/A N/A N/A 0.3 N/A N/A
U.S. 1.4 1.2 1.1 1.1 1.0 0.9 N/A 0.7
17
Ind
icato
r 10
con
tin
ues
on
pag
e 18

5.75.34.6 4.7
4.1
5.0 4.8
3.74.3
5.9 5.66.0 6.0
4.6 5.0
6.0
0.0
2.0
4.0
6.0
8.0
10.0
12.0
14.0
2000 2001 2002 2003 2004 2005 2006 2007
Ho
spit
aliz
atio
ns p
er 1
,000
,000
res
iden
ts
� FL—Total pneumoconiosis � FL—Asbestosis/ U.S.—Total pneumoconiosis/ U.S.—Asbestosis
Figure 8. Age-StandardizedMortality Rates fromor with TotalPneumoconiosis andAsbestosis, Ages 15Years and Older,Florida and the U.S.,2000–2007
Ind
icato
r 10
continued from page 17
18 Data Source: Number of deaths = Florida Vital Records. Population statistics used to calculate rates = U.S. Census Bureau.
Mortality from or with Pneumoconiosis

BACKGROUND A pesticide is a substance ormixture of substances used to control undesiredinsects, plants, animals, or fungi. Human exposureto certain pesticides can cause adverse healtheffects depending on the type of chemical, theexposure route, and the amount. Data for thisindicator are obtained from the AmericanAssociation of Poison Control Centers, and reflectthe number of calls that go to these centers inwhich callers report work related pesticide exposureand acute signs and symptoms indicative ofpesticide poisoning. Calls are typically taken fromindividuals, physicians, EMS responders, emergencydepartments and other health care facilities It isunlikely that these numbers reflect the truenumber of work-related pesticide poisonings inFlorida because only a portion of pesticidepoisonings are captured through calls to the poisoncontrol centers.
RESULTS Table 9 shows the number of work-related pesticide poisoning for the period 2000–2007. On average 153 work-related, pesticide-associated illnesses and injuries were reportedannually.
Figure 9 shows the rate of work-related pesticidepoisonings. The rate has ranged from 1.4–2.0 casesper 100,000 employed persons.
Ind
icato
r 11
2000 2001 2002 2003 2004 2005 2006 2007
� Florida/ U.S.2.0 2.1 2.1
2.02.1 2.1
1.6
1.4
0.0
0.5
1.0
1.5
2.0
2.5
Cas
es p
er 1
00,0
00 e
mp
loye
d p
erso
ns
2000 2001 2002 2003 2004 2005 2006 2007
Cases of pesticideassociated poisonings 147 155 163 154 166 172 138 125
19
Table 9. Number ofWork-relatedPesticide-AssociatedPoisonings Reportedby Florida PoisonInformation Centers,2000–2007
Figure 9. Rate ofWork-RelatedPesticide-AssociatedPoisonings, Floridaand the U.S., 2000–2007
Data Source: Numbers of pesticide-associated illness and injury = American Association of Poison Control Centers. Employment statisticsused to calculate rates = Bureau of Labor Statistics’ Current Population Survey.
Acute Work-related Pesticide-associated Illness andInjury Reported to Poison Control Centers

BACKGROUND Malignant mesothelioma is a fatalcancer that is caused by exposure to asbestos orrelated fibers and 90% of cases are directlyattributable to asbestos exposure. Mesotheliomahas a long latency period of 20–40 years and isprimarily found in the mesothelial tissue lining thepleura (lung cavity), the peritoneum (abdominalcavity), the pericardium (heart sac), and the tunicavaginalis (testis sac).
Asbestos as a material is extremely resistant tofire, heat and chemical damage and was usedheavily from the 1940s to the 1970s in a myriad ofproducts such as electrical and building insulation,drywall, floor tiles, roofing materials, popcornceilings, brake pads, and shoes and as fireproofingmaterial. Beginning in the 1970s, regulations tolimit or regulate asbestos in the environment wereenacted. Asbestos use has since declined butworkers are still occupationally exposed today, ascommercial use of asbestos in the United States isonly partially banned and remodeling and/orremoval of asbestos containing material arecommon.
Data for indicator 10 were obtained from theFlorida Cancer Data System, the statewidecomprehensive cancer registry.
RESULTS Table 10 shows the number of cases ofmalignant mesothelioma that occurred annuallyfor the years 2000–2007. An average of 236 casesof malignant mesothelioma was reported each year.
Figure 10 shows the age-standardized rates ofmalignant mesothelioma. The rate ofmesothelioma in Florida ranged from 11.1–15.4cases per million residents. The rates were similarto the U.S. average.
Ind
icato
r 12
14.7 14.3 14.513.9
11.112.2
13.4
15.4
0.0
2.0
4.0
6.0
8.0
10.0
12.0
14.0
16.0
18.0
2000 2001 2002 2003 2004 2005 2006 2007
Cas
es p
er 1
,000
,000
res
iden
ts
� Florida/ U.S.
2000 2001 2002 2003 2004 2005 2006 2007
Mesothelioma cases 248 242 250 246 199 226 248 230
20
Table 10. Number ofCases of MalignantMesothelioma, Ages15 Years and Older,Florida, 2000–2007
Figure 10. Age-StandardizedIncidence Rate ofMalignantMesothelioma, Ages15 Years and Older,Florida and the U.S.,2000–2007
Data Source: Numbers of mesothelioma cases = Florida Cancer Data System. Population statistics used to calculate rates = U.S. CensusBureau.
Incidence of Malignant Mesothelioma
Asbestos as a material isextremely resistant to fire, heatand chemical damage and wasused heavily from the 1940s tothe 1970s in a myriad of productssuch as electrical and buildinginsulation, drywall, floor tiles,roofing materials, popcornceilings, brake pads, and shoesand as fireproofing material.
BACKGROUND Adult blood lead is consideredelevated at 25μg/dL though there is evidence thattoxicity may occur at levels as low as 5μg/dL. 6,7,8
The majority of elevated blood lead levels amongadults are occupationally related. Occupationalexposures include manufacturing or recycling leadcontaining products such as batteries, bullets,metals and electrical components, handling leadpipes (plumbers and pipe fitters), paint, andammunition exposure (police officers, gunsmiths,and firing range instructors). For a more completelist, see http://www.cdc.gov/niosh/topics/lead/WorkerInfo.html.
Non-occupational exposures may occurthrough activities such as remodeling, renovating,painting, shooting and reloading firearms, andcasting lead bullets or fishing weights .
Workers in the above occupations may bringhome lead dust on their clothing and potentiallyexpose household members. Lead is particularlydangerous to children, which experience adversehealth effects at lower blood lead levels thanadults. Negative health effects of lead exposuremay include nervous system dysfunction, kidneydamage, hypertension, anemia, decreased fertility,and pregnancy issues such as miscarriage andpremature birth.
Data were obtained from the Florida AdultBlood Lead Epidemiology Surveillance (ABLES)
program. Incident cases (new cases) are defined ascases with an elevated blood lead level reported inthe calendar year, but not reported in theimmediately preceding year with an elevated bloodlead level (may appear in earlier years with anelevated blood lead level). Prevalent cases (newplus existing cases) are defined as the total numberof cases reported that year. All cases of elevatedblood lead are included regardless of whether anoccupational exposure was identified.
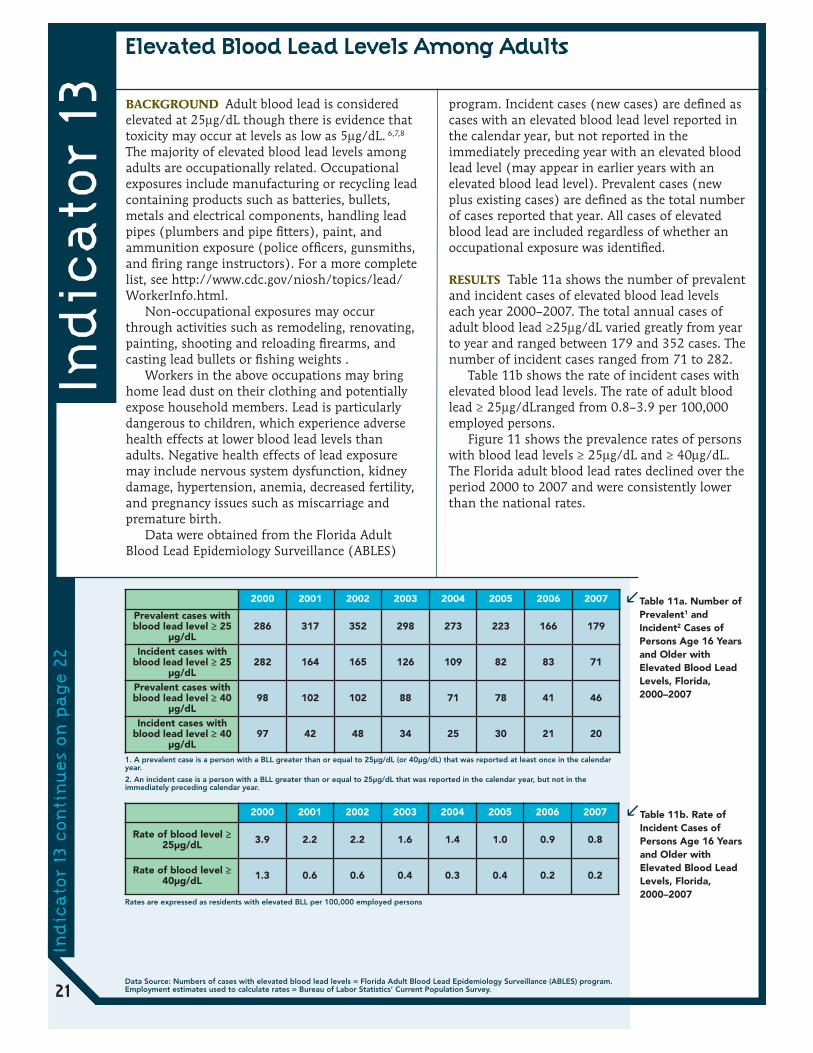
RESULTS Table 11a shows the number of prevalentand incident cases of elevated blood lead levelseach year 2000–2007. The total annual cases ofadult blood lead ≥25μg/dL varied greatly from yearto year and ranged between 179 and 352 cases. Thenumber of incident cases ranged from 71 to 282.
Table 11b shows the rate of incident cases withelevated blood lead levels. The rate of adult bloodlead ≥ 25μg/dLranged from 0.8–3.9 per 100,000employed persons.
Figure 11 shows the prevalence rates of personswith blood lead levels ≥ 25μg/dL and ≥ 40μg/dL.The Florida adult blood lead rates declined over theperiod 2000 to 2007 and were consistently lowerthan the national rates.
Ind
icato
r 13
Elevated Blood Lead Levels Among Adults
2000 2001 2002 2003 2004 2005 2006 2007
Prevalent cases withblood lead level ≥ 25
μg/dL286 317 352 298 273 223 166 179
Incident cases withblood lead level ≥ 25
μg/dL282 164 165 126 109 82 83 71
Prevalent cases withblood lead level ≥ 40
μg/dL98 102 102 88 71 78 41 46
Incident cases withblood lead level ≥ 40
μg/dL97 42 48 34 25 30 21 20
2000 2001 2002 2003 2004 2005 2006 2007
Rate of blood level ≥25μg/dL 3.9 2.2 2.2 1.6 1.4 1.0 0.9 0.8
Rate of blood level ≥40μg/dL 1.3 0.6 0.6 0.4 0.3 0.4 0.2 0.2
Table 11a. Number ofPrevalent1 andIncident2 Cases ofPersons Age 16 Yearsand Older withElevated Blood LeadLevels, Florida,2000–2007
Table 11b. Rate ofIncident Cases ofPersons Age 16 Yearsand Older withElevated Blood LeadLevels, Florida,2000–2007
21Data Source: Numbers of cases with elevated blood lead levels = Florida Adult Blood Lead Epidemiology Surveillance (ABLES) program.Employment estimates used to calculate rates = Bureau of Labor Statistics’ Current Population Survey.
1. A prevalent case is a person with a BLL greater than or equal to 25μg/dL (or 40μg/dL) that was reported at least once in the calendaryear.
2. An incident case is a person with a BLL greater than or equal to 25μg/dL that was reported in the calendar year, but not in theimmediately preceding calendar year.
Rates are expressed as residents with elevated BLL per 100,000 employed persons
Ind
icato
r 13
con
tin
ues
on
pag
e 22

Ind
icato
r 13
� FL≥25 μg/dl � FL≥40 μg/dl/ U.S.≥25 μg/dl / U.S.≥40 μg/dl
4.04.3 4.6
3.83.4
2.7
1.9 2.01.4 1.31.4
0.50.5
0.90.91.12.0
4.0
6.0
8.0
10.0
12.0
14.0
2000 2001 2002 2003 2004 2005 2006 2007
Cas
es p
er 1
00,0
00 e
mp
loye
d p
erso
ns
0.0
22
Figure 11. PrevalenceRates of Persons withBlood Lead Levels ≥25 μg/dL and ≥ 40μg/dL, Ages 16 Yearsand Older, Florida andthe U.S., 2000–2007
Elevated Blood Lead Levels Among Adults
Technical Notes: Florida rates included all cases of adult elevated BLL in the numerator; denominators are limited to employed persons.This may result in an overestimation of rates (cases per 100,000 employed persons) if some cases were the result of non-occupationalexposures.
U.S. rates were based on data published by the ABLES program.
Data Source: Numbers of cases with elevated blood lead levels = Florida Adult Blood Lead Epidemiology Surveillance (ABLES) program.Employment estimates used to calculate rates = Bureau of Labor Statistics’ Current Population Survey.
continued from page 21
BACKGROUND have an above average risk ofbecoming injured or ill on the job. High-riskindustries as defined by this indicator have aninjury and illness rate that is at least double theoverall national occupational morbidity rateestimated in the Survey of Occupational Illnessesand Injuries (SOII). For example, in 2003, the U.S.rate of non-fatal work-related injuries and illnesswas 5.0 per 100 full-time equivalents (ftes)therefore industries with 10 cases of occupationalmorbidity per 100 ftes were considered high-risk.In 2003, 37 industries met that definition. Thedefinition was created by the indicator workgroupcomprised of representatives from federal and stateagencies as well as the Council of State andTerritorial Epidemiologist (CSTE).
The list of high-risk industries differs for theperiod 2000–2002 and 2003–2007 as nationalcriteria and definitions were changed, therefore,data between these two periods are not comparable.High-risk industries for the period 2000–2002 weredefined using the Standard Industrial Classification(SIC) coding system. The coding system waschanged in 2003 to the North American IndustryClassification System (NAICS). The list of high-riskindustries is updated every 5 years. Data on thenumber of workers employed in each industry wereobtained from the Census Bureau County BusinessPatterns.
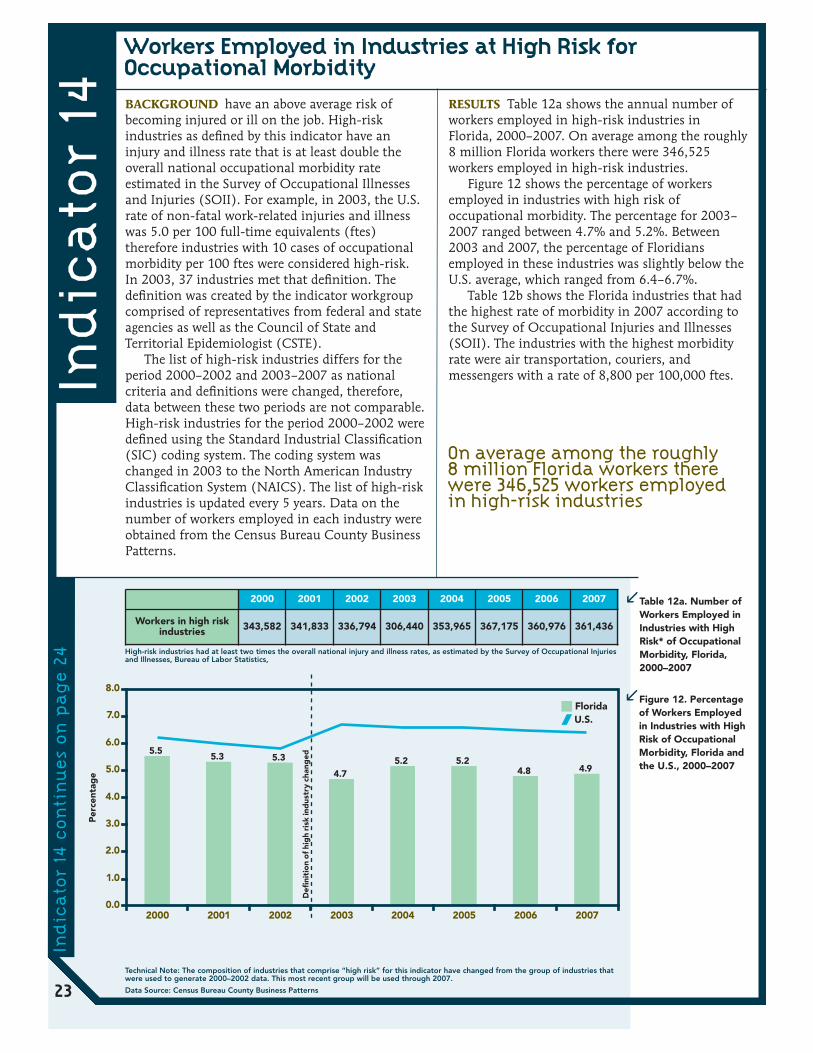
RESULTS Table 12a shows the annual number ofworkers employed in high-risk industries inFlorida, 2000–2007. On average among the roughly8 million Florida workers there were 346,525workers employed in high-risk industries.
Figure 12 shows the percentage of workersemployed in industries with high risk ofoccupational morbidity. The percentage for 2003–2007 ranged between 4.7% and 5.2%. Between2003 and 2007, the percentage of Floridiansemployed in these industries was slightly below theU.S. average, which ranged from 6.4–6.7%.
Table 12b shows the Florida industries that hadthe highest rate of morbidity in 2007 according tothe Survey of Occupational Injuries and Illnesses(SOII). The industries with the highest morbidityrate were air transportation, couriers, andmessengers with a rate of 8,800 per 100,000 ftes.In
dic
ato
r 14
2000 2001 2002 2003 2004 2005 2006 2007
Workers in high riskindustries 343,582 341,833 336,794 306,440 353,965 367,175 360,976 361,436
23
Table 12a. Number ofWorkers Employed inIndustries with HighRisk* of OccupationalMorbidity, Florida,2000–2007
Workers Employed in Industries at High Risk forOccupational Morbidity
Ind
icato
r 14
con
tin
ues
on
pag
e 24
� Florida/ U.S.
5.55.3 5.3
4.75.2 5.2
4.8 4.9
0.0
1.0
2.0
3.0
4.0
5.0
6.0
7.0
8.0
2000 2001 2002 2003 2004 2005 2006 2007
Per
cent
age
Defi
niti
on
of
hig
h ri
sk in
dus
try
chan
ged
Figure 12. Percentageof Workers Employedin Industries with HighRisk of OccupationalMorbidity, Florida andthe U.S., 2000–2007
High-risk industries had at least two times the overall national injury and illness rates, as estimated by the Survey of Occupational Injuriesand Illnesses, Bureau of Labor Statistics,
Technical Note: The composition of industries that comprise “high risk” for this indicator have changed from the group of industries thatwere used to generate 2000–2002 data. This most recent group will be used through 2007.
Data Source: Census Bureau County Business Patterns
On average among the roughly8 million Florida workers therewere 346,525 workers employedin high-risk industries

Ind
icato
r 14
24 Data Source: Bureau of Labor Statistics’ Annual Survey of Occupational Injuries and Illnesses (SOII)
Workers Employed in Industries at High Risk forOccupational Morbidity
NAICS Code IndustryRate per 100,000
Full-timeEquivalents (ftes)
48100 Air transportation 8,800
49200 Couriers and messengers 8,800
62300 Nursing and residential care facilities 8,200
49300 Warehousing and storage 8,100
33200 Fabricated metal product manufacturing 7,700
48500 Transit and ground passenger transportation 7,500
62200 Hospitals 7,400
31200 Beverage and tobacco product manufacturing 6,900
32600 Plastics and rubber products manufacturing 6,200
45200 General merchandise stores 6,100
Table 12b. Top TenIndustries withHighest Morbidity,Florida, 2007
continued from page 23
BACKGROUND Occupations at high risk foroccupational morbidity are those occupationsidentified in national analyses in which workershave an above average risk of becoming injured orill on the job. High-risk occupations as defined bythis indicator have an injury and illness rate that isat least double the overall national occupationalmorbidity rate estimated in the Survey ofOccupational Illnesses and Injuries (SOII). Thedefinition of high risk was created by the indicatorworkgroup comprised of representatives fromfederal and state agencies as well as the Council ofState and Territorial Epidemiologist (CSTE).
The list of high-risk occupations differs for theperiod 2000–2002 and 2003–2007 as nationalcriteria and definitions were changed, therefore,data between these two periods are not comparable.High-risk occupations for the period 2000–2002were defined using the Census Occupation Codes(COC) coding system. The coding system waschanged in 2003 to the Standard OccupationalClassification (SOC). The list of high-riskoccupations is updated every 5 years. Data on thenumber of workers employed in each occupationwas obtained from the Bureau of Labor StatisticsCurrent Population Survey.
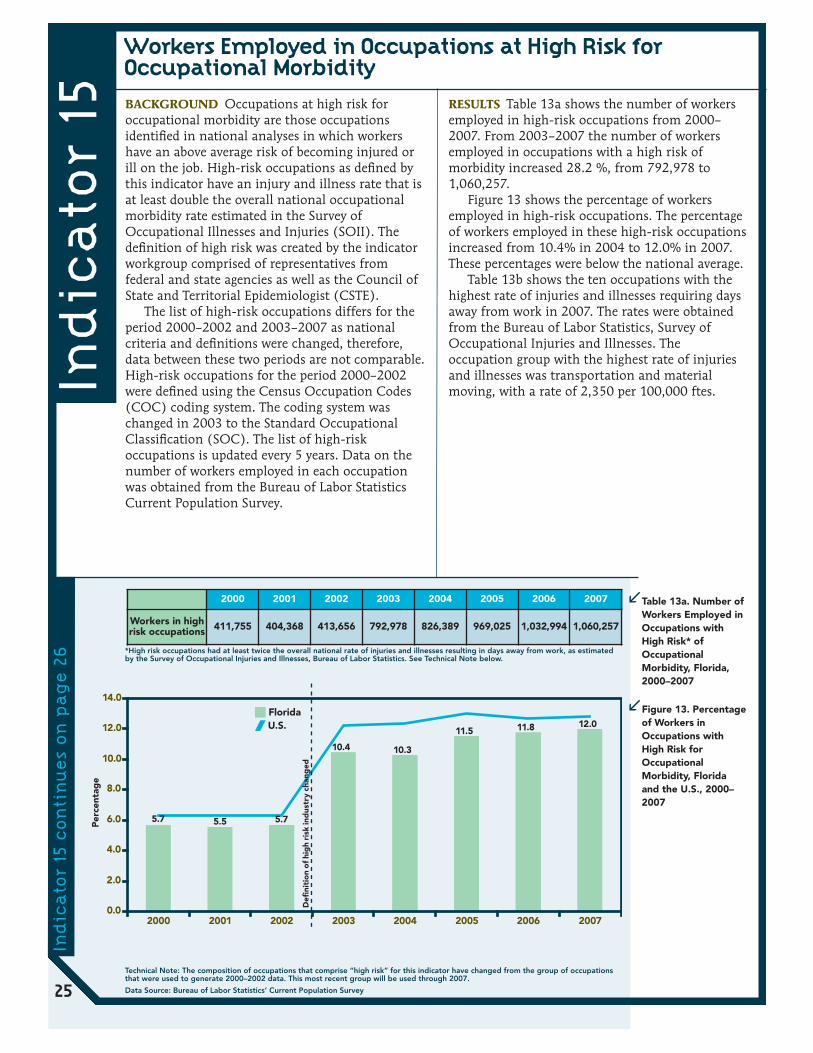
RESULTS Table 13a shows the number of workersemployed in high-risk occupations from 2000–2007. From 2003–2007 the number of workersemployed in occupations with a high risk ofmorbidity increased 28.2 %, from 792,978 to1,060,257.
Figure 13 shows the percentage of workersemployed in high-risk occupations. The percentageof workers employed in these high-risk occupationsincreased from 10.4% in 2004 to 12.0% in 2007.These percentages were below the national average.
Table 13b shows the ten occupations with thehighest rate of injuries and illnesses requiring daysaway from work in 2007. The rates were obtainedfrom the Bureau of Labor Statistics, Survey ofOccupational Injuries and Illnesses. Theoccupation group with the highest rate of injuriesand illnesses was transportation and materialmoving, with a rate of 2,350 per 100,000 ftes.In
dic
ato
r 15
2000 2001 2002 2003 2004 2005 2006 2007
Workers in highrisk occupations 411,755 404,368 413,656 792,978 826,389 969,025 1,032,994 1,060,257
25
Table 13a. Number ofWorkers Employed inOccupations withHigh Risk* ofOccupationalMorbidity, Florida,2000–2007
Workers Employed in Occupations at High Risk forOccupational Morbidity
Ind
icato
r 15
con
tin
ues
on
pag
e 26
� Florida/ U.S.
10.4 10.3
11.5 11.8 12.0
5.7 5.5 5.7
0.0
2.0
4.0
6.0
8.0
10.0
12.0
14.0
2000 2001 2002 2003 2004 2005 2006 2007
Per
cent
age
Defi
niti
on
of
hig
h ri
sk in
dus
try
chan
ged
Figure 13. Percentageof Workers inOccupations withHigh Risk forOccupationalMorbidity, Floridaand the U.S., 2000–2007
*High risk occupations had at least twice the overall national rate of injuries and illnesses resulting in days away from work, as estimatedby the Survey of Occupational Injuries and Illnesses, Bureau of Labor Statistics. See Technical Note below.
Technical Note: The composition of occupations that comprise “high risk” for this indicator have changed from the group of occupationsthat were used to generate 2000–2002 data. This most recent group will be used through 2007.
Data Source: Bureau of Labor Statistics’ Current Population Survey

Ind
icato
r 15
26 Data Source: Bureau of Labor Statistics’ Annual Survey of Occupational Injuries and Illnesses (SOII)
Workers Employed in Occupations at High Risk forOccupational Morbidity
Table 13b. Top TenOccupations with theHighest Rate ofInjuries and IllnessesRequiring Days AwayFrom Work, Florida,2007
SOC Occupation group Rate per 100,000FTE
53 Transportation and material moving 2,350
47 Construction and extraction 2,179
45 Farming, fishing, and forestry occupations 2,018
49 Installation, maintenance and repair 1,998
31 Healthcare support 1,687
51 Production 1,584
39 Personal care and service 1,512
37 Building and grounds cleaning and maintenance 1,476
21 Community and social services 1,084
11 Management occupations 1,003
continued from page 25

BACKGROUND Industries and occupations at highrisk for occupational mortality are those industriesand occupations identified in national analyses inwhich workers have an above average risk of beingkilled on the job. High-risk industries andoccupations as defined by this indicator have afatality rate that is at least double the overallnational occupational fatality rate estimated in theCensus of Fatal Occupational Injuries (CFOI). Thedefinition of high risk was created by the indicatorworkgroup comprised of representatives fromfederal and state agencies as well as the Council ofState and Territorial Epidemiologist (CSTE).
The list of high-risk industries and occupationsdiffers for the period 2000–2002 and 2003–2007 asnational criteria and definitions were changed,therefore, data between these two periods are notcomparable. High-risk industries for the period2000–2002 were defined using the StandardIndustrial Classification (SIC) coding system. Thecoding system was changed in 2003 to the NorthAmerican Industry Classification System (NAICS).High-risk occupations for the period 2000–2002were defined using the Census Occupation Codes(COC) coding system. The coding system waschanged in 2003 to the Standard OccupationalClassification (SOC). The list of high-riskoccupations is updated every 5 years. Data on thenumber of workers employed in each industry andoccupation were obtained from the Bureau of LaborStatistics Current Population Survey.
RESULTS Table 14a shows the number of workersemployed in industries and occupations at high riskof occupational mortality. From 2003–2007, thenumber of workers in high mortality risk industriesincreased 20.5% and the number of workers in highmortality risk occupations increased 25.6%.
Figure 14 shows the percentage of workersemployed in occupations and industries with highrisk of occupational mortality. Post 2003 thepercentage of workers in high-risk occupation andindustries was very close to the national average.
Table 14b shows the number of fatalities byindustry in Florida in 2007. Agriculture, forestry,fishing, and hunting had the highest rate offatalities, 37.7 per 100,000 persons employed inthat industry and 16 deaths. The industry with thehighest number of fatalities was construction, with80 deaths, rate of 9.0 per 100,000 personsemployed in that industry.
Table 14c shows the top 10 high fatalityoccupations in Florida in 2007. Miscellaneousagricultural workers had the highest fatality rate,49.6 per 100,000 persons employed that occupationand nine deaths. The occupation with the highestnumber of fatalities was Driver/Sales Workers andTruck Drivers with 44 deaths, 20.2 per 100,000persons employed in that occupation.
Ind
icato
r 16
� FL—High-risk occupations � FL—High-risk industries/ U.S.—High-risk occupations/ U.S.—High-risk industries
5.3 5.3 5.0
11.1 10.8 11.3 11.1 11.5
14.814.1 14.5
16.0 16.0 15.714.914.6
0.0
2.0
4.0
6.0
8.0
10.0
12.0
14.0
16.0
18.0
2000 2001 2002 2003 2004 2005 2006 2007
Per
cent
age
Defi
niti
on
of
hig
h ri
sk in
dus
try
chan
ged
2000 2001 2002 2003 2004 2005 2006 2007
Workers in highrisk occupations 386,489 383,918 363,977 841,834 866,745 946,904 975,863 1,014,195
Workers in highrisk industries 1,072,455 1,030,929 1,060,466 1,109,709 1,198,543 1,345,836 1,403,272 1,394,290
27
Table 14a. Number ofWorkers Employed inOccupations andIndustries with HighRisk* of OccupationalMortality, Florida,2000–2007
Figure 14. Percentageof Workers Employedin Occupations andIndustries with HighRisk of OccupationalMortality, Florida andthe U.S., 2000–2007
Workers Employed in Industries and Occupations atHigh Risk for Occupational Mortality
*High-risk industries and occupations had a fatality rate that was at least double the national fatality rate reported by the Census of FatalOccupational Injuries (CFOI), Bureau of Labor Statistics, 2003.
Ind
icato
r 16
con
tin
ues
on
pag
e 28
Technical Note: The composition of occupations that comprise “high risk” for this indicator have changed from the group of occupationsthat were used to generate 2000–2002 data. This most recent group will be used through 2007.
Data Source: Bureau of Labor Statistics’ Current Population Survey

Ind
icato
r 16 NAICS Industry Number Rate
11 Agriculture, forestry, fishing, and hunting 16 37.7
56 Administrative and waste services 64 12.6
23 Construction 80 9.0
NA Government 35 8.9
48–49 Transportation and warehousing 36 8.5
71 Arts, entertainment, and recreation 13 5.6
42 Wholesale trade 11 3.6
31–33 Manufacturing 17 3.4
44–45 Retail trade 34 3.1
12 Other services (excluding Publicadministration) 12 2.6
15 Accommodation and food services 15 2.2
8 Financial activities 8 1.0
54 Professional, scientific, and technicalservices 6 1.0
61–62 Education and health services 11 0.7
51 Information <5 N/A
22 Utilities <5 N/A
21 Mining <5 N/A
SOC Occupation Number Rate
452090 Miscellaneous Agricultural Workers 9 49.6
532010 Aircraft Pilots and Flight Engineers 5 34.3
472180 Roofers 9 26.4
472060 Construction Laborers 28 21.5
333050 Police Officers 15 20.6
533030 Driver/Sales Workers and Truck Drivers 44 20.2
472110 Electricians 11 20.1
373010 Grounds Maintenance Workers 21 18.2
472140 Painters and Paperhangers 6 10.9
372010 Building Cleaning Workers 11 9.7
28
Table 14b. Number ofFatalities by Industry,Florida, 2007
Table 14c. Top TenOccupations byFatality Rate, Florida,2007
Workers Employed in Industries and Occupations at HighRisk for Occupational Mortality
Rates are expressed as workers per 100,000 employed in the specific industry/occupation
N/A: “Not Available” rates not calculated if four or fewer cases
Data Source: Numbers of fatalities = Census of Fatal Occupational Injuries. Employment statistics used to calculate rates = Bureau of LaborStatistics’ Current Population Survey.
continued from page 27

BACKGROUND Occupational safety and healthprofessionals include occupational medicinephysicians, occupational health nurses, industrialhygienists, and safety professionals. An adequatenumber of safety and health professionals isimportant for workplace hazard identification andthe prevention and treatment of work-relatedinjuries. The number of occupational safety andhealth professionals was estimated from counts ofboard-certified professionals in each profession aswell as membership numbers from professionalorganizations. Data were obtained from the currentmembership rosters of cited organizations.
RESULTS Table 15a shows the estimated number ofoccupational safety and health professionals forthe period 2001 to 2007.
Table 15b shows the number of occupationalsafety and health professionals per 100,000employed persons. On average per 100,000employed persons, there was one occupationalmedicine physician, three occupational healthnurses, three industrial hygienists, and five safetyprofessionals that were board-certified. For alloccupational safety and health professionals therewas a lower rate of board-certified professionalsand members in professional organizations withinFlorida than the U.S. average, which is perhapsreflective of the south’s overall lower
manufacturing base and historical agrarianeconomy.
Ind
icato
r 17
29
Table 15a. Number ofOccupational Safetyand HealthProfessionals, Florida,2001–2007
Table 15b. Rate ofOccupational Safetyand HealthProfessionals per100,000 Employees,Florida, 2001–2007
Occupational Safety and Health Professionals
2001 2002 2003 2004 2005 2006 2007
Board-certified occupational medicine physicians 87 87 87 96 101 106 112ACOEM members 219 219 219 216 189 184 175
Board-certified occupational health nurses 229 229 229 257 265 295 255Member nurses of AAOHN 307 307 307 381 371 381 391
Board-certified industrial hygienists 205 205 205 214 218 211 209IH members of AIHA 394 394 394 386 388 370 290
Board-certified safety professionals 359 359 359 370 381 384 389Safety engineers who are members of ASSE 1,227 1,227 1,227 1,340 1,517 1,290 1,351
2001 2002 2003 2004 2005 2006 2007U.S.
Average2001–2007
Board-certified occupational medicine physicians 1.2 1.1 1.1 1.2 1.2 1.2 1.3 1.8ACOEM members 3.0 2.9 2.8 2.7 2.3 2.1 2.0 3.7
Board-certified occupational health nurses 3.1 3.0 3.0 3.2 3.2 3.4 2.9 4.6Member nurses of AAOHN 4.2 4.0 4.0 4.8 4.4 4.3 4.4 6.2
Board-certified industrial hygienists 2.8 2.7 2.6 2.7 2.6 2.4 2.4 4.8IH members of AIHA 5.4 5.2 5.1 4.8 4.6 4.2 3.3 7.6
Board-certified safety professionals 4.9 4.7 4.6 4.6 4.5 4.4 4.4 7.4Safety engineers who are members of ASSE 16.8 16.1 15.8 16.7 18.1 14.7 15.3 22.7
Technical Notes: Counts of safety and health professionals may include retired individuals and individuals who devote the majority of theirtime to research and have limited or no time for provision of actual preventive services.
An individual may practice part-time or even full-time in the field of occupational health and not be board-certified or a member of theorganization representing occupational health professionals.
The completeness and frequency of updating addresses varies by each organization. Members are often listed in a database by apreferred address, which may not be the address where they practice.
Other important occupational health specialties such as fire prevention, health physicists, occupational health psychologists, employee-assistance professionals, ergonomists, and health educators are not included.
Data Source: Numbers of safety and health professionals = Current membership rosters of cited organizations. Employment estimatesused to calculate rates = Bureau of Labor Statistics’ Current Population Survey
ACOEM: American College ofOccupational andEnvironmental Medicine
AAOHN: AmericanAssociation of OccupationalHealth Nurses Inc.
AIHA: American IndustrialHygienist Association
ASSE: American Society ofSafety Engineers

BACKGROUND The Occupational Safety andHealth Administration (OSHA) was established byCongress as part of the Occupational Safety andHealth Act of 1970. This act established a workersright to a safe workplace. OSHA’s activities includeworkplace safety and health standardsdevelopment, compliance assistance andenforcement.
The numbers of OSHA inspections and workerscovered by OSHA inspections were obtained fromthe OSHA Office of Statistics. The number ofestablishments and workforce estimates wereobtained from the Bureau of Labor StatisticsCovered Employers and Wages (ES 202).
RESULTS Table 16 shows the number ofestablishments under OSHA jurisdiction, thenumber of establishments inspected by OSHA andthe number of workers covered by inspections forthe years 2001 to 2007. The total number ofestablishments under OSHA jurisdiction increased33.2% from 2001 to 2007 (446,216 to 594,363).
Figure 16 shows the percentage ofestablishments inspected by OSHA and percentageof workers in establishments under OSHAjurisdiction whose work areas were inspected byOSHA. The percentage of these establishmentsinspected has remained steady at 0.4–0.5%. This islower than the national average (1.2 –1.3% ofestablishments inspected). The estimatedpercentage of all employees in establishmentsunder OSHA jurisdiction whose work areas wereinspected ranged from 0.7–0.9% in Florida. Thiswas consistently lower than the national averagepercentage of employees whose work areas wereinspected (3.0–3.5%).
Ind
icato
r 18
Per
cent
age
4.0
3.5
3.0
2.5
2.0
1.5
1.0
0.5
0.0
� FL—Estimated percentage of all establishments under OSHA jurisdiction inspected by OSHA� FL—Estimated percentage of all employees under OSHA whose work areas were inspected/ U.S.—Estimated percentage of all establishments under OSHA jurisdiction inspected by OSHA/ U.S.—Estimated percentage of all employees under OSHA whose work areas were inspected
2001 2002 2003 2004 2005 2006 2007
0.5
0.9
0.5
0.9
0.5
0.9
0.40.7
0.4
0.80.5
0.70.4
0.8
2001 2002 2003 2004 2005 2006 2007
Total number of establishments underFederal/State OSHA jurisdiction 446,216 467,022 486,562 515,580 549,781 574,033 594,363
Number of establishments inspected byFederal/State OSHA 2,015 2,516 2,203 2,045 2,363 3,050 2,387
Number of employees whose work areaswere inspected by Federal/State OSHA 54,932 53,646 54,172 45,163 52,016 49,982 55,660
30
Table 16. Number ofEstablishments underOSHA Jurisdiction,Number Inspected byOSHA, and Numberof Workers Coveredby Inspections,Florida, 2001–2007
Figure 16.Percentage ofEstablishments underOSHA JurisdictionInspected by OSHA,and Percentage ofWorkers inEstablishments underOSHA Jurisdictionwhose Work Areaswere Inspected byOSHA, Florida andthe U.S., 2001–2007
OSHA Enforcement Activities
Technical Notes: The calculation of the percentages for Figure 18 excluded agriculture/farms. It was necessary to make this exclusionbecause it is difficult to identify large farms (i.e., those with more than 10 employees and thus covered by OSHA). This means thatinspections of farms were included in the numerator, but not the denominator. The effect should be negligible because: the 2002 Census ofAgriculture data indicated that most farms had 10 or fewer employees and were not covered by OSHA; and few OSHA inspections of largefarms were conducted according to data from several states.Mining is covered by the Mining Safety and Health Administration (MSHA), not OSHA.Data Source: Numbers of OSHA inspections and workers covered by OSHA inspections = OSHA Office of Statistics. Number ofestablishments and workforce estimates = Bureau of Labor Statistics’ Covered Employers and Wages (ES 202).
The Occupational Safety andHealth Administration (OSHA) wasestablished by Congress as partof the Occupational Safety andHealth Act of 1970. This actestablished a workers right to asafe workplace.

BACKGROUND Workers’ compensation providesbenefits for medical expenses and partial coveragefor lost wages in the event that an individualexperiences a work-related injury or illness andmeets the eligibility requirements. Workers’compensation coverage requirements vary by state.In Florida, not all workers are eligible for stateworkers compensation coverage. Federal workersand self-employed persons are not covered.Additionally, employers of small farms and smallnon-construction industry businesses are notrequired to carry workers compensation coverage.See the following link for Florida specificinformation on workers compensation(http://www.myfloridacfo.com/wc/employer/coverage.html).
Data for this indicator were obtained from theNational Academy of Social Insurance.
RESULTS Table 17 shows the total workerscompensations benefits paid per year from 2000 to2007. On average, workers’ compensation paid$2.7 billion in benefits per year
Figure 17 shows the average workers’compensation benefit paid per covered worker. Theaverage benefit ranged from a high of $449 in 2001to a low of $338 in 2006. The average benefit paidper covered worker, across all years was, $391.
Ind
icato
r 19
$500
$450
$400
$350
$300
$250
$200
$150
$100
$50
$0 2000 2001 2002 2003 2004 2005 2006 2007
� Florida
$387
Do
llars
pai
d
$449
$396$411
$392 $397
$338$358
2000 2001 2002 2003 2004 2005 2006 2007
Totalbenefitspaid in
thousands
$2,576,875 $3,033,955 $2,678,082 $2,811,302 $2,759,712 $2,899,301 $2,532,864 $2,684,761
31
Table 17. Workers'CompensationAwards, Florida,2000–2007
Figure 17. AverageWorkers’Compensation BenefitPaid per CoveredWorker*, Florida,2000–2007
Data Source: Total amount and average benefits paid = National Academy of Social Insurance
Workers Compensation Awards
*All workers who are eligiblefor compensation should theysustain work-related injuriesor illnesses are considered“covered” workers.

Refe
ren
ces
33
1 Leigh JP, Marcin JP, Miller TR. An estimate of the US government’s undercount of nonfatal occupationalinjuries. Journal of Occupational and Environmental Medicine.2004; 46 (1), 10–18.
2 Azaroff LS, Levenstein C, Wegman DH. Occupational injury and illness surveillance: conceptual filters explainunderreporting. American Journal of Public Health. 2002; 92(9):1421–1429.
3 Biddle J, Roberts K, Rosenman K. What percentage of workers with work-related illnesses receive workerscompensation benefits. Journal of Occupational and Environmental Medicine.1998; 40(4): 325–331
4 Fan ZJ, Bonauto DK, Foley MP, Silverstein BA. (2006). Underreporting of work-related injury or illness toworker’s compensation: individual and industry factors. Journal of Occupational and Environmental Medicine.2006; 48(9): 914–922.
5 Rosenman K, Gardiner J, Wang J, Biddle J, Hogan A, Reilly M, Roberts K, Welch E. Why most workers withoccupational repetitive trauma do not file for workers’ compensation. Journal of Occupational andEnvironmental Medicine.2000; 42(1): 25–34.
6 Kosnett MJ, Wedeen, RP, Rothenberg SJ, Hipkins KL, Materna BL, Schwartz BS, Hu H, Woolf A.Recommendations for medical management of adult lead exposure. Environ Health Perspectives. 2007; 115:463–71.
7 Association of Occupational and Environmental Clinics. Medical management guidelines for lead-exposedadults. Washington, DC: Association of Occupational and Environmental Clinics; 2007. Available athttp://www.aoec.org/documents/positions/mmg_final.pdf. Accessed August 29, 2011.
8 Centers for Disease Control. Adult blood lead epidemiology and surveillance –United States, 2008–2009.Morbidity and Mortality Weekly Report. July 1, 2011; 60(25): 841–45