occupational disease indicators april 2008 · compensation claims may not be the most appropriate...
TRANSCRIPT

OCCUPATIONAL DISEASE INDICATORS APRIL 2008

© Commonwealth of Australia 2008
ISBN 978 0 642 32767 3
This work is copyright. You may download, display, print and reproduce this material in unaltered form only (retaining this notice) for your personal, non-commercial use or use within your organisation. Apart from any use as permitted under the Copyright Act 1968, all other rights are reserved. Requests and inquiries concerning reproduction and rights should be addressed to Commonwealth Copyright Administration, Attorney-General’s Department, Robert Garran Offices, National Circuit, Barton ACT 2600 or posted at http://www.ag.gov.au/cca
Disclaimer
The Department of Education, Employment and Workplace Relations through the Australian Safety and Compensation Council (ASCC) provides the information given in this document to improve public access to information about occupational health and safety information generally. The vision of the ASCC is Australian workplaces free from injury and disease. Its mission is to lead and coordinate national efforts to prevent workplace death, injury and disease in Australia.
The information provided in this document can only assist you in the most general way. This document does not replace any statutory requirements under any relevant State and Territory legislation. The ASCC accepts no liability arising from the use of or reliance on the material contained on this document, which is provided on the basis that the ASCC is not thereby engaged in rendering professional advice. Before relying on the material, users should carefully make their own assessment as to its accuracy, currency, completeness and relevance for their purposes, and should obtain any appropriate professional advice relevant to their particular circumstances. To the extent that the material in this document includes views or recommendations of third parties, such views or recommendations do not necessarily reflect the views of the ASCC or the Department of Education, Employment and Workplace Relations nor do they indicate a commitment to a particular course of action.

ForewordThe Australian Safety and Compensation Council (ASCC), works to lead and coordinate national efforts to prevent workplace death, injury and disease. As part of this role, the ASCC seeks to establish and monitor credible baseline indicators in occupational disease. Occupational disease is defined as: All employment-related diseases which result from repeated or long-term exposure to an agent(s) or event(s) or which are the result of a single traumatic event where there was a long latency period.
On 24 May 2002, the Workplace Relations Ministers’ Council endorsed the release of the National OHS Strategy 2002-2012. Five national priority action areas were identified within the strategy. The Occupational Disease Indicators project supports the third priority area, to ‘prevent occupational disease more effectively’. This report is the second in a series of biennial reports, the first of which was published in April 2006.
Eight disease groups have been identified in consultation with stakeholders for monitoring. These are:
- Musculoskeletal disorders- Mental disorders- Noise induced hearing loss- Infectious and parasitic diseases- Respiratory disease- Contact dermatitis- Cardiovascular disease- Occupational cancers
Further information on these diseases can be found on the ASCC website under research reports, www.ascc.gov.au
Data for the indicators published in this report come from various sources:
- the National Data Set for Compensation-Based Statistics (NDS)- the National Notifiable Disease Surveillance System (NNDSS)- the Australian Institute of Welfare’s (AIHW) National Hospital Morbidity Database (NHMD),
and- the AIHW’s National Cancer Statistics Clearing House (NCSCH).
Additional data sets are being assessed for their suitability for use in further developing disease trends. These data sets will be incorporated in future reports where appropriate. Further details on the data sources used in this report can be found in the Explanatory notes on page 14.
Issues in occupational disease
Unlike injury, where there is usually a clear cause and effect relationship between a hazard and its health effect, most occupational diseases are multi-factorial in nature, with workplace exposures constituting one important part of the risk matrix. Many diseases, such as cancers and pneumoconioses, have long latency periods, while for other diseases, such as asthma, the link between cause and effect can be difficult to establish. This may lead to considerable under-reporting of occupational diseases.
Furthermore, for diseases with long latency periods, incidence rates based on workers’ compensation claims may not be the most appropriate indicator of emerging trends as reductions in exposure to disease-causing agents may not lead to any reduction in the incidence rate until many years later. Indicators based on exposures to disease causing hazards are more appropriate. The ASCC is currently developing the Australian Hazard Exposure Assessment Database (AHEAD). The AHEAD project aims to collect, store and analyse workers’ exposure to disease causing hazards, thus informing prevention initiatives and subsequently reducing the incidence of occupational disease. This project is currently in the development phase. The ASCC will report on exposure data as it becomes available.

The indicators in this report rely primarily on compensated claims data from the NDS. These data are complemented, where possible, by other data sources to increase the overall validity of the results. As the additional data sources (NHMD, NNDSS, and NCSCH) do not identify work relatedness, data from these sources are only presented in this report for diseases with a high attribution to the work environment.
Trends in compensated claims for occupational disease are subject to a range of factors. For example, campaigns to increase awareness of occupational diseases may result in increased claims while, conversely, changes to legislation or standards may result in fewer accepted claims due to the application of higher acceptance thresholds.
Given the issues outlined above it should be noted that the figures presented in this paper are indicators only and should not be taken as representing the true incidence of occupational disease in Australia. The main purpose of this data is in examining trends over time.
Changes made since the previous report
Several changes have been made to both the format and analysis of the data since the first report was published. The main changes relate to the way the NDS data are shown in this report. As it is known that preliminary NDS claims understate the number of claims, data in this report will only be presented up to 2004–05, the most recently available non-preliminary data. In addition, NDS results will only be shown on an annual basis, rather than the quarterly reporting that was undertaken in the previous report. Reporting annual incidence rates removes the need for the seasonal adjustment analyses which were performed on the rates data in the previous report.
Other minor amendments have been made to some of the specifications of the disease groups. These are detailed in the relevant sections.
Contents
Foreword
Summary of findings 2
1. Musculoskeletal Disorders 3
2. Mental Disorders 4
3. Noise induced hearing loss 5
4. Infectious and parasitic diseases 6
5. Respiratory disease 8
6. Contact Dermatitis 10
7. Cardiovascular disease 11
8. Occupational cancer 12
Explanatory notes 14
Occupational Disease Indicators, April 2008 1

2 Australian Safety and Compensation Council
Summary of findingsFrom 1997–98 to 2004–05, decreasing trends were observed for five of the eight priority disease groups; musculoskeletal disorders, noise induced hearing loss, infectious diseases, contact dermatitis, and cardiovascular diseases.
Result Disease Findings
Musculoskeletal disorders The incidence of compensated claims for musculoskeletal disorders
decreased over the time period assessed. This decreasing trend was mainly driven by a decrease in muscular disorders rather than skeletal.
Mental disorders The incidence of compensated claims for mental disorders
increased over the time period assessed. While a slight decrease in the incidence rate was recorded for the most recent year, 2004–05, it is not clear whether this decrease will continue.
Noise induced hearing loss Overall the incidence of compensated deafness claims declined
considerably over the time period assessed. Despite this, an increase was observed between 2002–03 and 2004–05. It is not clear whether or not this increase will continue.
Infectious and parasitic diseases The rate of compensated claims for infectious disease was quite
volatile over the time period assessed, however overall a declining trend was observed. This declining trend was also observed when looking at disease notifications for specified zoonoses.
Respiratory disease The rate of compensated claims for respiratory diseases trended
upwards over the time period assessed. The rate of hospital separations due to respiratory diseases also increased over the same time period.
Contact dermatitis The rate of compensated claims for contact dermatitis declined
considerably over the time period assessed.
Cardiovascular disease Over the time period assessed the rate of compensated claims for
cardiovascular diseases was quite volatile. However, an overall decline was recorded over the assessment period
Occupational Cancer The rate of compensated claims for cancer has risen over time;
this appears to be due to persistent rises in claim rates for both Skin cancer and Mesothelioma. National Cancer Statistics Clearing House data show that the rate of new cases of Mesothelioma being notified to cancer registries throughout Australia has increased dramatically since 1982, the earliest year for which data are available.

Occupational Disease Indicators, April 2008 3
1. Musculoskeletal DisordersMusculoskeletal disorders cover a broad group of clinical disorders that impact on the musculoskeletal system. Within these conditions the intensity of the disorder and the associated impact on the affected person’s life varies greatly.
Data for this indicator were drawn from the NDS. From 2002–03 a new coding system, which provides additional advice on how to code musculoskeletal conditions, has been progressively introduced across the jurisdictions. This new system has resulted in many claims previously coded as injury (strains and sprains) now coded as disease (diseases of the musculoskeletal system). Due to the desire to have a long time series, it is necessary in this report to include all claims involving musculoskeletal conditions regardless of whether they have been classed as an injury or a disease. However, cases where the disorder was clearly caused by an injury, such as a fall, have been removed.
Figure 1 shows that from 1997–98 to 2004–05 there has been a downward trend in the incidence of Musculoskeletal disorders. However, when looking at muscular and skeletal disorders separately, the figure shows that the incidence of Muscular disorders has steadily declined, while the rate of claims for Skeletal disorders remained relatively stable over the same time period. The steady decline in Muscular disorders appears to be the main cause of the overall decline in musculoskeletal disorders.
Figure 1 Musculoskeletal disorders: incidence rate per million employees
Source: NDS
The time-series data shown separately for skeletal and muscular disorders should be treated with caution. The introduction of the new coding system by one large jurisdiction in the 2002–03 has resulted in claims moving from the muscular category to the skeletal category. Further shifts of this nature are expected in future years as more jurisdictions adopt this new coding system. Further information on the codes used to analyse NDS data can be found in the Explanatory notes on page 14.
Additional information on occupational musculoskeletal disorders can be found in the report titled Work-related Musculoskeletal Disease in Australia, April 2006 on the ASCC website.
0
2000
4000
6000
8000
10000
12000
1997-98 1998-99 1999-00 2000-01 2001-02 2002-03 2003-04 2004-05
Claim
s per
milli
on e
mplo
yees
Total Musculoskeletal disorders Skeletal disorders Muscular disorders

4 Australian Safety and Compensation Council
2. Mental DisordersWork-related mental disorders encompass conditions such as post-traumatic stress disorder, anxiety, depression and short-term shock.
Figure 2 shows that while there has been an overall increase in the incidence rate of Mental disorders from 1997–98 to 2004–05, an initial decline was recorded from 1997–98 to 1999–2000 followed by a sharp rise from 1999–2000 to 2002–03. While there is little evidence of continuing increases in the latest data, it is uncertain whether the decrease shown between 2003-04 and 2004-05 will continue.
Figure 2 Mental disorders: incidence per million employees
Source: NDS
Additional information on occupational mental disorders can be found in the report titled Work-related Mental Disorders in Australia, April 2006 on the ASCC website.
0
200
400
600
800
1000
1200
1997-98 1998-99 1999-00 2000-01 2001-02 2002-03 2003-04 2004-05
Claim
s per
milli
on e
mplo
yees

Occupational Disease Indicators, April 2008 5
3. Noise induced hearing lossClaims for occupational noise induced hearing loss are generally caused by sustained exposure to excessive sound energy, rather than traumatic exposures.
When assessing any data relating to noise induced hearing loss it is important to note changes to the acceptable hearing loss threshold for compensation claims nationally. A recommendation developed by the Heads of Workers’ Compensation Authorities (HoWCA) in 1997, suggested a 10% threshold apply for compensability. Minimum thresholds were subsequently adopted by all jurisdictions (although actual threshold percentages vary amongst jurisdictions). It is believed that this has led to a reduction in the number of occupational Deafness claims as shown in Figure 3.
The rate of occupational deafness declined from 1997–98 to 2004–05, although this decline occurred at a much slower rate post 1998–99 and shows some volatility over time.
Figure 3 Occupational deafness: incidence rate per million employees
Source: NDS
For more information on deafness thresholds, see the Comparison of Workers’ Compensation Arrangements report on the ASCC website.
Additional information on occupational deafness can be found in the report titled Work-related Noise Induced Hearing Loss in Australia, April 2006 on the ASCC website.
0
100
200
300
400
500
600
700
800
900
1997-98 1998-99 1999-00 2000-01 2001-02 2002-03 2003-04 2004-05
Claim
s per
milli
on e
mplo
yees

6 Australian Safety and Compensation Council
4. Infectious and parasitic diseasesInfection diseases include Intestinal infectious diseases, Specified zoonoses, Viral diseases, Hepatitis and other infectious diseases such as specified sexually transmitted diseases, HIV-AIDS, Mycoses and Other infectious and parasitic diseases.
The precise number of workers with infectious diseases is difficult to ascertain. Any one infectious disease may have a variety of causes, some of which can be attributed to the workplace. However, there are many infectious diseases where the exposure to the disease causing hazard is almost always work-related. Further information on the infectious diseases for which data are available in the following graphs can be found in the Explanatory Notes on page 14.
Figure 4 shows incidence rates for all infectious diseases captured in the NDS. This figure shows a large decline in the overall rate of infectious diseases from 1997–98 to 2004–05. The volatility shown in the graph is likely to be due to the relatively small number of compensated claims, and hence the potential for large changes to occur year by year. For example, in 2003-04 only around 300 cases of infectious and parasitic diseases were compensated.
Figure 4 Infectious and parasitic diseases: incidence rate per million employees
Source: NDS
Figure 4 also shows an overall downward trend in compensated claim rates for Specified Zoonoses and Viral diseases (excluding hepatitis). Other infectious diseases recorded a slight decrease in rate over the period but remain volatile. The rate of Intestinal diseases increased over the time period, with the largest increase occurring between 2001–02 and 2003–04. Incidence rates for Viral hepatitis have remained relatively steady.
Many infectious diseases are notifiable to the NNDSS though not all are work-related. As zoonoses are highly attributable to the work environment, NNDSS data are provided in this report as an alternate source of information. Figure 5 shows incidence rates of selected Specified zoonoses notifications (per million adults), specifically Brucellosis, Leptospirosis and Q-fever. These data show that after an initial increase, the notification rate of Leptospirosis has declined over the years while notification rates for Q-fever have fluctuated. In 2001, the Q-fever vaccination program was introduced and the data show the impact of this program with rates increasing until 2001-02 and then falling. Notification rates for Brucellosis remained relatively stable for the time period assessed.
Comparison of Figures 4 (NDS data) and 5 (NNDSS data) shows both data sources produce similar trends with an overall decrease in the incidence of Specified zoonoses. Since workers’ compensation only covers employees, it is to be expected that the NDS incidence rates would be much lower than the notification rates from the NNDSS, which theoretically include all cases of specified zoonoses. Another factor in the difference in rates between the two data sources is that these diseases predominately occur in the Agriculture, forestry and fishing industry, an industry in which only approximately half of all workers are covered by workers’ compensation.
0
10
20
30
40
50
60
70
80
1997-98 1998-99 1999-00 2000-01 2001-02 2002-03 2003-04 2004-05
Claim
s per
milli
on e
mplo
yees
Total Infectious diseases Viral diseases (excluding hepatitis)Intestinal diseases Specified zoonosesViral hepatitis Other infectious diseases

Occupational Disease Indicators, April 2008 7
Figure 5 Selected specified zoonoses: rate per million adults
Source: NNDSS
Additional information on occupational infectious diseases can be found in the report titled Work-related Infectious and Parasitic Diseases in Australia, April 2006 on the ASCC website.
0
10
20
30
40
50
60
70
1997-98 1998-99 1999-00 2000-01 2001-02 2002-03 2003-04 2004-05
Notifi
catio
ns p
er m
illion
adu
lts
Total specified zoonoses Q-feverLeptospirosis Brucellosis

8 Australian Safety and Compensation Council
5. Respiratory diseaseOccupational respiratory diseases include work-related Asthma, Asbestosis, Legionnaires and Pneumoconioses as well as Respiratory diseases due to various other substances. Workers commonly affected by such exposures include food processors, bakers, farmers, spray painters, miners, hairdressers and construction workers.
Figure 6 shows that overall, incidence rates for respiratory diseases increased from 1997–98 to 2004–05. Figure 6 also shows incidence rates for a range of specific respiratory diseases. These data show that the incidence rate for Asthma decreased over the time period assessed while the incidence rate for Legionnaires and other respiratory conditions due to substances increased marginally. Incidence rates for Other respiratory diseases showed an initial decrease, then remained relatively stable from 1998–99 until 2002–03, increasing rapidly over the following two years. Pneumoconioses (other than asbestosis) remained relatively steady, showing only a slight increase over the time period assessed. Overall the rate of asbestosis increased, despite an initial decline. The overall increasing trend for all respiratory diseases is predominately the result of the similar increase in rates observed for asbestosis.
Figure 6 Respiratory disease: incidence rate per million employees
Source: NDS
Compensated data from the NDS can be complemented by the use of hospital separations data for respiratory diseases which are highly attributable to work. The incidence of hospital separations per million adults for Asbestosis and Legionnaires and Other respiratory conditions due to substances are shown in Figure 7. This figure shows an overall increase in the rate of hospital separations, with the increases in hospital separations for Legionnaires and other respiratory conditions due to substances most dominant. Comparison of Figure 6 (NDS rates) with Figure 7 (hospital separation rates) shows upward trends in rates for both data sources. The higher incidence of compensated claims as opposed to hospital separations is likely to be due to respiratory diseases needing infrequent hospitalisation.
We are no longer able to report hospital separations for pneumoconioses, as the numbers have become quite small and the AIHW no longer publicly release these data.
Additional information on occupational respiratory diseases can be found in the report titled Occupational Respiratory Disorders in Australia, April 2006 on the ASCC website.
0
10
20
30
40
50
60
70
80
1997-98 1998-99 1999-00 2000-01 2001-02 2002-03 2003-04 2004-05
Claim
s per
milli
on e
mplo
yees
Total respiratory diseases AsbestosisAsthma Legionnaire & other resp disPnenmoconioses Other resp dis

Occupational Disease Indicators, April 2008 9
Figure 7 Respiratory disease: hospital separation rates per million adults
Source: NHMD
0
5
10
15
20
25
30
1998-99 1999-00 2000-01 2001-02 2002-03 2003-04 2004-05
Hops
pital
sepa
ratio
ns p
er m
illion
adu
lts
Total respiratory diseasesLegionnaries & other respiratory conditions due to substancesAsbestosis

10 Australian Safety and Compensation Council
6. Contact DermatitisContact dermatitis is a skin condition caused by substances interacting with the skin. It predominately affects the hands, although other exposed areas such as the arms and face may be affected. At risk workers include hairdressers, workers involved in food preparation, health care workers and workers involved in some aspects of manufacturing.
Figure 8 shows the incidence rate of Contact dermatitis declined considerably from 1997–98 to 2004–05, though a slight rise was recorded for the latest year. The better use of protective clothing may have contributed to this decline.
Note that Other and unspecified dermatitis or eczema, has been included in the occupational contact dermatitis category in order to include all compensated contact dermatitis claims in this report.
Figure 8 Contact dermatitis: incidence rate per million employees
Source: NDS
Additional information on occupational contact dermatitis can be found in the report titled Occupational Contact Dermatitis in Australia, April 2006 on the ASCC website.
0
15
30
45
60
75
90
105
1997-98 1998-99 1999-00 2000-01 2001-02 2002-03 2003-04 2004-05
Claim
s per
milli
on e
mplo
yees
Occupational Disease Indicators, April 2008 11
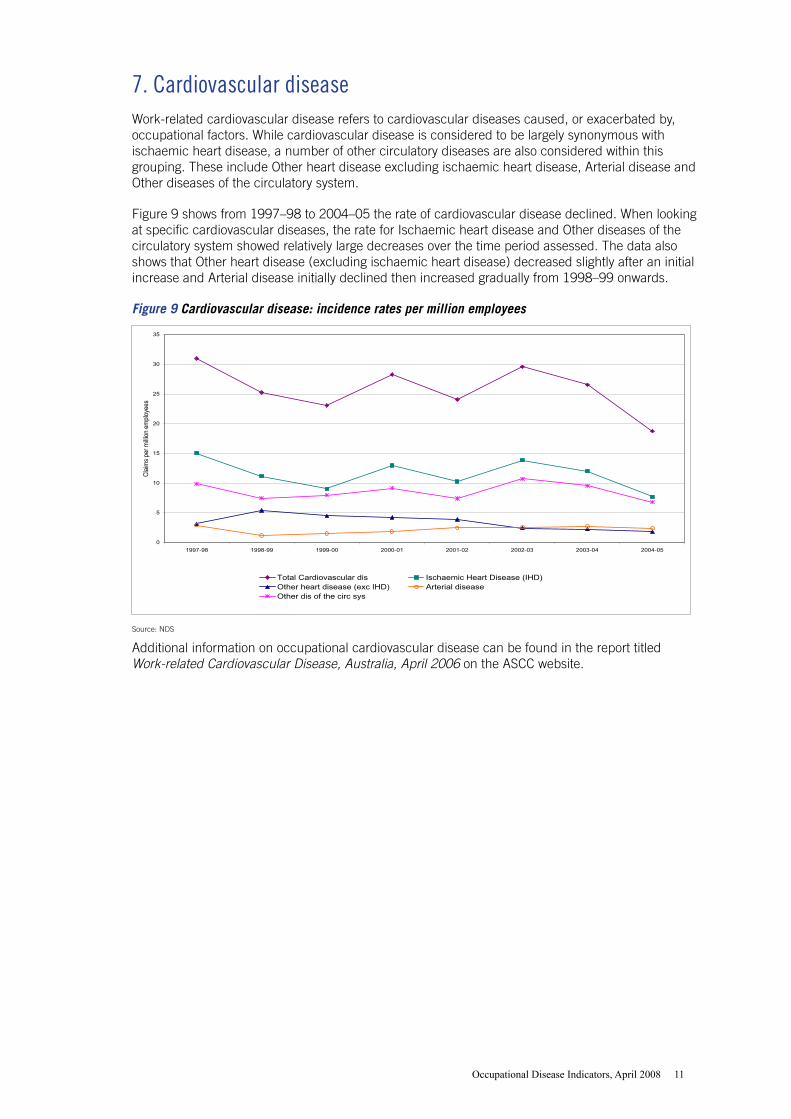
7. Cardiovascular diseaseWork-related cardiovascular disease refers to cardiovascular diseases caused, or exacerbated by, occupational factors. While cardiovascular disease is considered to be largely synonymous with ischaemic heart disease, a number of other circulatory diseases are also considered within this grouping. These include Other heart disease excluding ischaemic heart disease, Arterial disease and Other diseases of the circulatory system.
Figure 9 shows from 1997–98 to 2004–05 the rate of cardiovascular disease declined. When looking at specific cardiovascular diseases, the rate for Ischaemic heart disease and Other diseases of the circulatory system showed relatively large decreases over the time period assessed. The data also shows that Other heart disease (excluding ischaemic heart disease) decreased slightly after an initial increase and Arterial disease initially declined then increased gradually from 1998–99 onwards.
Figure 9 Cardiovascular disease: incidence rates per million employees
Source: NDS
Additional information on occupational cardiovascular disease can be found in the report titled Work-related Cardiovascular Disease, Australia, April 2006 on the ASCC website.
0
5
10
15
20
25
30
35
1997-98 1998-99 1999-00 2000-01 2001-02 2002-03 2003-04 2004-05
Claim
s per
milli
on e
mplo
yees
Total Cardiovascular dis Ischaemic Heart Disease (IHD)Other heart disease (exc IHD) Arterial diseaseOther dis of the circ sys

12 Australian Safety and Compensation Council
8. Occupational CancerCancer is a term which groups diseases characterised by the abnormal division of cells. These new cells (neoplasms) can invade nearby tissues. They can also spread throughout the body via the circulatory system and grow in major organs (metastasise). Current theories on cancer suggest that its cause is a multi-step process arising from a combination of factors that vary by nature and degree of exposure to carcinogens over time, mediated by individual behaviour, as well as genetic factors. There are a number of known carcinogens, however the specific toxicity, potency and latency periods associated with many agents are unknown. Further, given the long latency period associated with many carcinogenic exposures, workplace exposures and the onset of a specific cancer may not be readily associated. Consequently, it is likely that disease trends based on compensated claims greatly understate the real incidence of work-related cancer.
Note that in this report additional compensated cancer categories have been included under the sub-group ‘Other cancer’. This change means that all compensated cancers are included in the calculation of incidence rates in this report.
Figure 10 shows, that from 1997–98 to 2004–05, the incidence rate of occupational cancer has increased. The figure also shows the marked increases in incidence rates for both Mesothelioma and Skin cancer. The incidence rate for Other cancers is quite volatile over the time period assessed, with only a very slight overall increase since 1997–98.
The volatility seen in the figure below is likely to be caused by the relatively small numbers of cancers that are compensated under workers’ compensation arrangements. For example, in 2003-04, there were only approximately 240 compensated cases of cancer.
Figure 10 Occupational cancer: incidence rate per million employees
Source: NDS
Additional information on occupational cancers can be found in the report titled Occupational Cancers in Australia, April 2006 on the ASCC website.
0
5
10
15
20
25
30
1997-98 1998-99 1999-00 2000-01 2001-02 2002-03 2003-04 2004-05
Claim
s per
milli
on e
mplo
yees
Total Cancer Skin cancer Mesothelioma Other cancers

Occupational Disease Indicators, April 2008 13
Mesothelioma
Mesothelioma is a usually fatal cancer which typically occurs 20 to 30 years after exposure to asbestos. Mesothelioma is a notifiable disease, therefore all cases of mesothelioma diagnosed in Australia are required to be reported to the State Cancer Registries. These data are then collated in the National Cancer Statistics Clearing House (NCSCH), and national data are published by the Australian Institute of Health and Welfare (AIHW). Figure 11 shows that the incidence of new cases of mesothelioma has increased from 1997 to 2004. Due to the long latency of this disease and exposure periods to asbestos, it is likely that this rate will continue to increase, reaching a peak in the next 10 to 15 years. Further information and data on mesothelioma in Australia can be found in the Mesothelioma in Australia: Incidence 1982 to 2004, Deaths 1997 to 2005 report on the ASCC website.
Note that hospital separations are no longer reported for mesothelioma as it has become apparent that incidence data obtained from the NCSCH is far superior. Figure 11 New cases of mesothelioma per 100 000 population
Source: NCSCH
0.0
0.5
1.0
1.5
2.0
2.5
3.0
3.5
1997 1998 1999 2000 2001 2002 2003 2004Year of diagnosis
Rate
per
100
000
pop
ulatio
n

14 Australian Safety and Compensation Council
Explanatory notesSeveral data sets were examined in order to collect work-related disease information for this publication. The data sources used are the:• National Data Set for Compensation-based Statistics (NDS)• National Hospital Morbidity Database (NHMD)• National Notifiable Disease Surveillance System (NNDSS), and• National Cancer Statistics Clearing House (NCSCH).
A summary of the data sources used for each disease category is presented in Table 1, with further information on these sources detailed below.
Table 1 Summary of data sources
Disease Indicator Data Source/sMusculoskeletal disorders Incidence of musculoskeletal claims per million employees NDS
Mental disorders Incidence of mental disorders claims per million employees NDS
Noise induced hearing loss Incidence of noise induced hearing loss per million employees NDS
Infectious disease Incidence of infectious disease per million employees NDS
Notification rate of selected zoonoses per million adults NNDSS
Respiratory disease Incidence of respiratory disease claims per million employees/persons
NDS
Hospital separations rate of asbestosis, legionnaires and other respiratory diseases due to substances cases per million adults
NHMD
Contact dermatitis Incidence of contact dermatitis per million employees NDS
Cardiovascular disease Incidence of cardiovascular claims per million employees NDS
Cancer Incidence of cancer claims per million employees NDS
Incidence of new mesothelioma cases per 100 000 population NCSCH
National Data Set for Compensation-Based Statistics (NDS)
The NDS data in this report includes only serious claims. Serious claims are those involving a fatality, a permanent incapacity or a temporary incapacity which resulted in one or more weeks off work.
Data are received annually from the various workers’ compensation authorities operating in Australia for the previous financial year, along with updated data for the 5 years prior. As data for the most recent year are taken at an earlier stage of claims processing than the updated data for prior years, they understate the number of claims for that particular year and are not used in this report.
The NDS is the only national data set that provides information on claims that involve work-related disease. For a claim to be accepted, the workers’ compensation authorities require that the connection between workplace and disease be made by a medical practitioner. This may lead to considerable under-reporting of occupational disease in the NDS. It should also be noted that claims data are used based on date of lodgement of claims which is usually closer to the date of diagnosis than the date of exposure. Further information on the NDS can be found on the ASCC website.
Table 2 shows the Type of Occurrence Coding System (TOOCS2.1) codes for the disease data extracted from the NDS.

Occupational Disease Indicators, April 2008 15
Table 2: TOOCS Nature of injury/disease variables used in this report
Breakdown disease group NDS code Specific VariablesMusculoskeletal disorders
Skeletal disorders 010 Fractures
020 Fracture of vertebral column with or without mention of spinal chord lesion
030 Dislocation
310 Arthropathies and related disorders - disorders of the joints
320 Dorsopathies - disorders of the spinal vertebrae and intervertebral discs
340 Osteopathies, chondropathies and acquired musculoskeletal deformities
Muscular disorders 040 Sprains and strains of joints and adjacent muscles
330 Disorders of muscle, tendons and other soft tissues
450 Hernia
Mental disordersMental disorders 910 Mental disorders
DeafnessDeafness 250 Deafness
Infectious and parasitic diseasesIntestinal infectious diseases 510 Intestinal infectious diseases
Specified zoonoses 521-525 Specified zoonoses (includes anthrax, brucellosis, Q-fever, leptospirosis and ‘Other’ zoonoses)
Viral diseases excluding hepatitis 540 Viral diseases excluding hepatitis, sexually transmitted diseases and Acquired immune deficiency syndrome (AIDS)
Hepatitis 550 Viral hepatitis
Other infectious diseases 530 Protozoal diseases
560 Specified sexually transmitted diseases excluding AIDS
561 Human Immunodeficiency virus (HIV) - AIDS
570 Mycoses
580 Other Infectious and parasitic diseases
Respiratory diseasesAsthma 610 Asthma
Legionnaires and other respiratory conditions due to substances
620 Legionnaires disease
660 Other respiratory conditions due to substances
Asbestosis 630 Asbestosis (excludes mesothelioma)
Pneumoconioses 640 Pneumoconioses due to other silica or silicates
650 Pneumoconioses excluding asbestosis or silicosis
Other respiratory disease 670 Chronic bronchitis, emphysymea and allied conditions
680 Other diseases of the respiratory system
Contact dermatitisContact dermatitis 410 Contact dermatitis
420 Other and unspecified dermatitis and eczema
Cardiovascular diseaseIschaemic heart disease (IHD) 710 Ischaemic heart disease
Other heard disease excluding IHD 720 Other heard disease excluding IHD
Arterial disease 740 Arterial disease
Other diseases of the circulatory system
750 Hypertension (high blood pressure)
760 Varicose veins
780 Other diseases of the circulatory system
Occupational cancer Mesothelioma 810 Malignant neoplasm of pleura (mesothelioma)
Skin cancer 820 Malignant melanoma of skin
830 Other malignant neoplasm of skin
850 Carcinoma in situ of skin
Other cancer 840 Malignant neoplasm of lymphatic and haematopoietic tissue
860 Other malignant neoplasms and carcinomas
890 Neoplasms of uncertain or unspecified nature

16 Australian Safety and Compensation Council
National Hospital Morbidity Database (NHMD)
The NHMD provides data on in-patient episodes as hospital separations. This data set is maintained by the Australian Institute of Health and Welfare (AIHW). Data items include diagnosis, duration of hospital stay and procedures performed. Work relatedness is not consistently recorded in the data set. Therefore, only diseases considered to have a high attribution to work have been examined for use in this report. NHMD data may include the same individual presenting for multiple hospitalisations during the year and therefore could overstate the incidence of disease.
The National Notifiable Diseases Surveillance System (NNDSS)
The NNDSS was established in 1990 by the Communicable Disease Network of Australia who publish this data on a quarterly basis. The system co-ordinates the national surveillance of more than 50 communicable diseases or disease groups. Under this system, notifications are made to the State or Territory health authorities under the public health legislation in their jurisdiction. Computerised, de-identified unit records of notifications are supplied to the Commonwealth Department of Health and Ageing for collation, analysis and publication on the internet and in the quarterly journal, Communicable Diseases Intelligence. Only Infectious diseases with a high attribution to the workplace have been used in this report.
AIHW - National Cancer Statistics Clearing House (NCSCH)
The NCSCH receives data from individual State and Territory cancer registries on cancer diagnosed in residents of Australia. This data set is maintained by the AIHW. Data for new cases of cancers date back to 1982 and are currently available until 2004. The NCSCH produces reports of national incidence and mortality data. Periodically, additional reports are produced which analyse specific cancer sites, cancer histology, differentials in cancer rates by country of birth, geographical variation, trends over time and survival rates. The aim of the NCSCH is to foster the development and dissemination of national cancer statistics in Australia.
Calculation of incidence rates
The calculation of incidence rates from NDS data requires the number of employees in the Australian work force. These data are supplied to the Office of the ASCC by the Australian Bureau of Statistics (ABS) and are specifically calculated to match the scope of workers’ compensation coverage. More information on the NDS can be found in the NDS Technical Manual on the ASCC website.
Data obtained from the NHMD and NNDSS are drawn from the general population as work relatedness is not consistently identifiable using these data sources. As a result, ABS estimated resident population data are used when calculating incidence rates for these data sources. These data are estimated in June of the reference year and include all Australian residents aged 15 years and over.