occ and ots mortgage metrics report first quarter 2010
TRANSCRIPT

8/9/2019 OCC and OTS Mortgage Metrics Report First Quarter 2010
http://slidepdf.com/reader/full/occ-and-ots-mortgage-metrics-report-first-quarter-2010 1/59
OCC and OTS Mortgage Metrics ReportDisclosure of National Bank and Federal Thrift Mortgage Loan Data
First Quarter 2010
Office of the Comptroller of the CurrencyOffice of Thrift Supervision
Washington, D.C.
June 2010

8/9/2019 OCC and OTS Mortgage Metrics Report First Quarter 2010
http://slidepdf.com/reader/full/occ-and-ots-mortgage-metrics-report-first-quarter-2010 2/59
OCC and OTS Mortgage Metrics Report, First Quarter 2010
Contents
Executive Summary..................................................................................................... 4About Mortgage Metrics............................................................................................. 10New in This Report .................................................................................................... 10Definitions and Method .............................................................................................. 11
PART I: Mortgage Performance ................................................................................. 14Overall Mortgage Portfolio ......................................................................................... 14Overall Mortgage Performance.................................................................................. 15Performance of Government-Guaranteed Mortgages................................................ 17Performance of GSE Mortgages................................................................................ 18Performance of Option ARMs.................................................................................... 19Seriously Delinquent Mortgages, by Risk Category................................................... 20Mortgages 30–59 Days Delinquent, by Risk Category .............................................. 21
PART II: Home Retention Actions............................................................................. 22A. Loan Modifications, Trial Period Plans, and Payment Plans ............................. 23
Newly Initiated Home Retention Actions.................................................................... 23HAMP Modifications and Trial Period Plans, by Investor and Risk Category ............ 24Newly Initiated Home Retention Actions Relative to Newly Initiated Foreclosures .... 25Types of Modification Actions .................................................................................... 26Types of HAMP Modification Actions......................................................................... 27Types of Modification Actions, by Risk Category....................................................... 28Types of Modification Actions, by Investor and Product Type ................................... 29Types of HAMP Modification Actions, by Investor and Product Type ........................ 30Types of Modification Actions Taken on Option ARMs.............................................. 31Changes to Monthly Payments Resulting from Modification...................................... 32Changes to Monthly Payments Resulting from Modifications, by Quarter ................. 33Changes to Monthly Payments Resulting from HAMP Modifications, by Quarter...... 35
B. Modified Loan Performance ................................................................................. 36Re-Default Rates of Modified Loans: 60 or More Days Delinquent........................... 36Re-Default Rates of Modified Loans: 30 or More Days Delinquent........................... 37
- 2 -
8/9/2019 OCC and OTS Mortgage Metrics Report First Quarter 2010
http://slidepdf.com/reader/full/occ-and-ots-mortgage-metrics-report-first-quarter-2010 3/59
OCC and OTS Mortgage Metrics Report, First Quarter 2010
Re-Default Rates of Modified Loans: 90 or More Days Delinquent........................... 38Re-Default Rate, by Investor (60 or More Days Delinquent)...................................... 39Performance of Loan Modifications on Option ARMs ................................................ 41Performance of HAMP Modifications.........................................................................42
C. Modified Loan Performance, by Change in Monthly Payments......................... 43Modified Loans 60 or More Days Delinquent, by Changes to Monthly Payments: Re-Default Rates at 3, 6, 9, and 12 Months after Modification .................................. 4460+ Delinquency at 6 Months after Modification by Change to Monthly Payments ... 45Status of Mortgages Modified in 2008 and 2009 ....................................................... 46
Part III: Home Forfeiture Actions: Foreclosures, Short Sales, and Deed-in-Lieu-of-Foreclosure Actions ........................................................................ 48
Completed Foreclosures and Other Home Forfeiture Actions ................................... 48Newly Initiated Foreclosures...................................................................................... 49Foreclosures in Process ............................................................................................ 50Completed Foreclosures............................................................................................ 51Home Retention Actions Relative to Forfeiture Actions, by Risk Category ................ 52
Appendixes.................................................................................................................. 53Appendix A—New Loan Modifications....................................................................... 53Appendix B—New Trial Period Plans ........................................................................ 54Appendix C—New Payment Plans ............................................................................ 55Appendix D—Breakdown of Individual and Combination Modification Actions.......... 56
Index of Tables ............................................................................................................ 57Index of Figures .......................................................................................................... 59
- 3 -

8/9/2019 OCC and OTS Mortgage Metrics Report First Quarter 2010
http://slidepdf.com/reader/full/occ-and-ots-mortgage-metrics-report-first-quarter-2010 4/59

8/9/2019 OCC and OTS Mortgage Metrics Report First Quarter 2010
http://slidepdf.com/reader/full/occ-and-ots-mortgage-metrics-report-first-quarter-2010 5/59
OCC and OTS Mortgage Metrics Report, First Quarter 2010
Mortgage Performance
The percentage of current and performing mortgages in the portfolio increased to87.3 percent—an increase of 1.0 percent from the previous quarter—the first quarter-over-quarter improvement in overall portfolio performance since March of 2008 (see Table 9).
Pre-foreclosure delinquencies declined across all stages of delinquencies. Seriousdelinquencies declined to 6.5 percent of the portfolio, down 7.7 percent from the previousquarter. Loans 30–59 days past due declined 17.7 percent to 2.8 percent in the first quarter (see Table 9).
Delinquencies improved across all risk categories. Serious delinquencies among primemortgages, which represent 68 percent of the serviced portfolio, declined 3.8 percent fromthe previous quarter (see Table 13). Early-stage delinquencies (30–59 days past due) among prime mortgages declined more than 16 percent from the previous quarter (see Table 14).
Home Retention Actions: Loan Modifications, Trial Period Plans, and Payment Plans
Servicers implemented 629,678 new home retention actions—loan modifications, trial period plans, and payment plans—during the quarter. New home retention actions, includingHAMP actions, increased 5.4 percent this quarter and 61.4 percent from a year ago (seeTable 1).
Table 1. Number of New Home Retention Actions
3/31/09 6/30/09 9/30/09 12/31/09 3/31/101Q
%Change1Y %
Change
Loan Modifications 189,193 142,362 130,464 103,616 129,348 24.8% −31.6%
HAMP Modifications 0 0 783 20,679 99,980 383.5% --
HAMP Trial Period Plans 0 80,000 272,714 259,016 187,932 −27.4% --
Other Trial Period Plans 53,205 64,201 127,590 95,992 92,985 −3.1% 74.8%
Payment Plans 147,806 131,974 164,195 117,940 119,433 1.3% −19.2%
Total 390,204 418,537 695,746 597,243 629,678 5.4% 61.4%
Home Retention ActionsRelative to Serious
Delinquency andForeclosures In Process
15.7% 15.0% 21.7% 17.2% 18.6% 8.1% 18.6%
Servicers continued to emphasize home retention efforts over foreclosures, initiating1.7 times as many modifications and payment plans as new foreclosures. For every forfeitedhome during the quarter—foreclosure sale, short sale, or deed-in-lieu of foreclosure action—
servicers started more than three home retention actions to prevent foreclosures (see Table 6). Interest rate reductions were used in 85.9 percent of all mortgage modifications implemented
in the first quarter of 2010. Term extensions were used in 46.8 percent of all modifications, principal deferrals in 10.1 percent, and principal reductions in 1.9 percent (see Table 19).
1
1Because most modifications changed more than one aspect of the loan, these percentages exceed 100 percent.
- 5 -
8/9/2019 OCC and OTS Mortgage Metrics Report First Quarter 2010
http://slidepdf.com/reader/full/occ-and-ots-mortgage-metrics-report-first-quarter-2010 6/59
OCC and OTS Mortgage Metrics Report, First Quarter 2010
For HAMP modifications, capitalization of missed payments and fees followed by interestrate reductions and often term extensions were the prevailing actions. Principal deferral, oneof the prescribed actions under HAMP, was used in 19.1 percent of HAMP modifications(see Table 20).
Overall, modifications made during the first quarter lowered monthly principal and interest payments in 87.4 percent of all loan modifications. The percentage of modifications thatlowered monthly payments increased by more than 64 percent from a year ago, as servicersemphasized payment sustainability (see Table 29).2 Nearly all HAMP modifications reduced borrower principal and interest payments, and more than 78 percent reduced monthly principal and interest payments by 20 percent or more (see Table 30).
Modified Loan Performance
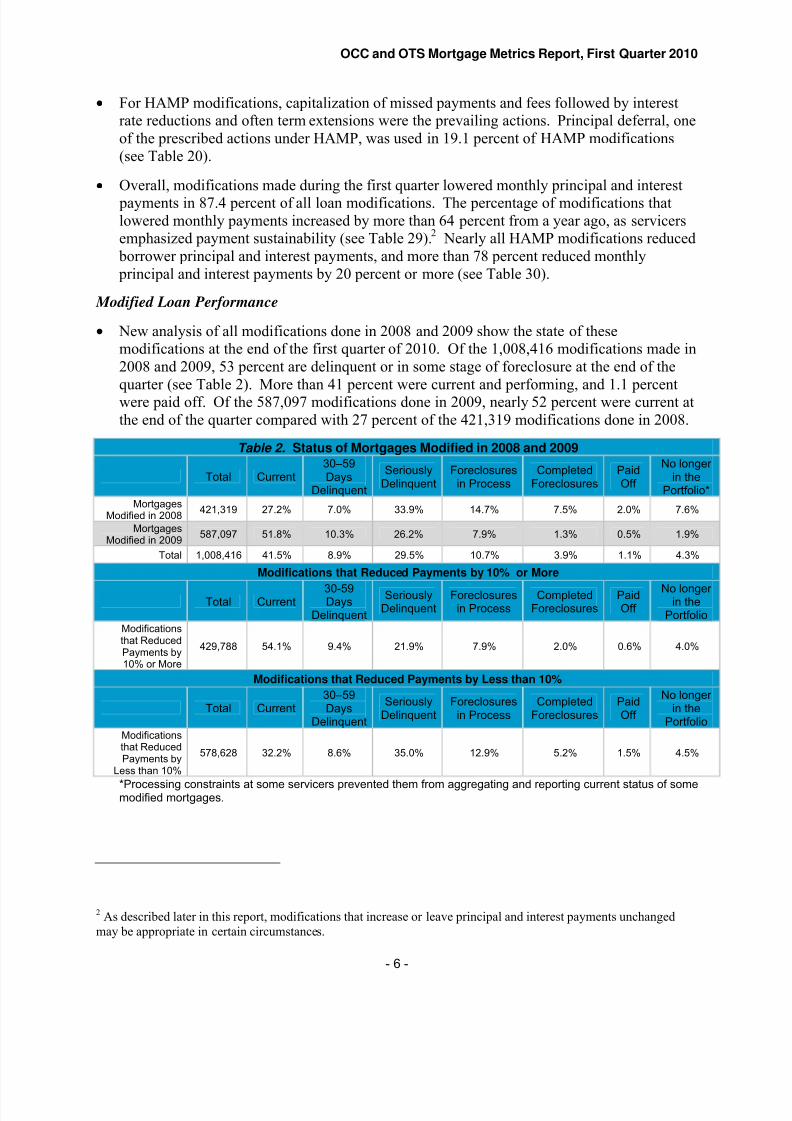
New analysis of all modifications done in 2008 and 2009 show the state of thesemodifications at the end of the first quarter of 2010. Of the 1,008,416 modifications made in2008 and 2009, 53 percent are delinquent or in some stage of foreclosure at the end of thequarter (see Table 2). More than 41 percent were current and performing, and 1.1 percentwere paid off. Of the 587,097 modifications done in 2009, nearly 52 percent were current atthe end of the quarter compared with 27 percent of the 421,319 modifications done in 2008.
Table 2. Status of Mortgages Modified in 2008 and 2009
Total Current Days30–59
Delinquent
SeriouslyDelinquent
Foreclosuresin Process
CompletedForeclosures
PaidOff
No longer in the
Portfolio*Mortgages
Modified in 2008421,319 27.2% 7.0% 33.9% 14.7% 7.5% 2.0% 7.6%
MortgagesModified in 2009
587,097 51.8% 10.3% 26.2% 7.9% 1.3% 0.5% 1.9%
Total 1,008,416 41.5% 8.9% 29.5% 10.7% 3.9% 1.1% 4.3%
Modifications that Reduced Payments by 10% or More
Total Current Days30-59
Delinquent
SeriouslyDelinquent
Foreclosuresin Process
CompletedForeclosures
PaidOff
No longer in the
PortfolioModificationsthat ReducedPayments by10% or More
429,788 54.1% 9.4% 21.9% 7.9% 2.0% 0.6% 4.0%
Modifications that Reduced Payments by Less than 10%
Total Current30–59Days
Delinquent
SeriouslyDelinquent
Foreclosuresin Process
CompletedForeclosures
PaidOff
No longer in the
PortfolioModificationsthat ReducedPayments by
Less than 10%
578,628 32.2% 8.6% 35.0% 12.9% 5.2% 1.5% 4.5%
*Processing constraints at some servicers prevented them from aggregating and reporting current status of somemodified mortgages.
2 As described later in this report, modifications that increase or leave principal and interest payments unchangedmay be appropriate in certain circumstances.
- 6 -

8/9/2019 OCC and OTS Mortgage Metrics Report First Quarter 2010
http://slidepdf.com/reader/full/occ-and-ots-mortgage-metrics-report-first-quarter-2010 7/59
OCC and OTS Mortgage Metrics Report, First Quarter 2010
The new analysis also shows that of the 429,788 modifications that reduced monthly payments by 10 percent or more, 54.1 percent were current at the end of the first quarter of 2010, compared with 32.2 percent of the 578,628 modifications that reduced payments byless than 10 percent (see Table 2).
Other data also show that delinquency following modification remained high, with more thanhalf of those modifications that have aged 12 months falling more than 60 days past due.However the data indicate more recent vintages of modification performed better after servicers began to emphasized lower monthly payments in the first quarter of 2009. Table 3shows that these more recent modifications performed better at 3, 6, and 9 months thanearlier modifications.
Table 3. Modified Loans 60 or More Days Delinquent(60+ Re-Default Rate for 2008–2009 Modifications)
Modification Date3 Months after Modification
6 Months after Modification
9 Months after Modification
12 Months after Modification*
Fourth Quarter 2008 29.9% 42.0% 51.6% 57.9%
First Quarter 2009 29.8% 42.3% 51.0% 54.9%
Second Quarter 2009 18.3% 33.1% 40.7% --
Third Quarter 2009 14.8% 27.7% -- --
Fourth Quarter 2009 11.3% -- -- --
* Data include only modifications that have had time to age the indicated number of months.
When compared with all modifications, HAMP modifications had fewer re-defaults after 3 months. At 3 months after modification, 7.7 percent of HAMP modifications were 60 or more days delinquent, compared with 11.3 percent overall (see Table 38).
Modifications on mortgages held in the servicers’ portfolios performed better than modified
mortgages serviced for others. This variance may result from differences in modification programs and servicers’ additional flexibility to modify mortgage terms. Modifiedgovernment-guaranteed mortgages had the highest delinquency rates at 6, 9, and 12 monthsfollowing modification compared with other investor types, which is also consistent withtheir higher overall delinquency rates (see Table 4).
Table 4. Re-Default Rates for Portfolio Loans and Loans Serviced for Others(60 or More Days Delinquent)
Investor Loan Type3 Months after Modification
6 Months after Modification
9 Months after Modification
12 Months after Modification
Fannie Mae 21.2% 41.1% 50.4% 58.3%
Freddie Mac 26.5% 44.2% 53.5% 59.9%
Government-Guaranteed
26.3% 49.1% 61.4% 67.1%
Private 32.3% 46.4% 55.4% 61.3%
Portfolio Loans 9.8% 20.2% 29.9% 36.8%
Overall 24.5% 39.9% 50.1% 57.1%
*Data include all modifications implemented since January 1, 2008 that have had time to age the indicatednumber of months.
- 7 -
8/9/2019 OCC and OTS Mortgage Metrics Report First Quarter 2010
http://slidepdf.com/reader/full/occ-and-ots-mortgage-metrics-report-first-quarter-2010 8/59
8/9/2019 OCC and OTS Mortgage Metrics Report First Quarter 2010
http://slidepdf.com/reader/full/occ-and-ots-mortgage-metrics-report-first-quarter-2010 9/59
OCC and OTS Mortgage Metrics Report, First Quarter 2010
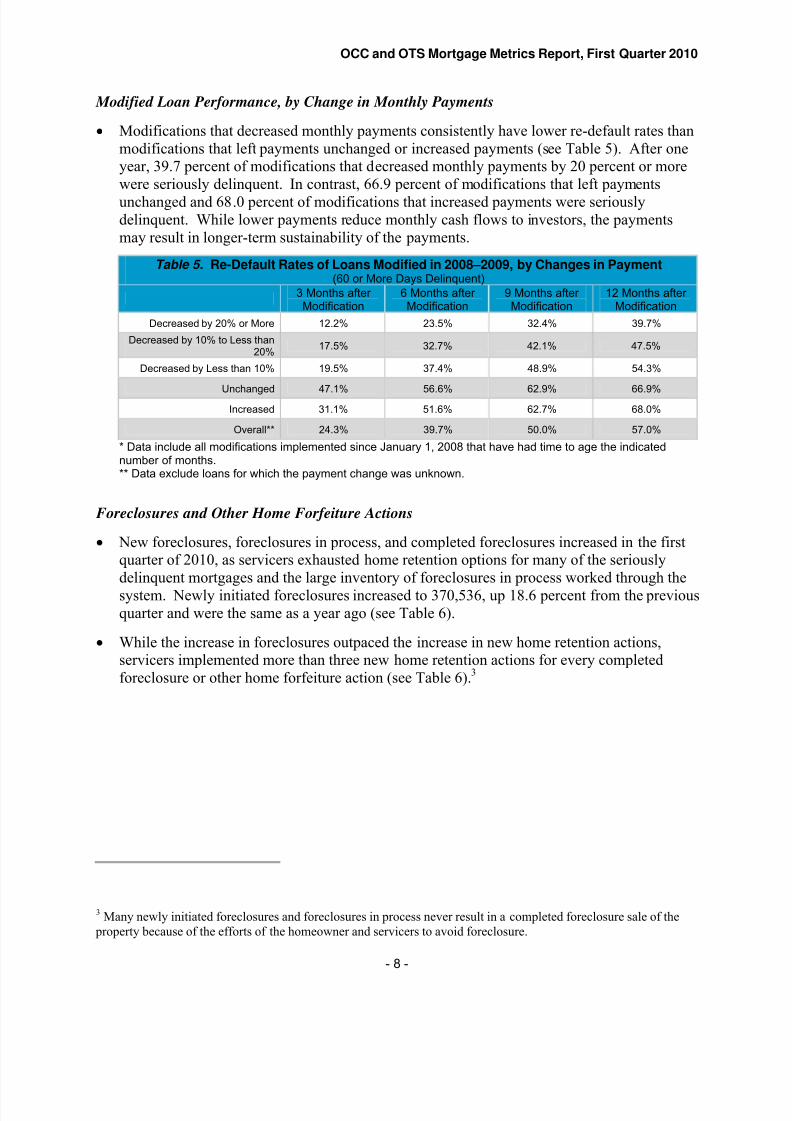
Table 6. Newly Initiated Home Retention Actions Compared with NewHome Forfeiture Actions
3/31/09 6/30/09 9/30/09 12/31/09 3/31/101Q
%Change1Y
%Change
Newly Initiated HomeRetention Actions
390,204 418,537 695,746 597,243 629,678 5.4% 61.4%
Newly InitiatedForeclosures
370,567 369,226 369,209 312,520 370,536 18.6% 0.0%
CompletedForeclosures and
Other HomeForfeiture Actions
110,612 132,252 150,605 167,496 194,886 16.4% 76.2%
Newly Initiated HomeRetention
Actions/NewlyInitiated Foreclosures
105.3% 113.4% 188.4% 191.1% 169.9% −11.1% 61.4%
Newly Initiated HomeRetention Actions/
CompletedForeclosures and
Other Home
Forfeiture Actions
352.8% 316.5% 462.0% 356.6% 323.1% −9.4% −8.4%
Short sales continued to grow as an alternative to foreclosure, increasing 9.2 percent to41,033—more than doubling from a year ago (see Table 7). Completed foreclosuresincreased 18.5 percent from the prior quarter to 152,654, and increased 68.3 percent from ayear ago as more homes worked through the foreclosure process.
Table 7. Completed Foreclosures and Other Home Forfeiture Actions
3/31/09 6/30/09 9/30/09 12/31/09 3/31/101Q
%Change1Y
%Change
New Short Sales 18,619 25,128 30,766 37,583 41,033 9.2% 120.4%
New Deed-in-Lieu-
of-ForeclosureActions
1,298 1,120 1,233 1,054 1,202 14.0%−
7.4%
CompletedForeclosures
90,695 106,004 106,207 128,859 152,654 18.5% 68.3%
Total 110,612 132,252 138,206 167,496 194,889 16.4% 76.2%
- 9 -
8/9/2019 OCC and OTS Mortgage Metrics Report First Quarter 2010
http://slidepdf.com/reader/full/occ-and-ots-mortgage-metrics-report-first-quarter-2010 10/59
OCC and OTS Mortgage Metrics Report, First Quarter 2010
About Mortgage Metrics
The OCC and OTS Mortgage Metrics Report presents data on first-lien residential mortgagesserviced by national banks and thrifts, focusing on credit performance, loss mitigation efforts,and foreclosures. The OCC and OTS collect these data from the nine national banks and twothrifts
4with the largest mortgage-servicing portfolios among national banks and thrifts. The data
represent more than 64 percent of all first-lien residential mortgages outstanding in the country.More than 90 percent of the mortgages in the portfolio were serviced for third parties because of loan sales and securitization. At the end of March 2010, the reporting institutions servicedalmost 34 million first-lien mortgage loans, totaling nearly $6 trillion in outstanding balances.
The loans reflected in this report represent a large percentage of the overall mortgage industry, but they do not represent a statistically random sample of all mortgage loans. The characteristicsof these loans differ from the overall population of mortgages. This report does not attempt toquantify or adjust for known seasonal effects that occur within the mortgage industry.
In addition to providing information to the public, the data support the supervision of national bank and thrift mortgage practices. Examiners use the data to help assess emerging trends,identify anomalies, compare servicers with peers, evaluate asset quality and necessary loan-lossreserves, and evaluate loss mitigation actions.
The report promotes the use of standardized terms and elements, which allow better comparisonsacross the industry and over time. The report uses standardized definitions for prime, Alt-A, andsubprime mortgages based on commonly used credit score ranges.
The OCC, OTS, and the participating institutions devote significant resources to ensuring thatthe information is reliable and accurate. Steps to ensure the validity of the data includecomparisons with institutions’ quarterly call and thrift financial reports, internal quality reviewsconducted by the banks and thrifts, as well as with data supplied by participating banks andaggregated by an external vendor to support this report. Data sets of this size and scopeinevitably suffer from a degree of inconsistency, missing data, and other imperfections. Thisreport notes cases in which data anomalies may have affected the results. The OCC and OTSrequire prior data submissions to be adjusted when errors and omissions are detected. In somecases, data presented in this report reflect resubmissions from institutions that restate and correctearlier information.
New in This Report
The report includes new details and analysis on the performance of modifications made over the past two years, including:
Details showing the difference in performance of modifications by investor for modificationsmade during 2008 and 2009 (see Tables 35 and 36).
4 The nine banks are Bank of America, JPMorgan Chase, Citibank, HSBC, MetLife, National City, U.S. Bank,Wachovia, and Wells Fargo. The thrifts are Merrill Lynch and OneWest Bank (formerly IndyMac). MetLife Bank replaced First Tennessee as a reporting institution in January 2010. Wachovia Bank was merged into Wells Fargo National Bank in March 2010.
- 10 -
8/9/2019 OCC and OTS Mortgage Metrics Report First Quarter 2010
http://slidepdf.com/reader/full/occ-and-ots-mortgage-metrics-report-first-quarter-2010 11/59
OCC and OTS Mortgage Metrics Report, First Quarter 2010
New data comparing re-default rates (measured as 60 or more days delinquent) at 6 monthsafter modification by change to monthly payments for each quarterly vintage of modifications (see Table 40).
Analysis of the status of all modifications made over the past two years at the end of the firstquarter of 2010 (see Table 41). This shows delinquency rates by modification year and theamount of payment reduction.
In addition, this report includes more detail on HAMP modifications and their performance,including:
New details on the change in monthly principal and interest payments resulting from HAMPmodifications (see Table 30).
Comparison of the performance of HAMP modifications with modifications overall (seeTable 38).
Additional detail in Appendix B on the volume of trial period plans, including HAMP trial
plans and other trial plans, implemented by reporting servicers.
Definitions and Method
The report uses standard definitions for three categories of mortgage creditworthiness based onthe following ranges of borrowers’ credit scores at the time of origination:
Prime —660 and above.
Alt-A —620 to 659.
Subprime —below 620.
Approximately 14 percent of mortgages in the portfolio were not accompanied by credit scores
and are classified as “other.” This group includes a mix of prime, Alt-A, and subprimemortgages. In large part, the lack of credit scores results from acquisitions of portfolios fromthird parties for which borrower credit scores at origination were not available.
Additional definitions include:
Completed foreclosures —Ownership of properties is transferred to servicers or investors. The ultimate result is the loss of borrowers’ homes because of nonpayment.
Deed-in-lieu-of-foreclosure actions —Borrowers transfer ownership of the properties(deeds) to servicers in full satisfaction of the outstanding mortgage debt to lessen theadverse impact of the debt on borrowers’ credit records. Deed-in-lieu-of-foreclosure
actions typically have less adverse impact than foreclosure on borrowers’ credit records.
Foreclosures in process —Number of mortgages for which servicers have begun formalforeclosure proceedings but have not yet completed the process resulting in the loss of borrowers’ homes. The foreclosure process varies by state and can take 15 months or more to complete. Many foreclosures in process never result in the loss of borrowers’homes because servicers simultaneously pursue other loss mitigation actions and borrowers may act to return their mortgages to current and performing status.
- 11 -
8/9/2019 OCC and OTS Mortgage Metrics Report First Quarter 2010
http://slidepdf.com/reader/full/occ-and-ots-mortgage-metrics-report-first-quarter-2010 12/59
OCC and OTS Mortgage Metrics Report, First Quarter 2010
Government-guaranteed mortgages —Government-guaranteed mortgages include allmortgages with an explicit guaranty from the U.S. government, including the FederalHousing Administration (FHA), the Department of Veterans Affairs (VA), and certainother departments. These loans may be held in pools backing Government NationalMortgage Association (Ginnie Mae) securities or owned by and/or securitized through
different investors.
Home retention actions —Home retention actions are loan modifications, trial period plans, and payment plans that allow borrowers to retain ownership and occupancy of their homes while attempting to return the loans to a current and performing status.
Loan modifications —Actions that contractually change the terms of mortgages withrespect to interest rates, maturity, principal, or other terms of the loan.
Newly initiated foreclosures —Mortgages for which the servicers initiate formalforeclosure proceedings during the month. Many newly initiated foreclosures do notresult in the loss of borrowers’ homes because servicers simultaneously pursue other loss
mitigation actions and borrowers may act to return their mortgages to current and performing status.
Payment plans —Short- to medium-term changes in scheduled terms and payments toreturn mortgages to a current and performing status.
Payment option adjustable rate mortgages (ARMs) —Mortgages that allow borrowersto choose a monthly payment that may reduce principal, pay interest only, or result innegative amortization, in which some amount of unpaid interest is added to the principal balance of the loan and results in an increased amount owed.
Principal deferral modifications —Modifications that remove a portion of the principalfrom the amount used to calculate monthly principal and interest payments for a set period. The deferred amount becomes due at end of the loan term.
Principal reduction modifications —Modifications that permanently forgive a portion of the principal amount owed on a mortgage.
Re-default rates —Percentage of modified loans that subsequently become delinquent or enter the foreclosure process. As alternative measures of delinquency, this report presents re-default rates using 30, 60, and 90 or more days delinquent and in process of foreclosure but focuses most often on the 60-day-delinquent measure.
5
Seriously delinquent loans —Mortgages that are 60 or more days past due and allmortgages held by bankrupt borrowers whose payments are 30 or more days past due.
Short sales —Sales of the mortgaged properties at prices that net less than the totalamount due on the mortgages. Servicers and borrowers negotiate repayment programs,
5 Some servicers have offered modification programs that do not reset or “re-age” delinquency status followingmodification. Loans in this category represent a small percentage of total loan modifications.
- 12 -
8/9/2019 OCC and OTS Mortgage Metrics Report First Quarter 2010
http://slidepdf.com/reader/full/occ-and-ots-mortgage-metrics-report-first-quarter-2010 13/59
OCC and OTS Mortgage Metrics Report, First Quarter 2010
forbearance, and/or forgiveness for any remaining deficiency on the debt. Short salestypically have less adverse impact than foreclosure on borrowers’ credit records.
Trial period plans —Home retention actions that allow borrowers to demonstratecapability and willingness to pay their modified mortgages for a set period of time. Theaction becomes a permanent loan modification following the successful completion of the
trial period.
Loan delinquencies are reported using the Mortgage Bankers Association convention that a loanis past due when a scheduled payment is unpaid for 30 days or more. The statistics andcalculated ratios are based on the number of loans rather than on the dollar amount outstanding.
Percentages are rounded to one decimal unless the result is less than 0.1 percent, which arerounded to two decimal places. The report uses whole numbers when approximating.
In tables throughout this report, the quarters are indicated by the last day of the quarter (e.g.,3/31/10), quarter-to-quarter changes are shown under the column “1Q %Change,” and year-to-year changes are shown under the column “1Y %Change.”
In tables throughout this report, percentages shown under “1Q %Change” and “1Y %Change”are calculated using unrounded values for each quarter. Calculating these percentages from therounded values shown in the table may yield materially different values.
Mortgage Metrics data may not agree with other published data because of timing delays inupdating servicer-processing systems.
- 13 -
8/9/2019 OCC and OTS Mortgage Metrics Report First Quarter 2010
http://slidepdf.com/reader/full/occ-and-ots-mortgage-metrics-report-first-quarter-2010 14/59
OCC and OTS Mortgage Metrics Report, First Quarter 2010
PART I: Mortgage Performance
Part I describes the performance of the entire mortgage portfolio, and, separately, the performance of government-guaranteed mortgages, mortgages serviced for the government-sponsored enterprises (GSEs), option ARMs, and for each loan risk category.
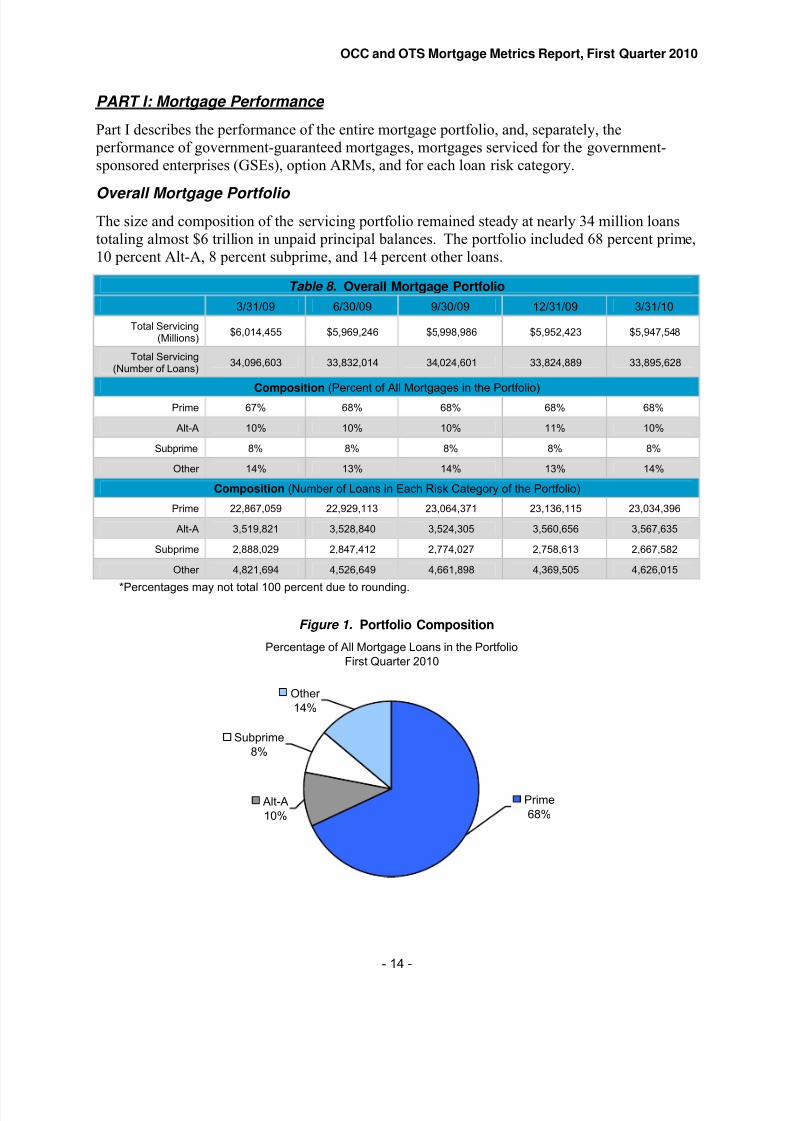
Overall Mortgage Portfolio The size and composition of the servicing portfolio remained steady at nearly 34 million loanstotaling almost $6 trillion in unpaid principal balances. The portfolio included 68 percent prime,10 percent Alt-A, 8 percent subprime, and 14 percent other loans.
Table 8. Overall Mortgage Portfolio
3/31/09 6/30/09 9/30/09 12/31/09 3/31/10
Total Servicing(Millions)
$6,014,455 $5,969,246 $5,998,986 $5,952,423 $5,947,548
Total Servicing(Number of Loans)
34,096,603 33,832,014 34,024,601 33,824,889 33,895,628
Composition (Percent of All Mortgages in the Portfolio)Prime 67% 68% 68% 68% 68%
Alt-A 10% 10% 10% 11% 10%
Subprime 8% 8% 8% 8% 8%
Other 14% 13% 14% 13% 14%
Composition (Number of Loans in Each Risk Category of the Portfolio)
Prime 22,867,059 22,929,113 23,064,371 23,136,115 23,034,396
Alt-A 3,519,821 3,528,840 3,524,305 3,560,656 3,567,635
Subprime 2,888,029 2,847,412 2,774,027 2,758,613 2,667,582
Other 4,821,694 4,526,649 4,661,898 4,369,505 4,626,015
*Percentages may not total 100 percent due to rounding.
Figure 1. Portfolio Composition
Percentage of All Mortgage Loans in the Portfolio
First Quarter 2010
Other
Alt-A
10%
Subprime
8%
14%
Prime
68%
- 14 -

8/9/2019 OCC and OTS Mortgage Metrics Report First Quarter 2010
http://slidepdf.com/reader/full/occ-and-ots-mortgage-metrics-report-first-quarter-2010 15/59
OCC and OTS Mortgage Metrics Report, First Quarter 2010
Overall Mortgage Performance
The percentage of current and performing mortgages increased to 87.3 percent at the end of thefirst quarter of 2010, the first quarter-over-quarter improvement since March of 2008. The percentages of mortgages 30–59 days delinquent, 60–89 days delinquent, and 90 or more daysdelinquent all improved during the quarter. The percentage of seriously delinquent mortgages,
those loans 60 or more days delinquent and mortgages to bankrupt borrowers more than 30 daysdelinquent, declined by 7.7 percent during the first quarter to 6.5 percent of total servicedmortgages.
Meanwhile, foreclosures in process increased during the first quarter of 2010 to 3.5 percent of total serviced mortgages. This 8.2 percent increase in foreclosures in process resulted from newforeclosures exceeding the number of completed foreclosures and other resolutions during thequarter. More mortgages remain in the foreclosure pipeline for longer periods because of thehigh volume of loans working through the process and continuing efforts to prevent avoidableforeclosures. Thus, not all foreclosures in process result in completed foreclosures as borrowersand servicers often work out other resolutions while in the foreclosure process.
While servicers report some optimism about the improvement in delinquencies from the fourthquarter of 2009 and the potential for this improvement to continue, this report does not quantifyknown seasonal effects that historically have resulted in lower delinquency rates in the firstquarter compared with preceding quarters. This report also does not quantify the affects of HAMP and trial payment plans converting to permanent modifications, which positively affectedreported delinquency rates.
Table 9. Overall Portfolio Performance(Percentage of All Mortgages in the Portfolio)
3/31/09 6/30/09 9/30/09 12/31/09 3/31/101Q
%Change1Y %Change
Current and Performing 89.8% 88.6% 87.2% 86.4% 87.3% 1.0% −2.9%
30–59 Days Delinquent 2.9% 3.2% 3.4% 3.4% 2.8%−
17.7%−
3.6%
The Following Three Categories Are Classified as Seriously Delinquent:
60–89 Days Delinquent 1.4% 1.4% 1.6% 1.6% 1.3% −19.3% −7.3%
90 or More Days Delinquent 2.8% 3.2% 3.9% 4.7% 4.5% −5.1% 60.3%
Bankruptcy 30 or MoreDays Delinquent
0.6% 0.7% 0.7% 0.8% 0.8% 0.0% 26.3%
Subtotal for Seriously Delinquent
4.8% 5.3% 6.2% 7.1% 6.5% −7.7% 36.8%
Foreclosures in Process 2.5% 2.9% 3.2% 3.2% 3.5% 8.2% 36.8%
Overall Portfolio Performance (Number of Mortgages in the Portfolio)
Current and Performing 30,629,971 29,962,265 29,666,568 29,217,743 29,574,953 1.2% −3.4%
30–59 Days Delinquent 980,517 1,078,663 1,154,825 1,138,822 939,306 −17.5% −4.2%
The Following Three Categories Are Classified as Seriously Delinquent:
60–89 Days Delinquent 460,683 476,179 529,845 525,071 424,534 −19.1% −7.8%
90 or More Days Delinquent 957,135 1,093,791 1,332,228 1,604,014 1,525,662 −4.9% 59.4%
Bankruptcy 30 or MoreDays Delinquent
207,268 228,562 249,515 259,853 260,299 0.2% 25.6%
Subtotal for Seriously Delinquent
1,625,086 1,798,532 2,111,588 2,388,938 2,210,495 −7.5% 36.0%
Foreclosures in Process 861,029 992,554 1,091,620 1,079,386 1,170,874 8.5% 36.0%
- 15 -

8/9/2019 OCC and OTS Mortgage Metrics Report First Quarter 2010
http://slidepdf.com/reader/full/occ-and-ots-mortgage-metrics-report-first-quarter-2010 16/59
OCC and OTS Mortgage Metrics Report, First Quarter 2010
Figure 2. Overall Portfolio Performance
0%
2%
4%
6%
30-59 Days 60-89 Days 90 or More Days Bankruptcy 30 or Foreclosures in
Delinquent Delinquent Delinquent More Days Process
Delinquent
3/31/09 6/30/09 9/30/09 12/31/09 3/31/2010
- 16 -

8/9/2019 OCC and OTS Mortgage Metrics Report First Quarter 2010
http://slidepdf.com/reader/full/occ-and-ots-mortgage-metrics-report-first-quarter-2010 17/59
OCC and OTS Mortgage Metrics Report, First Quarter 2010
Performance of Government-Guaranteed Mortgages
Government-guaranteed mortgages performed worse than the overall servicing portfolio.Consistent with the overall portfolio, the percentage of current and performing guaranteedmortgages improved during the first quarter to 85.4 percent. Serious delinquencies decreased by18.3 percent to 7.0 percent. However, foreclosures in process rose 11.6 percent to 3.1 percent of
all government-guaranteed mortgages. Increased origination of government-guaranteedmortgages continued in the first quarter, with guaranteed loans now comprising more than17 percent of the portfolio. This growth in guaranteed mortgages is partially driving the lower delinquency rate of this portfolio of loans. Of these loans, about 78 percent were FHA loans,17 percent were VA loans, and 5 percent were other government-guaranteed mortgages. Morethan 83 percent of these mortgages were held in pools of loans backing Ginnie Mae securities.
Table 10. Performance of Government-Guaranteed* Mortgages (Percent)
3/31/09 6/30/09 9/30/09 12/31/09 3/31/101Q
%Change1Y
%Change
Current and Performing 86.2% 84.9% 83.0% 82.7% 85.4% 3.3% −1.0%
30–59 Days Delinquent 5.1% 5.7% 6.3% 5.9% 4.5% −24.7% −11.8%
The Following Three Categories Are Classified as Seriously Delinquent:
60–89 Days Delinquent 2.0% 2.3% 2.6% 2.6% 1.8% −29.6% −11.7%
90 or More Days Delinquent 3.7% 4.1% 4.4% 5.0% 4.2% −15.2% 14.0%
Bankruptcy 30 or More DaysDelinquent
1.1% 1.1% 1.1% 1.1% 1.0% −5.4% −6.5%
Subtotal for Seriously Delinquent
6.8% 7.5% 8.2% 8.6% 7.0% −18.3% 3.1%
Foreclosures in Process 1.9% 2.0% 2.5% 2.8% 3.1% 11.6% 65.8%
Performance of Government-Guaranteed Mortgages (Number)
Current and Performing 3,897,209 4,056,662 4,376,413 4,602,510 4,991,326 8.4% 28.1%
30–59 Days Delinquent 229,575 271,651 333,614 331,188 261,986 −20.9% 14.1%
The Following Three Categories Are Classified as Seriously Delinquent:
60–89 Days Delinquent 91,936 110,407 139,019 142,114 105,019 −26.1% 14.2%
90 or More Days Delinquent 167,555 194,934 233,914 277,617 247,105 −11.0% 47.5%
Bankruptcy 30 or More DaysDelinquent
48,878 51,277 56,848 59,499 59,084 −0.7% 20.9%
Subtotal for Seriously Delinquent
308,369 356,618 429,781 479,230 411,208 −14.2% 33.3%
Foreclosures in Process 83,937 93,231 132,713 153,637 179,948 17.1% 114.4%
*Percentages may not total 100 due to rounding.
Figure 3. Performance of Government-Guaranteed Mortgages
0%
2%
4%
6%
8%
30-59 Days 60-89 Days 90 or More Days Bankruptcy 30 or Foreclosures in
Delinquent Delinquent Delinquent More Days Process
Delinquent
3/31/09 6/30/09 9/30/09 12/31/09 3/31/2010
- 17 -

8/9/2019 OCC and OTS Mortgage Metrics Report First Quarter 2010
http://slidepdf.com/reader/full/occ-and-ots-mortgage-metrics-report-first-quarter-2010 18/59
OCC and OTS Mortgage Metrics Report, First Quarter 2010
Performance of GSE Mortgages
Mortgages serviced for Fannie Mae and Freddie Mac (GSEs) have more prime mortgages thanthose serviced for private investors or held on the servicers’ balance sheets. As a result, thesemortgages performed better. In the first quarter of 2010, current and performing GSE loansincreased to 91.8 percent, compared with 87.3 percent for the overall portfolio and 85.4 percent
for government-guaranteed mortgages. Seriously delinquent GSE loans declined to 4.3 percent.However, foreclosures in process increased to 2.0 percent, a 7.4 percent increase from the prior quarter and almost 44 percent more than a year ago. Mortgages serviced for these agencies madeup about 63 percent of the overall servicing portfolio. Of the GSE mortgages, about58 percent were serviced for Fannie Mae, and 42 percent were serviced for Freddie Mac.
Table 11. Performance of GSE Mortgages (Percent)
3/31/09 6/30/09 9/30/09 12/31/09 3/31/101Q
%Change1Y
%Change
Current and Performing 94.1% 93.1% 92.1% 91.3% 91.8% 0.6% −2.5%
30–59 Days Delinquent 1.9% 2.2% 2.2% 2.3% 1.9% −17.5% −2.1%*
The Following Three Categories Are Classified as Seriously Delinquent:
60–89 Days Delinquent 0.8% 0.9% 1.0% 1.0% 0.8% −15.4% 0.9%
90 or More Days Delinquent 1.4% 1.8% 2.5% 3.1% 3.1% −2.8% 116.1%
Bankruptcy 30 or More DaysDelinquent
0.3% 0.3% 0.4% 0.4% 0.4% 1.6% 49.6%
Subtotal for Seriously Delinquent
2.5% 3.0% 3.9% 4.6% 4.3% −5.1% 70.5%
Foreclosures in Process 1.4% 1.7% 1.8% 1.8% 2.0% 7.4% 43.8%
Performance of GSE Mortgages (Number)
Current and Performing 20,492,967 20,000,848 19,775,288 19,361,573 19,471,020 0.6% −5.0%
30–59 Days Delinquent 423,874 464,532 480,320 490,139 404,565 −17.5% −4.6%
The Following Three Categories Are Classified as Seriously Delinquent:
60–89 Days Delinquent 183,036 191,608 210,156 212,754 179,974−
15.4%−
1.7%
90 or More Days Delinquent 307,978 386,351 538,299 667,075 648,649 −2.8% 110.6%
Bankruptcy 30 or More DaysDelinquent
62,757 72,845 84,192 89,985 91,482 1.7% 45.8%
Subtotal for Seriously Delinquent
553,771 650,804 832,647 969,814 920,105 −5.1% 66.2%
Foreclosures in Process 299,755 368,336 390,664 391,042 420,049 7.4% 40.1%
*The unrounded percentages for mortgages that were 30–59 days delinquent resulted in the 2.1 percentdecrease between March 31, 2009 and March 31, 2010.
Figure 4. Performance of GSE Mortgages
0%
1%
2%
3%
4%
30-59 Days 60-89 Days 90 or More Days Bankruptcy 30 or Foreclosures in
Delinquent Delinquent Delinquent More Days Delinquent Process
3/31/09 6/30/09 9/30/09 12/31/09 3/31/2010
- 18 -
8/9/2019 OCC and OTS Mortgage Metrics Report First Quarter 2010
http://slidepdf.com/reader/full/occ-and-ots-mortgage-metrics-report-first-quarter-2010 19/59
OCC and OTS Mortgage Metrics Report, First Quarter 2010
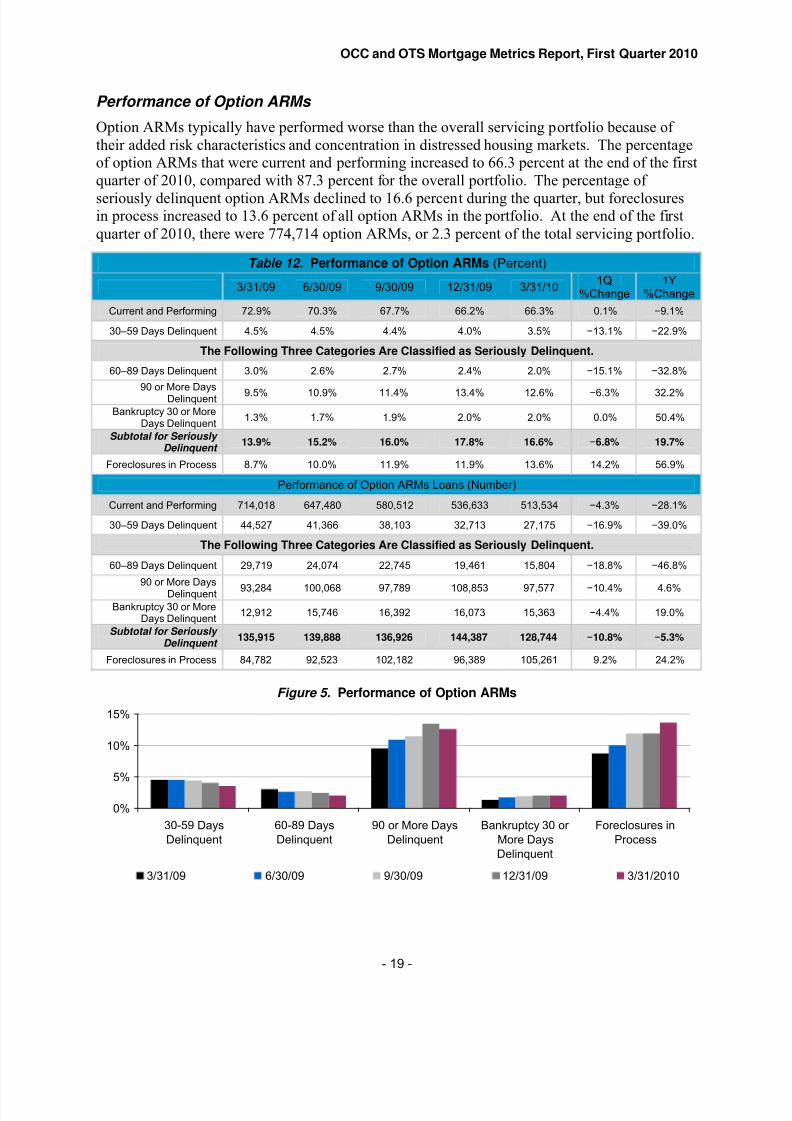
Performance of Option ARMs
Option ARMs typically have performed worse than the overall servicing portfolio because of their added risk characteristics and concentration in distressed housing markets. The percentageof option ARMs that were current and performing increased to 66.3 percent at the end of the firstquarter of 2010, compared with 87.3 percent for the overall portfolio. The percentage of
seriously delinquent option ARMs declined to 16.6 percent during the quarter, but foreclosuresin process increased to 13.6 percent of all option ARMs in the portfolio. At the end of the firstquarter of 2010, there were 774,714 option ARMs, or 2.3 percent of the total servicing portfolio.
Table 12. Performance of Option ARMs (Percent)
3/31/09 6/30/09 9/30/09 12/31/09 3/31/101Q
%Change1Y
%Change
Current and Performing 72.9% 70.3% 67.7% 66.2% 66.3% 0.1% −9.1%
30–59 Days Delinquent 4.5% 4.5% 4.4% 4.0% 3.5% −13.1% −22.9%
The Following Three Categories Are Classified as Seriously Delinquent.
60–89 Days Delinquent 3.0% 2.6% 2.7% 2.4% 2.0% −15.1% −32.8%
90 or More DaysDelinquent 9.5% 10.9% 11.4% 13.4% 12.6%
−6.3% 32.2%
Bankruptcy 30 or MoreDays Delinquent
1.3% 1.7% 1.9% 2.0% 2.0% 0.0% 50.4%
Subtotal for Seriously Delinquent
13.9% 15.2% 16.0% 17.8% 16.6% −6.8% 19.7%
Foreclosures in Process 8.7% 10.0% 11.9% 11.9% 13.6% 14.2% 56.9%
Performance of Option ARMs Loans (Number)
Current and Performing 714,018 647,480 580,512 536,633 513,534 −4.3% −28.1%
30–59 Days Delinquent 44,527 41,366 38,103 32,713 27,175 −16.9% −39.0%
The Following Three Categories Are Classified as Seriously Delinquent.
60–89 Days Delinquent 29,719 24,074 22,745 19,461 15,804 −18.8% −46.8%
90 or More DaysDelinquent 93,284 100,068 97,789 108,853 97,577
−10.4% 4.6%
Bankruptcy 30 or MoreDays Delinquent
12,912 15,746 16,392 16,073 15,363 −4.4% 19.0%
Subtotal for Seriously Delinquent
135,915 139,888 136,926 144,387 128,744 −10.8% −5.3%
Foreclosures in Process 84,782 92,523 102,182 96,389 105,261 9.2% 24.2%
Figure 5. Performance of Option ARMs
0%
5%
10%
15%
30-59 Days 60-89 Days 90 or More Days Bankruptcy 30 or Foreclosures in
Delinquent Delinquent Delinquent More Days Process
Delinquent
3/31/09 6/30/09 9/30/09 12/31/09 3/31/2010
- 19 -
8/9/2019 OCC and OTS Mortgage Metrics Report First Quarter 2010
http://slidepdf.com/reader/full/occ-and-ots-mortgage-metrics-report-first-quarter-2010 20/59
OCC and OTS Mortgage Metrics Report, First Quarter 2010
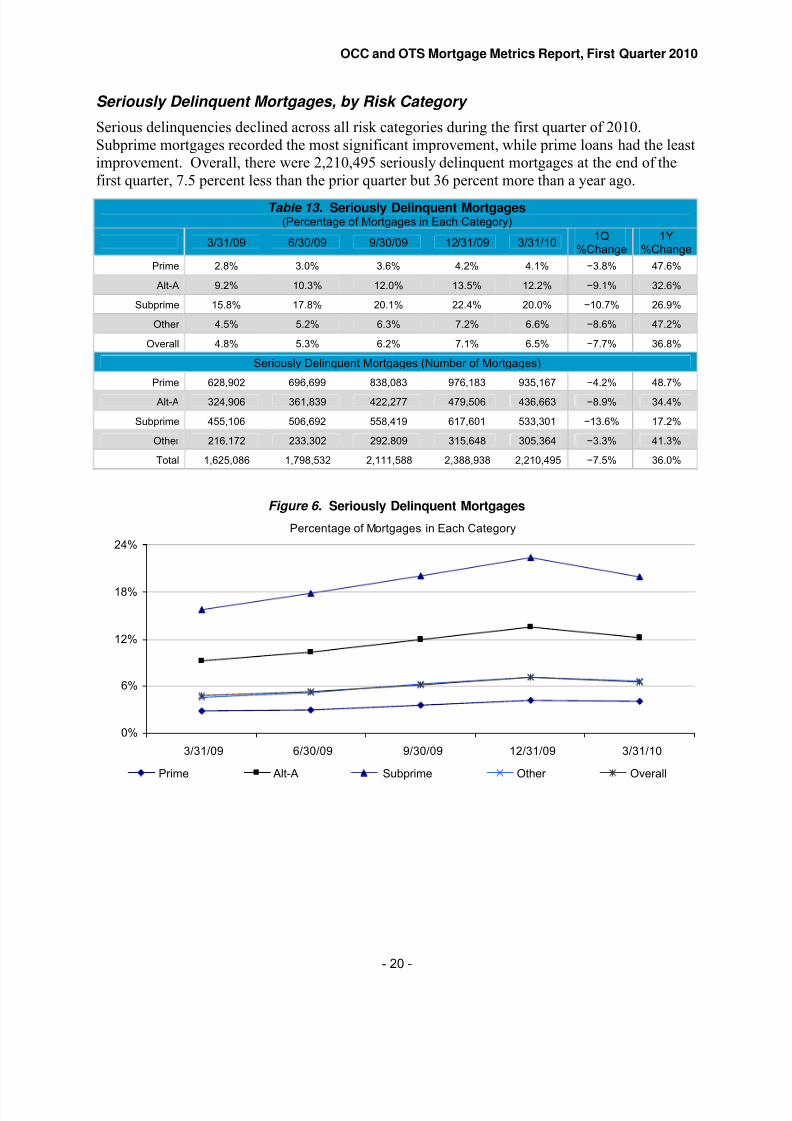
Seriously Delinquent Mortgages, by Risk Category
Serious delinquencies declined across all risk categories during the first quarter of 2010.Subprime mortgages recorded the most significant improvement, while prime loans had the leastimprovement. Overall, there were 2,210,495 seriously delinquent mortgages at the end of thefirst quarter, 7.5 percent less than the prior quarter but 36 percent more than a year ago.
Table 13. Seriously Delinquent Mortgages(Percentage of Mortgages in Each Category)
3/31/09 6/30/09 9/30/09 12/31/09 3/31/101Q
%Change1Y
%Change
Prime 2.8% 3.0% 3.6% 4.2% 4.1% −3.8% 47.6%
Alt-A 9.2% 10.3% 12.0% 13.5% 12.2% −9.1% 32.6%
Subprime 15.8% 17.8% 20.1% 22.4% 20.0% −10.7% 26.9%
Other 4.5% 5.2% 6.3% 7.2% 6.6% −8.6% 47.2%
Overall 4.8% 5.3% 6.2% 7.1% 6.5% −7.7% 36.8%
Seriously Delinquent Mortgages (Number of Mortgages)
Prime 628,902 696,699 838,083 976,183 935,167 −4.2% 48.7%
Alt-A 324,906 361,839 422,277 479,506 436,663 −8.9% 34.4%
Subprime 455,106 506,692 558,419 617,601 533,301 −13.6% 17.2%
Other 216,172 233,302 292,809 315,648 305,364 −3.3% 41.3%
Total 1,625,086 1,798,532 2,111,588 2,388,938 2,210,495 −7.5% 36.0%
Figure 6. Seriously Delinquent Mortgages
Percentage of Mortgages in Each Category
0%
6%
12%
18%
24%
3/31/09 6/30/09 9/30/09 12/31/09 3/31/10
Prime Alt-A Subprime Other Overall
- 20 -
8/9/2019 OCC and OTS Mortgage Metrics Report First Quarter 2010
http://slidepdf.com/reader/full/occ-and-ots-mortgage-metrics-report-first-quarter-2010 21/59
OCC and OTS Mortgage Metrics Report, First Quarter 2010
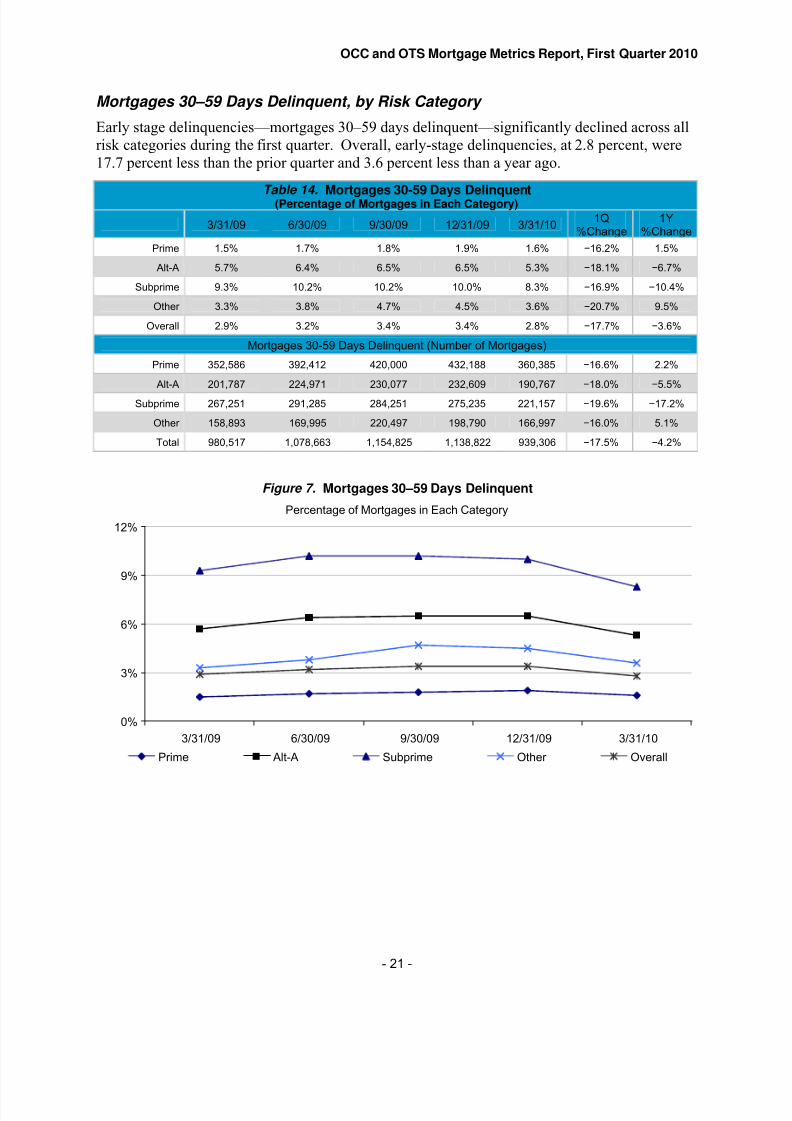
Mortgages 30–59 Days Delinquent, by Risk Category
Early stage delinquencies—mortgages 30–59 days delinquent—significantly declined across allrisk categories during the first quarter. Overall, early-stage delinquencies, at 2.8 percent, were17.7 percent less than the prior quarter and 3.6 percent less than a year ago.
Table 14. Mortgages 30-59 Days Delinquent(Percentage of Mortgages in Each Category)
3/31/09 6/30/09 9/30/09 12/31/09 3/31/101Q
%Change1Y
%Change
Prime 1.5% 1.7% 1.8% 1.9% 1.6% −16.2% 1.5%
Alt-A 5.7% 6.4% 6.5% 6.5% 5.3% −18.1% −6.7%
Subprime 9.3% 10.2% 10.2% 10.0% 8.3% −16.9% −10.4%
Other 3.3% 3.8% 4.7% 4.5% 3.6% −20.7% 9.5%
Overall 2.9% 3.2% 3.4% 3.4% 2.8% −17.7% −3.6%
Mortgages 30-59 Days Delinquent (Number of Mortgages)
Prime 352,586 392,412 420,000 432,188 360,385 −16.6% 2.2%
Alt-A 201,787 224,971 230,077 232,609 190,767 −18.0% −5.5%
Subprime 267,251 291,285 284,251 275,235 221,157 −19.6% −17.2%
Other 158,893 169,995 220,497 198,790 166,997 −16.0% 5.1%
Total 980,517 1,078,663 1,154,825 1,138,822 939,306 −17.5% −4.2%
Figure 7. Mortgages 30–59 Days Delinquent
Percentage of Mortgages in Each Category
0%
3%
6%
9%
12%
3/31/09 6/30/09 9/30/09 12/31/09 3/31/10
Prime Alt-A Subprime Other Overall
- 21 -

8/9/2019 OCC and OTS Mortgage Metrics Report First Quarter 2010
http://slidepdf.com/reader/full/occ-and-ots-mortgage-metrics-report-first-quarter-2010 22/59
OCC and OTS Mortgage Metrics Report, First Quarter 2010
PART II: Home Retention Actions
Home retention actions include loan modifications, in which servicers modify one or moremortgage contract terms; trial period plans, in which the loans will be converted to modificationsupon successful underwriting and completion of the trial periods; and payment plans, in whichno terms are contractually modified, but borrowers are given time to catch up on missed
payments. All of these actions are intended to enable the borrower to attain paymentsustainability and retain the home.
- 22 -
8/9/2019 OCC and OTS Mortgage Metrics Report First Quarter 2010
http://slidepdf.com/reader/full/occ-and-ots-mortgage-metrics-report-first-quarter-2010 23/59
OCC and OTS Mortgage Metrics Report, First Quarter 2010
A. Loan Modifications, Trial Period Plans, and Payment Plans
Newly Initiated Home Retention Actions
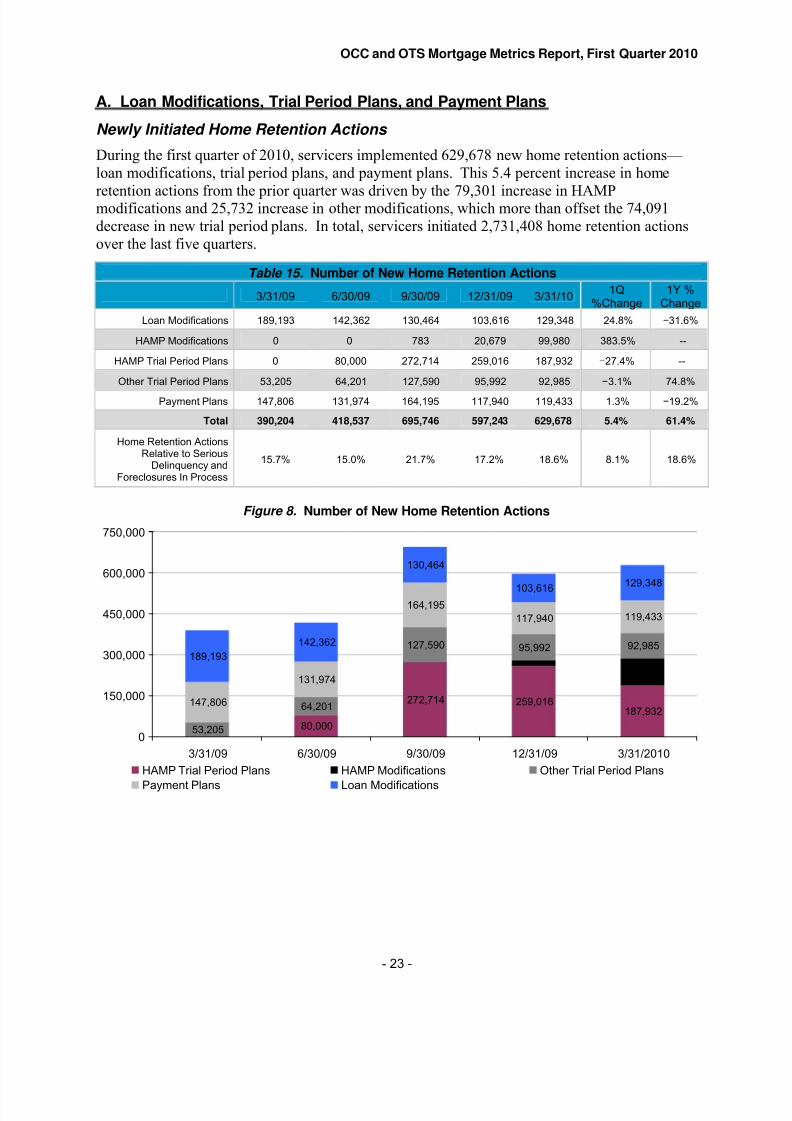
During the first quarter of 2010, servicers implemented 629,678 new home retention actions— loan modifications, trial period plans, and payment plans. This 5.4 percent increase in home
retention actions from the prior quarter was driven by the 79,301 increase in HAMPmodifications and 25,732 increase in other modifications, which more than offset the 74,091decrease in new trial period plans. In total, servicers initiated 2,731,408 home retention actionsover the last five quarters.
Table 15. Number of New Home Retention Actions
3/31/09 6/30/09 9/30/09 12/31/09 3/31/101Q
%Change1Y %
Change
Loan Modifications 189,193 142,362 130,464 103,616 129,348 24.8% −31.6%
HAMP Modifications 0 0 783 20,679 99,980 383.5% --
HAMP Trial Period Plans 0 80,000 272,714 259,016 187,932 −27.4% --
Other Trial Period Plans 53,205 64,201 127,590 95,992 92,985 −3.1% 74.8%
Payment Plans 147,806 131,974 164,195 117,940 119,433 1.3% −19.2%
Total 390,204 418,537 695,746 597,243 629,678 5.4% 61.4%
Home Retention ActionsRelative to Serious
Delinquency andForeclosures In Process
15.7% 15.0% 21.7% 17.2% 18.6% 8.1% 18.6%
Figure 8. Number of New Home Retention Actions
80,000
272,714 259,016187,932
99,980
53,205
64,201
127,590 95,992 92,985
147,806
131,974
164,195
117,940 119,433
189,193
142,362
130,464
103,616129,348
0
150,000
300,000
450,000
600,000
750,000
3/31/09 6/30/09 9/30/09 12/31/09 3/31/2010
HAMP Trial Period Plans HAMP Modifications Other Trial Period Plans
Payment Plans Loan Modifications
- 23 -
8/9/2019 OCC and OTS Mortgage Metrics Report First Quarter 2010
http://slidepdf.com/reader/full/occ-and-ots-mortgage-metrics-report-first-quarter-2010 24/59
OCC and OTS Mortgage Metrics Report, First Quarter 2010
HAMP Modifications and Trial Period Plans, by Investor and Risk Category
Servicers implemented 99,980 HAMP modifications during the first quarter of 2010, up morethan 383 percent from the 20,679 implemented during the fourth quarter of 2009, as anincreasing number of borrowers successfully completed trial plans. Nearly two-thirds of HAMPmodifications made in the first quarter of 2010 went to mortgages serviced for Fannie Mae and
Freddie Mac mortgages. Prime loans received about half of all HAMP modifications, whilesubprime loans received less than a quarter of these modification actions.
Table 16. HAMP Modifications, by Investor and Risk Category(Modifications implemented in the first quarter of 2010)
Fannie Mae Freddie MacGovernment-Guaranteed
Portfolio Private Total
Prime 23,930 14,857 1 4,223 6,860 49,871
Alt-A 9,036 4,238 1 2,281 5,185 20,741
Subprime 5,594 2,090 4 3,639 9,590 20,917
Other 5,116 1,658 0 545 1,132 8,451
Total 43,676 22,843 6 10,688 22,767 99,980
Servicers implemented 187,932 new HAMP trial period plans during the quarter, a decrease of nearly 28 percent from the 259,410 trial plans initiated in the prior quarter. Servicers report thatthe decrease in HAMP trial plans reflected both the continuing reduction from the initial surge of new activity in the second and the third quarters of 2009 as well as servicers increasinglyrequiring all necessary documentation before starting a new trial plan. Prime mortgages receivedmore than half of the plans implemented in the first quarter of 2010. Alt-A and subprimemortgages received less than a quarter of the HAMP trial plans implemented in the first quarter of 2010. About two-thirds of HAMP trial period plans initiated during the first quarter were for Fannie Mae or Freddie Mac mortgages, slightly greater than the GSE share of the overallserviced portfolio.
Table 17. HAMP Trial Period Plans, by Investor and Risk Category(Trial plans implemented in the first quarter of 2010)
Fannie Mae Freddie MacGovernment-Guaranteed
Portfolio Private Total
Prime 45,692 30,562 4 8,969 16,562 101,789
Alt-A 13,422 9,504 5 5,948 9,193 38,072
Subprime 8,260 4,711 12 7,842 13,567 34,392
Other 6,779 2,365 11 1,002 3,522 13,679
Total 74,153 47,142 32 23,761 42,844 187,932
- 24 -
8/9/2019 OCC and OTS Mortgage Metrics Report First Quarter 2010
http://slidepdf.com/reader/full/occ-and-ots-mortgage-metrics-report-first-quarter-2010 25/59
OCC and OTS Mortgage Metrics Report, First Quarter 2010
Newly Initiated Home Retention Actions Relative to Newly Initiated Foreclosures
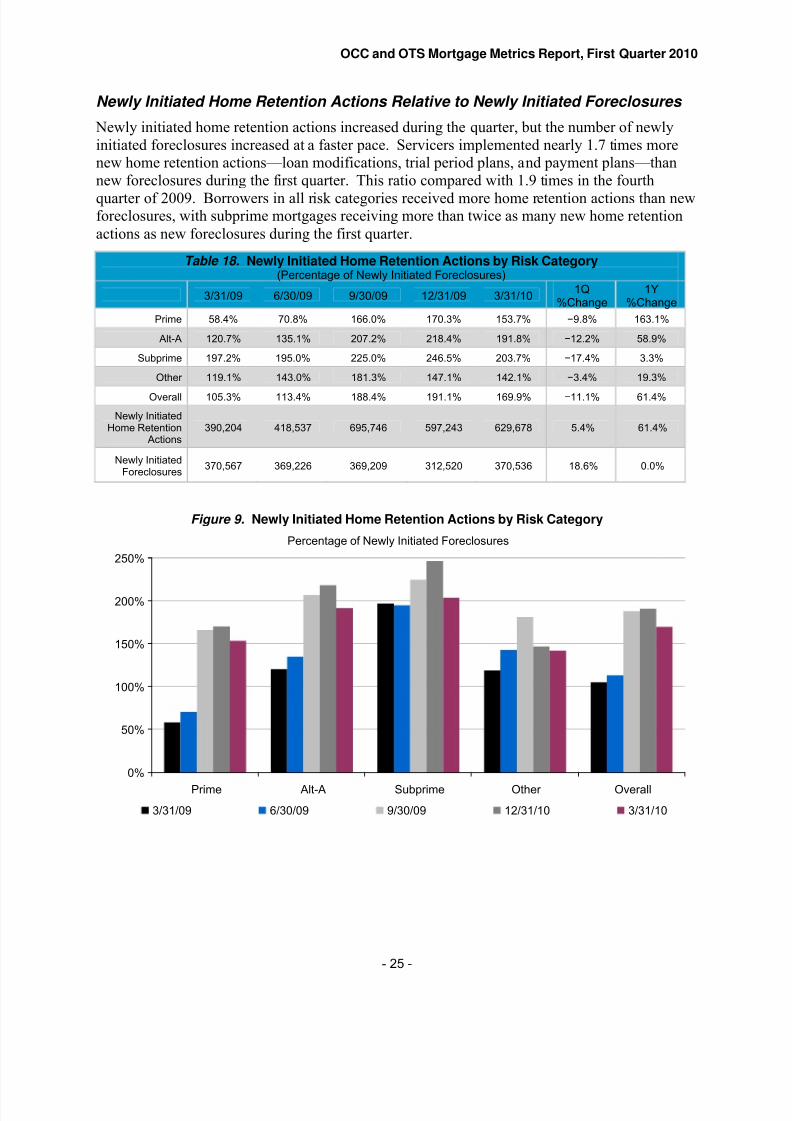
Newly initiated home retention actions increased during the quarter, but the number of newlyinitiated foreclosures increased at a faster pace. Servicers implemented nearly 1.7 times morenew home retention actions—loan modifications, trial period plans, and payment plans—thannew foreclosures during the first quarter. This ratio compared with 1.9 times in the fourth
quarter of 2009. Borrowers in all risk categories received more home retention actions than newforeclosures, with subprime mortgages receiving more than twice as many new home retentionactions as new foreclosures during the first quarter.
Table 18. Newly Initiated Home Retention Actions by Risk Category(Percentage of Newly Initiated Foreclosures)
3/31/09 6/30/09 9/30/09 12/31/09 3/31/101Q
%Change1Y
%Change
Prime 58.4% 70.8% 166.0% 170.3% 153.7% −9.8% 163.1%
Alt-A 120.7% 135.1% 207.2% 218.4% 191.8% −12.2% 58.9%
Subprime 197.2% 195.0% 225.0% 246.5% 203.7% −17.4% 3.3%
Other 119.1% 143.0% 181.3% 147.1% 142.1% −3.4% 19.3%
Overall 105.3% 113.4% 188.4% 191.1% 169.9%−
11.1% 61.4%
Newly InitiatedHome Retention
Actions390,204 418,537 695,746 597,243 629,678 5.4% 61.4%
Newly InitiatedForeclosures
370,567 369,226 369,209 312,520 370,536 18.6% 0.0%
Figure 9. Newly Initiated Home Retention Actions by Risk Category
Percentage of Newly Initiated Foreclosures
0%
50%
100%
150%
200%
250%
Prime Alt-A Subprime Other Overall
3/31/09 6/30/09 9/30/09 12/31/10 3/31/10
- 25 -
8/9/2019 OCC and OTS Mortgage Metrics Report First Quarter 2010
http://slidepdf.com/reader/full/occ-and-ots-mortgage-metrics-report-first-quarter-2010 26/59
OCC and OTS Mortgage Metrics Report, First Quarter 2010
Types of Modification Actions
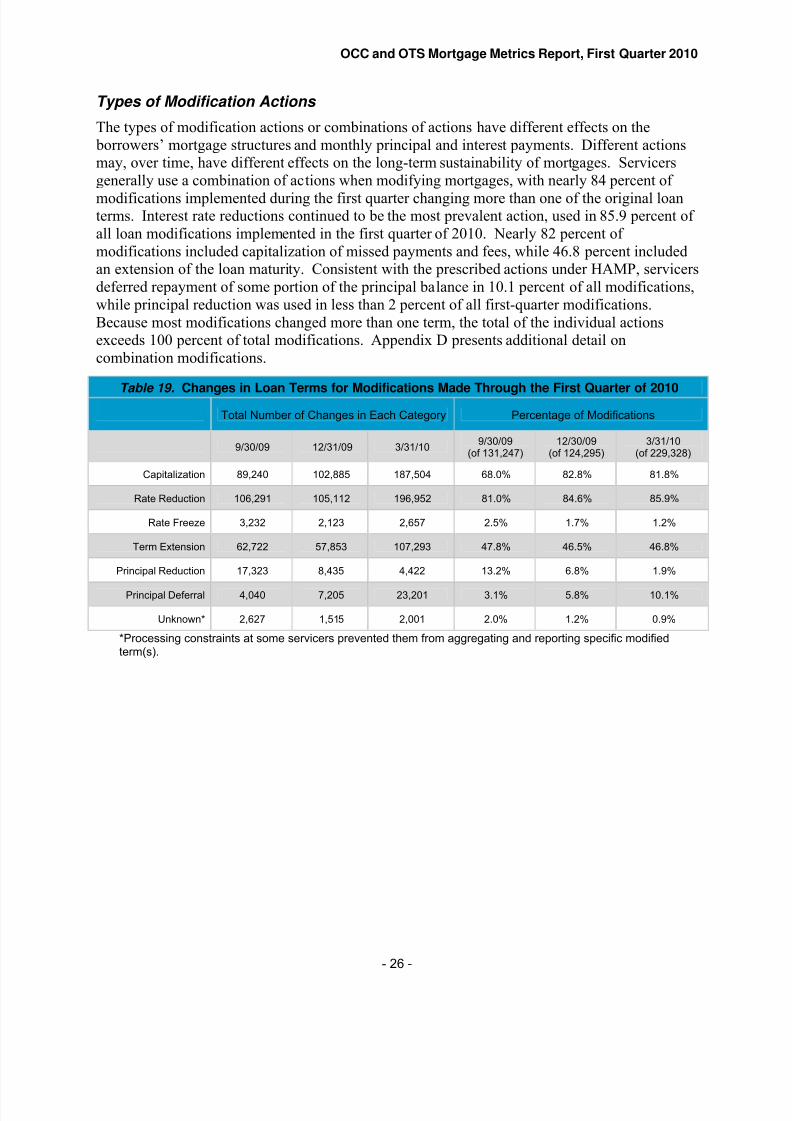
The types of modification actions or combinations of actions have different effects on the borrowers’ mortgage structures and monthly principal and interest payments. Different actionsmay, over time, have different effects on the long-term sustainability of mortgages. Servicersgenerally use a combination of actions when modifying mortgages, with nearly 84 percent of
modifications implemented during the first quarter changing more than one of the original loanterms. Interest rate reductions continued to be the most prevalent action, used in 85.9 percent of all loan modifications implemented in the first quarter of 2010. Nearly 82 percent of modifications included capitalization of missed payments and fees, while 46.8 percent includedan extension of the loan maturity. Consistent with the prescribed actions under HAMP, servicersdeferred repayment of some portion of the principal balance in 10.1 percent of all modifications,while principal reduction was used in less than 2 percent of all first-quarter modifications.Because most modifications changed more than one term, the total of the individual actionsexceeds 100 percent of total modifications. Appendix D presents additional detail oncombination modifications.
Table 19. Changes in Loan Terms for Modifications Made Through the First Quarter of 2010
Total Number of Changes in Each Category Percentage of Modifications
9/30/09 12/31/09 3/31/109/30/09
(of 131,247)12/30/09
(of 124,295)3/31/10
(of 229,328)
Capitalization 89,240 102,885 187,504 68.0% 82.8% 81.8%
Rate Reduction 106,291 105,112 196,952 81.0% 84.6% 85.9%
Rate Freeze 3,232 2,123 2,657 2.5% 1.7% 1.2%
Term Extension 62,722 57,853 107,293 47.8% 46.5% 46.8%
Principal Reduction 17,323 8,435 4,422 13.2% 6.8% 1.9%
Principal Deferral 4,040 7,205 23,201 3.1% 5.8% 10.1%
Unknown* 2,627 1,515 2,001 2.0% 1.2% 0.9%
*Processing constraints at some servicers prevented them from aggregating and reporting specific modifiedterm(s).
- 26 -
8/9/2019 OCC and OTS Mortgage Metrics Report First Quarter 2010
http://slidepdf.com/reader/full/occ-and-ots-mortgage-metrics-report-first-quarter-2010 27/59
OCC and OTS Mortgage Metrics Report, First Quarter 2010
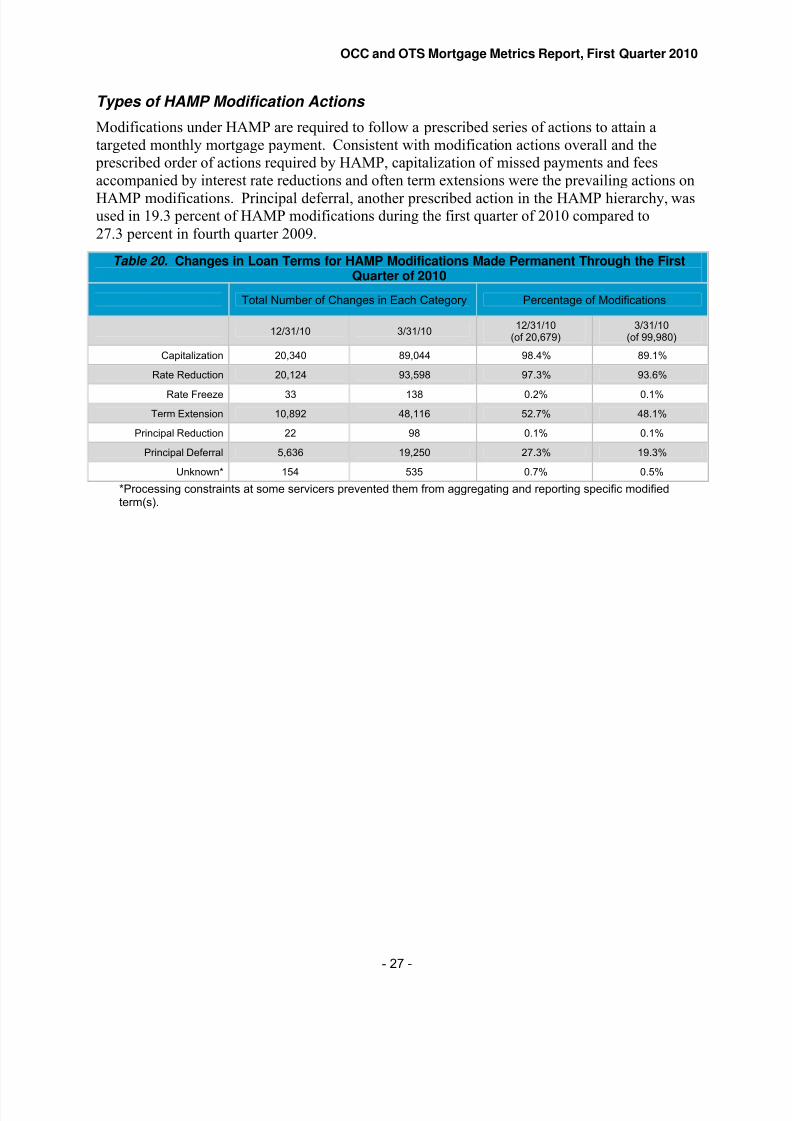
Types of HAMP Modification Actions
Modifications under HAMP are required to follow a prescribed series of actions to attain atargeted monthly mortgage payment. Consistent with modification actions overall and the prescribed order of actions required by HAMP, capitalization of missed payments and feesaccompanied by interest rate reductions and often term extensions were the prevailing actions on
HAMP modifications. Principal deferral, another prescribed action in the HAMP hierarchy, wasused in 19.3 percent of HAMP modifications during the first quarter of 2010 compared to27.3 percent in fourth quarter 2009.
Table 20. Changes in Loan Terms for HAMP Modifications Made Permanent Through the FirstQuarter of 2010
Total Number of Changes in Each Category Percentage of Modifications
12/31/10 3/31/1012/31/10
(of 20,679)3/31/10
(of 99,980)
Capitalization 20,340 89,044 98.4% 89.1%
Rate Reduction 20,124 93,598 97.3% 93.6%
Rate Freeze 33 138 0.2% 0.1%
Term Extension 10,892 48,116 52.7% 48.1%
Principal Reduction 22 98 0.1% 0.1%
Principal Deferral 5,636 19,250 27.3% 19.3%
Unknown* 154 535 0.7% 0.5%
*Processing constraints at some servicers prevented them from aggregating and reporting specific modifiedterm(s).
- 27 -

8/9/2019 OCC and OTS Mortgage Metrics Report First Quarter 2010
http://slidepdf.com/reader/full/occ-and-ots-mortgage-metrics-report-first-quarter-2010 28/59
OCC and OTS Mortgage Metrics Report, First Quarter 2010
Types of Modification Actions, by Risk Category
Servicers use a combination of actions when modifying mortgages, and no single action can beidentified as the primary component of a successful modification. Modifications across all risk categories often featured interest rate reduction and term extension on loans that include thecapitalization of past-due interest and fees. Principal deferral was used in an increasing number
of modifications across all categories. Because most modifications changed more than one term,the number of individual features changed exceeds the number of modified loans in each risk category.
Table 21. Numbers of Each Type of Modification, by Risk Category in First Quarter 2010
Prime Alt-A Subprime Other Total
Total MortgagesModified
95,657 48,561 63,866 21,244 229,328
Capitalization 78,008 40,539 51,961 16,996 187,504
Rate Reduction 82,773 40,963 54,575 18,641 196,952
Rate Freeze 757 582 941 377 2,657
Term Extension 44,346 21,361 28,782 12,804 107,293
Principal Reduction 2,425 1,037 865 95 4,422
Principal Deferral 14,546 4,042 2,821 1,792 23,201
Unknown* 927 387 408 279 2,001
*Processing constraints at some servicers prevented them from aggregating and reporting specific modifiedterm(s).
Table 22. Percentages of Each Type of Modification, by Risk Category in First Quarter 2010
Prime Alt-A Subprime Other Overall
Capitalization 81.5% 83.5% 81.4% 80.0% 81.8%
Rate Reduction 86.5% 84.4% 85.5% 87.7% 85.9%
Rate Freeze 0.8% 1.2% 1.5% 1.8% 1.2%
Term Extension 46.4% 44.0% 45.1% 60.3% 46.8%
Principal Reduction 2.5% 2.1% 1.4% 0.4% 1.9%
Principal Deferral 15.2% 8.3% 4.4% 8.4% 10.1%
Unknown* 1.0% 0.8% 0.6% 1.3% 0.9%
*Processing constraints at some servicers prevented them from aggregating and reporting specific modifiedterm(s).
- 28 -

8/9/2019 OCC and OTS Mortgage Metrics Report First Quarter 2010
http://slidepdf.com/reader/full/occ-and-ots-mortgage-metrics-report-first-quarter-2010 29/59
OCC and OTS Mortgage Metrics Report, First Quarter 2010
Types of Modification Actions, by Investor and Product Type
Modifications of mortgages serviced for the GSEs—Fannie Mae and Freddie Mac—accountedfor 45 percent of first quarter modifications. Mortgages serviced for private investors received25 percent of all modifications, while government-guaranteed loans received 16 percent.Mortgages held in servicer portfolios received 14 percent of first-quarter modifications, down
from 25 percent in the fourth quarter. While the total number of portfolio loan modificationsincreased in the first quarter, the rate of increase was much higher for other investor classes asthe GSEs, government-guaranteed, and private investors ramped up their implementation of HAMP and other modification programs. Tables 23 and 24 show the distribution of the types of modification actions by investor and product type. Because modifications often change morethan one term, the number exceeds the number of modified loans for each investor.
Table 23. Numbers of Each Type of Modification, by Investor, in First Quarter 2010
Fannie Mae Freddie MacGovernment-Guaranteed
PrivateInvestor
Portfolio Total
Total MortgagesModified
73,364 29,961 36,706 56,428 32,869 229,328
Capitalization 68,062 23,854 28,609 43,449 23,530 187,504
Rate Reduction 64,269 24,841 34,781 44,889 28,172 196,952
Rate Freeze 272 306 411 754 914 2,657
Term Extension 29,230 18,006 26,828 16,099 17,130 107,293
Principal Reduction 10 3 0 673 3,736 4,422
Principal Deferral 6,997 5,807 3 6,861 3,533 23,201
Unknown* 447 276 91 595 592 2,001
*Processing constraints at some servicers prevented them from aggregating and reporting specific modifiedterm(s).
Interest rate reduction, on loans that may also include the capitalization of missed payments andfees, remained the primary type of modification action for all investors and product types, withterm extension also used in a majority of Freddie Mac, government-guaranteed, and portfoliomodifications. Principal deferral was increasingly used in GSE, private investor, and portfoliomodifications. Principal reduction was used in a lesser number of first-quarter modifications,and it remained concentrated in portfolio modifications, primarily among option ARMs as shownin Table 27.
Table 24. Percentages of Each Type of Modification, by Investor, in First Quarter 2010
Fannie Mae Freddie MacGovernment-Guaranteed
PrivateInvestor
Portfolio Overall
Capitalization 92.8% 79.6% 77.9% 77.0% 71.6% 81.8%
Rate Reduction 87.6% 82.9% 94.8% 79.6% 85.7% 85.9%
Rate Freeze 0.4% 1.0% 1.1% 1.3% 2.8% 1.2%
Term Extension 39.8% 60.1% 73.1% 28.5% 52.1% 46.8%
Principal Reduction 0.0% 0.0% 0.0% 1.2% 11.4% 1.9%
Principal Deferral 9.5% 19.4% 0.0% 12.2% 10.7% 10.1%
Unknown* 0.6% 0.9% 0.2% 1.1% 1.8% 0.9%
*Processing constraints at some servicers prevented them from aggregating and reporting specific modifiedterm(s).
- 29 -
8/9/2019 OCC and OTS Mortgage Metrics Report First Quarter 2010
http://slidepdf.com/reader/full/occ-and-ots-mortgage-metrics-report-first-quarter-2010 30/59
OCC and OTS Mortgage Metrics Report, First Quarter 2010
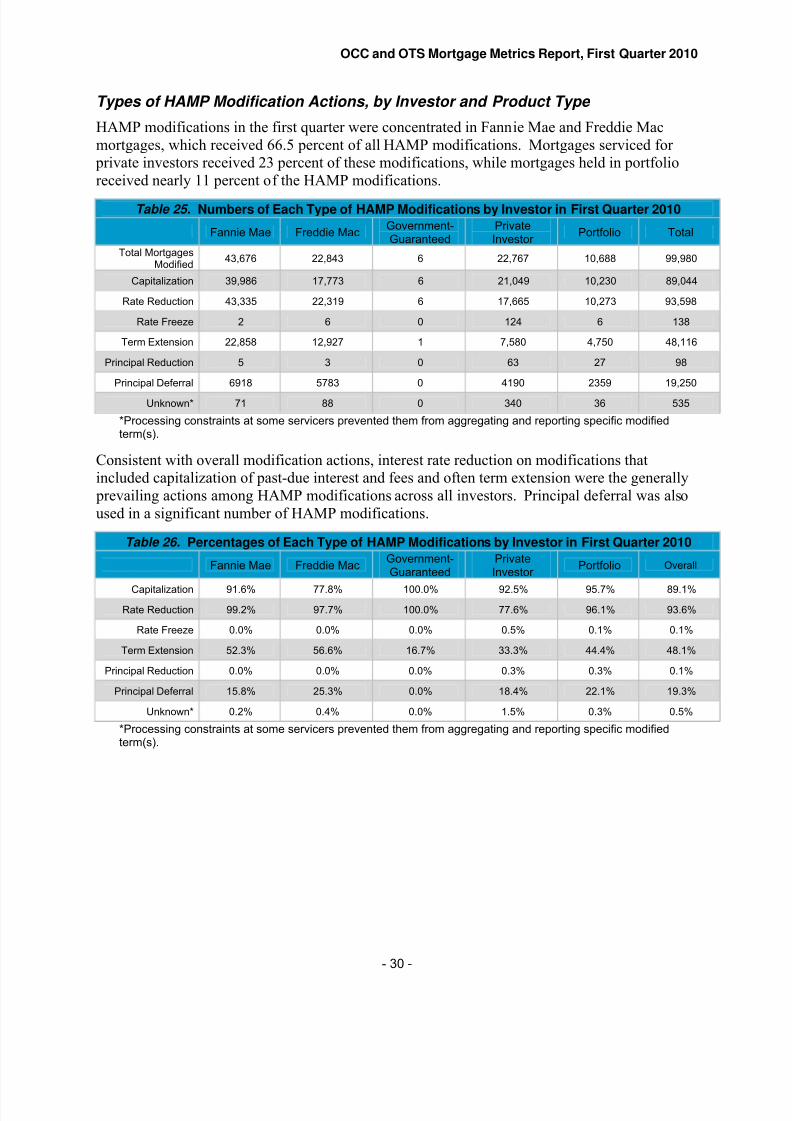
Types of HAMP Modification Actions, by Investor and Product Type
HAMP modifications in the first quarter were concentrated in Fannie Mae and Freddie Macmortgages, which received 66.5 percent of all HAMP modifications. Mortgages serviced for private investors received 23 percent of these modifications, while mortgages held in portfolioreceived nearly 11 percent of the HAMP modifications.
Table 25. Numbers of Each Type of HAMP Modifications by Investor in First Quarter 2010
Fannie Mae Freddie MacGovernment-Guaranteed
PrivateInvestor
Portfolio Total
Total MortgagesModified
43,676 22,843 6 22,767 10,688 99,980
Capitalization 39,986 17,773 6 21,049 10,230 89,044
Rate Reduction 43,335 22,319 6 17,665 10,273 93,598
Rate Freeze 2 6 0 124 6 138
Term Extension 22,858 12,927 1 7,580 4,750 48,116
Principal Reduction 5 3 0 63 27 98
Principal Deferral 6918 5783 0 4190 2359 19,250
Unknown* 71 88 0 340 36 535
*Processing constraints at some servicers prevented them from aggregating and reporting specific modifiedterm(s).
Consistent with overall modification actions, interest rate reduction on modifications thatincluded capitalization of past-due interest and fees and often term extension were the generally prevailing actions among HAMP modifications across all investors. Principal deferral was alsoused in a significant number of HAMP modifications.
Table 26. Percentages of Each Type of HAMP Modifications by Investor in First Quarter 2010
Fannie Mae Freddie MacGovernment-Guaranteed
PrivateInvestor
Portfolio Overall
Capitalization 91.6% 77.8% 100.0% 92.5% 95.7% 89.1%
Rate Reduction 99.2% 97.7% 100.0% 77.6% 96.1% 93.6%
Rate Freeze 0.0% 0.0% 0.0% 0.5% 0.1% 0.1%
Term Extension 52.3% 56.6% 16.7% 33.3% 44.4% 48.1%
Principal Reduction 0.0% 0.0% 0.0% 0.3% 0.3% 0.1%
Principal Deferral 15.8% 25.3% 0.0% 18.4% 22.1% 19.3%
Unknown* 0.2% 0.4% 0.0% 1.5% 0.3% 0.5%
*Processing constraints at some servicers prevented them from aggregating and reporting specific modifiedterm(s).
- 30 -

8/9/2019 OCC and OTS Mortgage Metrics Report First Quarter 2010
http://slidepdf.com/reader/full/occ-and-ots-mortgage-metrics-report-first-quarter-2010 31/59
OCC and OTS Mortgage Metrics Report, First Quarter 2010
Types of Modification Actions Taken on Option ARMs
Option ARMs contain unique, higher-risk features that may make them difficult to modify for payment sustainability while attaining a positive net present value to the investor. Servicersmodified 7,991 option ARMs during the first quarter, down from the 14,881 modificationsimplemented during the fourth quarter of 2009. Prime option ARMs received more than
67 percent of these modifications, while subprime loans received almost 10 percent.
Table 27. Numbers of Each Type of Option ARM Modification in First Quarter 2010
Prime Alt-A Subprime Other Total
Total MortgagesModified
5,365 1,720 769 137 7,991
Capitalization 4,152 1,418 578 85 6,233
Rate Reduction 3,630 1,211 633 104 5,578
Rate Freeze 25 21 13 6 65
Term Extension 2,275 852 684 95 3,906
Principal Reduction 1,657 670 493 37 2,857
Principal Deferral 934 302 25 8 1,269
Unknown* 45 31 4 2 82
*Processing constraints at some servicers prevented them from aggregating and reporting specific modifiedterm(s).
Consistent with other product types, interest rate reduction and term extension were the prevalentmodification actions for option ARMs. However, because of the unique features of optionARMs, principal reduction and principal deferral were used in significantly higher percentagesthan for other types of mortgages.
Table 28. Percentages of Each Type of Option ARM Modification in First Quarter 2010
Prime Alt-A Subprime Other Overall
Capitalization 77.4% 82.4% 75.2% 62.0% 78.0%
Rate Reduction 67.7% 70.4% 82.3% 75.9% 69.8%
Rate Freeze 0.5% 1.2% 1.7% 4.4% 0.8%
Term Extension 42.4% 49.5% 88.9% 69.3% 48.9%
Principal Reduction 30.9% 39.0% 64.1% 27.0% 35.8%
Principal Deferral 17.4% 17.6% 3.3% 5.8% 15.9%
Unknown* 0.8% 1.8% 0.5% 1.5% 1.0%
*Processing constraints at some servicers prevented them from aggregating and reporting specific modifiedterm(s).
- 31 -
8/9/2019 OCC and OTS Mortgage Metrics Report First Quarter 2010
http://slidepdf.com/reader/full/occ-and-ots-mortgage-metrics-report-first-quarter-2010 32/59
OCC and OTS Mortgage Metrics Report, First Quarter 2010
Changes to Monthly Payments Resulting from Modification
The previous sections describe the types of modification actions across risk categories, investors,and product types. This section describes the effect of those changes on borrowers’ monthly principal and interest payments.
Modifications that decrease payments occur when servicers elect to lower interest rates, extendthe amortization period, or forgive or defer principal. The reduced payments can makemortgages more affordable and more sustainable over time. However, the lower payments alsoresult in less monthly cash flow and interest income to the mortgage investor.
Mortgage modifications may increase monthly payments when borrowers and servicers agree toadd past-due interest, advances for taxes or insurance, and other fees to the loan balances andre-amortize the new balances over the remaining life of the mortgages. The interest rate or maturity of the loans may be changed but not enough to offset the increase in payment caused bythe additional capitalized principal. Modifications may also result in increased monthly payments when interest rates and payments on adjustable rate mortgages are reset higher but byless than the amount indicated in the original mortgage contracts.
Modifications that increase payments may be appropriate when borrowers experience temporarycash flow or liquidity problems and have reasonable prospects to make the higher payments to bring the loan current and repay the debt over time. However, during periods of prolongedeconomic stress, this strategy carries additional risk, underscoring the importance of verifying borrowers’ income and debt payment ability so that borrowers and servicers can have confidencethat the modifications are likely to be sustainable.
Servicers also modify some mortgages that leave principal and interest payments unchanged.This occurs, for example, when servicers “freeze” current interest rates and payments instead of allowing them to increase to levels required by the original mortgage contracts.
- 32 -
8/9/2019 OCC and OTS Mortgage Metrics Report First Quarter 2010
http://slidepdf.com/reader/full/occ-and-ots-mortgage-metrics-report-first-quarter-2010 33/59
OCC and OTS Mortgage Metrics Report, First Quarter 2010
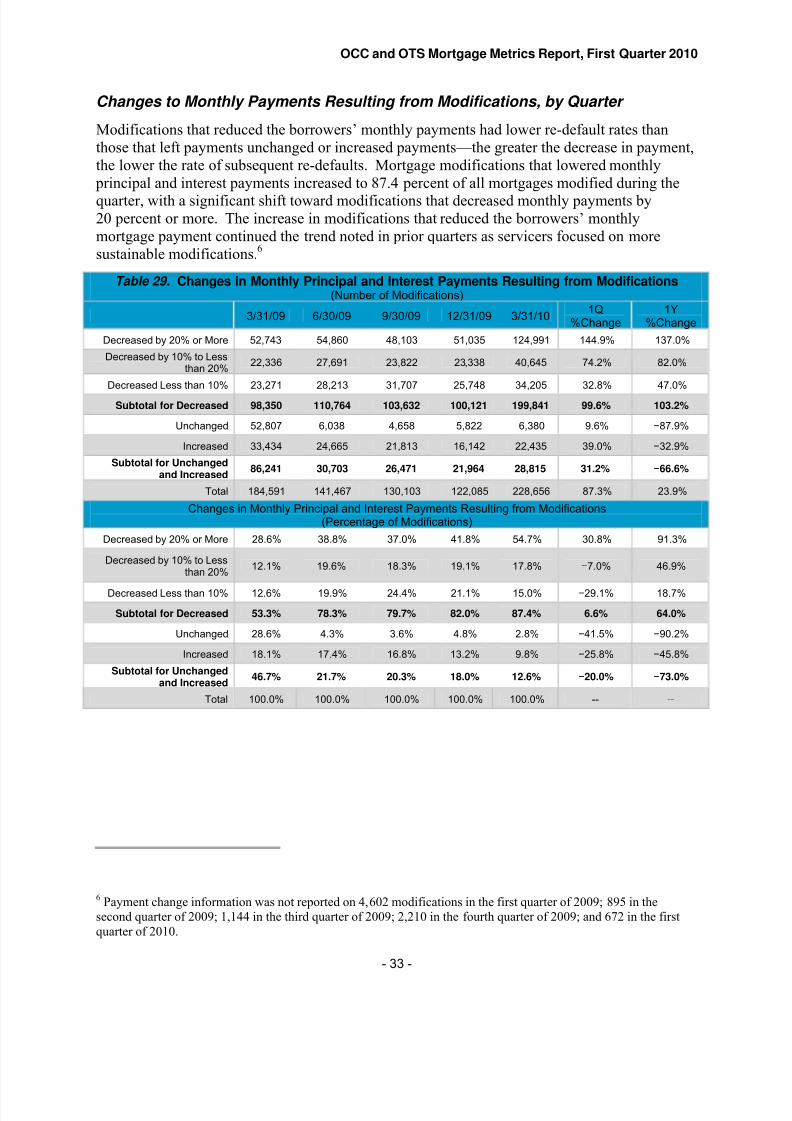
Changes to Monthly Payments Resulting from Modifications, by Quarter
Modifications that reduced the borrowers’ monthly payments had lower re-default rates thanthose that left payments unchanged or increased payments—the greater the decrease in payment,the lower the rate of subsequent re-defaults. Mortgage modifications that lowered monthly principal and interest payments increased to 87.4 percent of all mortgages modified during the
quarter, with a significant shift toward modifications that decreased monthly payments by20 percent or more. The increase in modifications that reduced the borrowers’ monthlymortgage payment continued the trend noted in prior quarters as servicers focused on moresustainable modifications.
6
Table 29. Changes in Monthly Principal and Interest Payments Resulting from Modifications(Number of Modifications)
3/31/09 6/30/09 9/30/09 12/31/09 3/31/101Q
%Change1Y
%Change
Decreased by 20% or More 52,743 54,860 48,103 51,035 124,991 144.9% 137.0%
Decreased by 10% to Lessthan 20%
22,336 27,691 23,822 23,338 40,645 74.2% 82.0%
Decreased Less than 10% 23,271 28,213 31,707 25,748 34,205 32.8% 47.0%
Subtotal for Decreased 98,350 110,764 103,632 100,121 199,841 99.6% 103.2%
Unchanged 52,807 6,038 4,658 5,822 6,380 9.6% −87.9%
Increased 33,434 24,665 21,813 16,142 22,435 39.0% −32.9%
Subtotal for Unchangedand Increased
86,241 30,703 26,471 21,964 28,815 31.2% −66.6%
Total 184,591 141,467 130,103 122,085 228,656 87.3% 23.9%
Changes in Monthly Principal and Interest Payments Resulting from Modifications(Percentage of Modifications)
Decreased by 20% or More 28.6% 38.8% 37.0% 41.8% 54.7% 30.8% 91.3%
Decreased by 10% to Lessthan 20%
12.1% 19.6% 18.3% 19.1% 17.8% −7.0% 46.9%
Decreased Less than 10% 12.6% 19.9% 24.4% 21.1% 15.0%−
29.1% 18.7%
Subtotal for Decreased 53.3% 78.3% 79.7% 82.0% 87.4% 6.6% 64.0%
Unchanged 28.6% 4.3% 3.6% 4.8% 2.8% −41.5% −90.2%
Increased 18.1% 17.4% 16.8% 13.2% 9.8% −25.8% −45.8%
Subtotal for Unchangedand Increased
46.7% 21.7% 20.3% 18.0% 12.6% −20.0% −73.0%
Total 100.0% 100.0% 100.0% 100.0% 100.0% -- --
6 Payment change information was not reported on 4,602 modifications in the first quarter of 2009; 895 in thesecond quarter of 2009; 1,144 in the third quarter of 2009; 2,210 in the fourth quarter of 2009; and 672 in the firstquarter of 2010.
- 33 -

8/9/2019 OCC and OTS Mortgage Metrics Report First Quarter 2010
http://slidepdf.com/reader/full/occ-and-ots-mortgage-metrics-report-first-quarter-2010 34/59
OCC and OTS Mortgage Metrics Report, First Quarter 2010
Figure 10. Changes in Monthly Principal and Interest Payments
Percentage of Modifications in Each Category
100%
75%
50%
25%
0%
3/31/2009 6/30/09 9/30/09 12/31/09 3/31/10
Increased Unchanged Decreased
- 34 -
8/9/2019 OCC and OTS Mortgage Metrics Report First Quarter 2010
http://slidepdf.com/reader/full/occ-and-ots-mortgage-metrics-report-first-quarter-2010 35/59
OCC and OTS Mortgage Metrics Report, First Quarter 2010
Changes to Monthly Payments Resulting from HAMP Modifications, by Quarter
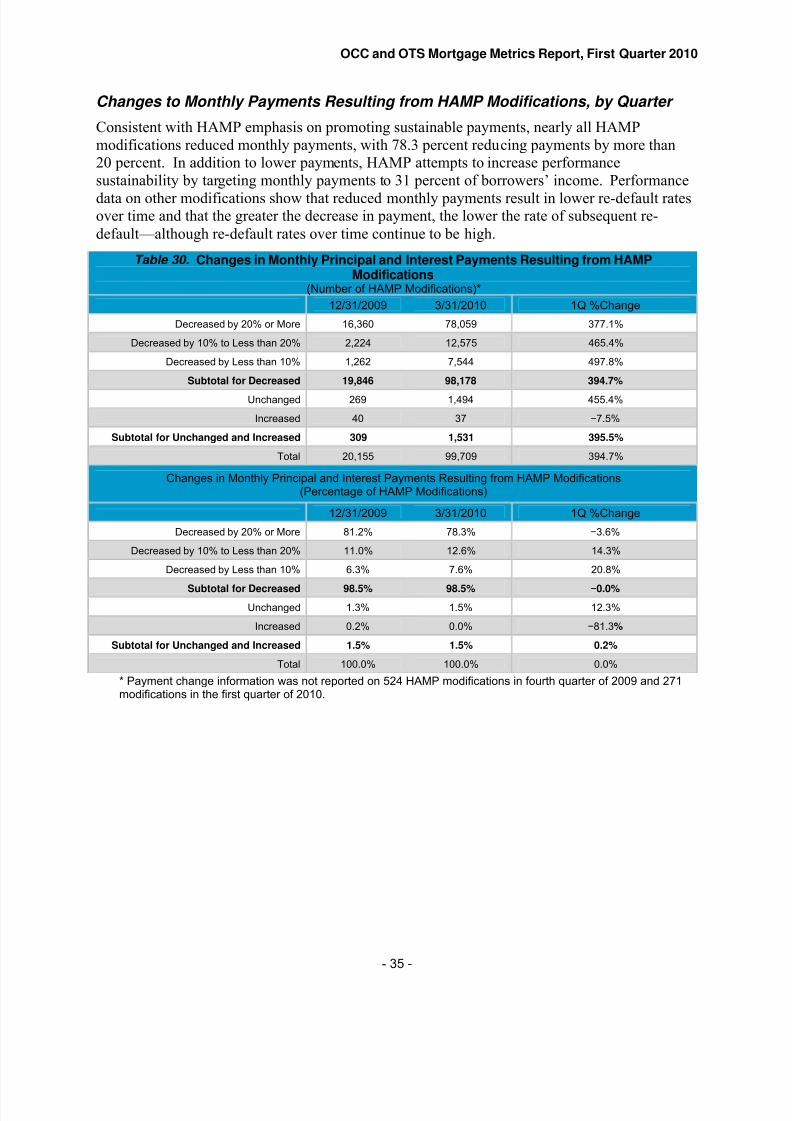
Consistent with HAMP emphasis on promoting sustainable payments, nearly all HAMPmodifications reduced monthly payments, with 78.3 percent reducing payments by more than20 percent. In addition to lower payments, HAMP attempts to increase performancesustainability by targeting monthly payments to 31 percent of borrowers’ income. Performance
data on other modifications show that reduced monthly payments result in lower re-default ratesover time and that the greater the decrease in payment, the lower the rate of subsequent re-default—although re-default rates over time continue to be high.
Table 30. Changes in Monthly Principal and Interest Payments Resulting from HAMPModifications
(Number of HAMP Modifications)*
12/31/2009 3/31/2010 1Q %Change
Decreased by 20% or More 16,360 78,059 377.1%
Decreased by 10% to Less than 20% 2,224 12,575 465.4%
Decreased by Less than 10% 1,262 7,544 497.8%
Subtotal for Decreased 19,846 98,178 394.7%
Unchanged 269 1,494 455.4%
Increased 40 37 −7.5%
Subtotal for Unchanged and Increased 309 1,531 395.5%
Total 20,155 99,709 394.7%
Changes in Monthly Principal and Interest Payments Resulting from HAMP Modifications(Percentage of HAMP Modifications)
12/31/2009 3/31/2010 1Q %Change
Decreased by 20% or More 81.2% 78.3% −3.6%
Decreased by 10% to Less than 20% 11.0% 12.6% 14.3%
Decreased by Less than 10% 6.3% 7.6% 20.8%
Subtotal for Decreased 98.5% 98.5%−
0.0%
Unchanged 1.3% 1.5% 12.3%
Increased 0.2% 0.0% −81.3%
Subtotal for Unchanged and Increased 1.5% 1.5% 0.2%
Total 100.0% 100.0% 0.0%
* Payment change information was not reported on 524 HAMP modifications in fourth quarter of 2009 and 271modifications in the first quarter of 2010.
- 35 -

8/9/2019 OCC and OTS Mortgage Metrics Report First Quarter 2010
http://slidepdf.com/reader/full/occ-and-ots-mortgage-metrics-report-first-quarter-2010 36/59
60+ Re-Default Rate for 2008-2009 Modifications
60%
40%
Fourth Quarter 2008
First Quarter 200920%
Second Quarter 2009
Third Quarter 2009
Fourth Quarter 2009
0%3 6 9 12
Months Following Modification
OCC and OTS Mortgage Metrics Report, First Quarter 2010
B. Modified Loan Performance
Re-Default Rates of Modified Loans: 60 or More Days Delinquent
Overall re-default rates remained high with more than half of all modifications becoming morethan 60 days past due one year after modification. However, more recent mortgage
modifications have had better performance than older vintages of modifications, correspondingwith the ongoing emphasis on lowering monthly payments and improving paymentsustainability. The recent increase in loans modified under HAMP also attempts to increasesustainability by targeting monthly payments to 31 percent of borrowers’ income. Lower early-stage re-default rates indicate potentially better performance and sustainability over time.
Table 31. Modified Loans 60 or More Days Delinquent(60+ Re-Default Rate for 2008–2009 Modifications)*
Modification Date3 Months after Modification
6 Months after Modification
9 Months after Modification
12 Months after Modification
Fourth Quarter 2008 29.9% 42.0% 51.6% 57.9%
First Quarter 2009 29.8% 42.3% 51.0% 54.9%
Second Quarter 2009 18.3% 33.1% 40.7% --
Third Quarter 2009 14.8% 27.7% -- --
Fourth Quarter 2009 11.3% -- -- --
* Data include only modifications that have had time to age the indicated number of months.
Figure 11. Modified Loans 60 or More Days Delinquent
- 36 -
8/9/2019 OCC and OTS Mortgage Metrics Report First Quarter 2010
http://slidepdf.com/reader/full/occ-and-ots-mortgage-metrics-report-first-quarter-2010 37/59
Figure 12. Modified Loans 30 or More Days Delinquent
30+ Re-Default Rate for 2008 - 2009 Modifications
65%
50%
20%
35%
3 6 9
Months Following Modification
12
Fourth Quarter 2008
First Quarter 2009
Second Quarter 2009
Third Quarter 2009
Fourth Quarter 2009
OCC and OTS Mortgage Metrics Report, First Quarter 2010
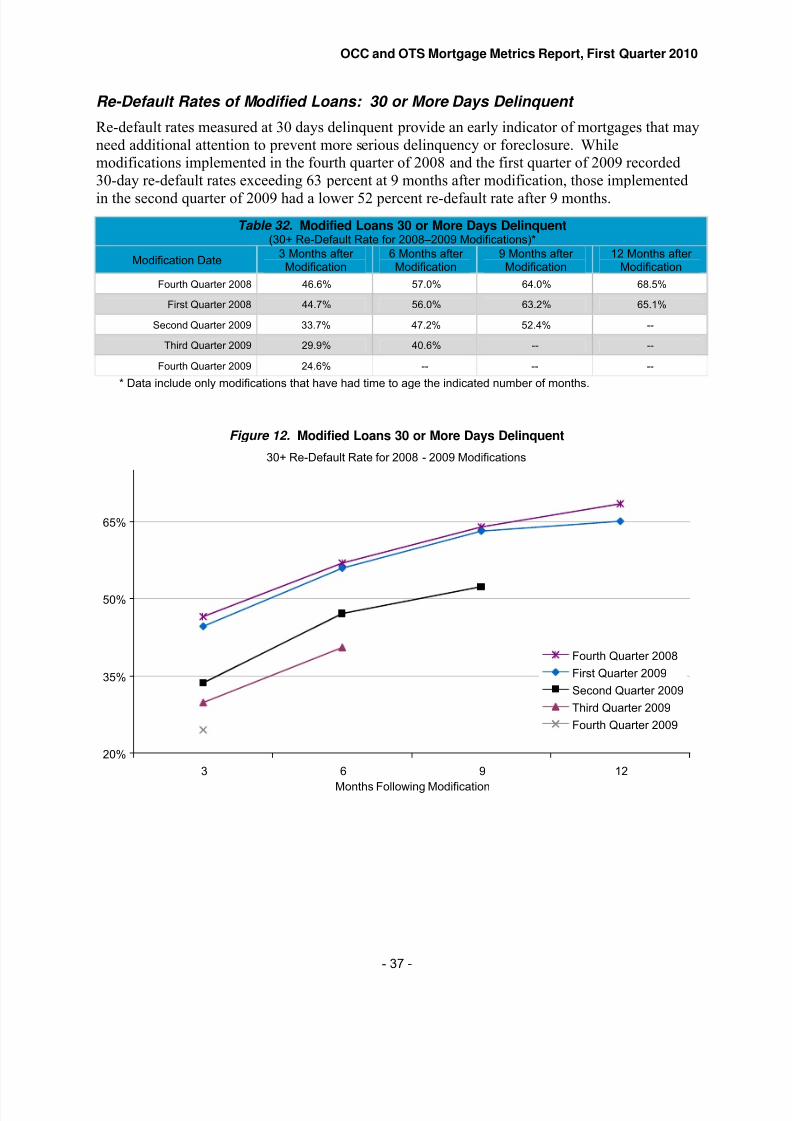
Re-Default Rates of Modified Loans: 30 or More Days Delinquent
Re-default rates measured at 30 days delinquent provide an early indicator of mortgages that mayneed additional attention to prevent more serious delinquency or foreclosure. Whilemodifications implemented in the fourth quarter of 2008 and the first quarter of 2009 recorded30-day re-default rates exceeding 63 percent at 9 months after modification, those implemented
in the second quarter of 2009 had a lower 52 percent re-default rate after 9 months.
Table 32. Modified Loans 30 or More Days Delinquent(30+ Re-Default Rate for 2008–2009 Modifications)*
Modification Date3 Months after Modification
6 Months after Modification
9 Months after Modification
12 Months after Modification
Fourth Quarter 2008 46.6% 57.0% 64.0% 68.5%
First Quarter 2008 44.7% 56.0% 63.2% 65.1%
Second Quarter 2009 33.7% 47.2% 52.4% --
Third Quarter 2009 29.9% 40.6% -- --
Fourth Quarter 2009 24.6% -- -- --
* Data include only modifications that have had time to age the indicated number of months.
- 37 -
8/9/2019 OCC and OTS Mortgage Metrics Report First Quarter 2010
http://slidepdf.com/reader/full/occ-and-ots-mortgage-metrics-report-first-quarter-2010 38/59
Figure 13. Modified Loans 90 or More Days Delinquent
90+ Re-Default Rate for 2008 - 2009 Modifications
60%
40%
20%
0%
Fourth Quarter 2008
First Quarter 2009
Second Quarter 2009
Third Quarter 2009
Fourth Quarter 2009
3 6 9 1
Months Following Modification
OCC and OTS Mortgage Metrics Report, First Quarter 2010
Re-Default Rates of Modified Loans: 90 or More Days Delinquent
Modified mortgages that were 90 or more days delinquent after modification were naturallyfewer than shorter-term delinquency measures but exhibited a similar rise in delinquencies over time. Mortgages modified since the beginning of the second quarter of 2009 have outperformed previous vintages of modifications when measured as 90 or more days delinquent or in process
of foreclosure.
Table 33. Modified Loans 90 or More Days Delinquent(90+ Re-Default Rate for 2008–2009 Modifications)*
Modification Date3 Months after Modification
6 Months after Modification
9 Months after Modification
12 Months after Modification
Fourth Quarter 2008 19.5% 32.2% 42.7% 50.5%
First Quarter 2009 20.1% 33.6% 42.9% 48.4%
Second Quarter 2009 9.3% 24.0% 33.1% --
Third Quarter 2009 6.4% 19.8% -- --
Fourth Quarter 2009 5.5% -- -- --
* Data include only modifications that have had time to age the indicated number of months.
2
- 38 -
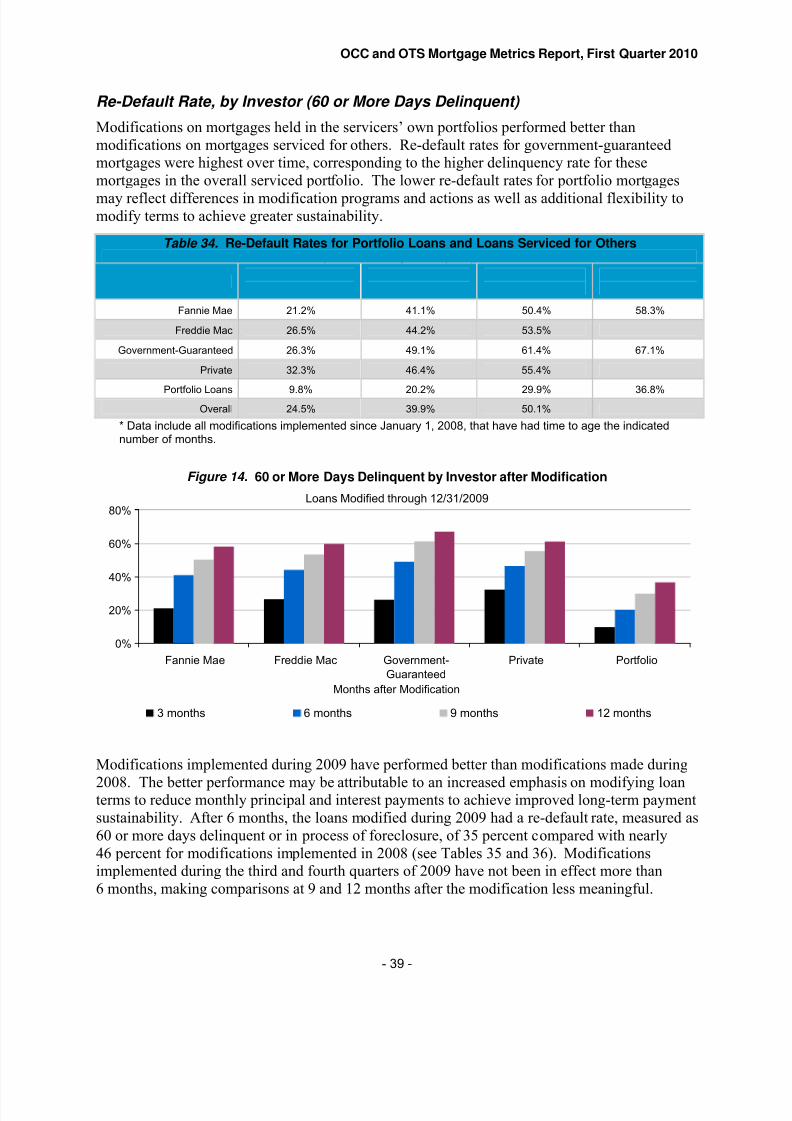
8/9/2019 OCC and OTS Mortgage Metrics Report First Quarter 2010
http://slidepdf.com/reader/full/occ-and-ots-mortgage-metrics-report-first-quarter-2010 39/59
Loans Modified through 12/31/200980%
60%
40%
20%
0%Fannie Mae Freddie Mac Government- Private Portfolio
GuaranteedMonths after Modification
3 months 6 months 9 months 12 months
OCC and OTS Mortgage Metrics Report, First Quarter 2010
Re-Default Rate, by Investor (60 or More Days Delinquent)
Modifications on mortgages held in the servicers’ own portfolios performed better thanmodifications on mortgages serviced for others. Re-default rates for government-guaranteedmortgages were highest over time, corresponding to the higher delinquency rate for thesemortgages in the overall serviced portfolio. The lower re-default rates for portfolio mortgages
may reflect differences in modification programs and actions as well as additional flexibility tomodify terms to achieve greater sustainability.
Table 34. Re-Default Rates for Portfolio Loans and Loans Serviced for Others(60 or More Days Delinquent)*
3 Months after 6 Months after 9 Months after 12 Months after Investor Loan Type
Modification Modification Modification Modification
Fannie Mae 21.2% 41.1% 50.4% 58.3%
Freddie Mac 26.5% 44.2% 53.5% 59.9%
Government-Guaranteed 26.3% 49.1% 61.4% 67.1%
Private 32.3% 46.4% 55.4% 61.3%
Portfolio Loans 9.8% 20.2% 29.9% 36.8%Overall 24.5% 39.9% 50.1% 57.1%
* Data include all modifications implemented since January 1, 2008, that have had time to age the indicatednumber of months.
Figure 14. 60 or More Days Delinquent by Investor after Modification
Modifications implemented during 2009 have performed better than modifications made during
2008. The better performance may be attributable to an increased emphasis on modifying loanterms to reduce monthly principal and interest payments to achieve improved long-term paymentsustainability. After 6 months, the loans modified during 2009 had a re-default rate, measured as60 or more days delinquent or in process of foreclosure, of 35 percent compared with nearly46 percent for modifications implemented in 2008 (see Tables 35 and 36). Modificationsimplemented during the third and fourth quarters of 2009 have not been in effect more than6 months, making comparisons at 9 and 12 months after the modification less meaningful.
- 39 -
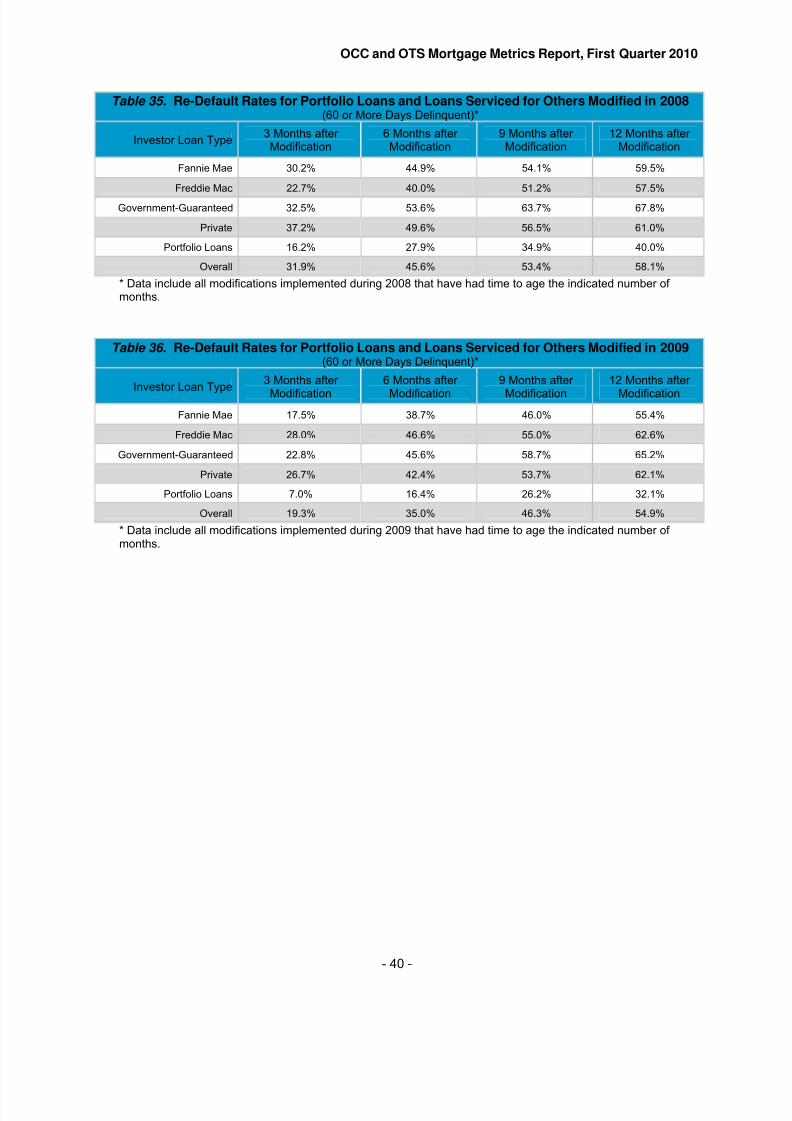
8/9/2019 OCC and OTS Mortgage Metrics Report First Quarter 2010
http://slidepdf.com/reader/full/occ-and-ots-mortgage-metrics-report-first-quarter-2010 40/59
OCC and OTS Mortgage Metrics Report, First Quarter 2010
Table 35. Re-Default Rates for Portfolio Loans and Loans Serviced for Others Modified in 2008(60 or More Days Delinquent)*
Investor Loan Type3 Months after Modification
6 Months after Modification
9 Months after Modification
12 Months after Modification
Fannie Mae 30.2% 44.9% 54.1% 59.5%
Freddie Mac 22.7% 40.0% 51.2% 57.5%
Government-Guaranteed 32.5% 53.6% 63.7% 67.8%
Private 37.2% 49.6% 56.5% 61.0%
Portfolio Loans 16.2% 27.9% 34.9% 40.0%
Overall 31.9% 45.6% 53.4% 58.1%
* Data include all modifications implemented during 2008 that have had time to age the indicated number of months.
Table 36. Re-Default Rates for Portfolio Loans and Loans Serviced for Others Modified in 2009(60 or More Days Delinquent)*
Investor Loan Type
3 Months after
Modification
6 Months after
Modification
9 Months after
Modification
12 Months after
Modification
Fannie Mae 17.5% 38.7% 46.0% 55.4%
Freddie Mac 28.0% 46.6% 55.0% 62.6%
Government-Guaranteed 22.8% 45.6% 58.7% 65.2%
Private 26.7% 42.4% 53.7% 62.1%
Portfolio Loans 7.0% 16.4% 26.2% 32.1%
Overall 19.3% 35.0% 46.3% 54.9%
* Data include all modifications implemented during 2009 that have had time to age the indicated number of months.
- 40 -
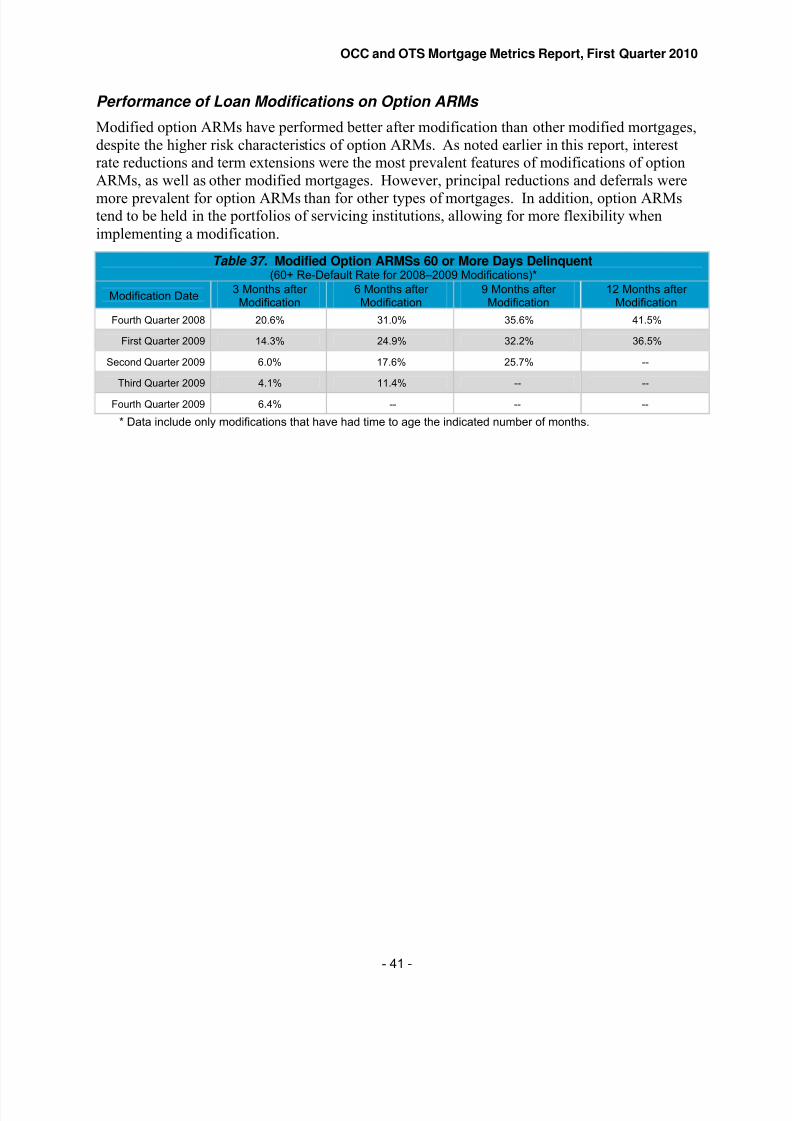
8/9/2019 OCC and OTS Mortgage Metrics Report First Quarter 2010
http://slidepdf.com/reader/full/occ-and-ots-mortgage-metrics-report-first-quarter-2010 41/59
OCC and OTS Mortgage Metrics Report, First Quarter 2010
Performance of Loan Modifications on Option ARMs
Modified option ARMs have performed better after modification than other modified mortgages,despite the higher risk characteristics of option ARMs. As noted earlier in this report, interestrate reductions and term extensions were the most prevalent features of modifications of optionARMs, as well as other modified mortgages. However, principal reductions and deferrals were
more prevalent for option ARMs than for other types of mortgages. In addition, option ARMstend to be held in the portfolios of servicing institutions, allowing for more flexibility whenimplementing a modification.
Table 37. Modified Option ARMSs 60 or More Days Delinquent(60+ Re-Default Rate for 2008–2009 Modifications)*
Modification Date3 Months after Modification
6 Months after Modification
9 Months after Modification
12 Months after Modification
Fourth Quarter 2008 20.6% 31.0% 35.6% 41.5%
First Quarter 2009 14.3% 24.9% 32.2% 36.5%
Second Quarter 2009 6.0% 17.6% 25.7% --
Third Quarter 2009 4.1% 11.4% -- --
Fourth Quarter 2009 6.4% -- -- --
* Data include only modifications that have had time to age the indicated number of months.
- 41 -
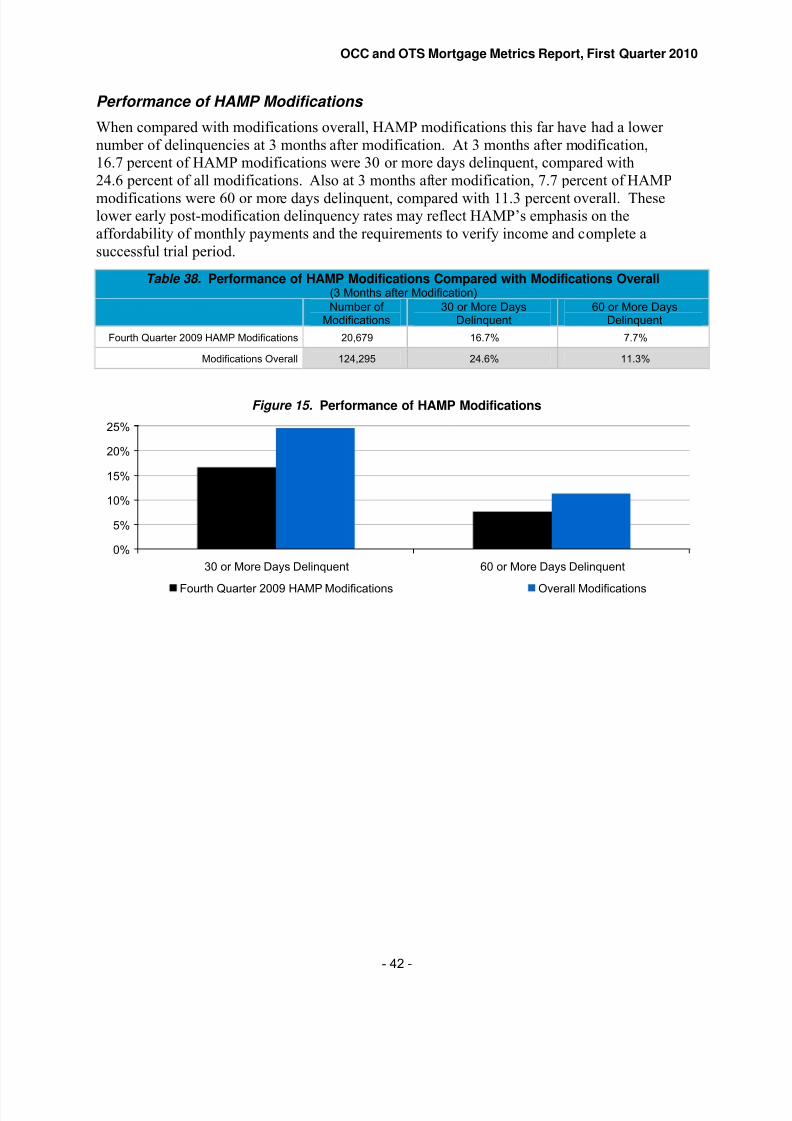
8/9/2019 OCC and OTS Mortgage Metrics Report First Quarter 2010
http://slidepdf.com/reader/full/occ-and-ots-mortgage-metrics-report-first-quarter-2010 42/59
OCC and OTS Mortgage Metrics Report, First Quarter 2010
Performance of HAMP Modifications
When compared with modifications overall, HAMP modifications this far have had a lower number of delinquencies at 3 months after modification. At 3 months after modification,16.7 percent of HAMP modifications were 30 or more days delinquent, compared with24.6 percent of all modifications. Also at 3 months after modification, 7.7 percent of HAMP
modifications were 60 or more days delinquent, compared with 11.3 percent overall. Theselower early post-modification delinquency rates may reflect HAMP’s emphasis on theaffordability of monthly payments and the requirements to verify income and complete asuccessful trial period.
Table 38. Performance of HAMP Modifications Compared with Modifications Overall(3 Months after Modification)Number of
Modifications30 or More Days
Delinquent60 or More Days
Delinquent
Fourth Quarter 2009 HAMP Modifications 20,679 16.7% 7.7%
Modifications Overall 124,295 24.6% 11.3%
Figure 15. Performance of HAMP Modifications
0%
5%
10%
15%
20%
25%
30 or More Days Delinquent 60 or More Days Delinquent
Fourth Quarter 2009 HAMP Modifications Overall Modifications
- 42 -
8/9/2019 OCC and OTS Mortgage Metrics Report First Quarter 2010
http://slidepdf.com/reader/full/occ-and-ots-mortgage-metrics-report-first-quarter-2010 43/59
OCC and OTS Mortgage Metrics Report, First Quarter 2010
C. Modified Loan Performance, by Change in Monthly Payments
Many factors drive mortgage delinquencies, including employment status, amount of homeowner equity, total homeowner debt, life-changing events, and poor initial underwriting.
Similar factors drive re-default rates on modified mortgages. However, the data in this section
consistently show that re-default rates have been lowest for modifications that reduce monthly payments. The data also show that the larger the reduction in monthly payment, the lower thesubsequent re-default rate. Lower recent re-default rates may also result from the increase inHAMP modifications, which emphasized lowering monthly payments to 31 percent of the borrower’s income, verifying income, and completing a successful trial period.
For servicers and investors, determining the optimal type of modification often requiresweighing the reduction in cash flow from loan terms that reduce monthly principal and interest payments, along with the possible costs of delaying foreclosure, against the potential for longer-term sustainability of the payments and ultimate repayment of the mortgage.
- 43 -

8/9/2019 OCC and OTS Mortgage Metrics Report First Quarter 2010
http://slidepdf.com/reader/full/occ-and-ots-mortgage-metrics-report-first-quarter-2010 44/59
OCC and OTS Mortgage Metrics Report, First Quarter 2010
Modified Loans 60 or More Days Delinquent, by Changes to Monthly Payments: Re-Default Rates at 3, 6, 9, and 12 Months after Modification
As stated earlier, mortgage modifications that decreased monthly principal and interest paymentsconsistently had lower re-default rates—the greater the decrease in payment, the lower the rate of subsequent re-defaults. After 12 months, 39.7 percent of modifications that decreased monthly
payments by 20 percent or more were 60 or more days delinquent. In contrast, 66.9 percent of modifications that left payments unchanged and 68.0 percent of modifications that increased payments were seriously delinquent after 12 months. While lower payments reduce monthlycash flows to investors, they may also result in longer-term sustainability of the mortgage payments and an increase in the likelihood that the mortgage will be repaid.
Table 39. Re-Default Rates of Loans Modified in 2008–2009 by Changes in Payment(60 or More Days Delinquent)*
3 Months after 6 Months after 9 Months after 12 Months after Modification Modification Modification Modification
Decreased by 20% or More 12.2% 23.5% 32.4% 39.7%
Decreased by 10% to Less than 20% 17.5% 32.7% 42.1% 47.5%
Decreased by Less than 10% 19.5% 37.4% 48.9% 54.3%
Unchanged 47.1% 56.6% 62.9% 66.9%
Increased 31.1% 51.6% 62.7% 68.0%
Total** 24.3% 39.7% 50.0% 57.0%
* Data include all modifications implemented since January 1, 2008 that have had time to age the indicated number of months. ** Data exclude loans for which the payment change was unknown.
Figure 16. Re-Default Rates of Loans Modified in 2008–2009 by Change in Payment
60 or More Days Delinquent
75%
60%
45%
30%
15%
0%
3 Months 6 Months 9 months 12 Months
Decreased by20% or More
Decreased by10% to Lessthan 20%
Decreased byLess than 10%
Unchanged
Increased
- 44 -
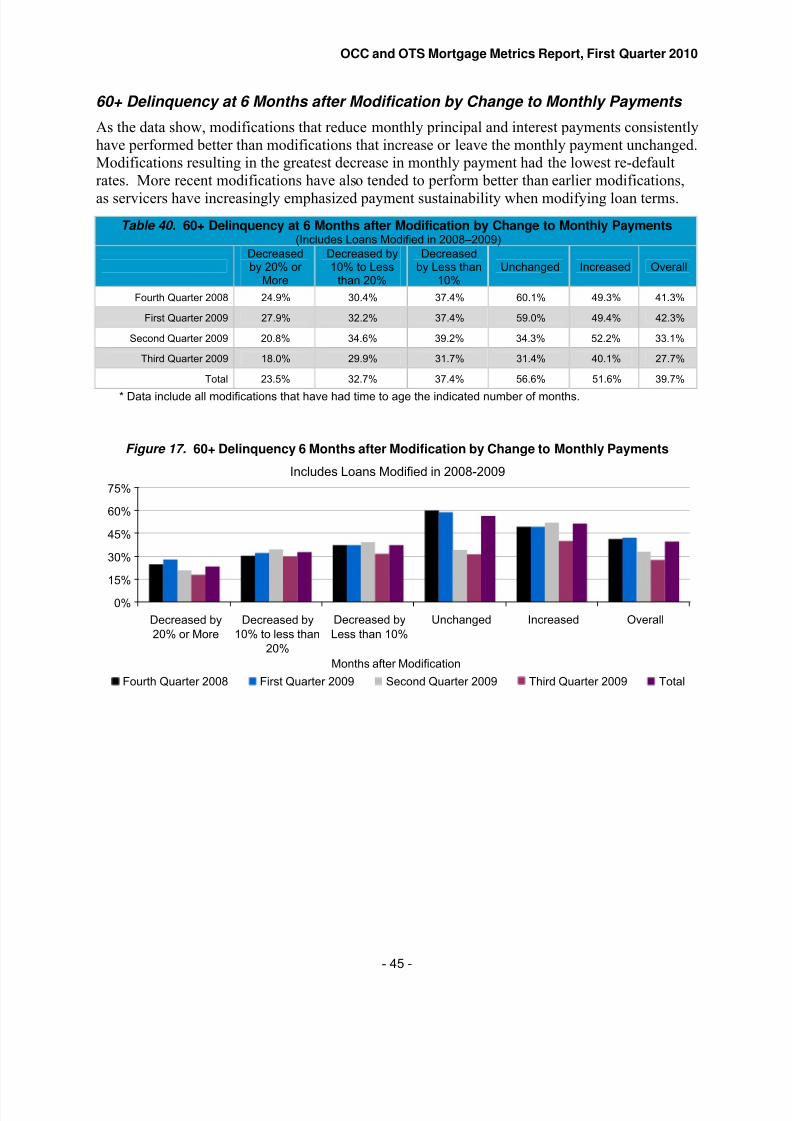
8/9/2019 OCC and OTS Mortgage Metrics Report First Quarter 2010
http://slidepdf.com/reader/full/occ-and-ots-mortgage-metrics-report-first-quarter-2010 45/59
0%
15%
30%
45%
60%
75%
Decreased by
20% or More
Decreased by
10% to less than
20%
Decreased by
Less than 10%
Unchanged Increased Overall
Months after Modification
Fourth Quarter 2008 First Quarter 2009 Second Quarter 2009 Third Quarter 2009 Total
OCC and OTS Mortgage Metrics Report, First Quarter 2010
60+ Delinquency at 6 Months after Modification by Change to Monthly Payments
As the data show, modifications that reduce monthly principal and interest payments consistentlyhave performed better than modifications that increase or leave the monthly payment unchanged.Modifications resulting in the greatest decrease in monthly payment had the lowest re-defaultrates. More recent modifications have also tended to perform better than earlier modifications,
as servicers have increasingly emphasized payment sustainability when modifying loan terms.
Table 40. 60+ Delinquency at 6 Months after Modification by Change to Monthly Payments(Includes Loans Modified in 2008–2009)
Decreasedby 20% or
More
Decreased by10% to Less
than 20%
Decreasedby Less than
10%Unchanged Increased Overall
Fourth Quarter 2008 24.9% 30.4% 37.4% 60.1% 49.3% 41.3%
First Quarter 2009 27.9% 32.2% 37.4% 59.0% 49.4% 42.3%
Second Quarter 2009 20.8% 34.6% 39.2% 34.3% 52.2% 33.1%
Third Quarter 2009 18.0% 29.9% 31.7% 31.4% 40.1% 27.7%
Total 23.5% 32.7% 37.4% 56.6% 51.6% 39.7%
* Data include all modifications that have had time to age the indicated number of months.
Figure 17. 60+ Delinquency 6 Months after Modification by Change to Monthly Payments
Includes Loans Modified in 2008-2009
- 45 -
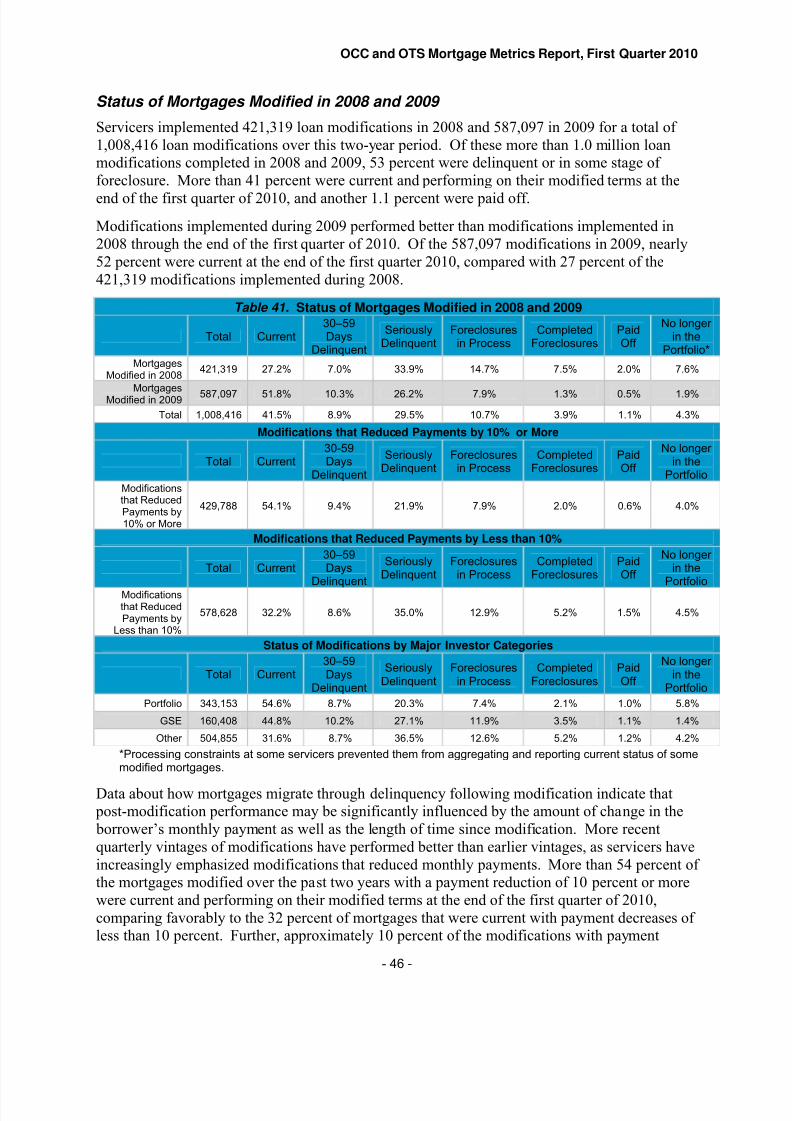
8/9/2019 OCC and OTS Mortgage Metrics Report First Quarter 2010
http://slidepdf.com/reader/full/occ-and-ots-mortgage-metrics-report-first-quarter-2010 46/59
OCC and OTS Mortgage Metrics Report, First Quarter 2010
Status of Mortgages Modified in 2008 and 2009
Servicers implemented 421,319 loan modifications in 2008 and 587,097 in 2009 for a total of 1,008,416 loan modifications over this two-year period. Of these more than 1.0 million loanmodifications completed in 2008 and 2009, 53 percent were delinquent or in some stage of foreclosure. More than 41 percent were current and performing on their modified terms at the
end of the first quarter of 2010, and another 1.1 percent were paid off.
Modifications implemented during 2009 performed better than modifications implemented in2008 through the end of the first quarter of 2010. Of the 587,097 modifications in 2009, nearly52 percent were current at the end of the first quarter 2010, compared with 27 percent of the421,319 modifications implemented during 2008.
Table 41. Status of Mortgages Modified in 2008 and 2009
Total Current Days30–59
Delinquent
SeriouslyDelinquent
Foreclosuresin Process
CompletedForeclosures
PaidOff
No longer in the
Portfolio*Mortgages
Modified in 2008421,319 27.2% 7.0% 33.9% 14.7% 7.5% 2.0% 7.6%
MortgagesModified in 2009 587,097 51.8% 10.3% 26.2% 7.9% 1.3% 0.5% 1.9%
Total 1,008,416 41.5% 8.9% 29.5% 10.7% 3.9% 1.1% 4.3%
Modifications that Reduced Payments by 10% or More
Total Current30-59Days
Delinquent
SeriouslyDelinquent
Foreclosuresin Process
CompletedForeclosures
PaidOff
No longer in the
PortfolioModificationsthat ReducedPayments by10% or More
429,788 54.1% 9.4% 21.9% 7.9% 2.0% 0.6% 4.0%
Modifications that Reduced Payments by Less than 10%
Total Current30–59Days
Delinquent
SeriouslyDelinquent
Foreclosuresin Process
CompletedForeclosures
PaidOff
No longer in the
PortfolioModificationsthat ReducedPayments by
Less than 10%
578,628 32.2% 8.6% 35.0% 12.9% 5.2% 1.5% 4.5%
Status of Modifications by Major Investor Categories
Total Current Days30–59
Delinquent
SeriouslyDelinquent
Foreclosuresin Process
CompletedForeclosures
PaidOff
No longer in the
Portfolio
Portfolio 343,153 54.6% 8.7% 20.3% 7.4% 2.1% 1.0% 5.8%
GSE 160,408 44.8% 10.2% 27.1% 11.9% 3.5% 1.1% 1.4%
Other 504,855 31.6% 8.7% 36.5% 12.6% 5.2% 1.2% 4.2%
*Processing constraints at some servicers prevented them from aggregating and reporting current status of somemodified mortgages.
Data about how mortgages migrate through delinquency following modification indicate that post-modification performance may be significantly influenced by the amount of change in the borrower’s monthly payment as well as the length of time since modification. More recentquarterly vintages of modifications have performed better than earlier vintages, as servicers haveincreasingly emphasized modifications that reduced monthly payments. More than 54 percent of the mortgages modified over the past two years with a payment reduction of 10 percent or morewere current and performing on their modified terms at the end of the first quarter of 2010,comparing favorably to the 32 percent of mortgages that were current with payment decreases of less than 10 percent. Further, approximately 10 percent of the modifications with payment
- 46 -

8/9/2019 OCC and OTS Mortgage Metrics Report First Quarter 2010
http://slidepdf.com/reader/full/occ-and-ots-mortgage-metrics-report-first-quarter-2010 47/59
OCC and OTS Mortgage Metrics Report, First Quarter 2010
reductions of 10 percent or more are in foreclosure or completed the foreclosure processcompared with more than 18 percent of modifications with payment reductions of less than10 percent.
Data have also shown that modified loans held on the balance sheets of servicing institutions performed better than those serviced for GSEs or other third-party investors. Of the 343,153
portfolio loans modified during the past two years (34 percent of all modifications), 54.6 percentwere current at the end of the first quarter of 2010. Of the modified GSE mortgages (16 percentof all modifications), nearly 45 percent were current at the end of the first quarter. Of the other third-party serviced mortgages (40 percent of all modifications), 31.6 percent were current at theend of the first quarter.
- 47 -
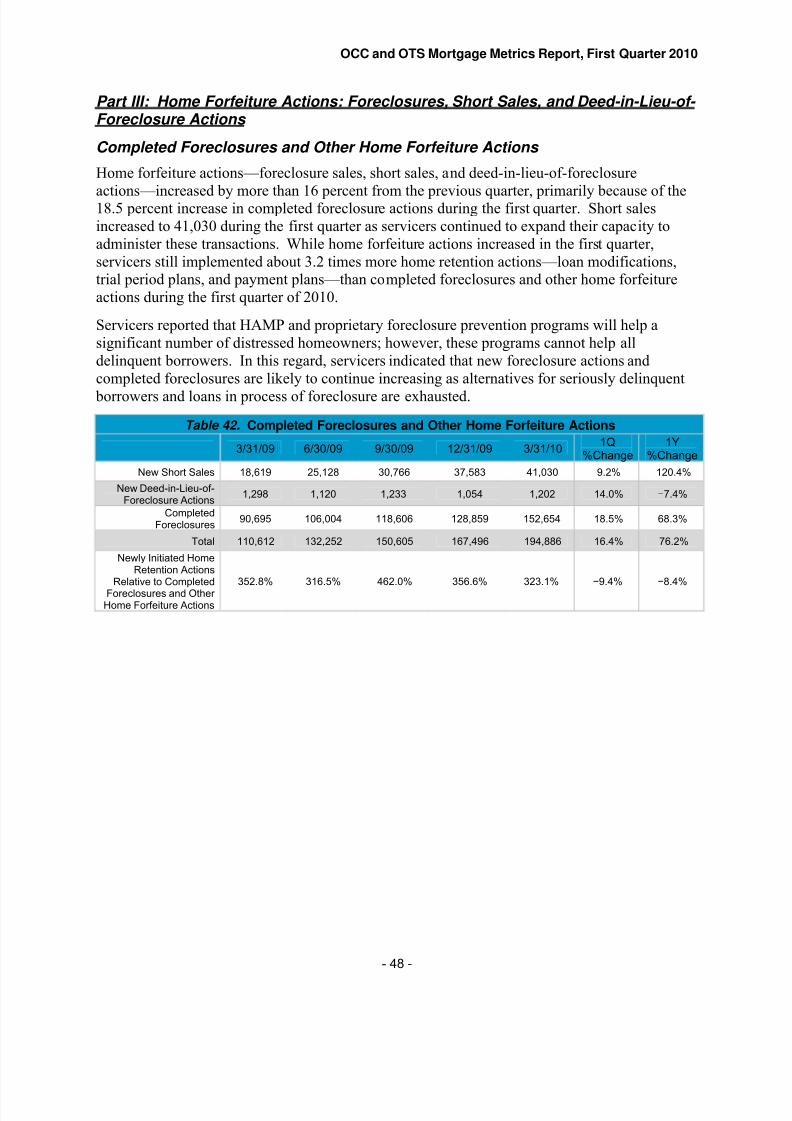
8/9/2019 OCC and OTS Mortgage Metrics Report First Quarter 2010
http://slidepdf.com/reader/full/occ-and-ots-mortgage-metrics-report-first-quarter-2010 48/59
OCC and OTS Mortgage Metrics Report, First Quarter 2010
Part III: Home Forfeiture Actions: Foreclosures, Short Sales, and Deed-in-Lieu-of- Foreclosure Actions
Completed Foreclosures and Other Home Forfeiture Actions
Home forfeiture actions—foreclosure sales, short sales, and deed-in-lieu-of-foreclosure
actions—increased by more than 16 percent from the previous quarter, primarily because of the18.5 percent increase in completed foreclosure actions during the first quarter. Short salesincreased to 41,030 during the first quarter as servicers continued to expand their capacity toadminister these transactions. While home forfeiture actions increased in the first quarter,servicers still implemented about 3.2 times more home retention actions—loan modifications,trial period plans, and payment plans—than completed foreclosures and other home forfeitureactions during the first quarter of 2010.
Servicers reported that HAMP and proprietary foreclosure prevention programs will help asignificant number of distressed homeowners; however, these programs cannot help alldelinquent borrowers. In this regard, servicers indicated that new foreclosure actions andcompleted foreclosures are likely to continue increasing as alternatives for seriously delinquent
borrowers and loans in process of foreclosure are exhausted.
Table 42. Completed Foreclosures and Other Home Forfeiture Actions
3/31/09 6/30/09 9/30/09 12/31/09 3/31/101Q
%Change1Y
%Change
New Short Sales 18,619 25,128 30,766 37,583 41,030 9.2% 120.4%
New Deed-in-Lieu-of-Foreclosure Actions
1,298 1,120 1,233 1,054 1,202 14.0% −7.4%
CompletedForeclosures
90,695 106,004 118,606 128,859 152,654 18.5% 68.3%
Total 110,612 132,252 150,605 167,496 194,886 16.4% 76.2%
Newly Initiated HomeRetention Actions
Relative to CompletedForeclosures and Other
Home Forfeiture Actions
352.8% 316.5% 462.0% 356.6% 323.1% −9.4% −8.4%
- 48 -

8/9/2019 OCC and OTS Mortgage Metrics Report First Quarter 2010
http://slidepdf.com/reader/full/occ-and-ots-mortgage-metrics-report-first-quarter-2010 49/59
OCC and OTS Mortgage Metrics Report, First Quarter 2010
Newly Initiated Foreclosures
The number of newly initiated foreclosures increased by 18.6 percent, to 370,536, during the firstquarter, returning to the levels recorded during the first three quarters of 2009. While a largenumber of loans have been held in a seriously delinquent status for an extended period as borrowers and servicers pursue alternate solutions, foreclosure actions are initiated when
workouts cannot be arranged.
Table 43. Number of Newly Initiated Foreclosures
3/31/09 6/30/09 9/30/09 12/31/09 3/31/101Q
%Change1Y
%Change
Prime 183,441 194,071 179,087 147,419 174,080 18.1% −5.1%
Alt-A 72,702 68,622 69,566 56,399 68,538 21.5% −5.7%
Subprime 75,508 69,383 81,721 63,400 79,308 25.1% 5.0%
Other 38,916 37,150 38,835 45,302 48,610 7.3% 24.9%
Total 370,567 369,226 369,209 312,520 370,536 18.6% 0.0%
Figure 18. Number of Newly Initiated Foreclosures
200,000
150,000
100,000
50,000
0
Prime Alt-A Subprime Other
3/31/09 6/30/09 9/30/09 12/31/09 3/31/2010
- 49 -

8/9/2019 OCC and OTS Mortgage Metrics Report First Quarter 2010
http://slidepdf.com/reader/full/occ-and-ots-mortgage-metrics-report-first-quarter-2010 50/59
OCC and OTS Mortgage Metrics Report, First Quarter 2010
Foreclosures in Process
The number of loans in process of foreclosure increased by 8.5 percent during the first quarter to1,170,874, reflecting the increase in newly initiated foreclosure actions. The ratio of foreclosures in process relative to total serviced mortgages was highest for subprime mortgagesat 8.6 percent and lowest for prime mortgages at 2.4 percent.
As previously mentioned, many mortgages remain in process of foreclosure for longer periodsthan historic norms as borrowers and servicers seek other workout resolutions. In addition, theamount of time required to process foreclosures has increased because of the large number of foreclosure actions and the inventory of foreclosures in process. Servicers indicated that therising inventory of foreclosures in process, 36 percent more than a year ago, is likely to result ina continued increase in completed foreclosure actions.
Table 44. Number of Foreclosures in Process
3/31/09 6/30/09 9/30/09 12/31/09 3/31/101Q
%Change1Y
%Change
Prime 409,313 497,266 540,762 527,792 561,692 6.4% 37.2%
Alt-A 172,268 191,456 205,343 199,254 213,649 7.2% 24.0%
Subprime 184,468 199,432 220,106 216,519 230,503 6.5% 25.0%
Other 94,980 104,400 125,409 135,821 165,030 21.5% 73.8%
Total 861,029 992,554 1,091,620 1,079,386 1,170,874 8.5% 36.0%
Percentages of Foreclosures in Process Relative to Mortgages in That Risk Category
Prime 1.8% 2.2% 2.3% 2.3% 2.4% 6.9% 36.2%
Alt-A 4.9% 5.4% 5.8% 5.6% 6.0% 7.0% 22.4%
Subprime 6.4% 7.0% 7.9% 7.8% 8.6% 10.1% 35.3%
Other 2.0% 2.3% 2.7% 3.1% 3.6% 14.8% 81.1%
Total 2.5% 2.9% 3.2% 3.2% 3.5% 8.2% 36.8%
Figure 19. Number of Foreclosures in Process
600,000
400,000
200,000
0
Prime Alt-A Subprime Other
3/31/09 6/30/09 9/30/09 12/31/09 3/31/10
- 50 -
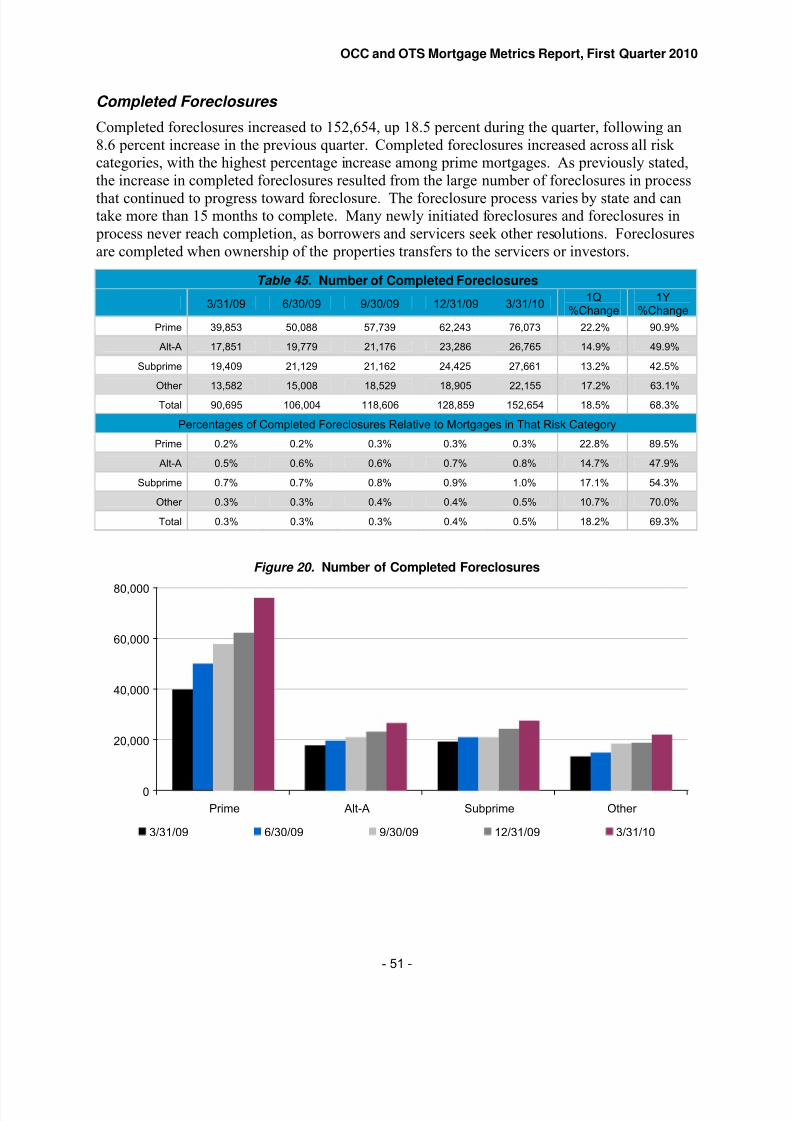
8/9/2019 OCC and OTS Mortgage Metrics Report First Quarter 2010
http://slidepdf.com/reader/full/occ-and-ots-mortgage-metrics-report-first-quarter-2010 51/59
OCC and OTS Mortgage Metrics Report, First Quarter 2010
Completed Foreclosures
Completed foreclosures increased to 152,654, up 18.5 percent during the quarter, following an8.6 percent increase in the previous quarter. Completed foreclosures increased across all risk categories, with the highest percentage increase among prime mortgages. As previously stated,the increase in completed foreclosures resulted from the large number of foreclosures in process
that continued to progress toward foreclosure. The foreclosure process varies by state and cantake more than 15 months to complete. Many newly initiated foreclosures and foreclosures in process never reach completion, as borrowers and servicers seek other resolutions. Foreclosuresare completed when ownership of the properties transfers to the servicers or investors.
Table 45. Number of Completed Foreclosures
3/31/09 6/30/09 9/30/09 12/31/09 3/31/101Q
%Change1Y
%Change
Prime 39,853 50,088 57,739 62,243 76,073 22.2% 90.9%
Alt-A 17,851 19,779 21,176 23,286 26,765 14.9% 49.9%
Subprime 19,409 21,129 21,162 24,425 27,661 13.2% 42.5%
Other 13,582 15,008 18,529 18,905 22,155 17.2% 63.1%
Total 90,695 106,004 118,606 128,859 152,654 18.5% 68.3%
Percentages of Completed Foreclosures Relative to Mortgages in That Risk Category
Prime 0.2% 0.2% 0.3% 0.3% 0.3% 22.8% 89.5%
Alt-A 0.5% 0.6% 0.6% 0.7% 0.8% 14.7% 47.9%
Subprime 0.7% 0.7% 0.8% 0.9% 1.0% 17.1% 54.3%
Other 0.3% 0.3% 0.4% 0.4% 0.5% 10.7% 70.0%
Total 0.3% 0.3% 0.3% 0.4% 0.5% 18.2% 69.3%
Figure 20. Number of Completed Foreclosures
80,000
60,000
40,000
20,000
0
Prime Alt-A Subprime Other
3/31/09 6/30/09 9/30/09 12/31/09 3/31/10
- 51 -
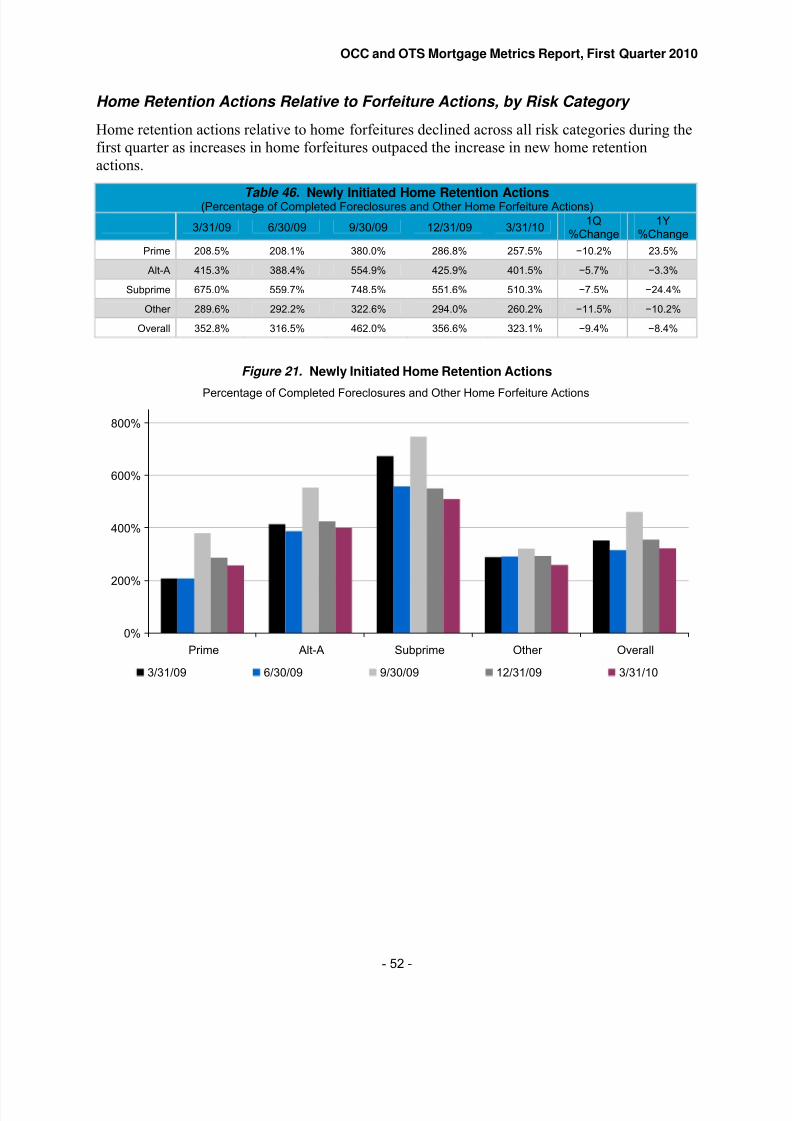
8/9/2019 OCC and OTS Mortgage Metrics Report First Quarter 2010
http://slidepdf.com/reader/full/occ-and-ots-mortgage-metrics-report-first-quarter-2010 52/59
OCC and OTS Mortgage Metrics Report, First Quarter 2010
Home Retention Actions Relative to Forfeiture Actions, by Risk Category
Home retention actions relative to home forfeitures declined across all risk categories during thefirst quarter as increases in home forfeitures outpaced the increase in new home retentionactions.
Table 46. Newly Initiated Home Retention Actions(Percentage of Completed Foreclosures and Other Home Forfeiture Actions)
3/31/09 6/30/09 9/30/09 12/31/09 3/31/101Q
%Change1Y
%Change
Prime 208.5% 208.1% 380.0% 286.8% 257.5% −10.2% 23.5%
Alt-A 415.3% 388.4% 554.9% 425.9% 401.5% −5.7% −3.3%
Subprime 675.0% 559.7% 748.5% 551.6% 510.3% −7.5% −24.4%
Other 289.6% 292.2% 322.6% 294.0% 260.2% −11.5% −10.2%
Overall 352.8% 316.5% 462.0% 356.6% 323.1% −9.4% −8.4%
Figure 21. Newly Initiated Home Retention Actions
Percentage of Completed Foreclosures and Other Home Forfeiture Actions
800%
600%
400%
200%
0%
Prime Alt-A Subprime Other Overall
3/31/09 6/30/09 9/30/09 12/31/09 3/31/10
- 52 -
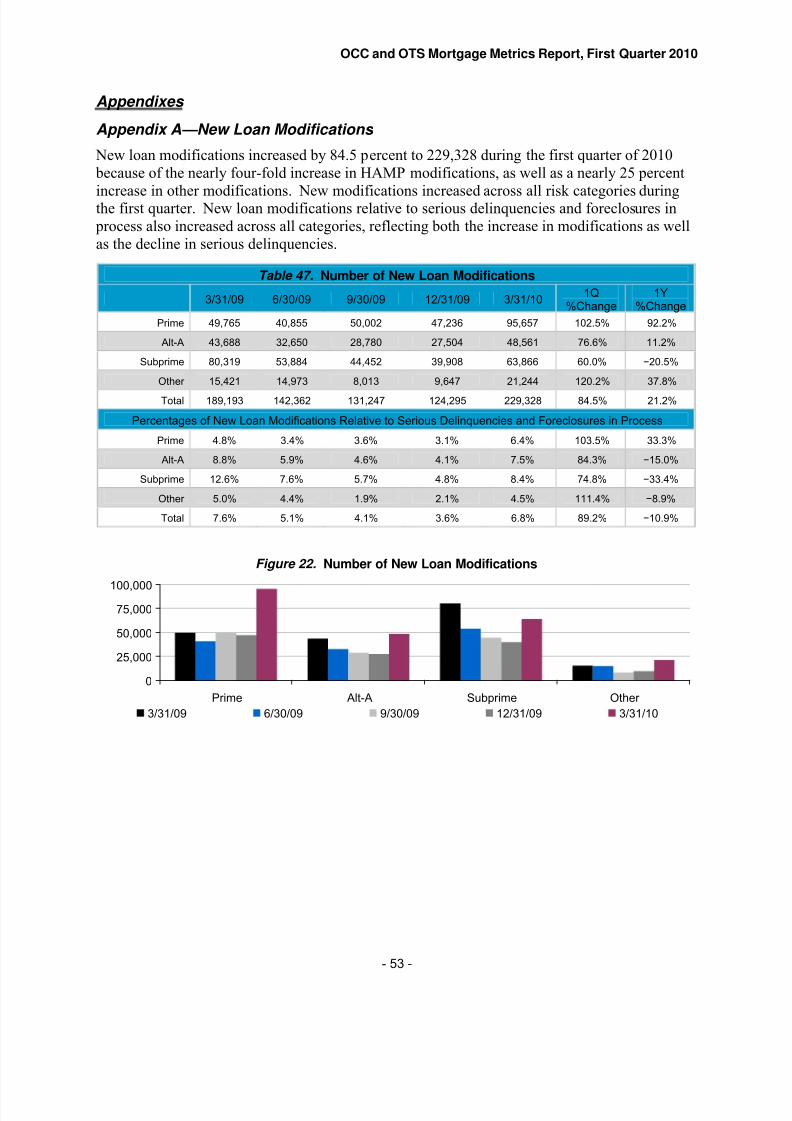
8/9/2019 OCC and OTS Mortgage Metrics Report First Quarter 2010
http://slidepdf.com/reader/full/occ-and-ots-mortgage-metrics-report-first-quarter-2010 53/59
OCC and OTS Mortgage Metrics Report, First Quarter 2010
Appendixes
Appendix A—New Loan Modifications
New loan modifications increased by 84.5 percent to 229,328 during the first quarter of 2010 because of the nearly four-fold increase in HAMP modifications, as well as a nearly 25 percent
increase in other modifications. New modifications increased across all risk categories duringthe first quarter. New loan modifications relative to serious delinquencies and foreclosures in process also increased across all categories, reflecting both the increase in modifications as wellas the decline in serious delinquencies.
Table 47. Number of New Loan Modifications
3/31/09 6/30/09 9/30/09 12/31/09 3/31/101Q
%Change1Y
%Change
Prime 49,765 40,855 50,002 47,236 95,657 102.5% 92.2%
Alt-A 43,688 32,650 28,780 27,504 48,561 76.6% 11.2%
Subprime 80,319 53,884 44,452 39,908 63,866 60.0% −20.5%
Other 15,421 14,973 8,013 9,647 21,244 120.2% 37.8%
Total 189,193 142,362 131,247 124,295 229,328 84.5% 21.2%
Percentages of New Loan Modifications Relative to Serious Delinquencies and Foreclosures in Process
Prime 4.8% 3.4% 3.6% 3.1% 6.4% 103.5% 33.3%
Alt-A 8.8% 5.9% 4.6% 4.1% 7.5% 84.3% −15.0%
Subprime 12.6% 7.6% 5.7% 4.8% 8.4% 74.8% −33.4%
Other 5.0% 4.4% 1.9% 2.1% 4.5% 111.4% −8.9%
Total 7.6% 5.1% 4.1% 3.6% 6.8% 89.2% −10.9%
Figure 22. Number of New Loan Modifications
0
25,000
50,000
75,000
100,000
Prime Alt-A Subprime Other
3/31/09 6/30/09 9/30/09 12/31/09 3/31/10
- 53 -
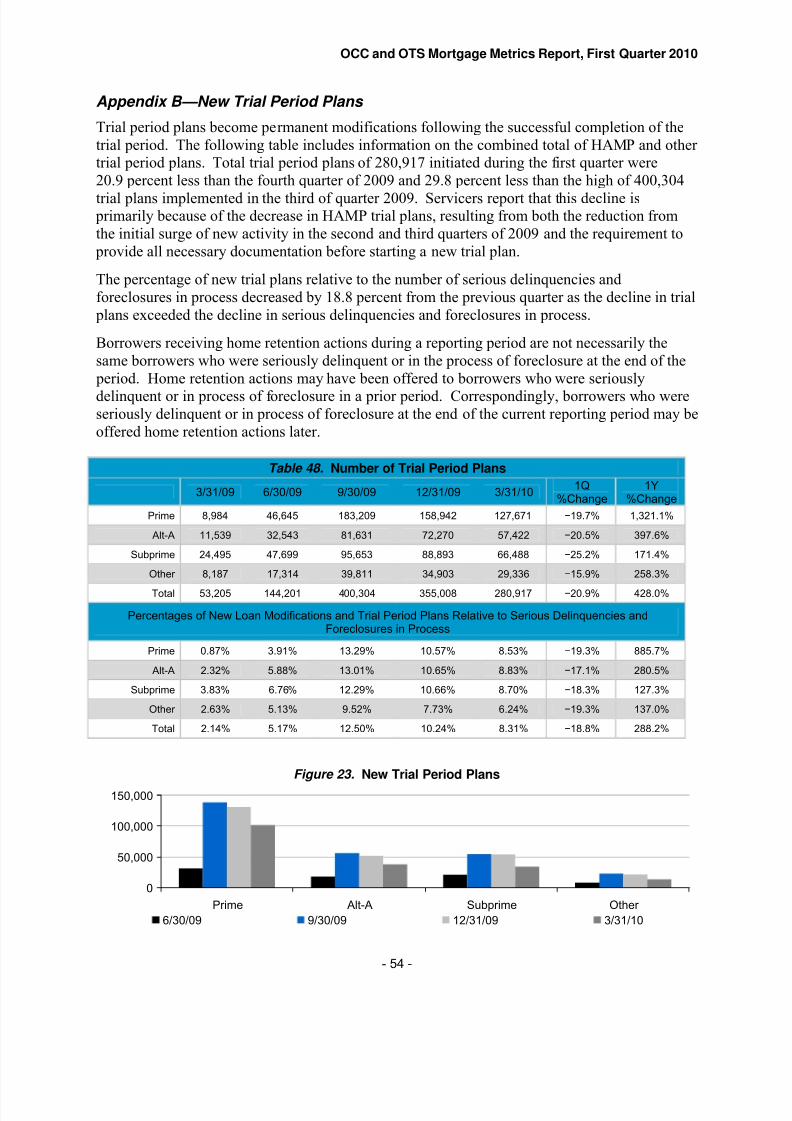
8/9/2019 OCC and OTS Mortgage Metrics Report First Quarter 2010
http://slidepdf.com/reader/full/occ-and-ots-mortgage-metrics-report-first-quarter-2010 54/59
OCC and OTS Mortgage Metrics Report, First Quarter 2010
Appendix B—New Trial Period Plans
Trial period plans become permanent modifications following the successful completion of thetrial period. The following table includes information on the combined total of HAMP and other trial period plans. Total trial period plans of 280,917 initiated during the first quarter were20.9 percent less than the fourth quarter of 2009 and 29.8 percent less than the high of 400,304
trial plans implemented in the third of quarter 2009. Servicers report that this decline is primarily because of the decrease in HAMP trial plans, resulting from both the reduction fromthe initial surge of new activity in the second and third quarters of 2009 and the requirement to provide all necessary documentation before starting a new trial plan.
The percentage of new trial plans relative to the number of serious delinquencies andforeclosures in process decreased by 18.8 percent from the previous quarter as the decline in trial plans exceeded the decline in serious delinquencies and foreclosures in process.
Borrowers receiving home retention actions during a reporting period are not necessarily thesame borrowers who were seriously delinquent or in the process of foreclosure at the end of the period. Home retention actions may have been offered to borrowers who were seriously
delinquent or in process of foreclosure in a prior period. Correspondingly, borrowers who wereseriously delinquent or in process of foreclosure at the end of the current reporting period may beoffered home retention actions later.
Table 48. Number of Trial Period Plans
3/31/09 6/30/09 9/30/09 12/31/09 3/31/101Q
%Change1Y
%Change
Prime 8,984 46,645 183,209 158,942 127,671 −19.7% 1,321.1%
Alt-A 11,539 32,543 81,631 72,270 57,422 −20.5% 397.6%
Subprime 24,495 47,699 95,653 88,893 66,488 −25.2% 171.4%
Other 8,187 17,314 39,811 34,903 29,336 −15.9% 258.3%
Total
Percentag
Prime
53,205 144,201 400,304 355,008 280,917
es of New Loan Modifications and Trial Period Plans Relative to Serious Delinquencies andForeclosures in Process
0.87% 3.91% 13.29% 10.57% 8.53%
−20.9%
−19.3%
428.0%
885.7%
Alt-A 2.32% 5.88% 13.01% 10.65% 8.83% −17.1% 280.5%
Subprime 3.83% 6.76% 12.29% 10.66% 8.70% −18.3% 127.3%
Other 2.63% 5.13% 9.52% 7.73% 6.24% −19.3% 137.0%
Total 2.14% 5.17% 12.50% 10.24% 8.31% −18.8% 288.2%
Figure 23. New Trial Period Plans
0
50,000
100,000
150,000
Prime Alt-A Subprime Other
6/30/09 9/30/09 12/31/09 3/31/10
- 54 -

8/9/2019 OCC and OTS Mortgage Metrics Report First Quarter 2010
http://slidepdf.com/reader/full/occ-and-ots-mortgage-metrics-report-first-quarter-2010 55/59
Figure 24. Number of New Payment Plans
250,000
200,000
150,000
100,000
50,000
0
Prime Alt-A Subprime Other
3/31/09 6/30/09 9/30/09 12/31/09 3/31/10
OCC and OTS Mortgage Metrics Report, First Quarter 2010
Appendix C—New Payment Plans
New payment plans declined by 15.4 percent to 400,350 during the first quarter of 2010. New payment plans decreased across all risk categories in the first quarter, continuing the declinesreported in the prior quarter, as servicers emphasized HAMP and other trial period plans insteadof shorter-term payment plans. The number of new payment plans relative to the number of
borrowers seriously delinquent or in process of foreclosure also decreased during the first quarter as the decline in the number of payment plans exceeded declines in serious delinquencies.
Table 49. Number of New Payment Plans
3/31/09 6/30/09 9/30/09 12/31/09 3/31/101Q
%Change1Y
%Change
Prime 57,410 96,546 247,297 203,869 171,942 −15.7% 199.5%
Alt-A 44,099 60,082 115,393 95,671 82,916 −13.3% 88.0%
Subprime 68,555 81,398 139,397 116,402 97,656 −16.1% 42.4%
Other 30,947 38,149 62,412 57,006 47,836 −16.1% 54.6%
Total 201,011 276,175 564,499 472,948 400,350 −15.4% 99.2%
Percentages of New Payment Plans Relative to Serious Delinquencies and Foreclosures in ProcessPrime 0.3% 0.4% 1.1% 0.9% 0.7% −15.3% 197.3%
Alt-A 1.3% 1.7% 3.3% 2.7% 2.3% −13.5% 85.5%
Subprime 2.4% 2.9% 5.0% 4.2% 3.7% −13.2% 54.2%
Other 0.6% 0.8% 1.3% 1.3% 1.0% −20.7% 61.1%
Total 0.6% 0.8% 1.7% 1.4% 1.2% −15.5% 100.3%
- 55 -
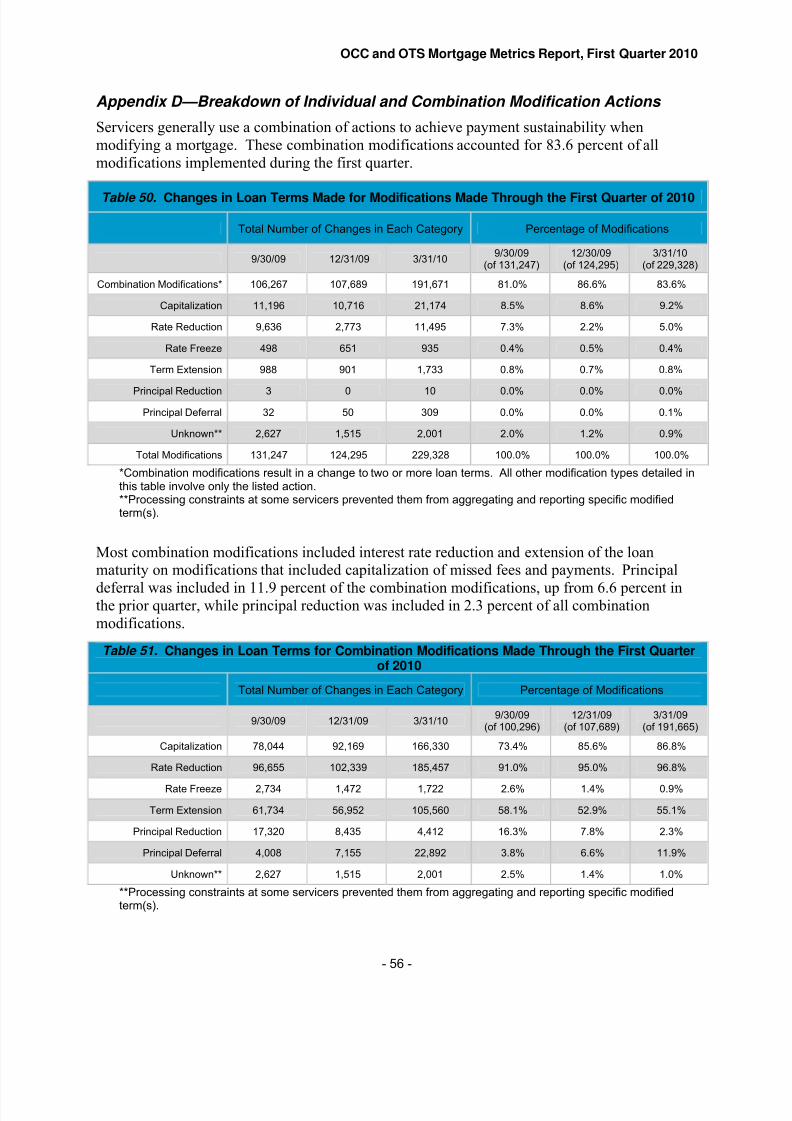
8/9/2019 OCC and OTS Mortgage Metrics Report First Quarter 2010
http://slidepdf.com/reader/full/occ-and-ots-mortgage-metrics-report-first-quarter-2010 56/59
OCC and OTS Mortgage Metrics Report, First Quarter 2010
Appendix D—Breakdown of Individual and Combination Modification Actions
Servicers generally use a combination of actions to achieve payment sustainability whenmodifying a mortgage. These combination modifications accounted for 83.6 percent of allmodifications implemented during the first quarter.
Table 50. Changes in Loan Terms Made for Modifications Made Through the First Quarter of 2010
Total Number of Changes in Each Category Percentage of Modifications
9/30/09 12/31/09 3/31/109/30/09
(of 131,247)12/30/09
(of 124,295)3/31/10
(of 229,328)
Combination Modifications* 106,267 107,689 191,671 81.0% 86.6% 83.6%
Capitalization 11,196 10,716 21,174 8.5% 8.6% 9.2%
Rate Reduction 9,636 2,773 11,495 7.3% 2.2% 5.0%
Rate Freeze 498 651 935 0.4% 0.5% 0.4%
Term Extension 988 901 1,733 0.8% 0.7% 0.8%
Principal Reduction 3 0 10 0.0% 0.0% 0.0%
Principal Deferral 32 50 309 0.0% 0.0% 0.1%
Unknown** 2,627 1,515 2,001 2.0% 1.2% 0.9%
Total Modifications 131,247 124,295 229,328 100.0% 100.0% 100.0%
*Combination modifications result in a change to two or more loan terms. All other modification types detailed in this table involve only the listed action. **Processing constraints at some servicers prevented them from aggregating and reporting specific modified term(s).
Most combination modifications included interest rate reduction and extension of the loanmaturity on modifications that included capitalization of missed fees and payments. Principal
deferral was included in 11.9 percent of the combination modifications, up from 6.6 percent inthe prior quarter, while principal reduction was included in 2.3 percent of all combinationmodifications.
Table 51. Changes in Loan Terms for Combination Modifications Made Through the First Quarterof 2010
Total Number of Changes in Each Category Percentage of Modifications
9/30/09 12/31/09 3/31/109/30/09
(of 100,296)12/31/09
(of 107,689)3/31/09
(of 191,665)
Capitalization 78,044 92,169 166,330 73.4% 85.6% 86.8%
Rate Reduction 96,655 102,339 185,457 91.0% 95.0% 96.8%
Rate Freeze 2,734 1,472 1,722 2.6% 1.4% 0.9%
Term Extension 61,734 56,952 105,560 58.1% 52.9% 55.1%
Principal Reduction 17,320 8,435 4,412 16.3% 7.8% 2.3%
Principal Deferral 4,008 7,155 22,892 3.8% 6.6% 11.9%
Unknown** 2,627 1,515 2,001 2.5% 1.4% 1.0%
**Processing constraints at some servicers prevented them from aggregating and reporting specific modifiedterm(s).
- 56 -
8/9/2019 OCC and OTS Mortgage Metrics Report First Quarter 2010
http://slidepdf.com/reader/full/occ-and-ots-mortgage-metrics-report-first-quarter-2010 57/59
OCC and OTS Mortgage Metrics Report, First Quarter 2010
Index of Tables
Table 1. Number of New Home Retention Actions....................................................................... 5
Table 6. Newly Initiated Home Retention Actions Compared with New Home Forfeiture
Table 18. Newly Initiated Home Retention Actions by Risk Category (Percentage of Newly Table 19. Changes in Loan Terms for Modifications Made Through the First Table 20. Changes in Loan Terms for HAMP Modifications Made Permanent Through Table 21. Numbers of Each Type of Modification, by Risk Category in First Table 22. Percentages of Each Type of Modification, by Risk Category in First
Table 2. Status of Mortgages Modified in 2008 and 2009 ............................................................ 6 Table 3. Modified Loans 60 or More Days Delinquent................................................................. 7 Table 4. Re-Default Rates for Portfolio Loans and Loans Serviced for Others ............................ 7 Table 5. Re-Default Rates of Loans Modified in 2008–2009, by Changes in Payment................ 8 Actions ............................................................................................................................................ 9 Table 7. Completed Foreclosures and Other Home Forfeiture Actions ........................................ 9 Table 8. Overall Mortgage Portfolio............................................................................................ 14 Table 9. Overall Portfolio Performance (Percentage of All Mortgages in the Portfolio)........... 15 Table 10. Performance of Government-Guaranteed* Mortgages (Percent) ................................ 17 Table 11. Performance of GSE Mortgages (Percent) .................................................................. 18 Table 12. Performance of Option ARMs (Percent) ..................................................................... 19 Table 13. Seriously Delinquent Mortgages (Percentage of Mortgages in Each Category)......... 20 Table 14. Mortgages 30-59 Days Delinquent (Percentage of Mortgages in Each Category)...... 21 Table 15. Number of New Home Retention Actions................................................................... 23 Table 16. HAMP Modifications, by Investor and Risk Category................................................ 24 Table 17. HAMP Trial Period Plans, by Investor and Risk Category ......................................... 24 Initiated Foreclosures) .................................................................................................................. 25 Quarter of 2010............................................................................................................................. 26 the First Quarter of 2010............................................................................................................... 27
Quarter 2010 ................................................................................................................................. 28
Quarter 2010 ................................................................................................................................. 28 Table 23. Numbers of Each Type of Modification, by Investor, in First Quarter 2010 .............. 29 Table 24. Percentages of Each Type of Modification, by Investor, in First Quarter 2010.......... 29 Table 25. Numbers of Each Type of HAMP Modifications by Investor in First Quarter 2010 .. 30
- 57 -
8/9/2019 OCC and OTS Mortgage Metrics Report First Quarter 2010
http://slidepdf.com/reader/full/occ-and-ots-mortgage-metrics-report-first-quarter-2010 58/59
OCC and OTS Mortgage Metrics Report, First Quarter 2010
Table 26. Percentages of Each Type of HAMP Modifications by Investor in First Quarter 2010......................................................................................................................... 30
Table 29. Changes in Monthly Principal and Interest Payments Resulting fromTable 30. Changes in Monthly Principal and Interest Payments Resulting from HAMP
Table 35. Re-Default Rates for Portfolio Loans and Loans Serviced for Others
Table 50. Changes in Loan Terms Made for Modifications Made Through the Table 51. Changes in Loan Terms for Combination Modifications Made Through the
Table 27. Numbers of Each Type of Option ARM Modification in First Quarter 2010 ............. 31 Table 28. Percentages of Each Type of Option ARM Modification in First Quarter 2010......... 31 Modifications (Number of Modifications).................................................................................... 33 Modifications (Number of HAMP Modifications)*..................................................................... 35 Table 31. Modified Loans 60 or More Days Delinquent............................................................. 36 Table 32. Modified Loans 30 or More Days Delinquent............................................................. 37 Table 33. Modified Loans 90 or More Days Delinquent............................................................. 38 Table 34. Re-Default Rates for Portfolio Loans and Loans Serviced for Others ........................ 39 Modified in 2008 (60 or More Days Delinquent)*....................................................................... 40 Table 36. Re-Default Rates for Portfolio Loans and Loans Serviced for Others ........................ 40 Table 37. Modified Option ARMSs 60 or More Days Delinquent.............................................. 41 Table 38. Performance of HAMP Modifications Compared with Modifications Overall .......... 42 Table 39. Re-Default Rates of Loans Modified in 2008–2009 by Changes in Payment............. 44 Table 40. 60+ Delinquency at 6 Months after Modification by Change to Monthly Payments.. 45 Table 41. Status of Mortgages Modified in 2008 and 2009 ........................................................ 46 Table 42. Completed Foreclosures and Other Home Forfeiture Actions .................................... 48 Table 43. Number of Newly Initiated Foreclosures..................................................................... 49 Table 44. Number of Foreclosures in Process ............................................................................. 50 Table 45. Number of Completed Foreclosures............................................................................ 51 Table 46. Newly Initiated Home Retention Actions.................................................................... 52 Table 47. Number of New Loan Modifications........................................................................... 53 Table 48. Number of Trial Period Plans ...................................................................................... 54 Table 49. Number of New Payment Plans................................................................................... 55 First Quarter of 2010..................................................................................................................... 56 First Quarter of 2010..................................................................................................................... 56
- 58 -
8/9/2019 OCC and OTS Mortgage Metrics Report First Quarter 2010
http://slidepdf.com/reader/full/occ-and-ots-mortgage-metrics-report-first-quarter-2010 59/59
OCC and OTS Mortgage Metrics Report, First Quarter 2010
Index of Figures
Figure 1. Portfolio Composition.................................................................................................. 14 Figure 2. Overall Portfolio Performance..................................................................................... 16 Figure 3. Performance of Government-Guaranteed Mortgages.................................................. 17 Figure 4. Performance of GSE Mortgages .................................................................................. 18 Figure 5. Performance of Option ARMs ..................................................................................... 19 Figure 6. Seriously Delinquent Mortgages.................................................................................. 20 Figure 7. Mortgages 30–59 Days Delinquent.............................................................................. 21 Figure 8. Number of New Home Retention Actions................................................................... 23 Figure 9. Newly Initiated Home Retention Actions by Risk Category....................................... 25 Figure 10. Changes in Monthly Principal and Interest Payments ............................................... 34 Figure 11. Modified Loans 60 or More Days Delinquent........................................................... 36 Figure 12. Modified Loans 30 or More Days Delinquent........................................................... 37 Figure 13. Modified Loans 90 or More Days Delinquent........................................................... 38 Figure 14. 60 or More Days Delinquent by Investor after Modification .................................... 39 Figure 15. Performance of HAMP Modifications....................................................................... 42 Figure 16. Re-Default Rates of Loans Modified in 2008–2009 by Change in Payment............. 44 Figure 17. 60+ Delinquency 6 Months after Modification by Change to Monthly Payments.... 45 Figure 18. Number of Newly Initiated Foreclosures................................................................... 49 Figure 19. Number of Foreclosures in Process ........................................................................... 50 Figure 20. Number of Completed Foreclosures .......................................................................... 51 Figure 21. Newly Initiated Home Retention Actions.................................................................. 52 Figure 22. Number of New Loan Modifications......................................................................... 53 Figure 23. New Trial Period Plans .............................................................................................. 54 Figure 24. Number of New Payment Plans................................................................................. 55