obstacles to sme growth in peru: an empirical …
TRANSCRIPT

OBSTACLES TO SME GROWTH IN PERU: AN EMPIRICAL ANALYSIS OF THE EFFECT OF LABOR CONSTRAINTS
ON FIRM PERFORMANCE
A Thesis submitted to the Faculty of the
Graduate School of Arts and Sciences of Georgetown University
in partial fulfillment of the requirements for the degree of
Master of Public Policy
By
Siobhan Pangerl B.S.
Washington, D.C. April 17, 2013

ii
Copyright 2013 by Siobhan Pangerl All Rights Reserved

iii
OBSTACLES TO SME GROWTH IN PERU: AN EMPIRICAL ANALYSIS OF THE EFFECT OF LABOR CONSTRAINTS
ON FIRM PERFORMANCE
Siobhan Pangerl, B.S.
Thesis Advisor: Andreas Kern, Ph.D.
ABSTRACT
Several studies have shown that access to finance is critical for firm growth, but scant
research has demonstrated the impact of human capital constraints on firm performance. This
study analyzes the impact of labor constraints on firm growth with an emphasis on small and
medium size enterprises (SMEs). In Peru, SMEs play a critical role in the economy, accounting
for nearly all businesses and employing over half of the active working population. According to
the 2010 World Bank Enterprise Surveys, over one-third of all Peruvian firms cite an
inadequately trained workforce as the major obstacle to growth. Using OLS regression analyses,
this study investigates how human capital constraints affect firm performance and whether these
effects vary by firm size. The findings of this analysis indicate the importance of looking beyond
credit constraints to help fuel small business growth in developing countries. Complex labor
regulations are found to have a negative impact on firm growth, with a larger effect on small
businesses. These results have important policy implications for incentivizing governments to
invest in long-term policies that benefit both the firm and the worker.

iv
TABLE OF CONTENTS
I. Introduction ……………………………………………………………………… 1
II. Literature Review………………………………………………………………... 5
III. Conceptual Framework...…………..…………………………………………… 12
IV. Data ..…………………………………………………………………………… 15
V. Estimation Results ………………………………………………………………. 20
VI. Sensitivity Analysis ….………………………………………………………… 27
VII. Policy Implications …….……………………………………………………… 30
VIII. Concluding Remarks ...……………………………………………………….. 34
IX. Appendix …………..…………………………………………………………... 37
X. References..……………………………………………………………………… 41
v
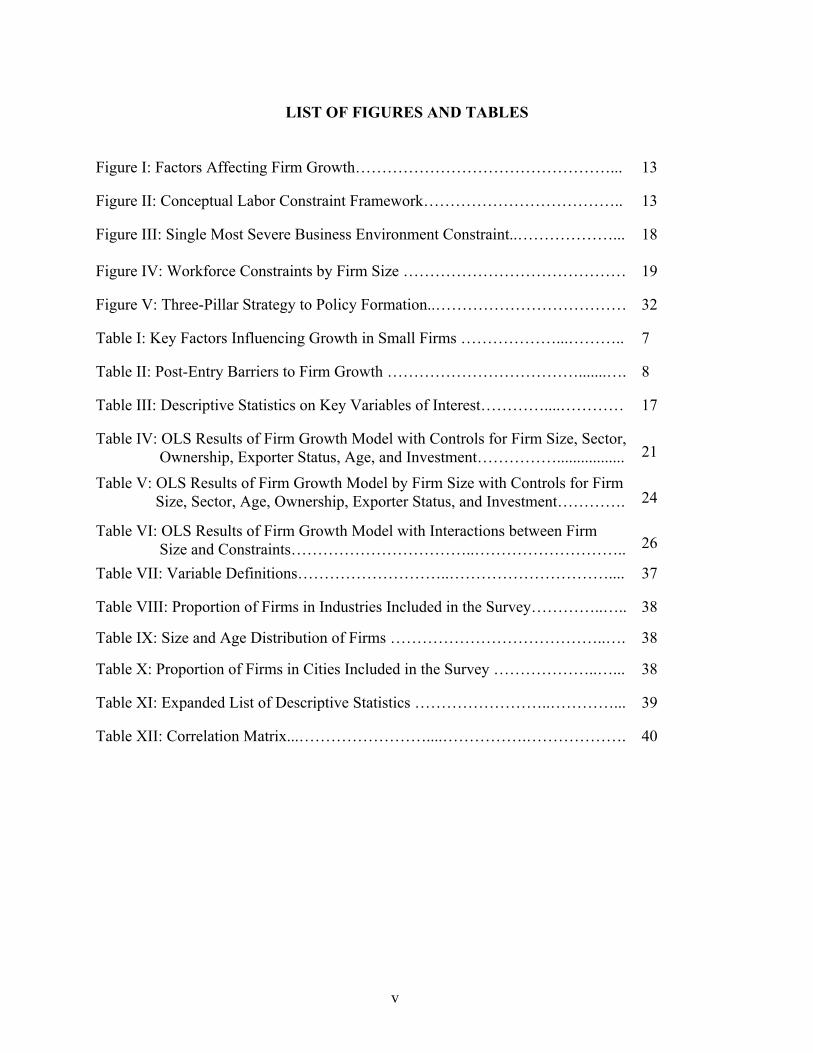
LIST OF FIGURES AND TABLES
Figure I: Factors Affecting Firm Growth…………………………………………... 13
Figure II: Conceptual Labor Constraint Framework……………………………….. 13
Figure III: Single Most Severe Business Environment Constraint..………………... 18
Figure IV: Workforce Constraints by Firm Size …………………………………… 19
Figure V: Three-Pillar Strategy to Policy Formation..……………………………… 32
Table I: Key Factors Influencing Growth in Small Firms ………………...……….. 7
Table II: Post-Entry Barriers to Firm Growth ……………………………….......…. 8
Table III: Descriptive Statistics on Key Variables of Interest…………....………… 17
Table IV: OLS Results of Firm Growth Model with Controls for Firm Size, Sector, Ownership, Exporter Status, Age, and Investment……………................. 21
Table V: OLS Results of Firm Growth Model by Firm Size with Controls for Firm Size, Sector, Age, Ownership, Exporter Status, and Investment…………. 24
Table VI: OLS Results of Firm Growth Model with Interactions between Firm Size and Constraints……………………………..……………………….. 26
Table VII: Variable Definitions………………………..………………………….... 37
Table VIII: Proportion of Firms in Industries Included in the Survey…………..….. 38
Table IX: Size and Age Distribution of Firms …………………………………..…. 38
Table X: Proportion of Firms in Cities Included in the Survey ………………..…... 38
Table XI: Expanded List of Descriptive Statistics ……………………..…………... 39
Table XII: Correlation Matrix...……………………....…………….………………. 40

1
I. INTRODUCTION
In July 2012 Ollanta Humala gave his second presidential address, challenging Peru to
become “one of the economies with the greatest growth and social inclusion in the world
[through dedicated] efforts to be a more productive, competitive country, and one with less
dependence on natural resources.”1 As Peru continues to be one of the fastest growing economies
in South America, Peruvian businesses are poised to expand.2! As part of this plan, Humala
called for a doubling in the number of small and medium sized (SME) firms that export by 2016.
Before SME firms can set out to achieve this ambitious goal, they must first overcome domestic
barriers that hinder their expansion into the global market. World Bank Enterprise Survey data
(2010) shows that access to an adequately trained work force is one of the major obstacles to
growth confronted by Peruvian firms. For Peru to reach its economic potential, developing high-
skilled human capital is a priority as the country sets out to double the level of SME exports.
With the underlying hypothesis that larger firms are less likely to be hindered by human capital
constraints than are SMEs, this study investigates how an inadequately trained workforce affects
firm performance in Peru and whether these effects vary by firm size.
Peru has seen substantial progress in fostering sustained economic growth through
prudent macroeconomic policies, positive terms of trade, and a high level of foreign direct
investment.3 Previously dominated primarily by export commodities, Peru’s market-oriented
economy has begun to diversify.4 In particular, private investment in the SME sector has helped
maintain economic growth and may be an indication that a more sustained period of prosperity is !!!!!!!!!!!!!!!!!!!!!!!!!!!!!!!!!!!!!!!!!!!!!!!!!!!!!!!!1!Quote translated from the annual “Message to the Nation from the President Ollanta Humala for the 191st Anniversary of the Independence of Peru” given on July 28, 2012 in Lima, Peru. 2 Since 2002, Peru has grown at an average GDP growth rate of 6.3%, reversing thirty years of economic stagnation between 1960 and 1990 (IMF, 2013). As a result of strong growth, the World Bank now classifies Peru as an upper middle-income country. 3 Efforts to improve the current macro-fiscal framework are underway. The government is seeking to refine the framework to better ensure the efficient use of growing commodity revenues while maintaining macroeconomic stability (IMF, 2013).
2
likely in coming years. Even with an optimistic macroeconomic future, many individual firms
are struggling to expand due to low-levels of human capital, as well as, a poor labor regulatory
framework that create information failures between firms and qualified workers. Firms in
developing countries, like Peru, face a stark challenge as they battle to move up the value chain
and succeed fast growing markets.
SMEs play a critical role in fueling economic growth in both developing and developed
countries. SMEs contribute to the production of goods and services, playing an important role in
job creation and innovation. A substantial body of research has shown a positive relationship
between the relative size of the SME sector in a country and economic growth (Beck et al.,
2005), typically comprising over 90% of all firms in both low and high-income countries
(OECD, 2005). Despite their significant contribution, SME firms, especially in developing
countries, face major barriers to expansion. While growth in the SME sector is dependent on
both capital and labor inputs, most academic research focuses heavily on the effect of capital
constraints on firm growth.5 Firms in developing countries rarely have access to the skilled
human capital necessary to complement capital inputs. For this reason, an assessment of the
impact of an inadequately trained workforce on firm growth is a much-needed complement to the
academic and policy discussions on SME growth in developing countries.
The empirical evidence on the drivers of firm growth is diverse. While much of the early
research on firm growth focuses on size and age, subsequent studies uncover relationships
between a broader range of firm characteristics and firm post-entry performance, including
skilled labor and management ability (Storey, 1994). Following this tradition, this study analyzes
!!!!!!!!!!!!!!!!!!!!!!!!!!!!!!!!!!!!!!!!!!!!!!!!!!!!!!!!!!!!!!!!!!!!!!!!!!!!!!!!!!!!!!!!!!!!!!!!!!!!!!!!!!!!!!!!!!!!!!!!!!!!!!!!!!!!!!!!!!!!!!!!!!!!!!!!!!!!!!!!!!!!!!!!!!!!!!!!!!!4!In addition to prudent domestic policy, Peru remains active in engaging the global economy through regional integration and has signed over ten bilateral free trade agreements (i.e. the United States, Chile, Singapore, China, Japan, Mexico, and the European Union) (MINCETUR, 2013).!5 For example: Beck and Demirgic-Kent (2006), Bechetti and Trovado (2002), Klapper et al. (2004), and Djankov et al. (2002)
3
the impact of workforce constraints on firm growth in Peru. It builds upon earlier research on
the impact of human capital as a major driver of firm performance. Furthermore, it assesses
whether firms of different sizes are equally constrained by human capital. Developing a skilled
labor force is an integral step in fostering a business environment conducive to investments in
new technologies and infrastructure. However, for these investments to be productive, firms
require a workforce with the technical skills necessary to produce higher value products that
enable firms to integrate into the global value chain (Robertson, 2003).
To spur growth and attract greater foreign investment, Peru has replaced its once highly
protective labor system with a more flexible pro-enterprise system characterized by strong
managerial authority. The rapid liberalization of the labor market eliminated many of the
institutions responsible for granting collective bargaining power to workers, shifting the balance
heavily in favor of the employer (Chacaltana, 2003). This has had a highly negative impact on
job quality for workers in the SME sector. Recently, regulations targeted specifically at micro
and small firms in Peru have worsened the incentives for long-term employment in this sector
through reductions in employee benefits (i.e. Legislative Decree 1086). The deterioration of
worker rights promulgated by these reforms is magnified by poor enforcement mechanisms
among the centralized Ministry of Labor and the Promotion of Employment and local authorities
that provide little oversight over SME firms.
Peru’s ineffective labor market framework represents an additional barrier to firms as
they seek to expand. Upper-middle-income countries often struggle to move up the value chain
from low-skill to high-skill products due either to a poorly trained workforce or the inability to
provide on-the-job training. Although labor market outcomes have improved overall, there is
evidence that employment creation has been insufficient and uneven, while earnings and labor
4
productivity have grown only modestly. This is evident in Peru where more than half of all jobs
continue to take place in low-productivity sectors, including agriculture and trade (World Bank,
2011). Changes in the pattern of labor demand, namely export-led growth and technological
changes, are leading to mismatches in the supply and demand of skills in the labor market. Given
the relative weight of SMEs in Peru, these firms play an important role in redistributing income,
hiring higher skilled workers, and carrying out on-the-job training for unskilled or semi-skilled
workers.6
Matching semi-skilled and high-skilled workers with fast-growing firms remains a major
challenge to growth for Peruvian firms. As an upper-middle-income country, credit constraints
are no longer a primary concern to firm owners. This is illuminated in the 2010 World Bank
Enterprise Surveys where access to a skilled workforce is found to be a larger growth constraint
for Peruvian firms than access to finance. To maintain high sustainable growth in the medium-
term, Peruvian firms require greater resiliency to shocks and increased productivity (IMF, 2013).
Improving human capital and maintaining labor market flexibility (i.e. a market that benefits
both worker and employers) are key components to ensuring that a socially inclusive growth
strategy is feasible. For human capital to improve, the regulatory framework to support and
match workers with jobs must already be in place.
Independent of firm size, workers form the backbone of firms. The difficulties inherent in
quantifying the monetary contribution of human capital to firm performance may be one reason
why there are few empirical studies measuring this relationship. This paper contributes to the
firm growth literature by empirically assessing this relationship. Using 2010 World Bank
Enterprise Survey data, I use traditional ordinary least squares (OLS) regression methods to
!!!!!!!!!!!!!!!!!!!!!!!!!!!!!!!!!!!!!!!!!!!!!!!!!!!!!!!!6 SMEs account for 98% of all Peruvian enterprises, they comprise 60% of the active working population, and they contribute over 40% of the national GDP (Vasquez et al., 2011).
5
analyze the relationship between human capital constraints and firm growth in Peru, specifically
looking at how the impact of human capital constraints varies by firm size. A broader and
deeper understanding of the relationship between human capital and firm growth has
implications for the creation of public policies that enhance the technical skills of the labor
market, as a means to improve overall firm productivity and competitiveness.
II. LITERATURE REVIEW
There is a breadth of economic literature that studies the firm growth process.
Understanding the drivers of firm growth is important for a few key reasons. First, growth is a
prerequisite for firm survival in the market. Stagnant or unproductive firms will not last long in
the marketplace as their competitors begin to outpace them (Geroski, 1999). Firm growth also
has implications for the creation of jobs where firms in expansion tend to hire on new workers to
keep pace with the new growth. Increased competition among firms sparks innovation and
technological change to boost productivity (Kuramoto, 2011). Technological advances can have
spillover effects through knowledge sharing and adaption to other industries in the national
economy. Lastly, firm growth has important consequences for the domestic economy. An
increase in firm growth often times leads to increased demands in other sectors of the economy,
resulting in a broader economic growth. The creation of backward and forward linkages helps
create balanced growth, as firms outside regional economic hubs are included in the value chain.
The above reasons underscore the importance of understanding firm growth process.
This paper is primarily concerned with barriers to growth within the market and therefore the
following literature review focuses on firm performance once firms have entered the market.
This section first presents an analysis of different economic theories of firm growth and then
6
delves into relevant country-specific factors affecting firm growth in Peru.
Evidence from theoretical and empirical research on the precise mechanisms that affect
firm growth varies (Hart, 2000). The substantial research conducted on this topic has led to little
convergence among theories. Storey (1994) and Sengupta (1998) recognize the importance of
skilled managers and workers in the growth process. Other authors similarly argue that much of
the variation in firm growth can be attributed to non-observable attributes, such as human capital.
In fact, a large portion of the unexplored mechanisms of firm growth can be found through a
deeper analysis of the labor market itself:
The vast majority of variation in firm performance is not associated with traditional observables such as location, industry, size, age or capital; rather it is associated with unobservable factors specific to the firm or business unit, many of which appear to be permanent attributes of the business unit. One such attribute is the managerial capital of the firm, another is the skills of the workforce. (Jensen and McGuckin, 1997, p. 25)
Later research builds upon the findings of Jensen and McGuckin on the importance of skilled
labor on firm growth. In an empirical study comparing growth among UK and US firms, Hart
finds that while firm growth is largely stochastic, certain systematic factors like capital
investment and research and development (R&D) do impact growth, although there is a low
probability for the influence of these factors to remain present in the long-term (Hart, 1999). The
two studies agree on the importance of taking into account both individual firm characteristics
and idiosyncratic factors, as Hart finds that R&D could likely be correlated with the skill level
among the workforce.
Human capital makes a critical contribution to post-entry small firm performance (Storey,
1994). Storey classifies small firm growth factors in three categories: entrepreneur-specific
factors, firm-specific factors, and strategy-specific factors (see Table I). Under this theory, firms
maximize their growth when they are able to optimize factors from all three categories. Firms

7
that recognize their capabilities and have strategies to improve them tend to be the most capable
of expanding their business and utilizing firm characteristics to their advantage.
The large combination of factors that can affect firm growth leads to heterogeneity
among firms. While many of these factors are controllable, many are not, which has led
economists to incorporate another important characteristic of firm growth: randomness. The
notion that there are unexpected factors that affect the interaction between observable factors lies
at the foundation of this theory. Geroski (1999) argues that firm growth rates are random and
differ between firms in “unpredictable” and “temporary” means. He argues that empirical
evidence on firm growth does not coincide with theory, finding that “work on the theory of the
firm needs to be redirected towards models which help to account for the uneven, erratic
performance of firms over time” (Geroski, 1999, p. 19). From this perspective, firm growth is not
only generated by a combination of controllable factors, but also a series of unexpected events
Table I: Key Factors Influencing Growth in Small Firms Entrepreneurial Organizational Strategic Motivation Age Workforce training Unemployment Sector Management training Education Legal form External equity Management experience Location Technological
sophistication Number of founders Size Market positioning Prior self-employment Ownership Market adjustments Family history Planning Social marginality New products Functional skills Management recruitment Training State support Age Customer concentration Prior business failure Competition Prior sector experience Information and advice Prior firm size experience Exporting
Gender Source: Storey, 1994

8
that affect the firms’ planned growth trajectory.
Although understanding how to outperform competitors is important, firms also face a
myriad of barriers that can hinder their growth potential (see Table II). While some of the
barriers are under the control of firms, many are not. They must rely on collaboration with other
actors and a supportive policy environment for rapid growth. For example, management ability is
well within the hands of the firm, whereas skilled labor and market demand are heavily
influenced by government policies.
Other empirical work supports the view that it is the unobserved factors, such as the skills
of the workforce and managerial capability, instead of the observables like size, age, capital, or
location, that determine firm growth (Jensen and McGuckin, 1997). Both the observable and
unobservable characteristics of a firm must be included in order to render a complete analysis of
firm growth (Laursen et al., 1999). Academic literature has been heavily focused on analyzing
barriers to firm growth with regard to access to finance, largely ignoring the impact of skilled
labor on firm growth. Addressing the skills gap present across firms in different sectors is a
Table II: Post-Entry Barriers to Firm Growth
Availability and cost of finance for expansion Availability and cost of overdraft facilities Overall growth of market demand Increasing competition Marketing and sales skills Management skills Skilled labor Acquisition of new technology Difficulties in implementing new technology Availability of appropriate premises or site Access to overseas markets Source: Storey, 1994

9
prudent step in improving the long-term technical capacity of workers crucial to foster firm
competitiveness, productivity, and ultimately, growth.
The idea that knowledge plays a vital role in firm growth is not new. New growth theory
analyzes economic growth through endogenous mechanisms such as information technology,
human capital, and knowledge spillover (Sengupta, 1998). According to new growth theory,
knowledge raises the returns on investment by spurring productivity, as well as fostering a
supportive environment in which to develop improved products and services. Increased returns
allow the cycle to continue, which in turn, contributes to the accumulation of knowledge.
Sustained increases in investment are what eventually lead to rising national growth rate (OECD,
1996). In addition, knowledge spillovers into different sectors can ease firm growth constraints
due to lack of capital.
With a knowledge-based or new growth framework in mind, challenges such as unskilled
labor play a larger than previously acknowledged role in explaining firm productivity.7 The
quality of human resources is gaining importance, especially in high value-added functions
necessary for firms to enter global value chains. SMEs are usually forced to enter the global
market incrementally due to a lack of economic and managerial capabilities (Vasquez et al.,
2011). Consequently, firms are increasingly concerned not only about building a strong
workforce to produce domestically but also as a key driver in helping expand sales abroad. Poor
educational systems hurt the scope for equipping the labor force with the skills needed to be
innovators rather than simply users of new technology.
Contrary to new growth theory, some empirical research finds that the role of human
capital in firm performance is minimal. Soderbom and Teal (2001) use firm-level panel data
!!!!!!!!!!!!!!!!!!!!!!!!!!!!!!!!!!!!!!!!!!!!!!!!!!!!!!!!7!Knowledge-based economies place a greater emphasis on the role of education, information, and technology as drivers of economic growth (OECD, 1996).!
10
from the manufacturing sector in Ghana to analyze the role of human capital on determining both
earnings and productivity. Their results show observable skills are of minor importance in
explaining differences in productivity across firms. Karlan and Valdivia (2011) use a randomized
control trial to measure the impact of improved human capital (e.g. business training) to a group
of Peruvian micro-entrepreneurs. They find that attempts at improving the business acumen of
female micro-entrepreneurs over a two-year period did not lead to higher revenues or improved
firm performance. These findings give rise to the need for a supportive regulatory labor
framework that enables workers to maximize productivity and promotes a long-term
employment relationship.
The characteristics of the overall labor market are vital in determining the payoffs of
investment in knowledge and training. Functioning labor markets tend to allocate human capital
into the sectors that maximize growth (i.e., dynamic manufacturing sectors) (Pissarides, 2000).
On the one hand, labor markets are also capable of redistributing income and employment in a
more equitable fashion through the allocation of jobs across income groups. This type of job
creation tends to benefit the low-skilled, low-wage workers, which can have direct positive
effects on poverty reduction (Banerji et al., 1995). Any distortion of labor markets, on the other
hand, would create the opposite effect.
Labor market distortions, such as high informality, inefficient labor laws, and poor
educational systems are endemic in developing economies. These distortions tend to have a
negative impact on SMEs in the formal sector, where the formal wage is set well above the social
opportunity cost of labor. A highly flexible labor framework can discourage long-term
employment relationships through weak incentives for employees to remain at one firm for a
long period of time (Chacaltana, 2003). The higher cost of formal employment can represent a

11
systematic bias against the growth of SMEs, as they often operate in a more labor-intensive
manner than larger firms. The wage distortion, however, does not tend to have as big of an effect
on large firms, who are more able to utilize efficient compensation strategies to attract the most
productive workers or substitute capital for labor.
Labor regulations play an important role in providing a skilled workforce. Research on
the effect of labor regulations on firm performance has led to inconclusive results. In a panel
study done on manufacturing firms in Argentina, Mondino and Montoya (2004) found a strong
negative relationship between regulation in the form of taxes and labor demand. The authors
found that when faced with strict labor regulations, firms alter their labor allocations, reducing
their demand for workers, while increasing the number of hours of current employees. They posit
that this is due to the cost associated with regulatory compliance. Strict labor regulations can
distort firm growth by raising the opportunity cost of firms to hire and fire workers. SMEs are
likely more adversely affected by such policies because they do not have the capacity of large
firms to adhere to these regulations (Seker and Correa, 2010).
The ambiguousness of the literature on labor regulations stems from the perspective
from which researchers are conducting their analysis: pro-worker or pro-business. Peru’s labor
regulations are highly oriented toward the firm. Well-aligned to the results of this paper, Aterido
et al. (2009) conclude that regulations were found to create growth bottlenecks for small firms,
while their impact on medium and large firms was insignificant. Other evidence from Latin
America found similar results. Micco and Pages (2006) find a negative relationship between
employment protection laws and labor turnover, while Mondino and Montoya (2004) show that
labor regulations reduce labor market flexibility and generate societal inequalities.
A well-functioning labor market is fundamental in maximizing the returns from

12
investment in human capital. However, matching human capital to SME firms is also a
challenge. SMEs often face difficulties in hiring well-qualified labor because smaller firms
frequently cannot match the compensation offered by larger firms. Thus, small firms must devise
strategies to attract skilled workers away from larger firms. For instance, recent SME legislation
in Peru substantially weakened the terms and conditions of work in SME firms by reducing
vacation, wages, and compensation if unjustly dismissed. 8 Furthermore, SMEs are more
susceptible to business and market fluctuations, which, in a worst-case scenario, could lead to
bankruptcy. Workers want to optimize their job environment and employee benefits where job
security is of primary concern. This adds to the difficulties SMEs have with the development and
retention of a skilled workforce. The next section synthesizes the previously discussed factors
affecting firm growth in order to develop the conceptual framework used as the empirical
foundation for this paper.
III. CONCEPTUAL FRAMEWORK
Analysis of the relationship between human capital and firm growth requires a deeper
look at both the micro and macro characteristics affecting firms. Figure I below illustrates the
individual firm-level and macro-level characteristics that affect firm performance. The firm-
level characteristics that impact firm growth include skill-level of the workforce, firm age,
capital investments, training opportunities, quality of management, and use of technology. In
addition, there are macro-level characteristics associated with firm growth, including labor
regulations, access to finance, institutional capacity, corruption, and informality.
!!!!!!!!!!!!!!!!!!!!!!!!!!!!!!!!!!!!!!!!!!!!!!!!!!!!!!!!8 In 2008, Legislative Decree 1086 was passed, substantially weakened the terms and conditions of work in the majority of workplaces in Peru by reducing vacation and lowering wages for all workers in workplaces of 100 or fewer workers (the law was previously written for firms of 50 or fewer workers).

13
Figure I: Factors Affecting Firm Growth
Figure II narrows in on human capital constraints using new growth theory. These
factors are a critical piece in determining firm performance. The macro-level characteristics
determine the quality of skilled labor available to firms. Firms are dependent on the institutional
setting of a country to produce qualified workers. For example, public educational systems that
do not provide students with a core set of generic cognitive and socio-emotional skills may
produce a labor market without the requisite skills sought after by firms. In addition to the level
of education of workers, national labor regulations can also be restrictive to firm hiring practices.
Figure'II:'Conceptual'Labor'Constraint'Framework''
Weak Firm Performance
Poor Educational System
Inadequately Skilled
Workforce
Minimum On-the-Job
Training
Reduced Firm
Productivity
Source: Author’s Illustration
Firm-Level Characteristics
− Workforce (level of skill) − Capital investment − Firm age − Firm size − On-the-job training − Quality of management − Technology transfer
Macro Characteristics
− Business regulations − Access to finance − Crime and corruption − Informal business − Institutions and the legal
system − Taxation
Firm Performance
Source: Author’s Illustration
14
Empirical research has shown that tighter labor regulations discriminate in favor of
workers with higher human capital, limiting the opportunities for unskilled workers, and
protecting the jobs of skilled workers (Mondino and Montoya, 2004). Concurrent micro-level
characteristics are associated with an inadequately skilled workforce. These factors include firm
size, firm age, internal training, and managerial quality. Private sector training (internal) is
positively correlated with firm productivity (Dearden, Reed and Van Reenen, 2006). However, it
is highly probable that smaller firms are not able to afford as much on-the-job training as are
larger firms. This implies that firms with greater resources are able to re-invest in their human
capital as a means to improve firm productivity at a faster rate than firms not endowed with such
financial resources.
A skilled labor force is necessary to increase firm productivity and entrance into the
export market. Peruvian SMEs are poised to remain the backbone of the economy and begin the
climb up the global value chain, as larger firms are already doing. However, this is contingent on
firm access to skilled labor. I hypothesize that workforce constraints have a negative impact on
firm growth. Despite strong capital investments, an inadequately trained workforce will reduce
firm productivity and will, as a result, reduce overall firm performance. Additionally, I posit that
small and medium sized firms will be more impacted by a poorly trained workforce because they
do not maintain the internal resources necessary to provide on-the-job training to overcome the
gap in skills that many larger firms possess.
To test the hypothesis, I use ordinary least squares multiple regression analysis to
test how firm growth rates differ by size controlling for certain firm-specific characteristics.
The OLS model used in these analyses is as follows:
15
!"#$!!"#!"ℎ = !! + !!!"#$%"#&'!!"#$%&'(#%$ + !!!"#$%!!"#$%&'()*!!"#$%&'(#%$
+ !!!!"#$ + !!!!"#$%& + !!!!"# + !!!!"#$%& + !!!!"#$%&'
+ !!!!"#$%&'$&( + !!!!"#!"#$!%# + !!
(1)
The !! term is a dummy variable equal to one if firms identified an inadequately trained
workforce as a major or severe constraint to their firm. Similarly, !! is a dummy variable equal
to one if firms identified labor regulations as a major or severe constraint to their firm. The
remaining variables are firm-specific control variables. The last term in the model represents the
error term.
IV. DATA
Data for the regression analysis in this study was collected in Peru through the World
Bank’s Enterprise Surveys. Enterprise Surveys collect data on the experiences and perceptions of
private sector firms to measure the business environment in which they operate. Business owners
and top managers in the manufacturing and services sectors were interviewed to capture their
opinions on the largest barriers to firm growth, the relative effects of different constraints on
improved productivity and employment levels, and the impact of Peru’s business environment on
international competitiveness.
The most recent Peru Enterprise Survey was conducted between May 2010 and March
2011 and forms the basis of this analysis. One thousand firms were interviewed in the four
largest cities in Peru: Lima, Trujillo, Chiclayo and Arequipa. The universe of the study is the
non-agricultural economy, comprising all manufacturing sectors according to ISIC’s group
classification.9 The key dependent variable is real annual sales growth, calculated as the change
!!!!!!!!!!!!!!!!!!!!!!!!!!!!!!!!!!!!!!!!!!!!!!!!!!!!!!!!9 The two-digit industry classification is made using United Nations ISIC Rev 3.1.

16
in sales reported in 2009 from three years prior.10 Sales growth is a common measure of firm
performance and typically has a positive correlation with firm growth (Heshmati, 2006).
! Firm growth tends to vary by firm size, where smaller firms are less likely to have the
capacity to overcome financial or regulatory barriers that distort firm growth (Seker and Correa,
2010). To analyze how constraints vary by size, firms are divided into three groups by the
number of full-time, permanent workers employed: small: 5!19, medium: 20!99, and large: ≥
100. Firm size variables are constructed according to the employment level of the firms in 2010
(see Appendix, Table VII). As shown in Table III, the distribution of small (n=328), medium
(n=352), and large firms (n=312) is fairly even across the sample. Micro-firms are omitted from
the sample due to the low number of observations in this sample (n=6).
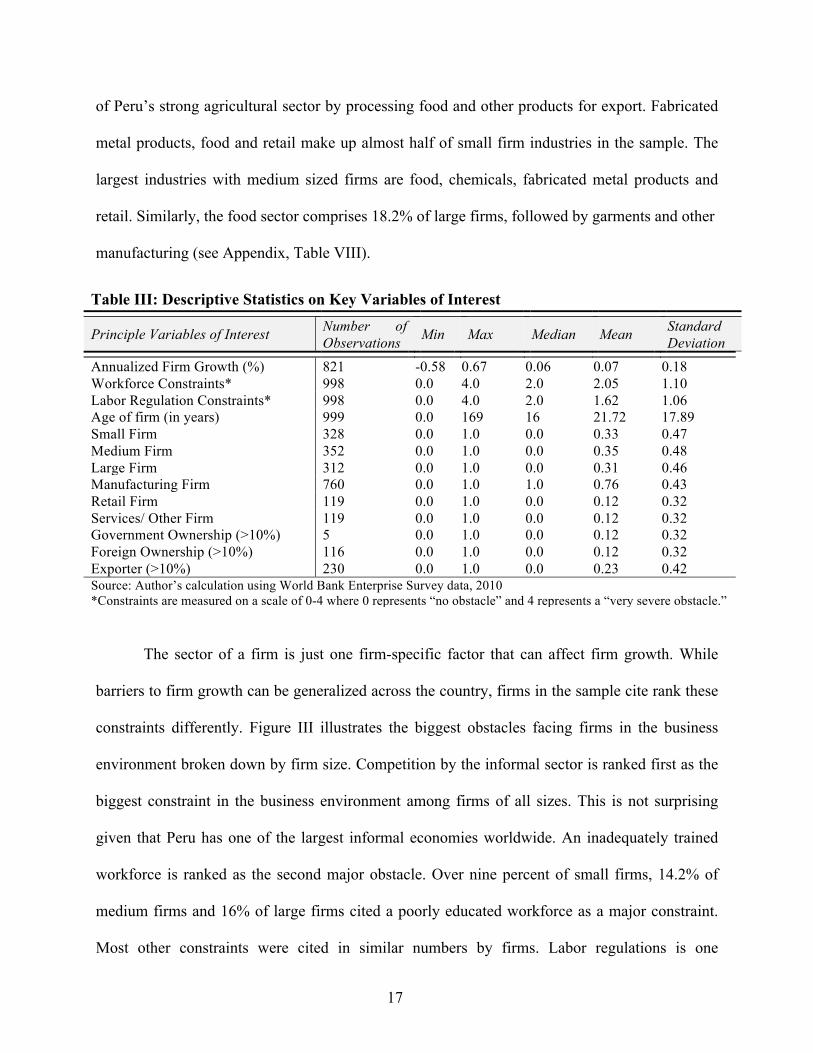
Table III provides an overview of descriptive statistics for the key variables. The average
annual sales growth is 0.07%, with the lowest growth rate being -0.58% and the highest growth
rate 0.67%. On average, firms perceive an inadequately trained workforce to be a moderate
constraint and labor regulations to be slightly less constraining. Additionally, 40% of the full-
time, permanent employees are unskilled. Over 93% of full-time employees in the surveyed
firms have graduated from secondary school, compared to an average of only 21.7% who have
received a bachelor degree (see Appendix Table XI).
Manufacturing constitutes the overwhelming majority of firms in this sample (n=760).
The retail sector is comprised of 119 firms. The services sector, comprised of IT, hotels,
construction, transportation and auto repair, also makes up just over 10% of the sample size.
Only 116 firms are foreign-owned; these firms are mostly from the food (n= 26), chemicals
(n=15) and retail (n=15) sectors. Foreign-owned firms in the sample are likely taking advantage
!!!!!!!!!!!!!!!!!!!!!!!!!!!!!!!!!!!!!!!!!!!!!!!!!!!!!!!!10!The formula for real annual sales growth is: !"#$%ℎ = (!! ∗
!""#!!"#$!!!!!""#!!"#$!!""#!!"#$!!!""#!!"#$!
!), where t=3 years
17
of Peru’s strong agricultural sector by processing food and other products for export. Fabricated
metal products, food and retail make up almost half of small firm industries in the sample. The
largest industries with medium sized firms are food, chemicals, fabricated metal products and
retail. Similarly, the food sector comprises 18.2% of large firms, followed by garments and other
manufacturing (see Appendix, Table VIII).
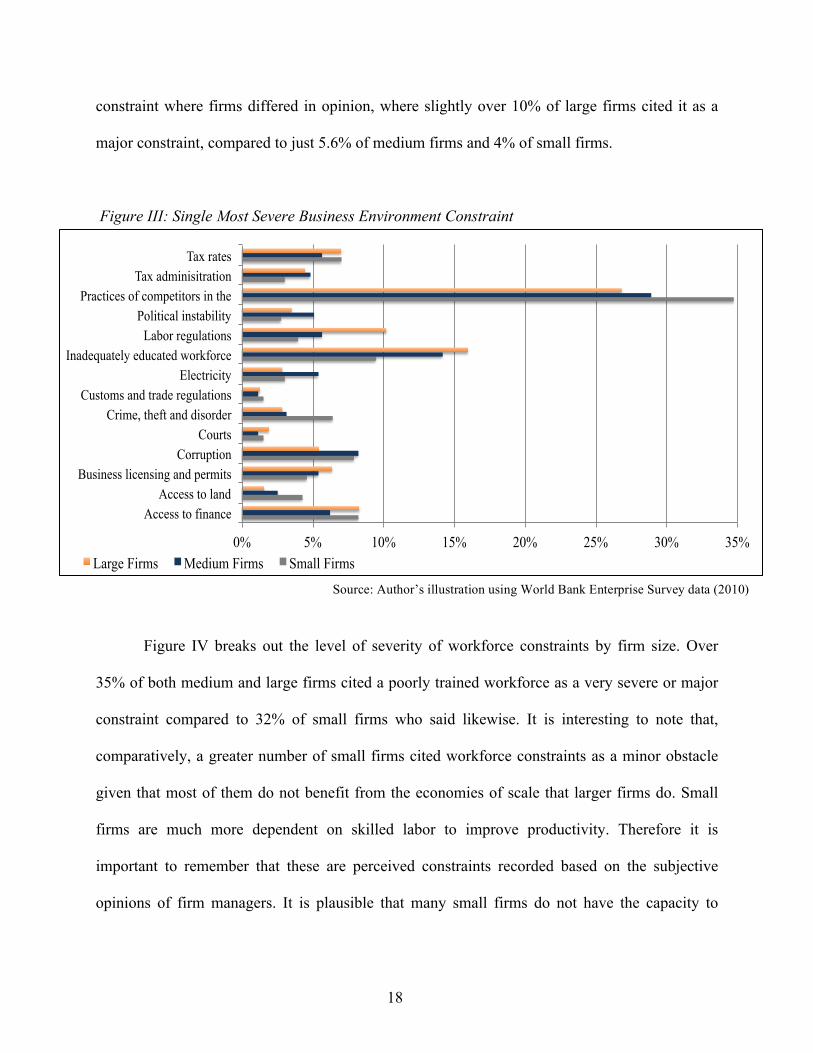
The sector of a firm is just one firm-specific factor that can affect firm growth. While
barriers to firm growth can be generalized across the country, firms in the sample cite rank these
constraints differently. Figure III illustrates the biggest obstacles facing firms in the business
environment broken down by firm size. Competition by the informal sector is ranked first as the
biggest constraint in the business environment among firms of all sizes. This is not surprising
given that Peru has one of the largest informal economies worldwide. An inadequately trained
workforce is ranked as the second major obstacle. Over nine percent of small firms, 14.2% of
medium firms and 16% of large firms cited a poorly educated workforce as a major constraint.
Most other constraints were cited in similar numbers by firms. Labor regulations is one
Table III: Descriptive Statistics on Key Variables of Interest
Principle Variables of Interest Number of Observations Min Max Median Mean Standard
Deviation Annualized Firm Growth (%) 821 -0.58 0.67 0.06 0.07 0.18 Workforce Constraints* 998 0.0 4.0 2.0 2.05 1.10 Labor Regulation Constraints* 998 0.0 4.0 2.0 1.62 1.06 Age of firm (in years) 999 0.0 169 16 21.72 17.89 Small Firm 328 0.0 1.0 0.0 0.33 0.47 Medium Firm 352 0.0 1.0 0.0 0.35 0.48 Large Firm 312 0.0 1.0 0.0 0.31 0.46 Manufacturing Firm 760 0.0 1.0 1.0 0.76 0.43 Retail Firm 119 0.0 1.0 0.0 0.12 0.32 Services/ Other Firm 119 0.0 1.0 0.0 0.12 0.32 Government Ownership (>10%) 5 0.0 1.0 0.0 0.12 0.32 Foreign Ownership (>10%) 116 0.0 1.0 0.0 0.12 0.32 Exporter (>10%) 230 0.0 1.0 0.0 0.23 0.42 Source: Author’s calculation using World Bank Enterprise Survey data, 2010 *Constraints are measured on a scale of 0-4 where 0 represents “no obstacle” and 4 represents a “very severe obstacle.”
18
constraint where firms differed in opinion, where slightly over 10% of large firms cited it as a
major constraint, compared to just 5.6% of medium firms and 4% of small firms.
Figure III: Single Most Severe Business Environment Constraint
! !
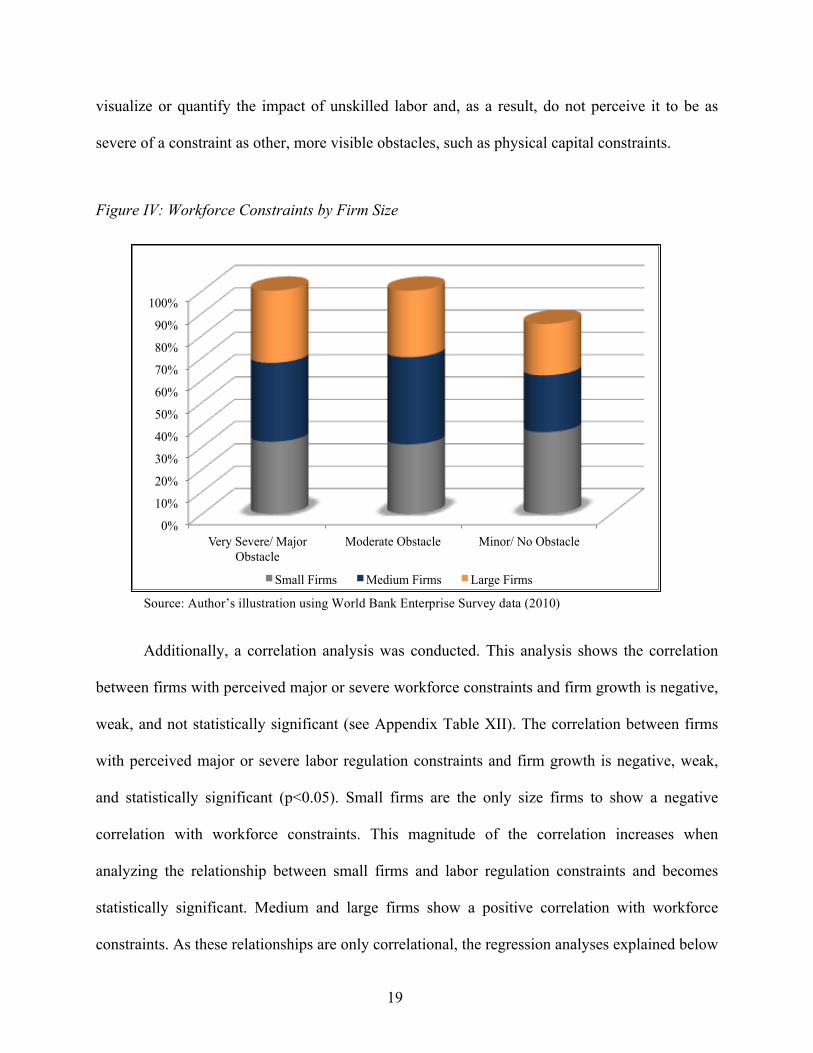
! Figure IV breaks out the level of severity of workforce constraints by firm size. Over
35% of both medium and large firms cited a poorly trained workforce as a very severe or major
constraint compared to 32% of small firms who said likewise. It is interesting to note that,
comparatively, a greater number of small firms cited workforce constraints as a minor obstacle
given that most of them do not benefit from the economies of scale that larger firms do. Small
firms are much more dependent on skilled labor to improve productivity. Therefore it is
important to remember that these are perceived constraints recorded based on the subjective
opinions of firm managers. It is plausible that many small firms do not have the capacity to
0% 5% 10% 15% 20% 25% 30% 35%
Access to finance Access to land
Business licensing and permits Corruption
Courts Crime, theft and disorder
Customs and trade regulations Electricity
Inadequately educated workforce Labor regulations
Political instability Practices of competitors in the
Tax adminisitration Tax rates
Large Firms Medium Firms Small Firms
Source: Author’s illustration using World Bank Enterprise Survey data (2010) !
19
visualize or quantify the impact of unskilled labor and, as a result, do not perceive it to be as
severe of a constraint as other, more visible obstacles, such as physical capital constraints.
Figure IV: Workforce Constraints by Firm Size
Additionally, a correlation analysis was conducted. This analysis shows the correlation
between firms with perceived major or severe workforce constraints and firm growth is negative,
weak, and not statistically significant (see Appendix Table XII). The correlation between firms
with perceived major or severe labor regulation constraints and firm growth is negative, weak,
and statistically significant (p<0.05). Small firms are the only size firms to show a negative
correlation with workforce constraints. This magnitude of the correlation increases when
analyzing the relationship between small firms and labor regulation constraints and becomes
statistically significant. Medium and large firms show a positive correlation with workforce
constraints. As these relationships are only correlational, the regression analyses explained below
Source: Author’s illustration using World Bank Enterprise Survey data (2010) '
0%
10%
20%
30%
40%
50%
60%
70%
80%
90%
100%
Very Severe/ Major Obstacle
Moderate Obstacle Minor/ No Obstacle
Small Firms Medium Firms Large Firms

20
provide a more precise estimate of the relationship between labor constraints and firm growth.
V. ESTIMATION RESULTS
Tables IV and V show how firm growth depends on labor market constraints, after
controlling for firm-specific variables. Table IV presents OLS regression results for all firms,
whereas Table V presents firm growth by firm size. In Table IV, specifications one and two are
simple OLS regressions with annual sales growth measured as the main dependent variable and
workforce constraints as the primary dependent variable. Firm growth is measured as the change
in annual sales reported in 2009 from three years prior. Workforce constraints are a dummy
variable equal to one if firms identified an inadequately trained workforce as a “major” or
“severe” constraint. A secondary independent variable included in the models is labor regulation
constraints, which is a dummy variable equal to one if firms identified labor regulations as a
“major” or “severe” constraint to firm growth. For the remainder of this paper, “labor market
constraints” refer to workforce and labor regulation constraints combined. Model three regresses
firm growth on both labor market constraints. Regressions four through six add additional firm-
specific control variables into the model.
Labor market constraints in this dataset are comprised of both a poorly trained workforce
and labor regulations. The first two regressions in Table IV are simple regressions of firm growth
on each component of labor market constraints individually: workforce constraints and labor
regulation constraints. Model one shows a negative, but statistically insignificant relationship
between workforce constraints and firm growth. Regression two, on the other hand, shows both a
negative and statistically significant relationship between firm growth and labor regulation
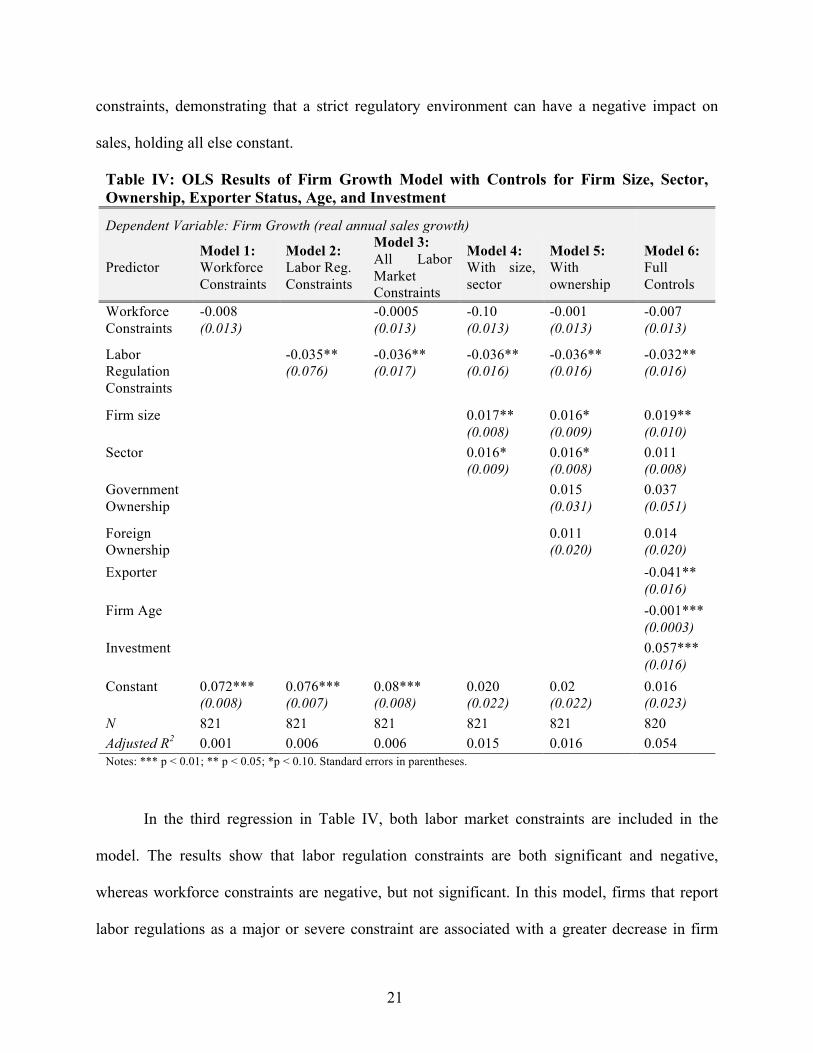
21
constraints, demonstrating that a strict regulatory environment can have a negative impact on
sales, holding all else constant.
Table IV: OLS Results of Firm Growth Model with Controls for Firm Size, Sector, Ownership, Exporter Status, Age, and Investment
Dependent Variable: Firm Growth (real annual sales growth)
Predictor Model 1: Workforce Constraints
Model 2: Labor Reg. Constraints
Model 3: All Labor Market Constraints
Model 4: With size, sector
Model 5: With ownership
Model 6: Full Controls
Workforce Constraints
-0.008 (0.013)
-0.0005 (0.013)
-0.10 (0.013)
-0.001 (0.013)
-0.007 (0.013)
Labor Regulation Constraints
-0.035** (0.076)
-0.036** (0.017)
-0.036** (0.016)
-0.036** (0.016)
-0.032** (0.016)
Firm size 0.017** (0.008)
0.016* (0.009)
0.019** (0.010)
Sector 0.016* (0.009)
0.016* (0.008)
0.011 (0.008)
Government Ownership
0.015 (0.031)
0.037 (0.051)
Foreign Ownership
0.011 (0.020)
0.014 (0.020)
Exporter -0.041** (0.016)
Firm Age -0.001*** (0.0003)
Investment 0.057*** (0.016)
Constant 0.072*** (0.008)
0.076*** (0.007)
0.08*** (0.008)
0.020 (0.022)
0.02 (0.022)
0.016 (0.023)
N 821 821 821 821 821 820 Adjusted R2 0.001 0.006 0.006 0.015 0.016 0.054 Notes: *** p < 0.01; ** p < 0.05; *p < 0.10. Standard errors in parentheses.
In the third regression in Table IV, both labor market constraints are included in the
model. The results show that labor regulation constraints are both significant and negative,
whereas workforce constraints are negative, but not significant. In this model, firms that report
labor regulations as a major or severe constraint are associated with a greater decrease in firm
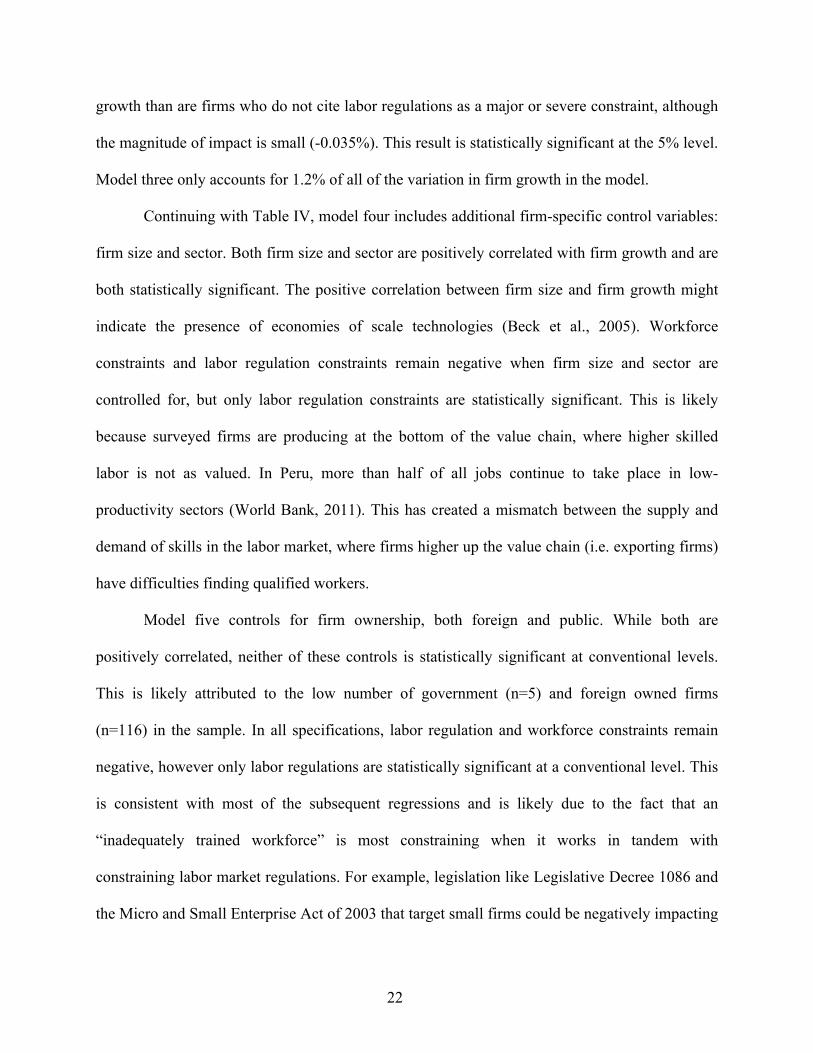
22
growth than are firms who do not cite labor regulations as a major or severe constraint, although
the magnitude of impact is small (-0.035%). This result is statistically significant at the 5% level.
Model three only accounts for 1.2% of all of the variation in firm growth in the model.
Continuing with Table IV, model four includes additional firm-specific control variables:
firm size and sector. Both firm size and sector are positively correlated with firm growth and are
both statistically significant. The positive correlation between firm size and firm growth might
indicate the presence of economies of scale technologies (Beck et al., 2005). Workforce
constraints and labor regulation constraints remain negative when firm size and sector are
controlled for, but only labor regulation constraints are statistically significant. This is likely
because surveyed firms are producing at the bottom of the value chain, where higher skilled
labor is not as valued. In Peru, more than half of all jobs continue to take place in low-
productivity sectors (World Bank, 2011). This has created a mismatch between the supply and
demand of skills in the labor market, where firms higher up the value chain (i.e. exporting firms)
have difficulties finding qualified workers.
Model five controls for firm ownership, both foreign and public. While both are
positively correlated, neither of these controls is statistically significant at conventional levels.
This is likely attributed to the low number of government (n=5) and foreign owned firms
(n=116) in the sample. In all specifications, labor regulation and workforce constraints remain
negative, however only labor regulations are statistically significant at a conventional level. This
is consistent with most of the subsequent regressions and is likely due to the fact that an
“inadequately trained workforce” is most constraining when it works in tandem with
constraining labor market regulations. For example, legislation like Legislative Decree 1086 and
the Micro and Small Enterprise Act of 2003 that target small firms could be negatively impacting
23
small firms by making it more costly to attract skilled, long-term workers (Joshi, 2005). This
would inhibit firm growth by making it cost prohibitive to hire higher skilled workers.
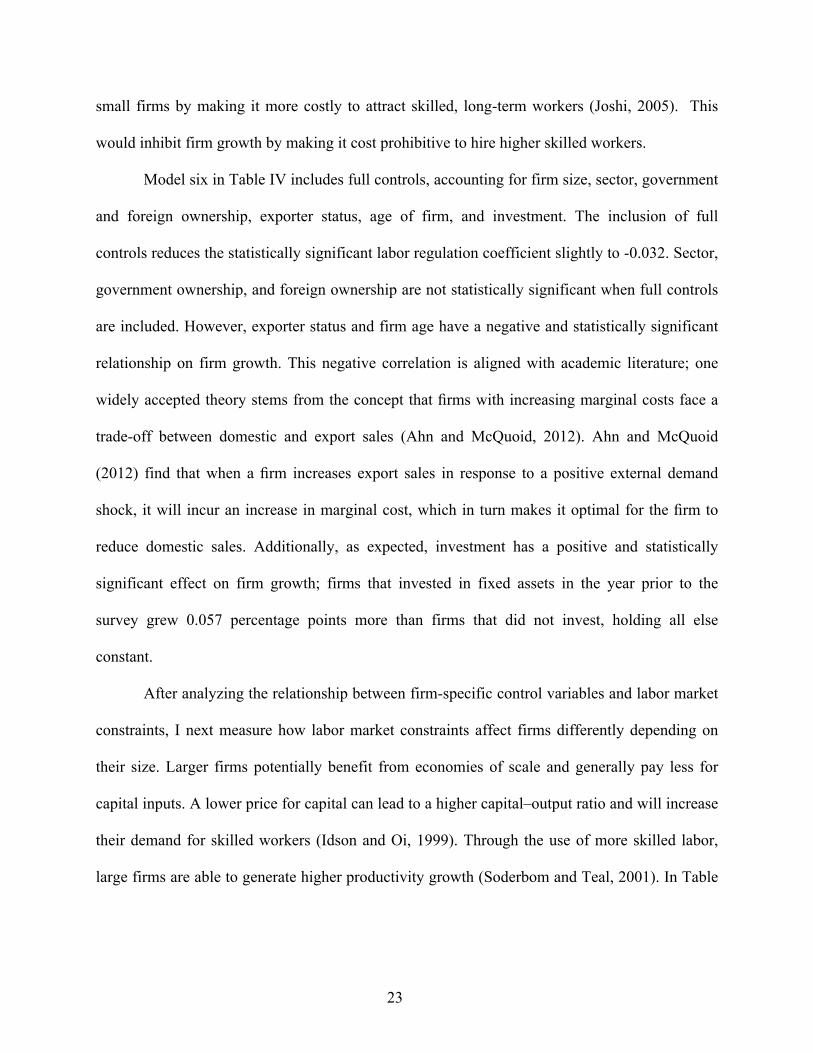
Model six in Table IV includes full controls, accounting for firm size, sector, government
and foreign ownership, exporter status, age of firm, and investment. The inclusion of full
controls reduces the statistically significant labor regulation coefficient slightly to -0.032. Sector,
government ownership, and foreign ownership are not statistically significant when full controls
are included. However, exporter status and firm age have a negative and statistically significant
relationship on firm growth. This negative correlation is aligned with academic literature; one
widely accepted theory stems from the concept that firms with increasing marginal costs face a
trade-off between domestic and export sales (Ahn and McQuoid, 2012). Ahn and McQuoid
(2012) find that when a firm increases export sales in response to a positive external demand
shock, it will incur an increase in marginal cost, which in turn makes it optimal for the firm to
reduce domestic sales. Additionally, as expected, investment has a positive and statistically
significant effect on firm growth; firms that invested in fixed assets in the year prior to the
survey grew 0.057 percentage points more than firms that did not invest, holding all else
constant.
After analyzing the relationship between firm-specific control variables and labor market
constraints, I next measure how labor market constraints affect firms differently depending on
their size. Larger firms potentially benefit from economies of scale and generally pay less for
capital inputs. A lower price for capital can lead to a higher capital–output ratio and will increase
their demand for skilled workers (Idson and Oi, 1999). Through the use of more skilled labor,
large firms are able to generate higher productivity growth (Soderbom and Teal, 2001). In Table

24
V, models one through four regress the full model for small, medium, large, and SME firms,
respectively.
Table V: OLS Results of Firm Growth Model by Firm Size with Controls for Firm Size, Sector, Age, Ownership, Exporter Status, and Investment Dependent Variable: Firm Growth (real annual sales growth)
Predictor Model 1 (Small)
Model 2 (Medium)
Model 3 (Large)
Model 4 (SME Firms)
Workforce Constraints (Major or Severe)
-0.001 (0.023)
-0.0233 (0.023)
0.015 (0.022)
-0.017 (0.016)
Labor Regulations (Major or Severe)
-0.062* (0.036)
-0.019 (0.029)
-0.020 (0.022)
-0.037* (0.022)
Sector -0.018 (0.016)
0.028** (0.013)
0.024 (0.015)
0.008 (0.010)
Government Ownership -0.216 (0.224
n/a 0.043 (0.040)
-0.124*** (0.045)
Foreign Ownership 0.149 (0.226)
-0.003 (0.040)
0.013 (0.022)
0.006 (0.042)
Exporter -0.094 (0.063)
-0.008 (0.026)
-0.045** (0.022)
-0.032 (0.024)
Firm Age -0.002** (0.001)
-0.002** (0.001)
-0.0005 (0.0004)
-0.002*** (0.0006)
Investment 0.037* (0.023)
0.017*** (0.024)
0.065* (0.038)
0.059*** (0.016)
Constant 0.112*** (0.035)
0.017 (0.034)
0.029 (0.046)
0.063*** (0.024)
N 252 295 269 547 Adjusted R2 0.066 0.080 0.0654 0.056 Notes: *** p < 0.01; ** p < 0.05; *p < 0.10. Robust standard errors in parentheses.
Workforce constraints are negatively correlated with firm growth for all firm sizes except
large firms, however none of these coefficients are statistically significant. Labor regulation
constraints have a similar negative impact on firm growth. This impact is statistically significant
for both small and medium sized firms. The magnitude of the labor regulation coefficient is also
much larger for small firms (β= -0.062) and for SME firms (β=-0.037). Additionally,
government ownership and firm age are negatively associated with firm growth and are both
statistically significant at the 1% level. Government ownership is associated with a -0.124
percentage point decrease in SME firm growth compared to large firms. These results provide
25
evidence that labor regulation constraints have larger impact on the growth of small and medium
firms.
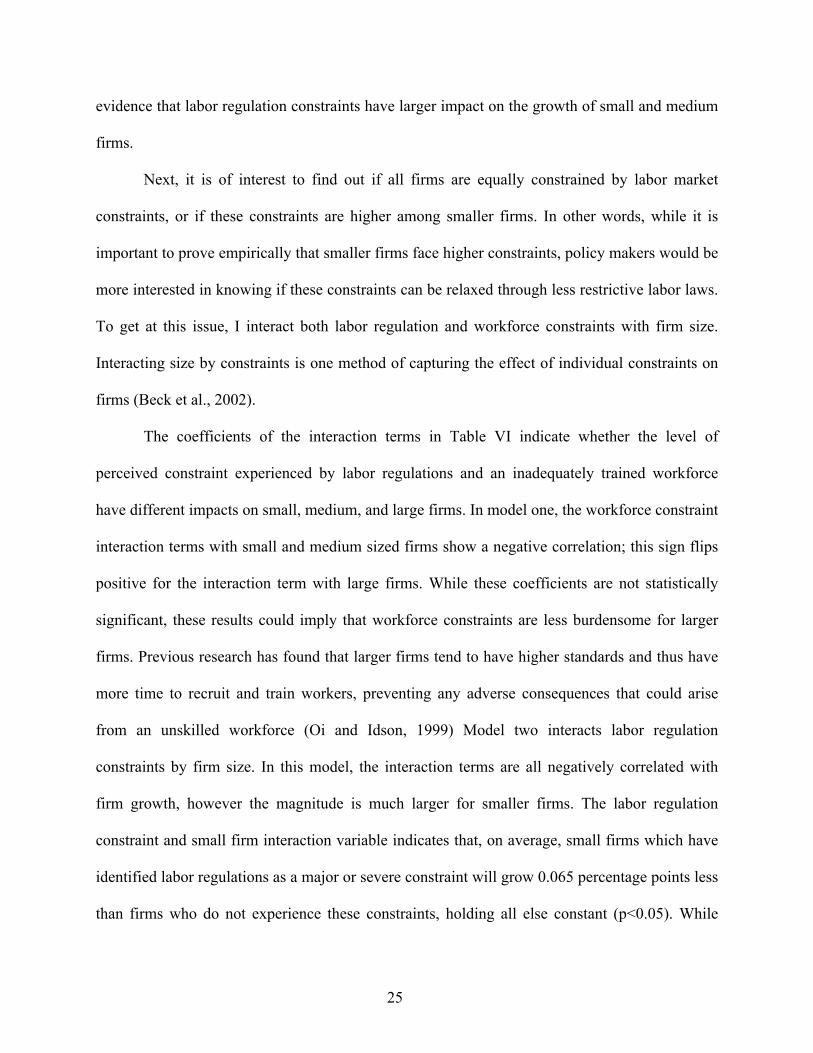
Next, it is of interest to find out if all firms are equally constrained by labor market
constraints, or if these constraints are higher among smaller firms. In other words, while it is
important to prove empirically that smaller firms face higher constraints, policy makers would be
more interested in knowing if these constraints can be relaxed through less restrictive labor laws.
To get at this issue, I interact both labor regulation and workforce constraints with firm size.
Interacting size by constraints is one method of capturing the effect of individual constraints on
firms (Beck et al., 2002).
The coefficients of the interaction terms in Table VI indicate whether the level of
perceived constraint experienced by labor regulations and an inadequately trained workforce
have different impacts on small, medium, and large firms. In model one, the workforce constraint
interaction terms with small and medium sized firms show a negative correlation; this sign flips
positive for the interaction term with large firms. While these coefficients are not statistically
significant, these results could imply that workforce constraints are less burdensome for larger
firms. Previous research has found that larger firms tend to have higher standards and thus have
more time to recruit and train workers, preventing any adverse consequences that could arise
from an unskilled workforce (Oi and Idson, 1999) Model two interacts labor regulation
constraints by firm size. In this model, the interaction terms are all negatively correlated with
firm growth, however the magnitude is much larger for smaller firms. The labor regulation
constraint and small firm interaction variable indicates that, on average, small firms which have
identified labor regulations as a major or severe constraint will grow 0.065 percentage points less
than firms who do not experience these constraints, holding all else constant (p<0.05). While

26
small in magnitude, the impact of labor regulation constraints on small firms is more than twice
that of medium firms and almost five time greater than the impact of labor regulations on large
firm growth.
Table VI: OLS Results of Firm Growth Model with Interactions between Firm Size and Constraints (Controls for Firm Size, Sector, Age, Ownership, Exporter Status, and Investment are Omitted from Table) Dependent Variable: Firm Growth (real annual sales growth)
Predictor
Model 1 (Workforce Constraint * Firm Size)
Model 2 (Labor Reg. Constraint * Firm Size)
Small Firm 0.255* (0.151)
0.257* (0.150)
Medium Firm 0.256* (0.151)
0.250* (0.151)
Large Firm 0.273* (0.151)
0.281* (0.151)
Labor Reg. Constraint * Small Firm -0.0642** (0.0316)
Labor Reg. Constraint * Medium Firm -0.0280 (0.0272)
Labor Reg. Constraint * Large Firm -0.0134 (0.0216)
Workforce Constraint * Small Firm -0.0211 (0.0215)
Workforce Constraint * Medium Firm -0.0297 (0.0206)
Workforce Constraint * Large Firm 0.0118 (0.0212)
Constant -0.211 (0.150)
-0.211 (0.150)
N 820 820 R-squared 0.065 0.062 Notes: *** p < 0.01; ** p < 0.05; *p < 0.10. Standard errors in parentheses.

27
VI. SENSITIVITY ANALYSIS
Several sensitivity tests were performed to further examine the empirical robustness of
the results of the analyses. These sensitivity tests were conducted to observe whether a change in
the key variables produced measurably different results (i.e. due to measurement error). In the
first test, firm productivity growth was substituted for the key dependent variable, sales growth.
Using firm productivity growth, the results were generally qualitatively similar to those in the
main analysis.11 Simple regressions show a negative association between both labor regulation
and workforce constraints on firm productivity, although the association is only statistically
significant for labor regulation constraints at the 10% level. This is consistent with the results in
the full model (model six from Table IV). When all controls were added, the association between
productivity growth and workforce constraints remained negative, but was not statistically
significant. Additionally, the relationship between productivity growth and labor market
constraints remained negative when the full model was run for only SME firms; however it was
not statistically significant. Substituting productivity growth for firm growth produced
comparable results as firm growth did in the main analysis, although statistical significance was
lacking. Despite this observation, these results demonstrate that the direction of the main
independent variables does not change when a different measure of firm growth is used. In other
words, the results are not sensitive to only one measure of firm growth.
In a second set of sensitivity tests, observations were divided by whether firm
productivity growth was above or below zero. Doing this allows us to measure whether the effect
of labor market constraints varies by firm-level productivity. For firms with productivity growth
above zero (positive growth), a simple regression showed a negative association between labor
!!!!!!!!!!!!!!!!!!!!!!!!!!!!!!!!!!!!!!!!!!!!!!!!!!!!!!!!11 Firm growth in the main analysis is defined as the real annualized sales growth (using GDP deflators) expressed as a percentage and is measured as change in annual sales reported in 2009 from three years prior.

28
market constraints and firm growth, although the association was not statistically significant.
This relationship maintained negative when full controls were added in for firms with positive
productivity growth, although there was no statistical significance at conventional levels.
Interestingly, workforce constraints were positively correlated for firms who experienced
negative productivity growth (productivity growth below zero). Labor regulation constraints
remained negative for firms with negative productivity growth, albeit neither coefficient was
statistically significant. This directional change in relationship for workforce constraints is not
surprising for firms with negative productivity growth as these firms are likely experiencing
other constraints that are playing a larger role in inhibiting growth than are labor regulations or
human capital.
It is important to note that in all the regressions above, there is a large portion of variation
in firm growth that is not accounted for by workforce constraints, labor regulation constraints,
and control variables. Previous empirical studies that measure the impact of subjective
constraints on firm growth also produced low explanatory power, including Beck, Demirguc-
Kent, and Maksimovic (2002) and Hallward-Driemeier and Aterido (2009). Despite
encountering similar difficulties in producing high explanatory power (R2), these papers
concluded that subjective rankings of constraints are an accurate reflection of how well the firm
is doing and how important the cited constraints are to the firm. Potential explanations for this
paper’s low explanatory power include: the mismeasurement of variables, omitted variable bias,
and endogeneity.
The mismeasurement of variables in World Bank Enterprise Surveys could be an issue if
firm and country level measures of obstacles do not produce consistent responses. Commander
and Tinn (2008) match responses in Enterprise Survey firm level surveys to the World Bank’s

29
Doing Business indicators that are their closest match for over 30,000 observations across a
seven-year period. They concluded that there is no clear connection between firm level survey
responses and what is reported as part of the Doing Business indicators. They find that there is a
large variation in responses between industries within countries, which suggest that there is a lot
of variation in subjective responses. The discrepancies between subjective and objective methods
make it unclear as to whether one measure is better than the other. The findings of Commander
and Tinn put into question the level of bias implicit in subjective responses, which could lessen
the explanatory power of the analyses above.
Another limitation of the study is the exclusion of certain factors whose omission is
exerting a bias on the labor market constraints coefficients. For example, Peru’s GDP per capita
and growth rates are likely to affect the extent to which businesses grow, and these policies are
likely to evolve over time. Additionally, urban-rural migration rates are likely associated with
firm growth rates since every firm in the sample is located in an urban hub and these rates will
change over time depending on economic opportunity. The omission of these variables is likely
exerting a negative bias on the labor market coefficients included in the models presented in this
paper.
Concerns about endogeneity stem from the notion that the conditions a firm faces are a
result of individual firm success rather than specific quantitative of qualitative indicators. When
using World Bank Enterprise Surveys, the underlying assumption is that causality runs from firm
constraints to firm growth. However, the results in this paper demonstrate that both quantitative
and qualitative measures reflect differences in the obstacles facing firms. Larger firms are also
found to be less constrained by labor constraints than smaller firms, a finding that can be
explained generically by firm capacity.
30
VII. POLICY IMPLICATIONS
In the past decade, Peru’s economy has transitioned away from a growth policy rooted in
government protection to a free market economy based on the initiative of individuals. Many of
the pro-business labor market reforms specifically targeting small enterprises have had the
opposite effect to the desired one. The highly flexible labor framework precludes long-term
employment relationships and discourages employers from spending money on workers due to
expectations of only a temporary labor relationship (Chacaltana, 2003). As found in the
empirical analysis above, this has negative consequences on the level of skilled workforce a
small business is able to retain. The number of different institutions involved in specific policies
targeting the small business sector, combined with the number of different authorities
responsible for enforcing specific legislation in this sector, makes it difficult to design
implementable measures.
The results of this study indicate that labor regulation constraints prove to be more
binding than are human capital constraints, although both constraints are negatively associated
with firm performance. The negative relationship between both of these labor constraints and
firm growth are greater for SMEs than larger firms, making clear the need for reforms
specifically tailored to the SME sector. For firms to shift from low to high-productivity sectors,
both constraints need to be addressed together. These reforms could create a noticeable impact
on the ability of smaller firms to move up the value chain into exporting markets (Morrison et
al., 2006). Improving the cognitive skills among the Peruvian workforce has implications for the
long-term growth of the economy. According to recent projections, if Peru were to double the
pace of performance gains achieved in its PISA scores in the past decade, it could boost its long-
term per capita growth by 2.4% per year, doubling its current annual per capita growth rate

31
(World Bank, 2011).12 Taken together, ineffective labor regulations and a low-level of human
capital in Peru have magnified labor market distortions, constituting a strong case for sparking
job creation in the SME sector. !
! Peru has adapted its administrative framework to the needs of small businesses by
creating distinct structures targeted at small enterprises. Instead of promoting growth and
employment expansion, legislation targeting small firms makes it more costly to attract skilled,
long-term workers. The current Peruvian legislation can deter workers from even entering the
SME sector through reductions in health, social security, and pension benefits.13 These laws
promote short-term, temporary work in the small enterprise sector and reduce firm investment in
worker training programs needed to improve human capital. These reforms offer attractive
incentives to Peruvian small firms, but often have adverse effects because growth past a certain
level implies losing valued benefits (Mitra & Pingali, 1999).
The findings of this study indicate the importance of looking beyond credit constraints to
help fuel small business growth in developing countries. Complex labor regulations are found to
have a negative impact on firm growth, with a larger effect on small businesses. These findings
have important policy implications for incentivizing governments to invest in long-term policies
that have the potential to benefit both the firm and the worker. Given that the government of Peru
has specifically identified smaller sized firms as the country’s core engine of growth, enacting
policy reforms that will foster the growth of their expansion is important in achieving economic
objectives. Figure V shows the key areas for policy reform. Policy interventions should address
!!!!!!!!!!!!!!!!!!!!!!!!!!!!!!!!!!!!!!!!!!!!!!!!!!!!!!!!12 The International Student Assessment (PISA) is an international study funded by the OECD that evaluates education systems worldwide every three years. It tests the competence of 15-year-old students in core subjects (i.e. reading, math,!and!science).!13 Legislative Decree 1086 (passed in 2008) substantially weakened the terms and conditions of work in the majority of workplaces in Peru by reducing vacation, lowering pay, and reducing compensation if unjustly dismissed for all workers in workplaces of 100 or fewer workers (the law was previously written for firms of 50 or fewer workers).

32
Labor Costs (Short-run)
Human Capital
Formation (Long-run)
Labor Regulations (Short-run)
Figure'V:'Three;Pillar'Strategy'to'Policy'Formation''
Source: Author’s own illustration.
both short-term and long-term concerns, focusing on human capital formation, labor regulations,
and labor costs. By developing a framework that touches on all three pillars, governments are
better positioned to integrate both short and long run concerns into efficient labor market
policies. Lastly, policy reforms should also put in place sound enforcement mechanisms that
establish responsibilities among implementing parties (i.e. local, regional, and national
government entities), preventing future coordination problems. Enforcement mechanisms will
help ensure that the intended beneficiaries (i.e. small business owners and workers) are both
aware of policy changes and able to take advantage of them.
The cost of labor (i.e. wages) and labor regulations are common entry barriers for small
firms who want to enter the market. The results of this paper demonstrate the statistically
significant negative impact of labor regulations for both small and SME firms. Entry barriers can
be relaxed through enhanced labor market flexibility that benefits small businesses. Unless small
businesses have a greater pool of skilled labor to hire from, regulatory reforms will have little
impact. Improving the quality of labor in a market can only be improved through a long-term

33
investment in human capital. Reducing entry barriers combined with a sustained investment in
human capital will not only enhance competitiveness of Peruvian firms, but also help deliver the
socially inclusive economic growth that current President Humala is challenging the country to
achieve (IMF, 2013).
With these policy implications in mind, the findings of this study lead to three main
recommendations. First, Peru should restructure its regulatory framework to eliminate those
barriers that specifically disincentivize high labor turnover, the high cost of information sharing,
and the high cost and poor quality of training. These reforms could offer important
improvements in job quality, fostering a more permanent employer-employee relationship, and
enhance overall labor productivity. Second, Peru could strengthen its labor market institutions so
that they are able to harmonize the competing interests between worker rights and those of SME
owners (i.e., increasing the collective bargaining power of workers). Third, decentralizing labor
market institutions will improve compliance and enforcement mechanisms that the centralized
Ministry of Labor and Promotion of Employment is ill equipped to manage (Chacaltana, 2003).
For example, devolving power to local municipalities to conduct labor inspections can be
expected to increase the government’s capacity to enforce its labor laws (especially those
specifically directed at smaller sized firms). Strengthened labor institutions that promote long-
term employment and increased bargaining power will improve job quality and attract higher-
skilled workers. Effective labor institutions enable a better environment for smaller firms to
invest in employee training, keeping them up-to-date on emerging best practices and
technologies, ultimately fostering socio-economic development.
34
VIII. CONCLUDING REMARKS
Most development policy discussions about SME growth focus on access to finance
constraints and assume that, without those constraints, firms are able to expand their productive
capacity and profits (Karlan and Valdivia, 2011). The motivation behind this study is the
argument that access to finance constraints are the primary constraint to SME growth in the
developing world. This paper argues that upper-middle-income countries like Peru face a
different set of challenges, where firm growth is more severely hindered by human capital
constraints such as an inadequately trained workforce. These constraints are major barriers to be
addressed as Peru continues its path toward becoming a “more productive [and] competitive
country.”14
The OLS regression results above demonstrate that labor market constraints have a
negative impact on firm growth, especially small firms. The results of this study provide
evidence that only one of the labor market constraints, labor regulations, has a significant impact
on firm growth. Contrary to expectations, workforce constraints were not significant in any of
the above specifications. One reason for this could be that Peruvian firms are still located at a
lower level of the value chain and do not require a higher-skilled workforce to add production
value. Additionally, all models regressing firm growth on labor constraints for small and
medium-sized firms produced negative relationships between firm growth and labor constraints,
which provides evidence of the need to enact reforms that specifically target smaller firms.
Looking at the descriptive statistics alone, one would presume that smaller firms are less
constrained by labor market constraints. Small firms perceived workforce constraints to be less
of an obstacle to growth than did larger firms. However, the models in this paper show small
!!!!!!!!!!!!!!!!!!!!!!!!!!!!!!!!!!!!!!!!!!!!!!!!!!!!!!!!14!Quote taken from the annual “Message to the Nation from the President Ollanta Humala for the 191st Anniversary of the Independence of Peru” given on July 28, 2012 in Lima, Peru.!
35
firms to be the most constrained by these factors. This result implies that demand-driven
solutions may not be as simple if firms themselves do not recognize the severity of an unskilled
workforce. With this evidence at hand, forward-thinking governments should enact policies that
specifically target small firms, even if the firms have yet to recognize the binding nature of the
constraint itself.
This study has broad implications about how small firms prioritize constraints depending
on their growth stage. It demonstrates the importance of turning to rigorous quantitative analyses
to better understand the major constraints felt by individual firms that are often not captured by
macro-level data. Given the abundance of empirical work on the impact of credit constraints on
firm growth, and given the importance of having productive education and labor policies in
place, development practitioners should also have the knowledge at hand on whether labor
constraints play just as prohibitive a role in firm growth as other constraints.
As discussed throughout this study, labor regulations restrict the level of skilled human
capital available to small firms, hindering their growth. Countries that rely heavily on low-skilled
labor to attract foreign direct investment (FDI) may suffer slower economic growth (Miyamoto.
2003). As competition for FDI continues to rise, Peru must formulate labor policies that build
local skills and improve human resource capabilities. Implementation of these policies is critical
for Peru to attract a more diverse and less commodity driven volume of FDI, which is necessary,
not only for the country to continue its impressive growth rates, but to begin to reduce the
systemic inequalities engrained in its labor markets.
Addressing obstacles to growth requires an integrated approach consisting of long-term
investment in human capital formation and labor regulation reforms that reduce entry barriers for
workers into the SME sector and promote long-term employment relationships. Any strategy that
36
fails to address all three pillars of reform falls short of addressing the core problems. The long-
held presumption that access to finance, not skills, is the key obstacle to SME growth is no
longer an accurate reflection of the major constraints facing individual firms in upper-middle-
income developing countries. These findings are of particular importance as President Humala
takes continued steps toward the goal of doubling the number of exporting SME firms by 2016.
Investments in human capital and efficient labor regulation reforms will play an integral role in
helping SMEs move up the value chain to join fast-growing and highly competitive global
markets.
37
IX. APPENDIX
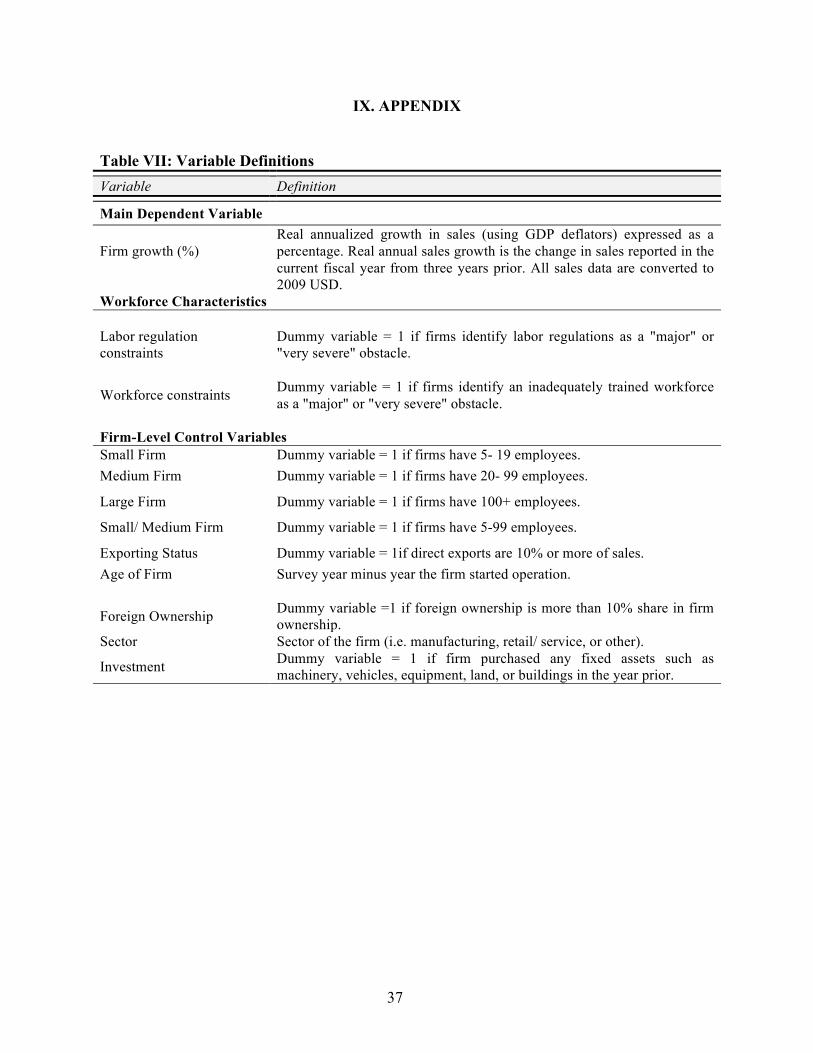
Table VII: Variable Definitions Variable Definition
Main Dependent Variable
Firm growth (%)
Real annualized growth in sales (using GDP deflators) expressed as a percentage. Real annual sales growth is the change in sales reported in the current fiscal year from three years prior. All sales data are converted to 2009 USD.
Workforce Characteristics Labor regulation constraints
Dummy variable = 1 if firms identify labor regulations as a "major" or "very severe" obstacle.
Workforce constraints
Dummy variable = 1 if firms identify an inadequately trained workforce as a "major" or "very severe" obstacle.
Firm-Level Control Variables Small Firm Dummy variable = 1 if firms have 5- 19 employees. Medium Firm Dummy variable = 1 if firms have 20- 99 employees.
Large Firm Dummy variable = 1 if firms have 100+ employees.
Small/ Medium Firm Dummy variable = 1 if firms have 5-99 employees.
Exporting Status Dummy variable = 1if direct exports are 10% or more of sales. Age of Firm Survey year minus year the firm started operation.
Foreign Ownership Dummy variable =1 if foreign ownership is more than 10% share in firm ownership.
Sector Sector of the firm (i.e. manufacturing, retail/ service, or other).
Investment Dummy variable = 1 if firm purchased any fixed assets such as machinery, vehicles, equipment, land, or buildings in the year prior.

38
Table VIII: Proportion of Firms in Industries Included in the Survey ISIC Industry Small Medium Large Total Food 14.6% 15.6% 18.2% 160 Textiles 2.4% 5.7% 6.4% 48 Garments 11.0% 9.6% 13.7% 113 Chemicals 11.3% 13.6% 8.9% 113 Plastics & rubber 3.0% 4.0% 5.4% 41 Non metallic mineral 0.6% 1.7% 2.2% 15 Basic metals 0.3% 0.8% 2.6% 12 Fabricated metal products 16.8% 12.7% 8.9% 128 Machinery & equipment 2.4% 2.5% 1.9% 23 Electronics 0.3% 1.4% 1.9% 12 Construction 0.3% 0.3% 0.0% 2 Services of motor vehicles 0.3% 0.3% 0.6% 4 Wholesale 6.7% 5.4% 2.6% 49 Retail 14.6% 12.5% 8.6% 119 Hotel and restaurants 2.1% 3.4% 1.6% 24 Transport 1.8% 3.4% 5.1% 34 Other manufacturing 11.3% 6.2% 10.5% 92 IT 0.0% 0.8% 0.6% 5 Total Number of Firms 328 353 313 994 Source: Author’s calculations using World Bank Enterprise Survey data (2010)
!!!
Table X: Proportion of Firms in Cities Included in the Survey
Small Firms Medium Firms Large Firms Total Lima 0.50 0.76 0.87 702 Arequipa 0.18 0.13 0.08 127 Chiclayo Trujillo
0.15 0.17
0.05 0.06
0.02 0.03
75 88
Total 328 352 312 992 Source: Author’s calculations using World Bank Enterprise Survey data (2010)
!
Table IX: Size and Age Distribution of Firms
1-5 Years 6-15 Years 16+ Years Total Small Firm 0.75 0.16 0.26 328 Medium Firm 0.17 0.47 0.37 352 Large Firm 0.08 0.37 0.37 312 Total 202 275 515 992 Source: Author’s calculations using World Bank Enterprise Survey data (2010)

39
!!
!!!!
Table XI: Expanded List of Descriptive Statistics
Principle Variables of Interest Number of Observations Min Max Median Mean Standard
Deviation
Annualized Firm Growth (%) 821 -0.58 0.67 0.06 0.07 0.18 Workforce Constraints* 998 0.0 4.0 2.0 2.05 1.10 Labor Regulation Constraints* 998 0.0 4.0 2.0 1.62 1.06 Age of firm (in years) 999 0.0 169 16 21.72 17.89 Small Firm 328 0.0 1.0 0.0 0.33 0.47 Medium Firm 352 0.0 1.0 0.0 0.35 0.48 Large Firm 312 0.0 1.0 0.0 0.31 0.46 Manufacturing Firm 760 0.0 1.0 1.0 0.76 0.43 Retail Firm 119 0.0 1.0 0.0 0.12 0.32 Services/ Other Firm 119 0.0 1.0 0.0 0.12 0.32 Government Ownership (>10%) 5 0.0 1.0 0.0 0.12 0.32 Foreign Ownership (>10%) 116 0.0 1.0 0.0 0.12 0.32 Exporter (>10%) 230 0.0 1.0 0.0 0.23 0.42 Number of Full-Time Workers 1000 2.00 10,600 36.5 189.11 613.48 % of Unskilled Workers 754 0.00 1.0 0.40 0.41 0.33 % of Full-Time Workers with High School Degree 987 5.00 100 100 93.94 15.01
% of Full-Time Workers with a Bachelor Degree 984 0.00 100 15 21.73 22.52
No. of Current Unfilled Vacancies 343 1.00 500 3.0 11.01 42.13 No. of Expected Vacancies in Next 12 Months 934 0.00 500 0.0 5.97 29.65
No. of Hours Spent on Internal Training ** 535 2.00 7,500 50 154.21 523.21
Source: Author’s calculation using World Bank Enterprise Survey data, 2010 *Constraints are measured on a scale of 0-4 where 0 represents “no obstacle” and 4 represents a “very severe obstacle.” ** Internal training is defined as in-house training conducted by the firm’s supervisors other non-supervisory employees or at the firm’s training centers.
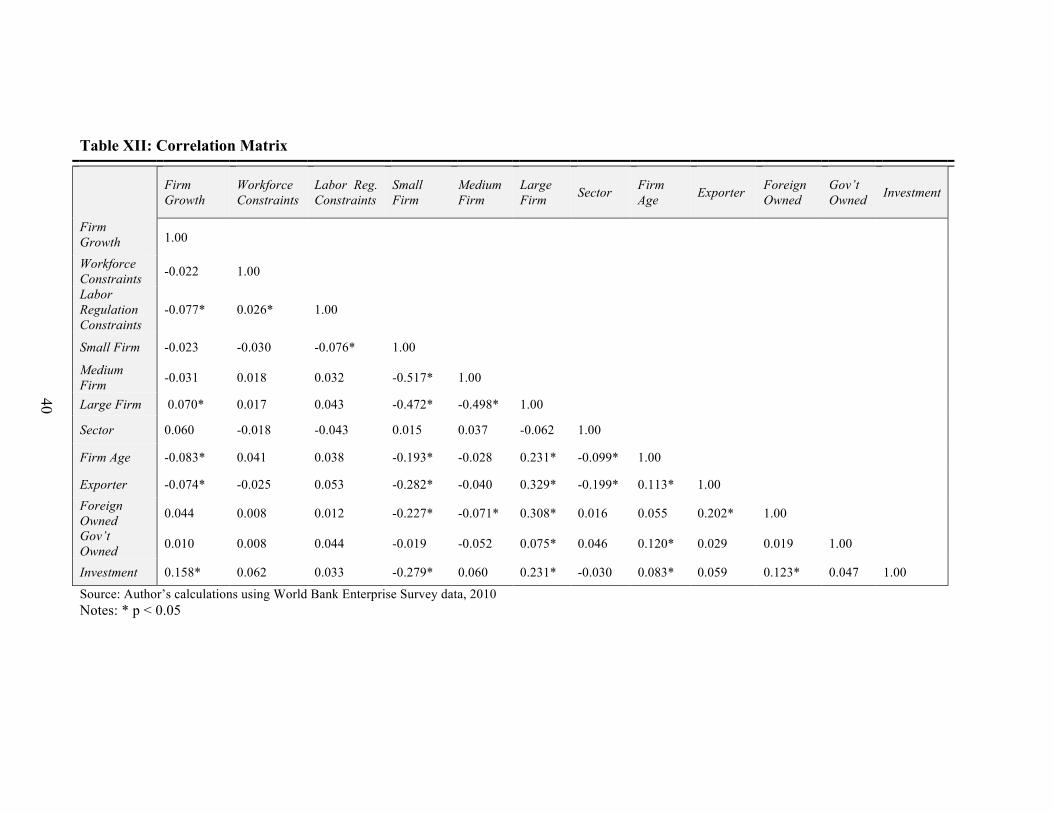
!
!
Table XII: Correlation Matrix
Firm Growth
Firm Growth
Workforce Constraints
Labor Reg. Constraints
Small Firm
Medium Firm
Large Firm Sector Firm
Age Exporter Foreign Owned
Gov’t Owned Investment
1.00
Workforce Constraints -0.022 1.00
Labor Regulation Constraints
-0.077* 0.026* 1.00
Small Firm -0.023 -0.030 -0.076* 1.00
Medium Firm -0.031 0.018 0.032 -0.517* 1.00
Large Firm 0.070* 0.017 0.043 -0.472* -0.498* 1.00
Sector 0.060 -0.018 -0.043 0.015 0.037 -0.062 1.00
Firm Age -0.083* 0.041 0.038 -0.193* -0.028 0.231* -0.099* 1.00
Exporter -0.074* -0.025 0.053 -0.282* -0.040 0.329* -0.199* 0.113* 1.00
Foreign Owned 0.044 0.008 0.012 -0.227* -0.071* 0.308* 0.016 0.055 0.202* 1.00
Gov’t Owned 0.010 0.008 0.044 -0.019 -0.052 0.075* 0.046 0.120* 0.029 0.019 1.00
Investment 0.158* 0.062 0.033 -0.279* 0.060 0.231* -0.030 0.083* 0.059 0.123* 0.047 1.00
Source: Author’s calculations using World Bank Enterprise Survey data, 2010 Notes: * p < 0.05
40
41
X. REFERENCES
Ahn, JaeBin and McQuoid, Alexander. “Capacity Constrained Exporters: Micro Evidence and Macro Implications.” International Monetary Fund (2012). Aterido, Reyes, and Mary Hallward-Driemeier. "Big Constraints to Small Firms' growth? Business Environment and Employment Growth Across Firms." Business Environment and Employment Growth Across Firms. World Bank Policy Research Working Paper Series (August 2009). Banerji, Arup and Ghanem, Hafez. “Political Regimes, Trade and Labor Policies in Developing Countries.” World Bank Policy Research Working Paper 1521 (1995). Becchetti, Leonardo, and Giovanni Trovato. "The Determinants of Growth for Small and Medium Sized Firms. The Role of the Availability of External Finance." Small Business Economics 19, no. 4 (2002): 291-306. Beck, Thorsten, and Demirguc-Kunt, Asli. "Small and Medium-Size Enterprises: Access to Finance as a Growth Constraint." Journal of Banking & Finance 30, no. 11 (2006): 2931- 2943. Beck, Thorsten, Demirguc-Kunt, Asli, and Levine, Ross. “SMEs, Growth, and Poverty.” No. 11224. National Bureau of Economic Research (2005). Chacaltana, Juan. “Public Policy and Employment in Micro and Small Enterprises in Peru.” International Labor Organization (2003). David, Paul and Foray, Dominique. “An Introduction to the Economy of the Knowledge Society.” International Social Science Journal 54, no 171 (2002): 9- 23. Dearden Lorraine, Reed, Howard and Van Reenen, John. 2006. “The Impact of Training on Productivity and Wages: Evidence from British Panel Data.” Oxford Bulletin of Economics and Statistics 68, no. 4 (2006): 397- 421. Djankov, Simeon, La Porta, R., Lopez-de-Silanes, F., and Shleifer, A. "The Regulation of Entry." The Quarterly Journal of Economics 117, no. 1 (2002): 1-37. Geroski, Paul. “The Growth of Firms in Theory and Practice.” Centre for Economic Policy Research, Discussion Paper no. 2092 (1999). Hart, Paul. “Theories of Firms’ Growth and the Generation of Jobs.” Review of Industrial Organization 17, no. 3 (2000): 229-248. Heshmati, Almas and Loof, Hans. “On the Relationship between Innovation and Performance: A Sensitivity Analysis.” Economics of Innovation and New Technology 15, no. 4-5 (2006): 317- 344.

42
Idson, Todd and Oi, Walter. “Workers are More Productive in Large Firms.” The American Economic Review 89, no. 2 (1999): 104- 108. Jensen and McGuckin. “Firm Performance and Evolution: Empirical Regularities in the U.S. Microdata.” Industrial and Corporate Change 6, no. 1 (1997): 25-47. Karlan, Dean and Valdivia, Martin. “Teaching Entrepreneurship: Impact of Business Training on Microfinance Clients and Institutions.” Review of Economics and Statistics 93, no. 2 (2011): 510-527. Klapper, Leora, Luc Laeven, and Raghuram Rajan. “Business Environment and Firm Entry: Evidence from International Data.” no. 10380. National Bureau of Economic Research, (2004). Kuramoto, Juana. “Innovation, R&D and Productivity: Case Studies from Peru.” Inter-American Development Bank Working Paper No. IDB-WP-249 (June 2011). Laursen, Keld, Mahnke, Volker and Vejrup-Hansen, Per. “Firm Growth from a Knowledge Structure Perspective.” Department of Industrial Economics and Strategy, Copenhagen Business School (1999). Micco, Alejandro and Pages, Carmen. “The Economic Effects of Employment Protection: Evidence from International Industry-Level Data.” Institute for the Study of Labor Discussion Paper No. 2433 (2006). Ministry of External Trade and Tourism. “Trade Agreements of Peru.” (2011) [Website] Retrieved from http://www.acuerdoscomerciales.gob.pe. Mitra, Reshmi and Pingali, Venugopal. “Analysis of Growth Stages in Small Firms: A Case Study of Automobile Ancillaries in India.” Journal of Small Business Management 37, no. 3 (1999): 62-75. Miyamoto, Koji. “Human Capital Formation and Foreign Direct Investment in Developing Countries.” OECD Development Center, Working Paper 211 (2003). Mondino, Guillermo and Montoya, Silvia. “The Effects of Labor Market Regulations on Employment Decisions by Firms. Empirical Evidence from Argentina.” Law and Employment: Lessons from Latin America and the Caribbean, University of Chicago Press (2004): 351-400. Idson, Todd L., and Walter Y. Oi. "Workers are More Productive in Large Firms." The American Economic Review 89, no. 2 (1999): 104-108. International Monetary Fund. “Peru: 2012 Article IV Consultation.” IMF Country Report no. 1 3/45, IMF Publications, Washington, DC (February 2013).
43
Organization for Economic Co-operation and Development Staff. “OECD SME and Entrepreneurship Outlook.” OECD (2005). Pissarides, Christopher. “Human Capital and Growth: A Synthesis Report.” no. 168. OECD, (2000). Presidency of the Republic of Peru. “Message to the Nation from the President Ollanta Humala for the 191st Anniversary of the Independence of Peru.” Presidency of the Republic of Peru. (July 28, 2012) [Website] Retrieved from http://www.presidencia.gob.pe/mensaje-a-la-nacion-del-presidente-de-la-republica- ollanta-humala-por-el-191d-aniversario-de-la-independencia-nacional. Robertson, Paul. “The Role of Training and Skilled Labour in the Success of SMEs in Developing Economies.” Education + Training 45, no. 8/9 (2003): 461- 473. Seker, Murat and Correa, Paulo. “Obstacles to Growth for Small and Medium Enterprises in Turkey.” The World Bank Working Paper Series (2010). Sengupta, Jati. New Growth Theory. Edward Elgar, Northampton, MA (1998). Soderbom, Mans and Tea, Francis. “Firm Size and Human Capital as Determinants of Productivity and Earnings.” University of Oxford, Institute of Economics and Statistics, Centre for the Study of African Economies (2001). Storey, D.J. Understanding the Small Business Sector. New York: Routledge (1994). Vasquez, Fernando and Doloriert, Clair. “Case-Study of Internationalization in Peruvian SMEs.” Journal of CENTRUM Cathedra 4, no. 1 (2011): 77-99. World Bank Group. “Enterprise Surveys (Peru).” World Bank, Washington, DC (2010) retrieved from http://www.enterprisesurveys.org. World Bank Group. “Strengthening Skills and Employability in Peru: Final Report.” World Bank Publications, Washington, DC (2011) retrieved from https://openknowledge.worldbank.org/handle/10986/12533. !