observations of pockmark flow structure in belfast bay
TRANSCRIPT
ORIGINAL
Observations of pockmark flow structure in Belfast Bay, Maine,Part 2: evidence for cavity flow
Christina L. Fandel1,2 & Thomas C. Lippmann1& Diane L. Foster1 & Laura L. Brothers3
Received: 5 April 2016 /Accepted: 25 September 2016# Springer-Verlag Berlin Heidelberg 2016
Abstract Pockmark flow circulation patternswere investigat-ed through current measurements along the rim and center oftwo pockmarks in Belfast Bay, Maine. Observed time-varyingcurrent profiles have a complex vertical and directional struc-ture that rotates significantly with depth and is strongly depen-dent on the phase of the tide. Observations of the verticalprofiles of horizontal velocities in relation to relative geomet-ric parameters of the pockmark are consistent with circulationpatterns described qualitatively by cavity flow models(Ashcroft and Zhang 2005). The time-mean behavior of theshear layer is typically used to characterize cavity flow, andwas estimated using vorticity thickness to quantify the growthrate of the shear layer horizontally across the pockmark.Estimated positive vorticity thickness spreading rates are con-sistent with cavity flow predictions, and occur at largely dif-ferent rates between the two pockmarks. Previously modeledflow (Brothers et al. 2011) and laboratory measurements (Pauet al. 2014) over pockmarks of similar geometry to those ex-amined herein are also qualitatively consistent with cavityflow circulation, suggesting that cavity flow may be a goodfirst-order flow model for pockmarks in general.
Introduction
Pockmarks are crater-like depressions in the seafloor that areglobally distributed and ubiquitous in nearshore environments(e.g., Kelley et al. 1994). These depressions are believed toform from fluid and gas escape from underlying, unconsoli-dated sediment and range in size from a few meters to severalkilometers in diameter (Hovland and Judd 1988). The interac-tion of currents with these seafloor depressions is poorly un-derstood, but is of primary importance to circulation, mixing,sediment transport within and morphological evolution ofpockmarks. Understanding the character of the flow in thevicinity of pockmarks could lead to improved estimations offaunal and nutrient dispersion patterns around pockmarks(Wildish et al. 2008) as well as better constrain sedimentationand erosion rate estimation within and around these prominentseafloor features (Pau and Hammer 2013).
The morphologies of pockmarks are often described ascircular or elliptical (or elongated), or more quantitativelyby the relative distance across the longest axis of the rim(L) to the depth from the rim to the bottom of the pock-mark (D). The length-to-depth ratio (L/D) for most ob-served pockmarks ranges from 1–10 depending on thenature of the bottom conditions and the flow fields wherethey are located (Manley et al. 2004; Hammer et al. 2009;Brothers et al. 2011; Pau and Hammer 2013). L/D ratioscan determine the nature of the flow patterns observedand are used as guiding parameters for numerical simula-tions (e.g., Brothers et al. 2011).
Several previous studies have investigated flow circulationwithin pockmarks. Manley et al. (2004) conducted a long-termfield study over a nearly circular pockmark with L/D~10 inBurlington Bay, Vermont. Observations of strong, upward-directed vertical velocity events and flow recirculation withinthe pockmark are consistent with back-eddy formation or the
* Thomas C. [email protected]
1 Center for Coastal and Ocean Mapping, University of NewHampshire, 24 Colovos Rd, Durham, NH 03824, USA
2 Now with: Hydrographic Surveys Division, Office of Coast Survey,National Oceanic and Atmospheric Administration, 1315 East-WestHwy, Silver Spring, MD 20910, USA
3 U.S. Geological Survey, 384 Woods Hole Rd, WoodsHole, MA 02543, USA
Geo-Mar LettDOI 10.1007/s00367-016-0473-3
development of a cyclostrophic flow within the pockmark.Three-dimensional numerical modeling completed byHammer et al. (2009) examined current flow over a pockmark(L/D~5.7) with similar dimensions to those found naturally inthe Inner Oslofjord, Norway pockmark field. Modeled resultsshow contour-following currents with strong upward-directedvelocities in the center and along the downstream edge of thepockmark that conceptually agree with the cyclostrophic flowmodel proposed by Manley et al. (2004). Brothers et al. (2011)numerically modeled incompressible flow over a simplifiedpockmark in two and three dimensions. The results show bothcontour-following and recirculating flow patterns within thepockmark as the relative L/D ratio of the pockmark is altered,and indicate that pockmark flow circulation is stronglyinfluenced by the geometry of the depression. Fieldobservations by Pau and Hammer (2013) of horizontal currents(vertical velocities within the pockmarks were not measured intheir study) above pockmarks in Oslofjord (L/D ~5.3 and 4.3)show diurnal variation with subsurface maxima attributed toswimming fish. Laboratory observations by Pau et al. (2014)over towed physical models of pockmarkswith higher L/D ratio(~8) show flow streamlines that dip down into the pockmarkdepression at the leading edge and upwell out of the pockmarkat the trailing edge, consistent with contour-following currentswithout recirculation within the pockmark. Finally, plausiblescenarios for the development of pockmarks have been pro-posed based on seismic observations of paleo-stratigraphy,and include contour-following currents that form stagnationpoints (and eddies) on the upstream side internal to the pock-mark (Kilhams et al. 2011).
In all of these studies, and often in nature, the morphologyof pockmarks resembles that of cavities (or surface cutouts)along a boundary. Flow past such cavities results in an evolu-tion of the bottom boundary layer that depends on the dimen-sions of the cavity, a feature of cavities that has been wellstudied in engineering fields (e.g., Rockwell and Naudascher1978; Ashcroft and Zhang 2005, and many others) and exam-ined theoretically, empirically, and with numerical models(e.g., Sarohia 1977; Rockwell and Naudascher 1978; Ahujaand Mendoza 1995). These studies reveal cavity flow circula-tion is strongly influenced by boundary layer thickness, free-stream velocity, turbulence, and the geometry of the cavity. Incavity flow, a shear layer forms as the overriding flow sepa-rates at the upstream rim of the cavity due to interactions withthe depression. Typically, the time-mean behavior of the shearlayer is used to characterize cavity flow, and is strongly de-pendent on the L/D ratio of the cavity.
Cavity flow can be grossly subdivided into two flow re-gimes: closed cavity flow and open cavity flow. Closed cavityflow predominantly occurs in shallow cavities (L/D>9) and ischaracterized by the shear layer flowing into the cavity,reattaching along the base, and then separating again beforethe downstream wall. The flow dips down into the cavity andprogresses across and out the downstream side withoutrecirculating within the cavity (like cyclostrophic flow pat-terns). Conversely, open cavity flow typically occurs in deepercavities (L/D<6) and is described by the shear layer passingover the cavity and reattaching along the trailing edge (Fig. 1shows a schematic that illustrates open cavity flow). In thiscase, a recirculation cell with overturning currents develops
Fig. 1 Schematic model of open cavity flow circulation and shear layergrowthwith distance downstream. Yellow trianglesApproximate locationof ADCPs within the pockmark, red fractional distance (relative to L)downstream from the leading edge. Top panel Expected circulationpatterns for open cavity flow during the flooding and the ebbing tides.Bottom panel Temporally varying horizontal velocity profiles across a
modeled cavity during flooding and ebbing tidal conditions, andapproximate shear layer growth with distance downstream (shadedorange region). The horizontal velocity profiles are offset based onposition within the cavity with zero flow marked by a dash-dot gray line.Modified from Fig. 3 of Ashcroft and Zhang (2005)
Geo-Mar Lett
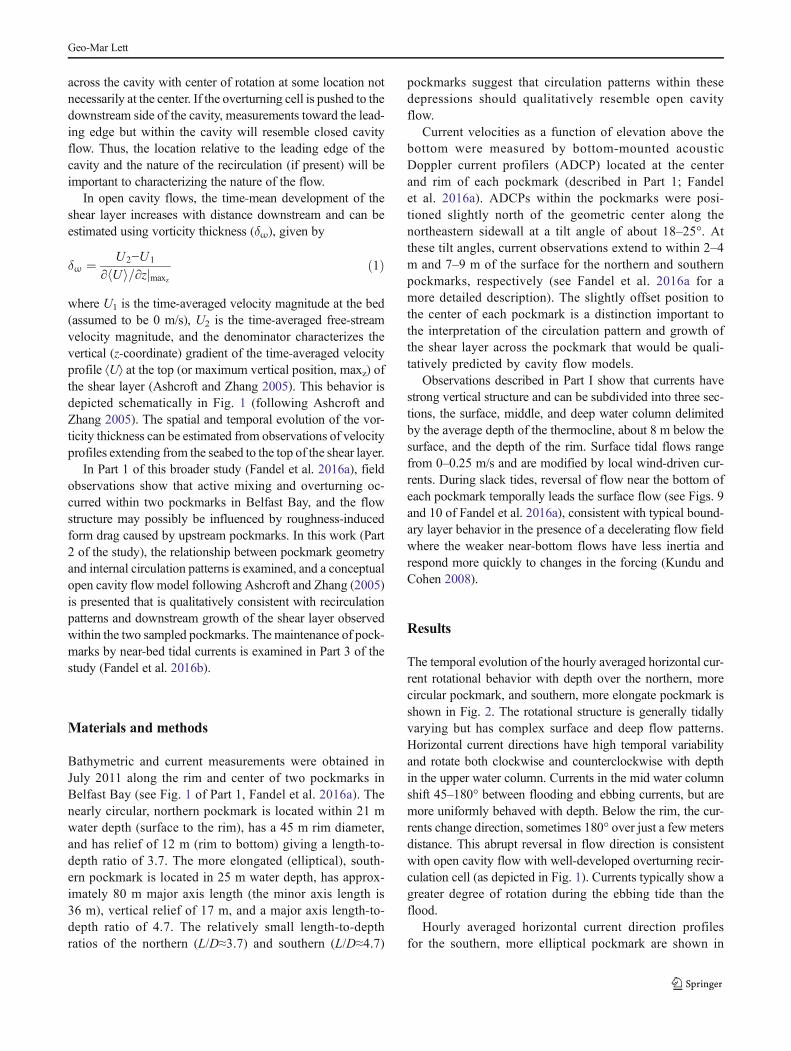
across the cavity with center of rotation at some location notnecessarily at the center. If the overturning cell is pushed to thedownstream side of the cavity, measurements toward the lead-ing edge but within the cavity will resemble closed cavityflow. Thus, the location relative to the leading edge of thecavity and the nature of the recirculation (if present) will beimportant to characterizing the nature of the flow.
In open cavity flows, the time-mean development of theshear layer increases with distance downstream and can beestimated using vorticity thickness (δω), given by
δω ¼ U2−U1
∂ Uh i=∂z maxzj ð1Þ
where U1 is the time-averaged velocity magnitude at the bed(assumed to be 0 m/s), U2 is the time-averaged free-streamvelocity magnitude, and the denominator characterizes thevertical (z-coordinate) gradient of the time-averaged velocityprofile ⟨U⟩ at the top (or maximum vertical position, maxz) ofthe shear layer (Ashcroft and Zhang 2005). This behavior isdepicted schematically in Fig. 1 (following Ashcroft andZhang 2005). The spatial and temporal evolution of the vor-ticity thickness can be estimated from observations of velocityprofiles extending from the seabed to the top of the shear layer.
In Part 1 of this broader study (Fandel et al. 2016a), fieldobservations show that active mixing and overturning oc-curred within two pockmarks in Belfast Bay, and the flowstructure may possibly be influenced by roughness-inducedform drag caused by upstream pockmarks. In this work (Part2 of the study), the relationship between pockmark geometryand internal circulation patterns is examined, and a conceptualopen cavity flowmodel following Ashcroft and Zhang (2005)is presented that is qualitatively consistent with recirculationpatterns and downstream growth of the shear layer observedwithin the two sampled pockmarks. The maintenance of pock-marks by near-bed tidal currents is examined in Part 3 of thestudy (Fandel et al. 2016b).
Materials and methods
Bathymetric and current measurements were obtained inJuly 2011 along the rim and center of two pockmarks inBelfast Bay (see Fig. 1 of Part 1, Fandel et al. 2016a). Thenearly circular, northern pockmark is located within 21 mwater depth (surface to the rim), has a 45 m rim diameter,and has relief of 12 m (rim to bottom) giving a length-to-depth ratio of 3.7. The more elongated (elliptical), south-ern pockmark is located in 25 m water depth, has approx-imately 80 m major axis length (the minor axis length is36 m), vertical relief of 17 m, and a major axis length-to-depth ratio of 4.7. The relatively small length-to-depthratios of the northern (L/D≈3.7) and southern (L/D≈4.7)
pockmarks suggest that circulation patterns within thesedepressions should qualitatively resemble open cavityflow.
Current velocities as a function of elevation above thebottom were measured by bottom-mounted acousticDoppler current profilers (ADCP) located at the centerand rim of each pockmark (described in Part 1; Fandelet al. 2016a). ADCPs within the pockmarks were posi-tioned slightly north of the geometric center along thenortheastern sidewall at a tilt angle of about 18–25°. Atthese tilt angles, current observations extend to within 2–4m and 7–9 m of the surface for the northern and southernpockmarks, respectively (see Fandel et al. 2016a for amore detailed description). The slightly offset position tothe center of each pockmark is a distinction important tothe interpretation of the circulation pattern and growth ofthe shear layer across the pockmark that would be quali-tatively predicted by cavity flow models.
Observations described in Part I show that currents havestrong vertical structure and can be subdivided into three sec-tions, the surface, middle, and deep water column delimitedby the average depth of the thermocline, about 8 m below thesurface, and the depth of the rim. Surface tidal flows rangefrom 0–0.25 m/s and are modified by local wind-driven cur-rents. During slack tides, reversal of flow near the bottom ofeach pockmark temporally leads the surface flow (see Figs. 9and 10 of Fandel et al. 2016a), consistent with typical bound-ary layer behavior in the presence of a decelerating flow fieldwhere the weaker near-bottom flows have less inertia andrespond more quickly to changes in the forcing (Kundu andCohen 2008).
Results
The temporal evolution of the hourly averaged horizontal cur-rent rotational behavior with depth over the northern, morecircular pockmark, and southern, more elongate pockmark isshown in Fig. 2. The rotational structure is generally tidallyvarying but has complex surface and deep flow patterns.Horizontal current directions have high temporal variabilityand rotate both clockwise and counterclockwise with depthin the upper water column. Currents in the mid water columnshift 45–180° between flooding and ebbing currents, but aremore uniformly behaved with depth. Below the rim, the cur-rents change direction, sometimes 180° over just a few metersdistance. This abrupt reversal in flow direction is consistentwith open cavity flow with well-developed overturning recir-culation cell (as depicted in Fig. 1). Currents typically show agreater degree of rotation during the ebbing tide than theflood.
Hourly averaged horizontal current direction profilesfor the southern, more elliptical pockmark are shown in
Geo-Mar Lett
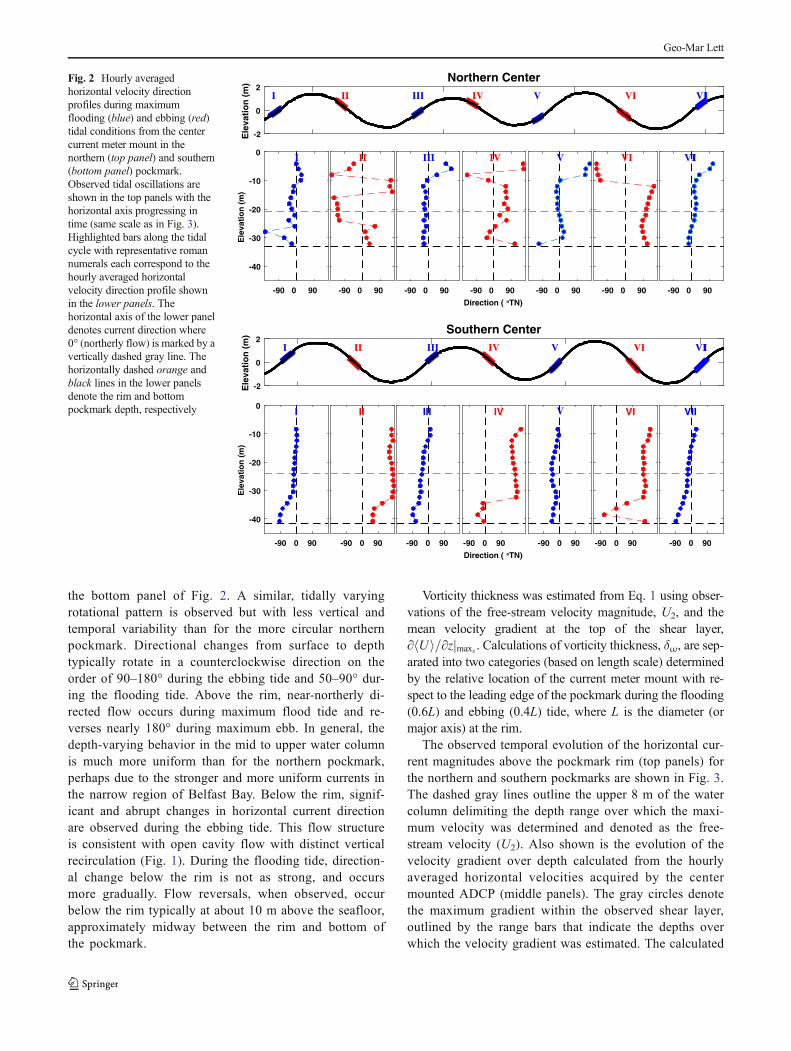
the bottom panel of Fig. 2. A similar, tidally varyingrotational pattern is observed but with less vertical andtemporal variability than for the more circular northernpockmark. Directional changes from surface to depthtypically rotate in a counterclockwise direction on theorder of 90–180° during the ebbing tide and 50–90° dur-ing the flooding tide. Above the rim, near-northerly di-rected flow occurs during maximum flood tide and re-verses nearly 180° during maximum ebb. In general, thedepth-varying behavior in the mid to upper water columnis much more uniform than for the northern pockmark,perhaps due to the stronger and more uniform currents inthe narrow region of Belfast Bay. Below the rim, signif-icant and abrupt changes in horizontal current directionare observed during the ebbing tide. This flow structureis consistent with open cavity flow with distinct verticalrecirculation (Fig. 1). During the flooding tide, direction-al change below the rim is not as strong, and occursmore gradually. Flow reversals, when observed, occurbelow the rim typically at about 10 m above the seafloor,approximately midway between the rim and bottom ofthe pockmark.
Vorticity thickness was estimated from Eq. 1 using obser-vations of the free-stream velocity magnitude, U2, and themean velocity gradient at the top of the shear layer,∂ Uh i=∂z maxzj . Calculations of vorticity thickness, δω, are sep-arated into two categories (based on length scale) determinedby the relative location of the current meter mount with re-spect to the leading edge of the pockmark during the flooding(0.6L) and ebbing (0.4L) tide, where L is the diameter (ormajor axis) at the rim.
The observed temporal evolution of the horizontal cur-rent magnitudes above the pockmark rim (top panels) forthe northern and southern pockmarks are shown in Fig. 3.The dashed gray lines outline the upper 8 m of the watercolumn delimiting the depth range over which the maxi-mum velocity was determined and denoted as the free-stream velocity (U2). Also shown is the evolution of thevelocity gradient over depth calculated from the hourlyaveraged horizontal velocities acquired by the centermounted ADCP (middle panels). The gray circles denotethe maximum gradient within the observed shear layer,outlined by the range bars that indicate the depths overwhich the velocity gradient was estimated. The calculated
-2
0
2
Ele
vati
on
(m
) Southern CenterI II III IV V VI VII
-90 0 90
-40
-30
-20
-10
0
Ele
vati
on
(m
)
I
-90 0 90
II
-90 0 90
III
-90 0 90
Direction ( °TN)
IV
-90 0 90
V
-90 0 90
VI
-90 0 90
VII
-2
0
2
Ele
vati
on
(m
) Northern CenterI II III IV V VI VII
-90 0 90
-40
-30
-20
-10
0
Ele
vati
on
(m
)
I
-90 0 90
II
-90 0 90
III
-90 0 90
Direction ( °TN)
IV
-90 0 90
V
-90 0 90
VI
-90 0 90
VII
Fig. 2 Hourly averagedhorizontal velocity directionprofiles during maximumflooding (blue) and ebbing (red)tidal conditions from the centercurrent meter mount in thenorthern (top panel) and southern(bottom panel) pockmark.Observed tidal oscillations areshown in the top panels with thehorizontal axis progressing intime (same scale as in Fig. 3).Highlighted bars along the tidalcycle with representative romannumerals each correspond to thehourly averaged horizontalvelocity direction profile shownin the lower panels. Thehorizontal axis of the lower paneldenotes current direction where0° (northerly flow) is marked by avertically dashed gray line. Thehorizontally dashed orange andblack lines in the lower panelsdenote the rim and bottompockmark depth, respectively
Geo-Mar Lett
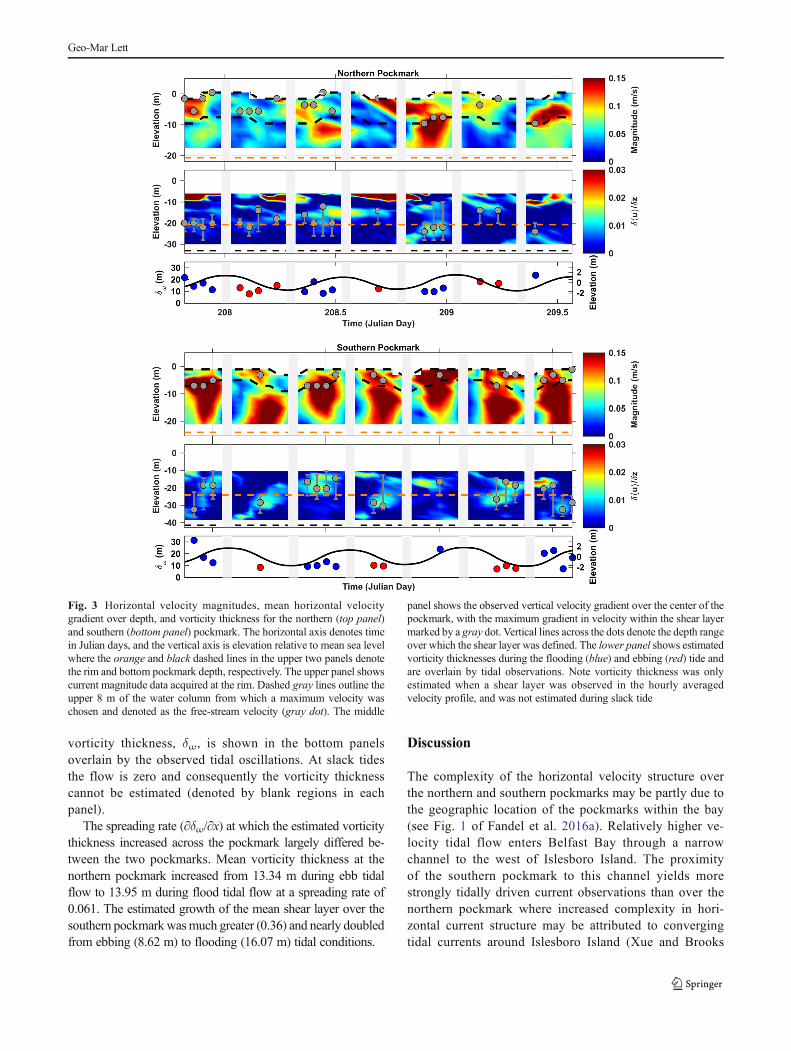
vorticity thickness, δω, is shown in the bottom panelsoverlain by the observed tidal oscillations. At slack tidesthe flow is zero and consequently the vorticity thicknesscannot be estimated (denoted by blank regions in eachpanel).
The spreading rate (∂δω/∂x) at which the estimated vorticitythickness increased across the pockmark largely differed be-tween the two pockmarks. Mean vorticity thickness at thenorthern pockmark increased from 13.34 m during ebb tidalflow to 13.95 m during flood tidal flow at a spreading rate of0.061. The estimated growth of the mean shear layer over thesouthern pockmarkwasmuch greater (0.36) and nearly doubledfrom ebbing (8.62 m) to flooding (16.07 m) tidal conditions.
Discussion
The complexity of the horizontal velocity structure overthe northern and southern pockmarks may be partly due tothe geographic location of the pockmarks within the bay(see Fig. 1 of Fandel et al. 2016a). Relatively higher ve-locity tidal flow enters Belfast Bay through a narrowchannel to the west of Islesboro Island. The proximityof the southern pockmark to this channel yields morestrongly tidally driven current observations than over thenorthern pockmark where increased complexity in hori-zontal current structure may be attributed to convergingtidal currents around Islesboro Island (Xue and Brooks
Fig. 3 Horizontal velocity magnitudes, mean horizontal velocitygradient over depth, and vorticity thickness for the northern (top panel)and southern (bottom panel) pockmark. The horizontal axis denotes timein Julian days, and the vertical axis is elevation relative to mean sea levelwhere the orange and black dashed lines in the upper two panels denotethe rim and bottom pockmark depth, respectively. The upper panel showscurrent magnitude data acquired at the rim. Dashed gray lines outline theupper 8 m of the water column from which a maximum velocity waschosen and denoted as the free-stream velocity (gray dot). The middle
panel shows the observed vertical velocity gradient over the center of thepockmark, with the maximum gradient in velocity within the shear layermarked by a gray dot. Vertical lines across the dots denote the depth rangeover which the shear layer was defined. The lower panel shows estimatedvorticity thicknesses during the flooding (blue) and ebbing (red) tide andare overlain by tidal observations. Note vorticity thickness was onlyestimated when a shear layer was observed in the hourly averagedvelocity profile, and was not estimated during slack tide
Geo-Mar Lett

2000). Depth-varying velocity structure is also partiallydue to the influence of the bottom boundary layer ontidally modulated flows (such as those described inPrandle 1982). In any case, the vertically varying rotation-al structure observed over the pockmarks shows abruptdirectional changes during the ebbing tide that are consis-tent with that expected for open cavity flow and the for-mation of a recirculation cell within the pockmark(Rockwell and Naudascher 1978).
Recirculation cell formation is also observed oversteeply sloped sand dunes (e.g., Paarlberg et al. 2009;Lefebvre et al. 2014a) and deep cavities (e.g., Ashcroftand Zhang 2005), but neither distinctly mimic the near-conical shape that characterizes pockmark geometry.Similar to pockmarks, cavities are defined by a basesurrounded by four walls, but exhibit vertical sidewallsunlike the sloped sidewalls of pockmarks. Comparatively, sand dunes share the sloping sidewall character-istic with pockmarks, but are defined as long linear fea-tures on the seabed and are not confined on all sides.Previous studies of flow over sand dunes show the forma-tion of a flow separation zone, resulting in a recirculatingcell that is followed by a turbulent wake downstream(Lefebvre et al. 2014b). A permanent flow separationzone (not observed in Ashcroft and Zhang 2005) is oftenobserved over bedforms with a leeside slope equal orclose to the angle of repose (30°; Bennett and Best1995; Venditti and Bennett 2000; Lefebvre et al. 2014a).Given the steep sidewall angles of the sampled pockmarks(up to 60°) and observations of flow reversal near the bedduring ebbing tidal conditions, it is possible that a flowseparation zone followed by a turbulent wake region maydescribe the flow circulation within the sampled pock-marks. However, the spatial resolution of the fixedADCP data is insufficient to accurately define the position
and extent of the flow separation zone. Conversely, theapplicability of the cavity flow model to the pockmarkflow circulation may be assessed by examining the time-mean vorticity thickness across the sampled pockmarks.
The locations of the ADCPs within the pockmark arenot centered, and thus yield different distances (overwhich shear layers can grow) relative to the direction ofthe tidal flows. The general circulation patterns for opencavity flow are illustrated in the diagram in Fig. 1, as wellas the approximate shear layer growth with distancedownstream of the leading edge of the pockmark.Observed vorticity thicknesses over both pockmarks arelarger during flooding tidal conditions (Fig. 3), consistentwith the expectation that for open cavity flow the shearlayer grows with distance downstream.
Spreading rate estimates across the sampled pockmarksare qualitatively compared to those obtained by Ashcroftand Zhang (2005) over a modeled deep cavity (L/D=4;Fig. 4). Ashcroft and Zhang (2005) observed linear shearlayer growth across the modeled cavity at a spreading rateof 0.14. The variability in spreading rates observed overthe modeled deep cavity and the sampled pockmarks(northern ∂δω/∂x = 0.061 and southern ∂δω/∂x = 0.36)may be attributed to the geometric differences betweenthese depressions, their relative proximity to convergingcurrents or narrowing of the channel width, or the timevariability associated with the natural flow field(consisting primarily of tides and wind-driven currents).In Ashcroft and Zhang (2005), modeled cavity geometryis described by vertical sidewalls and a flat bottom,whereas the Belfast pockmarks were conical in naturewith an approximate 30–60° sidewall slopes (Fandelet al. 2016a). The influence of non-vertical sidewalls aswell as proximity and possible influence of flow overother regional cavities (form drag; Fandel et al. 2016a)
0 10 20 30 40Pockmark Length (m)
0
5
10
15
20
25
30
(m)
Northern Pockmark
Ebbing TideFlooding Tide
0 20 40 60 80Pockmark Length (m)
0
5
10
15
20
25
30
(m)
Southern Pockmark
Ebbing TideFlooding Tide
Fig. 4 Vorticity thickness relativeto distance (inm) from the leadingedge of the pockmark (denotedPockmark Length in the panels)relative to the flow directionestimated over the northern andsouthern pockmark duringflooding (blue) and ebbing (red)tidal conditions. Mean vorticitythicknesses during flooding andebbing tidal conditions arerepresented as black squares withvalues indicated in the lower leftcorner of each graph
Geo-Mar Lett

are unaccounted for in this model and may be responsiblefor some of the differences in spreading rate estimates.Although large variability in spreading rates were ob-served over the sampled pockmarks, observations of flowreversal near the base of the pockmarks and downstreamgrowth of the shear layer are also consistent with opencavity flow, and suggest that cavity flow may describethe nature of flow circulation in the pockmarks ofBelfast Bay.
The cavity flowmodel predicts varying circulation patternsdepending on the geometry of the depression, often expressedas a function of the length-to-depth ratio. In shallow cavities(L/D>9), the shear layer typically reattaches along the base ofthe cavity and then separates again before the downstreamedge, whereas in deep cavities (L/D<6) the shear layer extendsacross the cavity and then reattaches along the downstreamwall. Referencing these length-to-depth thresholds, resultsfrom previous studies investigating flow circulation withinpockmarks are qualitatively consistent with the cavity flowmodel. Hammer et al. (2009) conducted three-dimensionalnumerical simulations of flow within a pockmark (L/D=5.7)and found contour-following horizontal velocity currents thatdecreased in magnitude with depth, representative of closedcavity flow. While closed cavity flow is typically associatedwith cavities of L/D>9, the proximity of the length-to-depthratio of the modeled pockmark to the theoretical threshold ofopen cavity flow (L/D<6) may account for the difference be-tween the results of Hammer et al. (2009) and those foundherein (with L/D=3.7 and L/D=4.7 for the two pockmarkssampled). Pau et al. (2014) conducted laboratory measure-ments of flow within a pockmark with L/D=8 that showedflow patterns without recirculation, consistent with closedcavity flow.
Numerical simulations conducted by Brothers et al. (2011)examined circulation patterns arising from two-dimensionalturbulent flow over a shallow pockmark (L/D≈18) and three-dimensional laminar flow over a deep pockmark (L/D≈4.7).Modeled results indicate contour-following currents withinthe shallow pockmark and the formation of a large circulationcell within the deep pockmark that bridges the pockmarkopening and circulates throughout the depression. These re-sults are consistent with cavity flow circulation that predictscontour-following currents in shallow (L/D>9) cavities andrecirculation cell formation within deep cavities (L/D<6).
Conclusions
Horizontal current direction profiles acquired within twopockmarks in Belfast Bay show significant rotationwith depthand are tidally modulated, particularly below the rim. Duringthe flooding tide, nearly northward surface currents graduallyrotate 75±25° with depth. Larger directional changes are
observed during ebbing tidal flow on the order of 180±50°and typically occur abruptly around 10 m from the bottom.The reversal of flow direction with depth during ebbing tidalconditions is qualitatively consistent with recirculation pat-terns predicted by open cavity flow (consistent withAshcroft and Zhang 2005).
Shear layer growth rates that characterize the downstreamspreading of high vorticity regions were approximated usingvorticity thickness and are positive across both pockmarks.The near-bed flow reversal and shear layer growthwith distancedownstream are consistent with open cavity flow patterns (L/D<6) and suggest that pockmark flow circulation in Belfast Bayis reasonably well described by cavity flow. The consistency ofobservations presented herein with modeled and empirical re-sults from previous Belfast Bay (Brothers et al. 2011) andOslofjord (Hammer et al. 2009; Pau et al. 2014) studies indicatethat cavity flow circulation (closed or open)may be a good first-order flow model for pockmarks in general.
Current observations made herein and those of others(Brothers et al. 2011; Pau et al. 2014) are qualitatively consis-tent with cavity flow whereby shallow cavities are defined bycontour-following currents and deep cavities exhibit a recir-culation cell within the depression. Other flowmodels, such asflow over steep-faced sand dunes, show similar circulationpatterns; however, the resolution of the field observations ob-tained in this study is insufficient to verify the correlationbetween pockmarks and dune flow structure. Future workshould include three-dimensional modeling of flow overpockmarks and model validation using more comprehensivefield observations that span the pockmark (if possible). Suchcoincident fine-resolution modeling and field observationswould lead to improved understanding of the primary andsecondary flow structures within these depressions, as wellas better relate pockmark flow circulation to that over cavities,sand dunes, or similar seafloor structures.
Acknowledgements Data obtained in this study are available at theCenter for Coastal and Ocean Mapping, University of New Hampshireunder the experiment name B2011 Belfast Bay Pockmark Experiment^. J.Kelley of the University of Maine provided the multibeam bathymetrymap from which candidate pockmarks were identified for further study.This work was based upon a model conceived by P. Koons at theUniversity of Maine and the many observations and interpretations madeby J. Kelley, D. Belknap (University of Maine), W. Barnhardt (USGS)and B. Andrews (USGS). Field assistance was provided by J. Irish, Capt.E. Terry, Capt. B. Smith, and J. Hunt. Comments by J. Irish, T. Karla, andthe anonymous reviewers greatly improved the manuscript. This researchwas supported by the National Oceanic and Atmospheric Administrationunder NOAA grant NA10NOS4000073. Any use of trade, firm, or prod-uct names is for descriptive purposes only and does not imply endorse-ment by the U.S. Government.
Compliance with ethical standards
Conflict of interest The authors declare that there is no conflict ofinterest with third parties.
Geo-Mar Lett
References
Ahuja K,Mendoza J (1995) Effects of cavity dimensions, boundary layer,and temperature on cavity noise with emphasis on benchmark datato validate computational aeroacoustic codes. NASA ContractorReport NASA CR 4653
Ashcroft G, Zhang X (2005) Vortical structures over rectangular cavitiesat low speed. Phys Fluids 17:1–8
Bennett SJ, Best JL (1995) Mean flow and turbulence structure overfixed, two-dimensional dunes: implications for sediment transportand bedform stability. Sedimentology 42:491–513
Brothers LL, Kelley JT, Belknap DF, Barnhardt WA, Koons PO (2011)Pockmarks: self-scouring seep features? In: Proc 7th Int Conf GasHydrates, 17–20 July, Edinburgh, UK
Fandel CL, Lippmann TC, Irish JD, Brothers LL (2016a) Observations ofpockmark flow structure in Belfast Bay, Maine, Part 1: current-induced mixing. Geo-Mar Lett, this volume. doi:
Fandel CL, Lippmann TC, Foster DL, Brothers LL (2016b) Observationsof pockmark flow structure in Belfast Bay, Maine, Part 3: implica-tions for sediment transport. Geo-Mar Lett, this volume. doi:
Hammer Ø, Webb KE, Depreiter D (2009) Numerical simulation of up-welling currents in pockmarks, and data from the Inner Oslofjord,Norway. Geo-Mar Lett 29:269–275
HovlandM, JuddAG (1988) Seabed pockmarks and seepages: Impact ongeology, biology, and the marine environment. Graham andTrotman, London
Kelley JT, Dickson SM, Belknap DF, Barnhardt WA, Henderson M(1994) Giant sea-bed pockmarks: evidence for gas escape fromBelfast Bay. Geology 22:59–62
Kilhams B, McArthur A, Huuse B, Ita E, Hartley A (2011) Enigmaticlarge-scale furrows of Miocene to Pliocene age from the centralNorth Sea: current-scoured pockmarks? Geo-Mar Lett 31:437–449
Kundu P, Cohen I (2008) Fluid mechanics, 4th edn. Elsevier AcademicPress, Burlington
Lefebvre A, Paarlberg AJ, Ernstsen VB, Winter C (2014a) Flow separa-tion and roughness lengths over large bedforms in a tidal environ-ment: a numerical investigation. Cont Shelf Res 91:57–69
Lefebvre A, Paarlberg A, Winter C (2014b) Flow separation and shearstress over angle of repose bedforms: a numerical investigation. JWater Resour Res 50:986–1005
Manley PL, Manley TO, Watzin MC, Gutierrez J (2004) Lakebed pock-marks in Burlington Bay, Lake Champlain: I. Hydrodynamics andimplications of origin. In: Manley TO, Manley PL, Mihuc TB (eds)Lake Champlain: Partnerships and research in the new millennium.Springer, Berlin, pp 299–330
Paarlberg AJ, Dohmen-Janssen CM, Hulscher SJMH, Termes P (2009)Modeling river dune evolution using a parameterization of flowseparation. J Geophys Res 114, F01014. doi:10.1029/2007JF000910
Pau M, Hammer O (2013) Sediment mapping and long-term monitoringof currents and sediment fluxes in pockmarks in the Oslofjord,Norway. Mar Geol 346:262–273
Pau M, Gisler G, Hammer Ø (2014) Experimental investigation of thehydrodynamics in pockmarks using particle tracking velocimetry.Geo-Mar Lett 34:11–19
Prandle D (1982) The vertical structure of tidal currents and other oscil-latory flows. Cont Shelf Res 1:191–207
Rockwell D, Naudascher E (1978) Review - self-sustaining oscillationsof flow past cavities. J Fluids Eng 100:152–165
Sarohia V (1977) Experimental investigation of oscillations in flows overshallow cavities. Am Inst Aero Astro J 15:984–991
Venditti JG, Bennett SJ (2000) Spectral analysis of turbulent flow andsuspended sediment transport over fixed dunes. J Geophys Res 015:22,035–22,047
Wildish DJ, Akagi HM, McKeown DL, Pohle GW (2008) Pockmarksinfluence benthic communities in Passamaquoddy Bay, Bay ofFundy, Canada. Mar Ecol Prog Ser 357:51–991
Xue H, Brooks D (2000) Characterization of fronts and eddies inPenobscot Bay using a three-dimensional ocean circulation model.Final Report presented to Island Institute, Rockland, ME
Geo-Mar Lett