observations of neutral beam and icrf tail ion losses due
TRANSCRIPT
1
PPPL-3160 - Preprint Date: April 1996, UC-420
Observations of Neutral Beam and ICRF Tail Ion Losses Due toAlfvén Modes in TFTR
D. S. Darrow, S. J. Zweben, Z. Chang, C. Z. Cheng, E. D. Fredrickson,E. Mazzucato, R. Nazikian, C. K. Phillips, S. Popovichev*, M. H. Redi,R. B. White, J. R. Wilson, and K.-L. Wong
Princeton University, Plasma Physics LaboratoryPrinceton, NJ 08543USA*Kurchatov Institute, Russian Research CenterMoscowRussia
Abstract
Fast ion losses resulting from MHD modes at the Alfvén frequency, such as the TAE, have been ob-served in TFTR. The modes have been driven both by neutral beam ions, at low BT, and by H-minorityICRF tail ions at higher BT. The measurements indicate that the loss rate varies linearly with the modeamplitude, and that the fast ion losses during the mode activity can be significant, e.g. up to 10% of theinput power is lost in the worst case.
I. Introduction
In a tokamak, knowledge of the rate of fast ion loss is of importance in determining the energy balanceof the discharge. Heating of the discharge may be diminished if losses are significant, since neutralbeam ions, ICRF heating tail ions, and alpha particles all heat the plasma and may all be lost throughprocesses which expel fast ions. In addition, a loss of fast ions which is sufficiently intense and local-ized may cause damage to plasma facing components in the vacuum vessel.[1] For these reasons,knowledge of the fast ion loss mechanisms is desirable.
Loss processes for fast ions in a tokamak fit into two broad categories: single particle and collective.Single particle losses are those, such as first orbit loss, which are independent of the number of fast ionspresent. These have been seen in numerous instances with various fast ions in TFTR and other toka-maks, and are reported elsewhere [2-7]. Collective losses arise when the fast ion density is sufficient todrive instabilities which then cause loss. The drive can come from ∂ff/∂ψ where ff is the fast ion distri-bution function) and ∂ff/∂E. Here E is the particle energy and ψ is the radial (poloidal flux) coordinate.Examples of collective instabilities include the toroidal Alfvén eigenmode (TAE), the kinetic balloon-ing mode (KBM), alpha driven sawteeth, alpha driven fishbones, Alfvén waves, and ion cyclotronwaves. This paper limits itself to the presentation of observations made during Alfvén frequency insta-bilities in TFTR which were excited under two conditions: at low field (1.5 T), with neutral beam ionsdriving the mode [8, 9], and at intermediate field (3.4 T), with the hydrogen minority ICRF tail ionsdriving the mode.[10]
2
The detectors used to measure the fast ion loss were the escaping alpha detectors, which are describedelsewhere [2-5, 11, 12]. These detectors act as magnetic spectrometers, dispersing fast ions onto ascintillator, depending upon their gyroradius and pitch angle. The detectors are located at 20°, 45°, 60°,and 90° below the outboard midplane. For the NBI driven mode, only the 20° probe could be utilized,since the 100 keV deuterons are screened from the other probes by a 3 µm thick aluminum foil over theentrance slit which stops particles with energies below ~400 keV; the 20° has no such foil. For theICRF tail ion driven TAE, the 20°, 45°, and 60° probes all showed measurable signals.
The TAE is a global mode in a tokamak. It is characterized by a single toroidal mode number, n (n≠0),and several poloidal mode numbers, m, which vary with minor radius. Its frequency is given approxi-mately by ω=vA/2qR, where vA is the Alfvén velocity. The mode is driven by the spatial gradient of thefast ion density, and in order for the mode to be unstable, the fast ion velocity must exceed vA (althoughthere is some sideband drive of the mode if vf>vA/3). In addition, the total drive must exceed the totaldamping. The experimental observations of the mode seen during ICRF heating match all the charac-teristics expected of a TAE, hence that name is used here to refer to that mode. The mode observedduring neutral beam injection matches most characteristics of the TAE, except that it appears to have atoroidal mode number of n=0. Hence, it is referred to here as an “Alfvén mode.”
Experiments on TAEs, motivated by the issues mentioned in the first paragraph, were first done withneutral beam plasmas in DIII-D [13-15] and TFTR.[8,9,16] Subsequent results have also come fromPBX-M[17], JT-60U[18-20], and JET.[21] The results from JT-60U and JET concentrate predomi-nantly on ICRF minority tail driven TAEs, although the JET work includes some on neutral beamdriven modes. Recent work on JET has included external excitation of the TAE by an antenna in orderto measure directly the damping of the mode.[22] The results from DIII-D indicated that neutral beamions were destabilizing TAEs with 2 ≤ n ≤ 10, causing up to 70% loss of the beam ions which, in turn,caused the beam ion beta to saturate. Losses were proportional to the TAE amplitude, and were largestnear the midplane. Neutral beam ion driven TAEs were observed in TFTR at low BT, with 2 ≤ n ≤ 4. Aloss of up to 50% loss of beam ions was inferred from the change in the neutron rate. In PBX-M, modesin the Alfvén frequency range were seen, localized near the q=1 surface, and having a ballooningcharacter. The loss of beam ions due to the mode was inferred from a drop in the neutron rate during themode. JT-60U reported TAEs driven by H-minority ICRF tail ions. The modes occurred with a thresh-old in power of ~3 MW, were localized near the q=1 surface, and had 4 ≤ n ≤ 12. The stored energy inthe tail ion population was observed to drop by 20% during the TAEs. In JET, TAEs with n ≤ 6 wereobserved during combined neutral beam injection and ICRF heating. The TAE appeared above ~5 MWof ICRF power, and resulted in a loss of beam ions which was linear with the mode amplitude.
Characteristics of the neutral beam driven Alfvén mode in TFTR and losses produced by it are pre-sented in Section II of this paper. Section III discusses some implications of these results. Section IVdescribes characteristics of losses from a TAE driven by H-minority ICRF tail ions, while Section Vdraws implications from those results and Section VI summarizes the paper.
II. Neutral Beam Ion Driven Alfvén Mode
The NBI driven Alfvén mode in TFTR appears only when the toroidal field is lowered sufficiently sothat the injected 100 keV beam deuterons satisfy vD~vA. Under these conditions, an instability is
3
observed on the Mirnov coils which has a frequency of approximately 120 kHz. The mode amplitudeincreases with increasing NBI power, and the mode vanishes entirely when BT is raised [8, 9]. Like-wise, the frequency scales with density and toroidal field according to the formula for the frequencystated above. Typical parameters for these plasmas are: 1 T ≤BT≤ 2 T, 300 kA ≤Ip≤ 700 kA, ne=3×10¹⁹
m-3, R=2.40 m, a=0.75 m, βfast~0.5%, and ⟨β⟩~1%. For these shots, the aperture of the 20° probe waslocated between R=3.41 m (0.32 m from the plasma edge) and R=3.51 m (0.42 m from the plasmaedge), with it most often being placed at R=3.46 m (0.37 m from the plasma edge). The limiter radiusat the angular location of the probe is R=3.525 m.
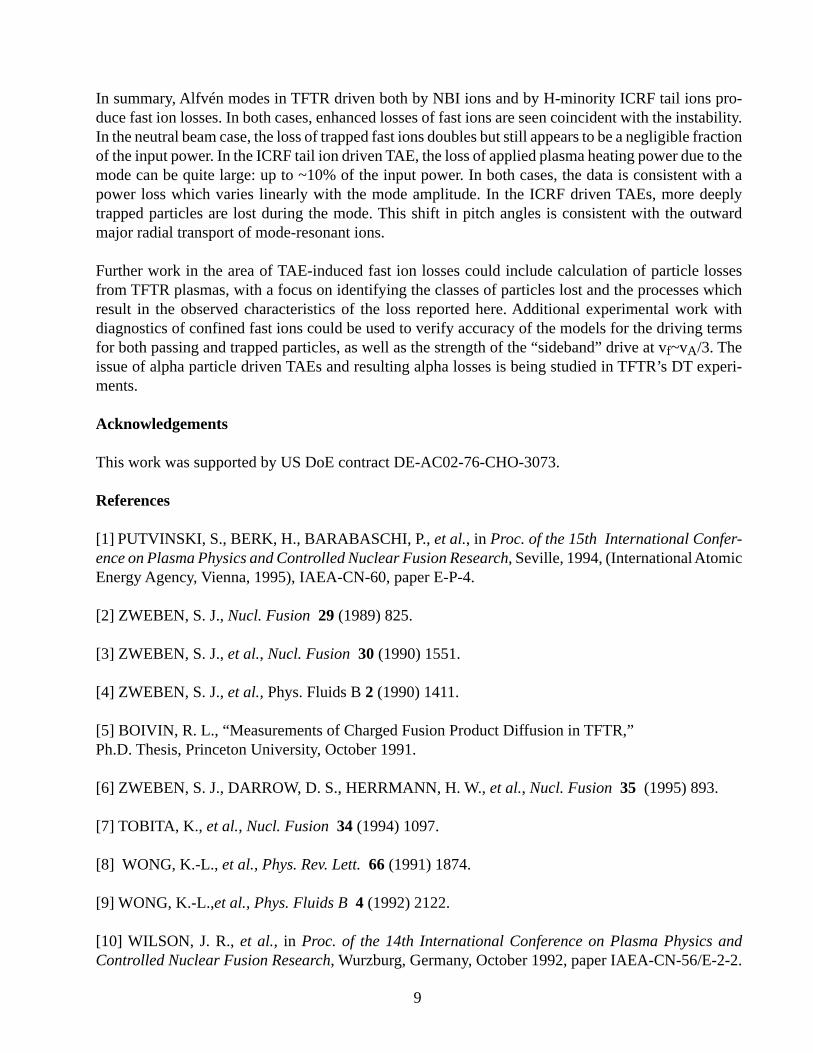
Figure 1 shows the time histories of a Mirnov coil signal, the neutron rate, and the rate of neutral beamion loss to the 20° escaping alpha detector.[16] The bursts in the Mirnov signal are caused by theAlfvén mode. During each burst, the beam ion loss rate increases. The neutron rate is seen to drop afterthe larger bursts, indicating an expulsion of beam ions. The time delay between the peak of the Mirnovsignal and the peak of the beam ion loss is about 0.5 msec. This interval corresponds to several tens ofbounce times for the trapped beam ions, and indicates that the loss mechanism requires numeroustransits of the particle through the mode in order to cause expulsion. In this discharge, the bursts occurat a regular interval and result in approximately equal losses. There is a baseline loss rate to which thesignal returns in between the bursts. This baseline loss is of trapped beam ions (see below) and prob-ably results from the few percent of beam neutrals which ionize at a sufficiently large minor radius tobe born onto trapped orbits.
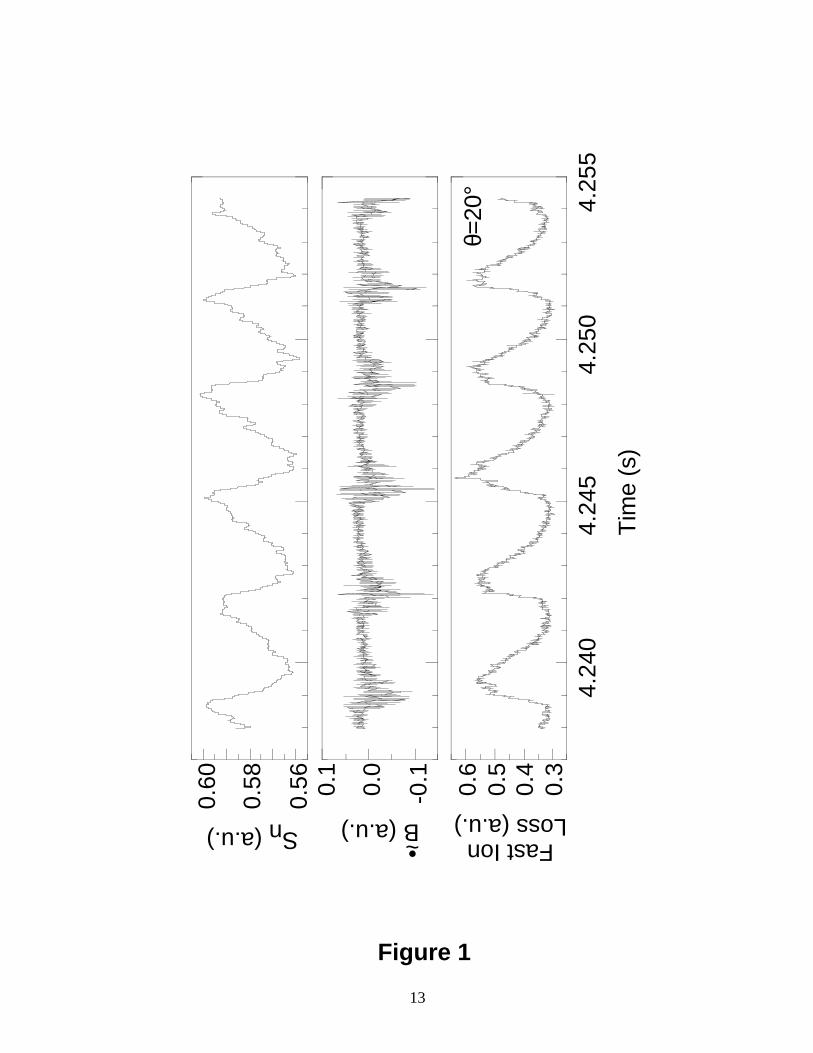
Figure 2 compares the frequency spectrum of the Mirnov signal during a burst to the spectrum betweenbursts. Though the spectrum during a burst is rather broad, it is centered around 120 kHz, which isconsistent with the expected Alfvén frequency for this plasma. During the Alfvén mode burst, there isalso enhanced MHD activity at 25 kHz, and some at ~6 kHz. The 6 kHz mode is observed in some shotsto persist between the bursts, and therefore seems unlikely to be the cause of the bursting losses seen.This low frequency mode exists principally near the center of the plasma, and appears to have modenumbers n=1 and m=1. Both the 25 kHz and 120 kHz modes have n=0 according to the Mirnov coilarray. The Alfvén mode has a poloidal mode number of m=1. By way of comparison, TAEs with 4 ≤ n≤ 8 have been observed in TFTR under conditions very similar to these, as described in Refs. 8 and 9.In DIII-D, neutral beam driven TAEs were frequently accompanied by simultaneous fishbone modes ata lower frequency.[13]
Figure 3 depicts the characteristics of a group of bursts taken from 12 nominally identical shots. InFigure 3a, the amplitude of the drop in neutron rate at each burst, defined in the same way as in Ref. 13,is plotted against the time-integral of the Mirnov amplitude. The integrated Mirnov amplitude is com-puted by high pass filtering the digitized Mirnov data with a cutoff of 62 kHz, then computing its rmsamplitude. Following that, the background level of turbulent magnetic fluctuations is subtracted, andthe remainder is integrated over the duration of the burst.
Several possible relationships between the loss and the mode amplitude have been predicted by theo-ries, depending upon the particular conditions of the instability and the fast ion velocity space. Thepredictions are that the loss will vary as δB0.5, δB, or δB2.[23] Taking the drop in the global neutronrate as a measure of the loss of beam ions, functions of all three forms were least-squares fitted to thedata shown in Fig. 3a. The results were correlation coefficients of 0.637, 0.692, and 0.163 respectively.A linear relationship between the drop in the neutron rate and the time integral of the mode amplitudeis therefore most consistent with the data. A similar result is obtained in Sec. IV below for ICRF tail ion

4
driven TAE modes.
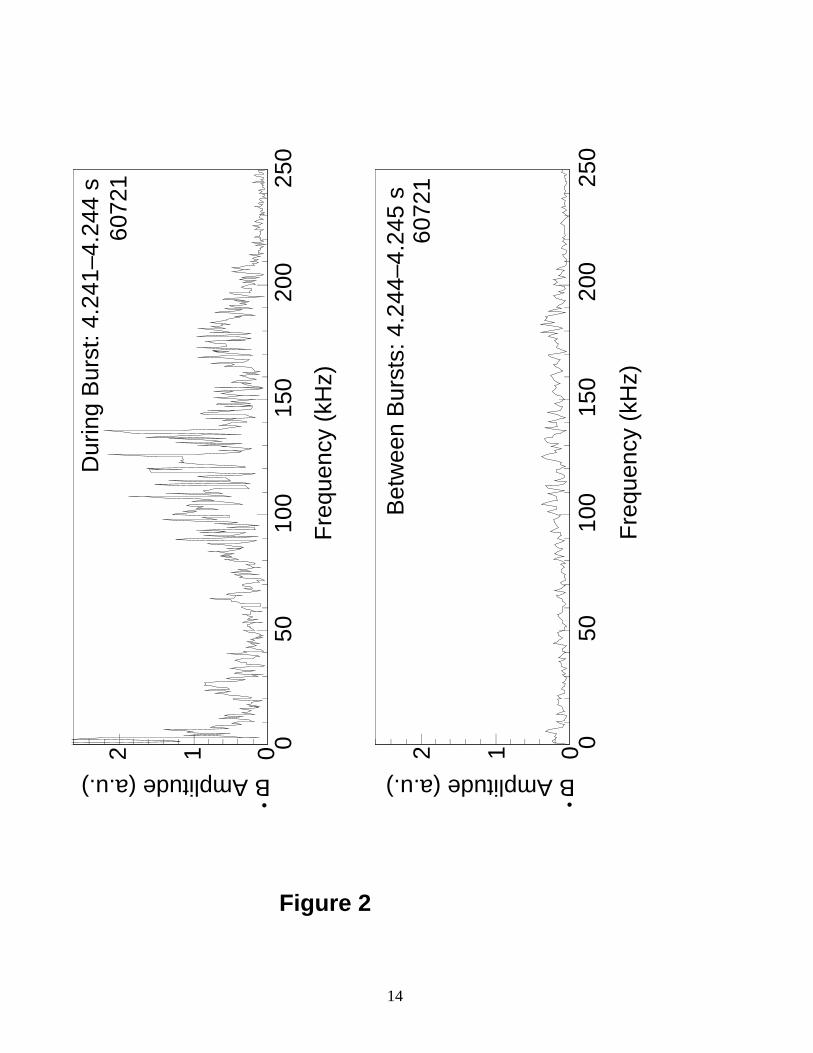
Figure 3b shows the time-integrated loss per burst to the midplane probe, again plotted against thetime-integrated Mirnov amplitude. Least squares fitting of the functional forms noted above was alsoapplied to this data, resulting in correlation coefficients of 0.513, 0.648, and 0.702 respectively forvariation as the square root, first power, and square of the mode amplitude. If one instead assumes thatthe data should be represented by a linear form with an offset, the correlation coefficient is 0.709.While the drop in the neutron rate scaled linearly with mode amplitude, the actual losses to the 20°probe are best represented as varying with the square of the mode amplitude or as varying linearly withmode amplitude above some threshold.
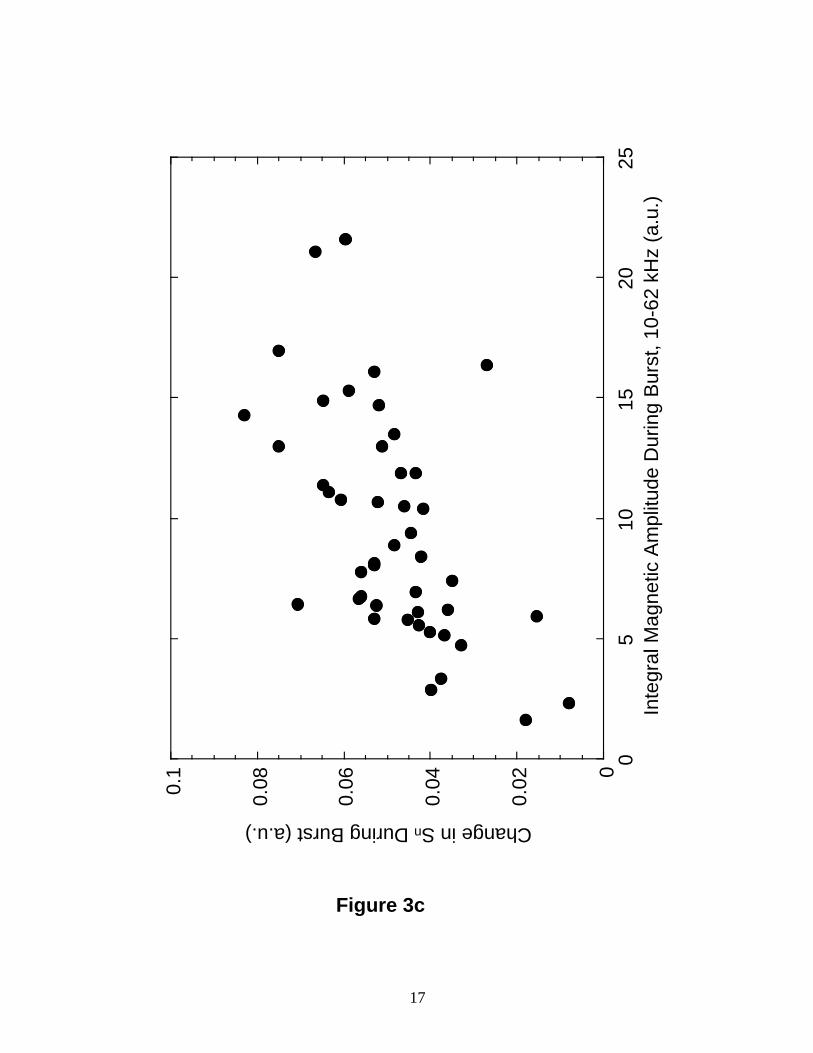
While it is possible that the losses result from the 25 kHz mode, and not from the Alfvén mode, theexisting data contradicts that interpretation. Figure 3c displays the drop in the neutron rate, plottedversus the integrated amplitude of magnetic fluctuations with 10 kHz ≤ f ≤ 62.5 kHz. The distributionis more scattered than that shown in Fig. 3a, and the correlation coefficients are significantly lowerthan those obtained when the 120 kHz mode amplitude is used. Hence, the Alfvén mode seems to havethe dominant role in driving the losses.
The pitch angle distribution during the bursts does not change significantly from the distribution be-tween bursts. Figure 4a compares the pitch angle distributions of the losses during and between thebursts. In this and all the figures in this paper, the pitch angles quoted are with respect to the toroidalfield. Hence, the pitch angle, χ, is defined as χ=arccos(vΤ/v). In this figure, the amplitude of the distri-bution during the Alfvén mode burst is normalized to the amplitude of the distribution between thebursts to facilitate comparison. The pitch angle of the loss both during and between the bursts is similar.In this particular case, the loss shifts to higher pitch angles i.e. more deeply trapped particles during theburst, but this is not uniformly the case. During some bursts in the same shot, the loss is at lower pitchangles. In this case, the loss peaks at a pitch angle of 64°, well into the trapped region of phase space.The pitch angle of the passing/trapped boundary is 47° at the 20° probe for these plasma conditions andparticle energies. The typical shape of these orbits is depicted in Fig. 5.
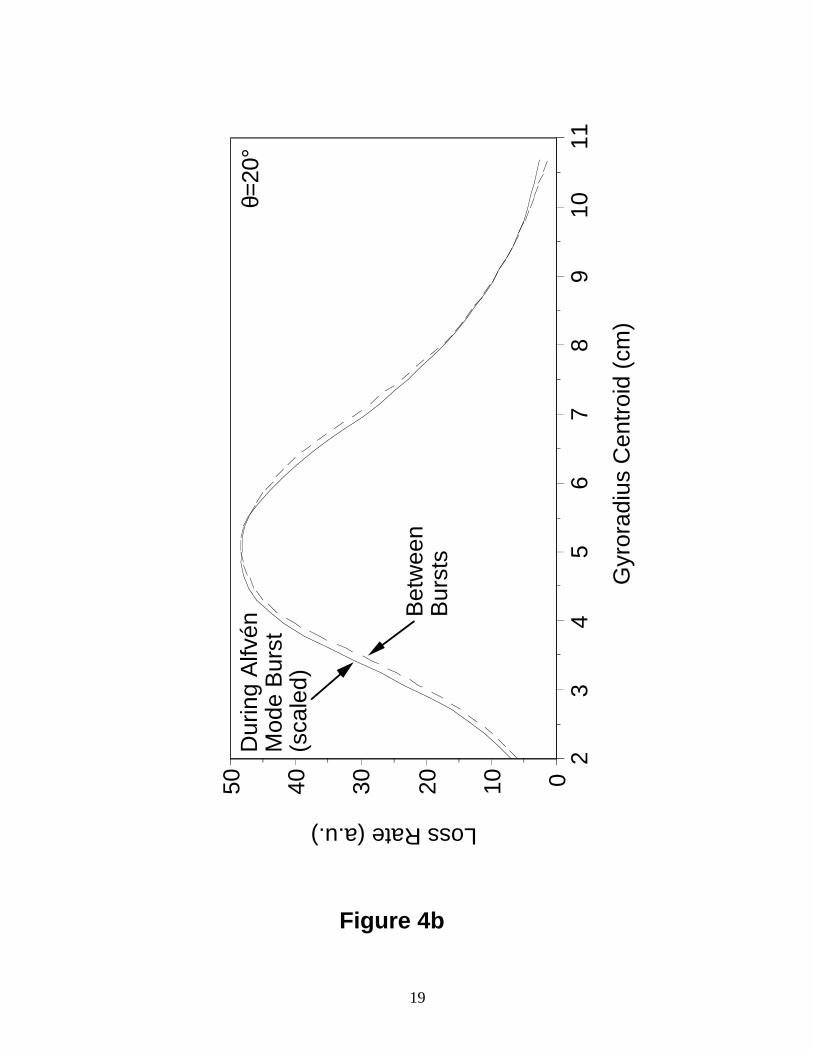
The gyroradius distribution during the bursts does not change significantly from the distribution be-tween bursts. Figure 4b displays the gyroradius distributions (again normalized to the same amplitude)of the losses during and between bursts. For the burst chosen, the same one as in Fig. 4a, the particleslost during the burst are at slightly lower gyroradii . During other bursts, however, the gyroradiusdistribution does not change at all from that between the bursts. The gyroradius seen is that expectedfor birth-energy (100 keV) deuterons.
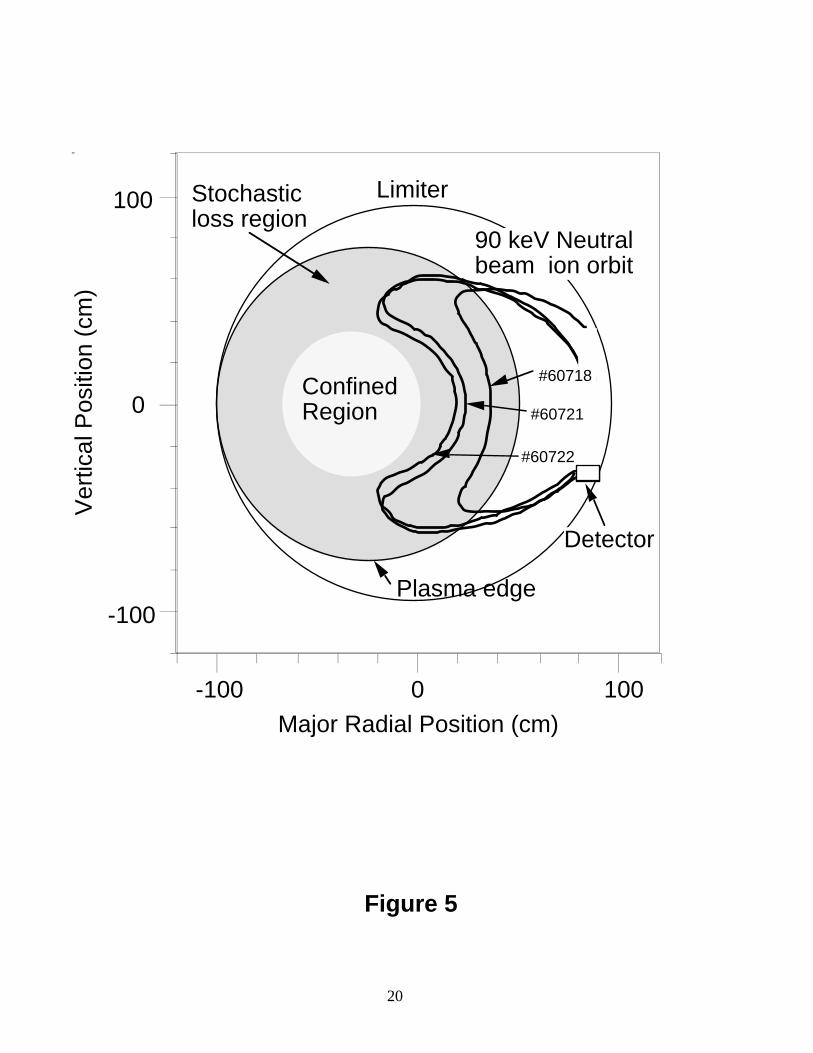
The orbits of the particles lost lie in the stochastic ripple loss region. This is shown in Fig. 5, whichdepicts several orbits computed from the observed pitch angles and energies at the detector. These arefor a 420 kA, 1.4 T plasma. Also shown in the figure is the stochastic toroidal field ripple diffusiondomain for 95 keV deuterons.[24] Any beam ion with banana tips in this domain is subject to stochas-tic ripple diffusion, which will eventually result in its loss to the wall near the midplane. As shown inthis figure, the orbits of the lost particles detected at several probe locations are all subject to stochasticripple diffusion. Since essentially the same pitch angles are observed in the absence of the mode, thepitch angle data and this plot indicate that the losses in the absence of the mode can be attributed tostochastic ripple diffusion. The fact that additional loss driven by the mode appears at the same pitchangle suggests that the mode-driven loss may result from a two-step process in which the mode moves

5
beam ions outward in minor radius until the particles are in the stochastic ripple domain. Then, theripple diffusion carries these particles out of the plasma. Since the ripple diffusion can take manybounces before the particle is ejected, this conjecture would be consistent with the observed time delaybetween the peak of the mode amplitude and the peak of the loss. Likewise, it would explain the fact,depicted in Fig. 1, that the losses persist for some time after the mode has vanished. It is also possiblethat stochastic diffusion can occur as the beam ions encounter an effective ripple in the field due to themagnetic fields of the mode itself (rather than due to the discreteness of the toroidal field coils). Sucha process would not explain, however, the persistence of the loss after the mode has vanished.
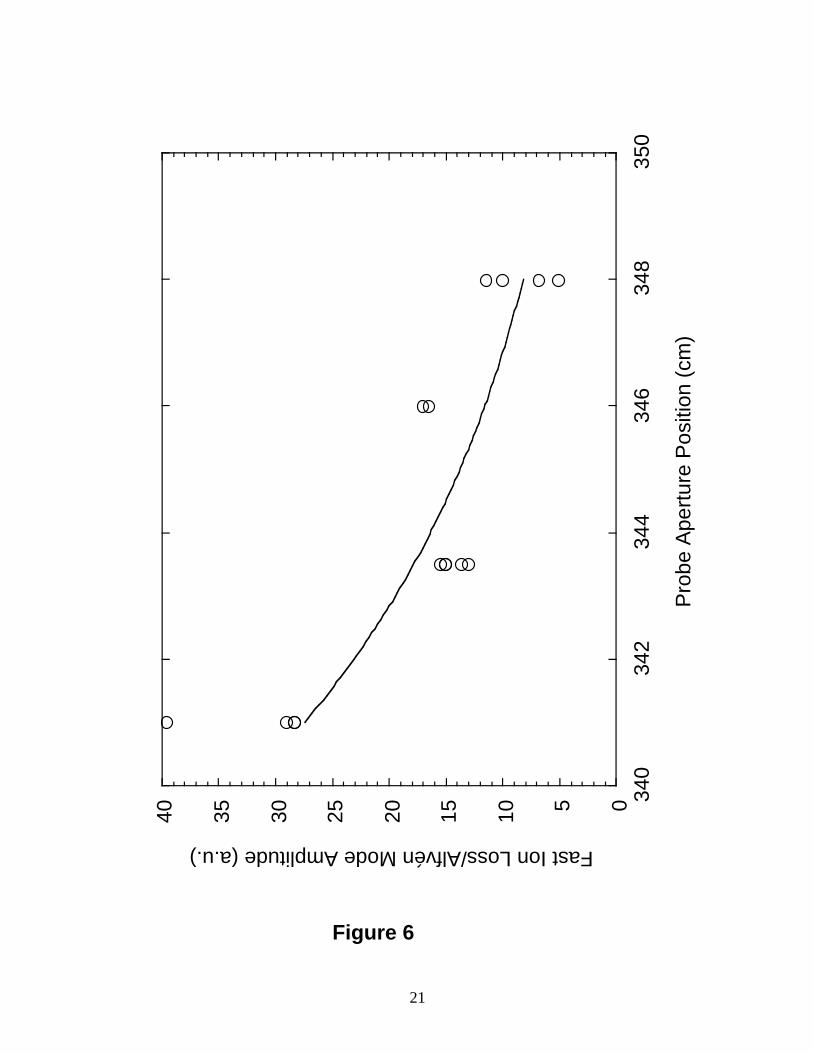
Figure 6 shows the total loss to the probe versus position. The loss increases as the probe moves fartherinward away from the limiter, which is at R=3.525 m. If the decay of the signal with increasing distancefrom the plasma is fitted to an exponential function, the result is an e-folding distance of ~6 cm.
Figure 7 depicts the peak pitch angle and the observed energy of the lost deuterons as a function ofprobe position. The peak pitch angle varies by ~5.5° over the 7 cm which the probe is scanned. Theapparent energy varies from about 65 keV to 100 keV, depending upon position. The observed decreasein energy as the probe moves away from the plasma may be due to the TAE extracting more energyfrom the beam ions as they move outward. Collisional slowing down proceeds too slowly to accountfor this reduction of energy, since the losses at all positions show the same time scales as are depictedin Fig. 1.
III. Discussion of NBI Loss Results
The regular bursting behavior depicted in Fig. 1 is consistent with a cyclical process of increasing thepopulation of fast ions up to a point above the instability threshold, whereupon the instability sets in,ejects the fast ions, and falls below threshold.[25]
Due to their relatively low density, the neutron production in the discharges considered here is pre-dominantly (80% according to the SNAP transport code) from reactions of beam ions with other beamions, i.e. Sn∝nf2. In contrast, the neutron production in the DIII-D experiments is computed to bedominantly from beam-plasma reactions.[13] Each individual burst of the TAE produces a reduction inthe neutron rate of between 5% and 10%, so the change in beam ion density can be treated perturbatively:Sn∝nf2 =nf02(1–δnf/nf0)2. (This zero-dimensional model ignores the radial dependence of the fast iondensity.) The result is that the change in the neutron rate, to lowest order, is linear in the change in thebeam ion density: δSn∝–2nf0δnf . This means, then, that the change in neutron rate, the vertical axis inFig. 3a, can be regarded as directly proportional to the change in the beam ion density, i.e. the amountof loss. Thus, the fact that a straight line best fits the data in Fig. 3a implies that the fast ion loss islinearly proportional to the TAE amplitude.
Although the neutron data implies that the fast ion loss is linearly proportional to the mode amplitude,the direct measurements of loss from the 20° probe seem best fit by the square of the mode amplitude.This discrepancy may be resolved if one assumes that there is a threshold in mode amplitude belowwhich particles are not transported to the edge of the plasma. This assumption can be made plausible byrecalling that the neutron rate can be diminished simply by moving beam ions farther outward in minorradius, where they are less reactive, whereas particles must be moved all the way to the edge beforethey can be seen by the 20° probe. If the losses are attributable to stochastic ripple diffusion, this onsetthreshold may represent the point at which beam ions are transported into the stochastic ripple domain.
6
If one accepts this view, then a consistent interpretation of both loss measurements is that the magni-tude of the beam ion loss scales linearly with mode amplitude. A similar linear dependence of fast ionloss on mode amplitude has been observed in JET as well.[21]
It is possible to cross-calibrate the 20° detector from the 90° detector under other quiescent dischargeconditions where fusion product loss dominates.[5] Assuming the Scintillator response is linear withthe fast ion power incident upon it, that calibration can be used for neutral beam losses as well. For atypical discharge with a bursting frequency as shown in Fig. 1, the TAE bursts result in losses to thewall of ~0.06 W/cm2. Knowing that these losses result from stochastic toroidal field ripple diffusion,the total loss can be crudely estimated by assuming this loss rate holds between 0° and 30° below theoutboard midplane, and is axisymmetric. The result is that total losses are estimated to be ~6 kW, or~0.06% of the injected power of 10 MW. This result is not consistent with the change in the neutronrate produced by the bursts, which indicate ~10% beam ion loss. There are several assumptions used inthese estimates, that may be erroneous. First, the loss rate inferred from the change in the neutron rateassumes that the particles have actually been lost from the plasma, when they may only have beendisplaced to some region where they produce fewer neutrons. Second, the loss rate inferred from theprobe is based on an assumption about the poloidal distribution of the loss, which may be quite differ-ent from the actual distribution. Finally, the probe used cannot detect particles with pitch angles below40°, which may lead to an underestimate of the losses if particles in this pitch angle range are lost inquantity. In fact, most of the beam ions in the plasma do lie below this cutoff in pitch angle. Measure-ments in DIII-D indicate much higher beam ion loss powers than this power inferred from the probemeasurement.[13]
IV. H-minority ICRF Tail Driven TAE
Another condition in TFTR in which TAEs can be driven is during H-minority ICRF heating [10,26].In such plasmas, the tail ions can exceed the Alfvén velocity and drive TAEs. Typical plasma param-eters are: BT = 3.4 T, 1.3 MA ≤ Ip ≤ 1.8 MA, R = 2.62 m, a = 0.98 m, 4He or D plasmas, ⟨ne⟩ = 2.5×10¹⁹
m-3, 3 MW ≤ PICRF ≤ 11 MW, Ttail = 300-600 keV (vtail~vA~1×10⁷ m/sec), ⟨β⟩ = 0.3%, and ⟨βfast⟩= 0.03%.
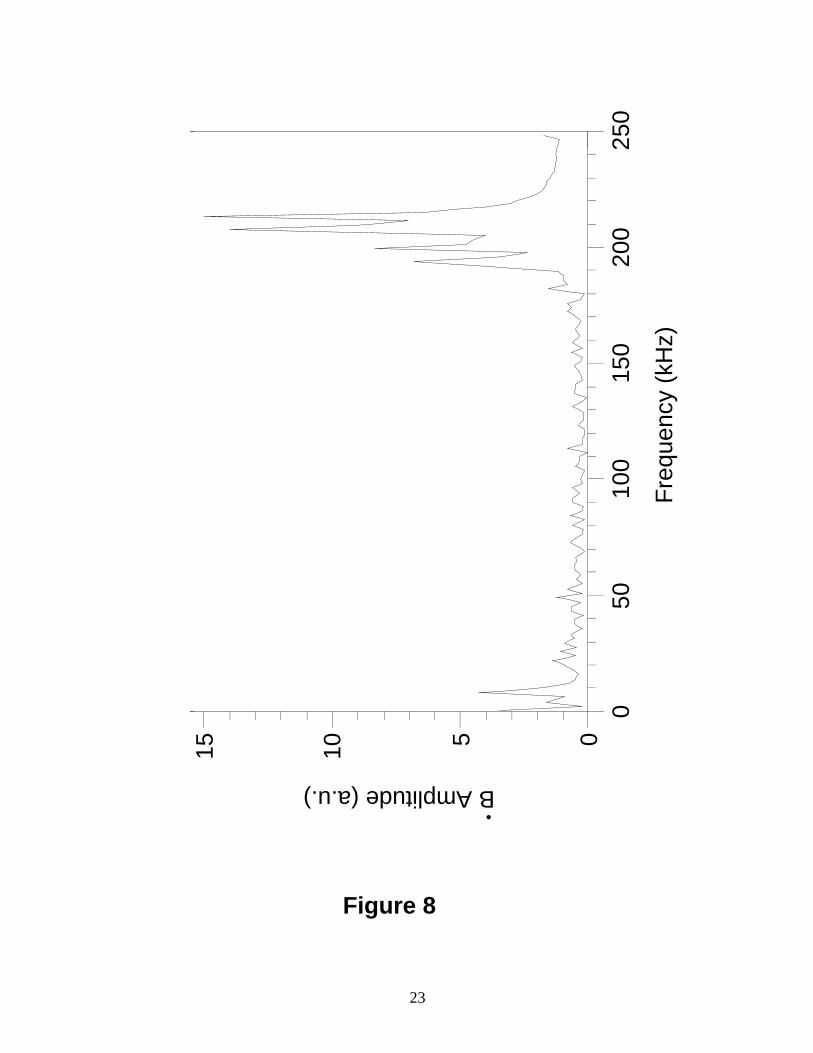
Under these conditions, the TAE appears as a magnetic fluctuation at a frequency between 170 and 250kHz, with 4 ≤ n ≤ 10. Figure 8 shows a typical frequency spectrum for such a mode, which oftenincludes several modes very closely spaced in frequency. The mode is also seen with the microwavereflectometer [10] and it appears only when the ICRF power exceeds 3 MW (equivalently, when thefast ion tail stored energy exceeds 70 kJ). The mode frequency scales inversely with the square root ofplasma density, in agreement with the equation for the Alfvén frequency. Its scaling with magneticfield cannot be checked convincingly since changing BT also alters the ICRF resonance location. Simi-lar behaviors of mode onset and frequency scaling have also been observed during minority ICRFheating in JET and JT-60U.[18-21]
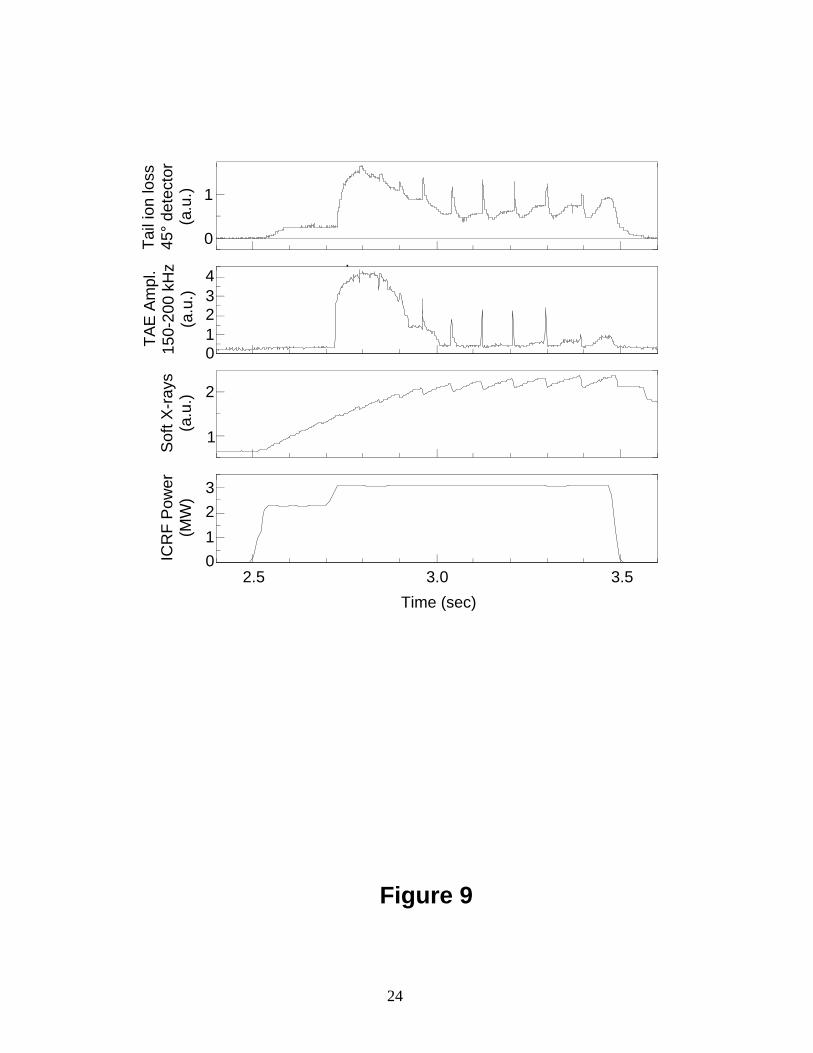
H-minority tail ion losses result from the TAE. These are most easily measured by the 45° and 60°probes which are in fixed locations, have apertures closer to the plasma than the 20° probe, and arebetter protected from the plasma heat flux than is the 20° probe. Figure 9 displays the time history of aTAE driven by the H-minority tail ions. The top trace depicts the total fast ion loss to the 45° escapingalpha probe versus time. The second trace is the mode amplitude. When the mode appears, the fast ionloss is seen to increase suddenly and substantially. As time progresses, the mode amplitude diminishes,

7
as do the fast ion losses. This, presumably, is due to some evolution of the tail ion distribution. A similarbehavior is seen in JET.[21] At the sawtooth crashes (seen in the third trace) the mode momentarilyturns on again, and the losses increase correspondingly. This, it is postulated, is due to a rearrangementof the fast ion profile. This figure also shows the turn-on threshold of 3 MW. The tail ions which arelost are trapped ions whose energies lie in the range 0.5 to 1 MeV, based upon the gyroradii detected.The lower end of this range, 0.5 MeV, corresponds to protons whose velocities are approximately equalto the Alfvén velocity, as noted above.
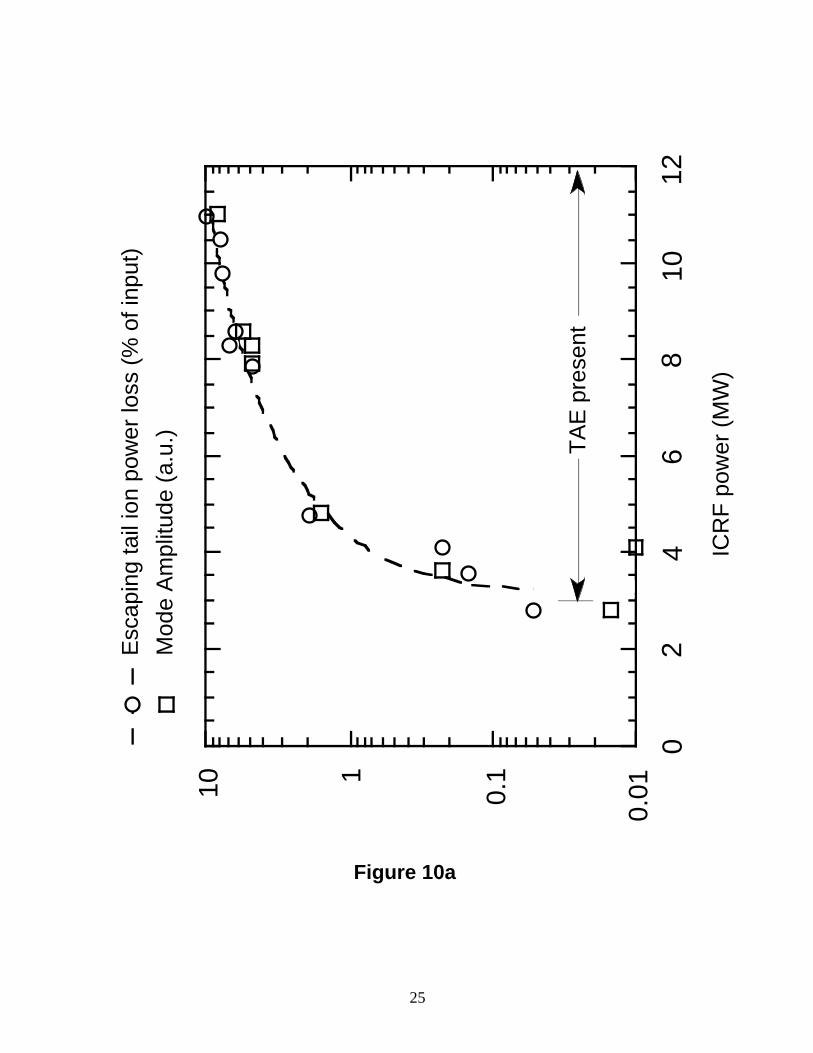
Figure 10(a) depicts the mode amplitude, as determined from the Mirnov coils, and the escaping tailion loss power as functions of the applied ICRF power. Both quantities increase approximately linearlywith the applied ICRF power (more easily seen in Fig. 10(b)). The escaping tail ion loss power isestimated assuming that the poloidal distribution of the losses is the same as that of first orbit loss. Thisassumption is known to be incorrect, since tail ion losses at the 90° detector position are negligible,while first orbit loss there is not. However, it does provide the best existing absolute calibration of the45° detector. Comparison of the fast ion loss signal in the 45° detector during the TAEs to the DDfusion product loss signal during an ordinary neutral beam heated shot yields an absolute magnitudefor the losses produced by the TAE. Because of the number of assumptions in this process, the uncer-tainties in the power loss quoted in Fig. 10(a) are accurate only to within an order of magnitude. In spiteof this uncertainty, it is apparent that a significant amount of power is lost in ICRF tail ions when theTAE amplitude is large. In the worst case shown, with 11 MW of applied ICRF power, an estimated 1MW is lost due to escaping tail ions.
This substantial loss may help explain two other experimental observations. First, it is seen that theenergy stored in fast ions does not increase with ICRF power for powers above 5 MW in 4He majorityplasmas.[26] It may be that part or all of this additional input power is rapidly lost to the walls in tailions (the accuracy of the measurements described above does not preclude the possibility that all theadditional input power above 5 MW is lost in escaping tail ions). Secondly, some in-vessel componentsin TFTR which lie ~10 cm in the shadow of the limiters have been melted or damaged due to excessiveheating. This damage is concentrated near the midplane and corresponds to where most of the tail ionsshould be lost due to the TAE, as described below.
Figure 10(b) depicts the same data as in 10(a), but plotted as power loss versus mode amplitude. Therelationship between the two quantities is best fit by a straight line. This is consistent with the relation-ship between mode amplitude and losses seen in the NBI-driven case described above. This linearity isagain in agreement with reported JET results.[21]
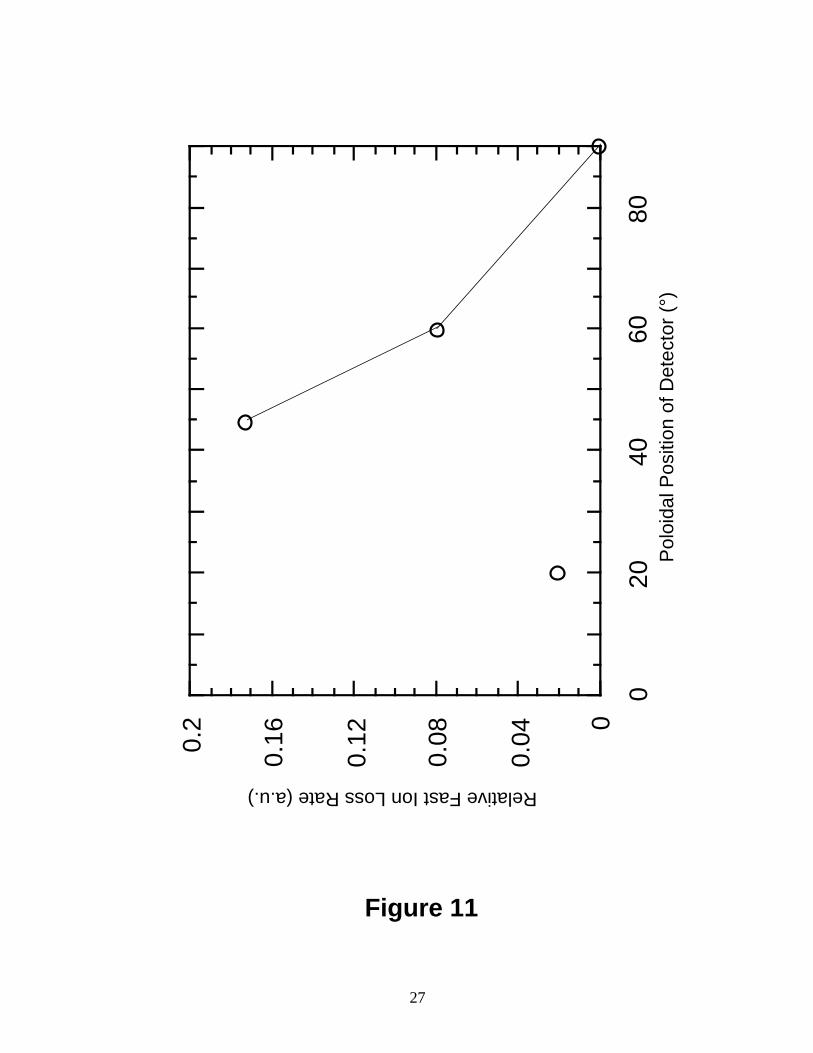
Based upon the data from the 90°, 60°, and 45° detectors, the loss of tail ions increases toward themidplane. Unfortunately, the 20° detector is of a different geometry than the others, with its aperture 3cm back from the probe tip, rather than 1 cm for the others. This difference makes it difficult to com-pare the fluxes in each probe directly. The loss versus poloidal position of the probes is plotted in Fig.11, and shows this trend of losses increasing rapidly toward the midplane. This poloidal distribution isconsistent with a loss process which causes a finite-sized radial step within one bounce time.
Figure 12 shows the orbits of particles which enter the 20°, 45°, and 60° detectors with and without theTAE (the 90° detector sees a negligible signal). The ICRF resonance layer is shown as a vertical dashedline in each figure. In the cases of the 45° and 60° detectors, it can be seen that the TAE causes the pitchangle of the observed loss to increase—i.e. more deeply trapped particles are lost. This was also some-times observed to be the case with the NBI driven Alfvén modes (see Fig. 4(a)). For the 20° detector,

8
the loss in the absence of the TAE was too small to detect, hence no orbit is plotted for that case.However, during the TAE, a significant loss is seen, with a typical orbit as depicted in Fig. 12(c). Theintriguing feature of this data is that particles which must have originated at the ICRF resonance layernow occupy orbits which are far removed from that region. From the distance the orbit has been dis-placed radially from the H cyclotron layer in Fig. 12(c), about 0.8 m, and the knowledge that thismotion occurs in less than a fast ion slowing down time, which is ~200 ms, it is possible to infer a lowerbound on the spatial diffusion coefficient for these ions. That lower bound is ~3 m2/s, considerablylarger than spatial diffusion coefficients for fast ions observed in quiescent plasmas, which are typi-cally of the order of 0.1 m2/s.[27]
Figure 13 displays the peak pitch angle of the tail ion loss during the TAE as a function of the plasmacurrent. For both the 45° and 60° detectors, the peak pitch angle diminishes as the plasma currentincreases. This may indicate something about the nature of the loss, but is also consistent with fact thatthe banana widths will be reduced as the plasma current increases, so that a particle will have to have alower pitch angle to reach the detector position. The peak pitch angle observed in the 20° detector doesnot change over the range observed.
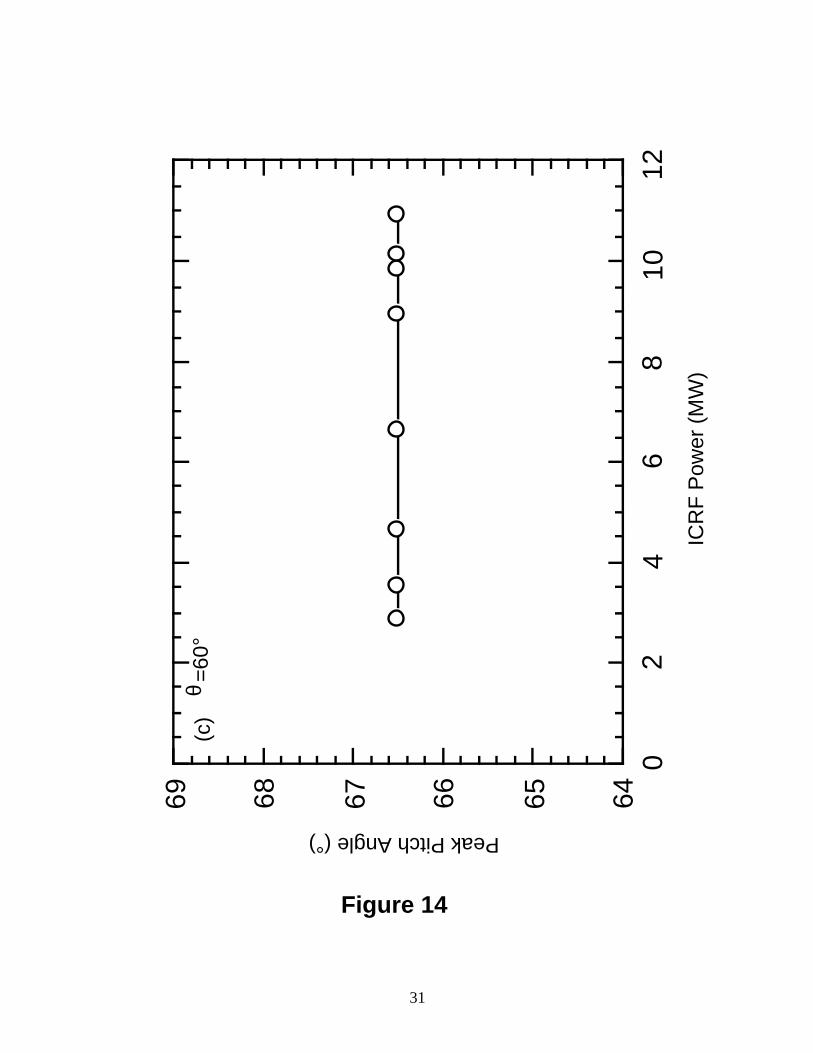
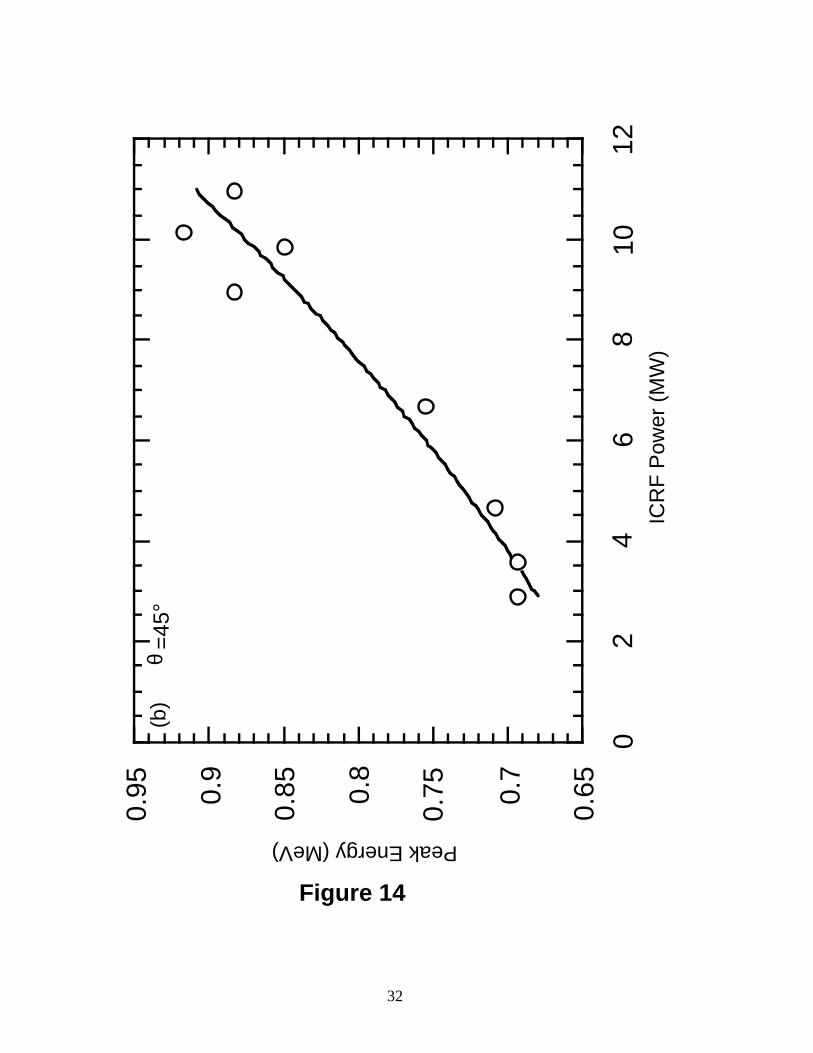
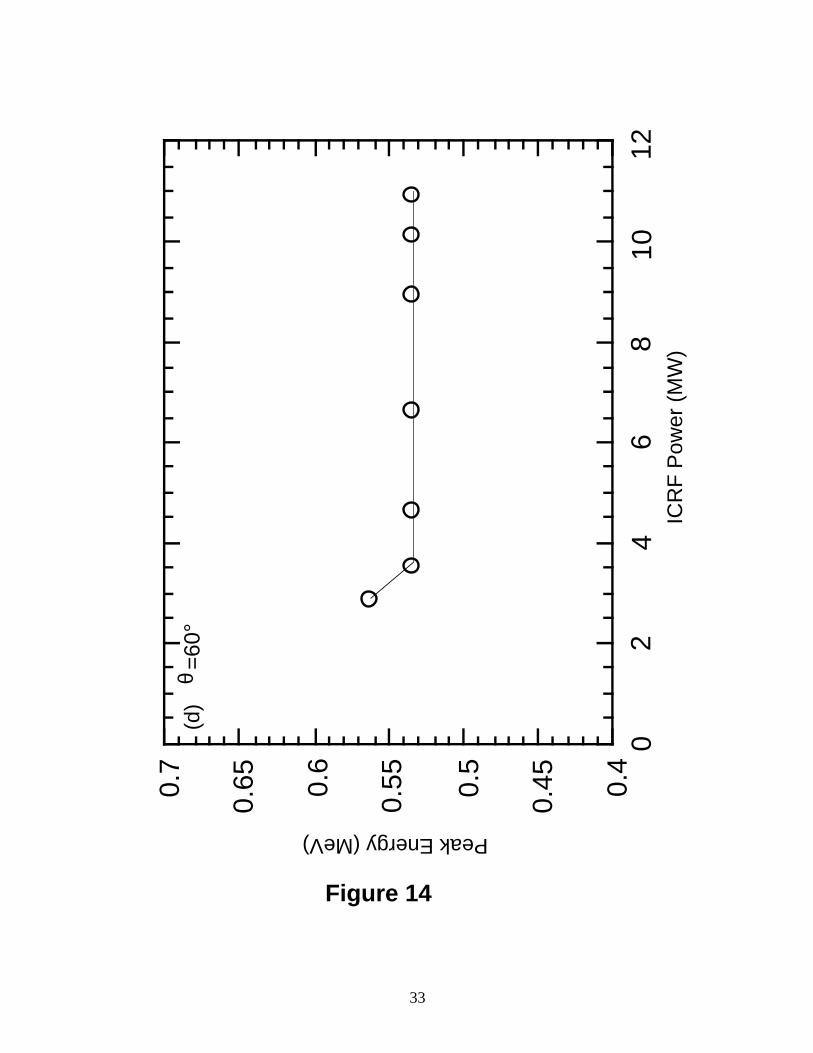
Finally, Fig. 14 indicates the variation with applied ICRF power of the peak pitch angles and energiesobserved in the 45° and 60° detectors. The two detectors display contrasting behaviors: in the 45°detector, the peak energy and the peak pitch angle of the particle losses are both observed to increase asthe ICRF power is increased. However, the data from the 60° detector reveals a constant pitch angleand energy over the entire range of ICRF power. It is unclear why the data from these two detectors,which otherwise tend to express similar trends, are so different in this instance.
V. Discussion of H-minority ICRF Results
The linear relationship between the TAE amplitude and loss rate suggests that the loss is due to aprocess which is convective in nature, rather than diffusive. Observations from the DIII-D tokamakalso indicate a linear relationship between TAE amplitude and particle loss rate [13-15]. Computa-tional models of alpha loss from CIT[23] predict loss of a convective character at first, followed by lossof a diffusive nature (loss rate quadratic in mode amplitude) as the most easily lost particles are de-pleted. This computation may not apply well to this experiment since the parameters used differ sig-nificantly from those in the experiment. In particular, the present experiments do not contain an isotro-pic distribution of fast ions, but one which is dominated by trapped ions. In addition, in the experiment,there is a continual source of new fast ions accelerated by the ICRF waves, while in the simulationthere is a population which is depleted and not replenished with time.
A loss mechanism which is consistent with the observation that more deeply trapped tail ions are lostduring the TAE is this: the TAE causes transport of resonant fast ions outward in major radius. Sincethe bounce frequency of the particles is roughly equal to the TAE frequency, this is possible. The 20°detector data seems especially to support this interpretation, since the tail ions appear radially outwardfrom where they are created, and are moved a substantial distance (several banana widths) to the detec-tor within a fraction of a slowing down time. Such a mechanism might also explain the observed linearrelationship between loss rate and mode amplitude. A similar mechanism was previously found to beresponsible for the expulsion of neutral beam ions during fishbone oscillations [28].
VI. Summary
9
In summary, Alfvén modes in TFTR driven both by NBI ions and by H-minority ICRF tail ions pro-duce fast ion losses. In both cases, enhanced losses of fast ions are seen coincident with the instability.In the neutral beam case, the loss of trapped fast ions doubles but still appears to be a negligible fractionof the input power. In the ICRF tail ion driven TAE, the loss of applied plasma heating power due to themode can be quite large: up to ~10% of the input power. In both cases, the data is consistent with apower loss which varies linearly with the mode amplitude. In the ICRF driven TAEs, more deeplytrapped particles are lost during the mode. This shift in pitch angles is consistent with the outwardmajor radial transport of mode-resonant ions.
Further work in the area of TAE-induced fast ion losses could include calculation of particle lossesfrom TFTR plasmas, with a focus on identifying the classes of particles lost and the processes whichresult in the observed characteristics of the loss reported here. Additional experimental work withdiagnostics of confined fast ions could be used to verify accuracy of the models for the driving termsfor both passing and trapped particles, as well as the strength of the “sideband” drive at vf~vA/3. Theissue of alpha particle driven TAEs and resulting alpha losses is being studied in TFTR’s DT experi-ments.
Acknowledgements
This work was supported by US DoE contract DE-AC02-76-CHO-3073.
References
[1] PUTVINSKI, S., BERK, H., BARABASCHI, P., et al., in Proc. of the 15th International Confer-ence on Plasma Physics and Controlled Nuclear Fusion Research, Seville, 1994, (International AtomicEnergy Agency, Vienna, 1995), IAEA-CN-60, paper E-P-4.
[2] ZWEBEN, S. J., Nucl. Fusion 29 (1989) 825.
[3] ZWEBEN, S. J., et al., Nucl. Fusion 30 (1990) 1551.
[4] ZWEBEN, S. J., et al., Phys. Fluids B 2 (1990) 1411.
[5] BOIVIN, R. L., “Measurements of Charged Fusion Product Diffusion in TFTR,”Ph.D. Thesis, Princeton University, October 1991.
[6] ZWEBEN, S. J., DARROW, D. S., HERRMANN, H. W., et al., Nucl. Fusion 35 (1995) 893.
[7] TOBITA, K., et al., Nucl. Fusion 34 (1994) 1097.
[8] WONG, K.-L., et al., Phys. Rev. Lett. 66 (1991) 1874.
[9] WONG, K.-L.,et al., Phys. Fluids B 4 (1992) 2122.
[10] WILSON, J. R., et al., in Proc. of the 14th International Conference on Plasma Physics andControlled Nuclear Fusion Research, Wurzburg, Germany, October 1992, paper IAEA-CN-56/E-2-2.

10
J. Y. Park and S. Z. Zweben, Princeton Plasma Physics Laboratory Report number PPPL-2971 (1994).
[11] BOIVIN, R. L., KILPATRICK, S., MANOS, D., and ZWEBEN, S. J., Rev. Sci. Instrum. 61 (1990)3208.
[12] DARROW, D. S., HERRMANN, H. W., JOHNSON, D. W., et al., Rev. Sci. Instrum. 66 (1995)476.
[13] DUONG, H., HEIDBRINK, W. W., STRAIT, E. J., et al., Nucl. Fusion 33 (1993) 749.
[14] HEIDBRINK, W. W., et al., Nucl. Fusion 31 (1991) 1635.
[15] STRAIT, E. J., et al., Nucl. Fusion 33 (1993) 1849.
[16] DARROW, D. S., et al., Proc. 19th EPS Conf. on Controlled Fusion and Plasma Physics, Part I(1992) 431.
[17] SESNIC, S., et al., Nucl. Fusion 33 (1993) 1877 .
[18] KIMURA, H., SAIGUSA, M., MORIYAMA, S., et al., Phys. Lett. A 199 (1995) 86.
[19] SAIGUSA, M., KIMURA, H., MORIYAMA, S., et al., Plasma Phys. Control. Fusion 37 (1995)295.
[20] KIMURA, H., SAIGUSA, M., KONDOH, T., et al., Jap. J. Plasma Fusion Res. 71 (1995) 1147.
[21] ALI-ARSHAD, S. and CAMPBELL, D. J., Plasma Phys. Control. Fusion 37 (1995) 715 .
[22] FASOLI, A., et al., Report Number JET-P(95)30, submitted to Nucl. Fusion.
[23] SIGMAR, D. J., et al., Phys. Fluids B 4 (1992) 1506.
[24] GOLDSTON, R. J., WHITE, R. B., and BOOZER, A. H., Phys. Rev. Lett. 47 (1981) 647 .
[25] HEIDBRINK, W. W., DUONG, H. H., MANSON, J., WILFRID, E., OBERMAN, C., and STRAIT,E. J., Phys. Fluids B 5 (1993) 2176 .
[26] PHILLIPS, C. K., WILSON, J. R., BELL, M., et al., in Proceedings of the 10th Topical Confer-ence on Radio Frequency Power in Plasmas , (Boston 1993), American Institute of Physics, New York(1994) 44.
[27] HEIDBRINK, W. W. and SADLER, G. J., Nucl. Fusion 34 (1994) 535.
[28] WHITE, R. B., et al., Phys. Fluids 26 (1983) 2958.

11
Figure Captions
Figure 1: Time history of the Mirnov coil signal, the neutron rate, and the rate of beam ion loss for aplasma in which an Alfvén mode was driven unstable by 100 keV deuterons from the neutral beamheating system of TFTR.
Figure 2: Frequency spectra of the signal from a Mirnov coil during and between bursts of modeactivity in the shot shown in Fig. 1.
Figure 3: (a) Fractional change in the neutron rate plotted against the time integral of the rms Alfvénmode amplitude. The data are from bursts which occurred in twelve nominally identical discharges.The magnitude of the drop in the neutron rate is computed as in Ref. 10, by extrapolating the neutronsignal at constant slope past the burst, and measuring the difference between this extrapolated level andthe minimum rate reached just after the burst. This is then divided by the average neutron rate to givethe fractional change. The integral Alfvén mode amplitude is determined by high pass filtering thedigitized Mirnov coil signal to retain f>62.5 kHz only, integrating the signal in time to restore δB fromd(δB)/dt, then computing the rms amplitude of the magnetic fluctuations, subtracting a backgroundlevel due to turbulence, and finally integrating the result in time. (b) Total loss to the midplane probe,integrated over the duration of the burst, plotted against the time integral of the rms Alfvén modeamplitude. (c) Fractional change in the neutron rate plotted against the time integral of the rms mag-netic activity between 10 and 62.5 kHz.
Figure 4: (a) Detected pitch angle distributions of beam ion losses during and between bursts of TAEactivity. The heights of the curves are rescaled to be equal for ease of comparison. A small increase inpitch angle is observed during the Alfvén mode burst, although during other bursts the pitch angle issometimes seen to decrease. The boundary between passing and trapped particles for this discharge isat a pitch angle of 47°. (b) Detected distributions of gyroradii from the same times as in part (a). Theloss appears to shift very slightly to lower gyroradii during the mode. Again, the heights have beenrescaled.
Figure 5: Orbits computed from the observed pitch angles at the 20° detector at several different posi-tions. All are banana orbits with their tips within the stochastic ripple domain, which is the darkershaded region in the plasma cross-section. The probe aperture positions were: 60718, R=3.49 m; 60721,R=3.435 m; and 60722, R=3.41 m.
Figure 6: Total beam ion loss to the 20° probe versus probe position. The limiter is at R=352.5 cm atthis poloidal angle. The data shows roughly an exponential scrape-off, with a characteristic length of~6 cm.
Figure 7: The observed peak pitch angle and peak gyroradius at the 20° detector versus probe position,for Alfvén mode driven neutral beam ion loss.
Figure 8: Frequency spectrum of Mirnov coil data during an ICRF H-minority tail driven TAE mode.
Figure 9: Time history of a discharge with H-minority ICRF tail ion driven TAE. (a) Tail ion loss rate atthe 45° escaping alpha detector. (b) TAE amplitude from Mirnov coil. (c) Soft X-ray signal showingthe sawtooth behavior of the discharge. (d) Applied ICRF power.

12
Figure 10: (a) TAE amplitude and escaping tail ion loss power versus applied ICRF power. (b) Escap-ing tail ion loss power and density fluctuation level as measured by a microwave reflectometer versusthe mode amplitude measured by the Mirnov coils.
Figure 11: TAE-induced loss of tail ions versus poloidal angle.
Figure 12: (a) Escaping ICRF tail ion orbits with and without the TAE, as seen at the 60° detector. (b)Escaping ICRF tail ion orbits with and without the TAE, as seen at the 45° detector. (c) Escaping ICRFtail ion orbits during the TAE only, as seen at the 20° detector.
Figure 13: Peak pitch angle of the TAE-induced tail ion loss in several detectors as a function of plasmacurrent.
Figure 14: (a) Peak pitch angle of the TAE-induced H-minority tail ion loss in the 45° detector plottedversus applied ICRF power. (b) Peak energy of the TAE-induced H-minority tail ion loss in the 45°detector plotted versus applied ICRF power. (c) Peak pitch angle of the TAE-induced H-minority tailion loss in the 60° detector plotted versus applied ICRF power. (d) Peak energy of the TAE-induced H-minority tail ion loss in the 60° detector plotted versus applied ICRF power.
13
0.56
0.58
0.60
-0.10.0
0.1
4.24
04.
245
4.25
04.
255
0.3
0.4
0.5
0.6
Tim
e (s
)
Sn (a.u.) B (a.u.)~• Fast Ion
Loss (a.u.)
Figure 1
θ=20
°
14
012 050
100
150
200
250
Fre
quen
cy (
kHz)
B Amplitude (a.u.)•
Dur
ing
Bur
st: 4
.241
–4.2
44 s
012 050
100
150
200
250
Fre
quen
cy (
kHz)
B Amplitude (a.u.)
•
Bet
wee
n B
urst
s: 4
.244
–4.2
45 s
Figure 2
6072
1
6072
1

15
0
0.02
0.04
Change in Sn During Burst (a.u.)
0.06
0.080.1
00.
20.
40.
60.
8
Inte
gral
Mod
e A
mpl
itude
Dur
ing
Bur
st (
a.u.
)
11.
21.
41.
6
Figure 3a
16
0
0.51
1.52
2.5
Integral Fast Ion Loss (a.u.)
0.2
0.4
0.6
0.8
11.
21.
41.
6
Inte
gral
Mod
e A
mpl
itude
Dur
ing
Bur
st (
a.u.
)
Figure 3b
17
0
0.02
0.04
0.06
0.080.1
Change in Sn During Burst (a.u.)
05
1015
2025
Inte
gral
Mag
netic
Am
plitu
de D
urin
g B
urst
, 10-
62 k
Hz
(a.u
.)
Figure 3c

18
4550
5560
6570
7580
85010203040506070
Pitc
h A
ngle
(°)
Loss rate (a.u.)
Dur
ing
Alfv
én
Mod
e B
urst
(sca
led)
Bet
wee
n B
urst
s
Figure 4a
θ=20
°
19
23
45
67
89
1011
01020304050
Gyr
orad
ius
Cen
troi
d (c
m)
Loss Rate (a.u.)
Figure 4b
Bet
wee
n B
urst
s
Dur
ing
Alfv
én
Mod
e B
urst
(sca
led)
θ=20
°
20
Stochastic loss region
Limiter
90 keV Neutral beam ion orbit
Plasma edge
Detector
0-100 100
-100
0
100
Major Radial Position (cm)
Ver
tical
Pos
ition
(cm
)
#60722
#60718
#60721
Figure 5
Confined Region
21
0510
Fast Ion Loss/Alfvén Mode Amplitude (a.u.)
152025303540
Pro
be A
pert
ure
Pos
ition
(cm
)
340
342
344
346
348
350
Figure 6

22
5060708090
100
110
Figure 7
340
342
344
346
348
350
Pro
be A
pert
ure
Pos
ition
(cm
)
Pea
k pi
tch
angl
e (°
)E
nerg
y (k
eV)
23
051015
050
100
150
200
250
Fre
quen
cy (
kHz)
B Amplitude (a.u.)
•
Figure 8
24
.
01234
TA
E A
mpl
.15
0-20
0 kH
z(a
.u.)
0
1
Tai
l ion
loss
45°
dete
ctor
(a.u
.)
0
1
2
3
ICR
F P
ower
(MW
)
3.5
Time (sec)
2.5 3.0
1
2
Sof
t X-r
ays
(a.u
.)
Figure 9
25
0.010.
1110
02
46
810
12
Figure 10a
ICR
F p
ower
(M
W)
Esc
apin
g ta
il io
n po
wer
loss
(%
of i
nput
)
Mod
e A
mpl
itude
(a.
u.)
TA
E p
rese
nt

26
02468
10
Escaping tail ion power loss (% of input)
∆ne /ne (%)
00.02
0.04
0.06
0.08
0.1
0.12
0.14
05
1015
2025
30
Figure 10b
TA
E A
mpl
itude
(m
G)
27
0
0.04
0.08
0.12
0.160.
2
Relative Fast Ion Loss Rate (a.u.)
020
4060
80
Figure 11
Pol
oida
l Pos
ition
of D
etec
tor
(°)

28
Figure 12
60°
dete
ctor
No
TA
E
TA
E
01
-1
ΩH Layer
(a)
20°
dete
ctorTA
E
01
-1
ΩH Layer
(c)
45°
dete
ctor
No
TA
E
TA
E
01
-1
ΩH Layer
(b)

29

30
495051525354
Peak Pitch Angle (°)
02
46
810
ICR
F P
ower
(M
W)
12
=45
°θ
(a)
Figure 14
31
646566676869
02
4
Peak Pitch Angle (°)
68
1012
(c)
θ
ICR
F P
ower
(M
W)
=60
°
Figure 14
32
0.650.
7
0.750.
8
0.850.
9
0.95
Peak Energy (MeV)
02
46
810
ICR
F P
ower
(M
W)
12
(b)
=45
°θ
Figure 14
33
0.4
0.450.
5
0.550.
6
0.650.
7
0
Peak Energy (MeV)
24
68
1012
ICR
F P
ower
(M
W)
(d)
θ=
60°
Figure 14