observations of atmospheric gravity waves using airglow ... · observations of atmospheric gravity...
TRANSCRIPT

Observations of atmospheric gravity waves using airglow all-skyCCD imager at Cachoeira Paulista, Brazil (23° S, 45° W)
A. F. Medeiros1, H. Takahashi2, P. P. Batista2, D. Gobbi2 and M. J. Taylor3
1 Universidade Federal Campina Grande (UFCG), Bodocongó, Campina Grande, Paraíba, Brasil2 Instituto Nacional de Pesquisas Espaciais (INPE), São José dos Campos, São Paulo, Brasil3 Space Dynamics Laboratory and Physics Department, Utah State University, Utah, USA
Received: March 31, 2002; accepted: July 29, 2002
RESUMENUn fotómetro imageador CCD all-sky fue operado en Cachoeira Paulista (CP), Brasil (23° S, 45° O), con la colaboración de
la Utah State University – EUA, durante 12 meses para la observación de las emisiones de aeroluminiscencia en OH, O2 y OI(557.7 nm). De estas observaciones fueron retiradas las componentes dominantes de las ondas de gravedad e investigadas susvariaciones con las estaciones del año. Estas ondas tienen típicamente longitud de onda horizontal corta (5 – 60 km), período corto(5 – 35 minutes) y velocidad de fase horizontal entre 1 y 80 m/s. Las ondas del tipo banda (longitud de onda horizontal entre 10 y60 km), muestran una clara dependencia en su dirección de propagación horizontal, moviéndose para el sudeste en el verano ypara el noroeste en el invierno. La dirección de propagación cambia a mediados del mes de marzo y al final de septiembre.Nuestros resultados sugieren que las ondas de gravedad en CP son generadas por una fuerte convección troposférica. En el veranoesta región se extiende en una linea entre los 10° S, 45° O y 40° S, 78° O cubriendo desde la parte septentrional de la Argentina alnordeste del Brasil, teniendo una acentuada distribuición en la parte central brasileña y siendo que CP está abajo de esta región. Enel invierno y en contraste con el verano, la región convectiva se localiza abajo de CP, principalmente sobre el mar, sin estaconvección en la región central del Brasil, arriba de CP. La conclusión más importante es que la anisotropía en la dirección depropagación de las ondas se debe principalmente a la localización de la fuente y su filtraje por los vientos estratosféricos.
PALABRAS CLAVE: Ondas de gravedad, resplandor atmosférico, imageador, diagrama de bloques, vientos.
ABSTRACTAn all-sky CCD imager for OH, O2 and OI (557.7 nm) airglow was operated at Cachoeira Paulista (CP), Brazil, (23° S, 45°
W), from October 1998 to September 1999, with Utah State University. Dominant gravity wave components are extracted andseasonal variations are investigated. These waves have typically short horizontal wavelengths (5 – 60 km), short periods (5 – 35minutes), and horizontal phase speeds of 1 – 80 m/s. Band-type waves of horizontal wavelength between 10 and 60 km showedclear seasonal dependence in the horizontal propagation direction to southeast in summer and to northwest in winter. The directionof propagation changed in mid-March and at the end of September. The gravity waves over CP may be generated by the strongtropospheric convection. In summer, this region extends along a line approximately between (10° S, 45° W) and (40° S, 78° W),from northern Argentina to the Brazilian northeast, with an accentuated distribution over central Brazil. CP is below this region. Inwinter, the convective region is located below CP mainly over the sea and there is no convection in central Brazil region above CP.Thus the anisotropy of the wave propagation direction is mainly due to source location and wave filtering by stratospheric winds.
KEY WORDS: gravity waves, airglow, imager, blocking diagram, winds.
1960), considerable observational and theoretical researchhas been carried out. These efforts have established the im-portance of such motions as a part of the driving force of themean circulation and thermal structure of the Mesosphereand Lower Thermosphere (MLT) region via wave energy andmomentum transports (Fritts, 1993).
Considerable progress has been made in observationaltechniques of gravity waves in the MLT. Some of these tech-niques are MF radar (Vincent and Fritts, 1987; Manson etal., 1997; Thayaparan ,1997; Fritts et al. ,1998 ); incoherentscattering radar (Burnside et al.,1991; Rishbeth andVaneyken,1993; Kirchengast et al.,1996; Oliver et al., 1997);MST radar (Riggin et al. 1995); MU radar (Takahashi et
1. INTRODUCTION
Over the past few decades much research has been doneto understand the role of atmospheric small scale dynamics,such as internal buoyancy waves, in the global circulationsystem of the atmosphere. An internal buoyancy wave, orgravity wave, is the result of a perturbation of the stable at-mosphere in which gravity and buoyancy act as restoringforces. The impact caused by gravity waves is a significantdeviation of the general circulation from radiative equilib-rium.
Since internal atmospheric gravity waves were recog-nized as an important atmospheric phenomenon (Hines,
Geofísica Internacional (2004), Vol. 43, Num. 1, pp. 29-39
29

30
A. F. Medeiros et al.
al.,1998,1999); lidar (Clemesha,1995; Clemesha et al.,1999,Gardner et al., 1995, Bills and Gardner,1993; She etal.,1991); photometer (Takahashi et al.,1974; Buriti, 1997);photographic camera (Peterson and Keiffaber 1973, Moreelsand Herse,1977; Herse et al., 1980); television camera(Hapgood and Taylor,1982; Taylor and Edwards,1991); im-ager with CCD(Taylor et al,1995a; Taylor and Garcia, 1995;Garcia and Taylor,1997; Hecht et al. ,1994; Swenson andMende,1994); Fabry-Perot interferometer (Hernandez etal.,1993) and Michelson interferometer (Lowe andTurnbull,1995; Sivjee and Walterscheid,1994; Gault etal.,1996; Shepherd,1996).
Airglow imaging techniques provide a simple and use-ful method for investigating the horizontal characteristics ofthe gravity waves and their temporal evolution at MLTheights. Most of the airglow image measurements reportedin the literature concern to short-period (<1 hour) wave struc-tures and they fall into two distinct categories called “bands”and “ripples”. Bands are extensive, long-lasting wave pat-terns which exhibit horizontal wavelengths of several tensof kilometers and horizontal phase velocities up to 100 m/s(e.g. Clairemidi et al., 1985). These patterns have been at-tributed to freely propagating or ducted short-period gravitywaves (Walterscheid et al., 1999; Isler et al., 1997; Taylor etal., 1987). Ripples are short-lived (<45 min) small-scale wavepatterns of restricted spatial extent (Peterson, 1979), and arethought to be generated in situ by localized shear or convec-tive-type instabilities in the total wind field (Taylor andHapgood, 1990; Hecht et al., 1995).
Nakamura et al. (1999) analyzed 18 months of obser-vation in the OH images, extracted dominant gravity wavecomponent and investigated seasonal variation of the char-acteristics of the waves. Walterscheid et al. (1999) analyz-ing 9 months of airglow image observations of atmosphericgravity waves proposed that many waves were thermallyducted. Hecht et al. (2001) analyzing 15 months of observa-tions suggested that the waves originated no more than afew thousand kilometers from the observation site. This pa-per describes new image measurements of short period wavesobserved from a low-latitude site in the Southern Hemi-sphere.
The main goal of this paper was to construct a sea-sonal variation behaviour of the short period gravity wavesover CP using an all-sky airglow imager. Maybe the mostimportant result of this work has been the appearance of ananisotropy in the propagation direction of the observedwaves. After reaching this objective, one second objective,not less important, was to understand the causes of the ob-served features. For explaining these features, we discussthe data using the filtering wave theory and searched forlikely generating sources of the waves. The result was thatthe waves over CP are generated by strong convective re-
gions and that anisotropy in propagation direction are in partdue to the location (seasonal variation) of the generatingsources and mainly to the filtering of the waves by strato-spheric winds.
2. INSTRUMENTATION AND METHODOLOGY
Routine airglow observations have been carried out atCP using an all-sky imaging system. This is a collaborativeprogram between the Instituto Nacional de PesquisasEspaciais (INPE), Brazil and the Space Dynamics Labora-tory, Utah State University (Dr. M. J. Taylor). The CCD im-ager consists of a large area (6.45 cm2), high resolution,1024x1024 back-illuminated array with a pixel size of 14bits. The high quantum efficiency (~80% at visible wave-lengths), low dark current (0.5 electrons/pixel/s), low read-out noise (15 electrons rms), and high linearity (0.05%) ofthis device made it possible to achieve quantitative measure-ments of the airglow emissions. The camera uses a fast (f/4)all-sky telecentric lens system that enables high signal-to-noise (20:1) images of wave structure to be obtained withtime integration of typically 15 s for the near-infrared OHemission (715-930 nm pass-band) and 90 s for the OI, O2,and OI(630.0 nm) emissions. The image was binned on-chipdown to 512x512 resolution to enhance the signal-to-noiseratio.
For the large-field information present in the all-skydata, accurate spatial calibration is essential. We can achievethis by using the stars in each image as known referencepoints in the sky. We determine the lens function by per-forming a least-square fit using the measured position of thestars in the original image. After we have processed the all-sky images, it is now possible to determine the horizontalwave parameters directly with standard 2-D FFT analysis.The advantage of this method is that measurements of all ofthe monochromatic features present in the data are now pos-sible.
We can investigate gravity wave content in any part ofthe image by isolating the region of interest, taking the 2-DFFT of the selected region and investigating peaks in thefrequency spectrum. Other way to show these events is toshow in three dimensions.
The determination of the period (and hence phasespeed) of the waves present in these data involves taking theone-dimensional (1-D) FFT in the time of the complex 2-DFFT in space. The peaks in the 1-D FFT correspond to thewave frequencies present in the data.
3. RESULTS
The imaging system was located at CP (23° S, 45° W).Measurements were taken from October 1998 to September

31
Atmospheric gravity waves at Cachoeira Paulista (23°S, 45° W)
1999. This result is depicted in the Figure 1 which plots thefrequency of occurrence of the waves. Despite the sometimessevere restrictions imposed by meteorological clouds, ap-proximately 433 hours of useful data were recorded on 69nights, in which 283 wave events were detected. The meanrate of the events was 0.7 events/hour, with higher mean rateon summer and winter months and lower mean rate on equi-noctial months.
The Figures 2 show examples of the gravity wavesimaged during the observation period. In the Figure 2 twoimages showing gravity waves recorded in the OI(557.7 nm)and near-infrared OH emissions with bands (left) andripples(right).
3.1 Band-Ripple comparison
Of the total 283 wave events, 64% were bands, while36% were ripples.
The data have been binned into histograms of 5 kmwidth. This shows the most frequently observed horizontalscale sizes. The strong tendency for ripples to occur overnarrow wavelength range is apparent with ~83% of all eventshaving wavelengths in the 10-15 km range. In contrary, theband distribution exhibited a significantly broader range ofhorizontal wavelengths extending from ~10-60 km and 85%of all bands had wavelengths > 15 km. The average bandwavelength was 22.92 km, approximately twice of that forthe ripples (12.94 km).
The distribution of observed waves periods have binnedat 2 min intervals 5. The ripples exhibit a remarkable sharpdistribution centered on the 6-10 min (with 70% of eventsoccurring within this range) and an average wave period of8.36 min. In comparison, the distribution of the periods ofthe bands is considerably broader than for the ripples andshows a clear tendency toward longer wave period (with 97%of bands exhibiting periods > 8 min). The bands exhibitedan average wave period of 15.62 min.
The distribution of wave phase speeds have plotted at10 m/s intervals. The bands measurements range from 10 to80 m/s and exhibit an average value of 26.1 m/s. There is aclear tendency for many of the waves to exhibit phase speedin the 10 40 m/s range. The ripples exhibited a distributionin the range of the 10-60 m/s. The average phase speed wasof 27.2 m/s.
The last parameter analyzed was the wave propaga-tion direction. The propagation direction for both groups,binned over 15° intervals, are plotted in Figure 3 The distri-bution of bands (Figure 3a) is highly anisotropic. There aretwo directions of preference: southeast (azimuth range 90°-180°) and northwest (azimuth range 270°-360°). The ripples(Figure 3b) presented propagation direction in all azimuthsand did not show a preferential direction.
3.2 Band-Ripple seasonal variation
After the general comparison of the bands and ripples,we analyzed the parameters (wavelength, period, phase ve-locity and propagation direction) distributed for each groupby each season. The total observation period was separatedin four seasons: summer (November, December, January andFebruary), autumn (March and April), winter (May, June,July and August) and spring (September and October).
This analysis did not show a clear seasonal variationfor wavelengths, periods and phase velocities, neither forripples or bands. The ripples also did not present seasonalvariation for propagation direction. However, the bandsshowed an evident seasonal variation for propagation direc-tion. The Figure 4 shows a clear preference of the bands for
Fig. 1. Frequency of occurrence of waves (ripples and bands) formonths.
Fig. 2. Gravity waves imaged during observation period. OI(5577nm) image(right) and OH image(left).

32
A. F. Medeiros et al.
Fig. 3. Polar histogram of the propagation direction for bands(a) and ripples(b) binned over 15° intervals.
Fig. 4. Polar histograms of the propagation direction for bands for each season. Summer (a), Autumn(b), winter(c) and spring(d).

33
Atmospheric gravity waves at Cachoeira Paulista (23°S, 45° W)
propagation direction in summer and winter. In summer thepreferential propagation direction is towards southeast (Fig-ure 4a). In winter the preferential propagation direction istowards northwest (Figure 4c). In the other seasons no clearpreferential propagation direction were observed.
4. DISCUSSION
4.1 Preferential direction and filtering
The anisotropy detected in propagation direction of thebands, mainly for summer and winter can be due the pres-ence of critic levels. Gravity waves propagating upward fromthe lower atmosphere are absorbed into the mean flow asthey approach a critical layer where the intrinsic frequencyof the wave is Doppler shifted to zero. This situation mayoccur at any height level when the local horizontal wind speedalong the direction of propagation equals the observed hori-zontal phase speed of the gravity wave.
The Equation 1 was used to determine the forbiddenregions (velocities) defined by the regions where the wave
frequency Ω ≤ 0 at any height below the peak of the layeremissions (OI5577, OH and O2):
v V V senx z m= +cosφ φ , (1)
where Vz is the zonal wind, Vm is the meridional wind and φis the angle between wave vector and east.
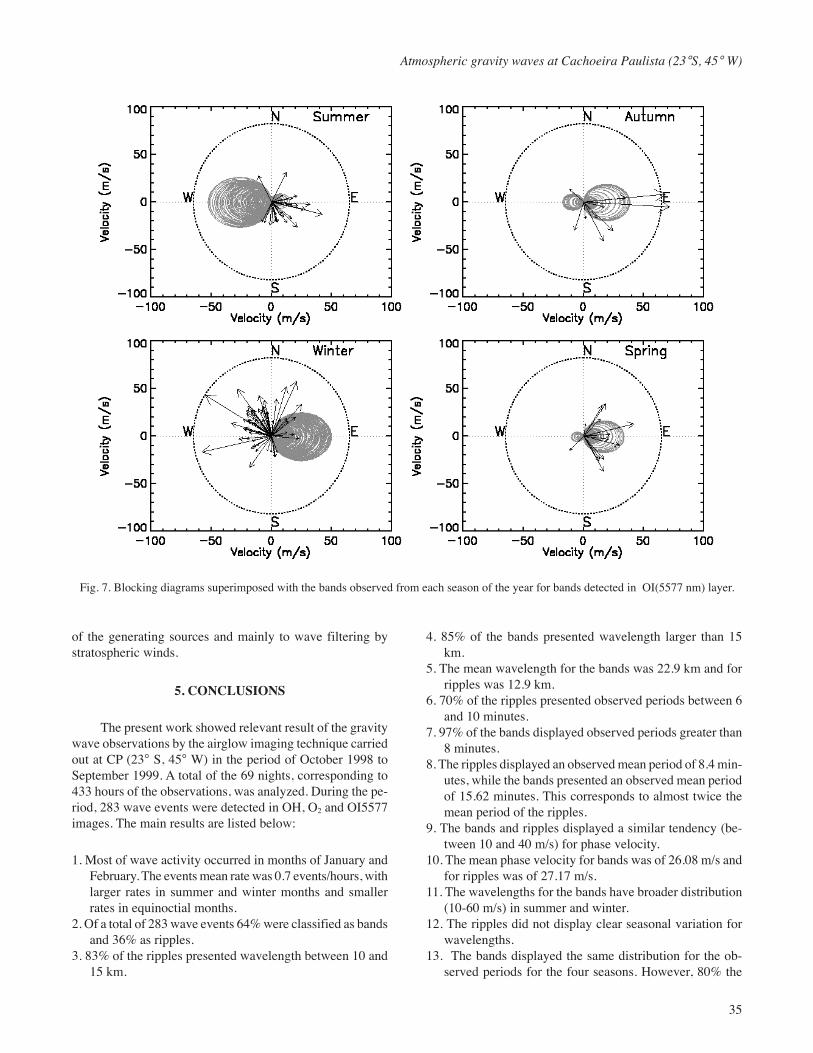
Blocking diagrams (Ryan,1991; Ryan and Tuan,1991;Taylor,1993) were plotted for each month of the year usingthe wind profiles derived from HWM93 (Hedin,1996) forCP. The Figures 5, 6 and 7 show blocking diagrams super-imposed with the bands observed for each season of the yearand each emission. The results agree in part with the anisot-ropy detected in the bands. This suggests that the wave fil-tering by winds can play an important role in the seasonalvariation of the waves over CP but it is not the only factor.
4.2 Likely sources
Any perturbation with temporal scales between a fewand several minutes that introduces changes in the atmosphere
Fig. 5. Blocking diagrams superimposed with the bands observed from each season of the year for bands detected in OH layer.

34
A. F. Medeiros et al.
may generate gravity waves. Nowadays the troposphericsources are thought as possible generators of the waves in alllatitudes (Taylor, 1988).
In this work we used airglow image data together withsatellite image (GOES8) data and Lightning imaging sensor(LIS) data to identify the sources. The LIS is a space basedinstrument used to detect the distribution and variability oftotal lightning (cloud-to-cloud, intracloud, and cloud-to-ground lightning) that occurs in the tropical regions of theglobe. The LIS is a scientific instrument aboard the TRMM(Tropical Rainfall Measuring Mission) observatory.
The satellite images were used to detect convective re-gions over South America (area with approximately 1000km of radius with center in CP).
The LIS data were used for identification of the thun-derstorms and to infer seasonal distribution of the lightingover South America. These data also permitted to discussthe anisotropy of the direction of propagation.
Figure 8 shows the lightning distribution in the tropicsfor summer. Note clearly that most of the lightning occur-rence over South America extends approximately in the linefrom northern Argentina to almost the Brazilian northeastwith a conspicuous distribution over central Brazil. CP islocated bellow this line, this suggests this convection line asresponsible for most of waves over CP directed to southeastin summer.
Figure 9 shows the lightning distribution over the trop-ics for winter detected by LIS. In contrast with summer thelightning distribution occur bellow CP, mainly over the seaand there is no convection above in central region of theBrazil. This suggests that is this region that contribute forthat waves to have propagation direction for northwest inwinter.
The analysis of the Figures 8 and 9 and its comparisonwith the Figures 5, 6 and 7 suggests that gravity waves overCP are generated by strong convection regions (above CP insummer and bellow of CP in winter). This way, the anisot-ropy of propagation direction is due in part to the location
Fig. 6. Blocking diagrams superimposed with the bands observed for each season of the year for bands detected in O2 layer.
35
Atmospheric gravity waves at Cachoeira Paulista (23°S, 45° W)
of the generating sources and mainly to wave filtering bystratospheric winds.
5. CONCLUSIONS
The present work showed relevant result of the gravitywave observations by the airglow imaging technique carriedout at CP (23° S, 45° W) in the period of October 1998 toSeptember 1999. A total of the 69 nights, corresponding to433 hours of the observations, was analyzed. During the pe-riod, 283 wave events were detected in OH, O2 and OI5577images. The main results are listed below:
1. Most of wave activity occurred in months of January andFebruary. The events mean rate was 0.7 events/hours, withlarger rates in summer and winter months and smallerrates in equinoctial months.
2. Of a total of 283 wave events 64% were classified as bandsand 36% as ripples.
3. 83% of the ripples presented wavelength between 10 and15 km.
4. 85% of the bands presented wavelength larger than 15km.
5. The mean wavelength for the bands was 22.9 km and forripples was 12.9 km.
6. 70% of the ripples presented observed periods between 6and 10 minutes.
7. 97% of the bands displayed observed periods greater than8 minutes.
8. The ripples displayed an observed mean period of 8.4 min-utes, while the bands presented an observed mean periodof 15.62 minutes. This corresponds to almost twice themean period of the ripples.
9. The bands and ripples displayed a similar tendency (be-tween 10 and 40 m/s) for phase velocity.
10. The mean phase velocity for bands was of 26.08 m/s andfor ripples was of 27.17 m/s.
11. The wavelengths for the bands have broader distribution(10-60 m/s) in summer and winter.
12. The ripples did not display clear seasonal variation forwavelengths.
13. The bands displayed the same distribution for the ob-served periods for the four seasons. However, 80% the
Fig. 7. Blocking diagrams superimposed with the bands observed from each season of the year for bands detected in OI(5577 nm) layer.

36
A. F. Medeiros et al.
bands in winter presented observed period between 10and 20 minutes.
14. The ripples displayed the same distribution for the ob-served periods for the four seasons.
15. The observed phase velocity of the bands in winter andsummer were of same order, between 10 and 40 m/s.
16. The ripples did not display a clear seasonal variation forobserved phase velocity.
17. The ripples did not display clear seasonal variation forpropagation direction.
18. The bands displayed an anisotropy in propagation direc-tion. In summer, most of waves propagated for south-
Fig. 8. Lightning distribution in the tropics for summer from LIS data.
Fig. 9. Lightning distribution in the tropics for winter from LIS data.

37
Atmospheric gravity waves at Cachoeira Paulista (23°S, 45° W)
east. In winter, the propagation direction was for north-west.
19. The gravity waves over CP are generated by strong con-vective regions. In summer, these regions extend over aline from approximately (10° S, 45° W) to (40° S, 78°W), covering from north of Argentina to Brazilian north-east, with an accentuated distribution over central Brazilhaving CP below this region. In winter, the convectiveregion in contrast to the summer is bellow CP, mainlyover the sea and there is no convection in central Brazilregion above CP.
20. Finally, maybe the most important conclusion of the workwas that the anisotropy of propagation direction is dueto partially the location of the generating sources (sea-sonal variation) and mainly to the wave filtering by strato-spheric winds.
BIBLIOGRAPHY
BILLS R. E. and C. S. GARDNER, 1993. Lidar observa-tions of the mesopause region temperature structure atUrbana. J. Geophys. Res. Atmosph., 98(D1), 1011-1021.
BURITI, R. A., 1997. Estudo de parâmetros de ondas degravidade por medidas simultâneas de radar MU efotômetro em Shigaraki (35°N,136°L), Japão. São Josédos Campos. 176p. (INPE-6647-TDI.624). Phd thesis,Instituto Nacional de Pesquisas Espaciais.
BURNSIDE R. G., C. A. TEPLEY, M. P. SULZER, T. J.FULLER-ROWELL, D. G. TORR and R. G. ROBLE,1991. The neutral thermosphere at Arecibo during geo-magnetic storms, J. Geophys. Res. Space Phys.,96(NA2), 1289-1302.
CLAIREMIDI, J., M. HERSE and G. MOREELS, 1985.Bi-dimensional observation of waves near the meso-pause at auroral latitudes. Planet. Space Sci., 33, 1013-1022.
CLEMESHA, B. R., 1995, Sporadic neutral metal layers inthe mesosphere and lower thermosphere. J. Atmosph.Terr. Phys., 57, 725-736.
CLEMESHA, B. R., I. VESELOVSKII, P. P. BATISTA, M.P. P. M. JORGE and D. M. SIMONICH, 1999. Firstmesopause temperature profiles from a fixed southernhemisphere site. Geophys. Res. Lett., 26(12), 1681-1684.
FRITTS, D. C. and P. K. RASTOGI, 1985. Convective anddynamical instabilities due to gravity wave motions inthe lower and middle atmosphere. Theory and observa-tions. Radio Science, 20(6), 1247-1277.
FRITTS, D. C., D. M. RIGGIN, B. B. BALSEY and R. G.STOCKWELL, 1998. Recents results with an MF radarat Mcmurdo, Antartica: Characteristics and variabilityof motions near 12-hour period in the mesosphere.Geophys. Res. Lett., 25(3), 297-300.
GARCIA, F. J. and M. J. TAYLOR, 1997. Two-dimensionalspectra-analysis of mesospheric airglow data. AppliedOptics, 36(29), 7374-7385.
GARDNER, C. S., J. QIAN, M. R. COBLE, G. C. PAPENand G. R. SWENSON, 1995. High resolution horizon-tal wave-number spectra of mesospheric wave pertur-bations observed during the 21 October triangularflight of ALOHA-93. Geophys. Res. Lett., 22(20),2869-2872.
GAULT, W. A., S. BROWN, A. MOISE, D. LIANG, G.SELLAR, G. G. SHEPHERD and J. WIMPERIS, 1996.An E-region wind interferometer. Applied Optics, 35(16),2913-2922.
HAPGOOD, M. A. and M. J. TAYLOR, 1982. Analysis ofairglow image data. Ann. Geophys., 38(6), 805-813.
HECHT, J. H., S. R. R. HOWAT, R. L. WALTERSCHEIDand J. R. ISLER,1995. Observations of spectra of inten-sity flutuations of the OH Meinel nightglow duringALOHA-93. Geophys. Res. Lett., 22:(20), 28373-2876.
HECHT, J. H., R. L. WALTERSCHEID and M. N. ROSS,1994. First measurements of the two-dimensional hori-zontal wave number spectrum from CCD images of thenightglow. J. Geophys. Res. Lett., 99, 11449-11460.
HECHT, J. H., R. L. WALTERSCHEID, M. P. KICKEY andS. J. FRANKE, 2001. Climatology and modeling ofquasi-monochromatic atmospheric gravity waves ob-served over Urbana Illinois. J. Geophys. Res., 106, 5181-5191.
HERNANDES, G., G. J. FRASER and R. W. SMITH, 1993.Mesospheric 12-hour oscillation near south pole, Ant-arctica. Geophys. Res. Lett., 20(17), 1787-1790.
HERSE M., MOREELS G. and J. CLAIREMIDI, 1980.Waves in the OH emissive layer: photogrammetry andtopography. Appl. Optics, 19, 355-362.
HINES, C. O., 1960. Internal atmospheric gravity waves ationospheric heights. Can. J. Phys, 38, 1441-1481.

38
A. F. Medeiros et al.
ISLER, J. R., M. J. TAYLOR and D. J. FRITTS, 1997. Ob-servational evidence of wave ducting and evanescencein the mesosphere. J. Geophys. Res., 102, 26301-26313.
KIRCHENGAST, G., K. HOCKE and K. SCHLEGEL, 1996.The gravity-wave tide relationship - insight via theo-retical-model EISCAT data comparison. J. Atmos. Terr.Phys., 58(1-4), 233-243.
LOWE, R. P. and D. N. TURNBULL, 1995. Comparison ofALOHA-93, ANLC-93 and ALOHA-90 observations ofthe hydroxyl rotational temperature and gravity waveactivity. Geophys. Res. Lett., 22(20), 2813-2816.
MANSON, A. H., C. E. MEEK and Q. M. ZHAN, 1997.Gravity-wave spectra and directions statistics for the me-sosphere as observed by MF radars in the canadian Prai-ries (49°N, 52°W) and at Tromso (69°N). J. Atmos. So-lar Terr. Phys., 59(9), 993-1009.
MORELS, G. and M. HERSE, 1997. Photographic evidenceof waves around the 85 km level. Planet. Space Sci-ence, 25, 265-273.
NAKAMURA, T., A. HIGASHIKAWA, T. TSUDA and Y.MATSUSHITA, 1999. Seasonal variations of gravitywave structures in OH airglow with a CCD imager atShigaraki. Earth Planets Space, 51, 897-906.
OLIVER, W. L., Y. OTSUKA, M. SATO, T. TAKAMI andS. FUKAO, 1997. A climatology of F-region gravity-wave propagation over middle and upper-atmosphereradar. J. Geophys. Res. Space Phys., 102(A7), 14499-14512.
PETERSON, A. W. and L. M. KIEFFABER, 1973. Infraredphotography of OH airglow structures. Nature, 242, 321-322.
PETERSON, A. W., 1979. Airglow events visible to the na-ked eye. Appl. Optics, 22, 3390-3393.
RIGGIN, D., D. C. FRITTS, C. D. FAWCETT and E.KUDEKI, 1995. Observations of inertial gravity wavemotions in the stratosphere over Jicamarca, Peru.Geophys. Res. Lett., 22(23), 3239-3242.
RISHBETH, H. and A. P. VANEYKEN, 1993. EISCAT -Early history and the 1st 10 years of operation. J.Atmosph. Terr. Phys., 55(4-5), 525-542.
RYAN, E. H., 1991. Critical layer directional filtering of at-mospheric gravity waves: A comparison of airglow and
wind profile model: M.S. thesis, The Univ. of Cincin-nati, Ohio.
RYAN, E. H. and T. F. TUAN, 1991. Gravity waves block-ing by critical layers, Middle Atmosphere Periodic Struc-ture and Associated Radiance (MAPSTAR) Meeting,Air Force Geophys. Lab., April.
SHE, C. Y., J. R. YU, J. W. HUANG, C. NAGASAWA andC. S. GARDNER, 1991. Na temperature lidar mea-surements of gravity wave perturbations of wind, den-sity and temperature in the mesopause region. Geophys.Res. Lett., 18(7), 1329-1331.
SHEPHERD, G. G., 1996. WINDII on UARS - a view ofupper mesosphere and lower thermosphere dynamics.J. Geomagnetism and Geoelectricity, 48(1), 125-133.
SIVJEE, G. G. and R. L. WALTERSHEID, 1994. 6-hourzonally symetrical tidal oscillation of the winter meso-pause over the south-pole station. Planet. Space Sci.,42(6), 447-453.
SWENSON, G. R. and S. B. MENDE, 1994. Oh emissionand gravity waves (including a breaking wave) in all-sky imagery from Bear Lake, UT. Geophys. Res. Lett.,21, 2239-2242.
TAKAHASHI, H., P. P. BATISTA, R. A. BURITI, D.GOBBI, T. NAKAMURA, T. TSUDA and S. FUKAO,1998. Simultaneous measurements of airglow OH emis-sion and meteor wind by a scanning photometer andMU radar. J. Atmosph. Solar Terr. Phys., 60, 1649-1668.
TAKAHASHI, H., P. P. BATISTA, R. A. BURITI, D. GOBBIT. NAKAMURA, T. TSUDA and S. FUKAO, 1999.Response of the airglow OH emission, temperature andmesopause wind to the atmospheric wave propagationover Shigaraki, Japan. Earth Planets Space, 51, 863-875.
TAKAHASHI, H., B. R. CLEMESHA and Y. SAHAY, 1974.Nightglow OH(8,3) band intensities and rotational tem-perature at 23 degrees. Planet. Space Sci., 22, 1323-1329.
TAYLOR, M. J. and R. EDWARDS, 1991. Observations ofshort-period mesospheric wave patterns - insitu or tro-pospheric wave generation. Geophy. Res. Lett., 18(7),1337-1340.
TAYLOR, M. J. and F. J. GARCIA, 1995. A two-dimen-sional spectral analysis of short period gravity waves

39
Atmospheric gravity waves at Cachoeira Paulista (23°S, 45° W)
imaged in the OI(557.7 nm) and near infrared OH night-glow emissions over Arecibo, Puerto Rico. Geophys. Res.Lett., 22, 2473-2276.
TAYLOR, M. J. and M. A. HAPGOOD, 1990. On the originof ripple-type wave structure in the nightglow emission.Planet. Space Sci., 38, 1421-1430.
TAYLOR, M. J., M. A. HAPGOOD and P.ROTHWELL,1987. Observations of gravity wavepropagation in the OI (557.7 nm), Na (589.2 nm) andthe near infrared OH nightglow emissions. Planet. SpaceSci, 35, 413-427.
TAYLOR, M. J. and M. A. HAPGOOD, 1988. Identifica-tion of a thunderstorm as a source of short period grav-ity waves in the upper atmospheric nightglow emissions.Planet. Space Sci. 36, 975-985.
TAYLOR, M. J., E. H. RYAN, T. F. TUAN and R.EDWARDS, 1993. Evidence of preferential directionsfor gravity wave propagation due to wind filtering inthe middle atmosphere. J. Geophys. Res., 98(A4), 6047-6057.
THAYAPARAN, T., 1997. The terdiurnal tide in the mesos-phere and lower thermosphere over London, Canada(43°N, 81°S). J. Geophys. Res., 102(D18), 21695-21708.
VINCENT, R. A. and D. C. FRITTS, 1987. A climatology ofgravity wave motions in the mesopause region atAdelaide, Australia. J. Atmospher. Sci., 44(4), 748-
760.
WALTERSCHEID, R. L., J. H. HECHT, R. A. VICENT, I.M. REID, J. WOITHE and M. P. HICKEY, 1999. Analy-sis and interpretation of airglow and radar observationsof quasi-monochromatic gravity waves in the uppermesosphere and lower thermosphere over Adelaide,Australia (35 S, 138 E). J. Atmos. Sol. Terr. Phys., 61,461-468.
_______________
A. F. Medeiros1, H. Takahashi2, P. P. Batista2, D.Gobbi2 and M. J. Taylor3
1 Universidade Federal Campina Grande (UFCG),Av. Aprígio Veloso 882, Bodocongó, Campina Grande,Paraíba, 58.109-170, Brasil.2 Instituto Nacional de Pesquisas Espaciais (INPE),Av. Dos Astronautas 1758, C. Postal: 515,São José dos Campos, São Paulo,12.201-970, Brasil.3 Space Dynamics Laboratory and Physics Department,Utah State University, Logan 84322-4145, Utah,USAEmail: [email protected]