observations for a better world - globenewswire
TRANSCRIPT

Annual report 2020
Observationsfor a betterworld

2
Contents
How to navigate this report:
Read more aboutthis topic
Vaisala’s year 2020 at a glance 3 Vaisala as a global company 4Chairman and CEO’s message 5Highlights of the year 7
Our businessStrategy 10 Business model 11Weather and Environment business area 12Industrial Measurements business area 14Operations 16
Creating value UN Sustainable Development Goals 18Value creation model 20Dashboard 21Megatrends 22Stakeholder engagement 24Value for customers 25Value for employees 27Value for society and the environment 29Value for investors 35
Sustainable business practices Reporting principles, policies, and due diligence 38Environment 39Personnel 46Occupational health and safety 49Ethics and compliance 51Responsible supply chains 53UN Global Compact 55Signatures 56Independent assurance report 57GRI content index 58
GovernanceCorporate governance statement 2020 67Risk management 74Board of Directors 78Management Group 80Information for shareholders 81
About this report: In its annual report, Vaisala applies the Integrated Reporting Framework, as defined by the International Integrated Reporting Council (IIRC). The primary purpose of an Integrated Report is to describe how a company creates value over time. We started our work towards this goal in 2016: this Vaisala annual report is the fifth one to apply the international <IR> Framework. Our aim is to develop our operations through exploring the different types
of value Vaisala creates for its stakeholders. Thus, this compre-hensive report includes information about Vaisala’s sustainability, governance and financials, as well as value creation. Vaisala has published standalone sustainability reports since 2008.
This report caters also to those who gather data from GRI (Global Reporting Initiative) reports. You can find the GRI content index
at the end of the Sustainable business practices section together with an Independent assurance report. Disclosure of non-financial information in accordance with Finnish Accounting Act chapter 3 a is presented in the Sustainable business practices section as well as in the chapters Business model in Our business section, Dashboard in the Creating value section, and Risk management in the Governance section.
Financial statements and Board of Directors’ ReportKey figures 83Board of Directors’ report 84Financial statements 2020 98Auditor’s report 160
Contacts 164
Work towards our mission continued, marked by the fight against COVID-19.p.5

3
Key figures for 2020
R&D
net sales, MEUR
379.5
1,900+employees
44.8operating result, MEUR
14%of net salesrenewable electricity
100%
3
Observations for a better worldIn 2020, Vaisala performed well despite the COVID-19 pandemic. The year was marked by adapting to the new global situation with new ways of working, supplying measure-ment solutions for the fight against the pandemic, enhancing sustainability matters, as well as by our technology’s journey to Mars.
Vaisala is a global leader in weather, environmental, and industrial measurement – with quality, sustainability, and science-based innovations at its core. Building on 85 years of experience, Vaisala provides measurement solutions and services. The accurate and reliable data from them supports customers and societies’ decision-making, safety, quality, and efficiency. Vaisala is headquartered in Finland, and Vaisala’s A shares are listed on the Nasdaq Helsinki stock exchange.
38%62% Weather and Environment
business area 235.5 MEUR
Industrial Measurements business area 143.9 MEUR
Business areas
Weather and EnvironmentWeather and Environment business area serves selected weather-dependent customers, to whom accurate, real-time, uninterrupted, and reliable weather data is essential to run efficient operations.
Main markets: meteorology, aviation, ground transportation, and renewable energy
Industrial MeasurementsIndustrial Measurements business area serves a wide range of industrial customers. It offers a broad range of accurate and reliable measure-ment instruments, continuous monitoring systems, and services that help our customers optimize their processes, improve efficiency, minimize energy consumption, and ensure the high quality of their end products.
Main markets: high-end humidity, high-end carbon dioxide, continuous monitoring systems, liquid measurements, and new markets (power and biogas)
NET SALES BY BUSINESS AREA
2020

Vaisala as a global company AMERICAS Orders received and net sales decreased compared to previous year due to lack of new large project orders. Profitability improved as a result of streamlined product offering to renewable energy customer segment as well as reorganization of the digital business. Large projects in Argentina and The Bahamas progressed slowly. New office building in Louisville, Colorado, was finalized.
Vantaa (head office)production facility and R&D
EspooR&D
Paris (Saclay) production facility and R&D
Shanghai R&D
Boulder (Louisville, CO) production facility and R&D
25+offices
16countries
36%of net sales
293employees
APACOrders received and net sales decreased compared to the previous year. In Industrial Measurements business area, development was positive. Large projects in Vietnam and Australia were completed.
29%of net sales
172employees
EMEAOrders received decreased due to lack of new large project orders in MEA, and this was reflected in net sales. In Europe, both orders received and net sales developed positively. EMEA increased its share of Vaisala’s total net sales and was as big as Americas. New R&D building in Vantaa, Finland, was finalized.
1,446employees
35%of net sales
4
Seattle and Vancouver R&D

5
2020 – a remarkable year to remember Vaisala’s work towards its mission Observations for a better world continued throughout the year, marked by the global fight against the COVID-19 pandemic.
For several reasons, the year 2020 will go down in history. As we write this annual review, the content looks rather different than what we anticipated in the beginning of 2020. The global COVID-19 pandemic has impacted societies, organizations, and – above all – people and families across the world. Vaisala was no exception.
Vaisala’s main priority during the pandemic was to ensure business continuity while at the same time secure the health and well-being of our employees globally. Many of our employees started working remote ly to ensure both their own safety and a safe working environment for those colleagues whose roles required presence in Vaisala premises. Furthermore, our teams developed several new ways of serving our customers virtually. Two good examples include remote Factory Acceptance Tests and augmented reality (AR) customer service.
The year 2020 was twofold. Even though it was challenging in many ways, Vaisala’s overall performance was good. The restrictions brought by the COVID-19 pandemic slowed down order intake, whereas we could see how trust in the global economy recovered in the second half of 2020. Despite the fluctuating demand, we managed to keep up our profitability and maintain our global delivery capability. This would not have been possible without the flexibility and innovativeness of our 1,900 experts globally. Therefore, we want to take this opportunity to thank the Vaisala team for its dedication, effort, and support through-out the year.
In addition to combating the COVID-19 pandemic in our own business operations, we contribute to the fight with several of our products. These comprise our continuous monitoring system used, for example, for monitoring vaccine development, production, and storage facilities as well as other instruments, such as our probes for measuring hydrogen peroxide vapor and utilized for sterilization of devices and spaces, such as laboratories. The examples illustrate well the important, needed, and continuously growing role that reliable measurements play in tackling major global societal and environmental challenges.
On a quest for a sustainable futureThe COVID-19 pandemic has been a major part of a larger global megatrend: well-being and health. Our business is additionally intertwined with several other megatrends affecting our planet. These include, for example, climate change, digitalization, urbanization, resource efficiency, and circular economy.
We continue our commitment both to the UN Global Compact as well as to those UN Sustainable Development Goals (SDGs) that hold the highest relevancy for Vaisala. In 2020, we took important steps to further integrate these SDGs into our business plans and product devel-
Raimo Voipio, Chairman of the Board of Directors Kai Öistämö, President and CEO

6
As the global market leader in weather, environmental, and
industrial measurements, we see that the requirements for accurate and reliable data will only increase, serving as a source for new growth
and innovation opportunities.
opment. In both of our business areas, sustainability and addressing the global megatrends are key elements.
Through our products and solutions, we help customers to make informed decisions and act upon the greatest challenges of our time. They can understand, adapt to, and mitigate climate change as well as save energy and natural resources.
Moreover, we strive to continuously improve sustainability in our own business practices. We are proud to say we reached our target of utilizing 100% renewable electricity in our premises by the end of 2020, which demonstrates our dedication to environmental sustainability in our business. Furthermore, we are committed to respecting human rights, promoting diversity and equality, ensuring occupational health and safety, and preventing corruption. This commitment includes both our own operations and our network of global partners.
Year of proven technological achievementsDuring the year, Vaisala launched new products both in the Weather and Environment as well as Industrial Measurements business area, including openings in the digital realm. The key launches of the year are presented in the Highlights chapter of this annual report.
In July 2020, technology by Vaisala and the Finnish Meteorological Institute once again took off to space and headed towards Mars. Our technology is known to be reliable and accurate also in the most demanding conditions. It is an honor that our pressure and relative humidity sensors, utilized in a multitude of applications on Earth, have been selected for planetary exploration to provide information on the conditions of the Red Planet.
Moreover, Vaisala’s multigas instrument MGP261 for the biogas industry, launched in 2019, was awarded in the Finnish Quality Innovation Awards in November 2020. The instrument measures biogas quality and improves biogas energy production significantly. Winning the Circular economy and carbon neutrality innovations category, this serves as a strong example of our commitment to new innovations that contribute to a more sustainable future.
The foundation for our reliable and accurate products and technolo-gies lies in our science-based approach and strong investments in R&D and innovation. In 2020, we invested 14% of our net sales in R&D. As we enter 2021, our new state-of-the-art innovation center in Vantaa is
opening its doors for ideation and co-creation by our R&D employees, customers, and partners. We are curious and excited to see what new inventions this will bring.
Towards future growth and innovationsThroughout its history of 85 years, Vaisala has been a forerunner in science-based innovations. As the global market leader in weather, environmental, and industrial measurements, we see that the require-ments for accurate and reliable data will only increase, serving as a source for new growth and innovation opportunities.
We are committed to finding novel ways of making our planet safe and sustainable for future generations, continuing our high investments in R&D and strong collaboration with scientific community, customers, and other partners.
Closing this remarkable year, we want to thank our employees, customers, partners, and other stakeholders for their valuable contribution and collaboration in 2020. We look forward to writing the next chapters of Vaisala’s story together with you.
Kai ÖistämöPresident and CEO
Raimo VoipioChairman of the Board of Directors
Change of President and CEOIn late 2020, Kjell Forsén handed over the responsibility as President and CEO of Vaisala after 14 successful years in the company to his successor, Kai Öistämö. Öistämö joined the company on October 1, 2020.
On behalf of the Board of Directors, I want to once more thank Kjell Forsén for his valuable contribution to significantly develop and grow the Vaisala business.
- Raimo Voipio, Chairman of the Board of Directors

7
Kai Öistämö was appointed as Vaisala’s new President and CEO and started in his position on October 1, 2020. Vaisala’s previous President and CEO Kjell Forsén stepped down from the position after 14 notable years.
Read more vaisala.com/annualreport
Highlights of the yearQ1 Q2
Our solutions were brought to use in the fight against the COVID-19 pandemic. Our measurement instruments and solutions help customers in vaccine development as well as in the bio-decontamination of laboratories and other research spaces.
Read more vaisala.com/annualreport
We launched the new Vaisala Mobile GRF/TALPA Reporter for airports. The system delivers accurate and reliable data of runway condition, enabling efficient runway assessment and reporting in compliance with ICAO regulation.
Read more vaisala.com/annualreport
We unveiled the durable Indigo520 transmitter to enable world-class data and smart decisions also in high-end industrial applications, such as pharmaceutical factories and industrial drying applications. It is part of the modular Indigo product family and can accommodate two probes.
Read more vaisala.com/annualreport
We introduced the new cloud-based Vaisala Jade Smart Cloud system for monitoring humidity and temperature. The wireless system is the ideal solution for museums and data centers, for example, as well as for measuring structural moisture at construction sites.
Read more vaisala.com/annualreport
We launched Vaisala Wx Horizon that gathers, analyzes, and visualizes real-time road weather data from different sources, such as mobile sensors on vehicles.
Read more vaisala.com/annualreport

8
Perseverance Rover was launched towards Mars, carrying Vaisala’s HUMICAP and BAROCAP sensor technologies. Our technology is at the heart of the humidity and pressure sensors, developed by the Finnish Meteorological Institute. The rover gathers information on the Martian atmosphere after landing on the planet in February 2021. Image: NASA/JPL-Caltech
Read more vaisala.com/annualreport
We brought a unique method for detecting air ingress in sealed power transformers to the market. The method, based on measuring total pressure of all dissolved gases in the insulation oil, helps customers detect and repair air leaks early. This can lead to significant cost savings.
Read more vaisala.com/annualreport
We started to deliver real-time, comprehensive weather data to new Hyundai Motor Company vehicles. The digital Vaisala Infotainment Weather service provides drivers with essential information on weather and driving conditions through the vehicle infotainment system.
Read more vaisala.com/annualreport
Q3
As a member of the RE100 initiative, we achieved our target to utilize 100% renewable electricity in our facilities by the end of 2020. We were able to achieve the goal within the set timeframe with a combination of self-produced clean energy and green electricity from local energy companies.
Read more vaisala.com/annualreport
Q4
We expanded our premium Indigo product range with the HMP1 probe for high-end humidity and temperature measurements. It provides the best measurement performance in critical production and storage facilities as well as other environments that require strict humidity monitoring and control with easy maintenance.
Read more vaisala.com/annualreport

1011121416
StrategyBusiness modelWeather and Environment business areaIndustrial Measurements business areaOperations
Our business

10
OUR YEAR SUSTAINABILITYCREATING VALUE GOVERNANCE FINANCIALS
Strategy
Weather and EnvironmentGlobal leadership based on best products and solutions
Industrial MeasurementsGrowth through product leadership
We drive excellence in high-mix, low-volume businesses.
Reliability Application expertise
Science-based technology leadership
Engaged & talented people
Vaisala Production System
Strong financial position Partnerships
Sustainability
Our customer value is built on reliability, science-based technology leadership, industry expertise, engaged and talented employees, as well as strong partnerships. We drive excellence also in the future by focusing on great leadership, continuous learning, and Lean thinking. Furthermore, our strategy work is driven by our values as well as global megatrends that affect our operating environment and provide opportunities for growth. Read more about megatrends on page 22.
Our values guide us
Customer focus We strive for deep understandingof our customers’ needs and aim atmeeting them in everything we do.
Innovation and renewal We embrace pioneering innovationand drive change through continuousimprovement and learning.
Strong together We excel by sharing, learning, andworking together with each otherand our stakeholders.
Integrity We are honest, respectful, and reliable.We promote sustainable and ethicalbehavior.
We build our success on

11
OUR YEAR SUSTAINABILITYCREATING VALUE GOVERNANCE FINANCIALS
Business modelPartners Activities
Products and technologies
• Key customers
• Meteorological institutes
• Distributors
• R&D partners
• Universities and research organizations
• Manufacturing partners
• Suppliers and sub-contractors
• Research and development
• Sales and marketing
• Sensor production
• Manufacturing
Delivery models
1. Product shipments2. System projects, including
installations, testing, and training3. Services, including calibration,
maintenance, and digital solutions
• Large and leading product portfo-lio based on proprietary technolo-gies and technological expertise
• Measurement sensors and instruments, systems, software, digital solutions, and services for measuring weather, environment, and industrial conditions and processes
* Our 300 product families include approximately 9,000 products.
Customer segmentsResources
Sales channel
Cost structure Revenue streams
• Application expertise
• Engaged and talented people
• Vaisala Production System
• In-house cleanroom
• Science-based technology leadership
• Strong financial position
Direct global sales
• Sales organization in approx. 20 countries
• E-commerce
Wide customer base covering public and private sector customers
WEATHER AND ENVIRONMENT
MeteorologyAviationGround transportationRenewable energy
INDUSTRIAL MEASUREMENTS
High-end humidityHigh-end carbon dioxideContinuous monitoring systemsLiquid measurementsPower and biogas
• R&D investments 14% of net sales
• Personnel costs 154.1 MEUR
• Material costs 108.2 MEUR
• Asset-light business model
• Capital expenditure 31 MEUR
Distribution network
• Distributors and agents in over 100 countries
• Retailers
Products: 70% of total salesProjects: 16% of total salesServices: 14% of total sales
Net sales 379.5 MEUREBIT 44.8 MEUR
Customers in over 150 countries
Value propositions
Reliable, high-quality measurements and
observations for decision-making, safety, and efficiency
Global technology and
market leader in weather, environmental, and high-end
industrial measurements
Excellence in high-mix, low-volume businesses
Solid dividend payer
EMEA 35%
AMERICAS 36%APAC 29%
• Thin-film sensors, infrared gas sen-sors, optical liquid sensors, optical weather and process sensors, and radio frequency technologies
• 300 product families*

12
OUR YEAR SUSTAINABILITYCREATING VALUE GOVERNANCE FINANCIALS
Weather and Environment business areaThe customers of Vaisala’s Weather and Environment business area focus on people’s safety, protection of property, sustainability, and efficient processes, utilizing reliable measurements and decision support systems in all weather conditions. The customers include, among others, meteorological institutes, airports, road operators, and energy companies.
Weather and Environment business area strives for profitable growth by expanding its product and decision support systems portfolio. The main markets are meteorology, aviation, ground transportation, and renewable energy. The business area seeks growth in large meteorological infrastructure projects, software and data services, new customers segments, as well as environmental measurements.
Product categories
• Radiosondes and sounding systems
• Pressure, temperature, and humidity sensors as well as wind sensors
• Visibility and present weather sensors
• Ceilometers
• Remote wind sensing instruments
• Lightning sensors
• Weather stations
• Weather radars
• Air quality sensors
• Road state sensors
Digital decision support systems for
• Transportation
• Lightning observations
• Renewable energy
• B2B weather services
• Smart cities
Partners
• Customers
• Meteorological institutes
• Governmental organizations
• Universities
• Research organizations
Aviation
Renewable energy
Main markets
Meteorology
Ground transportation

13
OUR YEAR SUSTAINABILITYCREATING VALUE GOVERNANCE FINANCIALS
We help our customers to
• prepare for increasing extreme weather events
• ensure the functionality of critical transportation infrastructure
• enhance the production of growing renewable energy
• optimize weather-dependent commercial operations
• make well-informed decisions
Growth through expansion
• Strengthening our position in weather observation products
• Large meteorological infrastructure development projects
• Digital decision support systems
• New business in environmental measurement markets
Competitive advantage
• Science- and application know-how- based technology leadership
• Comprehensive solutions from sensors to analytics
• Reliable partner for creating value throughout the product life cycle
In order to ensure their operation, societies and companies need solutions that are based on reliable measurements and impact modelling. Due to extreme weather and air quality challenges, the need for comprehensive solutions in weather and environmental measurements continues to grow.
Jarkko SairanenEVP, Weather and Environment
MEUR Meteorology TransportationRenewable
energyAmbient
air quality
Market size* 450–500 300–350 250–300 150–200
Market growth p.a.** 0% 0–5% 10% 5%
Vaisala market share 2020 High High Mid Low
Market size total ~1,300 MEUR / ~20% market share
Market share indication: Low < 10%, Mid 10–25%, High > 25%
* Vaisala estimate of the size of the market that is addressable currently or with organic development of the business
** Market growth rounded to a whole number divisible by 5.
Global market sizes and growth
Weather and Environment business area

14
OUR YEAR SUSTAINABILITYCREATING VALUE GOVERNANCE FINANCIALS
Power
High-end carbon dioxide
Liquid measurements
Industrial Measurements business areaThe Industrial Measurements business area has a strong position in its flagship high-end humidity and carbon dioxide measurement markets. We aim to gain momentum in our growth markets: continuous monitoring systems, liquid measurements, and power markets. Additionally, we seek to expand by identifying new growth markets.
Industrial Measurements trusts its product leadership strategy, based on continuous investment in research and development according to customer needs. The business area expands its product portfolio to cloud-based measurement solutions and focuses on strengthening customer experience and service business.
Main markets
High-end humidity
Continuous monitoring systems
Product categories
• Industrial instruments: The product area serves multiple industries and applications. Key products are instruments optimized for measuring high-end humidity and carbon dioxide as well as hydrogen peroxide vapor.
• Continuous monitoring systems: The most important applications are strictly regulated GxP environments. These are strictly regulated manu-facturing and production environments in different industries, such as laboratories, cleanrooms, and warehouses. The product category provides solu-tions for measuring temperature, humidity, carbon dioxide, dew point, differential pressure, and other critical parameters.
• Liquid measurements: The core industries are, for example, the semiconductor industry, pulp and paper, as well as food and pharmaceutical indus-tries. The process refractometers, developed for industrial processes, measure the dissolved solids in liquids.
• New markets (power and biogas): The product area serves the development of the energy sector by offering measurement solutions for the power and biogas industries. The most important instru-ments are the multigas DGA monitors, developed for continuous monitoring of high voltage power transformers, and products for biogas process optimization.

15
OUR YEAR SUSTAINABILITYCREATING VALUE GOVERNANCE FINANCIALS
MEURIndustrial
instruments
Continuousmonitoring
systemsLiquid
measurements
New markets: power and
biogas
Market size* 600–700 150–200 80–100 220–270
Market growth p.a.** 5% 10% 5% 10%
Vaisala market share 2020 Mid Mid Mid Low
Market size total ~1,200 MEUR / ~10% market share
Market share indication: Low < 10%, Mid 10–25%, High > 25%
* Vaisala estimate of the size of the market that is addressable currently or with organic development of the business.
** Market growth rounded to a whole number divisible by 5.
Global market sizes and growth
Despite the world-changing pandemic, we continued to grow thanks to our sales picking up at the end of the year. Orders increased especially in industrial instruments, monitoring systems aimed for health technology, as well as solutions for power transformer condition monitoring.
Sampsa LahtinenEVP, Industrial Measurements
Industrial Measurements helps customers to improve
• product quality
• productivity
• energy efficiency
• maintenance activities
• regulatory compliance
Partners
• End-users
• Original equipment manufacturers
• Integrators
• Distribution network
• Research and development partners
• Manufacturing partners and suppliers
Competitive advantages
• Science- and research-based technology leadership combined with strong application expertise
• Best customer experience
• Fast delivery times
• Global sales and services network
Industrial Measurements business area

16
OUR YEAR SUSTAINABILITYCREATING VALUE GOVERNANCE FINANCIALS
Vaisala Operations manufactures products for both business areas and develops operational excellence in high-mix, low-volume supply chain. The command of a large product portfolio without compromising quality has always been Vaisala’s core strength. The basis lies in Vaisala Production System.
The threefold Production System incorporates a Lean manage ment system, systematic improvement, and standardized ways of working. In addition, Operations’ strategy is guided by strategic choices: in-house manufacturing of key technologies and partnership-based sourcing.
Operations focus areas in 2020In the previous productivity program, we aimed to increase productivity by 20 percentage points in comparison to 2016, and we achieved this great target by the end of 2019. In 2020, we shifted our develop ment focus to improving our supply chain. We also continued to integrate the operations of Leosphere, acquired in 2018.
The strategic development areas in 2020 were:• further development of Vaisala Production System• improving the product development process together with research
and development• supply chain quality improvement• Intelligent Factory project for identifying and adopting new technologies
Operations
over
500 production equipment
over
450 suppliers
300 product families 57,000 different components
More than 930 engineering changes in products
to customers in over
150 countriesannually More than 1,000
shipments weekly
4 factories
Product life cycles of even over
20 years
Despite the COVID-19 pandemic in 2020, we managed to continue operations and keep up our excellent delivery capability. This achievement was greatly thanks to our Operations employees, whose health and safety were taken care of during the year. This guarantees a strong position for us also in the future.
Vesa PylvänäinenEVP, Operations
Operations in numbers 2020

182021222425272935
Creating valueUN Sustainable Development Goals Value creation modelDashboardMegatrendsStakeholder engagementValue for customersValue for employeesValue for society and the environmentValue for investors

18
OUR YEAR SUSTAINABILITYCREATING VALUE GOVERNANCE FINANCIALS
UN Sustainable Development Goals
UN Sustainable Development Goal (SDG)
The most relevant UN SDG targets for Vaisala Vaisala’s solutions Read more
13.1 Strengthen resilience and adaptive capacity to climate- related hazards and natural disasters in all countries.
13.3 Improve education, awareness -raising, and human and institutional capacity on climate change mitigation, adaptation, im-pact reduction, and early warning.
Reliable weather measure-ments and observations of climate change
Meteorological infrastruc-ture development projects
Measuring hurricanes with dropsondes
Megatrends: Climate change
Value for customers: Quality
Value for society and the environment
7.2 By 2030, increase the share of renewable energy in the global energy mix substantially.
7.3 By 2030, double the global rate of improvement in energy efficiency.
Optimizing wind and solar power production
Megatrends: Renewable energy
Value for customers
11.2 By 2030, provide access to safe, affordable, accessible, and sustaina-ble transport systems for all.
11.6 By 2030, reduce the adverse per capita environmental impact of cities, including by paying special attention to air quality.
Improving the safety of transport systems
Air quality measurement networks
Highlights of the year
Megatrends: Resource efficiency and circular economy, Green and smart cities, Future of mobility, Digitalization
Value for society and the envi-ronment: Resource efficiency
Sustainable solutions
Weather and Environment business areaUN Sustainable Development Goal (SDG)
The most relevant UN SDG targets for Vaisala Vaisala’s solutions Read more
9.4 By 2030, upgrade infrastruc-ture and retrofit industries to make them sustainable, with increased resource-use efficiency and greater adoption of clean and environ-mentally sound technologies and industrial processes.
Improving resource efficiency with industrial measurement solutions
Highlights of the year
Megatrends: Climate change, Resource efficiency and circular economy, Green and smart cities
Value for customers
Value for society and the envi-ronment: Resource efficiency
7.2 By 2030, increase the share of renewable energy in the global energy mix substantially.
7.3 By 2030, double the global rate of improvement in energy efficiency.
Improving energy effi ciency in industrial processes
Improving energy efficiency in buildings by demand-controlled ventilation
Biogas production process optimization
Megatrends: Renewable energy, Smart energy distribution and consumption, Green and smart cities, Digitalization
Value for customers: Productivity
Value for society and the envi-ronment: Resource efficiency, Safety
3.8 Achieve universal health coverage, including financial risk protection, access to quality essential health-care services, and access to safe, effective, quality, and affordable essential medicines and vaccines for all.
Monitoring of con-ditions in medicine manufacturing, storing, and supply chains
Monitoring of conditions in hospitals and laboratories
Highlights of the year
Megatrends: Well-being and health, Digitalization
Value for customers: Quality
Value for society and the environment
Industrial Measurements business area
In 2020, we continued developing our business and practices in line with the UN Sustainable Development Goals that are the most relevant for Vaisala. Solutions that benefit society and the environment have always been at the core of our business. Integrating the goals to our strategy work helps us to better assess our impacts on sustainable development and get inspiration for developing new business and sustainable practices.

19
OUR YEAR SUSTAINABILITYCREATING VALUE GOVERNANCE FINANCIALS
UN Sustainable Development Goals (SDG)
The most relevant UN SDG targets for Vaisala
Vaisala’s business practices Indicators Read more
12.2 By 2030, achieve the sustainable management and efficient use of natural resources.
12.4 Achieve environmen-tally sound management of chemicals and all wastes throughout their life cycle, in accordance with agreed in-ternational frameworks, and significantly reduce their release to air, water, and soil in order to minimize their adverse impacts on human health and the environment.
12.5 By 2030, reduce waste generation substantially through prevention, reduc-tion, recycling, and reuse.
Design for the environ-ment and long product life cycles
Enabling safe use and end-of-life processing of products
Increasing the recycling rate
% of employees working on ISO 14001 certified sites
Recycling rate
Environment: Envi-ronmental manage-ment, Waste, Sustain-able product design and management
7.2 By 2030, increase the share of renewable energy in the global energy mix substantially.
7.3 By 2030, double the global rate of improvement in energy efficiency.
Using renewable electricity
Improving energy effi-ciency in our facilities
% of renewable electricity
Energy use and energy intensity
Scope 2 emissions
Highlights of the year
Environment: Energy and emissions
13.3 Improve education, awareness-raising, and human and institutional capacity on climate change mitigation, adaptation, impact reduction, and early warning.
Decreasing indirect emissions for example from commuting
Raising awareness of climate change and encouraging personnel’s climate -friendly choices
Scope 3 emissions Value for society and the environ-ment: Active community outreach and scientific collaboration
Environment: Environ mental man-agement, Energy and emissions
Sustainable business practicesUN Sustainable Development Goal (SDG)
The most relevant UN SDG targets for Vaisala
Vaisala’s business practices Indicators Read more
8.1 Sustain per capita economic growth in accordance with national circumstances.
8.7 Take immediate and effective measures to eradicate forced labour, end modern slavery and human trafficking, and by 2025 end child labor in all its forms.
8.8 Protect labour rights and promote safe and secure working environ-ments for all workers.
Positive economic impact on communi-ties through employ-ment and taxes, both directly and through supply chain
Upholding labor standards and occupa tional health and safety as well as managing human rights risks in our own operations and partner network
Economic value generated and distributed
% of suppliers rated with ESG metrics and suppliers that have signed the Supplier Code of Conduct
Total Recordable Injuries rate (TRI), Proactive reports, Employees in health and safety committees
Value for society and the environ-ment: Economic value
Ethics and compli ance: Respect for human rights, Conflict minerals
Responsible supply chains
Occupational health and safety
10.3 Ensure equal opportu-nity and reduce inequalities of outcome, including by eliminating discriminatory laws, policies, and practices and promoting appropriate legislation, policies, and action in this regard.
Promoting diversity and providing equal opportunities, for ex-ample, in recruitment and development opportunities
Gender distribution (All/ Supervisor/ Manage ment/ Board)
Equality in remuneration
Personnel: Diversity and equality
16.5 Reduce corruption and bribery in all their forms substantially.
Ensuring compliance with our International Anti-Corruption Policy
% of employees completed the Code of Conduct training
Ethics and compliance: Prevention of corruption and bribery
UN Sustainable Development Goals

20
OUR YEAR SUSTAINABILITYCREATING VALUE GOVERNANCE FINANCIALS
Value creation model
LUOTETTAVUUS
APPLICATION EXPERTISE
ENGAGED AND TALENTED PEOPLE
VAISALA PRODUCTION SYSTEM
SCIENCE-BASED TECHNOLOGY LEADERSHIP
PARTNERSHIPS
STRONG FINANCIAL POSITION
SUSTAINABILITY
Our mission
InvestorsResponsible returns
CustomersReliable decisions,
productivity,quality
EmployeesPurposeful work,
well-being,learning
Society and the environment
Direct impact:Economic value,
active communityoutreach and scientific
collaboration
Indirect impact:Better-informed
societies,resource efficiency,
safety
Our fundamentals Value created
Observations for a better world
We create value in continuous interaction with our stakeholders. Our business leaves a positive handprint on society especially through our customers. With our solutions they can make reliable decisions and improve their productivity and processes in the areas of weather and environment as well as industrial measurements. This way we are also able to have an impact on current challenges, related to different megatrends, and contribute to the United Nations’ Sustainable Development Goals by increasing awareness, resource efficiency, and safety in societies.
CLI
MA
TE C
HANGE R
ESOURCE EFFICIENCY AND CIRCULAR ECONOMY RENEWABLE ENERGY SMART ENERGY DISTRIBUTION AND CON
SUM
PTION
GREEN AND SMART CITIES FUTURE OF MOBILITY WELL-BEING AND HEALTH DIGITALIZATION
RELIABILITY

21
OUR YEAR SUSTAINABILITYCREATING VALUE GOVERNANCE FINANCIALS
DashboardOur fundamentals Topic Performance 2020 Target
ReliabilityVaisala Production SystemPartnerships
On-time delivery accuracy (OTD)* 94.6% (94.8%) 96%
Product and delivery nonconformity rate 2.2% (1.7%) Continuous reduction
Engaged and talented peopleEmployee Engagement Index 4.23/5 (4.12/5) > 4.00/5
Learning Index 3.88/5 (3.84/5) > 4.00/5
Science-based technology leadershipApplication expertise
R&D investments, % of net sales 14% (13.1%) Over 10% of net sales
Strong financial position
Net sales growth year-on-year -6% (16%) > 5% growth year-on-year
EBIT % of net sales 11.8% (10.2%) > 12%
Return on equity (ROE) 16.3% (17.7%)
Earnings per share (EPS), euros 0.91 (0.94)
Sustainability
Greenhouse gas emissions (Scope 1–3) in relation to net sales 33.9 tonnes CO₂e/ MEUR (47.1 tonnes CO₂e/MEUR) Continuous reduction
Carbon footprint reduction, Scope 2 97% from 2014 baseline (90%) > 90% by 2020
Renewable electricity of Group consumption 100% (93%) 100% by 2020
Waste recycling rate 59% (53%) Continuous improvement
Total recordable injuries rate (TRI) 2.0 injuries per million working hours (2.6) Continuous reduction
Suppliers scored for ESG metrics, % of spend 83% (82%) Continuous improvement
* Does not include Leosphere, acquired in the fall of 2018.

22
OUR YEAR SUSTAINABILITYCREATING VALUE GOVERNANCE FINANCIALS
Global megatrends are transformational shifts that provide both a source of innovation and opportunities for growth for Vaisala. We constantly assess markets and technologies to find new ways to engage with these megatrends. Together with our customers, we create solutions to the pressing societal, environmental, and industrial needs and challenges posed by these megatrends.
Megatrends
CLIMATE CHANGE
Climate change increases extreme weather and
creates a chain of societal, environmental, and
economic effects. Vaisala helps customers to
establish weather observation networks and
build up capabilities to improve their capacity
to predict extreme weather. We help nations
to observe climate change and become more
resilient to its impacts with first-rate environ mental
observations, forecasting, and early warning
systems. We support the scientific community in
increasing knowledge of climate change. Vaisala’s
instruments can also be used to measure carbon
sequestration of natural carbon sinks.
Vaisala’s measurement instruments offer
industrial customers better visibility into their
processes. Precise and reliable measurement
data enables them to make choices that enhance
production process efficiency as well as decrease
emissions and thus also the carbon footprint of
end-products.
RESOURCE EFFICIENCY AND CIRCULAR ECONOMYVaisala’s measurement instruments make
production more efficient, improve productivity,
as well as help to decrease the loss of materials
and save both energy and natural resources.
Our durable and long-lasting instruments enable
industrial customers to optimize their processes,
resource efficiency, and end-product quality.
With Vaisala’s road weather solutions, road
transportation customers plan and allocate
maintenance resources, such as maintenance
routes and de-icing during winter, as well as
evaluate the need for pavement repairs in the
road network.
RENEWABLE ENERGY
Various forms of clean and renewable energy are
becoming increasingly competitive and common
and help to mitigate climate change. Vaisala’s
measurement technologies help to make wind
and solar power plants even more efficient.
Accurate measurements enable our customers
to select the optimal site for their wind parks,
for example, as well as monitor, predict, and plan
operations. Weather observations can also be
utilized to optimize hydroelectric power plants.
Biogas provides significant opportunities for
industrial needs and transportation. Vaisala’s
measurement solution for biogas process
optimization helps to generate more value from
waste by decreasing production costs and
increasing the efficiency of the biogas plant.
Vaisala’s products enable also the optimal
performance of fuel cells in the hydrogen
economy.
SMART ENERGY DISTRIBUTION AND CONSUMPTIONGlobal energy demand is increasing: to meet the
future needs, production and consumption of
energy needs to become more efficient. Vaisala’s
measurement technologies help to optimize many
industrial processes, improving energy efficiency
and operations in a multitude of energy intensive
industries. The energy efficiency of buildings is
also enhanced with measurements of humidity,
carbon dioxide, and temperature, as ventilation is
adjusted based on the demand.
In power production, Vaisala supports smart
electricity grids with lightning detection networks
and online condition monitoring of power
transformers. With Vaisala’s devices and precision
weather forecasts, energy demand can also be
anticipated, enabling further optimization of
energy distribution and production.

23
OUR YEAR SUSTAINABILITYCREATING VALUE GOVERNANCE FINANCIALS
GREEN AND SMART CITIES
As population, traffic, and finance concentrate
increasingly in the same areas, it affects the
conditions and weather dependency in cities.
Vaisala provides reliable instruments, systems, and
digital solutions to measure and model air quality,
road weather, as well as urban weather and micro-
climates. This helps smart cities to overcome their
challenges with urbanization and make informed
decisions regarding sustainability, economic growth,
safety, and well-being.
We offer diverse and advanced measurement
technologies for buildings, industrial environments,
and automatized industrial processes. Such environ-
ments include, for example, smart buildings, subway
networks, industrial hubs, and large manufacturing
facilities. In addition, we support sustainable
construction in cities: Vaisala’s smart and wireless
solution monitors the structural moisture of con-
crete and saves the data safely in a cloud service,
provided by Vaisala.
FUTURE OF MOBILITY
Automation, digitalization, and innovative
energy sources change traffic and the modes of
transportation. Vaisala provides solutions that
combine measurement technologies, computer
vision, weather forecasts, and open data, thus
delivering relevant information to the operators
and users of road infrastructure. Based on that
data, they can make suitable decisions and
ensure the safety and efficiency of road, rail, sea,
and air transport. Furthermore, Vaisala provides
cars’ navigational systems with weather data that
will be essential also for autonomous vehicles
and drones in the future.
In addition, Vaisala’s solutions enable the use
of high-quality fuel cells, lithium batteries, and
biogas as the energy source of vehicles.
WELL-BEING AND HEALTH
By monitoring environmental indoor and outdoor
conditions, people’s health and well-being can
be secured. Vaisala’s solutions help to ensure
safe and healthy living, working, and production
conditions inside buildings. Accurate and reliable
monitoring of prevailing conditions is particularly
important, for example, in laboratories and hospi-
tals as well as in the cold storages and incubators
in these buildings. Our solutions are also used
to monitor the development and manufacturing
conditions in the strictly regulated pharmaceu-
tical industry and supply chains as well as in the
biodecontamination of spaces and equipment.
Outdoors, Vaisala’s ambient air quality sensors
monitor urban environments and provide data
for better decision-making to improve health and
quality of life.
DIGITALIZATION
Digitalization transforms ways of working and
provides Vaisala with the opportunity to offer SaaS
services. Weather observation networks provide
data for governmental organizations, research
organizations, and the public. Air quality and
weather sensors can be connected seamlessly to
the needs of smart cities, new data sources, and
IoT technologies. Our computer vision application
optimizes road maintenance and provides data for
autonomous vehicles. By fusing artificial intelli-
gence, machine learning, and different data sources,
we help customers to optimize their operations
based on weather and environmental conditions.
In the industrial business, we offer interfaces for our
customers’ systems, enabling reliable data transfer
between systems and smooth process control. In
the strictly regulated pharmaceutical industry, digi-
tal records and reporting provide improvements for
our customers’ operations and regulated reporting.
Vaisala’s instruments monitor also the conditions
and energy efficiency in data centers.
Megatrends

24
OUR YEAR SUSTAINABILITYCREATING VALUE GOVERNANCE FINANCIALS
Stakeholder engagement
In 2020, meetings and communication with employees and other stake holder groups were largely organized in digital communication, sales, and marketing channels due to the COVID-19 pandemic. For instance, the Annual General Meeting for shareholders as well as other investor and analyst meetings were held virtually.
We identify and evaluate our stakeholders as part of our sustain-ability management and preparatory work for strategy updates. The stakeholder analysis and materiality assessments are typically updated annually. The process can be an internally conducted update, or it can involve surveying or interviewing key stakeholders.
We determine the impact of various stakeholders on the company and analyze how our actions in turn affect them. We maintain a constant dialogue with our most important stakeholders and actively seek partnerships and joint opportunities with customers, suppliers, academia, research institutes, and other parties.
Our stakeholders influence the future of our business, and we work in an open and continuous interaction with them.
Description Main activities
Thousands of private and public sector customers in more than 150 countries
Distributors in more than 100 countries
• Continuous customer relationship development and
management, e.g. in online channels, meetings, events,
and exhibitions
• Ongoing online surveys on customer training and field
services operations as well as on technical support and
services
Over 1,900 professionals globally • Learning and career development opportunities
• Monitoring employee satisfaction and well-being
• Active internal communications
Universities and research collaborators, meteorological institutes, manufacturing partners and suppliers, governments and regulators, local communities, the media, and the public
• Partnerships and collaboration with academic and
scientific institutions
• Scholarships and donations
• Close cooperation with our global supply chain
• Sharing expertise with external organizations and
decision-makers
• Raising awareness of environmental issues among experts
and the public
• Continuous improvement of media relations, press
releases, and activity in social media
Major shareholders include descendants of the founder Professor Vilho Väisälä, Novametor Oy, Finnish pension funds and other financial institutions, the Finnish Academy of Science and Letters, and private households. Ownership outside Finland and nominee registrations amounted to 19.3% of shares on December 31, 2020.
• Quarterly result presentations and Q&A for investors,
analysts, and the media
• Annual General Meeting
• Stock exchange releases
• Roadshows, investor and analyst meetings and confer-
ence calls
Customers
Employees
Society and the environment
Owners and investors

25
OUR YEAR SUSTAINABILITYCREATING VALUE GOVERNANCE FINANCIALS
Value for customersVaisala’s technologies and solutions help safeguard life and property, while enabling critical decision-making that facilitates productive, efficient, and high-quality operations. By measuring the environment or a process accurately, our customers can make more reliable decisions and ensure more efficient, safer, and more sustainable operations in any application area.
Reliable decisionsWe enable our customers to make reliable decisions based on accurate environmental observations. For example, investments in wind energy production are based on reliable data on wind conditions and wind field performance. Our remote wind sensing solutions as well as our data services help customers to make profitable investments and decisions. With our solutions, they are able to select the best possible location for efficient wind energy production, monitor profitability as well as increase the performance of their wind park.
With Vaisala’s measurement instruments, industrial customers can optimize their processes to achieve the best result. For example, in many industrial drying applications, reliable humidity measurement data helps to adjust drying conditions to the optimal level as well as ensure end-product quality and energy efficiency.

26
OUR YEAR SUSTAINABILITYCREATING VALUE GOVERNANCE FINANCIALS
Vaisala launched Windcube Insights software for its Windcube Nacelle customers
Vaisala’s Indigo520 transmitter improves control of malting process
Windcube Nacelle is a lidar, mounted on the nacelle of a wind turbine. The new WindCube Insights analytics software provides customers with accurate and open data through a web service, which enables them to make sure that their wind farms are performing efficiently.
Read morevaisala.com/annualreport
Vaisala’s Indigo520 transmitter helps the high-quality malt producer Viking Malt to monitor humidity conditions inside the malting process. By adjusting moisture, the high quality and compliance of products are ensured. In addition, continuous monitoring enables them to save costs.
Read morevaisala.com/annualreport
Case Case
Value for customers
ProductivityVaisala’s solutions improve the cost efficiency of our customers’ operations as well as increase productivity. For instance, Vaisala’s innovative MGP261 multigas instrument for the optimization of biogas process enables biogas plants to generate more value from waste. The instrument measures humidity, methane, and carbon dioxide directly from the production process. In 2020, the instrument won a Finnish innovation competition.
Vaisala’s automatic sounding systems enable flexible remote soundings, reducing costs. The systems make it possible to carry out automatic soundings for one month at a time, relieving resources for critical weather forecasts. Thanks to these sounding systems, national weather services can extend the coverage of their upper-air networks to geographically hard-to-reach locations. In January 2020, Vaisala finalized a sounding project with NOAA (National Oceanic and Atmospheric Administration) in the remote and challenging Alaska.
QualityHigh-quality products and services have always been at the core of V aisala, but it is equally important to us that our customers can ensure the quality of their own end-products and operations with the help of our technologies and expertise. For example, Vaisala’s weather observing systems provide reliable and comparable observations that likewise support reliable weather forecasts and climate projects.
Accurate monitoring of industrial processes and test chambers helps to guarantee high-quality products. For instance, in the food industry as well as the pharmaceutical industry, liquid concentrations need to be measured in every batch in each factory to ensure even quality. The process refractometer, developed for industrial liquid measurements, provides our customers with accurate digital data on the liquid concen-tration and thus indicates end-product quality.
Read more examples of how Vaisala creates value for customers at vaisala.com/annualreport.

27
OUR YEAR SUSTAINABILITYCREATING VALUE GOVERNANCE FINANCIALS
Value for employeesVaisala offers versatile opportunities for talented and motivated professionals who value work with a purpose and learning opportunities. We support the well-being of our employees and want to make sure they have the chance to develop at work.
Purposeful workVaisala’s products and solutions have true positive influence on the environment, societies, businesses, and individuals, and our employees are motivated by the opportunity to solve the challenges of our time. Sustainable and ethical behavior is an integral part of the values of both Vaisala and our employees. We invest significantly in research and development, which guarantees that we can continue to respond to global issues also in the future as well as grow our business sustainably. This increases the meaningfulness of working in Vaisala.
Our annual employee survey was conducted in November 2020. The survey shows that Vaisala’s employees were engaged and proud of their work even amidst changes. During the exceptional year, many of our employees worked remotely and teams developed new ways of working to keep up the meaningfulness of their work and serve customers. The Engagement Index in the survey continued its rising curve and was 4.23 on a scale of 1–5. The survey had a response rate of 85%, with answers from 1,574 employees.
We focus on good and motivating leadership, and we support managers and experts systematically in developing their leadership skills by organizing different training programs and courses. In the beginning of the year, we implemented a new bonus model that enables

28
OUR YEAR SUSTAINABILITYCREATING VALUE GOVERNANCE FINANCIALSValue for employees
Well-beingAt Vaisala, well-being at work is regarded as a whole, including the work community, leadership, the company, and the individuals themselves. Thus well-being consists of good leadership, motivating work community, balanced workload, meaningful work, as well as a safe working environment. As preventive measures, Vaisala supports well-being and energy at work by supporting sports and recovery, providing occupational healthcare, and preventing problems early on.
With these preventive measures, we aim to support our professionals in managing their work, ensuring recovery, and maintaining a
managers to reward their team members immediately for outstanding performance. The feedback concerning the model has been positive, and it has provided managers with better opportunities to guide and motivate their team’s work to the wanted direction.
The Leadership Index remained on a good level and was 4.18 on a scale of 1–5. The key strengths of Vaisala managers are fairness and objectivity, ability to listen, as well as positive attitude towards initiatives.
healthy lifestyle. In Finland, we provide our personnel with sports and recreational clubs, sport and cultural benefit, well-being weeks, trainings on time management and recovery, as well as the opportunity to participate in a well-being analysis on stress and quality of sleep. In 2020, we introduced virtual break exercises to support ergonomics and well-being: their importance was especially heightened in remote work during the year. In the United States, the Vaisala FIT program supports the well-being of employees.
Employee well-being is measured regularly in Vaisala employee surveys. The results show that Vaisala employees find their work mean-ingful and they feel that they are appreciated and treated equally. There is some room for development in ensuring that workloads are manage-able. In November 2020, Vaisala Well-Being Index score was 4.01 on a scale of 1-5 and increased a little compared to the previous year.
During 2020, we also conducted two personnel surveys on how our personnel experienced the changes brought by the COVID-19 pandemic. According to the results, our personnel has adjusted well. We have supported managers by organizing trainings on virtual leadership as well as communicated regularly about the changed practices, for example concerning remote work.
Learning and development Vaisala’s competitive strength stems from our talented, motivated, and engaged personnel. Changes in the business environment, technologies, working methods, and tools require our employees to learn and take in new things continuously. We support and encourage the whole personnel to actively develop and keep up their knowledge and expertise.
During 2020, we encouraged managers to increase virtual discussions regarding the goals, development needs and well-being of their team members. Managers play an important role in enabling and supporting learning, and it is the responsibility of all managers to plan development and learning activities together with their teams. Devel-oping expertise and knowledge is always in line with Vaisala’s values as well as our business needs and objectives. Defining competence development needs is part of the annual People Forum process.
In November 2020, Vaisala Learning Index, derived from the person nel survey, was 3.88 on a scale of 1–5. Employee training costs amounted to 1.13 MEUR and averaged 591 EUR per employee in 2020.

29
OUR YEAR SUSTAINABILITYCREATING VALUE GOVERNANCE FINANCIALS
Value for society and the environmentWe bring value to societies through accurate and reliable environmental measurements as well as decision-making support for national and local authorities and businesses. This way we help societies become better-informed, more resource efficient, and safer. In addition, we create value through significant investments in R&D and collaboration with the scientific community.
Better-informed societiesVaisala works together with nearly all meteorological institutes in the world, supporting them in gathering accurate weather observations for weather forecasts that are critical for societies. We also collaborate with international funding agencies and weather experts to build capacity for weather observing networks and competence in developing economies. This way we help these societies to be better prepared for extreme weather and its impacts.
Health services are also one of the foundation pillars of an informed society, and for example hospitals require accurate and reliable environ mental monitoring of their various activities. Vaisala’s viewLinc Continuous Monitoring System monitors the critical parameters in, among other spaces, blood and tissue banks, where continuous monitoring ensures that the materials are preserved and remain viable. Our solutions are also widely used to monitor the manufacturing and storing of different medicines, such as the vaccine for COVID-19 in 2020.

30
OUR YEAR SUSTAINABILITYCREATING VALUE GOVERNANCE FINANCIALS
Case
The sky is no limit: Vaisala’s sensor technology on its way to MarsInternational and scientific collaboration takes Vaisala and the Finnish Meteorological Institute’s (FMI) measurement expertise once again to Mars, this time onboard the Perseverance Rover. Cutting-edge humidity and pressure instruments gather scien-tific data of the planet’s conditions. Vaisala’s core technology provides accuracy and stability in a challenging environment.
Read morevaisala.com/annualreport
Resource efficiencyVaisala’s measurement solutions improve resource efficiency in various industrial production processes. Accurate measurements enable our customers to optimize their production as well as reduce their energy consumption and material loss. With the data from Vaisala’s measurement instruments, the air conditioning in data centers can be optimized energy efficiently, for example.
Vaisala’s road weather stations and MD30 mobile detectors provide real-time data that, combined with road weather model, heat maps, and information systems, help to optimize road winter maintenance. Timely decisions on anti-icing, de-icing, and snow ploughing increase safety and resource efficiency as well as reduce the environmental effects of chemicals used in road maintenance.
SafetyOur technologies help our customers maintain safe operating environments in many parts of society. Extreme weather, such as hurricanes, can have devastating consequences for local economies and livelihoods. Vaisala’s hurricane-tracking dropsondes can make in situ measurements inside a hurricane, providing essential information for forecasting its path and intensity. This advance information helps to safeguard both lives and infrastructure.
The essential institutions in society, such as hospitals and production facilities, consume electricity to guarantee safe operations. Our solutions make it easy to maintain and monitor the devices that are critical for power production and distribution, such as high voltage transformers. Continuous transformer condition monitoring supports smart power grids, where electricity consumption is controlled and adjusted as needed. With reliable online monitoring, operators can move from reactive operations to preventive maintenance, which enables them to detect faults in time and thus prevent power outages that would risk the safety and operation of society.
Read more examples of how Vaisala creates value for society and the environment at vaisala.com/annualreport.
Value for society and the environment
Finnish Meteorological Institute. Photographer: T. Pajukallio
Vaisala’s system monitors medical assets in the Finnish Red Cross Logistics CentreThe Finnish Red Cross Logistics Centre is full of medicines and other necessities for emergency response – supplies that can also be delivered to disaster areas when needed. Vaisala’s viewLinc Continuous Monitoring System helps to ensure that the medical assets are stored in the right conditions.
Read morevaisala.com/annualreport
Case

31
OUR YEAR SUSTAINABILITYCREATING VALUE GOVERNANCE FINANCIALS
Economic valueVaisala has a positive impact on local communities through employ-ment and taxes, both directly and through its supply chain. Responsible business practices and use of local suppliers create indirect benefits to local communities.
Vaisala as taxpayerVaisala’s head office is located in Vantaa, Finland. Vaisala has estab-lished subsidiaries and branches in 16 countries. Our group structure is simple, and we have companies only in countries where we do business.
In addition to the tax data published in the financial statement, Vaisala provides here more information on its approach to tax, tax management, and global tax footprint.
Approach to taxVaisala’s values are the basis of all our activities, both within Vaisala and with our partners and customers. We value integrity: we are honest, respectful, and reliable. We promote sustainable and ethical behavior. We recognize that Vaisala has a liability to pay taxes that are legally due in any country in accordance with the rules set by the relevant authorities. Vaisala also has a responsibility to its shareholders to structure its
MEUR 2020 2019 2018 2017 2016
Net sales 379.5 403.6 348.8 332.6 319.1
Operating costs -162.2 -181.9 -166.2 -152.8 -144.8
Employee wages and benefits -154.1 -157.7 -133.6 -129.9 -128.4
Payments to providers of capital1 -22.4 -21.1 -40.2 -17.8 -17.1
Payments to governments2 -6.6 -8.4 -8.4 -8.7 -7.9
Community investments (donations) -0.1 -0.2 -0.1 -0.1 -0.7
Economic value retained 34.1 34.2 0.3 23.2 20.2
Direct economic value generated and distributed in 2020
DIRECT ECONOMIC VALUE GENERATED AND DISTRIBUTED
Net sales
Operating costs
Employee wages and benefits
Payments to providers of capital1
Payments to governments2
Community investments (donations)
Economic value retained
1 Includes dividends and interest of borrowings2 Includes income taxes
379.5 M€
-162.2 M€
-154.1 M€
-22.4 M€
-6.6 M€
-0.1 M€
34.1 M€
Direct economic value generated and distributed in 2020
Value for society and the environment
To launch or not to launch: the impact of weather on space launches
Space launches are precise and expensive missions, where safety is not compromised. Weather conditions, such as wind and lightning, have a significant impact on the planning of the launch and resources, which is why accurate weather measurements play a key role.
Read morevaisala.com/annualreport
Case

32
OUR YEAR SUSTAINABILITYCREATING VALUE GOVERNANCE FINANCIALS
business in an efficient manner to ensure that strategic business objectives are met without incurring unnecessary tax costs.
Vaisala is committed to ensuring that it follows local and international tax rules and regulations in all jurisdictions where it conducts its business. We do not operate in tax haven countries for tax reasons. Vaisala does not practice tax planning that would aim at artificially decreasing the Group’s taxable income. We pay and report taxes in countries where the reporting obligations are applicable as a result of our activities.
Vaisala´s transfer pricing is aligned with the arm’s length principle in accordance with OECD Transfer Pricing Guidelines. The rationale of the chosen transfer pricing methods is properly documented. We comply with OECD transfer pricing guidelines and local legislations in relation to all our intercompany transactions.
Tax managementThe tax team within centralized Finance & Control function is respon-sible for managing and monitoring tax matters at Vaisala group level. Important matters of principle are presented and approved by the Audit Committee in Vaisala’s Board of Directors.
Vaisala Group has outsourced a large part of its foreign recurring tax compliance work to a few professional service providers to ensure compe tences and resources in complying with the local rules and regulations. Vaisala Finance & Control regularly monitors the trans-parency, quality, and outputs of these outsourcing engagements.
Global tax footprintTo ensure focus on process implementation and comparable data collection, Vaisala decided to start its tax footprint initiative in 2019. Vais-ala reports paid corporate income taxes, value added taxes, payroll taxes, excise taxes, and property taxes for the financial year 2020 and compa-rable figures for 2019. The principle of materiality has been observed in the collection and presentation of figures.
Vaisala benefits from R&D tax credits in the United States, Canada, and France. In addition, Vaisala has prior year tax losses in its subsidiaries located in the United States and France, which reduced their corporate income tax payments in 2020. The tax contribution of the parent company in Finland totaled 31.4 (26.2) MEUR in 2020.
Tax Paid in 2020 (MEUR) Paid in 2019 (MEUR)
Corporate Income Tax (CIT) 7.7 9.0
Value Added Tax (VAT) 10.4 10.8
Payroll Tax 32.6 28.9
Property Tax 0.6 0.5
Electricity Tax 0.1 0.1
Total 51.5 49.3
Total taxes paid 2020 – Vaisala Group
PAID IN 2020 – ALL VAISALA COMPANIES
(2019)
Corporate Income Tax (CIT) (18%)Value Added Tax (VAT)(22%)Payroll Tax (59%)Property Tax (1%)Electricity Tax(0%)
15%
20% 63%
1%
0%
Dataa ei esitetä 2020 ?WN20
TOTAL TAXES PAID BY
REGION 2020(2019)
Americas 7.2 MEUR(9.4)APAC 3.9 MEUR (4.1)EMEA 40.2 MEUR(35.9)
14%8%
78%
Value for society and the environment

33
OUR YEAR SUSTAINABILITYCREATING VALUE GOVERNANCE FINANCIALS
Active community outreach and scientific collaborationIn addition to Vaisala’s own research and development work, scientific collaboration strengthens our position as an industry pioneer and an innovative technology leader. Vaisala continues to be a contributor to many organizations, advancing technological development in several fields of study as well as supporting higher education, research, and science education.
Vaisala is a wide-ranging, research- and innovation-focused technology company, and our collaboration partners include several different organi zations, research institutions, corporations, meteorological institutes, and universities from around the world and from different fields of technology. Therefore, instead of an exhaustive list of all our cooperation projects, we introduce illustrative and significant examples of our work in the scientific community and society.
Participating in the most significant scientific commissions and organizations in our field Vaisala’s solutions are used to observe and measure aviation weather, and thus Vaisala is active in the International Civil Aviation Organization (ICAO), a specialized agency of the United Nations (UN). The World Meteorological Organization (WMO), likewise an agency of UN, coordi-nates the study of the state and behavior of the Earth’s atmosphere, including weather and climate. Vaisala participates in various expert teams and commissions working under and recognized by WMO. These groups focus on developing weather observations and forecasts globally. Such expert teams include the Commission for Instruments and Methods of Observation (CIMO) as well as the Association of Hydro-Meteorological Equipment Industry© (HMEI) and its Commission for Basic Systems (CBS).
We also participate in various industry standards development work in fields that are important to us, for example as a member of the European Telecommunications Standards Institute (ETSI) as well as in different national committees and groups of the International Electrotechnical Commission (IEC). Vaisala has also participated in the working groups of CIGRE (Conseil International des Grands Réseaux Électriques): the documentation created in these groups forms, for the most part, the basis for IEC’s standards. In 2020, Vaisala’s Industry Expert Senja Leivo was appointed as a member of CIGRE’s Study Committee D1 that focuses on materials and emerging test techniques.
In Finland, Vaisala operates in close cooperation with various scientific stakeholders, including the Finnish Meteorological Institute (FMI), VTT Technical Research Centre of Finland Ltd., the Helsinki Region Environmental Services Authority HSY, and different universities. Vaisala has representation in the Technology Industries of Finland organization, and we cooperate with Technology Academy Finland TAF as a Millennium Technology Prize partner.
In the United States, our collaboration partners comprise, for example, the National Oceanic and Atmospheric Administration (NOAA) and the National Centre for Atmospheric Research (NCAR). Vaisala is also a strong contributor and corporate sponsor to the American Meteorological Society (AMS) that is a leading scientific organization dedicated to atmospheric, oceanic, and hydrologic sciences. In addition to sponsorships, Vaisala representatives contribute to the AMS through
Vaisala funds two Professor Dr. Vilho Väisälä AwardsThe awards are administered by the World Meteoro-logical Organization (WMO). They are granted to distinguished research in the field of environmental measurement instruments and observation methods as well as meteorological instrument work in devel-oping countries and countries with economies in transition. Both awards carry a cash prize of 10,000 USD, and they are granted in connection with the CIMO TECO conference every other year. In 2020, the conference and awards were postponed until 2021 due to the COVID-19 pandemic.
several activities, such as scientific committees, journals, and articles. Regarding software development, Vaisala is a long-term member
in the Open Geospatial Consortium (OGC), developing global, open geospatial standards and APIs (Application Program Interface). In the Open Mobile Alliance, we participate in developing open and modern solutions for software device management. We also contribute to the CAR 2 CAR consortium that advances the digital interfaces in vehicles.
Seats in different sustainability and commerce organizationsWe are active in the International Chamber of Commerce (ICC) Finland, which promotes international trade and investment worldwide. Vaisala is also a member in FIBS, Finland’s leading corporate responsibility network, and in the Climate Leadership Coalition (CLC). The purpose the CLC is to improve the competitiveness of Finnish businesses and research organizations as well as their ability to respond to the threats posed by climate change.
Value for society and the environment

34
OUR YEAR SUSTAINABILITYCREATING VALUE GOVERNANCE FINANCIALS
Vaisala is a shareholder and research partner of CLIC Innovation Oy. CLIC is an open innovation cluster with the mission to create break-through solutions in bioeconomy, energy, and cleantech by facilitating joint research between industry and academia in Finland.
Enhancing academic research and science educationAcademic research around the world is an integral part of the devel-opment of Vaisala’s science-based innovations. Our experts participate in collaboration with several universities, and our personnel includes Masters’ students and doctoral candidates. We equally participate in the EU Research and Innovation program Horizon 2020: the wind lidar business, acquired in 2018, is a part of the Innovative Training Network “Lidar Knowledge Europe (LIKE)”. In LIKE, we advance the techniques of remote wind sensing and integrate them into standard tools applied by many industries together with PhD students.
In the United States, we collaborate with the Colorado State Univer sity (CSU) in the field of weather radars, among others: in 2020, Vaisala’s Board of Directors renewed the annual donation of 25,000 USD to the university for three years. Another example of university col-laboration is the Nanjing Air Quality Testbed project, realized together with the University of Nanjing in China. Similar air quality project has been realized in Helsinki with the University of Helsinki. In the projects, dense air quality observation networks and predictive models have been built in the cities, providing data for decision-making.
In the field of science education, Vaisala aims to enhance awareness of natural sciences, innovations, and the environment by supporting research and education focused on these subjects. Already in 1963, Vaisala’s founder Vilho Väisälä donated a fifth of Vaisala shares to the Finnish Academy of Science and Letters to promote the study of natu-ral sciences and mathematics. The Academy’s Väisälä Fund continues to distribute grants for study and research to this day. More information of the grants and prizes can be found in Finnish on the Finnish Academy of Science and Letters website.
Vaisala inspires children and youngsters in the field of science also as a long-term partner in Science Centre Heureka’s exhibitions Sci-ence on a Sphere and Intelligent City in Finland. Overall, we support natural sciences and science education in different projects annually. Scholarships paid in the form of salary are outside the scope of Vaisala’s community outreach activities.
Support for important climate and environment projectsVaisala provides charitable donations with products, funding, or services to non-profit organizations as part of its community outreach activities. Our overall objective is to support organizations and projects that advance environmental awareness and science education. All our outreach activities are in line with our values and resonate well with topical issues close to our business, such as climate, weather, envi-ronmental and industrial measurements, and environmental sciences. Vaisala does not donate funds to political parties, causes, or campaigns.
Another focus are non-profit organizations working for environ-mental disaster prevention and recovery. Furthermore, impartial humanitarian organizations that provide protection and assistance to people affected by disasters are within the scope of possible donations. In 2020, we helped The Bahamas to recover from Hurricane Dorian by donating automated weather observing systems to three airports.
In 2020, Vaisala’s personnel in Finland participated in the Kilometer Competition by the Chain Reaction Campaign. In the competition, Vaisala employees kept track of all the kilometers they cycled during the summer. Based on the total 70,000 kilometers, Vaisala made a donation to the Finnish Red Cross to help the Tajikistan mountain range, where climate change is causing melting of the glaciers as well as other societal and environmental challenges.
Vaisala sponsors My2050 climate change game in VantaaMy2050 is an informative mobile game about the future and climate matters. By sponsoring the game, Vaisala realizes its innovation- and collaboration-based values and increases understanding of climate change.
Read morevaisala.com/annualreport
Case
Value for society and the environment

35
OUR YEAR SUSTAINABILITYCREATING VALUE GOVERNANCE FINANCIALS
Value for investorsVaisala is a stable, sustainable, and globally operating company based in Finland. As the technological leader in its field, Vaisala utilizes megatrends as well as invests in research and development to ensure growth also in the future.
The company’s series A shares have been quoted on Nasdaq Helsinki stock exchange since 1994. Vaisala’s target is to maintain high solvency and to pay a stable dividend which will increase in line with net profit development.

36
OUR YEAR SUSTAINABILITYCREATING VALUE GOVERNANCE FINANCIALS
Well diversified sales mix
• Vaisala is a global player in its rel-evant markets with representa-tives in more than 100 countries
• 2020 geographical net sales split: 36% Americas | 29% APAC | 35% EMEA
• Several customer segments in governmental and private sectors
Technology leader and strong market position
• Leading technologies in environmental and industrial sensing with most accurate and reliable instruments, algorithms, and software
• Clear market leadership position in key products, high customer satisfaction, estimated total market size 2.5 billion EUR
• High continuous investments in R&D (2020: 53.2 MEUR or 14% of net sales)
Growth potential in multiple dimensions
• New technologies
• New products, applications, and digital solutions that leverage latest technologies, platforms, as well as business models based on recurring revenue
• Expansion into new customer segments and geographical regions
Asset-light business model
• High-mix, low-volume business model
• Sales growth does not require capex: related annual capex around 10 MEUR
• Potential for productivity improvement with volume growth
Sustainable technologies in a responsible way
• Technologies, products, and digital solutions that contribute to building better-informed, safer, and more resource efficient societies
• Reliable partner, whose corporate responsibility work has been recognized, for example, by the investor initiative CDP that focuses on climate reporting and the RE100 initiative that encourages the use of renewable energy
• Member in several sustainability networks, such as Climate Leadership Coalition as well as UN Global Compact and Caring for Climate initiatives
Solid dividend payer
• Aim to distribute a stable divi-dend which will increase in line with net profit development
• Dividend per share for the last five years paid at the average rate of 86% on earnings and the average effective dividend yield of share 3.4%
Strong cash generation and financial position
• Enable investing in growth and long-term business development
• Strong cash conversion rate (2020: 0.9)
• Solvency ratio 59.0% (2020)
• Gearing 5.7% (2020)
1
5
2
6
3 4
7
Value for investors

38394649515355565758
Sustainable business practices
Reporting principles, policies, and due diligenceEnvironmentPersonnelOccupational health and safetyEthics and complianceResponsible supply chainsUN Global CompactSignaturesIndependent assurance reportGRI content index

38
OUR YEAR SUSTAINABILITYCREATING VALUE GOVERNANCE FINANCIALS
Reporting principles, policies, and due diligenceNon-financial informationDisclosure of non-financial information in accordance with the Finnish Accounting Act chapter 3 a is presented in the Sustainable business practices section as well as the chapters Business model in Our business section, Dashboard in the Creating value section, and Risk man agement in the Governance section. The Sustainable business prac-tices section includes information on environmental matters, social and employee matters, respecting human rights, as well as anti-corruption and anti-bribery compliance.
Policies and due diligenceWe endorse the United Nations Global Compact strategic initiative for sustainable business practices and follow the Global Compact’s Ten Principles, which cover the areas of human rights, labor, environment, and anti-corruption. These ten principles are reflected in Vaisala’s Code of Conduct, and we report on the implementation of the principles on an annual basis as part of our sustainability reporting.
The Code of Conduct guides our actions and operations and reflects Vaisala values: Integrity, Strong together, Innovation and renewal, and Customer focus. We expect all our employees and partners, such as distributors and representatives, to comply with our Code of Conduct in all their actions. We have a separate Supplier Code of Conduct that sets standards for our suppliers and subcontractors. We comply with all applicable laws and regulations in the countries in which we operate. Where differences exist between regulatory requirements and Vaisala’s Code of Conduct, we strive to apply whichever sets the highest standard. We respect and comply with international conventions, such as the United Nations Declaration of Human Rights and the International Labour Organization’s (ILO) Declaration on Fundamental Principles and Rights at Work.
Our Code of Conduct includes guidance on environmental matters, social aspects and employment matters, human rights, and anti-bribery
and anti-corruption. Moreover, Vaisala Board of Directors has approved more detailed policies, such as the International Anti-Corruption Policy and the Quality, Environment, and Health and Safety (QEHS) Policy. The QEHS Policy is implemented through our global management system that includes our ISO 14001 certified Environmental Management System and ISO 45001 certified Health and Safety Management System.
We train our entire personnel regularly on the contents of the Code of Conduct and aim to bring up new angles on the matters in the trainings. In addition, separate trainings are organized on various topics, such as environment, health and safety, anti-corruption and bribery, and human rights risks management, some of which are mandatory for the entire personnel and others tailored to specific employee groups based on need.
Each Vaisala employee is responsible for complying with the Code of Conduct, and each manager monitors and supervises compliance with the Code of Conduct. Any suspected action against or violation of the Code of Conduct should be escalated either anonymously to our whis-tleblowing channel or directly to the legal department. We also monitor that our suppliers and other business partners comply with our Code of Conduct, for example through self-assessments and audits.
Implementing the GRI guidelinesTo maintain transparency and consistency in our sustainability reporting, we apply the Global Reporting Initiative’s (GRI) reporting guidelines. This report has been prepared in accordance with the GRI Standards: Core option. The GRI reference index can be found on pages 58–65 of this report.
BoundariesApart from the environmental data, our sustainability data is reported for the entire Group and for all locations. Our carbon footprint includes
offices with more than 20 employees or otherwise significant opera-tions as well as indirect sources. The indicators related to energy consumption and waste are reported from the most significant manu-facturing sites, located in Finland, the United States, and France.
Independent assuranceAccording to our reporting process, we seek assurance for the report from a third-party assurance provider. An independent third party, Deloitte Oy, has at Vaisala management’s request externally assured the contents and indicators of the Sustainable business practices section on pages 38–55 as well as indicator 201-1 on page 31. Independent assurance report can be found on page 57.
MaterialityThe material aspects are reviewed annually as part of the reporting process. Also, the development suggestions received from stakeholders are considered in the materiality review update. The material issues are included in the Creating value and Sustainable business practices sections of the annual report.

39
OUR YEAR SUSTAINABILITYCREATING VALUE GOVERNANCE FINANCIALS
EnvironmentEnvironmental managementOur environmental responsibility work is guided by our Global Quality, Environment, and Health and Safety (QEHS) Policy and our ISO 14001 certified environmental management system, which covers our largest manufacturing sites and offices. Presently, 93% of our employees work in ISO 14001 certified locations. All our certified locations are audited by an independent third party as part of our audit program.
Our environmental management system helps us identify the most significant environmental impacts and risks at each location and set environmental targets both for the entire company and locally. Many of our locations have voluntary green teams which promote necessary measures for achieving the environmental targets.
Our head office in Finland has been committed to the WWF Green Office environmental program already for ten years. During 2020, we focused on promoting environmentally friendly commuting at our Finnish sites by enabling employees to use their sports and culture benefit on public transport tickets, participating in the national Kilo-metrikisa (Kilometer Competition) biking contest with our own Vaisala team, organizing a subsidized bicycle service campaign, and testing out a shuttle bus connection between our head office and the nearest train station.
Environmental impactsWe regularly assess our environmental impacts as part of our environ-mental management system and aim to continuously reduce the nega-tive environmental impact of our product portfolio, business operations, and supply chain. The most significant environmental impacts from our business operations are related to energy consumption, waste, the materials our products contain, and indirect emissions. Such emissions arise, for example, from purchased products and services, business travel, logistics, commuting, and energy consumption during product use.
In previous years, we have also reported the water consumption of our manufacturing sites, but we have recognized that its share of our environmental impact is minor. Therefore, we have decided to no longer report it. However, we will continue to monitor our water consumption and will re-examine the situation, should changes occur in the consump-tion or availability of water at our sites.
The most significant environmental risks of our operations are related to potential emergency situations that can lead to local contamination. These risks are controlled, for example, as part of our emergency prepared ness and management processes for hazardous substances.
Emissions from 2014 baseline (Scope 2)
-97%(2019: -90%)
Target 2020: -90%
Renewable electricity
100% (2019: 93%)
Target 2020: 100%
Waste recycling rate*
59%(2019: 53%)
Employees working on ISO 14001 certified sites
93%(2019: 85%)
* Recycling rate includes reuse, material recycling, and composting.
Environmental indicators in 2020
OUR YEAR SUSTAINABILITYCREATING VALUE GOVERNANCE FINANCIALS

40
OUR YEAR SUSTAINABILITYCREATING VALUE GOVERNANCE FINANCIALSEnvironment
MINIMIZING OUR ENVIRONMENTAL FOOTPRINT
MAXIMIZING OUR ENVIRONMENTAL HANDPRINT
Supply chain Our operations Logistics Product use Service andmaintenance
Productend- of-life
1,260 tmaterialsused
217 MWh solar energygenerated
1,386 t emissionsfrom businesstravel
213 t emissions frompurchased energy
1,373 temissionsfrom employeecommuting
663 tproductsshipped
8,428 t
emissionsfrom logistics
1,114 t emissions from productuse (weather radars)
Reducing customers’environmental footprintthrough product use
Extending lifecyclesthroughcalibrationand updates
Vaisala servicesand calibrates over 60,000 instrumentsannually
Productrecyclability
59% recycled waste
17.69 GWh energy consumption
indicates CO2-equivalent
100% renewableelectricity
CO2
CO2
CO2
CO2CO2 CO2
Environmental impacts
Manufacturing

41
OUR YEAR SUSTAINABILITYCREATING VALUE GOVERNANCE FINANCIALS
Energy and emissionsWe believe in a future in which societies are powered by renewable energy. In 2015, Vaisala joined RE100, a global initiative encouraging companies to make a 100% renewable energy commitment within a clear timeframe. With this initiative, we committed to using 100% renewable electricity in our facilities by the end of 2020.
In 2020, we reached our target and succeeded in covering our sites’ electricity consumption with 100% renewable sources. Even though our manufacturing sites in Finland and the United States are already using solar panels to produce clean energy, we still need to purchase most of our electricity from local energy companies. Those of our sites with the most significant energy consumption purchase green electricity prod-ucts directly from their electricity providers. The origin of renewable energy for these green electricity products has been certified. In those sites where Vaisala cannot negotiate the electricity agreement directly, we achieved the goal by purchasing unbundled energy attribute certifi-cates from the regional markets to match our consumption.
The energy efficiency of our facilities is important to us. At the end of the year, our head office in Vantaa was reinforced with a new research and development building, in which energy efficiency is improved by a heat recovery system, for example. A new building designed for energy efficiency and sustainability was also taken into use in Boulder, Colorado.
The use of renewable electricity has reduced our energy consumption emissions by 97% compared to our baseline year 2014 (Scope 2, market-based). In 2020, our market-based Scope 2 emissions (calculated with supplier-specific emission factors) were only 213 metric tons of CO2e (2019: 681 CO2e). Our location-based Scope 2 emissions (calculated with country-specific average emission factors) were 2,986 metric tons of CO2e (2019: 3,332 CO2e).
The majority of our emissions are other indirect emissions (Scope 3), mostly business travel, inbound and outbound logistics, waste treatment, and commuting. The year 2020 was exceptional due to the global COVID-19 pandemic, which is also reflected in our carbon footprint through increased remote work and especially reduced business travel. Business travel has been one of our most significant sources of emissions, but in 2020 the emissions associated with it decreased by 77%.
Scope 1
Scope 2
Scope 3
2016 2017 2018 2019 2020
100
80
60
40
20
0
25,000
20,000
15,000
10,000
5,000
0
CARBON FOOTPRINT
Tons CO2e Tons CO2e/MEUR net sales
18,12
7
16,9
42
18,0
18
19,0
00
12,8
68
477
1,257
16,393
220
949
15,773
288
667
17,063
254
681
18,064
218
213
12,436
2016 2017 2018 2019 2020
100
75
50
25
0
20
15
10
5
0
ENERGY USE
Heat Electricity
MWh/MEUR net salesGWh
11.35.5
11.55.8
11.85.5
12.75.6
12.55.2
Environment

42
OUR YEAR SUSTAINABILITYCREATING VALUE GOVERNANCE FINANCIALS
WasteWaste associated with Vaisala’s business operations is produced at the beginning of the supply chain in the manufacture of materials and components, in Vaisala’s own operations related to manufacturing, repairing and servicing of products and the work of our personnel, as well as at the end of the value chain when a customer removes a Vaisala product from service. These impacts are depicted in the waste process flow chart.
Our main manufacturing site in Finland generates most of the waste in our own operations. There waste is sorted into 14 categories to enable its efficient processing and use. In the future, we are going to put more effort in increasing personnel awareness, so that a larger portion of waste would end up in the correct category. We actively try to find ways to direct an even bigger proportion of waste to recovery in cooperation with our waste management service providers. We make sure that our waste operators have the appropriate licenses for waste treatment.
We also aim to reduce the amount of waste generated, for example by utilizing reusable trays for packaging with some of our suppliers and reducing scrap material produced in our manufacturing processes. We reduce the amount of waste at the end of the value chain by designing our products to last as long as possible and offering diverse mainte-nance and repair services for our products. In addition, we advise our customers on how to recycle our products at the end of their life cycles.
500
400
300
200
100
0
2016 2017 2018 2019 2020
WASTE*
Tons Tons/MEUR net sales
2.5
2.0
1.5
1.0
0.5
0
Non-hazardous Hazardous
* Waste management takes place offsite in our service provider’s premises. The reported waste amounts do not include the temporary waste from our construction sites.
27.1332.2
35.5423.6 40.5
350.128.5367.4
44.3340.9
DISPOSAL METHODS FOR
NON-HAZARDOUS WASTE
Recycling
Energy recovery
Composting
Landfill
Reuse
48.3%
34.5% 13.6%3.0%
0.6%
DISPOSAL METHODS FOR HAZARDOUS
WASTE
Physico-chemical treatment
Recycling
Incineration
Recovery
Landfill
35.0%
30.7% 26.4%
7.2% 0.7%
Environment

43
OUR YEAR SUSTAINABILITYCREATING VALUE GOVERNANCE FINANCIALSEnvironment
Waste process flow
Organization
Downstream waste
Disposal methods
Own activities Downstream in value chainUpstream in value chain
Outputs
Products, packages
InputsSupplier Customer
Upstream waste
Life cycle services
Recycling
Energy recovery
Composting
Landfill
Manufacturing
Packaging
Other activities Kitchen, offices, coffee rooms Facility repairs
Raw materialsElectronics, metal components
Process materialsChemicals (hazardous and non-hazardous)
Packaging materialsCardboard, wood, plastic, Returnable boxes
ProductsElectronics, office supplies Kitchen supplies
Hazardous waste
Electronic waste
Packaging waste
Chemical waste
Energy waste
Mixed waste
Bio-waste
Paper waste
Construction waste

44
OUR YEAR SUSTAINABILITYCREATING VALUE GOVERNANCE FINANCIALS
Scope of environmental reportingMost of our Group’s energy consumption and waste generation can be attributed to our manufacturing locations in Finland, the United States, and France. Hence, these key indicators are reported only for these three largest manufacturing sites. The energy consumption of these locations does not include the fuel consumption of field-service vehicles due to the low number of such vehicles.
To calculate our carbon footprint, we collect data more extensively from those locations with more than 20 employees or otherwise significant operations. Vaisala’s carbon footprint includes various parts of the company’s value chain. Our reported carbon footprint is divided into three levels (Scope 1–3) in line with the GHG Protocol (Greenhouse Gas Protocol) Corporate Accounting and Reporting Standard. Scope 1 includes field-service vehicles owned by Vaisala. Purchased-energy emissions (Scope 2) include purchased power and heat.
Other indirect emissions (Scope 3) include business travel (flights, rail travel, and rental cars), inbound and outbound logistics, commuting, and waste treatment (only in Finland, where 78% of the Group’s waste is generated). Emissions originating from the use of our products are calculated only for installed weather radars due to their relatively significant energy consumption and the availability of data. We have also identified purchased goods and services as a relevant category of scope 3 emissions, but for the time being, we do not have adequate data on our supply chain emissions to be able to include this category in our Scope 3 emissions.
Data sources and assumptionsEnergy and waste data are collected from various sources. In addition to having our own monitoring systems on the sites, we collect data from the systems and invoices of our service providers. All our sites in the reporting scope submit their environmental indicators in a central-ized reporting system.
For indirect (Scope 3) emissions calculation, we collect business travel data from our travel agency, outgoing logistics data from our logistics partners, and waste treatment data from our waste management service providers. For incoming logistics and the energy consumption of weather radars, we use data from our internal systems, and for commuting, we utilize data from the commuting survey renewed in 2019 to estimate the proportions of different modes of transport. Additionally, we take into consideration the impact that increased remote work due to the global COVID-19 pandemic had on commuting in 2020.
The environmental figures for 2020 are based, for the relevant part, on data that was available at the time of the publication of the report for the first 10–12 months of the year. For the missing part, the figures are estimates based on actual data for the previous months. There is no reason to assume that there should be significant differences between the estimates and the actual figures for 2020.
DIVISION OF ENVIRONMENTAL IMPACTS BY LOCATION
Energy
Waste
Vantaa, Manufacturing location
Boulder (Louisville, CO), Manufacturing location
Paris (Saclay), Manufacturing location
Other locations
Environment

45
OUR YEAR SUSTAINABILITYCREATING VALUE GOVERNANCE FINANCIALS
Emission factorsGreenhouse gas emissions are calculated using the best available conversion factors. These emission factors mainly come from the DEFRA database and GHG Protocol calculation tools. Certain emission factors come from other sources, such as our logistics partners, local energy companies, and vehicle manufacturers. For flights, we use DEFRA’s emission factor with radiative forcing that acknowledges also those climate change effects of aviation not attributable to CO2.
To determine our Scope 2 carbon footprint, we primarily use the market-based calculation method, which takes our purchased-energy specific emissions into account. In 2020, our purchased electricity has been entirely renewable, which means that we use 0.0 g CO2e / kWh as the emission factor for electricity in the market-based calculation. In addition, we report our location-based Scope 2 emissions, which are based on average country-specific emissions from energy production.
Our carbon footprint includes all greenhouse gases converted into carbon dioxide using global warming potential (GWP-100).
Sustainable product design and managementA significant portion of the environmental impacts generated by our products arise during their use. Our industrial products and solutions help our customers improve their environmental performance, and our weather measurement solutions support decision-making in society by providing a wide range of critical information.
The environmental footprint generated by products over their life cycle can be influenced during the product design phase. Our product development process includes environmental requirements, and many of the required product qualities, such as energy efficiency, maintainability, and recyclability, are beneficial for the environment. The updateability and modular design of many of our products, combined with our field services, extend the product life cycle, which typically ranges from a year to over 20 years. However, we are aware that the global scarcity of re-sources and rapidly developing environmental requirements call for us to improve our product design process continuously. In 2020, we arranged a training session on this topic for our product designers and conducted a survey on sustainable development in product design. This survey raised development ideas which we will advance in the coming years.
To ensure that our products are safe for people and the environment,
we set strict requirements on the materials used in our products during the product design process. Components are analyzed early in the new product development process to ensure compliance. We systematically collect information about substances that REACH* legislation has defined to be of very high concern as well as about compliance with RoHS** leg-islation in order to enable the safe use and end-of-life treatment of prod-ucts. Furthermore, we are prepared to report the required information in the SCIP database*** of the European Chemicals Agency. We select new suppliers carefully and ensure that they meet our strict requirements. At the end of a product’s life cycle, we advise customers to recycle the products in accordance with local best practices for electronics recycling or to return them to Vaisala for recycling.
* REACH = Registration, Evaluation, Authorisation, and Restriction of Chemicals
** RoHS = Restriction of Hazardous Substances in electrical and electronic
equipment
*** SCIP = Substances of Concern In articles, as such or in complex objects
(Products)
Environment

46
OUR YEAR SUSTAINABILITYCREATING VALUE GOVERNANCE FINANCIALS
PersonnelPersonnel in 2020 The total number of employees at the end of 2020 was 1,919. The average number of personnel employed during the year was 1,911. The average age of personnel was 43 years. At the end of the year, 95% of employees were permanent and 5% temporary.
Employee turnoverDuring 2020, 190 permanent employees were recruited and 128 perma-nent employees left the company, out of whom 11 retired. The turnover rate for permanent employees was 7%, and the recruitment rate was 10%.
Collective agreements and trade unionsVaisala recognizes Technology Industries of Finland as its trade union. Vaisala’s employees in Finland are covered by three collective agree-ments: the collective agreement for employees in technology industries, the collective agreement for salaried employees in technology indus-tries, and the collective agreement for senior salaried employees in technology industries.
Salaries and wages paid by the company are based on local collec-tive and individual agreements, individual performance, and the require ments of each position. The base salaries are supplemented by a performance-based bonus system, which covers all Vaisala personnel.

47
OUR YEAR SUSTAINABILITYCREATING VALUE GOVERNANCE FINANCIALS
–19 20–29 30–39 40–49 50–59 60– Total
Male 13 83 55 41 16 2 210
Female 8 42 27 18 5 100
Total 21 125 82 59 21 2 310
Recruitments by age group
–19 20–29 30–39 40–49 50–59 60– Total
Male 10 56 33 27 16 8 150
Female 6 37 15 9 5 7 79
Total 16 93 48 36 21 15 229
Turnover by age group
Finland Americas EMEA APAC Total
Permanent 128 27 22 13 190
Temporary 94 4 18 4 120
Total 222 31 40 17 310
Recruitments by region
Finland Americas EMEA APAC Total
Permanent 50 43 12 23 128
Temporary 71 5 21 4 101
Total 121 48 33 27 229
Turnover by region
2016 2017 2018 2019 2020
PERSONNEL AT THE END OF THE YEAR
2,100
1,800
1,500
1,200
900
600
300
0
1,569 1,608
1,816 1,8371,919
PERSONNEL BY REGION AND CONTRACT
Permanent Temporary
Americas: North and South America EMEA: Europe, Middle-East, and Africa APAC: Asia-Pacific
1,500
1,200
900
600
300
0
Finland Americas EMEA APAC
7159
2819
221
851,157
Personnel

48
OUR YEAR SUSTAINABILITYCREATING VALUE GOVERNANCE FINANCIALS
Diversity and equalityIn Vaisala, advancing diversity and equality is important from the points of view of employee well-being and attracting new talent, for example. By fostering the diversity and equality in our work community, we can also do our part to promote equality in the society at large.
As laid out in Vaisala’s Code of Conduct, we recognize the value of diversity and do not accept any form of discrimination. We aim to treat all our employees and applicants equally in all recruitment, hiring, training, and development. Equality and fairness are also important elements of Vaisala’s compensation policy. We do not distinguish between gender or other non-professional attributes in employee compensation or benefits plans.
According to the Finnish Non-Discrimination Act, an employer must create a plan to advance equality. The aim of our equality plan is that Vaisala’s personnel, jobseekers, and the subcontractors operating within Vaisala’s guidance and offices as well as leased personnel will be treated equally, independently of their attributes.
Furthermore, our goal is that our employees work within a safe, caring, communal, and accessible operating environment. Equality is advanced by developing good practices as well as identifying problems and presenting solutions to them. If discrimination occurs, it will be reacted to immediately and systematically. According to the principle of equality, we want to support our personnel in different stages of life and circumstances. We take a positive view on family leaves, irrespective of gender.
In accordance with the Finnish Equality Act, we promote gender equality in a target-oriented and systematic manner. As part of preparing our equality plan in 2020, we conducted a wage survey in Finland and found that there were no systematic differences in wages that could be explained with gender distribution. The women’s wage was, on average, 97% of men’s wage on the same job requirement level for salaried and senior salaried employees and 100% of men’s wage for production employees.
In North America, Vaisala Inc. is an Equal Opportunity Employer (EOE). All qualified applicants are considered for employment without regard to age, race, color, religion, gender, marital status, national origin, sexual orientation, disability, or veteran status.
Also, Leosphere SAS, that Vaisala acquired in late 2018, aims to promote diversity. Moreover, the French law protects employees from
discrimination in recruitment, remuneration, and career development, for example.
The level of equality in Vaisala was researched in 2020 in the personnel survey, where employees were asked whether they experience that all employees are treated equally without regard to any form
PERSONNEL BY LEVEL OF EDUCATION*
Doctoral degree
University degree
College/vocational school
High school/vocational institute
Comprehensive school
* Covers 80% of permanent personnel
2%
70% 9%
15%3%
GENDER DISTRIBUTION
Male
Female
71%
29%
MANAGER GENDER
DISTRIBUTION
Male
Female
73%
27%
MANAGEMENT GROUP GENDER DISTRIBUTION
Male
Female
57%
43%
BOARD OF DIRECTORS
GENDER DISTRIBUTION
Male
Female
75%
25%
AGE DISTRIBUTION
< 30
30–49
50>
12%
58% 30%
SUPERVISOR AGE DISTRIBUTION
< 30
30–49
50>
1%
61% 38%
of diversity. The average score was 4.39 on a scale of 1–5. The open answers showed that supervisors are seen as fair and unbiased and that they respect different team members. Vaisala was seen as an open and fair employer that appreciates its employees.
Personnel

49
OUR YEAR SUSTAINABILITYCREATING VALUE GOVERNANCE FINANCIALS
Occupational health and safetyOccupational health and safety management Occupational health and safety is an important part of all our activities, from the product development’s health and safety requirements to the installation of the products. Our occupational health and safety man-agement and development is guided by our Global Quality, Environ-ment, and Health and Safety (QEHS) Policy and our ISO 45001 certified occupational health and safety system, which sets the background for continuous improvement. 94% of our employees work on certified sites, but the system covers all our activities and employees.
The identification and assessment of occupational health and safety related risks is systematic work, and it is done in cooperation with our employees and other stakeholders. The most significant injury risks appear especially in electrical work, working at heights, and working with chemicals or gases. We apply the hierarchy of controls to minimize risks. We aim to eliminate the most significant hazards or substitute them with less dangerous alternatives, if removing is not possible. We aim to further reduce the residual risk by controlling the risk at source through engineering controls. If personal protective equipment is needed, it is given to employees for free.
We invest in health and safety training for employees and ensure that all employees have the necessary qualifications for performing their work. All employees have the right to refuse work that they believe could cause them or another person injury or ill health. This and other occupational health and safety practices are covered in our safety e-training which was published also as a Chinese version this year, in addition to the previous Finnish, English, and French ones. Occupational safety training is free for our employees and subcontractors, and the trainings can be conducted during working hours.
Impacts of the COVID-19 pandemicAs a result of the COVID-19 pandemic, increased remote work, on the one hand, and ensuring the health security of the production employ-ees, on the other, brought their own challenges to the health and safety work in 2020. The challenges were taken up in cooperation with the Risk Management and Human Resources functions. We managed to prevent the formation of epidemics at our workplaces by increasing remote work, improving hygiene instructions and cleaning, as well as tightening the travel and visitor restrictions.
The risks related to remote work were assessed by analyzing the ex-periences of remote workers and the results of two personnel surveys. Based on these results, we provided tools for better management of remote work and the related physical and psychological risks. The fact that the results improved as the pandemic continued indicates that the actions had an impact and that the management of risks related to remote work developed positively.
CollaborationWe have increased collaboration between employees and the employer by establishing Health and Safety Committees in several locations. The committees have an important role in monitoring and developing occupational health and safety. Currently, active Health and Safety Committees are operating in Finland, Canada, Germany, the United States, the United Kingdom, Japan, France, and China.
These committees meet at least four times a year. The representa-tives on the Health and Safety Committees currently make up 4.2% of all employees and represent 93% of the personnel. Our goal is to have at least one in three non-managerial employees on each committee.

50
OUR YEAR SUSTAINABILITYCREATING VALUE GOVERNANCE FINANCIALS
Proactive reporting and investigationWe encourage our employees and contractors to proactively report any health and safety risks in the workplace and make suggestions to improve the safety of working conditions and methods. To prevent injuries, harmful exposure, and the recurrence of incidents, the line management is responsible for making sure that the reported devia-tions and their causes are investigated. After the investigation, correc-tive measures are implemented without delay. A globally consistent reporting procedure and database improve the efficiency and trans-parency of monitoring health and safety performance.
Our aim was to increase the frequency of proactive reporting (risks, near misses, and improvement suggestions) compared to the previous year. In 2020, our goal was one reported near miss, risk, or improvement suggestion per six (6) employees. The total amount of reports was 198 reports, so only 62% of the target was reached. The low reporting frequency was influenced significantly by the increased remote work.
We aim to increase the reporting frequency in the future by contin-uing to focus on education and increasing the understanding of the importance of proactive reporting. In addition, we aim to shorten the processing time of the reports.
InjuriesThe injury rate went down in 2020 compared to the previous year. A total of eight injuries occurred, and the injury rate was 1.99 injuries per million hours worked, the total number of hours worked being 3.99 million hours. These injuries were mainly minor bruises or cuts, and none of the injuries resulted in a fatality or caused severe or long-term disability. We continue to work towards our long-term goal of zero injuries and occupational diseases, and we believe we can achieve this goal through continuous improvement.
Occupational health servicesIn Vaisala, the occupational healthcare is managed by following local legislative requirements, and thus the practices vary in different coun-tries. Employees are informed about the services through our intranet, for example.
In Finland, Vaisala offers all employees general practitioner level medical care. Our working capacity insurance covers specialist level medical services for all but hourly based employees. Our healthcare contract covers treatment expenses caused by accidents that occur during working hours and free time.
In the United States, Vaisala provides a complete package of health-care benefits including but not limited to medical, dental, and vision coverage. In France, Vaisala’s subsidiary Leosphere SAS pays 50% of employees’ mandatory private health insurance that covers a variety of medical specialist treatments. In China, Vaisala provides annual medical check-ups to all employees and regular additional occupational medical examinations for employees who are exposed to risky working environ-ments. An exclusive commercial medical insurance has been purchased for employees and their dependents, which covers the most treatment costs in public hospitals.
In countries other than the ones mentioned above (the countries mentioned cover approxi mately 90% of Vaisala’s personnel), the occupational healthcare is managed in accordance with local legislation and practices.
12
10
8
6
4
2
0
20202016 2017 2018 2019
PROACTIVE REPORTING
Reports/100 employees
3.96
7.15
9.388.55
10.32
4
3
2
1
0
2016 2017 2018 2019 2020
INJURIES PER MILLION WORKING HOURS (TRI)
2.32
1.31
3.202.59
1.99
Occupational health and safety

51
OUR YEAR SUSTAINABILITYCREATING VALUE GOVERNANCE FINANCIALS
Ethics and complianceVaisala Code of ConductThe Code of Conduct reflects Vaisala’s values: Integrity, Strong together, Innovation and renewal, and Customer focus. All our employees, part-ners, distributors, and agents must comply with the Code of Conduct under all circumstances.
All Vaisala employees must complete the Code of Conduct training at regular intervals and confirm their commitment to the Code and the International Anti-Corruption Policy. The mandatory Code of Conduct training was renewed in late 2020. Of all employees, 96% had com pleted the training by January 18, 2021. All new employees commit to complying with the Code of Conduct and the International Anti- Corruption Policy as part of their employment contracts as well as participate in induction training on the operating principles and procedures of the company. Violations of the Code of Conduct or the International Anti-Corruption Policy may lead to disciplinary action, including termination of employment.
Prevention of corruption and briberyVaisala has a zero tolerance policy towards all forms of corruption. Our International Anti-Corruption Policy strictly forbids offering, giving, soliciting, arranging, demanding, or accepting bribes, whether directly or through third parties. The Policy includes detailed guidelines on acceptable hospitality and entertainment. Periodical training for employees on the Code of Conduct also covers aspects related to the International Anti-Corruption Policy. In addition, a more specific Anti- Corruption Policy training has been tailored to employees who, accord-ing to risk analysis, might face challenging situations in their work.
To serve its customers as efficiently as possible, Vaisala conducts business through a network of partners: with distributors, agents, and resellers in more than 100 countries. Our business operations cover a large geographical area, meaning that we also operate in countries with a demanding business environment. For this reason, we pay special attention to selecting our business partners. Our agreements
with our partners typically include strict clauses concerning immediate termination if a partner violates any aspects of our Code of Conduct or International Anti-Corruption Policy, both of which are attached to the agreements we sign with partners.
In 2020, we also introduced an e-training on Vaisala’s Code of Conduct targeted at our distribution partners. The completion of the training is monitored via the training system. The training emphasizes anti-corruption and bribery, and it aims to ensure that partners under-stand Vaisala’s principles and can act according to them in all situations.
Supplier Code of ConductThe Supplier Code of Conduct reflects Vaisala’s values and operating principles and is based on the principles created by the International Labour Organization (ILO), the United Nations Global Compact initia-tive, and the Responsible Business Alliance (formerly EICC). In addition, the Supplier Code of Conduct includes requirements concerning standards and procedures in line with the Business Social Compliance Initiative (BSCI) and Social Accountability International (SAI).
Respect for human rightsVaisala is committed to respecting human rights as defined in the United Nations’ Universal Declaration of Human Rights and endorses ILO’s Declaration of Fundamental Principles and Rights at Work. Vaisala does not condone violations of human rights or labor laws in any part of its supply chain. The company takes appropriate measures to ensure that the risk of violations of its Code of Conduct or Supplier Code of Conduct is minimized in its immediate supply chain.
Vaisala’s internal human rights risk assessment suggests that the risk of most salient human rights violations is the highest beyond the third tier of suppliers. These risks are the same as in other electronics manufacturing supply chains, including unpaid or excessive overtime, dangerous working conditions, bonded labor, and low wages. The human rights risks in Vaisala’s supply chain are mitigated by care-
fully choosing preferred suppliers and working closely with first-tier suppliers, insisting on policies that go beyond the requirements of local laws and obliging them to ensure that human rights are respected also in their supply chains.
Another area where we have identified a high need to understand and manage human rights risks is our global project subcontractor net-work, where we need to ensure, for example, that our partners follow adequate health and safety standards. Therefore, we have started to give concrete safety instructions and trainings to our subcontractors, in addition to ensuring their commitment to Vaisala’s Supplier Code of Conduct.
We also train our sourcing personnel and project managers operat-ing in high-risk areas to identify and manage human rights risks while operating with potential or selected suppliers or subcontractors.
Conflict mineralsVaisala is committed to responsible sourcing of minerals. Our operating model for ensuring the responsibility of the minerals supply chain follows the Organisation for Economic Co-operation and Development (OECD) Guidance, and we use the Responsible Minerals Initiative’s (RMI) reporting template to find out and document the origin of the minerals.
Vaisala’s suppliers must aim to ensure that the parts delivered to V aisala do not contain any minerals that have their origin in conflict areas, currently including but not limited to the tin, tungsten, tantalum, and gold mined in the Democratic Republic of Congo (DRC) or in adjoining countries. If parts or products supplied to Vaisala contain tin, tantalum, tungsten, or gold, the supplier must ensure responsible sourcing of these minerals and report to Vaisala using RMI’s Conflict Minerals Reporting Template (CMRT).

52
OUR YEAR SUSTAINABILITYCREATING VALUE GOVERNANCE FINANCIALS
Product safetyVaisala is known for its reliable products, and customer health and safety are key considerations at all stages of our product develop-ment. We follow all safety standards applicable to each product in our product design. Our products are carefully designed and type tested keeping in mind their safe and environmentally friendly delivery, use, maintenance, and decommissioning. User documentation is built to support these goals. Accredited laboratories are widely used to ensure the safe design of our products. Vaisala performs an electrical safety inspection on all applicable products.
Compliance monitoring and violationsCompliance with the Code of Conduct and other guidelines is continuously monitored by regional and business area managers and immediate supervisors as well as by means of internal audits. If any Vaisala employee knows or suspects that the Code of Conduct or the International Anti-Corruption Policy is being violated, they must report the incident. Vaisala provides a whistleblowing channel for its employees and external stakeholders for reporting violations. Through the channel, they may report suspected violations or communicate others concerns.
The channel can be used via email or regular mail, and messages can also be sent anonymously. Vaisala ensures that the reporting does not cause any kind of harm to the complainant. The reported complaints or concerns are addressed immediately, and the complainants are informed about the progress of the handling process, if they have given their contact information.
Vaisala has a Compliance Committee, which monitors compliance with the Code of Conduct and other guidelines as well as processes reports of suspected non-compliance. The Committee consists of members from the Legal Department, Finance & Control, and Human Resources and is headed by the Senior Vice President for Compliance and Risk Management.
In 2020, the Committee became aware of one suspected violation of the Code of Conduct, which was related to the company’s practices when ending an employment relationship. The suspected violation has been investigated and no violation could be found. The case was
handled in cooperation with the Human Resources department, and the result of the investigation has been reported to the complainant.
There were no complaints or sanctions by the authorities during 2020. No incidents of corruption, anti-competitive behavior, anti-trust or monopoly practices, or any other violations of laws or regulations were identified. Furthermore, no violations of human rights, labor rights, or environmental legislation or concerns related to these were identified in the immediate supply chain.
Read moreRead more about Vaisala’s policies: vaisala.com/standards-and-policiesVaisala whistleblowing channel can be reached at [email protected]
Ethics and compliance

53
OUR YEAR SUSTAINABILITYCREATING VALUE GOVERNANCE FINANCIALS
Responsible supply chainsIn its supply chain, Vaisala seeks to promote innovation and competitive advantage responsibly through cooperation. Our business operations are based on high mix and low volumes. Managing this complexity requires effective coordination of hundreds of suppliers and selected strategic partners. To deliver on our customer promise and meet stake-holder expectations, we must have a reliable and responsible supply chain. We set strict requirements for our suppliers, and we cooperate with them closely over the long term, which enables both parties to further develop their operations.
Typical product supply chainVaisala’s direct suppliers are generally located close to its product devel opment operations and manufacturing sites. We purchase subassem blies, components, and mechanical parts mainly from Finland and other European countries as well as the United States. Our up-stream supply chains resemble other typical supply chains in the global electronics manufacturing industry.
Supplier managementVaisala’s supplier management model has four categories: potential, approved, preferred, and strategic suppliers. In addition to these categories, suppliers may be, for example, in phase-out when their contracts are being discontinued gradually or on watch-list when they are monitored closely due to serious issues experienced over the long term. The classification defines the relationship between Vaisala and the supplier and outlines the management model for each category. All suppliers are expected to meet certain requirements before they can be approved and categorized. The requirements for suppliers are based

54
OUR YEAR SUSTAINABILITYCREATING VALUE GOVERNANCE FINANCIALS
on the classification, risk assessment, and spend. Suppliers must also commit to the Supplier Code of Conduct.
We use a Supplier Sustainability Self-Assessment Questionnaire (SAQ) as part of supplier development in all categories in order to assess environmental, social, and governance (ESG) risks. The question-naire exposes risks related to environmental management, occupational safety, social responsibility, governance, and supply chain management. If a supplier’s assessment does not meet Vaisala’s requirements, the supplier is expected to implement corrective measures to improve their sustainability as part of their comprehensive development plan, and any weaknesses are addressed in cooperation with the supplier.
As part of supplier management, we also audit our suppliers to check aspects related to quality and sustainability, such as their knowledge and application of our Supplier Code of Conduct, labor and human rights, occupational safety, environmental management, product safety (RoHS and REACH), and conflict mineral management.
In 2020, we continued the integration of the new suppliers that came through the acquisitions of Leosphere and K-Patents in late 2018 into the sustainability management processes of Vaisala’s supply chain, prioritizing the suppliers based on risk and spend. Primarily, effort has been put into having the suppliers sign Vaisala’s Supplier Code of Conduct, and a good level has already been reached. Only a few ESG risk evaluations following Vaisala’s process have been made for these new suppliers, and the work will be continued in the coming years.
Read moreRead more about supplier management at Vaisala: vaisala.com/suppliers
83%(2019: 82%)of purchases
(based on spend) were made from
suppliers rated on ESG metrics
454 (2019: 490)
suppliers
21(2019: 28)
suppliers audited during the year
92%(2019: 87%) of purchases
(based on spend) were made from
suppliers who had signed the
Supplier Code of Conduct
* By direct suppliers, we mean suppliers related to our products, which includes manufacturing partners as well as mechanics and other component suppliers.
Key figures of Vaisala’s direct supply chain*
SPEND BY SUPPLIER
CATEGORY
50%
18% 27% 5%
Strategic suppliers(11 suppliers)Preferred suppliers(44 suppliers)Approved suppliers(331 suppliers)Other (68 suppliers)
Responsible supply chains
SPEND BY REGION
Finland(161 suppliers)
Other EU(131 suppliers)North America(109 suppliers)China(45 suppliers)South-East Asia (4 suppliers)Japan, South Korea, and Australia (4 suppliers)
1%
60%
25% 10%2%2%
OUR YEAR SUSTAINABILITYCREATING VALUE GOVERNANCE FINANCIALS

55
OUR YEAR SUSTAINABILITYCREATING VALUE GOVERNANCE FINANCIALS
UN Global Compact
Human rights
Principle 1: Businesses should support and respect the protection of internationally proclaimed human rights.
p. 51 Ethics and compliance
Principle 2: Make sure that they are not complicit in human rights abuses.
p. 51 Ethics and compliance
Labor standards
Principle 3: Businesses should uphold the freedom of association and the effective recognition of the right to collective bargaining.
p. 46 Collective agreements and trade unions
Principle 4: The elimination of all forms of forced and compulsory labor.
p. 51 Ethics and compliance
Principle 5: The effective abolition of child labor. p. 51 Ethics and compliance
Principle 6: The elimination of discrimination in respect of employment and occupation.
p. 48 Diversity and equality, p. 51 Ethics and compliance
Environment
Principle 7: Businesses should support a precautionary approach to environmental challenges.
p. 45 Sustainable product design and management
Principle 8: Undertake initiatives to promote greater environmental responsibility.
p. 39 Environmental management, p. 41 Energy and emissions, p. 42 Waste
Principle 9: Encourage the development and diffusion of environmentally friendly technologies.
p. 45 Sustainable product design and management
Anti-corruption
Principle 10: Businesses should work against corruption in all its forms, including extortion and bribery.
p. 51 Ethics and compliance
Vaisala joined the UN Global Compact in 2008 and has committed to following the ten guiding principles of the initiative. These ten principles are reflected in Vaisala’s Code of Conduct, and we report on the implementation of the principles on an annual basis as part of our sustainability reporting. Our sustainability reports have qualified for the Global Compact Advanced differentiation level since its introduction in 2010.

56
OUR YEAR SUSTAINABILITYCREATING VALUE GOVERNANCE FINANCIALS
Signing of non-financial information
Vantaa February 18, 2021
Petri Castrén Antti Jääskeläinen Petra Lundström
Jukka Rinnevaara Kaarina Ståhlberg Tuomas Syrjänen
Raimo Voipio Ville Voipio Kai ÖistämöChairman of the Vice Chairman of the President and CEO Board of Directors Board of Directors
Disclosure of non-financial information in accordance with Finnish Accounting Act is presented in the annual report’s Sustainable business practices section as well as the chapters Business model in Our business section, Dashboard in the Creating value section, and Risk management in the Governance section.

57
OUR YEAR SUSTAINABILITYCREATING VALUE GOVERNANCE FINANCIALS
Independent limited assurance reportTo the Management of Vaisala OyjWe have been engaged by the management of Vaisala Oyj (hereafter Vaisala) to provide a limited assurance on the GRI indicators disclosed in the Vaisala’s annual report for the reporting period of January 1, 2020 to December 31, 2020. In the scope of the assurance were the indicators presented in the Sustainable business practices section on pages 38–55 and the indicator 201-1 on page 31 of the report (hereafter Sustainability Information).
Management’s responsibilityManagement is responsible for the preparation of the Sustainability Information in accordance with the Reporting criteria as set out in Vaisala’s reporting principles on page 38 of the Non-Financial Information report and the Sustainability Reporting Standards (Core) of the Global Reporting Initiative. This responsibility includes: designing, implementing, and maintaining internal control relevant to the preparation and fair presentation of the Sustainability Information that are free from material misstatement, whether due to fraud or error, selecting and applying appropriate criteria, and making estimates that are reasonable in the circumstances.
Assurance provider’s responsibilityOur responsibility is to express a limited assurance conclusion on the Sustainability Information based on our engagement. We conducted our assurance engagement in accordance with International Standard on Assurance Engagements (ISAE) 3000 (Revised). The assurance criteria used was the Sustainability Reporting Standards of the Global Reporting Initiative.
ISAE 3000 standard requires that we comply with ethical requirements and plan and perform the assurance engagement to obtain limited assur-ance whether any matters come to our attention that cause us to believe that the Sustainability Information has not been prepared, in all material respects, in accordance with the Reporting criteria.
We did not perform any assurance procedures on the prospective
information, such as targets, expectations, and ambitions, disclosed in the Sustainability Information. Consequently, we draw no conclusion on the prospective information. Our assurance report is made in accordance with the terms of our engagement with Vaisala. We do not accept or assume responsibility to anyone other than Vaisala for our work, for this assurance report, or for the conclusions we have reached.
A limited assurance engagement with respect to responsibility related data involves performing procedures to obtain evidence about the Sustain-ability Information. The procedures performed depend on the practition-er’s judgment, but their nature is different from, and their extent is less than, a reasonable assurance engagement. They do not include detailed testing of source data or the operating effectiveness of processes and internal controls, and consequently they do not enable us to obtain the assurance necessary to become aware of all significant matters that might be identified in a reasonable assurance engagement.
Our procedures on this engagement included:• Interviewing senior management of the Company;
• Conducting interviews with employees responsible for the collection and reporting of the Sustainability Information and reviewing of the processes and systems for data gathering, including the aggregation of the data for the Sustainability Information;
• Reviewing internal and external documentation to verify to what extent these documents and data support the information included in the Sus-tainability Information and evaluating whether the information present-ed in the Sustainability Information is in line with our overall knowledge of corporate responsibility at Vaisala;
• Performing analytical review procedures and testing data on a sam-ple basis to assess the reasonability of the presented Sustain ability Information;
• Conducting an interview with Vaisala’s Paris site through a video conference
• Assessing that the Sustainability Information has been prepared in accordance with the Sustainability Reporting Standards (Core) of the Global Reporting Initiative.
We believe that the evidence we have obtained is sufficient and appropriate to provide a basis for our conclusion.
Our independence, quality control, and competencesWe have complied with Deloitte’s independence policies which address and, in certain cases, exceed the requirements of the Code of Ethics for professional accountants issued by the International Ethics Standards Board for Accountants. We have maintained our independence and objectivity throughout the year, and there were no events or prohibited services provided which could impair our independence and objectivity.
Deloitte Oy applies International Standard on Quality Control 1 and accordingly maintains a comprehensive system of quality control including documented policies and procedures regarding compliance with ethical requirements, professional standards, and applicable legal and regulatory requirements. This engagement was conducted by a multidisciplinary team including assurance and sustainability expertise with professional qualifications. Our team is experienced in providing sustainability reporting assurance.
ConclusionOn the basis of the procedures we have performed, nothing has come to our attention that causes us to believe that the information subject to the assurance engagement is not prepared, in all material respects, in accordance with the Sustainability Reporting Standards (Core) of the Global Reporting Initiative or that the Sustainability Information is not properly prepared, in all material respects, in accordance with the Reporting criteria.
Our assurance statement should be read in conjunction with the inherent limitations of accuracy and completeness for sustainability information.
Vantaa February 18, 2021Deloitte Oy
Reeta Virolainen Teemu Jaatinen Authorized Public Accountant Authorized Public Accountant

58
OUR YEAR SUSTAINABILITYCREATING VALUE GOVERNANCE FINANCIALS
GRI content indexThe Global Reporting Initiative (GRI) content index is provided to assist the reader in navigating through the annual report and to compare it to the GRI Standards Guidelines. For more information about the guidelines, please see globalreporting.org.
Topic and disclosureDisclosure number References and reasons for omissions
GENERAL DISCLOSURES
GRI 102: GENERAL DISCLOSURES 2016
1. Organizational profile
Name of the organization 102-1 Vaisala Oyj
Activities, brands, products, and services 102-2 3 Business areas
Location of headquarters 102-3 Vantaa, Finland
Location of operations 102-4 4 Vaisala as a global company, 38 Boundaries,
137 Consolidated financial statements: Note 26. Subsidiaries
Ownership and legal form 102-5 96 Board of Directors’ report: Ownership structure
Markets served 102-6 3 Business areas, 4 Vaisala as a global company, 11 Business model
Scale of the organization 102-7 3 Key figures for 2020 (net sales, number of employees), 4 Vaisala as a global company (number of offices), 11 Business model (number of products), 16 Operations (Operations in numbers), 100 Consolidated statement of financial position
Information on employees and other workers 102-8 47 Personnel by area and contract
Gender distribution of temporary and part-time employees is not reported separately due to the small amount of such employees. Work performed by workers who are not employees is not reported due to the small amount of such work.
Supply chain 102-9 53–54 Responsible supply chains
Significant changes to the organization and its supply chain 102-10 84–97 Board of Directors’ report, 129 Consolidated financial statements: Capital structure
Precautionary principle or approach 102-11 45 Sustainable product design and management
External initiatives 102-12 33–34 Active community outreach and scientific collaboration, 36 Sustainable technologies in a responsible way, 55 UN Global Compact
Membership of associations 102-13 33–34 Active community outreach and scientific collaboration, 46 Collective agreements and trade unions

59
OUR YEAR SUSTAINABILITYCREATING VALUE GOVERNANCE FINANCIALS
Topic and disclosureDisclosure number References and reasons for omissions
2. Strategy
Statement from senior decision-maker 102-14 5–6 Chairman and CEO’s message
Key impacts, risks, and opportunities 102-15 18–19 UN Sustainable Development Goals, 20 Value creation model, 21 Dashboard, 22–23 Megatrends, 74–77 Risk management
3. Ethics and integrity
Values, principles, standards, and norms of behavior 102-16 10 Strategy, 51–52 Ethics and compliance
Mechanisms for advice and concerns about ethics 102-17 51–52 Ethics and compliance
4. Governance
Governance structure 102-18 67–73 Corporate Governance Statement
Nominating and selecting the highest governance body 102-24 68 Selection criteria, diversity, and the independence of the members
Highest governance body’s role in sustainability reporting 102-32 The Board of Directors approves the sustainability information included in the annual report.
5. Stakeholder engagement
List of stakeholder groups 102-40 24 Stakeholder engagement
Collective bargaining agreements 102-41 69% of employees are covered by collective bargaining agreements.
Identifying and selecting stakeholders 102-42 24 Stakeholder engagement
Approach to stakeholder engagement 102-43 24 Stakeholder engagement
Key topics and concerns raised102-44
20 Value creation model, 25–26 Value for customers, 27–28 Value for employees, 29–32 Value for society and the environment, 35–36 Value for investors
6. Reporting practice
Entities included in the consolidated financial statements 102-45 137 Consolidated financial statements: Note 26. Subsidiaries
Defining report content and topic boundaries 102-46 38 Reporting principles, policies, and due diligence
List of material topics 102-47 18–19 UN Sustainable Development Goals, 20 Value creation model, 25–26 Value for customers, 27–28 Value for employees, 29–32 Value for society and the environment, 35–36 Value for investors, 39–45 Environment, 46–48 Personnel, 49–50 Occupational health and safety, 51–52 Ethics and compliance, 53–54 Responsible supply chains
GRI content index

60
OUR YEAR SUSTAINABILITYCREATING VALUE GOVERNANCE FINANCIALS
Topic and disclosureDisclosure number References and reasons for omissions
Restatements of information 102-48 No restatements
Changes in reporting 102-49 39 Environmental impacts
In previous years, we have also reported the water consumption of our manufacturing sites, but we have recognized that its share of our environmental impacts is minor. We are therefore no longer reporting it.
Reporting period 102-50 Calendar year 2020
Date of most recent report 102-51 25.2.2020
Reporting cycle 102-52 Annually
Contact point for questions regarding the report 102-53 164 Contacts
Claims of reporting in accordance with the GRI Standards 102-54 This report has been prepared in accordance with the GRI Standards: Core option.
GRI content index 102-55
External assurance 102-56 38 Independent assurance, 57 Independent limited assurance report
ECONOMIC PERFORMANCE
GRI 103: MANAGEMENT APPROACH 2016 103-1-3 31 Economic value
GRI 201: ECONOMIC PERFORMANCE 2016
Direct economic value generated and distributed 201-1 31 Direct economic value generated and distributed
Figures are reported on Group level. We consider the regional level reporting of these figures proprietary information.
Defined benefit plans and obligations and other retirement plans 201-3 110–112 Consolidated financial statements: Note 6. Pension obligations
Percentage of salary contributed and participation level are not reported.
GRI content index
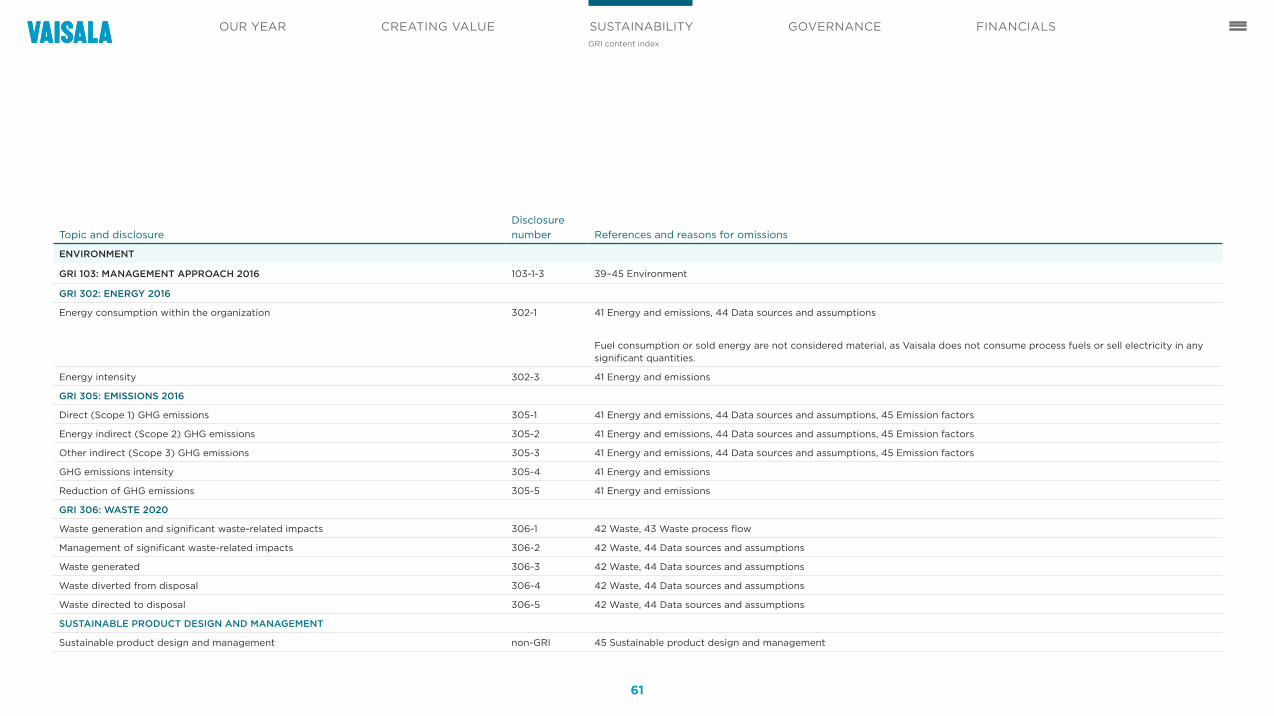
61
OUR YEAR SUSTAINABILITYCREATING VALUE GOVERNANCE FINANCIALS
Topic and disclosureDisclosure number References and reasons for omissions
ENVIRONMENT
GRI 103: MANAGEMENT APPROACH 2016 103-1-3 39–45 Environment
GRI 302: ENERGY 2016
Energy consumption within the organization 302-1 41 Energy and emissions, 44 Data sources and assumptions
Fuel consumption or sold energy are not considered material, as Vaisala does not consume process fuels or sell electricity in any significant quantities.
Energy intensity 302-3 41 Energy and emissions
GRI 305: EMISSIONS 2016
Direct (Scope 1) GHG emissions 305-1 41 Energy and emissions, 44 Data sources and assumptions, 45 Emission factors
Energy indirect (Scope 2) GHG emissions 305-2 41 Energy and emissions, 44 Data sources and assumptions, 45 Emission factors
Other indirect (Scope 3) GHG emissions 305-3 41 Energy and emissions, 44 Data sources and assumptions, 45 Emission factors
GHG emissions intensity 305-4 41 Energy and emissions
Reduction of GHG emissions 305-5 41 Energy and emissions
GRI 306: WASTE 2020
Waste generation and significant waste-related impacts 306- 1 42 Waste, 43 Waste process flow
Management of significant waste-related impacts 306 -2 42 Waste, 44 Data sources and assumptions
Waste generated 306- 3 42 Waste, 44 Data sources and assumptions
Waste diverted from disposal 306 -4 42 Waste, 44 Data sources and assumptions
Waste directed to disposal 306 -5 42 Waste, 44 Data sources and assumptions
SUSTAINABLE PRODUCT DESIGN AND MANAGEMENT
Sustainable product design and management non- GRI 45 Sustainable product design and management
GRI content index

62
OUR YEAR SUSTAINABILITYCREATING VALUE GOVERNANCE FINANCIALS
Topic and disclosureDisclosure number References and reasons for omissions
PERSONNEL
GRI 103: MANAGEMENT APPROACH 2016 103 -1- 3 27–28 Value for employees, 46–48 Personnel
GRI 401: EMPLOYMENT 2016
New employee hires and employee turnover 401- 1 46 Employee turnover
GRI 402: LABOR/MANAGEMENT RELATIONS 2016
Minimum notice periods regarding operational changes 402 -1 The personnel in Finland (65% of Vaisala’s personnel) is covered by collective agreements of technology industries, which specify the minimum notice period. For other countries, the notice periods vary depending on legislation.
GRI 404: TRAINING AND EDUCATION 2016
Percentage of employees receiving regular performance and career development reviews 404- 3 28 Learning and development
As all of our employees are offered the opportunity to have annual development discussions, regional and gender distribution are not considered relevant to report for this indicator.
GRI 405: DIVERSITY AND EQUAL OPPORTUNITY 2016
Diversity of governance bodies and employees 405- 1 48 Diversity and equality, 78–79 Board of Directors (years of birth), 80 Management Group (years of birth)
Ratio of basic salary and remuneration of women to men 405 -2 48 Diversity and equality
The study was conducted only in Finland, which covers approximately 64% of Vaisala’s permanent employees. The study has not yet been conducted for other locations.
GRI 406: NON-DISCRIMINATION 2016
Incidents of discrimination and corrective actions taken 406 -1 No incidents of discrimination
GRI content index

63
OUR YEAR SUSTAINABILITYCREATING VALUE GOVERNANCE FINANCIALS
Topic and disclosureDisclosure number References and reasons for omissions
OCCUPATIONAL HEALTH AND SAFETY
GRI 103: MANAGEMENT APPROACH 2016 103-1- 3 49–50 Occupational health and safety
GRI 403: OCCUPATIONAL HEALTH AND SAFETY 2018
Occupational health and safety management system 403 -1 49 Occupational health and safety management
Hazard identification, risk assessment, and incident investigation 403 -2 49 Occupational health and safety management, 50 Proactive reporting and investigation
Occupational health services 403 -3 50 Occupational health services
Worker participation, consultation, and communication on occupational health and safety 403 -4 49 Collaboration
Worker training on occupational health and safety 403 -5 49 Occupational health and safety management
Promotion of worker health 403 -6 28 Well-being, 50 Occupational health services
Prevention and mitigation of occupational health and safety impacts directly linked by business relationships
403- 7 51 Respect for human rights
Workers covered by an occupational health and safety management system 403 -8 49 Occupational health and safety management
Work-related injuries 403 -9 49 Occupational health and safety management, 50 Injuries
Data for contractors is too limited for reporting.
GRI content index

64
OUR YEAR SUSTAINABILITYCREATING VALUE GOVERNANCE FINANCIALS
Topic and disclosureDisclosure number References and reasons for omissions
ETHICS AND COMPLIANCE
GRI 103: MANAGEMENT APPROACH 2016 103-1-3 51–52 Ethics and compliance
GRI 205: ANTI-CORRUPTION 2016
Communication and training about anti-corruption policies and procedures 205-2 51 Vaisala Code of Conduct, 51 Prevention of corruption and bribery
Confirmed incidents of corruption and actions taken 205-3 52 Compliance monitoring and violations (no incidents)
GRI 206: ANTI-COMPETITIVE BEHAVIOR 2016
Legal actions for anti-competitive behavior, anti-trust, and monopoly practices 206-1 52 Compliance monitoring and violations (no incidents)
GRI 307: ENVIRONMENTAL COMPLIANCE 2016
Non-compliance with environmental laws and regulations 307-1 52 Compliance monitoring and violations (no incidents)
GRI 407: FREEDOM OF ASSOCIATION AND COLLECTIVE BARGAINING 2016
Operations and suppliers in which the right to freedom of association and collective bargaining may be at risk
407-1 51 Respect for human rights, 53–54 Responsible supply chains
The topic is material only in some parts of the supply chain, not in Vaisala’s own operations.
GRI 408: CHILD LABOR 2016
Operations and suppliers at significant risk for incidents of child labor 408-1 51 Respect for human rights, 53–54 Responsible supply chains
The topic is material only in some parts of the supply chain, not in Vaisala’s own operations.
GRI 409: FORCED OR COMPULSORY LABOR 2016
Operations and suppliers at significant risk for incidents of forced or compulsory labor 409-1 51 Respect for human rights, 53–54 Responsible supply chains
The topic is material only in some parts of the supply chain, not in Vaisala’s own operations.
GRI 412: HUMAN RIGHTS ASSESSMENT 2016
Employee training on human rights policies or procedures 412 -2 Vaisala's Code of Conduct training, organized annually, includes also topics related to human rights.
GRI content index

65
OUR YEAR SUSTAINABILITYCREATING VALUE GOVERNANCE FINANCIALS
Topic and disclosureDisclosure number References and reasons for omissions
GRI 416: CUSTOMER HEALTH AND SAFETY 2016
Incidents of non-compliance concerning the health and safety impacts of products and services
416- 2 52 Compliance monitoring and violations (no incidents)
GRI 417: MARKETING AND LABELING 2016
Incidents of non-compliance concerning product and service information and labeling 417 -2 52 Compliance monitoring and violations (no incidents)
GRI 419: SOCIOECONOMIC COMPLIANCE 2016
Non-compliance with laws and regulations in the social and economic area 419- 1 52 Compliance monitoring and violations (no incidents)
RESPONSIBLE SUPPLY CHAINS
GRI 103: MANAGEMENT APPROACH 2016 103-1-3 53–54 Responsible supply chains
GRI 308: SUPPLIER ENVIRONMENTAL ASSESSMENT 2016
New suppliers that were screened using environmental criteria 308-1 The four new suppliers approved during 2020 had not been assessed with ESG criteria by the end of the reporting period. Three of these are related to Lesphere SAS whose supplier management integration is still in process. One new supplier was approved due to a change in an existing supplier’s legal entity followed by a merger. In this case, the ESG assessment had not yet been finished.
GRI 414: SUPPLIER SOCIAL ASSESSMENT 2016
New suppliers that were screened using social criteria 414-1 The four new suppliers approved during 2020 had not been assessed with ESG criteria by the end of the reporting period. Three of these are related to Lesphere SAS whose supplier management integration is still in process. One new supplier was approved due to a change in an existing supplier’s legal entity followed by a merger. In this case, the ESG assessment had not yet been finished.
GRI content index

6774788081
GovernanceCorporate Governance Statement 2020Risk managementBoard of DirectorsManagement GroupInformation for shareholders

67
OUR YEAR SUSTAINABILITYCREATING VALUE GOVERNANCE FINANCIALS
Corporate Governance Statement 2020Vaisala’s general governance principlesVaisala’s corporate governance is based on and complies with the laws of Finland and Vaisala’s Articles of Association. Consolidated financial statements and other financial reports are prepared according to the International Financial Reporting Standards (IFRS), approved by the EU. The company complies with the rules, regulations, and guidelines for listed companies issued by Nasdaq Helsinki Ltd and Finnish Supervisory Authority as well as Finnish Corporate Governance Code 2020 published by the Securities Market Association.
Vaisala Board of Directors has approved this Corporate Governance Statement in its meeting on February 18, 2021. Deloitte Oy, audit firm, the company’s auditor, has verified that the statement has been issued and that the general description of internal audit and risk management systems associated with the financial reporting process conforms to the same in financial statements.
Deviation from the recommendations of the Corporate Governance Code and explanation for the deviationThe term of the members of Vaisala’s Board of Directors deviates from the Recommendation 6 of Corporate Governance Code, which recom-mends a term of one year. The term of Vaisala’s member of the Board of Directors is determined in accordance with its Articles of Association. Under the Articles of Association, a member’s term is three years, beginning at the close of the General Meeting in which the member is elected and ending at the close of the third subsequent Annual General Meeting.
A longer term of office of the Board members is justified by the long-term development of Vaisala’s business as well as by the nature of the business. The practice has worked well, and Vaisala’s shareholders are committed to it.
Governing bodies The General Meeting, the Board of Directors, and the President and CEO, assisted by the Management Group, are responsible for the governance of the Vaisala Corporation.
General meeting The General Meeting is the supreme decision-making body of Vaisala, in which all the shareholders of the company can participate in the supervision and control of the company and exercise their right to vote, speak, and ask questions. The Annual General Meeting is held once a year before the end of June on a date determined by the Board of
Directors. It decides on the matters stipulated in the Finnish Limited Liability Companies Act and the Articles of Association. The decisions are mainly made with simple majority of votes.
The Chairman of the Board of Directors, members of the Board of Directors, and the President and CEO are present at the Annual General Meeting. The auditor is present at the Annual General Meeting. Board member candidates are present at the Annual General Meeting where they are elected. If the above-mentioned person or persons fail to attend the Annual General Meeting, Vaisala notifies the General Meeting of such non-attendance. The members of the Management Group participate in the Annual General Meeting, if possible.
Participation in the General Meeting requires that the shareholder
Management Group
President and CEO
Board of DirectorsExternal audit
AuditCommittee
Remuneration andHR Committee
Financialand internal
controlRisk
manage- ment
Internalaudit
General Meeting

68
OUR YEAR SUSTAINABILITYCREATING VALUE GOVERNANCE FINANCIALS
is registered in Vaisala’s shareholder register, maintained by Euroclear Finland Ltd, on the record date of the meeting and that he/she registers for the meeting by the date mentioned in the meeting notice.
Shareholders are entitled to have an issue placed on the agenda of the Annual General Meeting, provided that the issue can be decided upon by the Annual General Meeting according to the Limited Liability Companies Act. The request must be submitted in writing to the Board of Directors early enough that the issue can be included in the meeting notice. On its website, the company announces the date by which the shareholder must notify the Board of Directors of an issue to be added to the agenda of the Annual General Meeting. The date is available by the end of the previous financial year.
Vaisala publishes a notice of the Annual General Meeting no more than two months before the record date and no less than three weeks before the meeting on the company’s website or in any other way that may be decided by the Board of Directors, or Vaisala may deliver it directly to shareholders when required by law. In addition, Vaisala pub-lishes a meeting notice as a stock exchange release after the Board of Directors has decided on the convening of the Annual General Meeting. Agenda of the Annual General Meeting, proposals on decisions, and meeting documents are available on the company’s website at least three weeks prior to the meeting. Documents of the Annual General Meeting will be held on the company’s website for at least five years from the time of the meeting. Minutes of the meeting will be published on the company’s website within two weeks of the meeting.
Due to the COVID-19 pandemic, the Annual General Meeting 2020 was held on June 3, 2020 in accordance with the temporary legislative act approved by the Finnish Parliament on April 24, 2020 and in a man-ner that the shareholders, auditor, and members of Board of Directors were not present. Shareholders both voted and were allowed to ask questions in advance.
Board of Directors Competence, composition, and election The Board of Directors is responsible for the administration and the proper organization of the operations of the company. The Board acts in accordance with the Articles of Association and the applicable legis-lation as well as the instructions and recommendations of the Financial
Supervisory Authority and Nasdaq Helsinki Ltd. In accordance with the Articles of Association, Vaisala Corporation Board of Directors com-prises at least four and maximum eight members. The Annual General Meeting elects all Board members. The Board of Directors elects a Chairman and a Vice Chairman from among its members. Under the Articles of Association, the term of the Board members is three years. The term begins at the close of the General Meeting in which the member is elected and ends at the close of the third subsequent Annual General Meeting following the member’s election.
Selection criteria, diversity, and the independence of the members The primary goal in Board member election is to gather capability, expertise, and experience from various technologies, international relations, global business, and strategically significant industries to the Board of Directors. The Board should be considered as a whole that is capable of managing its tasks and duties in the best possible way. The goal of the election of the members of the Board of Directors is to ensure that the Board supports the development of the company’s current and future business. In addition, the Board should consist of members of both genders, and the members should have the chance to allocate a sufficient amount of time to managing their tasks. The goal is that there is at least 25% representation of both men and women in the Board of Direcctors.
Vaisala complies with the Finnish Corporate Governance Code 2020 in evaluation of the independence of the members of the Board. The majority of the members of the Board must be independent of the company, and at least two members in this majority must be independent of the company’s major shareholders. The Board of Directors evaluates the independence of the members annually based on an overall evaluation. This evaluation of a member takes into account information and analysis provided by the member himself/herself.
Vaisala Board of Directors in 2020 represents adequate expertise and experience as well as diversity on the established goals. All members of the Board of Directors were independent of the company and of the company’s major shareholders.
Meetings, duties, and decision-making The Board of Directors convenes at least eight times a year and if other-wise needed. The President and CEO and the Chief Financial Officer
also attend Board meetings. The other members of the Management Group attend Board meetings as required on the invitation of the Board of Directors. The Board of Directors may, on the basis of the Chairman’s decision, establish working groups from among its members in indi-vidual cases to prepare the matters allocated for it in order to ensure the effective organization of the Board of Directors’ work.
The Board of Directors operates in accordance with an approved written charter, published on the company’s website. Meetings may, if necessary, be held as conference calls, video meetings, or e-mail meetings. Minutes of the meetings are compiled in English, with annually running numbering. The General Counsel acts as the Secretary of the Board of Directors.
A member of the Board of Directors is not allowed to participate if he/she is biased in that issue between him/her and the company or between the company and a third party when there is a possibility to achieve essential advantage to him/her, which may conflict with the company’s interest.
The members of the Board of Directors are bound by obligations related to commercial and trade secrets as well as by the restrictions and requirements of the Market Abuse Regulation (EU) N:o 596/2014 (MAR) and the restrictions and obligations of Vaisala’s Insider Policy. In their de-cision-making and other activities, the Board and its members must act in accordance with the interest of the company and all its shareholders as well as in accordance with the principles of due care and data protection .
The Board will have a quorum when more than half of the members are present. Decisions are made on a simple majority basis, and when the votes are even, the Chairman has the casting vote. When the votes for election of the Chairman are even, the Chairman is elected by drawing lots.
The President and CEO is responsible for the execution of the Board of Directors’ decisions, oversees their implementation, and reports to the Board on deficiencies or problems observed during the execution.
Main responsibilities of the Board of Directors are • to decide on the election and dismissal of the President and CEO
• to decide on the employment terms of the President and CEO
• to decide on the election and dismissal of the members of the Management Group and their job descriptions based on the President and CEO’s proposition
Corporate Governance Statement

69
OUR YEAR SUSTAINABILITYCREATING VALUE GOVERNANCE FINANCIALS
• to ensure that the company has organized internal control of accounting and financial management as well as to monitor the effectiveness of supervision
• to determine the company’s strategy and oversee its implementation and to approve the strategic plans of the business areas
• to determine the company’s long-term targets and to monitor their implementation and to accept business areas’ long-term targets
• to assess the company’s and its business areas’ annual action plans
• to approve the company’s and its business areas’ financial targets
• to make the business decisions, the value of which exceeds the approval limit of the President and CEO according to the Approval Policy, such as business reorganizations, acquisitions and dives-titures, major contracts and liabilities, investments, and financing arrangements
• to review and approve the company’s most important policies and instructions, such as Approval Policy, Treasury Policy, Disclosure Policy, Dividend Policy, Risk Management Policy, Insider Policy, Code of Conduct, and Anti-Corruption Policy
• to decide on management remuneration and incentive systems
Members of the Board of Directors in 2020 During January 1–June 3, 2020, the Board of Directors comprised eight members. The Chairman of the Board of Directors was Raimo Voipio, the Vice Chairman was Ville Voipio, and the members were Petri Castrén, Petra Lundström, Jukka Rinnevaara, Kaarina Ståhlberg, Tuomas Syrjänen, and Pertti Torstila. The Board of Directors’ secretary was General Counsel Katriina Vainio.
The Annual General Meeting held on June 3, 2020 confirmed that the number of Board members is eight. Petri Castrén, Petra Lundström, Jukka Rinnevaara, Kaarina Ståhlberg, Tuomas Syrjänen, Raimo Voipio, and Ville Voipio continued as members of the Board of Directors. Antti Jääskeläinen started as a new member of the Board. The Chairman of the Board of Directors is Raimo Voipio, and the Vice Chairman is Ville Voipio. The Board of Directors’ secretary is General Counsel Katriina Vainio.
Member Member sinceEnd of
term Born Education Nationality Main occupationShareholding Dec 31, 2020
Raimo Voipio, Chairman
1989
Chairman since 1994 2023 1955 M.Sc. (Eng.) Finnish Board professional
570,524 (A share)
454,296 (K share)
Ville Voipio Vice Chairman 2015 2021 1974 D.Sc. (Tech.) Finnish CTO, Si-Tecno Oy
396,493 (A share)
96,712 (K share)
Petri Castrén 2017 2022 1962
LL.M., MBA (University of Connecticut) Finnish CFO, Kemira Oyj 2,807 (A share)
Antti Jääskeläinen 2020 2023 1972
M.Sc. (Eng.), M.Sc. (Econ.),
MBA (INSEAD, France) Finnish
Executive Vice President, UPM
Raflatac 406 (A share)
Petra Lundström 2014 2021 1966M.Sc.
(Tech. Physics) Finnish
Vice President, Nucle-ar Services, Fortum Power and Heat Oy 6,207 (A share)
Jukka Rinnevaara 2019 2023 1961 M.Sc. (Econ.) FinnishPresident and CEO, Teleste Corporation 1,126 (A share)
Kaarina Ståhlberg 2016 2022 1966LL.M (Helsinki and
Columbia Universities) FinnishGeneral Counsel and
M&A, Posti Group Oyj 5,607 (A share)
Tuomas Syrjänen 2019 2022 1976 M.Sc. (El. Eng.) FinnishProgram Director – AI Renewal, Futurice Oy 2,476 (A share)
Total
985,646 (A share)
551,008 (K share)
1,536,654 (Total)
Shareholdings include also shares held by the Board of Directors’ controlled organizations.In accordance with the recommendation 10, all Board members are independent of the company and of significant shareholders of the company.
Composition of the Board of Directors Dec 31, 2020
Corporate Governance Statement

70
OUR YEAR SUSTAINABILITYCREATING VALUE GOVERNANCE FINANCIALS
Attendance in board meetings 2020
MemberAttendance/
number of meetings Attendance %
Raimo Voipio (Chairman) 16/16 100
Petri Castrén 16/16 100
Antti Jääskeläinen 8/8 100
Petra Lundström 16/16 100
Jukka Rinnevaara 16/16 100
Kaarina Ståhlberg 16/16 100
Tuomas Syrjänen 15/16 94
Pertti Torstila 7/7 100
Ville Voipio 16/16 100
Board committees The Board of Directors has two permanent committees: Audit Committee and Remuneration and HR Committee. The members and the chairs of the Committees are appointed annually from among the members of the Board of Directors in accordance with the charter of the respective committee.
Audit Committee The Audit Committee assists the Board of Directors in supervising the company’s accounting and asset management, risk management, as well as in organizing internal controls and external and internal audits. The Audit Committee manages its tasks in accordance with the charter approved by the Board of Directors, the Securities Market Association’s Finnish Corporate Governance Code, as well as the applicable laws and regulations. The Audit Committee’s charter is published as part of the charter of the Board of Directors on the company’s website. The Audit Committee reports regularly about its meetings to the Board of Directors.
The Audit Committee comprises at least three members, appointed annually by the Board of Directors from among its members. The members of the committee must be independent of the company, and at least one member must also be independent of significant shareholders of the company. A member of the Audit Committee may not participate in the company’s or its group company’s daily management. Members of the Audit Committee have sufficient expertise and experience in matters forming part of the Audit Committee’s duties and of the mandatory tasks related to audit.
Remuneration and HR CommitteeThe Remuneration and HR Committee is responsible for preparing human resources matters pertaining to the compensation of the President and CEO as well as top management, evaluation of the performance of the President and CEO and the Management Group, and to remuneration and incentive plans. Remuneration and HR Committee prepares Remuneration Policy for governing bodies and Remuneration Report. Additionally, the Remuneration Committee oversees the performance evaluation and successor planning of top management. The Remuneration and HR Committee’s charter is available as part of the charter of the Board of Directors on the company’s website. The Remuneration and HR Committee reports regularly about its meetings to the Board of Directors.
The Remuneration and HR Committee comprises at least three members, appointed annually by the Board of Directors from among its members. The majority of the members of the committee must be independent of the company.
Temporary Nomination CommitteeIn 2020, the Board of Directors appointed a temporary four-member Nomination Committee from among its members to assist in the selection of President and CEO. The Committee was active during January–April 2020, and it reported regularly of its actions to the Board of Directors.
Committee members and their attendance in committee meetings in 2020
Committee Member
Attendance/number of meetings Attendance %
Audit Committee
Kaarina Ståhlberg
(Chair) 4/5 80
Petri Castrén 5/5 100
Antti Jääskeläinen
(as of June 3, 2020) 3/3 100
Jukka Rinnevaara
(until June 3, 2020) 2/2 100
Ville Voipio 5/5 100
Remunera-tion and HR Committee
Ville Voipio (Chair) 6/6 100
Petri Castrén
(until June 3, 2020) 1/1 100
Petra Lundström 6/6 100
Jukka Rinnevaara
(as of June 3, 2020) 5/5 100
Temporary Nomination Committee
Raimo Voipio (Chair) 10/10 100
Jukka Rinnevaara 10/10 100
Kaarina Ståhlberg 10/10 100
Ville Voipio 10/10 100
All members of the Audit Committee as well as the Remuneration and HR Com-mittee are independent of both the company and its significant shareholders. Members of the temporary Nomination Committee were independent of both the company and its significant shareholders.
Corporate Governance Statement

71
OUR YEAR SUSTAINABILITYCREATING VALUE GOVERNANCE FINANCIALS
President and CEO The Board of Directors appoints the President and CEO. The President and CEO is responsible for the day-to-day management of the company in accordance with the guidelines and instructions given by the Board of Directors and informs the Board of Directors of the development of the company’s business and financial situation. The President and CEO is responsible for ensuring that the company’s accounting is legally compliant and that its financial affairs have been arranged in a reliable manner. Kjell Forsén was the President and CEO of Vaisala as well as the Chairman of Vaisala Management Group since 2006 until the end of September 2020. He retired at the end of the year. Kai Öistämö started as President and CEO in October 2020. He was born in 1964 and holds a Ph.D. degree in computer science.
Management Group The President and CEO is the Chairman of the Management Group. In 2020, the Management Group comprised seven members. The Management Group meets at least once a month to assist the President and CEO in developing and implementing the strategy, managing operational business, as well as preparing matters handled by the Board. The Management Group draws up annual operational and financial plans as well as targets related to these plans, monitors the implementation of the plans, and prepares major investments and acquisitions. The President and CEO is responsible for the decisions made by the Management Group. Members of the Management Group are responsible for implementing the decisions in their own areas of responsibility.
Members of the Management Group are the Executive Vice Presidents of both business areas, the Chief Financial Officer, the Executive Vice President of Operations, the Executive Vice President of Human Resources, as well as the Group General Counsel. The General Counsel acts as secretary to the Management Group.
Members of the Management Group Dec 31, 2020
Director Member since Born Education Nationality Position at VaisalaShareholding Dec 31, 2020
Kai Öistämö 2020 1964PhD (Computer science) Finnish President and CEO -
Mari Heusala 2019 1966 M.Sc. (Econ.) Finnish EVP, Human Resources -
Sampsa Lahtinen 2013 1963M.Sc. (El. Eng.) Finnish
EVP, Industrial Measurements business area 25,606 (A share)
Kaarina Muurinen 2011 1958 M.Sc. (Econ.) Finnish CFO 29,496 (A share)
Vesa Pylvänäinen 2011 1970 M.Sc. (Econ.) Finnish EVP, Operations 20,412 (A share)
Jarkko Sairanen 2016 1963M.Sc. (Ind. Eng.), MBA (INSEAD) Finnish
EVP, Weather and Environment business area 13,176 (A share)
Katriina Vainio 2017 1967 LL.M. Finnish EVP, Group General Counsel 13,088 (A share)
Total 101,778 (A share)
Shareholdings include also shares held by the Management Group’s controlled organizations.
Vaisala announced on January 1, 2021 that Olli Nastamo, M.Sc. (Engineering), b. 1956, has been appointed Executive Vice President, Operational Excellence as of March 1, 2021. He becomes a member of the Vaisala Management Group and reports to the President and CEO Kai Öistämö. With this appointment, the number of manage-ment group members rises to eight (8).
Corporate Governance Statement

72
OUR YEAR SUSTAINABILITYCREATING VALUE GOVERNANCE FINANCIALS
design. Most important internal steering instruments for financial reporting comprise the Code of Conduct, Approval Policy, Treasury Policy, Credit Policy, Disclosure Policy, accounting policies, and other reporting instructions.
Risk assessment Risk assessment as regards financial reporting aims to identify and systematically evaluate most significant threats at the levels of Vaisala, reporting segments, functions, and processes. As a result of risk assessment, the company defines control targets through which it seeks to ensure that the fundamental requirements placed on financial reporting are fulfilled. Information on the development of essential risk areas as well as reactions to the risks are communicated regularly to the Audit Committee.
Control activities The President and CEO is operationally responsible for internal controls. Internal control related to financial activities as well as to control of the business and the management has been integrated into Vaisala’s business processes. The company has defined and documented significant internal control activities related to its financial statements reporting process as part of business processes. Approval mechanisms, access rights, segregation of duties, authorizations, verifications, reconciliations, and follow-up of financial reporting are essential internal activities.
All business units have their own defined controller function whose representatives participate in planning and evaluating the unit’s performance. They ensure that monthly and quarterly financial reporting follows the company’s policies and instructions and that all financial reporting is delivered on time. The management follows up the achievement of targets through monthly management reporting routines. The Chief Financial Officer regularly reports the results of the internal control work and the efficiency of the control activities to the Audit Committee.
Communications Vaisala seeks to ensure that the internal and external communication of the company is open, transparent, accurate, and timely. The Disclosure
Controls
Main features of the internal control and risk management systems pertaining to the financial reporting process Internal control seeks to ensure the company’s compliance with applicable laws, regulations, Code of Conduct, and with other recommendations as well as the reliability of financial and operational reporting. Furthermore, internal control seeks to safeguard the assets of the company and to ensure overall effectiveness and efficiency of operations to meet strategic, operational, and financial targets. Internal control practices are aligned with the risk management process. The goal of risk management is to support strategy and achievement of targets by anticipating and reacting to potential business threats and opportunities.
Vaisala’s operating model of internal control and risk management related to financial reporting aims to provide sufficient assurance regarding the reliability of financial reporting and that the financial statements have been prepared in accordance with the applicable laws and regulations, accepted accounting principles (IFRS), and other requirements for listed companies. The principal components of internal control are control environment, risk assessment, control activities, communications, and monitoring.
Control environment The Board of Directors has the overall responsibility for the internal control of financial reporting. The Board of Directors has established a written charter that clarifies its responsibilities and regulates the internal distribution of work of the Board of Directors and its committees. The Board of Directors has appointed the Audit Committee whose task is to ensure that established principles for financial reporting, risk manage-ment, and internal control are followed by and to enable appropriate external audit. The President and CEO is responsible for organizing an effective control environment and ongoing work on internal control as regards financial reporting. The internal audit reports all relevant issues to the Audit Committee and the President and CEO.
Internal audit focuses on developing and enhancing controls related to financial reporting by proactively and consistently assessing internal control environment and by monitoring the effectiveness of the control
Corporate Governance Statement

73
OUR YEAR SUSTAINABILITYCREATING VALUE GOVERNANCE FINANCIALS
Related party transactions Vaisala Board of Directors has defined principles for monitoring and assessing related party transactions as well as keeps a record of related parties. The Board of Directors resolves on all related party transactions that are not made in the ordinary course of business and implemented under arms-length terms.
On top of its affiliates, related parties of Vaisala are Vaisala Board members, Vaisala Management Group (VMG) members including President and CEO, as well as their spouses, partners, and children and legal entities, where a Member of Board or a VMG member has control. Board of Directors has approved guidelines that stipulate approval process and reporting concerning related party transactions. In accordance with the guidelines, Finance and Control as well as Legal follow related party transactions as part of regular reporting and control procedures. Board of Directors will resolve on all related party transactions that are not made in the ordinary course of business and implemented under arms-length terms.
Vaisala reports related party transactions in a note to financial statements. Vaisala has currently no related party transactions which would be material and in conflict with the ordinary course of business and not implemented under arms-length terms.
Auditing and auditor’s fees According to the Articles of Association, the company has one auditor, who must be a public accountant or an audit firm authorized by the Finland Chamber of Commerce. If an audit firm is not chosen to perform the auditing, a deputy auditor must be elected as well. Auditor’s term of office covers the current fiscal year and expires at the close of the following Annual General Meeting. Annual General Meeting elects the auditor and decides on the compensation paid to them.
The Annual General Meeting held on June 3, 2020 re-elected Deloitte Oy, audit firm, as the Auditor for a term of one year. APA Reeta Virolainen has acted as the auditor with the principal responsibility as of June 3, 2020. APA Merja Itäniemi acted as the auditor with the principal responsibility of the company during March 26, 2014–June 3, 2020.
Auditor’s fees
EUR 1,000 2020 2019
Audit 416 488
Tax advice 34 30
Statements 12 16
Other fees 74 50
Total 536 584
Insiders Vaisala maintains project- or event-specific insider lists when needed. 30-day closed window applies to the managers defined by the company before publishing Interim Reports, Half Year Financial Report, Financial Statement Release, and Financial Statements. Closed window ends on the day following the publication day. Closed window also applies to the persons engaged in preparation of those reports. The managers subject to transaction notification obligations comprise the Board of Directors, the President and CEO, as well as members of the Management Group. The company’s legal department is responsible for insider management, training, creation, and maintenance of project- and event-specific insider lists as well as monitoring of the same.
The President and CEO, Chief Financial Officer, and/or the General Counsel, two together, can decide, based on an evaluation of the conditions set out in the Market Abuse Regulation being met, to delay publication of insider information. When the company makes the decision on delay of disclosure, a project- or event-based insider list regarding the inside information will be established. Persons, to whom project- or event-specific inside information is disclosed, are entered into the project- or event-specific insider list.
Corporate Governance Statement
Policy defines how and when information should be given and by whom it is given. It also defines the accuracy and comprehensiveness of the information in order to fulfill the communication obligations. Code of Conduct, Approval Policy, Treasury Policy, Credit Policy, accounting policies, and reporting instructions as well as Disclosure Policy and Insider Policy are available on the company’s intranet.
Monitoring The Board of Directors, the Audit Committee, the President and CEO, and internal audit monitor the effectiveness of internal control related to financial reporting. The monitoring includes follow-up of monthly financial reports, review of the rolling forecasts and plans, as well as reports from internal audit and auditors. Internal audit assesses the effectiveness of operations and adequacy of risk management and reports the risks and development areas related to the internal control processes. Internal audit compiles an annual audit plan and reports the status of the plan and findings regularly to the Audit Committee and the Management Group. Furthermore, the Chief Financial Officer, the General Counsel, internal audit, and auditor coordinate audit planning and monitoring regularly.
General development measures in internal control and risk management in 2020 In 2020, internal audit focused on a renewed sourcing and procurement process, the integration process of acquired companies, access management process, and certain follow-up audits, such as GDPR compliance and sales process. A sourcing and procurement audit resulted in recommendations in process improvement and efficiency. Other audits provided input to continual improvement of processes and internal controls.
Harmonization of the control environment in businesses recently acquired by Vaisala has been a priority of internal controls during several years. In 2020, Finance and Control created a Control Catalog describing the most significant risk-based internal controls to ensure completeness, timeliness, and reliability of financial reporting and to prevent fraud.

74
OUR YEAR SUSTAINABILITYCREATING VALUE GOVERNANCE FINANCIALS
Risk managementThe objective of Vaisala’s risk management is to identify and manage material risks related to strategy implementation and business opera-tions. Vaisala’s Risk Management Policy, approved by the Board of Directors, covers the company’s strategic, operational, hazard, and financial risks. The policy aims to ensure the safety of the company’s personnel, operations, and products as well as the continuity and compliance of business operations.
The Board of Directors defines and approves risk management principles and assesses the effectiveness of risk management. The Audit Committee reviews compliance with Risk Management Policy and processes. Vaisala’s Risk Management Steering Group is responsible for the operational oversight of risk management and assures that all signif-icant risks are identified and reported and that risks are acted upon in the appropriate manner.
Risk management is integrated into key business processes and operations by incorporating risk identification, assessment, manage-ment, and risk reporting actions into the core processes. The most sig-nificant risks are reported to the Vaisala Management Group quarterly and to the Audit Committee annually.
Various risks may have an adverse effect on Vaisala’s business operations. The list in this chapter explains some of the risks with their potential impacts and how Vaisala manages those risks. Risk likelihoods and impacts are estimates, provided by a small group of subject area experts. No quantitative methods have been applied to assess either likelihoods or impacts.
Risks related to sustainable practices
EnvironmentWe assess environmental risks as part of our environmental manage-ment system. The most significant environmental risks of our operations are related to potential emergency situations that can lead to local contamination. These risks are controlled as part of our emergency preparedness and our management process for hazardous substances. Climate change, on the other hand, has been assessed to increase the likelihood of certain risks (H4 and O1 in the table introduced here). Exceptional weather conditions, storms, floods, and drought – all related to climate change – may provide Vaisala also with business opportunities.
Social and personnel mattersOn an individual level, personnel risks relate to occupational health and occupational accidents. On corporate level, the risks are related to the company’s ability to retain and attract talent. These risks are controlled through continuous development of Vaisala’s occupational health and safety system, support for the well-being of our employees, monitoring employee satisfaction, as well as providing purposeful work, learning opportunities, and an equal work environment.
Respecting human rights and preventing corruption and bribery Risks related to human rights violations, corruption, and bribery impact corporate reputation, brand, and the company’s ability to attract the best talent. Other potential consequences are judicial processes, penalties, contract cancellations, and exclusion from tenders. These risks are managed through recurring and compulsory Code of Conduct trainings as well as audits. We choose our suppliers carefully and verify the sustainability of their practices. Our Supplier Code of Conduct sets the requirement level for their operation. Our other partners, such as distributors and agents, are committed to complying with our Code of Conduct. The compliance of all our partners is assessed and monitored.

75
OUR YEAR SUSTAINABILITYCREATING VALUE GOVERNANCE FINANCIALS
Key risks 2020 Impact/Likelihood
Strategic risks
S1Challenges in the aviation industry decrease the demand for aviation weather solutions high/high
S2Larger austerity measures in the public sector than anticipated or global depression due to the COVID-19 pandemic high/medium
S3Industry consolidation, increased competition, loss of market leader and price premium position high/medium
S4 Lack of success in winning large projects in weather business medium/medium
S5 Slow growth of the remote wind sensing business medium/high
S6 Political, legislative, or regulatory changes medium/high
Hazard risks
H1 Long disruption in the cleanroom operation very high/very low
H2 Severe field service personnel accident caused by working conditions very high/low
H3 Critical failure of infrastructure supporting digital solutions low/low
H4 Natural disaster, epidemic (other than COVID-19), civil unrest, terrorism low/medium
H5 Long disruption in radiosonde production high/very low
Operational risks
O1 Business continuity risks related to suppliers medium/low
O2 Cyber risk high/low
O3 Long unavailability of IT systems high/low
O4 Delay in a significant product launch low/high
Financial risks
F1 Credit risk very low/high
F2 Liquidity and refinancing risk very low/very low
F3 Financial credit and interest rate risk very low/very low
F4 Currency risk very low/high
Risk management
LIK
EL
IHO
OD VERY
HIGH
HIGH
MEDIUM
LOW
VERY LOW
VERY LOW
LOW MEDIUM HIGH VERY HIGH
IMPACT
S1
S3S4
S5
S2
H1
H2H3
H4
O1 O2 O3
O4F1
F2F3
F4S6
H5

76
OUR YEAR SUSTAINABILITYCREATING VALUE GOVERNANCE FINANCIALS
Managing risk
• Continued focus on product leadership
• Striving for outstanding customer experience and superior product quality
• Gathering and analyzing competitor information
• Actively managing product portfolio
• Focusing on capacity building projects in the weather business
S4 Lack of success in winning large projects in weather businessLarge infrastructure projects have a significant impact on net sales.
Managing risk
• Growing the number of projects in the sales funnel
• Frequent customer contacts
• Development of project funding solutions
S5 Slow growth of the remote wind sensing businessThe market for lidar technology, used for remote wind sensing, is very competitive. The expansion of the applications into wind energy production and aviation is slow.
Managing risk
• Partnerships and local production in China
• Integration of airport applications into the rest of Vaisala’s product portfolio
• Lowering unit costs
S6 Political, legislative, or regulatory changesChanges in the market environment and growing protectionism can lead to loss of market potential or increased cost of accessing the market.
Managing risk
• Geographic and market diversity of businesses
• Increasing local production in the Unites States and China together with partners
• Market and regulatory foresight
• Partnerships
• Following the economic and political developments in the United States, China, and Russia
Hazard risksH1 Long disruption in the cleanroom operationLong disruption of cleanroom operation would have a major impact on the delivery capability of both business areas. Potential causes could include fire, contamination, or breakdown of key equipment
Managing risk
• Emergency stock of sensor components, management of manufacturing equipment and spare parts, safety of facilities
• Business continuity planning
• Manufacturing partnerships
• Business Interruption Insurance
H2 Severe field service personnel accident caused by working conditions A serious accident caused by hazardous working conditions, for exam-ple at roadsides, in tall towers, or in extreme conditions.
Managing risk
• Continuous development of occupational safety, emergency procedures, job hazard analysis
• Tracking system for employees working in hazardous conditions
Risk management
Strategic risks
S1 Challenges in the aviation industry decrease the demand for aviation weather solutionsDue to the COVID-19 virus, air traffic has decreased significantly. The aviation industry is facing major financial challenges, affecting the investment needs and capabilities of Vaisala’s customers in the near future.
Managing risk
• Updating aviation weather solutions instead of renewing them
• Focusing on efficiency and automation in Vaisala’s offering
• Studying the demand for new business models
S2 Larger austerity measures in the public sector than anticipated or global depression due to the COVID-19 pandemicThe scale of the austerity measures that are implemented due to the COVID-19 virus and affect Vaisala’s customers is not yet known. Moreover, global depression is possible.
Managing risk
• Highlighting the importance of investments in weather observations
• Utilizing financial stimulus packages and funding mechanisms together with customers
• Saving costs with the help of automation and remote services
• Managing cost
S3 Industry consolidation, increased competition, loss of market leader and price premium positionVaisala is a market leader in many businesses. Loss of that position would lead to a significant reduction in profitability. Competitor merg-ers are taking place especially in the weather and environment business area, which will affect the competitive situation.

77
OUR YEAR SUSTAINABILITYCREATING VALUE GOVERNANCE FINANCIALS
Operational risks
O1 Business continuity risks related to suppliersLong disruption in the operations of a strategic supplier, for example due to a natural disaster, equipment breakdown, an accident, or bankruptcy.
Managing risk
• Active supplier risk assessment
• Long-term supplier development plans
• Strategic supplier business continuity audits
• Parts stock at Vaisala
O2 Cyber risk Interruptions to operations or digital services, financial loss, loss of trade secrets or personal data.
Managing risk
• ISO 27000 compliant Information Security Management System (ISMS) creation and deployment
• Cyber insurance
• GDPR controls
O3 Long unavailability of IT systems Unavailability of systems leads to interruptions in operations, especially in manufacturing.
Managing risk
• IT Disaster Recovery Plan as part of Information Security Management System
• Shortening the resolution time of critical incidents
• Change management process of systems, including impact assess-ments and formal approvals
• Cyber insurance
O4 Delay in a significant product launch A product development project may be delayed due to technical or resource-related issues, leading to additional costs and delayed profit.
Managing risk
• Continuous improvement of product development processes
• Developing software architecture and product platforms
• Management and prioritization of the product portfolio
• Use of Lean methods as part of product development
Financial risks
F1 Credit risk Managing risk
• Secured terms of payment
• Business credit checks
• Diverse customer pool
F2 Liquidity and refinancing riskManaging risk
• Sustainable capital structure
F3 Financial credit and interest rate riskManaging risk
• High credit rating of financial counter parties
• Low risk cash investment
F4 Currency riskManaging risk
• Currency hedging
Risk management
H3 Critical failure of infrastructure supporting digital solutionsService unavailability due to, for example, a communications or soft-ware failure or power outage, causing significant harm to customers.
Managing risk
• Geographic system redundancy across multiple server sites
• Transition to cloud computing
H4 Natural disaster, epidemic (other than COVID-19), civil unrest, terrorismImpaired business environment caused by external events.
Managing risk
• Geographic diversity of business
• Business Interruption Insurance
• Monitoring the business environment
• Risk assessment of business opportunities
• Crisis management team
H5 Long disruption in radiosonde productionA long disruption in production can result in the loss of long-term customers.
Managing risk
• Identification of critical production factors and managing their risks
• Safety of facilities
• Reserve stocks
• Business Interruption Insurance

78
OUR YEAR SUSTAINABILITYCREATING VALUE GOVERNANCE FINANCIALS
Board of DirectorsRaimo Voipio
Chairman of the Board of Directors
b. 1955, Finnish citizen, M.Sc. (Engineering)
Independent member of the Vaisala Board of Directors since 1989 and Chairman since 1994. End of term 2023.
Main occupation: Board professional
Vaisala shares held
Dec 31, 2020: 570,524 A shares and 454,296 K shares
Dec 31, 2019: 570,002 A shares and 454,296 K shares
Ville Voipio
Vice Chairman of the Board of Directors, Member of the Audit Committee, Chairman of the Remuneration and HR Committee
b. 1974, Finnish citizen, D.Sc. (Measurement Technology)
Independent member of the Vaisala Board of Directors since 2015. End of term 2021.
Main occupation: CTO, Si-Tecno Oy, R&D and strategy management
Vaisala shares held
Dec 31, 2020: 396,493 A shares and 96,712 K shares
Dec 31, 2019: 396,087 A shares and 96,712 K shares
Petri Castrén
Member of the Audit Committee
Born 1962, Finnish citizen, LL.M, MBA (University of Connecticut, USA)
Independent member of the Vaisala Board of Directors since 2017. End of term 2022.
Main occupation: Chief Financial Officer, Kemira Oyj
Vaisala shares held
Dec 31, 2020: 2,807 A shares
Dec 31, 2019: 2,401 A shares
Antti Jääskeläinen
Member of the Audit Committee
b. 1972, Finnish citizen, M.Sc. (Eng.), M.Sc. (Econ.), MBA (INSEAD, France)
Independent member of the Vaisala Board of Directors since 2020. End of term 2023.
Main occupation: Executive Vice President, UPM Raflatac, Member of the UPM Group Executive Team
Vaisala shares held
Dec 31, 2020: 406 A shares
Dec 31, 2019: -

79
OUR YEAR SUSTAINABILITYCREATING VALUE GOVERNANCE FINANCIALS
Shareholdings include direct holdings and shares held by interest parties and controlled organizations.Read full CV information on the company’s website at vaisala.com.
Jukka Rinnevaara
Member of the Remuneration and HR Committee
b. 1961, Finnish citizen, M.Sc. (Econ.)
Independent member of the Vaisala Board of Directors since 2019. End of term 2023.
Main occupation: President and CEO, Teleste Corporation
Vaisala shares held
Dec 31, 2020: 1,126 A shares
Dec 31, 2019: 720 A shares
Kaarina Ståhlberg
Chairman of the Audit Committee
b. 1966, Finnish citizen, LL.M. (University of Helsinki and Columbia University, NY)
Independent member of the Vaisala Board of Directors since 2016. End of term 2022.
Main occupation: General Counsel and M&A, Member of the Executive Board, Posti Group Oyj
Vaisala shares held
Dec 31, 2020: 5,607 A shares
Dec 31, 2019: 5,201 A shares
Tuomas Syrjänen
Member of the Board of Directors
b. 1976, Finnish citizen, M.Sc. (El. Eng.)
Independent member of the Vaisala Board of Directors since 2019. End of term 2022.
Main occupation: Program Director - AI Renewal, Futurice Oy
Vaisala shares held
Dec 31, 2020: 2,476 A shares
Dec 31, 2019: 2,070 A shares
Board of Directors
Petra Lundström
Member of the Remuneration and HR Committee
b. 1966, Finnish Citizen, M.Sc. (Technical Physics)
Independent member of the Vaisala Board of Directors since 2014. End of term 2021.
Main occupation: Vice President, Nuclear Services, Fortum Power and Heat Oy
Vaisala shares held
Dec 31, 2020: 6,207 A shares
Dec 31, 2019: 5,801 A shares
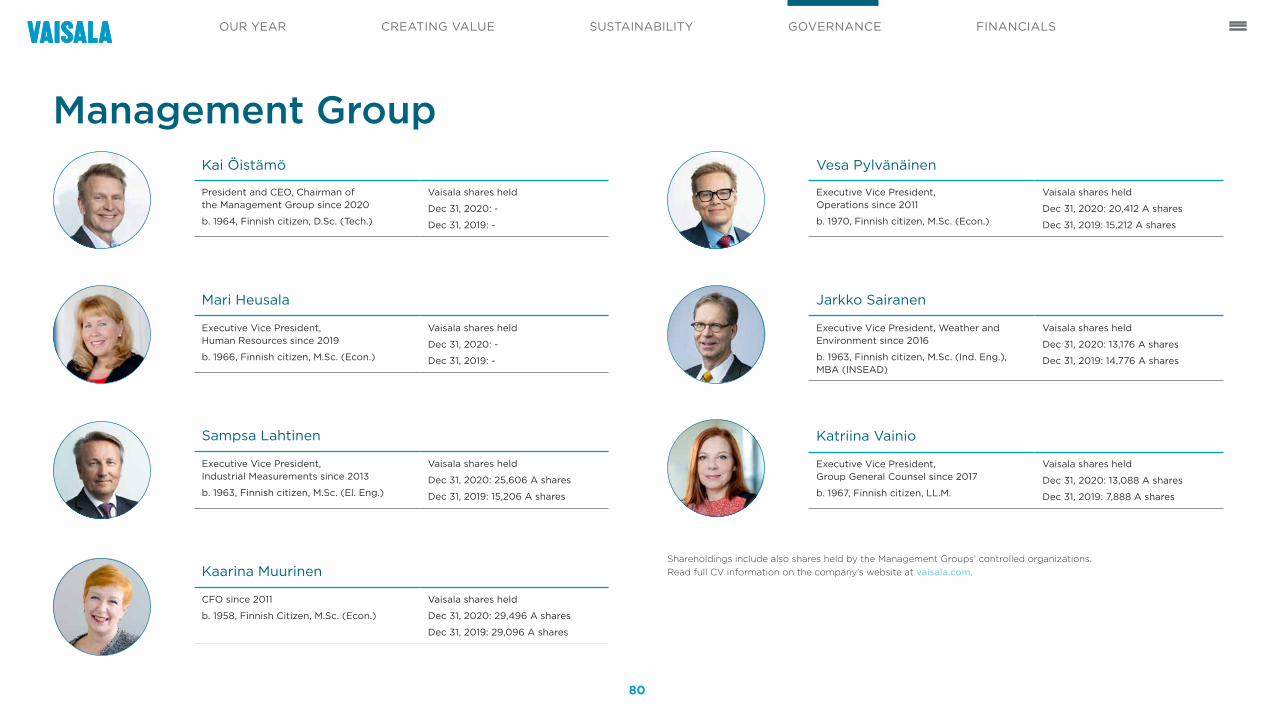
80
OUR YEAR SUSTAINABILITYCREATING VALUE GOVERNANCE FINANCIALS
Management GroupKai Öistämö
President and CEO, Chairman of the Management Group since 2020
b. 1964, Finnish citizen, D.Sc. (Tech.)
Vaisala shares held
Dec 31, 2020: -
Dec 31, 2019: -
Mari Heusala
Executive Vice President, Human Resources since 2019
b. 1966, Finnish citizen, M.Sc. (Econ.)
Vaisala shares held
Dec 31, 2020: -
Dec 31, 2019: -
Sampsa Lahtinen
Executive Vice President, Industrial Measurements since 2013
b. 1963, Finnish citizen, M.Sc. (El. Eng.)
Vaisala shares held
Dec 31, 2020: 25,606 A shares
Dec 31, 2019: 15,206 A shares
Kaarina Muurinen
CFO since 2011
b. 1958, Finnish Citizen, M.Sc. (Econ.)
Vaisala shares held
Dec 31, 2020: 29,496 A shares
Dec 31, 2019: 29,096 A shares
Vesa Pylvänäinen
Executive Vice President, Operations since 2011
b. 1970, Finnish citizen, M.Sc. (Econ.)
Vaisala shares held
Dec 31, 2020: 20,412 A shares
Dec 31, 2019: 15,212 A shares
Jarkko Sairanen
Executive Vice President, Weather and Environment since 2016
b. 1963, Finnish citizen, M.Sc. (Ind. Eng.), MBA (INSEAD)
Vaisala shares held
Dec 31, 2020: 13,176 A shares
Dec 31, 2019: 14,776 A shares
Katriina Vainio
Executive Vice President, Group General Counsel since 2017
b. 1967, Finnish citizen, LL.M.
Vaisala shares held
Dec 31, 2020: 13,088 A shares
Dec 31, 2019: 7,888 A shares
Shareholdings include also shares held by the Management Groups’ controlled organizations. Read full CV information on the company’s website at vaisala.com.

81
OUR YEAR SUSTAINABILITYCREATING VALUE GOVERNANCE FINANCIALS
Information for shareholdersVaisala Corporation’s Annual General Meeting will be held on Tues-day March 30, 2021. The Board of Directors of Vaisala has resolved on excep tional procedure for the meeting based on the temporary legislative act approved by the Finnish Parliament on October 2, 2020. The company has resolved to take actions enabled by the act in order to hold the meeting in a predictable manner, taking into account the health and safety of the company’s shareholders, personnel, and other stake holders. Shareholders can follow the meeting via live webcast on Vaisala website at vaisala.com/agm. More information about the Annual General Meeting at vaisala.com/agm.
Payment of dividendsThe Board of Directors proposes to the Annual General Meeting a dividend of EUR 0.61 per share for the fiscal year 2020 to be paid. The dividend would be paid to shareholders registered in the Register of Shareholders held by Euroclear Finland Ltd on the record date of the dividend distribution, April 1, 2021. The Board of Directors proposes that the dividend will be paid on April 12, 2021.
Change of addressVaisala’s shareholders are kindly requested to report written changes of address to the bank where they have their book entry account.
Listing of Vaisala sharesVaisala Corporation has two classes of shares: the listed series A shares and the non-listed series K shares. The Vaisala series A shares are listed on the Nasdaq Helsinki and are registered at Euroclear Finland Ltd.
Publication of financial informationVaisala Corporation publishes financial information in Finnish and English. All materials are available on Vaisala’s website at vaisala.com.
The printed Finnish Annual Report will be mailed only upon request. The company’s mailing list for financial reports can be joined on Vaisala’s website at vaisala.com.
Interim Reports and Half Year Report• April 29, 2021: Interim Report January–March 2021
• July 23, 2021: Half Year Financial Report 2021
• October 28, 2021: Interim Report January–September 2021
Silent periodSilent period begins 30 calendar days before the publishing of the Interim Reports, Half Year Financial Report, and Financial Statement Release, and lasts until the publishing of the Interim Reports, Half Year Financial Report, and Financial Statement Release. Exceptions to this rule are the Annual General Meeting (if held during the silent period) and the publishing of a stock exchange release regarding a significant business event and the related communication. During silent periods, Vaisala’s spokespersons refrain from discussing and commenting on issues related to the company’s financial performance or meeting with capital market representatives.
Comprehensive investor relations pages and investor relations contact information can be found at vaisala.com/investors.

82
Financial statements and Board of Directors’ Report
Key figuresBoard of Directors’ Report Financial statements 2020Auditor’s report
838498160

83
OUR YEAR SUSTAINABILITYCREATING VALUE GOVERNANCE FINANCIALS
Key figures
62%
38% Industrial Measurements 143,9 MEURWeather and Environment235,5 MEUR
NET SALES BY BUSINESS
AREA 2020
NET SALES BY GEOGRAPHICAL
AREA 2020
Americas: North and South America APAC: Asia Pacific EMEA: Europe, Middle-East and Africa
Americas135 MEURAPAC110 MEUREMEA134 MEUR
36%
29% 35%
2016 2017 2018 2019 2020
450
400
350
300
250
200
150
100
50
0
NET SALES, MEUR
319.1 332.6348.8
403.6379.5
2016 2017 2018 2019 2020
50
40
30
20
10
0
OPERATING RESULT (EBIT), MEUR
22.3
40.9 38.9 41.144.8
450
400
350
300
250
200
150
100
50
0
2016 2017 2018 2019 2020
ORDERS RECEIVED, MEUR
311.3
346.3 334.2
419.4382.8
140
120
100
80
60
40
20
0
2016 2017 2018 2019 2020
ORDER BOOK, MEUR
118.0124.8 120.6
139.0 137.8
2016 2017 2018 2019 2020
14
12
10
8
6
4
2
0
RESEARCH & DEVELOPMENT COSTS % OF NET SALES
11.9 11.913.0 13.1
14.0
2016 2017 2018 2019 2020
PERSONNEL AT YEAR-END
2,100
1,800
1,500
1,200
900
600
300
0
1,569 1,608
1,816 1,837 1,919
2016 2017 2018 2019 2020
450
400
350
300
250
200
150
100
50
0
NET SALES, MEUR
319.1 332.6348.8
403.6379.5
2016 2017 2018 2019 2020
50
40
30
20
10
0
OPERATING RESULT (EBIT), MEUR
22.3
40.9 38.9 41.144.8
Americas: North and South America
APAC: Asia Pacific
EMEA: Europe, Middle East and Africa

84
OUR YEAR SUSTAINABILITYCREATING VALUE GOVERNANCE FINANCIALS
Board of Directors’ Report 2020Key figures
Financial key figures2020 2019 2018 2017 2016
Net sales, MEUR 379.5 403.6 348.8 332.6 319.1
Exports and international operations, % 97.0 98.0 98.0 97.0 98.0
Gross profit, % 56.1 54.8 53.1 52.3 51.6
Operating result, MEUR 44.8 41.1 38.9 40.9 22.3
% of net sales 11.8 10.2 11.1 12.3 7.0
Result before taxes, MEUR 41.3 40.2 37.5 38.1 22.1
% of net sales 10.9 10.0 10.8 11.5 6.9
Result for the financial year, MEUR 32.8 33.6 29.5 27.2 18.8
% of net sales 8.7 8.3 8.5 8.2 5.9
R&D expenditure, MEUR 53.2 52.8 45.4 39.6 38.0
% of net sales 14.0 13.1 13.0 11.9 11.9
Depreciation, amortization and impairment, MEUR 21.1 23.5 12.1 9.7 24.1
2020 2019 2018 2017 2016
Cash and cash equivalents, MEUR 45.4 56.4 72.7 91.3 72.4
Equity, MEUR 205.5 198.3 182.9 185.4 178.5
Statement of financial position total, MEUR 351.8 361.5 334.4 273.8 255.0
Return on equity, % 16.3 17.7 16.0 15.0 10.5
Solvency ratio, % 59.0 55.7 55.6 68.9 71.1
Interest-bearing liabilities, MEUR 57.0 51.5 40.5 - 0.0
Gearing, % 5.7 -2.4 -17.6 -49.2 -40.6
Capital expenditure, MEUR 31.0 26.8 14.5 8.5 7.7
% of net sales 8.2 6.6 4.2 2.5 2.4
Cash flow from operating activities, MEUR 41.0 40.8 48.3 49.2 41.8
Orders received, MEUR 382.8 419.4 334.2 346.3 311.3
Order book at the end of financial year, MEUR 137.8 139.0 120.6 124.8 118.0
Personnel expenses, MEUR 154.1 157.7 133.6 129.9 128.4
Average personnel 1,911 1,829 1,678 1,592 1,590
Personnel at the end of financial year 1,919 1,837 1,816 1,608 1,569

85
OUR YEAR SUSTAINABILITYCREATING VALUE GOVERNANCE FINANCIALS
Key figures
Share key figures2020 2019 2018 2017 2016
Earnings per share (EPS), EUR 0.91 0.94 0.82 0.76 0.53
Diluted earnings per share, EUR 0.91 0.93 0.81 0.75 0.52
Cash flow from operating activities per share, EUR 1.14 1.14 1.35 1.38 1.17
Equity per share, EUR 5.70 5.52 5.11 5.20 5.00
Dividend per share, EUR *0.61 0.61 0.58 1.05 0.50
Dividend per earnings, % **66.9 65.2 70.7 138.2 95.2
Effective dividend yield, % **1.51 1.92 3.51 4.72 2.97
Price/earnings (P/E) 44.34 33.78 20.12 29.28 32.10
Series A share price development, EUR
highest price 42.50 32.80 23.90 24.45 18.48
lowest price 21.65 15.95 15.85 15.94 10.91
volume weighted average price 32.58 23.56 20.14 20.13 14.14
closing price 40.35 31.75 16.50 22.25 16.85
2020 2019 2018 2017 2016
Market capitalization at the end of financial year***, MEUR 1,452.6 1,139.2 590.5 794.1 601.6
A shares traded
pieces 3,852,297 3,442,439 3,710,610 4,298,504 4,062,272
% of total series 13.0 11.6 12.5 14.5 13.7
Number of shares, pieces 36,436,728 36,436,728 36,436,728 36,436,728 36,436,728
A shares, pieces 29,705,636 29,685,330 29,658,066 29,658,066 29,658,026
K shares, pieces 6,731,092 6,751,398 6,778,662 6,778,662 6,778,702
Outstanding shares at the end of financial year***, pieces 35,999,689 35,880,739 35,790,092 35,692,000 35,702,974
* Proposal by the Board of Directors** Calculated according to the proposal by the Board of Directors*** Including series A and K shares, excluding treasury shares. Series K shares are valued using the closing price for the series A share on the last trading day of December.
The share issue without payment approved by Vaisala’s Annual General Meeting on April 10, 2018 doubled the total number of series K and A shares. All share related figures in this Board of Directors’ Report have been adjusted to reflect the increased number of shares.
Trading information is based on Nasdaq Helsinki Ltd. statistics.
Board of Directors’ Report

86
OUR YEAR SUSTAINABILITYCREATING VALUE GOVERNANCE FINANCIALSBoard of Directors’ Report
Calculation of key figures
Earnings/share, EUR = Result for the period +/- non-controlling interest Average number of shares outstanding Cash flow from business = Cash flow from business operations operations/share, EUR Number of shares outstanding at the end of the period Equity/share, EUR = Total equity attributable to owners of parent company Number of shares outstanding at the end of the period Dividend/share, EUR = Dividend Number of shares outstanding at the end of the period Dividend/earnings, % = Dividend x 100 Result for the period +/- non-controlling interest Effective dividend yield, % = Dividend / share x 100 Closing price for the series A share at the end of the period Price/earnings (P/E) = Closing price for the series A share at the end of the period Earnings / share Market capitalization, MEUR = Closing price for the series A share x number of shares shares outstanding
Alternative performance measuresVaisala presents in its financial reporting alternative performance measures, which describe businesses’ financial performance and its development as well as investments and return on equity. In addition to accounting measures which are defined or specified in IFRS, alternative performance measures complement and explain presented information. Vaisala presents in its financial reporting the following alternative performance measures:
Net sales with comparable = Net sales converted to euros with exchange rates used during exchange rates comparison period Gross margin, % = Net sales - Cost of sales x 100 Net sales Operating result = Result before income taxes, financial income and expenses, and share of result in associated company as presented in Consolidated Statement of Income. Operating result describes profitability and development of business areas’ performance. Result before taxes = Result before taxes as presented in Consolidated Statement of Income. Return on equity (ROE), % = Result for the period x 100 Total equity (average) Solvency ratio, % = Total equity x 100 Statement of financial position total – advances received Investmets = Gross investments in non-current intangible assets as well as property, plant and equipment Order book = Undelivered customer orders at the end of the period
Gearing, % = Interest-bearing liabilities – cash and cash equivalents x 100 Total equity

87
OUR YEAR SUSTAINABILITYCREATING VALUE GOVERNANCE FINANCIALS
Orders received and order book
MEUR 2020 2019 Change FX*
Orders received 382.8 419.4 -9% -8%
Order book, end of period 137.8 139.0 -1%
* Change with comparable exchange rates
In 2020, orders received, EUR 382.8 (419.4) million, were impacted by the global economic downturn caused by the COVID-19 pandemic and decreased by 9% compared to strong comparison period. In Weather and Environment business area, orders received decreased due to lack of large project orders. Orders received decreased mainly in aviation segment and somewhat in ground transportation. Majority of the decrease came from Latin America and MEA. Orders received in APAC region decreased as well. Orders received increased in North America and in Europe. Orders received in Industrial Measurements business area increased by 2% as a result of improved demand during the second half and especially the fourth quarter of the year. Orders received increased in Americas and APAC regions and were flat in EMEA. Increase in orders received came from continuous monitoring systems and power industry applications, whereas demand for liquid measurements solutions decreased. Orders received for industrial instruments were at previous year’s level.
At the end of December 2020, order book amounted to EUR 137.8 (139.0) million and decreased by 1% compared to previous year. In Weather and Environment business area, order book decreased by 2% mainly as a result of weak orders received in MEA throughout the year as well as reduced scope and value of the Argentina contract. EUR 13 million weather infrastructure project order with the National Meteorology Agency in Ethiopia, announced in October 2019, is not included in order book. Order book for Industrial Measurements business area increased by 7% compared to previous year following strong orders received during the fourth quarter and increase was highest in Americas region. EUR 100.1 (101.4) million of the order book is scheduled to be delivered in 2021.
Financial review 2020
Financial performance
MEUR 2020 2019 Change FX**
Net sales 379.5 403.6 -6% -5%
Products 267.3 278.5 -4%
Projects 59.3 73.2 -19%
Services 52.9 51.9 2%
Gross margin, % 56.1 54.8
Operating expenses 169.2 177.3 -5%
R&D expenditure 53.2 52.8 1%
% of net sales 14.0 13.1
Amortization* 7.5 9.6
Operating result 44.8 41.1
% of net sales 11.8 10.2
* Amortization of intangible assets related to the acquired businesses ** Change with comparable exchange rates
Net sales by region
MEUR 2020 2019 Change
Americas 134.9 149.7 -10%
APAC 110.4 119.6 -8%
EMEA 134.2 134.3 -0%
Total 379.5 403.6 -6%
In 2020, net sales decreased by 6% compared to previous year and were EUR 379.5 (403.6) million. Operations outside Finland accounted for 97 (98) % of net sales. Foreign currency translation impact on
net sales was negative EUR 3.3 million, evenly distributed between business areas. Net sales in Weather and Environment business area decreased by 10% compared to previous year as a result of decrease in both project and product deliveries. Net sales decreased in all other regions than in Europe. Industrial Measurements business area’s net sales increased by 1% as a result of increase in APAC region, whereas net sales in EMEA and Americas regions were at previous year’s level. Growth in net sales came mainly from continuous monitoring systems and power industry applications, whereas net sales of liquid measurements solutions decreased.
In 2020, gross margin improved to 56.1 (54.8) % as a result of profitability improvement in Weather and Environment business area’s digital services and in Industrial Measurements business area’s service business. Operating result increased from previous year to EUR 44.8 (41.1) million, 11.8 (10.2) % of net sales. Decrease in net sales decreased operating result, however, improved gross margin partially off-set the impact. Operating expenses decreased compared to previous year due to restrictions imposed by the COVID-19 and savings related to discontinuation of assessment services provided for renewable energy segment. On the other hand, investments to research and development, sales and marketing as well as in process development continued. Amortization of intangible assets, included in operating expenses, decreased by EUR 2.2 million compared to previous year. Other operating income and expenses improved operating result by EUR 1.1 (-2.7) million. This included among others EUR 1.4 million cost related to discontinuation of assessment services provided for renewable energy segment and EUR 2.0 million positive impact mainly as valuation of contingent considerations related to acquired businesses decreased as a result of updated financial plans. Comparison period included among others cost related to Vaisala Digital refocus and reorganization, one-off expense related to a lease contract termination, as well as cost related to termination of a product line.
In 2020, financial income and expenses were EUR -3.6 (-1.1) million. This was mainly a result of valuation of USD denominated receivables and interest expenses. Income taxes were EUR 8.5 (6.6) million and effective tax rate 20.6 (16.3) %. Effective tax rate in 2019 was
Board of Directors’ Report

88
OUR YEAR SUSTAINABILITYCREATING VALUE GOVERNANCE FINANCIALS
exceptionally low. Result before taxes was EUR 41.3 (40.2) million and result for the period EUR 32.8 (33.6) million. Earnings per share was EUR 0.91 (0.94).
Statement of financial position, cash flow and financingVaisala’s financial position remained strong in 2020. Cash and cash equivalents decreased to EUR 45.4 (56.4) million at the end of December. Dividend payment amounted to EUR 22.0 (20.8) million. At the end of December, statement of financial position totaled EUR 351.8 (361.5) million.
In 2020, cash flow from operating activities remained at previous year’s level totaling to EUR 41.0 (40.8) million.
On December 31, 2020, Vaisala had interest-bearing loans from financial institutions totaling EUR 45.2 (40.2) million, of which EUR 40.0 million related to term loan and EUR 5.0 million related to utilized revolving credit facility. In addition, interest-bearing lease liabilities totaled EUR 11.9 (11.3) million.
Capital expenditureIn 2020, capital expenditure in intangible assets and property, plant and equipment totaled EUR 31.0 (26.8) million. Capital expenditure was mainly related to building projects in Vantaa, Finland and Louisville, Colorado US, as well as to investments in machinery and equipment to develop and maintain Vaisala’s production and service operations. Louisville office building was finalized during the third quarter and Vantaa R&D building during the fourth quarter. On December 31, 2020, commitments related to building projects totaled EUR 0.3 (8.8) million.
Depreciation, amortization and impairment were EUR 21.1 (23.5) million. This included EUR 7.5 (9.6) million of amortization of identified intangible assets related to the acquired businesses.
PersonnelThe average number of personnel employed in 2020 was 1,911 (1,829). At the end of 2020, the number of employees was 1,919 (1,837). 77 (74) % of employees were located in EMEA, 15 (16) % in Americas and 9 (9) % in APAC. 65 (62) % of employees were based in Finland.
Number of employees by regionDec 31,
2020Dec 31,
2019 Change
Americas 281 297 -16
APAC 166 174 -8
EMEA (excluding Finland) 230 224 6
Finland 1,242 1,142 100
Total 1,919 1,837 82
Number of employees by functionDec 31,
2020Dec 31,
2019 Change
Sales and marketing 467 449 18
R&D 446 407 39
Operations 470 441 29
Services 336 347 -11
Administration 200 193 7
Total 1,919 1,837 82
In addition to sales and marketing, number of employees increased mainly in R&D and operations. About half of the increase in R&D was related to in-sourcing of software development. Major part of the increase in operations related to product launches as well as process and system development. In Americas and APAC regions, number of employees declined mainly due to discontinuation of assessment services provided for renewable energy segment.
In 2020, personnel expenses totaled EUR 154.1 (157.7) million.
Share-based incentive plansThe share issue without payment approved by Vaisala’s Annual General Meeting on April 10, 2018 doubled the total number of series K and A shares. All share-related figures have been adjusted to reflect the increased number of shares. Until the end of 2017, the cost of the share
part of the share-based payments corresponded to the value of Vaisala’s series A share closing price on the grant date of the incentive plan, and the cash-settled part of the share-based payments was valued at the closing price of the share. As of January 1, 2018, the cost of the share part as well as the cash-settled (cash) part of the share-based payments correspond to the value of Vaisala’s series A share closing price on the grant date of the incentive plan less expected discounted dividends.
On December 16, 2015, the Board of Directors resolved for the group key employees a share-based incentive plan that was based on the development of group’s profitability in calendar year 2016. The reward payment corresponded to 49% of the maximum target. On March 5, 2019, a total of 88,452 company’s series A shares were conveyed without consideration to the 30 key employees participating in this incentive plan. The rest of the reward was paid in cash. Closing price of Vaisala’s series A share was EUR 11.57 on the grant date of the incentive plan. A total expense of this plan of EUR 2.3 million was recorded for 2016–2019.
On February 10, 2016, the Board of Directors resolved for a share-based incentive plan, in which the earning criteria was uninterrupted employment of certain group employees for a defined number of years. This share-based incentive plan ended in March 2018, and the remaining reward, corresponding to 3,000 Vaisala’s series A shares including the cash portion, was conveyed without consideration to the key employees participating in this incentive plan. A total expense of this plan of EUR 0.3 million was recorded for 2016–2018.
On December 15, 2016, the Board of Directors resolved for the group key employees a share-based incentive plan that was based on the development of group’s profitability in calendar year 2017. The reward payment corresponded to 65% of the maximum target. On March 3, 2020, a total of 118,950 company’s series A shares were conveyed without consideration to 33 key employees participating in this incentive plan. The rest of the reward was paid in cash. In addition, on June 28, 2019, a total reward of 1,734 Vaisala’s series A shares was conveyed without consideration to a key employee who participated in this incentive plan and the other half of the reward was paid in cash. Closing price of Vaisala’s series A share was EUR 17.90 on the grant date of the incentive plan. A total expense of this plan of EUR 4.2 million was recorded for 2017–2020.
Board of Directors’ Report

89
OUR YEAR SUSTAINABILITYCREATING VALUE GOVERNANCE FINANCIALS
On February 7, 2018, the Board of Directors resolved for the group key employees a share-based incentive plan that was based on the development of group’s profitability in calendar year 2018. The reward will be paid partly in Vaisala’s series A shares and partly in cash in spring 2021. The cash proportion will cover taxes and tax-related costs arising from the reward to a key employee. The maximum amount of this plan originally corresponded to 320,000 series A shares, and the reward payment will correspond to 55% of the maximum target. No reward will be paid if a key employee’s employment or service ends before the reward payment date. The expenses of this share-based incentive plan are accrued over the term of the plan from April 2018 to March 2021. Closing price of Vaisala’s series A share was EUR 22.10 on the grant date of the incentive plan. On December 31, 2020, this share-based incentive plan was directed to 27 persons and the maximum reward payable totals to 166,200 Vaisala’s series A shares, including the cash portion. On the grant date October 1, 2020, a total of 8,000 series A shares were directed to Kai Öistämö, President and CEO, and the earning criteria for these shares is uninterrupted service until the payment date. On June 28, 2019, a total reward of 461 Vaisala’s series A shares was conveyed without consideration to a key employee who participated in this incentive plan and the other half of the reward was paid in cash.
On February 12, 2019, the Board of Directors resolved for approximately 45 group key employees a share-based incentive plan that is based on the development of the total shareholder return (TSR) and profitability in 2019–2021. The reward will be paid partly in Vaisala’s series A shares and partly in cash in spring 2022. The cash proportion will cover taxes and tax-related costs arising from the reward to a key employee. The maximum amount of this plan originally corresponded to 330,000 series A shares. No reward will be paid if a key employee’s employment or service ends before the reward payment date. In addition, Vaisala’s Board of Directors requires that the President and CEO and each member of the Management Group retains his/her ownership of shares received under this plan until the value of his/her ownership in Vaisala corresponds to at least his/her annual gross base salary. The expenses of this share-based incentive plan are accrued over the term of the plan from April 2019 to March 2022. Closing price of Vaisala’s series A share was EUR 19.06 on the grant date of the incentive plan. On December 31, 2020, this share-based incentive plan
was directed to 44 persons. On the grant date October 1, 2020, a total of 4,000 series A shares were directed to Kai Öistämö, President and CEO, and the earning criteria for these shares is uninterrupted service until the payment date.
On February 12, 2020, the Board of Directors resolved for approximately 45 group key employees a share-based incentive plan that is based on the development of the total shareholder return (TSR) and profitability in 2020–2022. The reward will be paid partly in Vaisala’s series A shares and partly in cash in spring 2023. The cash proportion will cover taxes and tax-related costs arising from the reward to a key employee. The maximum amount of this plan originally corresponded to 240,000 series A shares. No reward will be paid if a key employee’s employment or service ends before the reward payment date. In addition, Vaisala’s Board of Directors requires that the President and CEO and each member of the Management Group retains his/her ownership of shares received under this plan until the value of his/her ownership in Vaisala corresponds to at least his/her annual gross base salary. The expenses of this share-based incentive plan are accrued over the term of the plan from May 2020 to March 2023. Closing price of Vaisala’s series A share was EUR 28.65 on the grant date of the incentive plan. On December 31, 2020, this share-based incentive plan was directed to 48 persons, including a total of 21,375 series A shares directed to Kai Öistämö, President and CEO, on the grant date October 1, 2020.
On December 17, 2020, the Board of Directors resolved for approximately 40 group key employees a share-based incentive plan that is based on the development of the total shareholder return (TSR) and profitability in 2021–2023. The reward will be paid partly in Vaisala’s series A shares and partly in cash in spring 2024. The cash proportion will cover taxes and tax-related costs arising from the reward to a key employee. The maximum amount of this plan originally corresponded to 180,000 series A shares. No reward will be paid if a key employee’s employment or service ends before the reward payment date. In addition, Vaisala’s Board of Directors requires that the President and CEO and each member of the Management Group retains his/her ownership of shares received under this plan until the value of his/her ownership in Vaisala corresponds to at least his/her annual gross base salary.
Expenses for share-based incentive plansEUR million 2016 2017 2018 2019 2020
Share-based incentive plans 2016 0.7 1.2 0.6 0.2
Share-based incentive plan 2017 1.1 1.3 1.5 0.3
Share-based incentive plan 2018 0.6 1.2 1.5
Share-based incentive plan 2019 0.6 1.6
Share-based incentive plan 2020 0.6
Board of Directors’ Report

90
OUR YEAR SUSTAINABILITYCREATING VALUE GOVERNANCE FINANCIALS
2020 review by business area
Weather and Environment business areaMEUR 2020 2019 Change FX**
Orders received 236.9 276.2 -14% -14%
Order book, end of period 119.8 122.3 -2%
Net sales 235.5 261.3 -10% -9%
Products 137.4 149.0 -8%
Projects 59.3 73.2 -19%
Services 38.8 39.1 -1%
Gross margin, % 51.0 49.9
Operating expenses 106.3 113.0 -6%
R&D expenditure 34.1 34.0 0%
of net sales, % 14.5 13.0
Amortization* 5.8 6.9
Operating result 14.6 17.7
of net sales, % 6.2 6.8
* Amortization of intangible assets related to the acquired businesses** Change with comparable exchange rates
Weather and Environment business area’s 2020 orders received were EUR 236.9 (276.2) million and decreased by 14% compared to strong comparison period and due to lack of large project orders. Orders received decreased mainly in aviation segment and somewhat in ground transportation. Majority of the decrease came from Latin America and MEA. Orders received in APAC region decreased as well. Orders received increased in North America and in Europe.
At the end of December 2020, Weather and Environment business area’s order book amounted to EUR 119.8 (122.3) million and decreased by 2% compared to previous year. Order book decreased mainly as a result of weak orders received in MEA throughout the year as well as reduced scope and value of the Argentina contract. On the other hand, order book increased by 19% in Europe and was flat in North America. EUR 13 million weather infrastructure project order with the National Meteorology Agency in Ethiopia, announced in October 2019, is not included in order book. EUR 83.6 (86.6) million of the order book is scheduled to be delivered in 2021.
Weather and Environment business area’s 2020 net sales decreased by 10% compared to previous year as a result of decrease in both project and product deliveries and were EUR 235.5 (261.3) million. Net sales decreased in all other regions than in Europe. On-going large projects represented three quarters of business area’s project net sales. Gross margin was 51.0 (49.9) %. Profitability improved in digital services.
Weather and Environment business area’s 2020 operating result decreased compared to previous year and totaled EUR 14.6 (17.7) million, 6.2 (6.8) % of net sales. Decrease in net sales decreased operating result, however, improved gross margin partially off-set the impact. Operating expenses decreased compared to previous year due to restrictions imposed by the COVID-19 pandemic and savings related to discontinuation of assessment services provided for renewable energy segment. Amortization of intangible assets, included in operating expenses, decreased by EUR 1.0 million compared to previous year and improved operating result. Other operating income and expenses improved operating result. This included among others EUR 1.4 million cost related to discontinuation of assessment services provided for renewable energy segment and EUR 1.9 million positive impact mainly as valuation of contingent considerations related to acquired businesses decreased as a result of updated financial plans.
Industrial Measurements business areaMEUR 2020 2019 Change FX**
Orders received 146.0 143.2 2% 3%
Order book, end of period 18.0 16.8 7%
Net sales 143.9 142.3 1% 2%
Products 129.9 129.5 0%
Services 14.1 12.8 10%
Gross margin, % 64.4 63.9
Operating expenses 61.5 63.4 -3%
R&D expenditure 19.2 18.8 2%
of net sales, % 13.3 13.2
Amortization* 1.7 2.8
Operating result 31.6 26.1
of net sales, % 21.9 18.4
* Amortization of intangible assets related to the acquired businesses** Change with comparable exchange rates
Industrial Measurements business area’s 2020 orders received increased by 2% compared to previous year as a result of improved demand during the second half and especially the fourth quarter of the year and totaled EUR 146.0 (143.2) million. Orders received increased in Americas and APAC regions and were flat in EMEA region. Increase in orders received came from continuous monitoring systems and power industry applications, whereas demand for liquid measurements solutions decreased. Orders received for industrial instruments were at previous year’s level.
Board of Directors’ Report

91
OUR YEAR SUSTAINABILITYCREATING VALUE GOVERNANCE FINANCIALS
At the end of December 2020, Industrial Measurements business area’s order book amounted to EUR 18.0 (16.8) million and increased by 7% compared to previous year following strong orders received during the fourth quarter and increase was highest in Americas region. EUR 16.6 (14.8) million of the order book is scheduled to be delivered in 2021.
Industrial Measurements business area’s 2020 net sales increased by 1% compared to previous year and were EUR 143.9 (142.3) million. Net sales increased in APAC region, whereas net sales in EMEA and Americas regions were at previous year’s level. Growth in net sales came mainly from continuous monitoring systems and power industry applications, whereas net sales of liquid measurements solutions decreased. Gross margin was on good level at 64.4 (63.9) %.
Industrial Measurements business area’s 2020 operating result improved from previous year and totaled EUR 31.6 (26.1) million, 21.9 (18.4) % of net sales. Net sales growth and gross margin improvement increased operating result. Operating expenses decreased compared to previous year due to restrictions imposed by the COVID-19 pandemic. On the other hand, investments in research and development as well as in sales and marketing continued. Amortization of intangible assets, included in operating expenses, decreased by EUR 1.1 million compared to previous year. Comparison period included EUR 1.5 million one-off expense related to a lease contract termination.
Impact of the COVID-19 pandemicThe global economic downturn caused by the COVID-19 pandemic impacted especially airports customer segment and emerging markets. Weather and Environment business area missed larger project orders. Orders received decreased mainly in aviation segment and somewhat in ground transportation. Orders received decreased the most in Latin America and MEA as well as in APAC. Industrial Measurements business area did not meet growth targets for industrial instruments and liquid measurements products due to volatile market situation. Even though orders received increased in Americas and APAC regions, they did not meet growth targets, and in EMEA orders received remained flat. Vaisala estimates that as a result of weakening demand as well as delays in some project deliveries due to restrictions related
to the COVID-19 pandemic, lost orders received during January–December 2020 was in the range of EUR 30–40 million and lost net sales in the range of EUR 25–35 million. Related negative impact on operating result was offset by improved gross margin and low operating expenses.
Vaisala’s production and logistics have been running smoothly as a result of successful mitigation activities. Vaisala has closely cooperated with its strategic suppliers to ensure availability of components. Inventory levels for most critical components were increasing during the first half of the year but were near to normal levels at the end of December 2020. Field service capabilities have been limited due to travel restrictions and lockdowns and thus limited access to customer sites.
Despite the COVID-19 pandemic, Vaisala has uninterruptedly carried on R&D projects as well as core process and system development to ensure progress of strategic projects according to plans.
Vaisala’s financial position and cash flow remained strong despite EUR 31 million capital expenditure and EUR 22 million dividend payments in 2020. Gearing was 5.7% at the end of December 2020. No material changes were identified in customers’ payment behavior and credit loss allowance remained on previous year’s level.
Strategy and its implementation in 2020In 2020, Vaisala continued to execute strategy for 2019–2023. Fundamentals of profitable growth are reliable products and solutions that are based on leading technologies, perform with superb quality, create value for our customers and optimize total cost of ownership.
Industrial Measurements business area drives profitable growth through product leadership strategy in gas and liquid measurement technologies. In addition to business area’s flagship markets, high-end humidity and high-end carbon dioxide, growth is sought from liquid measurements, continuous monitoring systems and power industry applications. Target is to exceed Vaisala’s average growth. Objective is to win by most reliable measurements, best customer experience, fast delivery as well as excellent sales and service capabilities.
In 2020, Industrial Measurements business area’s flagship markets, high-end humidity and high-end carbon dioxide, as well as liquid measurements were most hit by consequences of the COVID-19
pandemic and customers’ delayed decision making. However, demand increased during the second half and especially the fourth quarter of the year gave signs of recovery. Within the growth businesses, annual growth of continuous monitoring systems was good especially in pharmaceutical customer segment. Growth of power industry applications accelerated, which increased business’ market share. Demand for liquid measurements solutions declined, and therefore, development of the business was a disappointment. These growth businesses together accounted for one fourth of the business area’s net sales.
Industrial Measurements business area launched Indigo520 transmitter for harsh industrial environments. This transmitter allows dual probe installations and enables enhanced data visualization.
Industrial Measurements business area also launched a new high-performance probe HMP1 for humidity and temperature measurements in high-end facilities such as data centers. This probe is compatible with any Vaisala Indigo series transmitters. With the Indigo200 series transmitter it forms a single wall-mounted unit with no probe cable or probe holder. With the robust Indigo520 transmitter it offers flexibility to installations allowing optimal positioning of the probe.
In addition, Industrial Measurement business area introduced Vaisala Jade Smart Cloud, a remote measurement system allowing access to high-quality measurement data anywhere: The data can be viewed on the go; on a mobile device and on a pc or laptop. The Jade Smart Cloud is ideal for any structural moisture or ambient humidity trend measurement need.
Moreover, Industrial Measurement business area introduced a method for detecting power transformer air leaks. This accurate and reliable method, based on measuring total pressure of all dissolved gases in the power transformer insulation oil, will help customers detect and repair any air leaks early. This can extend the lifetime of a transformer and lead to significant cost savings. The new measurement solution will be made available to the current customers via a software release for Vaisala’s Optimus™ DGA Monitor OPT100.
Weather and Environment business area’s strategic intent is to remain undisputable global leader for weather observations. Business area’s strategy has four pillars: offer industry-leading products for weather observations, strive for excellence in large system project deliveries, develop digital solutions for selected weather critical
Board of Directors’ Report

92
OUR YEAR SUSTAINABILITYCREATING VALUE GOVERNANCE FINANCIALS
operations, and expand into environmental measurements with urban air quality as spearhead. Objective is to win by focusing R&D in instrument and weather radar offering renewal, driving growth of wind lidar business, and developing innovative digital solutions targeted to intelligent transportation market.
In 2020, Weather and Environment business area’s project deliveries proceeded well despite delays in some project implementations caused by the COVID-19 pandemic. On-going large projects represented three quarters of business area’s project net sales. Net sales of wind lidar business fell short of previous year’s level, as did the entire Weather and Environment business area. During the second quarter, Vaisala decided to discontinue unprofitable assessment consulting services provided for renewable energy segment. This as well as earlier refocus and reorganization, enabled digital business to improve its profitability significantly, while net sales growth was marginal. Renewable energy segment remains a strategic growth area for Vaisala as it will continue to offer wind lidars and energy forecasting services to the segment to enable optimized operations and development activities.
Weather and Environment business area launched Vaisala Beacon, an easy-to-use compact weather station solution that provides reliable measurements, data collection, connectivity, end-to-end security and data visualization from the cloud in one package. For the first time, businesses have the opportunity to implement out of the box the premier weather intelligence Vaisala is known for, to ensure efficient and safe operations. For meteorologists, the offering amplifies through supplementary measurements their use of existing reference-grade observation networks.
Weather and Environment business area announced an improved version of its turbine nacelle mounted wind lidar, WindCube® Nacelle. It can measure the wind conditions at hub height and has the unprecedented capability to measure up to 700 meters ahead. The WindCube Nacelle’s extraordinary measurement range and accuracy provides a complete picture of the wind profile for any turbine rotor size.
Weather and Environment business area launched a completely new product Wx Horizon targeted to support road authorities in their weather critical winter maintenance operations. Wx Horizon combines Vaisala’s industry-leading road weather station and mobile sensors with world-class weather and road surface state forecasting capabilities to deliver timely, accurate winter road condition intelligence to arm road
agencies with the road weather data required to keep roads safe. Weather and Environment business area introduced an upgrade
to Vaisala’s Global Lightning Dataset GLD360. Vaisala has completely rebuilt the backend processing software to locate lightning strikes with an accuracy of one kilometer compared to 1.5–2.0 kilometers earlier. When considered that GLD360 sensors can detect lightning events over 10,000 kilometers away, it is even more impressive to pinpoint the location within such a small radius.
Vaisala Operations manufactures products for both business areas and develops operational excellence in high mix low volume supply chain through Vaisala Production System. Strategic programs are productivity improvement, early involvement to product creation, as well as scouting and deploying latest smart factory technologies.
In 2020, target set for direct labor productivity improvement was not met due to decline in volumes. Delivery capability was solid through-out the year. Operations participated in multiple product development projects together with business areas in order to ensure good producibility and timely production ramp-up.
Vaisala’s process development focused on customer facing processes. Solution creation and renewal of CPQ (Configure Price and Quote) as well as eCommerce progressed well. Renewal of ERP solution was initiated and focused on technology selection.
Long-term financial targetsVaisala’s long-term financial targets are an average annual growth exceeding 5% and operating profit margin (EBIT) exceeding 12%.
Vaisala does not consider the long-term financial targets as market guidance for any given year.
Group structureVaisala’s headquarters are located in Vantaa, Finland. On December 31, 2020 Vaisala had subsidiaries in Australia, Brazil, Canada, China, Finland, France, Germany, India, Japan, Kenya, Malaysia, Mexico, United Kingdom and United States. The parent company has branches in Argentina and Colombia. Vaisala Digital Oy was merged into Vaisala Corporation on April 1, 2020, and K-Patents Inc. into Vaisala Inc. on November 1, 2020.
Board of DirectorsThe Annual General Meeting held on June 3, 2020 confirmed that the number of the Board members is eight.
Members of the Board of Directors on December 31, 2020• Raimo Voipio, Chairman• Ville Voipio, Vice Chairman• Petri Castrén• Antti Jääskeläinen• Petra Lundström• Jukka Rinnevaara• Kaarina Ståhlberg• Tuomas Syrjänen
Management GroupOn June 3, 2020, Vaisala’s Board of Directors appointed Kai Öistämö, b. 1964, as President and CEO. Öistämö started at Vaisala on October 1, 2020. Vaisala’s previous President and CEO Kjell Forsén stepped down from his position and retired at the end of 2020.
On December 31, 2020, Vaisala’s Management Group members were• Kai Öistämö, President and CEO, Chairman of the Management
Group• Mari Heusala, EVP, Human Resources• Sampsa Lahtinen, EVP, Industrial Measurements Business Area• Kaarina Muurinen, CFO• Vesa Pylvänäinen, EVP, Operations• Jarkko Sairanen, EVP, Weather and Environment Business Area• Katriina Vainio, EVP, Group General Counsel
On January 7, 2021, Olli Nastamo (b. 1956) was appointed Executive Vice President, Operational Excellence. He will be a member of the Vaisala Management Group and report to President and CEO Kai Öistämö. Olli Nastamo will start in his position on March 1, 2021.
Board of Directors’ Report

93
OUR YEAR SUSTAINABILITYCREATING VALUE GOVERNANCE FINANCIALS
Risk managementThe objective of Vaisala’s risk management is to identify and manage material risks related to strategy implementation and business operations. Vaisala’s Risk Management Policy, approved by the Board of Directors, covers the company’s strategic, operational, hazard, and financial risks. The policy aims to ensure the safety of the company’s personnel, operations, and products as well as the continuity and compliance of business operations.
The Board of Directors defines and approves risk management principles and assesses the effectiveness of risk management. The Audit Committee reviews compliance with Risk Management Policy and processes. Vaisala’s Risk Management Steering Group is responsible for the operational oversight of risk management and assures that all significant risks are identified and reported and that risks are acted upon in the appropriate manner.
Risk management is integrated into key business processes and operations by incorporating risk identification, assessment, management, and risk reporting actions into the core processes. The most significant risks are reported to the Vaisala Management Group quarterly and to the Audit Committee annually.
Vaisala is exposed to a number of financial risks in its operations of which key ones are currency risk, interest rate risk, refinancing and liquidity risks as well as financial counterparty risk and trade receivables credit risks. Vaisala’s objective is to limit the impact of these risks on statement of income, statement of financial position and cash flow statement. The management of financial risks is based on the treasury and credit policies approved by the Board of Directors.
Currency riskCurrency risk refers to the uncertainty in statement of income, statement of financial position and cash flow statement arising from exchange rate fluctuations. Vaisala’s business is global and is exposed to transaction and translation risks in multiple currencies. The transaction risk is related to the currency flows of sales and expenses. The translation risk arises from net investments in entities outside the euro area.
Vaisala’s sales are denominated in various currencies. In 2020, 46% of the group’s sales was in EUR, 32% in USD, 7% in CNY, 6% in JPY and
4% in GBP. Expenses and purchases occur mostly in EUR and USD. The group’s policy is to hedge foreign currency positions which consists of the order book, purchase commitments and net receivables. Vaisala does not hedge forecasted cash flows that are not in the order book. Vaisala does not apply hedge accounting in accordance with IFRS and changes in fair value are recognized in the statement of income.
Intercompany loans and deposits are mainly initiated in subsidiaries’ local currencies. Vaisala does not hedge intercompany loans, deposits or equities of subsidiaries. Translation of subsidiaries’ equities into euros caused translation difference of EUR -4.0 (0.5) million. The most significant translation risk exposures are in USD.
The IFRS 7 currency risk sensitivity analysis is based on the group companies’ foreign currency receivables, cash and cash equivalents and liabilities. The calculation does not include internal loans, order book or forecasted cash flows, but includes foreign exchange forwards in their nominal value. The effect of a 10% appreciation in all open net currency positions on Vaisala’s result after taxes and equity would have been EUR -0.1 (-0.5) million. Three largest foreign exchange net exposures in euro and their sensitivity analysis based on a 10% change (before taxes) are presented in the following table:
Foreign exchange net exposures against EUR2020 2019
HRK -3.0 USD -7.9
USD -2.7 SEK -3.5
SEK -2.3 SGD -2.3
Interest rate riskInterest rate risk refers to the uncertainty in statement of income, statement of financial position and cash flow statement arising from interest rate changes. The group is exposed to cash flow interest rate risk, if it has floating rate liabilities. At the end of the financial year 2020 Vaisala’s interest-bearing liabilities and loans were at floating rates and totaled to EUR 57.0 (51.5) million. EUR 11.9 (11.3) million of
interest-bearing liabilities and loans related to lease liabilities. As the group has floating rate loans, the group is exposed to interest rate risk arising from changes in interest rates.
Refinancing and liquidity risksRefinancing and liquidity risk refers to the uncertainty in the ability to maintain liquidity. In order to ensure liquidity, cash and cash equivalents and availability of credit facilities are maintained at a sufficient level.
Vaisala’s cash and cash equivalents amounted to EUR 45.4 (56.4) million.
On May 25, 2020, Vaisala signed a EUR 40.0 million unsecured term loan agreement with one of its core banks and on May 29, 2020, the loan was fully utilized. The loan matures in three years from the signing date and has a financial covenant (gearing), which is tested semi-annually. On December 31, 2020, Vaisala was in compliance with the covenant. This facility will be used for refinancing of existing indebtedness as well as for general corporate and working capital purposes. In addition, Vaisala has a EUR 50 million unsecured revolving credit facility which was signed on October 5, 2018. The committed credit facility agreement matures in 5 years from the signing and it has no financial covenants. On December 31, 2020, Vaisala had interest bearing liabilities totaling EUR 57.0 (51.5) million, of which EUR 5 (40) million related to utilized revolving credit facility, which matures within the next 12 months. Group has no loans that would mature after five years or more. In addition, Vaisala has a domestic commercial paper program amounting to EUR 150 million that was not utilized as of December 31, 2020.
Financial counterparty riskFinancial counterparty risk refers to the uncertainty about the counterparty’s ability to assume the obligations related to the financing. Vaisala is exposed to financial counterparty risk in respect of cash and cash equivalents and derivative financial instruments. Vaisala’s cash and cash equivalents amounted to EUR 45.4 (56.4) million and the nominal value of derivative financial instruments to EUR 31.4 (33.8) million. Vaisala deposits its assets and concludes derivative financial contracts with counterparties with good creditworthiness and approved by the Board of Directors. The creditworthiness of banks is constantly assessed.
Board of Directors’ Report

94
OUR YEAR SUSTAINABILITYCREATING VALUE GOVERNANCE FINANCIALS
Trade receivables credit riskTrade receivables credit risk means the customer-related uncertainty about the collectability of receivables. These trade receivables credit risks are managed by using letter of credit, advance payments and bank guarantees as payment terms. Additionally, trade receivables credit risk is managed by utilizing credit risk insurance and by monitoring customer liquidity. Management estimates that the group does not have significant credit risk concentrations because, due to its globally distributed customer base, no single customer or a group of customers constitutes a significant risk. During the financial year, credit losses and related reversals for trade receivables recognized in the statement of income amounted to EUR -0.3 (-0.2) million. Credit loss is recognized once it has been officially declared that the receivable will not be paid as a result of liquidation or bankruptcy.
Further information about risk management is available in the Annual Report’s sections Governance/Risk Management and on the company’s website at vaisala.com.
Annual General Meeting 2020Vaisala Corporation’s Annual General Meeting was held on June 3, 2020. The meeting approved the financial statements and discharged the members of the Board of Directors and the President and CEO from liability for the financial period January 1–December 31, 2019.
Dividend The Annual General Meeting decided a dividend of EUR 0.61 per share. The record date for the dividend payment was June 5, 2020, and the payment date was June 12, 2020.
Board of DirectorsThe Annual General Meeting confirmed that the number of Board members is eight. Petri Castrén, Petra Lundström, Jukka Rinnevaara, Kaarina Ståhlberg, Tuomas Syrjänen, Raimo Voipio and Ville Voipio will continue as members of the Board of Directors. Antti Jääskeläinen was elected as a new member of the Board of Directors.
The Annual General Meeting confirmed that that the annual remuneration payable to the Chairman of the Board of Directors is EUR
45,000 and each Board member EUR 35,000 per year. Approximately 40% of the annual remuneration will be paid in Vaisala Corporation’s series A shares acquired from the market and the rest in cash. In addition, the Annual General Meeting confirmed that the meeting fee for the Chairman of the Audit Committee would be EUR 1,500 per attended meeting and EUR 1,000 for each member of the Audit Committee and Chairman and each member of the Remuneration and HR Committee and any other committee established by the Board of Directors for a term until the close of the Annual General Meeting in 2021. The meeting fees are paid in cash. Possible travel expenses are proposed to be reimbursed according to the travel policy of the company.
AuditorThe Annual General Meeting re-elected Deloitte Oy as the auditor of the company and APA Reeta Virolainen will act as the auditor with the principal responsibility. The auditors are reimbursed according to invoice presented to the company.
Authorization for the directed repurchase of own series A sharesThe Annual General Meeting authorized the Board of Directors to resolve on the directed repurchase of a maximum of 500,000 of the company’s own series A shares in one or more instalments by using company’s unrestricted equity. The authorization is valid until the closing of the next Annual General Meeting, however, no longer than December 3, 2021.
Authorization on the issuance of the company’s own series A sharesThe Annual General Meeting authorized the Board of Directors to resolve on the issuance of a maximum of 937,039 company’s own series A shares. The issuance of own shares may be carried out in deviation from the shareholders’ pre-emptive rights (directed issue). The authorization entitles the issuance of treasury series A shares as a directed issue without payment as part of the company’s share-based incentive plan. The subscription price of the shares can instead of cash also be paid in full or in part as contribution in kind. The authorization is valid until December 3, 2021. The authorization for the company’s incentive program shall however be valid until June 3, 2024.
The organizing meeting of the Board of DirectorsAt its organizing meeting held after the Annual General Meeting the Board elected Raimo Voipio to continue as the Chairman of the Board of Directors and Ville Voipio as the Vice Chairman.
Kaarina Ståhlberg was elected as the Chairman and Petri Castrén, Antti Jääskeläinen and Ville Voipio as members of the Audit Committee. Ville Voipio was elected as the Chairman and Petra Lundström and Jukka Rinnevaara as members of the Remuneration and HR Committee. The Chairman and all members of the Audit Committee as well as the Remuneration and HR Committee are independent both of the company and of significant shareholders.
Shares and shareholders
Share capital and sharesVaisala’s share capital totaled EUR 7,660,808 on December 31, 2020. Vaisala has 36,436,728 shares, of which 6,731,092 are series K shares and 29,705,636 series A shares. During the third quarter, number of series K shares decreased by 20,306 and number of series A shares increased by 20,306 as the Board of Directors decided that 20,306 series K shares were converted to series A shares. This conversion was registered into the Trade Register on July 31, 2020. The series K shares and series A shares are differentiated by the fact that each series K share entitles its owner to 20 votes at a General Meeting of Shareholders while each series A share entitles its owner to 1 vote. The series A shares represented 81.5% of the total number of shares and 18.1% of the total votes. The series K shares represented 18.5% of the total number of shares and 81.9% of the total votes.
Trading and share price developmentIn 2020, a total of 3,852,297 series A shares with a value totaling EUR 125.6 million were traded on the Nasdaq Helsinki Ltd. During the year, the share price increased by 27% while OMXHCAPPI index increased by 10%. The closing price of the series A share on the Nasdaq Helsinki stock exchange was EUR 40.35. Shares registered a high of EUR 42.50 and a low of EUR 21.65. Volume-weighted average share price was EUR 32.58.
Board of Directors’ Report

95
OUR YEAR SUSTAINABILITYCREATING VALUE GOVERNANCE FINANCIALS
The market value of series A shares on December 31, 2020 was EUR 1,181.0 million, excluding company’s treasury shares. Valuing the series K shares – which are not traded on the stock market – at the rate of the series A share’s closing price on the last trading day of December, the total market value of all the series A and series K shares together was EUR 1,452.6 million, excluding company’s treasury shares.
Treasury sharesIn March 2020, a total of 118,950 of treasury shares were conveyed without consideration to the 33 key employees participating in the Share-based incentive plan 2017 under the terms and conditions of the plan. This directed share issue was based on an authorization given by the Annual General Meeting held on March 26, 2019.
Following this directed share issue, the number of series A treasury shares on December 31, 2020 was 437,039, which represents 1.5% of series A shares and 1.2% of total shares.
Major shareholders December 31, 2020A shares K shares Total % of shares % of votes
Novametor Oy 2,778,000 998,358 3,776,358 10.36 13.84
Finnish Academy of Science and Letters 322,445 1,757,760 2,080,205 5.71 21.59
Nordea Nordic Small Cap Fund 1,791,351 0 1,791,351 4.92 1.09
Mandatum Life Insurance Company Ltd. 1,197,100 274,800 1,471,900 4.04 4.07
Weisell-säätiö 1,440,000 0 1,440,000 3.95 0.88
Voipio Mikko 666,000 602,312 1,268,312 3.48 7.74
Caspers Anja 406,560 562,936 969,496 2.66 7.10
Voipio Raimo* 514,524 454,296 968,820 2.66 5.84
Ilmarinen Mutual Pension Insurance Company 911,051 0 911,051 2.50 0.55
Voipio Tauno 591,520 315,304 906,824 2.49 4.20
Voipio Lauri 561,692 83,376 645,068 1.77 1.36
Voipio Riitta 561,692 83,376 645,068 1.77 1.36
Voipio Ville 396,493 96,712 493,205 1.35 1.42
Voipio Mari 391,486 96,712 488,198 1.34 1.42
Voipio Timo 391,484 96,712 488,196 1.34 1.42
Total 12,921,398 5,422,654 18,344,052 50.34 73.88
Nominee registered shares** 6,977,269 0 6,977,269 19.15 4.25
* In addition to direct share ownership, Raimo Voipio’s controlled organization Imar Oy owned 56,000 series A shares. ** Includes 1,000,000 series A shares owned by Lannebo Fonder, which represented 2.74% of all shares and 0.61% of all votes (according to Lannebo’s notification).
Board of Directors’ Report

96
OUR YEAR SUSTAINABILITYCREATING VALUE GOVERNANCE FINANCIALS
Ownership structure (series A and K shares) December 31, 2020
Shares % of shares
Households 14,676,300 40.28
Nominee registered and outside Finland 7,023,294 19.28
Private companies 4,856,066 13.33
Financial and insurance institutions 4,798,783 13.17
Non-profit organizations 3,929,548 10.79
Public sector organizations 1,152,737 3.16
Total 36,436,728 100.00
Ownership distribution (series A and K shares) December 31, 2020
Share- holders
% of share-
holders Shares%
of shares
1–100 5,170 48.24 222,753 0.61
101–500 3,541 33.04 963,536 2.64
501–1 000 988 9.22 746,123 2.05
1 001–5 000 784 7.32 1,681,690 4.62
5 001–10 000 91 0.85 638,187 1.75
10 001–50 000 88 0.82 1,778,634 4.88
50 001–100 000 22 0.21 1,447,065 3.97
100 001–500 000 19 0.18 5,173,559 14.20
500 001– 14 0.13 23,785,181 65.28
Total 10,717 100.00 36,436,728 100.00
Nominee registered 10
Shareholders’ agreementsThe Board of Directors is not aware of any agreements concerning the ownership of the company’s shares and the use of their voting rights.
Shareholding by the Board of Directors and the Management GroupOn December 31, 2020, the Board of Directors held and controlled 985,646 (988,083) series A shares. These shares accounted for 3.3 (3.3) % of series A shares and 2.7 (2.7) % of total shares. The number of series K shares held and controlled by the Board was 551,008 (551,008). Total votes attached to the series A and K shares held and controlled by the Board were 12,005,806 (12,008,243), which accounted for 7.3 (7.3) % of the total votes of all shares.
On December 31, 2020, Kai Öistämö, the President and CEO, did not hold nor control any series A or series K shares. Other Management Group members held and controlled 101,778 (82,178) series A shares but none series K shares.
Corporate Governance Statement includes more details on the shareholdings of the Board of Directors and the Management Group.
More information about Vaisala’s shares and shareholders are presented on the company’s website at vaisala.com/investors.
DonationsVaisala collaborates with the Colorado State University (CSU) in the US in the field of weather radars, among others. In 2020, Vaisala’s Board of Directors renewed the annual donation of 25,000 USD to the university for three years.
Non-financial informationDisclosure of non-financial information in accordance with the Finnish Accounting Act chapter 3 a is presented in the Sustainable business practices section as well as the chapters Business model in Our business section, Dashboard in the Creating value section, and Risk management in the Governance section. The Sustainable business practices section includes information on environmental matters, social and employee matters, respecting human rights, as well as anti-corruption and anti-bribery compliance.
Corporate Governance StatementCorporate Governance Statement will be published as a part of the Annual Report as well as a separate report on the company’s website at vaisala.com/investors.
Remuneration ReportRemuneration Report will be published as a separate report on the company’s website at vaisala.com/investors.
Near-term risks and uncertaintiesCOVID-19 pandemic’s impact on Vaisala’s business is depending on the duration and severity of this exceptional situation. Vaisala’s delivery capability may deteriorate due to disruptions in suppliers’ operations, absence of own production employees or disruptions in incoming and/or outgoing logistics. Demand may fluctuate materially by country or customer segment and customers’ recovery from the exceptional situation varies a lot. Effects of the pandemic on customers’ cash flow can be significant and lead to credit losses. Exceptional situation may also cause delays or interruptions in Vaisala’s operations, e.g. in project deliveries and R&D.
Uncertainties in international trade policies or political situation may reduce or delay demand for Vaisala’s products and services. Customers’ preference for local manufacturing may reduce demand for Vaisala’s products and services.
Obstacles related to market acceptance, sales channel development, or regulatory certification of new products and services may postpone realization of Vaisala’s growth and profitability targets. Customers’ budgetary constraints, complex decision-making processes, changes in scope, and financing arrangements may postpone closing of infrastructure contracts in Weather and Environment business area. Cyber risk and downtime of IT systems may impact operations and delivery of digital solutions.
Board of Directors’ Report

97
OUR YEAR SUSTAINABILITYCREATING VALUE GOVERNANCE FINANCIALS
Measures taken to mitigate impacts of the COVID-19 pandemicEmployeesEnsuring employees’ wellbeing and their health and safety has been the most important focus area during the COVID-19 pandemic. To enforce containment actions and safe work environment for production workers, access to factories has been limited. Remote working practices were introduced in all offices and office environments have been adapted to meet local recommendations and regulations.
CustomersEffective delivery of products and services has been crucial while customer organizations have dealt with staff shortages, closures of offices and factories and health protection measures. Remote customer meetings, electronic signatures, re-routing of shipments, remote acceptance testing and cooperation with local field service companies and their remote support are examples of measures, which have been taken to fulfill customer expectations.
Supplier relationships and cooperationVaisala has numerous suppliers, technology providers and outsourcing partners. Strategic suppliers, which are critical to ongoing business operations, have been assessed for their business continuity and information reliability. Purchase orders, delivery schedules and changes in lead times have been assessed to ensure timely receipt of components. Inventory levels for most critical components were increased by two-three months availability.
CommunicationsVaisala has communicated regularly with multiple stakeholders: employees, customers, suppliers and authorities. Objective has been to ensure clear and transparent communication how Vaisala manages possible impacts of the COVID-19 pandemic, and to ensure continuity of core operations, including support and services for customers without endangering employees, customers and other stakeholders. Digital marketing efforts have been intensified to compensate for absence of conventional marketing events.
LiquidityVaisala’s financial position and liquidity have been assessed. New term loan agreement was negotiated in order to provide more flexibility.
Scenario planningVaisala has done scenario planning and contingency planning in order to make sound decisions in a highly volatile operating environment. Vaisala has identified risks related to delivery capability and demand outlook as well as diverse challenges emerging in the operating environment. Scenario plans and related assumptions have been continuously updated and followed up.
Further information about risk management and risks are available in Annual Report and on the company’s website at vaisala.com/investors.
Market development and business outlook for 2021COVID-19 pandemic will continue to cause significant uncertainty in 2021. Still, the global economy is expected to continue to recover in 2021.
Market for high-end industrial instruments is expected to recover after weak 2020. Life science and power industry market is expected to continue to grow.
Meteorology market in developing countries is expected to continue to suffer due to lack of funding and delayed decision making while demand in developed countries is expected to remain stable. Aviation market declined significantly in 2020 as a result of the global pandemic, and market outlook remains weak, although some recovery is expected. Ground transportation market is expected to be stable. Renewable energy market is expected to continue to grow.
Vaisala estimates that its full-year 2021 net sales will be in the range of EUR 370–400 million and its operating result (EBIT) will be in the range of EUR 30–45 million.
Board of Directors’ proposal for dividendThe parent company’s distributable earnings amount to EUR 172,498,369.07, of which the result for the period is EUR 23,477,939.71.
The Board of Directors proposes to the Annual General Meeting that
dividend of EUR 0.61 per share be paid out of distributable earnings totaling approximately EUR 22.0 million and the rest to be carried forward in the shareholders’ equity. No dividend will be paid for treasury shares held by the company.
There have been no significant changes in the company’s financial position since the close of the financial period. According to the Board of Directors, the proposed dividend distribution does not endanger the company’s financial standing.
Annual General Meeting 2021Vaisala Corporation’s Annual General Meeting will be held on Tuesday March 30, 2021. The Board of Directors of Vaisala has resolved on exceptional procedure for the meeting based on the temporary legislative act approved by the Finnish Parliament on October 2, 2020. The company has resolved to take actions enabled by the act in order to hold the meeting in a predictable manner, taking into account the health and safety of the company’s shareholders, personnel and other stakeholders. Shareholders can follow the meeting via live webcast at Vaisala website vaisala.com/agm.
Vantaa, February 18, 2021
Vaisala CorporationBoard of Directors
The forward-looking statements in this Board of Directors’ Report are based on the current expectations, known factors, decisions and plans of Vaisala’s management. Although the management believes that the expectations reflected in these forward-looking statements are reasonable, there is no assurance that these expectations would prove to be correct. Therefore, the results could differ materially from those implied in the forward-looking statements, due to for example changes in the economic, market and competitive environments, regulatory or other government-related changes, or shifts in exchange rates.
Board of Directors’ Report

98
OUR YEAR SUSTAINABILITYCREATING VALUE GOVERNANCE FINANCIALS
CONSOLIDATED FINANCIAL STATEMENTS 99Consolidated statement of income 99Consolidated statement of comprehensive income 99Consolidated statement of financial position 100Consolidated cash flow statement 102Consolidated statement of changes in equity 103
The audited financial statements comprise the consolidated statement of income, consolidated statement of comprehensive income, consolidated statement of financial position, consolidated cash flow statement, consolidated statement of changes in equity and notes to the consolidated financial statements, as well as the parent company income statement, parent company balance sheet, parent company cash flow statement and notes to the parent company financial statements.
NOTES TO THE CONSOLIDATED FINANCIAL STATEMENTS 104Financial development
1. Reportable segments 1062. Geographical segments 1083. Revenue from contracts
with customers 1084. Other operating income
and expenses 1095. Personnel expenses and
number of personnel 1106. Pension obligations 1107. Share-based payments 1128. Research and development
expenditure 114 9. Financial income and expenses 11410. Income taxes 11411. Earnings per share 118
Net working capital 12. Trade receivables and
other receivables 11813. Inventories 11914. Trade payables and
other liabilities 12015. Provisions 120
Intangible and tangible assets 16. Intangible and tangible assets 12117. Leases 127
Capital structure 18. Shareholders’ equity 12919. Financial risk management 13020. Non-current receivables 13121. Financial assets and liabilities 13122. Interest-bearing liabilities
and other adjustments in cash flow statement 134
23. Cash and cash equivalents 13524. Contingent liabilities and
pledges given 135Consolidation
25. Business combinations 13626. Subsidiaries 13727. Associated company 137
Other notes 28. Related party transactions 13829. Auditor’s fees 14130. Application of new and revised
standards and interpretations in issue but not yet effective 141
PARENT COMPANY FINANCIAL STATEMENTS 143Parent company income statement 143Parent company balance sheet 144Parent company cash flow statement 146 NOTES TO THE PARENT COMPANYFINANCIAL STATEMENTS 147
1. Accounting principles 1472. Net sales 1483. Other operating income 1494. Personnel expenses and
number of personnel 1495. Depreciation, amortization and
impairment 1516. Financial income and expenses 1517. Direct taxes 1518. Non-current assets and
other long-term investments 1529. Other receivables 15510. Deferred assets 15511. Deferred tax assets and
liabilities 156
Financial statements 2020
12. Provisions 15613. Shareholders’ equity 15614. Non-current liabilities 15715. Loans from financial
institutions 15716. Accrued expenses and
deferred income 15717. Receivables and liabilities
from other companies in Vaisala group 158
18. Contingent liabilities and pledges given 158
19. Auditor’s fees 158
SIGNING OF THE BOARD OF DIRECTOR’S REPORT AND FINANCIAL STATEMENTS 159
AUDITOR’S REPORT 160

99
OUR YEAR SUSTAINABILITYCREATING VALUE GOVERNANCE FINANCIALS
Consolidated statement of income
EUR million NoteJan 1-Dec 31,
2020Jan 1-Dec 31,
2019
Net sales 1, 2, 3 379.5 403.6
Cost of goods sold 5, 13, 16 -166.6 -182.4
Gross profit 212.9 221.2
Sales, marketing and administrative costs 5, 7, 16 -116.0 -124.5
Research and development costs 5, 7, 8, 16 -53.2 -52.8
Other operating income and expenses 4 1.1 -2.7
Operating result 44.8 41.1
Share of result in associated company 27 0.2 0.1
Financial income and expenses 9 -3.6 -1.1
Result before taxes 41.3 40.2
Income taxes 10 -8.5 -6.6
Result for the financial year 32.8 33.6
Attributable to
Owners of the parent company 32.8 33.5
Non-controlling interests 0.0 0.1
Result for the financial year 32.8 33.6
Earnings per share for result attributable to the equity holders of the parent company 11
Earnings per share, EUR 0.91 0.94
Diluted earnings per share, EUR 0.91 0.93
Consolidated statement of comprehensive income
EUR million NoteJan 1-Dec 31,
2020Jan 1-Dec 31,
2019
Items that will not be reclassified to profit or loss (net of taxes)
Actuarial profit (loss) on post-employment benefits 6 0.0 0.2
Total 0.0 0.2
Items that may be reclassified subsequently to profit or loss
Translation differences -4.0 0.5
Total -4.0 0.5
Total other comprehensive income -4.0 0.7
Comprehensive income for the financial year 28.9 34.3
Attributable to
Owners of the parent company 28.8 34.2
Non-controlling interests 0.0 0.1
Comprehensive income for the financial year 28.9 34.3
The notes are an essential part of the financial statements.
Consolidated financial statements

100
OUR YEAR SUSTAINABILITYCREATING VALUE GOVERNANCE FINANCIALS
Consolidated statement of financial positionEUR million Note Dec 31, 2020 Dec 31, 2019
Assets
Non-current assets
Intangible assets 16 63.6 72.7
Property, plant and equipment 16 83.9 63.4
Right-of-use assets 17 12.5 12.3
Investments in shares 0.1 0.1
Investment in associated company 27 1.1 1.1
Non-current receivables 20 0.9 0.9
Deferred tax assets 10 7.3 9.8
Total non-current assets 169.5 160.3
Current assets
Inventories 13 44.5 39.6
Trade and other receivables 12 64.0 77.3
Contract assets 3 24.2 25.0
Income tax receivables 4.3 2.8
Cash and cash equivalents 23 45.4 56.4
Total current assets 182.4 201.1
Total assets 351.8 361.5
EUR million Note Dec 31, 2020 Dec 31, 2019
Equity and liabilities
Equity 18
Share capital 7.7 7.7
Other reserves 5.6 7.0
Translation differences -2.8 1.3
Treasury shares -6.3 -7.9
Retained earnings 200.8 190.0
Total equity attributable to owners of parent company 205.1 198.0
Non-controlling interests 0.4 0.3
Total equity 205.5 198.3
Non-current liabilities
Interest-bearing loans from financial institutions 21 40.0 -
Interest-bearing lease liabilities 17 9.2 8.3
Post-employment benefits 6 2.3 2.4
Deferred tax liabilities 10 7.7 8.1
Provisions 15 0.1 0.1
Other non-current liabilities 21 2.6 4.3
Total non-current liabilities 62.0 23.3
Consolidated financial statements

101
OUR YEAR SUSTAINABILITYCREATING VALUE GOVERNANCE FINANCIALS
EUR million Note Dec 31, 2020 Dec 31, 2019
Current liabilities
Interest-bearing loans from financial institutions 21 5.2 40.2
Interest-bearing lease liabilities 17 2.7 3.0
Trade and other payables 14 52.3 64.5
Contract liabilities 3 20.9 27.3
Income tax liabilities 1.5 1.7
Provisions 15 1.7 3.2
Total current liabilities 84.3 139.8
Total liabilities 146.2 163.1
Total equity and liabilities 351.8 361.5
The notes are an essential part of the financial statements.
Consolidated financial statements

102
OUR YEAR SUSTAINABILITYCREATING VALUE GOVERNANCE FINANCIALS
Consolidated cash flow statement
EUR million NoteJan 1-Dec 31,
2020Jan 1-Dec 31,
2019
Cash flow from operating activities
Result for the financial period 32.8 33.6
Depreciation, amortization and impairment 16 21.1 23.5
Financial income and expenses 9 3.6 1.1
Gains and losses on sale of intangible assets and property, plant and equipment
4 -0.1 -0.3
Share of result in associated company 27 -0.2 -0.1
Income taxes 10 8.5 6.6
Other adjustments 22 -5.6 1.6
Inventories, increase (-) / decrease (+) 13 -1.8 -7.5
Non-interest bearing receivables, increase (-) / decrease (+) 12 12.6 -7.8
Non-interest bearing liabilities, increase (+) / decrease (-) 14 -18.4 1.5
Changes in working capital -7.5 -13.9
Financial items paid 9 -3.5 -2.3
Income taxes paid 10 -8.2 -9.0
Cash flow from operating activities 41.0 40.8
Cash flow from investing activities
Acquisition of subsidiaries, net of cash acquired 25 -0.2 -7.3
Capital expenditure on intangible assets and property, plant and equipment
16 -31.0 -26.8
Proceeds from sale of intangible assets and property, plant and equipment
4 0.1 0.5
Proceeds from sale of shares 0.1 -
Cash flow from investing activities -31.0 -33.6
EUR million NoteJan 1-Dec 31,
2020Jan 1-Dec 31,
2019
Cash flow from financing activities
Dividends paid 18 -22,0 -20,8
Change in loan receivables 0,1 0,1
Proceeds from borrowings 21 100,1 80,0
Repayment of borrowings 21 -95,0 -80,5
Principal payments of lease liabilities 17 -3,3 -4,1
Cash flow from financing activities -20,0 -25,4
Change in cash and cash equivalents, increase (+) / decrease -10,0 -18,1
Cash and cash equivalents at the beginning of the financial year
56,4 72,7
Change in cash and cash equivalents -10,0 -18,1
Transfer of cash and cash equivalents classified as assets held for sale to continuing operations - 1,1
Effect from changes in exchange rates -1,0 0,7
Cash and cash equivalents at the end of the financial year 23 45,4 56,4
The notes are an essential part of the financial statements.
Consolidated financial statements

103
OUR YEAR SUSTAINABILITYCREATING VALUE GOVERNANCE FINANCIALS
Consolidated statement of changes in equity
EUR million Note Share capital Other reservesTranslation differences Treasury shares
Retained earnings
Equity attributable to owners of the
parent companyNon-controlling
interests Total
Equity at Dec 31, 2018 7.7 6.1 0.8 -9.0 177.3 182.9 182.9
Result for the financial year 18 33.5 33.5 0.1 33.6
Other comprehensive income 18 0.0 0.5 0.2 0.7 0.7
Dividend distribution 18 -20.8 -20.8 -20.8
Share-based payments 7, 18 0.8 1.1 1.9 1.9
Transfer between items 18 0.0 -0.0 0.0 0.0
Changes in non-controlling interests that did not result in changes in control -0.2 -0.2 0.2 0.0
Equity at Dec 31, 2019 7.7 7.0 1.3 -7.9 190.0 198.0 0.3 198.3
Result for the financial year 18 32.8 32.8 0.0 32.8
Other comprehensive income 18 -0.0 -4.0 0.0 -4.0 -4.0
Dividend distribution 18 -22.0 -22.0 -22.0
Share-based payments 7, 18 -1.4 1.6 0.2 0.2
Transfer between items 18 0.0 -0.0 0.0 0.0
Changes in non-controlling interests that did not result in changes in control -0.0 -0.0 0.0 0.0
Equity at Dec 31, 2020 7.7 5.6 -2.8 -6.3 200.8 205.1 0.4 205.5
Consolidated financial statements

104
OUR YEAR SUSTAINABILITYCREATING VALUE GOVERNANCE FINANCIALS
Basic informationVaisala is a global leader in weather, environmental and industrial measurement. With more than 80 years of experience, Vaisala provides a comprehensive range of innovative observation and measurement products and services for chosen weather-related and industrial markets.
The parent company, Vaisala Corporation, is a Finnish public limited company, domiciled in Vantaa, Finland. The registered address is Vanha Nurmijärventie 21, FI-01670 Vantaa, Finland (P.O. Box 26, FI-00421 Helsinki). The company’s Business ID is 0124416-2.
These financial statements have been approved for publication by the Board of Directors of Vaisala Corporation on February 18, 2021. Under the Finnish Companies Act, shareholders have the right to approve, reject or make changes to the financial statements in the Annual General Meeting to be held after the publication. A copy of the consolidated financial statements is available on the company’s website at vaisala.com/investors or at the parent company head office at the address Vanha Nurmijärventie 21, FI-01670 Vantaa, Finland (P.O. Box 26, FI-00421 Helsinki).
Accounting principles for the consolidated financial statementsThe consolidated financial statements of Vaisala have been prepared in accordance with International Financial Reporting Standards (IFRS) approved for adoption by the European Union, including International Accounting Standards (IAS) and the SIC and IFRIC Interpretations valid on December 31, 2020. In the Finnish Accounting Act and ordinances based on the provisions of the Act, IFRS refer to the standards and their interpretations adopted in accordance with the procedures laid down in regulation (EC) No. 1606/2002 of the European Parliament and of the Council. The notes to the consolidated financial statements are also in accordance with the Finnish accounting and corporate law.
The consolidated financial statements are presented in millions of euros, if not otherwise stated. All presented figures have been rounded and consequently the sum of individual figures may deviate from the presented sum. Financial statements are based on original acquisition costs, if not otherwise stated in the accounting principles. In the text sections figures from previous years are presented in parenthesis. Calculation of key figures and alternative performance measures are presented in the Board of Directors’ Report.
The reporting of cash flows from operating activities in the consolidated cash flow statement has been changed from the direct method to the indirect method as of January 1, 2020. Indirect method specifies the change in working capital and its impact on cash flows from operating activities. The comparative information has been reported accordingly.
Consolidation principlesThe consolidated financial statements include the parent company Vaisala Corporation and those subsidiaries in which the group has control. The group has control of an entity when it is exposed, or has rights, to variable returns from its involvement with the investee and has the ability to affect those returns through its power over the investee. Subsidiaries, acquired or founded during the financial period, are consolidated from the date on which control is transferred to the group and are no longer consolidated from the date that control ceases.
Business combinations are accounted for using the acquisition method. The consideration transferred is the fair value of transferred assets, issued equity interests and liabilities incurred to former owners. Any contingent consideration is recognized at fair value at the acquisition date and classified as a liability or equity. Contingent considerations classified as a liability are measured at fair value on each reporting date with changes recognized in consolidated statement of income. Identifiable assets acquired as well as assumed liabilities and contingent liabilities are measured initially at their fair values on the date of acquisition without deducting non-controlling interest. The amount by which the consideration transferred, the amount of any non-controlling interest in the acquiree and the acquisition date fair value of any previous equity interest exceeds the fair value of identifiable net assets is recognized as goodwill. If the consideration transferred is lower than the acquired net assets, the gain is recognized in the consolidated statement of income on the acquisition date. All acquisition-related costs, except for the costs to issue debt or equity securities, are expensed in the periods in which the costs are incurred and the services are received.
The non-controlling interests’ share of the result and of the comprehensive income for the financial year are presented in the consolidated statement of income and in the consolidated statement of comprehensive income. The non-controlling interests’ share of the equity is presented as a separate item in the consolidated statement of financial position.
The group’s intercompany transactions, unrealized margins on internal deliveries, receivables and liabilities as well as dividends are eliminated. Unrealized losses on internal transactions are also eliminated unless costs are not recoverable or the loss results from an impairment. The consolidated financial statements are prepared applying consistent accounting principles to similar transactions and other events under equal conditions.
The share of results of associated companies, i.e. companies of which Vaisala owns 20–50% or over which it otherwise has significant influence, are included in the consolidated financial statements applying the equity method. If Vaisala’s share of an associated company’s losses exceeds the carrying amount of the investment, the investment is recognized in the consolidated statement of financial position at zero value and further losses are not recognized unless the group has incurred obligations on behalf of the associated company. Unrealized gains on transactions between the group and its associated companies have been eliminated to the extent of the group’s interest in the associated companies. The group’s share of associated companies’ results is presented in the consolidated statement of income as a separate item before ‘financial income and expenses’. Investments in associated companies are initially recognized at cost and the carrying amount
Notes to the consolidated financial statements
Consolidated financial statements

105
OUR YEAR SUSTAINABILITYCREATING VALUE GOVERNANCE FINANCIALS
is increased or decreased by the share of post-acquisition results. Distribution of profit received from an investment reduces the carrying amount of the results.
Foreign currency translationItems relating to the consolidated result and financial position are measured using the currency of the primary economic environment in which the entity operates (“the functional currency”). The consolidated financial statements have been presented in euros, which is the parent company’s functional and presentation currency.
Transactions in foreign currencies are recorded in the functional currency using the exchange rate on the date of transaction. Receivables and payables in foreign currency have been valued at the rates quoted by European Central Bank on the last trading date of the financial year. Exchange rate differences resulting from the settlement of monetary items or from the presentation of items in the financial statements at different exchange rates from which they were originally recognized during the financial period or presented in the previous financial statements, are recognized as financial income or expenses in the financial period in which they arise.
Statements of financial position of subsidiaries in other functional currency than euro have been translated into euros using the rates quoted by European Central Bank on the last trading date of the financial year. Translating statements of income monthly average exchange rates have been used. Translating net income for the financial year using different exchange rates in the consolidated statements of income and in the consolidated statement of financial position, results in a translation difference, which is recognized in other comprehensive income. Translation differences arising from the elimination of the acquisition cost of foreign subsidiaries and the translation of the accumulated equity items after the acquisition are recognized in other comprehensive income. When a foreign subsidiary or associated company is disposed of or partly disposed of, the translation difference is recognized in the consolidated statement of income as part of the gain or loss on the sale.
Goodwill or fair value adjustments arising from the acquisition of a foreign entity are treated as assets and liabilities in the functional currency of the foreign entity and are translated at the rate of the last trading date of the financial year.
Key exchange rates
Average rates Period end rates
2020 2019 Dec 31, 2020 Dec 31, 2019
USD 1.1384 1.1213 1.2271 1.1234
CNY 7.8807 7.7282 8.0225 7.8205
JPY 121.51 122.29 126.49 121.94
GBP 0.8853 0.8795 0.8990 0.8508
New and amended IFRS standards that are effective for the year 2020The following new or revised IFRSs have been adopted from January 1, 2020 in these consolidated financial statements. Their adoption has not had any material impact on the disclosures or on the amounts reported in these financial statements.
Amendments to References to the Conceptual Framework in IFRS StandardsThe amendments included in Amendments to References to the Conceptual Framework in IFRS Standards include consequential amendments to affected Standards so that they refer to the new Framework. Not all amendments, however, update those pronouncements with regard to references to and quotes from the Framework so that they refer to the revised Conceptual Framework. Some pronouncements are only updated to indicate which version of the Framework they are referencing to (the IASC Framework adopted by the IASB in 2001, the IASB Framework of 2010, or the new revised Framework of 2018) or to indicate that definitions in the Standard have not been updated with the new definitions developed in the revised Conceptual Framework. The Standards which are amended are IFRS 2, IFRS 3, IFRS 6, IFRS 14, IAS 1, IAS 8, IAS 34, IAS 37, IAS 38, IFRIC 12, IFRIC 19, IFRIC 20, IFRIC 22, and SIC-32.
Amendments to IFRS 3 Definition of a businessThe amendments clarify that while businesses usually have outputs, outputs are not required for an integrated set of activities and assets to qualify as a business. To be considered a business an acquired set of activities and assets must include, at a minimum, an input and a substantive process that together significantly contribute to the ability to create outputs. The amendments remove the assessment of whether market participants are capable of replacing any missing inputs or processes and continuing to produce outputs. The amendments also introduce additional guidance that helps to determine whether a substantive process has been acquired. The amendments introduce an optional concentration test that permits a simplified assessment of whether an acquired set of activities and assets is not a business. Under the optional concentration test, the acquired set of activities and assets is not a business if substantially all of the fair value of the gross assets acquired is concentrated in a single identifiable asset or group of similar assets. The amendments are applied prospectively to all business combinations and asset acquisitions for which the acquisition date is on or after January 1, 2020.
Amendments to IAS 1 and IAS 8 Definition of material The amendments make the definition of material in IAS 1 easier to understand and are not intended to alter the underlying concept of materiality in IFRS Standards. The prohibition of ’obscuring’ material information with immaterial information has been included as part of the new definition. The threshold for materiality influencing users has been changed from ’could influence’ to ’could reasonably be expected to influence’. The definition of material in IAS 8 has been replaced by a reference to the definition of material in IAS 1. In addition, the IASB amended other Standards and the Conceptual Framework that contain a definition of ’material’ or refer to the term ‘material’ to ensure consistency.
Consolidated financial statements

106
OUR YEAR SUSTAINABILITYCREATING VALUE GOVERNANCE FINANCIALS
The following new and revised IFRSs has had no impact on the disclosures or on the amounts reported in these financial statements.• COVID-19-related rent concessions amendment to IFRS 16 has had no impact on these financial
statements as Vaisala as a lessee has not received any rent concessions occurring as a direct consequence of COVID-19.
• Interest rate benchmark reform amendments to IFRS 9 and IFRS 7 has had no impact on these financial statements as the group does not apply hedge accounting.
Accounting principles requiring management judgment and the main uncertainty factors relating to estimatesThe preparation of financial statements in accordance with IFRS requires management to make estimates and judgment in the application of the accounting policies. The financial statements are based on estimates and assumptions concerning the future, the outcome of which may differ from the estimates and assumptions made. The estimates and judgments made are based on past experience and other factors, such as assumptions about future events that may reasonably be expected to occur in the circumstances. Estimates and assumptions are reviewed on a regular basis.
Estimates and judgment have been used in particular in the following areas for which significant accounting policies and accounting estimates and judgments have been described in the accompanying notes:• Revenue recognition (note 3) (judgment and estimate)• Income taxes (note 10) (judgment and estimate)• Allowances for excess and obsolete inventory (note 13) (estimate)• Fair value allocation of purchase price in business combinations (notes 16 and 25) (estimate)• Impairment testing (note 16) (estimate)• Leases (note 17) (judgment)
In addition, estimates, judgment and assumptions are related to the following areas: • With regard to pension obligations (note 6) assumptions in actuarial calculations related to e.g. discount
interest rate, inflation and development of salary and pension indexes (assumption)• With regard to share-based payments (note 7) estimate related to e.g. profitability forecasts and
attrition of participants benefiting from the share-based payment plans (estimate)• With regard to warranty provision (note 15) estimate related to future costs (estimate)• With regard to credit loss allowance for trade receivables and contract assets (note 21) estimate related
to expected credit loss risk for different groups of receivables (estimate)
Financial development1. REPORTABLE SEGMENTS
Accounting principlesVaisala has two operating and reportable segments, which are based on the type of business operations: Weather and Environment Business Area and Industrial Measurements Business Area. Operating segments have not been aggregated to build the reportable segments.
Operating segments are based on the management reports reviewed by Vaisala Management Group, which is the chief operating decision-maker of Vaisala. Vaisala Management Group is responsible for allocating resources and assessing performance of the operating segments. Vaisala Management Group assesses the performance of the operating segment based on the operating result. The reporting provided to Vaisala Management Group is prepared in consistency with the principles of IFRS consolidated financial statements. As of the beginning of the financial year 2020 only income and expenses related to discontinued businesses are not allocated to operating segments and are presented in Other operations. Previously no restructuring and M&A activities related costs nor discontinued operations were allocated to operating segments and were presented in Other operations. Transfer pricing between segments is based on arm’s length principle.
Weather and Environment Business Area serves selected weather-dependent markets where accurate, real-time, uninterrupted, and reliable weather data is essential to run efficient operations. Main markets are meteorology, ground transportation, aviation, railway, maritime, safety and security, renewable energy, and ambient air quality.
Industrial Measurements Business Area serves a wide range of industrial customers. It offers a broad range of measurement instruments to ensure operational quality and productivity. Main markets are high-end humidity and carbon dioxide measurements, life science, and power industry.
Revenue recognition principles are presented in note 3, Revenue from contracts with customers.
Consolidated financial statements

107
OUR YEAR SUSTAINABILITYCREATING VALUE GOVERNANCE FINANCIALS
Reportable segments
2020EUR million
Weather and Environment
Industrial Measurements
Other operations Vaisala total
Products 137.4 129.9 267.3
Projects 59.3 59.3
Services 38.8 14.1 52.9
Net sales 235.5 143.9 379.5
Performance obligations satisfied at a point in time 154.2 141.2 295.5
Performance obligations satisfied over time 81.3 2.7 84.0
Net sales 235.5 143.9 379.5
Operating result 14.6 31.6 -1.4 44.8
Share of result in associated company 0.2
Financial income and expenses -3.6
Result before taxes 41.3
Income taxes -8.5
Result for the financial year 32.8
Reportable segments
2019EUR million
Weather and Environment
Industrial Measurements
Other operations Vaisala total
Products 149.0 129.5 278.5
Projects 73.2 73.2
Services 39.1 12.8 51.9
Net sales 261.3 142.3 403.6
Performance obligations satisfied at a point in time 168.6 140.0 308.6
Performance obligations satisfied over time 92.7 2.3 95.0
Net sales 261.3 142.3 403.6
Operating result 17.7 26.1 -2.7 41.1
Share of result in associated company 0.1
Financial income and expenses -1.1
Result before taxes 40.2
Income taxes -6.6
Result for the financial year 33.6
Consolidated financial statements

108
OUR YEAR SUSTAINABILITYCREATING VALUE GOVERNANCE FINANCIALS
2. GEOGRAPHICAL SEGMENTSVaisala’s reportable segments operate in geographical areas which are Americas, APAC and EMEA. 1)
Geographical segments
2020 EUR million
Net sales, by destination
country2)
Net sales, by location
country3)
Non-current assets3)
Americas 134.9 124.3 35.7
of which United States 109.9 117.5 35.4
APAC 110.4 67.1 4.8
EMEA 134.2 324.5 121.7
of which Finland 9.8 258.4 111.1
Eliminations -136.5
Total 379.5 379.5 162.2
Geographical segments
2019EUR million
Net sales, by destination
country2)
Net sales, by location
country3)
Non-current assets3)
Americas 149.7 137.1 32.1
of which United States 120.1 129.5 31.7
APAC 119.6 63.9 3.5
EMEA 134.3 341.7 115.0
of which Finland 9.8 275.2 104.7
Eliminations -139.1
Total 403.6 403.6 150.6
1) Americas: North and South America, APAC: Asia Pacific, EMEA: Europe, Middle East and Africa2) Sales to external customers have been presented as net sales by destination country3) Net sales and non-current assets have been presented according to the group’s and associated companies’ countries
3. REVENUE FROM CONTRACTS WITH CUSTOMERS Accounting principles
Vaisala’s net sales consist of revenue recognized from contracts with customers. Net sales are divided into products, projects and services. Indirect taxes and discounts have been deducted from sales revenue. Exchange rate differences are recognized in the financial income and expenses.
Product net sales include revenue from products, spare parts and system deliveries. A system delivery contains a standard product delivery with limited amount of configuration. Each distinct product delivery is a performance obligation under IFRS 15. Revenue from the sale of products is recognized at a point in time when the control is transferred to the customer.
Projects are integrated projects, in which observation solutions, consisting of products, services and software, are delivered. Solutions are integrated to customer systems according to customer specifications. Therefore, one project is one performance obligation under IFRS 15. Revenue for all projects is recognized over time using percentage of completion method. Progress is measured by cost-to-cost method, comparing incurred costs and forecasted costs, as it best describes the satisfaction of a performance obligation by transferring the promised asset to a customer. Projects meet the over-time revenue recognition criteria mainly by creating an asset without an alternative use and Vaisala having an enforceable right to payment for performance completed to date.
Services are divided into service contracts and one off service deliverables. Services may include maintenance, calibration and repair, modernization, extended warranties and data based solutions supporting decisions in weather-dependent operations. Service contracts are continuous services including for example extended warranty, availability of customer support and availability of spare part delivery. One service contract or one service deliverable is one performance obligation. Service contracts are recognized over time or at a point of time depending on the nature of the service and content of a contract. In case of one-off request services, the revenue is recognized at a point in time when the service has been rendered.
Standard warranty period for products is one year and 2, 5 or 10 years for selected products. Standard warranty period for services is 6 or 12 months. Extended warranty is a separately sold and priced service over a separately agreed period. Revenue for extended warranty is recognized over time starting at the time of standard warranty expiration. Provision for warranty costs is recognized as described in Note 15, Provisions.
Accounting principles requiring management judgment and the main uncertainty factors relating to estimatesRevenue recognition over time under IFRS 15 requires management judgment related to cost throughout the project delivery. When the outcome of a project cannot be estimated reliably, project costs are recognized as expenses in the same period when they arise and project revenues only to the extent of project costs incurred where it is probable that those costs will be recoverable. When it is probable that total costs necessary to complete the project will exceed total project revenue, the expected loss is recognized as an expense immediately.
Consolidated financial statements
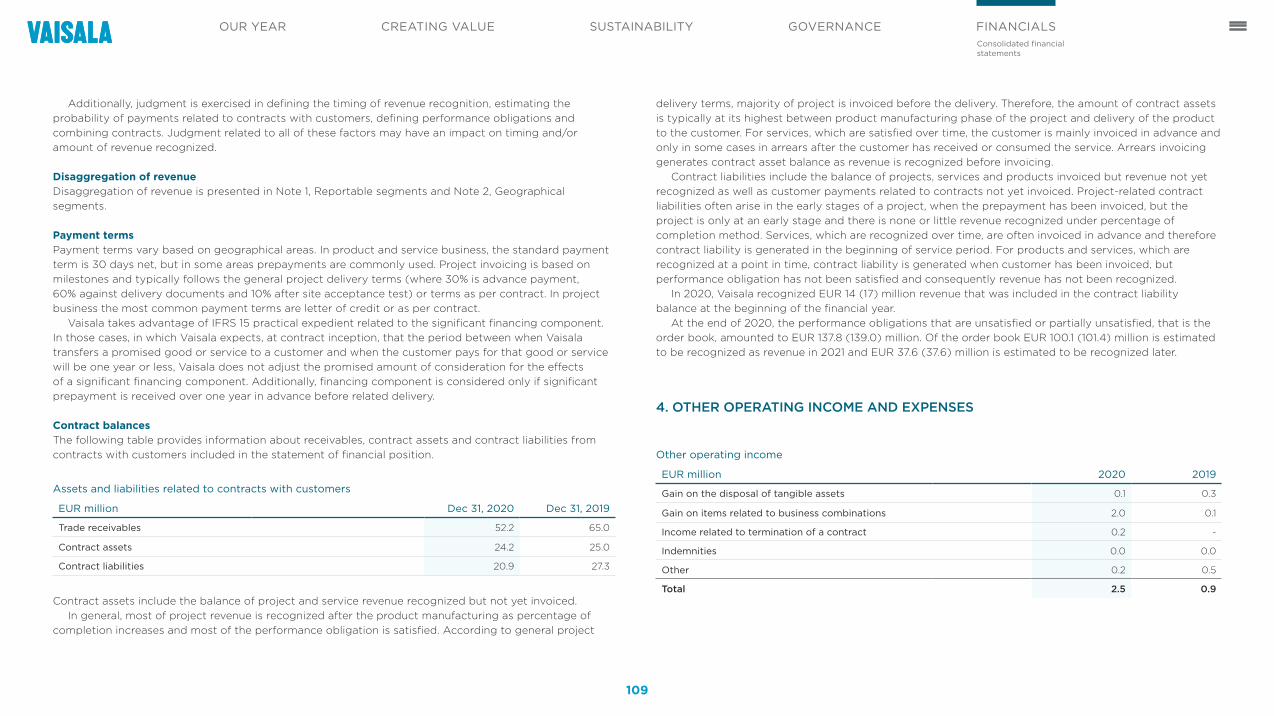
109
OUR YEAR SUSTAINABILITYCREATING VALUE GOVERNANCE FINANCIALS
Additionally, judgment is exercised in defining the timing of revenue recognition, estimating the probability of payments related to contracts with customers, defining performance obligations and combining contracts. Judgment related to all of these factors may have an impact on timing and/or amount of revenue recognized.
Disaggregation of revenueDisaggregation of revenue is presented in Note 1, Reportable segments and Note 2, Geographical segments.
Payment termsPayment terms vary based on geographical areas. In product and service business, the standard payment term is 30 days net, but in some areas prepayments are commonly used. Project invoicing is based on milestones and typically follows the general project delivery terms (where 30% is advance payment, 60% against delivery documents and 10% after site acceptance test) or terms as per contract. In project business the most common payment terms are letter of credit or as per contract.
Vaisala takes advantage of IFRS 15 practical expedient related to the significant financing component. In those cases, in which Vaisala expects, at contract inception, that the period between when Vaisala transfers a promised good or service to a customer and when the customer pays for that good or service will be one year or less, Vaisala does not adjust the promised amount of consideration for the effects of a significant financing component. Additionally, financing component is considered only if significant prepayment is received over one year in advance before related delivery.
Contract balancesThe following table provides information about receivables, contract assets and contract liabilities from contracts with customers included in the statement of financial position.
Assets and liabilities related to contracts with customers
EUR million Dec 31, 2020 Dec 31, 2019
Trade receivables 52.2 65.0
Contract assets 24.2 25.0
Contract liabilities 20.9 27.3
Contract assets include the balance of project and service revenue recognized but not yet invoiced. In general, most of project revenue is recognized after the product manufacturing as percentage of
completion increases and most of the performance obligation is satisfied. According to general project
delivery terms, majority of project is invoiced before the delivery. Therefore, the amount of contract assets is typically at its highest between product manufacturing phase of the project and delivery of the product to the customer. For services, which are satisfied over time, the customer is mainly invoiced in advance and only in some cases in arrears after the customer has received or consumed the service. Arrears invoicing generates contract asset balance as revenue is recognized before invoicing.
Contract liabilities include the balance of projects, services and products invoiced but revenue not yet recognized as well as customer payments related to contracts not yet invoiced. Project-related contract liabilities often arise in the early stages of a project, when the prepayment has been invoiced, but the project is only at an early stage and there is none or little revenue recognized under percentage of completion method. Services, which are recognized over time, are often invoiced in advance and therefore contract liability is generated in the beginning of service period. For products and services, which are recognized at a point in time, contract liability is generated when customer has been invoiced, but performance obligation has not been satisfied and consequently revenue has not been recognized.
In 2020, Vaisala recognized EUR 14 (17) million revenue that was included in the contract liability balance at the beginning of the financial year.
At the end of 2020, the performance obligations that are unsatisfied or partially unsatisfied, that is the order book, amounted to EUR 137.8 (139.0) million. Of the order book EUR 100.1 (101.4) million is estimated to be recognized as revenue in 2021 and EUR 37.6 (37.6) million is estimated to be recognized later.
4. OTHER OPERATING INCOME AND EXPENSES
Other operating income
EUR million 2020 2019
Gain on the disposal of tangible assets 0.1 0.3
Gain on items related to business combinations 2.0 0.1
Income related to termination of a contract 0.2 -
Indemnities 0.0 0.0
Other 0.2 0.5
Total 2.5 0.9
Consolidated financial statements

110
OUR YEAR SUSTAINABILITYCREATING VALUE GOVERNANCE FINANCIALS
Other operating expenses
EUR million 2020 2019
Loss on the disposal of tangible assets 0.0 -
Restructuring expenses 1.4 2.2
Expenses related to termination of a contract - 1.5
Total 1.4 3.6
Other operating income and expenses, net 1.1 -2.7
5. PERSONNEL EXPENSES AND NUMBER OF PERSONNEL
Personnel expenses
EUR million 2020 2019
Salaries 124.9 126.6
Share-based payments 4.0 3.5
Social costs 11.1 12.2
Pensions
Defined benefit plans 0.0 0.1
Defined contribution plans 14.1 15.3
Total 154.1 157.7
Personnel expenses by function
EUR million 2020 2019
Procurement and production 45.3 48.2
Sales, marketing and administration 64.7 69.2
Research and development 44.1 40.3
Total 154.1 157.7
Personnel, average by business area
Persons 2020 2019
Weather and Environment 817 797
Industrial Measurements 424 390
Other operations 670 642
Total 1,911 1,829
Personnel, average by geographical area
Persons 2020 2019
Americas 293 321
APAC 172 163
EMEA (excluding Finland) 234 225
Finland 1,212 1,119
Total 1,911 1,829
Information on share-based payments is disclosed in Note 7, Share-based payments.Information on key management compensation is disclosed in Note 28, Related party transactions.
6. PENSION OBLIGATIONS Accounting principles
The group has several pension plans around the world based on local practices. These pension schemes are classified either as defined contribution or as defined benefit plans. In defined contribution plans expenses are recognized in the statement of income on an accrual basis. TyEL pensions managed in insurance companies are defined contribution plans.
In defined benefit pension plans, liability to be recognized is the net amount of the present value of the defined benefit obligation in the end of the financial year and the fair value of the plan assets adjusted by the unamortized portion of unrecognized past service cost. The defined benefit obligation is calculated by actuaries independent of Vaisala and it is based on the projected unit credit method in which the estimated future cash flows are discounted to their present value using the interest rates approximating high quality corporate bonds. Pension costs are recognized in the statement of income on an accrual basis over years of service. Actuarial gains and losses are recognized in statement of comprehensive income.
Consolidated financial statements

111
OUR YEAR SUSTAINABILITYCREATING VALUE GOVERNANCE FINANCIALS
Defined benefit plansThe defined benefit plans are in the parent company. The additional pension coverage of parent company personnel was arranged by Vaisala Pension Fund that was closed on January 1, 1983. The pension fund liability was transferred to a pension insurance company on December 31, 2005 and the fund was dissolved in 2006. The company retains, however, an obligation under IAS 19 for future index and salary increases in terms of individuals covered by the Pension Fund who are employed by the company.
Defined benefit pension liability
EUR million 2020 2019
Fair value of funded obligations 4.9 4.9
Fair value of assets -4.4 -4.3
Net liability in the statement of financial position at Dec 31 0.6 0.6
Amounts recognized in the statement of income and the statement of other comprehensive income
EUR million 2020 2019
Current service cost 0.0 0.0
Interest 0.0 0.0
Expense recognized in the statement of income 0.0 0.0
Net actuarial gain and loss -0.0 -0.2
Total recognized in the statement of income and the statement of other comprehensive income
-0.0 -0.2
Pension costs in the statement of income have been recognized in sales, marketing and administrative costs.
Present value of obligation
EUR million 2020 2019
Changes in the present value of obligation
Present value of obligation Jan 1 4.9 5.0
Current service cost 0.0 0.0
Interest cost 0.0 0.1
Remeasurements
Actuarial gain (-) / loss (+) arising from changes in financial assumptions 0.1 0.3
Experience adjustment 0.4 -0.2
Benefits paid -0.4 -0.3
Present value of obligation Dec 31 4.9 4.9
Changes in the fair value of plan assets
EUR million 2020 2019
Fair value of plan assets Jan 1 4.3 4.3
Interest income on assets 0.0 0.1
Net return on plan assets 0.5 0.4
Benefits paid -0.4 -0.3
Contributions -0.0 -0.1
Fair value of plan assets Dec 31 4.4 4.3
Consolidated financial statements
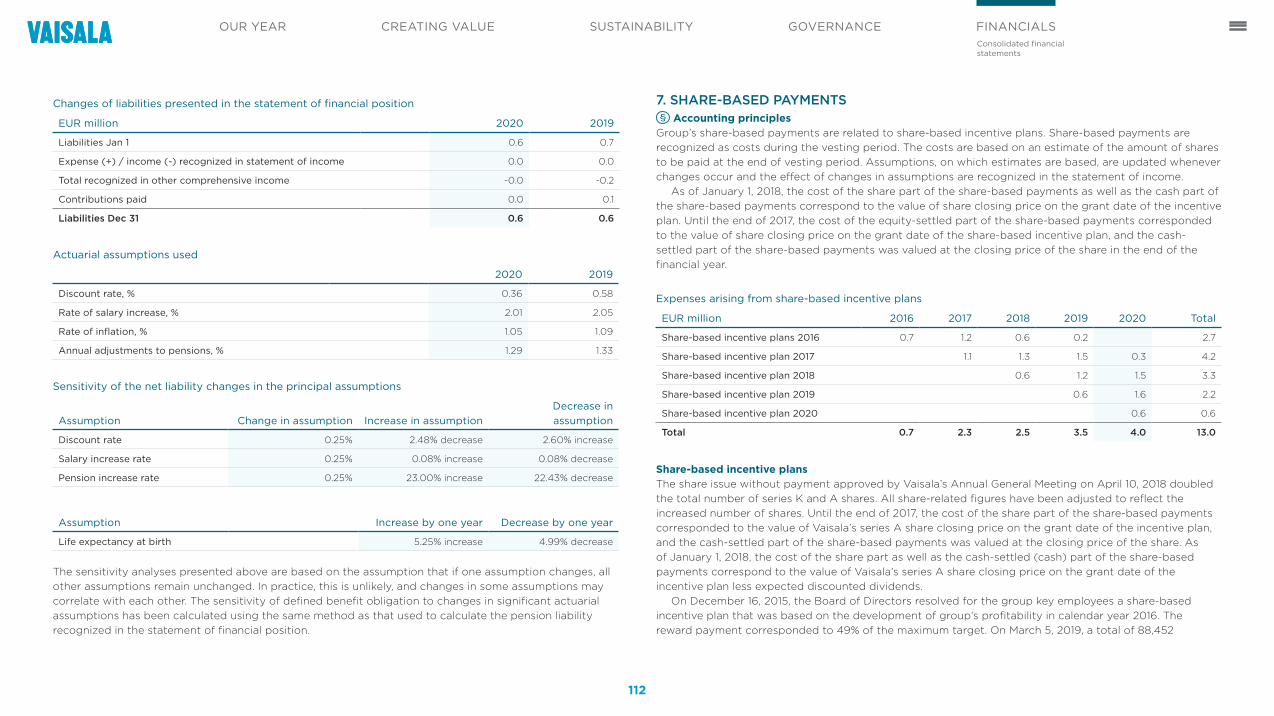
112
OUR YEAR SUSTAINABILITYCREATING VALUE GOVERNANCE FINANCIALS
Changes of liabilities presented in the statement of financial position
EUR million 2020 2019
Liabilities Jan 1 0.6 0.7
Expense (+) / income (-) recognized in statement of income 0.0 0.0
Total recognized in other comprehensive income -0.0 -0.2
Contributions paid 0.0 0.1
Liabilities Dec 31 0.6 0.6
Actuarial assumptions used
2020 2019
Discount rate, % 0.36 0.58
Rate of salary increase, % 2.01 2.05
Rate of inflation, % 1.05 1.09
Annual adjustments to pensions, % 1.29 1.33
Sensitivity of the net liability changes in the principal assumptions
Assumption Change in assumption Increase in assumptionDecrease in assumption
Discount rate 0.25% 2.48% decrease 2.60% increase
Salary increase rate 0.25% 0.08% increase 0.08% decrease
Pension increase rate 0.25% 23.00% increase 22.43% decrease
Assumption Increase by one year Decrease by one year
Life expectancy at birth 5.25% increase 4.99% decrease
The sensitivity analyses presented above are based on the assumption that if one assumption changes, all other assumptions remain unchanged. In practice, this is unlikely, and changes in some assumptions may correlate with each other. The sensitivity of defined benefit obligation to changes in significant actuarial assumptions has been calculated using the same method as that used to calculate the pension liability recognized in the statement of financial position.
7. SHARE-BASED PAYMENTS Accounting principles
Group’s share-based payments are related to share-based incentive plans. Share-based payments are recognized as costs during the vesting period. The costs are based on an estimate of the amount of shares to be paid at the end of vesting period. Assumptions, on which estimates are based, are updated whenever changes occur and the effect of changes in assumptions are recognized in the statement of income.
As of January 1, 2018, the cost of the share part of the share-based payments as well as the cash part of the share-based payments correspond to the value of share closing price on the grant date of the incentive plan. Until the end of 2017, the cost of the equity-settled part of the share-based payments corresponded to the value of share closing price on the grant date of the share-based incentive plan, and the cash-settled part of the share-based payments was valued at the closing price of the share in the end of the financial year.
Expenses arising from share-based incentive plans
EUR million 2016 2017 2018 2019 2020 Total
Share-based incentive plans 2016 0.7 1.2 0.6 0.2 2.7
Share-based incentive plan 2017 1.1 1.3 1.5 0.3 4.2
Share-based incentive plan 2018 0.6 1.2 1.5 3.3
Share-based incentive plan 2019 0.6 1.6 2.2
Share-based incentive plan 2020 0.6 0.6
Total 0.7 2.3 2.5 3.5 4.0 13.0
Share-based incentive plansThe share issue without payment approved by Vaisala’s Annual General Meeting on April 10, 2018 doubled the total number of series K and A shares. All share-related figures have been adjusted to reflect the increased number of shares. Until the end of 2017, the cost of the share part of the share-based payments corresponded to the value of Vaisala’s series A share closing price on the grant date of the incentive plan, and the cash-settled part of the share-based payments was valued at the closing price of the share. As of January 1, 2018, the cost of the share part as well as the cash-settled (cash) part of the share-based payments correspond to the value of Vaisala’s series A share closing price on the grant date of the incentive plan less expected discounted dividends.
On December 16, 2015, the Board of Directors resolved for the group key employees a share-based incentive plan that was based on the development of group’s profitability in calendar year 2016. The reward payment corresponded to 49% of the maximum target. On March 5, 2019, a total of 88,452
Consolidated financial statements

113
OUR YEAR SUSTAINABILITYCREATING VALUE GOVERNANCE FINANCIALS
company’s series A shares were conveyed without consideration to the 30 key employees participating in this incentive plan. The rest of the reward was paid in cash. Closing price of Vaisala’s series A share was EUR 11.57 on the grant date of the incentive plan. A total expense of this plan of EUR 2.3 million was recorded for 2016–2019.
On February 10, 2016, the Board of Directors resolved for a share-based incentive plan, in which the earning criteria was uninterrupted employment of certain group employees for a defined number of years. This share-based incentive plan ended in March 2018, and the remaining reward, corresponding to 3,000 Vaisala’s series A shares including the cash portion, was conveyed without consideration to the key employees participating in this incentive plan. A total expense of this plan of EUR 0.3 million was recorded for 2016–2018.
On December 15, 2016, the Board of Directors resolved for the group key employees a share-based incentive plan that was based on the development of group’s profitability in calendar year 2017. The reward payment corresponded to 65% of the maximum target. On March 3, 2020, a total of 118,950 company’s series A shares were conveyed without consideration to 33 key employees participating in this incentive plan. The rest of the reward was paid in cash. In addition, on June 28, 2019, a total reward of 1,734 Vaisala’s series A shares was conveyed without consideration to a key employee who participated in this incentive plan and the other half of the reward was paid in cash. Closing price of Vaisala’s series A share was EUR 17.90 on the grant date of the incentive plan. A total expense of this plan of EUR 4.2 million was recorded for 2017–2020.
On February 7, 2018, the Board of Directors resolved for the group key employees a share-based incentive plan that was based on the development of group’s profitability in calendar year 2018. The reward will be paid partly in Vaisala’s series A shares and partly in cash in spring 2021. The cash proportion will cover taxes and tax-related costs arising from the reward to a key employee. The maximum amount of this plan originally corresponded to 320,000 series A shares, and the reward payment will correspond to 55% of the maximum target. No reward will be paid if a key employee’s employment or service ends before the reward payment date. The expenses of this share-based incentive plan are accrued over the term of the plan from April 2018 to March 2021. Closing price of Vaisala’s series A share was EUR 22.10 on the grant date of the incentive plan. On December 31, 2020, this share-based incentive plan was directed to 27 persons and the maximum reward payable totals to 166,200 Vaisala’s series A shares, including the cash portion. On the grant date October 1, 2020, a total of 8,000 series A shares were directed to Kai Öistämö, President and CEO, and the earning criteria for these shares is uninterrupted service until the payment date. On June 28, 2019, a total reward of 461 Vaisala’s series A shares was conveyed without consideration to a key employee who participated in this incentive plan and the other half of the reward was paid in cash.
On February 12, 2019, the Board of Directors resolved for approximately 45 group key employees a share-based incentive plan that is based on the development of the total shareholder return (TSR) and
profitability in 2019–2021. The reward will be paid partly in Vaisala’s series A shares and partly in cash in spring 2022. The cash proportion will cover taxes and tax-related costs arising from the reward to a key employee. The maximum amount of this plan originally corresponded to 330,000 series A shares. No reward will be paid if a key employee’s employment or service ends before the reward payment date. In addition, Vaisala’s Board of Directors requires that the President and CEO and each member of the Management Group retains his/her ownership of shares received under this plan until the value of his/her ownership in Vaisala corresponds to at least his/her annual gross base salary. The expenses of this share-based incentive plan are accrued over the term of the plan from April 2019 to March 2022. Closing price of Vaisala’s series A share was EUR 19.06 on the grant date of the incentive plan. On December 31, 2020, this share-based incentive plan was directed to 44 persons. On the grant date October 1, 2020, a total of 4,000 series A shares were directed to Kai Öistämö, President and CEO, and the earning criteria for these shares is uninterrupted service until the payment date.
On February 12, 2020, the Board of Directors resolved for approximately 45 group key employees a share-based incentive plan that is based on the development of the total shareholder return (TSR) and profitability in 2020–2022. The reward will be paid partly in Vaisala’s series A shares and partly in cash in spring 2023. The cash proportion will cover taxes and tax-related costs arising from the reward to a key employee. The maximum amount of this plan originally corresponded to 240,000 series A shares. No reward will be paid if a key employee’s employment or service ends before the reward payment date. In addition, Vaisala’s Board of Directors requires that the President and CEO and each member of the Management Group retains his/her ownership of shares received under this plan until the value of his/her ownership in Vaisala corresponds to at least his/her annual gross base salary. The expenses of this share-based incentive plan are accrued over the term of the plan from May 2020 to March 2023. Closing price of Vaisala’s series A share was EUR 28.65 on the grant date of the incentive plan. On December 31, 2020, this share-based incentive plan was directed to 48 persons, including a total of 21,375 series A shares directed to Kai Öistämö, President and CEO, on the grant date October 1, 2020.
On December 17, 2020, the Board of Directors resolved for approximately 40 group key employees a share-based incentive plan that is based on the development of the total shareholder return (TSR) and profitability in 2021–2023. The reward will be paid partly in Vaisala’s series A shares and partly in cash in spring 2024. The cash proportion will cover taxes and tax-related costs arising from the reward to a key employee. The maximum amount of this plan originally corresponded to 180,000 series A shares. No reward will be paid if a key employee’s employment or service ends before the reward payment date. In addition, Vaisala’s Board of Directors requires that the President and CEO and each member of the Management Group retains his/her ownership of shares received under this plan until the value of his/her ownership in Vaisala corresponds to at least his/her annual gross base salary.
Consolidated financial statements

114
OUR YEAR SUSTAINABILITYCREATING VALUE GOVERNANCE FINANCIALS
8. RESEARCH AND DEVELOPMENT EXPENDITURE Accounting principles
Research and development expenditure is recognized as costs in the financial year in which they incur, except for machinery and equipment acquired for research and development purposes, which are capitalized and depreciated on a straight-line basis.
According to IAS 38, an intangible asset is recognized in the statement of financial position only when it is probable that the expected future economic benefits will flow to the entity. Vaisala does not capitalize costs related to the development of new products and processes as their future returns will not be realized until the products enter the market. According to IAS 38 no intangible asset arising from research shall be recognized and if an entity cannot distinguish the research phase from the development phase of an internal project, the entity treats the expenditure as if it were incurred in research phase only. It is typical for the industry, in which Vaisala operates, that it is not possible to distinguish the research phase of an internal project that aims to create an asset from its development phase.
The statement of income includes research and development costs of EUR 53.2 (52.8) million in 2020.
9. FINANCIAL INCOME AND EXPENSES Accounting principles
Exchange rate differences resulting from settlement of monetary items or from presentation of items in the financial statements at different exchange rates from which they were originally recognized during the financial period or presented in the previous financial statements, are recognized as financial income or expenses in the financial period in which they arise.
All derivative financial contracts are initially recognized at cost and subsequently remeasured at their fair value. Derivative financial contracts are valued at their fair value using the market prices of derivative financial contracts at the closing date of the financial year. Unrealized and realized gains and losses arising from changes in the fair value are recognized in the statement of income in ‘financial income and expenses” in the period in which they arise.
Interest income and expenses related to financial assets and liabilities at amortized cost are recognized over time. Principles related to interest expenses related to lease liabilities are presented in note 17, Leases.
Financial income
EUR million 2020 2019
Interest and financial income 0.0 0.3
Gains arising from sale of shares 0.1 -
Gains arising from changes in fair values of derivative financial contracts 2.3 1.3
Foreign exchange gains 2.5 3.0
Total 5.0 4.6
Financial expenses
EUR million 2020 2019
Interest expenses 0.6 0.3
Interest expenses on lease liabilities 0.4 0.3
Other financial expenses 0.3 0.3
Losses arising from changes in fair values of derivative financial contracts 1.3 2.5
Foreign exchange losses 5.9 2.3
Total 8.5 5.7
Financial income and expenses, net -3.6 -1.1
Foreign exchange gains and losses include gains and losses mainly from revaluation of cash and cash equivalents, trade and other receivables, internal loans as well as trade and other payables.
10. INCOME TAXES Accounting principles
The group tax expense includes taxes of group companies based on taxable profit for the financial year, tax adjustments for previous years and changes in deferred taxes. Taxes are recognized in the consolidated statement of income except when they are related with items recognized in other comprehensive income or directly in shareholder’s equity. Current taxes are calculated on the taxable income based on the tax rates enacted or substantively enacted for each country by the end of the financial year. Taxes are adjusted for the taxes of previous financial periods, if applicable.
Consolidated financial statements

115
OUR YEAR SUSTAINABILITYCREATING VALUE GOVERNANCE FINANCIALS
Deferred taxes are calculated for all temporary differences between the carrying amount of an asset or a liability and its tax base, and those are measured with enacted or substantively enacted tax rates by the end of the financial year. Main temporary differences arise from depreciation and amortization, accruals for share-based incentive plans and tax losses carried forward. Other temporary timing differences consist mainly of provisions and accruals of operating expenses. Deferred tax assets are recognized to the extent that it is probable that these can be utilized against future taxable profits.
Accounting principles requiring management judgment and the main uncertainty factors relating to estimatesDefining income taxes and deferred tax assets and liabilities as well as to what extent deferred tax assets may be recognized require management judgment. Group is subject to income taxation in several countries, in which interpretation of tax legislation may require management judgment and uncertainty may relate to the applied interpretations. Additionally, management assumptions and estimates are needed especially in recognizing deferred tax assets related to tax losses carried forward. Key assumptions relate to the facts that recoverability periods for tax losses carried forward will not change and existing tax laws and rates remain unchanged in the near future. Recognizing deferred tax assets on tax losses carried forward requires also preparing estimates on future taxable income and its timing.
Income taxes
EUR million 2020 2019
Tax based on taxable income for the financial year 7.5 9.1
Taxes from previous financial years -0.9 -0.6
Change in deferred tax assets and liabilities 1.9 -1.9
Total 8.5 6.6
Reconciliation statement between the statement of income tax item and taxes calculated at the tax rate of the group country of domicile
EUR million 2020 2019
Result before taxes 41.4 40.2
Taxes calculated at the Finnish tax rate 8.3 8.0
Effect of foreign subsidiaries' tax rates 1.0 0.8
Non-deductible expenses, tax-free revenue and tax incentives -0.2 0.1
Taxes from previous financial years -0.9 -0.6
Other direct taxes 0.1 0.1
Reassessment of deferred tax assets 0.6 -1.9
Other -0.4 0.1
Total 8.5 6.6
Effective tax rate 20.6% 16.3%
Vaisala had in total of EUR 8.9 (7.8) million tax losses carried forward for which no deferred tax assets have been recognized as of December 31, 2020. In financial year 2019 deferred tax liabilities in total of EUR 0.8 million was recognized for intangible assets (including technology-based and customer related intangible assets) identified in business combinations.
Deferred taxes in the statement of financial position
EUR million 2020 2019
Deferred tax assets 7.3 9.8
Deferred tax liabilities -7.7 -8.1
Total -0.4 1.7
Consolidated financial statements

116
OUR YEAR SUSTAINABILITYCREATING VALUE GOVERNANCE FINANCIALS
Gross change in deferred taxes recognized in the statement of financial position
EUR million 2020 2019
Deferred taxes Jan 1 1.7 0.4
Items recognized in the statement of income -1.9 1.9
Effect of business combinations 0.0 -0.8
Translation differences -0.2 0.0
Items recognized in the equity 0.0 0.2
Items recognized in the statement of comprehensive income -0.0 0.0
Deferred taxes Dec 31 -0.4 1.7
Changes in deferred taxes during 2020
EUR million Jan 1, 2020Recognized in the
statement of income Translation differences
Recognized in the statement of
comprehensive income Dec 31, 2020
Deferred tax assets
Internal margin of inventories, intangible assets and property, plant and equipment 0.8 0.2 0.0 1.0
Employee benefits and share-based payments 2.0 0.0 0.0 -0.0 2.0
Unused tax losses 4.0 -0.8 -0.1 3.1
Timing difference of amortization on intangible assets and depreciation on property,
plant and equipment 2.3 -0.6 1.7
Other temporary timing differences 3.4 -1.0 -0.2 2.0
Netted against deferred tax liabilities -2.7 0.2 -2.5
Total 9.8 -2.1 -0.4 -0.0 7.3
Deferred tax liabilities
Timing difference of amortization on intangible assets and depreciation on property,
plant and equipment 10.4 -0.4 -0.2 9.8
Other 0.4 0.1 0.0 0.5
Netted against deferred tax assets -2.7 0.2 -2.6
Total 8.1 -0.1 -0.2 7.7
Deferred taxes, net 1.7 -1.9 -0.2 -0.0 -0.4
Consolidated financial statements

117
OUR YEAR SUSTAINABILITYCREATING VALUE GOVERNANCE FINANCIALS
Changes in deferred taxes during 2019
EUR million Jan 1, 2019Recognized in the
statement of incomeEffect of business
combinationsTranslation differences Recognized in equity
Recognized in the statement of
comprehensive income Dec 31, 2019
Deferred tax assets
Internal margin of inventories, intangible assets and
property, plant and equipment 0.7 0.1 0.0 0.8
Employee benefits and share-based payments 1.9 0.2 0.0 0.0 2.0
Unused tax losses 2.8 1.2 0.0 4.0
Timing difference of amortization on intangible
assets and depreciation on property, plant and
equipment 2.8 -0.5 2.3
Other temporary timing differences 3.7 -0.2 0.0 3.4
Netted against deferred tax liabilities -2.0 -0.7 -2.7
Total 9.8 0.0 0.0 0.0 9.8
Deferred tax liabilities
Timing difference of amortization on intangible
assets and depreciation on property, plant and
equipment 11.0 -1.3 0.8 10.4
Other 0.5 0.1 -0.2 0.4
Netted against deferred tax assets -2.0 -0.7 -2.7
Total 9.4 -1.9 0.8 -0.2 8.1
Deferred taxes, net 0.4 1.9 -0.8 0.0 0.2 0.0 1.7
Consolidated financial statements

118
OUR YEAR SUSTAINABILITYCREATING VALUE GOVERNANCE FINANCIALS
11. EARNINGS PER SHARE Accounting principles
Earnings per share is calculated by dividing the result for the period attributable to the parent company’s shareholders by weighted average number of issued shares during the financial year. Diluted earnings per share is calculated by adjusting the weighted average number of shares outstanding during the financial year with the diluted effect of potential shares from the share-based payments.
Earnings per share
2020 2019
Result attributable to the shareholders of the parent company, EUR million 32.8 33.5
Weighted average number of shares outstanding, 1,000 pcs 35,979 35,864
Effect of share-based incentive plans, 1,000 pcs 243 269
Weighted average diluted number of shares, 1,000 pcs 36,223 36,133
Earnings per share, EUR 0.91 0.94
Diluted earnings per share, EUR 0.91 0.93
Net working capital12. TRADE RECEIVABLES AND OTHER RECEIVABLESAccounting principles related to trade receivables and other receivables are presented in Note 21, Financial assets and liabilities.
Trade receivables and other receivables
EUR million 2020 2019
Trade receivables 52.2 65.0
Advances paid 0.7 0.9
Value-added tax receivables 3.4 4.1
Other receivables 1.1 0.9
Derivative financial contracts 1.2 0.3
Other prepaid expenses and accrued income 5.4 6.2
Total 64.0 77.3
The fair value of trade and other receivables is, in all material respects, equivalent to their carrying amounts.
Expected credit losses of trade receivables
Dec 31, 2020Trade receivables,
gross amountCredit loss allowance
Trade receivables, net amount
Current 34.5 0.1 34.3
Due less than 90 days 11.8 0.0 11.7
Due 91-180 days 0.8 0.1 0.7
Due over 180 days 1.0 0.4 0.6
Credit loss allowance other than those based on age analysis 5.9 1.0 4.8
Total 53.9 1.7 52.2
Consolidated financial statements

119
OUR YEAR SUSTAINABILITYCREATING VALUE GOVERNANCE FINANCIALS
Expected credit losses of trade receivables
Dec 31, 2019Trade receivables,
gross amountCredit loss allowance
Trade receivables, net amount
Current 38.4 0.1 38.2
Due less than 90 days 16.4 0.1 16.3
Due 91-180 days 1.3 0.2 1.1
Due over 180 days 1.6 0.7 0.9
Credit loss allowance other than those based on age analysis 9.5 1.0 8.5
Total 67.1 2.0 65.0
Reconciliation of credit loss allowance of trade receivables
EUR million 2020 2019
Opening balance for credit loss allowance on Jan 1 2.0 2.2
Change in credit loss allowance recognized in profit or loss during the financial year 0.2 0.2
Receivables recognized as final credit losses during the financial year due to uncollectability -0.5 -0.7
Assets held for sale - 0.3
Exchange rate differences -0.1 0.0
Total 1.7 2.0
Credit losses and related reversals arising from trade receivables recognized for the financial year amounted to EUR -0.3 (-0.2) million.
Trade receivables by currency
EUR million 2020 2019
EUR 23.5 31.3
USD 17.4 21.3
GBP 2.6 3.7
JPY 4.7 5.1
AUD 0.8 0.8
CNY 1.7 1.3
CAD 1.0 0.8
Others 0.5 0.7
Total 52.2 65.0
13. INVENTORIES Accounting principles
Inventories are stated at the lower of standard cost or net realizable value. Inventory cost includes the cost of purchase (including mainly purchase price, import duties and transport), direct labor and a proportion of production overhead. An allowance is recognized for excess inventory and obsolescence.
Accounting principles requiring management judgment and the main uncertainty factors relating to estimatesAllowance for inventory is recognized for possible excess, obsolescence and decrease in net realizable value below inventory cost. Estimates and judgment are required in determining the value of the allowance for excess and obsolete inventory. Management analyses estimates of demand and determines allowance for excess and obsolete inventory. Possible changes in the assumptions may cause revaluation of inventory valuation in the future periods.
Consolidated financial statements

120
OUR YEAR SUSTAINABILITYCREATING VALUE GOVERNANCE FINANCIALS
Inventories
EUR million 2020 2019
Materials, supplies and finished goods 44.5 39.6
Total 44.5 39.6
The cost of inventories recognized in the statement of income as an expense corresponding to net sales was EUR 108.2 (111.6) million.
Write-offs and excess and obsolescence allowances for slow moving and obsolete inventory recognized during the financial year amounted to EUR 1.2 (2.4) million.
14. TRADE PAYABLES AND OTHER LIABILITIES Accounting principles
Due to the short maturity of trade payables and other liabilities the carrying amount is considered to be the fair value. Trade and other payables are classified as current liabilities if they are due within 12 months from the balance sheet date or are to be settled within the normal operating business cycle. Accounting principles for derivative financial contracts are presented in note 21, Financial assets and liabilities.
Trade payables and other liabilities
EUR million 2020 2019
Trade payables 13.8 18.0
Personnel cost accruals 27.0 32.2
Derivative financial contracts 0.1 0.4
Other accrued expenses and deferred income 5.0 6.6
Other current liabilities 6.4 7.3
Total 52.3 64.5
Trade payables arise from ordinary course of business and they relate to purchases of inventories, intangible and tangible assets and other goods and services. Personnel cost accruals are mainly related to bonuses and unused vacations.
15. PROVISIONS Accounting principles
A provision is recognized when group has a legal or constructive obligation as a result of a prior event, it is probable that an outflow of resources will be required to settle the obligation, and a reliable estimate of the amount can be made. The amount recognized as a provision is the best estimate of the expenditure required to settle the present obligation at the end of reporting period. If the effect of the time value of money is material, the amount of provision is the present value of the expenditure expected to be required to settle the obligation. The discount factor used in calculating the present value is selected so that it reflects the market view of the time value of money and the risks related to the obligations at the time of examination.
Where some or all of the expenditure required to settle a provision is expected to be reimbursed by a third party, the reimbursement is recognized as a separate asset but only when the reimbursement is virtually certain. The amount of provisions is reviewed at end of each reporting period and the amount is adjusted to reflect the current best estimate. A provision is reversed when the probability of financial settlement has been removed. A change in provision is recognized in the same item of the statement of income in which the provision was originally recognized.
Provisions can relate to restructuring of operations, loss-making contracts, warranties, legal disputes and other commitments.
A restructuring provision is recognized when a detailed and appropriate plan for restructuring has been prepared and the company has started to implement the plan or has announced it to those affected by it. Restructuring provisions include mainly lease termination penalties and redundancy payments.
A provision for a loss-making contract is recognized when unavoidable costs of meeting the obligation exceed the economic benefits expected to be received from the contract.
A warranty provision covers the cost of repairing or replacing the products. The warranty provision is based on past experience and an estimate of future costs.
Consolidated financial statements

121
OUR YEAR SUSTAINABILITYCREATING VALUE GOVERNANCE FINANCIALS
Non-current provisions
EUR million 2020 2019
Provisions Jan 1 0.1 0.2
Increase in provisions 0.0 0.0
Tranferred to current provisions - -0.0
Exchange rate differences - 0.0
Provisions Dec 31 0.1 0.1
Current provisions
EUR million 2020 2019
Provisions Jan 1 3.2 3.2
Increase in provisions 0.1 1.3
Transferred from non-current provisions - 0.0
Used provisions -1.5 -1.3
Provisions Dec 31 1.7 3.2
In 2020 and 2019 provisions related to warranties, restructuring, loss-making contracts and other contractual commitments.
Intangible and tangible assets16. INTANGIBLE AND TANGIBLE ASSETS
Accounting principlesGoodwillGoodwill represents the excess of the consideration transferred of an acquisition over the fair value of the group’s share of the net assets of the acquired entity at the date of acquisition. Goodwill is calculated in the currency of the operating environment of the acquired entity. If the consideration transferred is lower than the net asset value of the acquired entity, the difference is recognized in the statement of income. Goodwill is not amortized but tested annually for possible impairment and whenever there is an indication that the value may be impaired. For this purpose, goodwill has been allocated to cash-generating units. Vaisala’s total goodwill is allocated to the cash-generating unit formed by the Weather and Environment Business Area. Goodwill is valued at acquisition cost less impairment losses. Impairment losses are recognized in the statement of income.
Technology-based and customer related intangible assetsIntangible assets identified in connection with acquisitions are measured at the fair value at the acquisition date. In business combinations consideration transferred has been allocated to technology-based and customer related intangible assets. Initial measurement of technology-based and customer related intangible assets has been prepared by applying income and cost approach method. Intangible assets identified in connection with acquisitions are amortized over their delivery times or estimated useful lifetimes.
Other intangible assetsOther intangible assets include mainly patents, trademarks and licenses. Other intangible assets are recognized initially at acquisition cost and amortized using the straight-line method over their useful lifetime. Intangible assets that have an indefinite useful lifetime are not amortized, but are tested annually for impairment. The carrying amount of these intangible assets is not material.
Estimated useful lifetimes for intangible assets are:
Technology-based intangible assets 7-8 yearsCustomer related intangible assets 1-5 yearsIntangible rights 3–20 yearsSoftware licenses 3–5 yearsOther intangible assets 3–5 years
Consolidated financial statements

122
OUR YEAR SUSTAINABILITYCREATING VALUE GOVERNANCE FINANCIALS
Property, plant and equipmentProperty, plant and equipment comprise mainly land and buildings as well as machinery and equipment. The carrying amount of assets are based on original acquisition cost less accumulated depreciation as well as possible impairment losses. The cost of self-constructed assets includes materials and direct labor as well as a proportion of overhead costs attributable to construction labor. If a tangible asset consists of several parts which have different useful lifetimes, these parts are treated as separate assets. Accordingly, expenses relating to the renewal of a part are capitalized and the remaining part is recognized as an expense. Otherwise, expenditures that incur later are included in the carrying amount of the tangible assets only if it is probable that the future economic benefit connected with the asset is for the benefit of group and that the acquisition cost can be reliably determined. Other repair and maintenance expenses are recognized in the statement of income when realized.
Depreciation is calculated using the straight-line method and is based on the estimated useful lifetime of the asset. Land is not depreciated. Estimated useful lifetimes for assets are:
Buildings and structures 5–40 yearsMachinery and equipment 3–8 yearsOther tangible assets 3–8 years
The residual values, depreciation methods and useful lifetimes of the assets are reviewed, and adjusted if necessary, in connection with each financial statement to reflect changes in the expectations of future economic benefit. Gains and losses on disposals are determined by comparing the disposal proceeds with the carrying amount of the asset and are included in the operating result.
Public grants received for investments are recognized as a reduction in the carrying amounts of tangible assets. Thus, grants are recognized in the form of lower depreciation over the useful lifetime of the asset.
ImpairmentIn the end of each reporting period, the group reviews assets for any indication of impairment. The need for impairment is reviewed at cash-generating unit level, i.e. at the lowest level of units which is mainly independent of other units and whose cash flows are separate and highly independent from the cash flows of other corresponding units. If there is an indication of impairment, the recoverable amount of the asset is assessed. Additionally, the recoverable amount is assessed annually for the following assets irrespective of whether there is indication of impairment: goodwill, intangible assets which have an indefinite useful lifetime, as well as incomplete intangible assets.
The recoverable amount is the higher of the asset’s fair value less the cost arising from disposal and its value in use. In determining value in use, the estimated future cash flows are discounted to their present value using discount rates that reflect the average pre-tax cost of capital for the respective country and industry (WACC = weighted average cost of capital). The special risks associated with these assets are also taken into account in the discount rates. For an individual asset that does not independently generate future cash flows, the recoverable amount is determined for the cash-generating unit to which the asset belongs.
An impairment loss is recognized as an expense when the carrying amount of the asset is greater than its recoverable amount. An impairment loss is reversed if there has been a change in the circumstances that led to the estimates and the recoverable amount of the asset has changed since the impairment loss was recognized.
An impairment loss is not reversed more than the carrying amount of the asset (less depreciation) without an impairment loss recognized. Impairment losses recognized for goodwill are not reversed under any circumstances.
Accounting principles requiring management judgment and the main uncertainty factors relating to estimatesIn business combinations, IFRS 3 requires the acquirer to recognize an intangible asset separately from goodwill, if the recognition criteria are met. Recognition of an intangible asset at fair value requires management estimates of future cash flows. To the extent possible, management has used available market values as the basis for allocating costs to determine fair values. When this is not possible, which is typical especially for intangible assets, valuation is mainly based on the expectations on returns of the asset and its intended use in the business. Valuations are based on discounted cash flows and require management’s estimates and assumptions about the future use of the assets and their effect on the financial position of the company. Changes in the focus and direction of the company’s business operations may, in the future, result in changes in the original valuation. Group tests goodwill annually for impairment and assesses indications of impairment of property, plant and equipment and intangible assets as described above. The recoverable amounts of cash-generating units are determined using value in use calculations. Although management believes that the assumptions used are appropriate, the estimated recoverable amounts might differ materially from those realized in the future.
Consolidated financial statements

123
OUR YEAR SUSTAINABILITYCREATING VALUE GOVERNANCE FINANCIALS
Intangible assets
EUR million GoodwillTechnology-based
intangible assetsCustomer related intangible assets Other intangible assets
Advance payments and construction in progress Total
Acquisition cost Jan 1, 2020 29.8 39.1 14.1 32.9 0.4 116.3
Translation difference -1.3 0.0 -0.6 0.0 -1.9
Increases 0.2 0.1 0.4
Decreases -0.0 -0.9 -0.9
Transfers between items 0.1 -0.1 0.0
Acquisition cost Dec 31, 2020 28.5 39.1 14.1 31.7 0.4 113.8
Accumulated amortization and impairment Jan 1, 2020 6.7 6.3 30.5 43.6
Translation difference 0.0 -0.6 -0.6
Accumulated amortization of decreases and
transfers -0.0 -0.9 -0.9
Amortization for the financial year 5.3 1.9 0.9 8.1
Impairment for the financial year 0.0 0.0
Accumulated amortization and impairment Dec 31, 2020
12.1 8.2 30.0 50.2
Carrying amount Dec 31, 2020 28.5 27.0 5.9 1.7 0.4 63.6
Consolidated financial statements

124
OUR YEAR SUSTAINABILITYCREATING VALUE GOVERNANCE FINANCIALS
Intangible assets
EUR million GoodwillTechnology-based
intangible assetsCustomer related intangible assets Other intangible assets
Advance payments and construction in progress Total
Acquisition cost Jan 1, 2019 25.2 37.3 11.8 33.1 0.4 107.8
Translation difference 0.3 0.0 0.1 0.0 0.4
Increases 0.2 0.1 0.4
Business combinations 4.3 1.8 2.3 8.4
Decreases -0.0 -0.7 -0.7
Transfers between items 0.1 -0.1 0.0
Acquisition cost Dec 31, 2019 29.8 39.1 14.1 32.9 0.4 116.3
Accumulated amortization and impairment Jan 1, 2019 1.4 2.3 30.0 33.7
Translation difference 0.0 0.1 0.1
Accumulated amortization of decreases and
transfers -0.0 -0.7 -0.7
Amortization for the financial year 5.4 4.0 1.1 10.5
Impairment for the financial year 0.0 0.0
Accumulated amortization and impairment Dec 31, 2019
6.7 6.3 30.5 43.6
Carrying amount Dec 31, 2019 29.8 32.4 7.8 2.4 0.4 72.7
Impairment testingVaisala assesses the value of goodwill, intangible assets which have an idefinite useful lifetime, as well as incomplete intangible assets for impairment annually and whenever there is an indication that the unit may be impaired. The recoverable amount of the cash-generating unit is based on value in use calculations and cash flows are based on three year forecasts approved by Vaisala management. Vaisala’s total goodwill is allocated to the cash-generating unit formed by Weather and Environment Business Area.
In Weather and Environment Business Area cash-generating unit the recoverable amount exceeds the carrying amount by EUR 233 million. Weather and Environment Business Area sales are expected to grow in average 6% next three years. Terminal growth rate is 2% and Weighted Average Cost of Capital is 7.9%. Key assumptions in impairment testing are net sales, profitability and discount rate. Vaisala’s management has estimated it to be unlikely that any expected change in key assumptions would lead to carrying amount of the cash-generating unit exceeding the recoverable amount.
Consolidated financial statements

125
OUR YEAR SUSTAINABILITYCREATING VALUE GOVERNANCE FINANCIALS
Property, plant and equipment
EUR million Land and waters Buildings and structures Machinery and equipment Other tangible assetsAdvance payments and
construction in progress Total
Acquisition cost Jan 1, 2020 4.7 57.5 79.5 0.1 23.7 165.4
Translation difference -0.2 -0.5 -1.3 -0.5 -2.6
Increases 21.5 4.1 5.0 30.6
Decreases -0.8 -12.2 -13.1
Transfers between items 15.2 4.9 -20.2 -0.1
Acquisition cost Dec 31, 2020 4.5 92.9 74.9 0.1 8.0 180.4
Accumulated depreciation and impairment Jan 1, 2020 40.8 61.2 102.0
Translation difference -0.4 -1.2 -1.6
Accumulated depreciation of decreases and
transfers -0.8 -12.2 -13.0
Depreciation for the financial year 3.0 6.0 9.0
Impairment for the financial year 0.1 0.1 0.1
Accumulated depreciation and impairment Dec 31, 2020
42.5 53.9 96.4
Carrying amount Dec 31, 2020 4.5 50.4 21.0 0.1 8.0 83.9
On December 31, 2020, the carrying amount of machinery and equipment used in production was EUR 13.3 (11.9) million.
Consolidated financial statements

126
OUR YEAR SUSTAINABILITYCREATING VALUE GOVERNANCE FINANCIALS
Property, plant and equipment
EUR million Land and waters Buildings and structures Machinery and equipment Other tangible assetsAdvance payments and
construction in progress Total
Acquisition cost Jan 1, 2019 4.6 56.1 73.3 0.1 7.0 141.2
Translation difference 0.0 0.1 0.4 0.0 0.5
Increases 1.0 5.8 19.3 26.2
Decreases -0.0 -2.8 -2.8
Transfers between items 0.3 2.8 -2.7 0.4
Acquisition cost Dec 31, 2019 4.7 57.5 79.5 0.1 23.7 165.4
Accumulated depreciation and impairment Jan 1, 2019 38.1 56.8 94.9
Translation difference 0.1 0.3 0.4
Accumulated depreciation of decreases and
transfers 0.0 -2.2 -2.2
Depreciation for the financial year 2.5 6.0 8.6
Impairments for the financial year 0.0 0.4 0.4
Accumulated depreciation and impairment Dec 31, 2019
40.8 61.2 102.0
Carrying amount Dec 31, 2019 4.7 16.8 18.2 0.1 23.7 63.4
Consolidated financial statements

127
OUR YEAR SUSTAINABILITYCREATING VALUE GOVERNANCE FINANCIALS
Depreciation, amortization and impairment by function
EUR million 2020 2019
Procurement and production 3.8 4.0
Sales, marketing and administration 12.4 14.3
Research and development 1.1 1.2
Total 17.3 19.4
Depreciation, amortization and impairment by asset group 2020
EUR million Depreciation Impairment Total
Technology-based intangible assets 5.3 5.3
Customer related intangible assets 1.9 1.9
Other intangible assets 0.9 0.0 0.9
Buildings and structures 3.0 0.1 3.0
Machinery and equipment 6.0 0.1 6.1
Total 17.1 0.2 17.3
Depreciation, amortization and impairment by asset group 2019
EUR million Depreciation Impairment Total
Technology-based intangible assets 1.1 0.0 1.1
Customer related intangible assets 5.4 5.4
Other intangible assets 4.0 4.0
Buildings and structures 2.5 0.0 2.5
Machinery and equipment 6.0 0.4 6.4
Total 19.0 0.4 19.4
17. LEASESAccounting principles
Vaisala acts as a lessee and its lease contracts consist mainly of offices, other premises, land area, apartments and cars.
Majority of Vaisala’s lease contracts are fixed-term arrangements without one-sided extension or termination options and thus the lease term is defined based on the duration of the contract. If an arrangement includes extension, termination or purchase option management estimates the probable lease term for each arrangement based on an understanding of the business needs.
A contract may include both a lease component and other components (such as a service fee), for which the contract consideration is allocated on the basis of relative separate prices. Other components are excluded from IFRS 16 calculation, except for service fees for car leases, which are included in the lease component.
For leases, right-of-use asset and corresponding lease liability are recognized in the statement of financial position.
The cost of initial measurement of the right-of-use asset comprise the following items:
• the amount of the initial measurement of the lease liability;
• any lease payments made at or before the commencement date, less any lease incentives received (such as rent-free period);
• any initial direct costs incurred by the lessee; and
• the potential costs of restoring the underlying asset
Right-of-use assets are tested for impairment as described in Note 16, Intangible and tangible assets. Subsequently right-of-use asset is measured at cost less accumulated depreciation and impairment
losses, adjusted for any remeasurement of the lease liability. The lease liability is initially measured at the present value of the future lease payments discounted by
incremental borrowing rate. Incremental borrowing rate is the rate of interest that Vaisala would have to pay to borrow over a similar term, and with a similar security, the funds necessary to obtain an asset of a similar value to the right-of-use asset in a similar economic environment. Subsequently, in valuation of lease liability effective interest rate method is applied, according to which lease liability is recognized at amortized cost and interest expense is accrued over the lease term.
Consolidated financial statements

128
OUR YEAR SUSTAINABILITYCREATING VALUE GOVERNANCE FINANCIALS
Lease liabilities include the net fair value of the following items:
• fixed payments (including in-substance fixed payments), less any lease incentives receivable;• variable lease payments that depend on an index or a rate, initially measured using the index or rate as at
the commencement date;• amounts expected to be payable by the lessee under residual value guarantees;• the exercise price of a purchase option if the lessee is reasonably certain to exercise that option; and• payments of penalties for terminating the lease, if the lease term reflects the lessee exercising an option
to terminate the lease.
Leases based on extension options that are reasonably certain to be exercised are also included in the liability. Subsequently, the amount of lease liability is affected by, among other things, the interest accrued by the lease liability, the leases paid, the index increases in leases and the effects of changes in contract.
Depreciation and impairments of right-of-use assets, interest on lease liabilities and items arising from contractual changes are recognized in the consolidated statement of income.
Accounting principles requiring management judgment and the main uncertainty factors relating to estimatesThe application of IFRS 16 requires management to consider the duration of the lease term if there is an option for extension, termination or purchase. When evaluating the likelihood of the option being exercised and, therefore, the duration of the lease term, management takes into account all known facts and circumstances that create a financial incentive to exercise, or not to exercise, the option on a contractual basis.
Management’s estimates of the business needs and hence the likelihood of the exercise of various options are based on known short- and long-term strategies and action plans and on the possible reorganization plans and investment decisions based on them. When evaluating the likelihood of the exercise of options, the decision is also influenced by, among other things, the purpose of the use of the premises and the extent of the investments made.
Amounts recognized in the statement of financial position related to leases
Carrying amounts of right-of-use assets
EUR million 2020 2019
Land and waters 1.3 1.3
Buildings and structures 10.7 10.3
Machinery and equipment 0.6 0.7
Total 12.5 12.3
Additions to the right-of-use assets during the financial year 2020 were EUR 4.4 (4.0) million.
Interest-bearing lease liabilities
EUR million 2020 2019
Non-current 9,2 8,3
Current 2,7 3,0
Total 11,9 11,3
Maturity of lease liabilities is presented in note 21, Financial assets and liabilities. Future cash outflows from leases not yet commenced at the end of the financial year is presented in note 24, Contingent liabilities and pledges given.
Amounts recognized in the statement of income related to leases
Depreciation of right-of-use assets
EUR million 2020 2019
Buildings and structures 2.9 3.7
Machinery and equipment 0.4 0.5
Total 3.3 4.1
Write-downs of right-of-use assets
EUR million 2020 2019
Buildings and structures 0.5 -
Total 0.5 -
Other items recognized in the statement of income
EUR million 2020 2019
Interest expense on lease liabilities 0.4 0.3
The total cash outflow for leases in 2020 was EUR 3.7 (4.4) million.
Consolidated financial statements

129
OUR YEAR SUSTAINABILITYCREATING VALUE GOVERNANCE FINANCIALS
Capital structure18. SHAREHOLDERS’ EQUITY
Accounting principlesThe group’s equity consists of share capital, reserve fund, fund of invested non-restricted equity, translation differences and retained earnings.
Shares issued by the parent company are presented as share capital. Expenses related to the share issues or acquisition of own shares are presented as a reduction of equity. If the company acquires back its own shares, the consideration paid including direct costs is deducted from the equity.
The Board of Directors’ proposal for dividend distribution is not recognized in the financial statements. The dividends are recognized only after the Annual General Meetings’ approval.
Shares and share capitalOn April 24, 2019 Board of Directors of Vaisala Corporation decided to convert 27,264 series K share to series A shares. This conversion was registered into the Trade Register on May 27, 2019. On July 21, 2020 Vaisala Corporation’s Board of Directors decided to convert 20,306 K shares to series A shares. This conversion was registered into the Trade Register on July 31, 2020. After this Vaisala Corporation has 36,436,728 shares, of which 6,731,092 are series K shares and 29,705,636 series A shares. The shares do not have nominal value. The series K shares and A shares are differentiated by the fact that each series K share entitles its owner to twenty (20) votes at General Meeting of Shareholders while each series A share entitles its owner to one (1) vote. The shares have the same rights to dividend. Series K shares can be converted to series A shares according to specific rules stated in the Articles of Association.
On December 31, 2020 and 2019, the fully paid and registered share capital of Vaisala Corporation amounted to EUR 7,660,807.86.
Share capital and reserves
EUR millionNumber of
shares 1,000 Share capital Other reservesTreasury
shares Total
Dec 31, 2018 35,790 7.7 6.1 -9.0 4.8
Share-based payments 91 0.8 1.1 1.9
Transfers between items 0.0 0.0
Translation difference 0.0 0.0
Dec 31, 2019 35,881 7.7 7.0 -7.9 6.8
Share-based payments 119 -1.4 1.6 0.2
Transfers between items 0.0 0.0
Translation differences -0.0 0.0
Dec 31, 2020 36,000 7.7 5.6 -6.3 7.0
Own shares held by the company 437
Total 36,437
Other reservesOther reserves consist of reserve fund and invested non-restricted equity. Share-based payments are also recognized in other reserves. The reserve fund, EUR 0.5 (0.5) million, includes items based on local rules of subsidiaries. Eligibility of the reserve fund is subject to restrictions based on local regulations. Invested non-restricted equity includes funds transferred from the share premium fund. On December 31, 2020 the amount of other reserves totaled to EUR 0.1 (0.1) million.
Own sharesOwn shares (treasury shares) include the acquisition cost of own shares held by the group and are presented as a deduction from retained earnings.
Consolidated financial statements

130
OUR YEAR SUSTAINABILITYCREATING VALUE GOVERNANCE FINANCIALS
Number of shares
Purchase price EUR million
Treasury shares Dec 31, 2018 646,636 9.0
Distribution of treasury shares to key employees -90,647 -1.1
Treasury shares Dec 31, 2019 555,989 7.9
Distribution of treasury shares to key employees -118,950 -1.6
Treasury shares Dec 31, 2020 437,039 6.3
On December 31, 2020 the company held 437,039 (555,989) series A shares representing 1.2% (1.5) of the total number of shares and 0.3% (0.3) of the voting rights. The consideration paid for the shares held by the company was EUR 6.3 million.
Treasury shares can be used as consideration in possible acquisitions or in other business related arrangements, to finance investments, as part of the company’s incentive program, or be retained, conveyed, or cancelled by the company.
Translation differencesTranslation differences include the translation differences arising from the elimination of the acquisition cost of non-euro area group companies and from post-acquisition equity items, and the translation differences arising from translation of profit or loss for the period. The group has not hedged any equity denominated in foreign currency.
The result for the financial year is recognized in retained earnings.
DividendFor the financial year 2019 a dividend of EUR 0.61 per share was paid, totaling to EUR 22.0 million.
The Board of Directors proposes to the Annual General Meeting to be held on March 30, 2021 that a dividend of EUR 0.61 per share be paid for the financial year 2020, representing a total dividend of approximately EUR 22.0 million. The proposed dividend has not been recognized as a dividend liability in these financial statements.
19. FINANCIAL RISK MANAGEMENTVaisala is exposed to a number of financial risks in its operations of which key ones are currency risk, interest rate risk, refinancing and liquidity risks as well as financial counterparty risk and trade receivables credit risks. Vaisala’s objective is to limit the impact of these risks on statement of income, statement of financial position and cash flow statement. The management of financial risks is based on the treasury and credit policies approved by the Board of Directors.
Currency riskCurrency risk refers to the uncertainty in statement of income, statement of financial position and cash flow statement arising from exchange rate fluctuations. Vaisala’s business is global and is exposed to transaction and translation risks in multiple currencies. The transaction risk is related to the currency flows of sales and expenses. The translation risk arises from net investments in entities outside the euro area.
Vaisala’s sales are denominated in various currencies. In 2020, 46% of the group’s sales was in EUR, 32% in USD, 7% in CNY, 6% in JPY and 4% in GBP. Expenses and purchases occur mostly in EUR and USD. The group’s policy is to hedge foreign currency positions which consists of the order book, purchase commitments and net receivables. Vaisala does not hedge forecasted cash flows that are not in the order book. Vaisala does not apply hedge accounting in accordance with IFRS and changes in fair value are recognized in the statement of income.
Intercompany loans and deposits are mainly initiated in subsidiaries’ local currencies. Vaisala does not hedge intercompany loans, deposits or equities of subsidiaries. Translation of subsidiaries’ equities into euros caused translation difference of EUR -4.0 (0.5) million. The most significant translation risk exposures are in USD.
The IFRS 7 currency risk sensitivity analysis is based on the group companies’ foreign currency receivables, cash and cash equivalents and liabilities. The calculation does not include internal loans, order book or forecasted cash flows, but includes foreign exchange forwards in their nominal value. The effect of a 10% appreciation in all open net currency positions on Vaisala’s result after taxes and equity would have been EUR -0.1 (-0.5) million. Three largest foreign exchange net exposures in euro and their sensitivity analysis based on a 10% change (before taxes) are presented in the following table:
Foreign exchange net exposures against EUR
EUR million
2020 2019
Net position Sensitivity EUR million Net position Sensitivity
HRK -3.0 +/- 0.3 USD -7.9 +/- 0.8
USD -2.7 +/- 0.2 SEK -3.5 +/- 0.3
SEK -2.3 +/- 0.2 SGD -2.3 +/- 0.2
Interest rate riskInterest rate risk refers to the uncertainty in statement of income, statement of financial position and cash flow statement arising from interest rate changes. The group is exposed to cash flow interest rate risk, if it has floating rate liabilities. At the end of the financial year 2020 Vaisala’s interest-bearing liabilities and loans were at floating rates and totaled to EUR 57.0 (51.5) million. EUR 11.9 (11.3) million of interest-bearing liabilities and loans related to lease liabilities.
Consolidated financial statements

131
OUR YEAR SUSTAINABILITYCREATING VALUE GOVERNANCE FINANCIALS
Refinancing and liquidity risksRefinancing and liquidity risk refers to the uncertainty in the ability to maintain liquidity. In order to ensure liquidity, cash and cash equivalents and availability of credit facilities are maintained at a sufficient level.
Vaisala’s cash and cash equivalents amounted to EUR 45.4 (56.4) million.On May 25, 2020, Vaisala signed a EUR 40.0 million unsecured term loan agreement with one of its core
banks and on May 29, 2020, the loan was fully utilized. The loan matures in three years from the signing date and has a financial covenant (gearing), which is tested semi-annually. On December 31, 2020, Vaisala was in compliance with the covenant. This facility will be used for refinancing of existing indebtedness as well as for general corporate and working capital purposes. In addition, Vaisala has a EUR 50 million unsecured revolving credit facility which was signed on October 5, 2018. The committed credit facility agreement matures in 5 years from the signing and it has no financial covenants. On December 31, 2020, Vaisala had interest bearing liabilities totaling EUR 57.0 (51.5) million, of which EUR 5 (40) million related to utilized revolving credit facility, which matures within the next 12 months. Group has no loans that would mature after five years or more. In addition, Vaisala has a domestic commercial paper program amounting to EUR 150 million that was not utilized as of December 31, 2020.
Financial counterparty riskFinancial counterparty risk refers to the uncertainty about the counterparty’s ability to assume the obligations related to the financing. Vaisala is exposed to financial counterparty risk in respect of cash and cash equivalents and derivative financial instruments. Vaisala’s cash and cash equivalents amounted to EUR 45.4 (56.4) million and the nominal value of derivative financial instruments to EUR 31.4 (33.8) million. Vaisala deposits its assets and concludes derivative financial contracts with counterparties with good creditworthiness and approved by the Board of Directors. The creditworthiness of banks is constantly assessed.
Trade receivables credit riskTrade receivables credit risk means the customer-related uncertainty about the collectability of receivables. These trade receivables credit risks are managed by using letter of credit, advance payments and bank guarantees as payment terms. Additionally, trade receivables credit risk is managed by utilizing credit risk insurance and by monitoring customer liquidity. Management estimates that the group does not have significant credit risk concentrations because, due to its globally distributed customer base, no single customer or a group of customers constitutes a significant risk. During the financial year, credit losses and related reversals for trade receivables recognized in the statement of income amounted to EUR -0.3 (-0.2) million. Credit loss is recognized once it has been officially declared that the receivable will not be paid as a result of liquidation or bankruptcy.
20. NON-CURRENT RECEIVABLES
EUR million2020 carrying
amounts Fair values2019 carrying
amounts Fair values
Non-current rent deposits 0.7 0.7 0.9 0.9
Other non-current receivables 0.2 0.2 0.0 0.0
Total 0.9 0.9 0.9 0.9
21. FINANCIAL ASSETS AND LIABILITIES Accounting principles
Financial assets Financial assets are classified into following categories: at amortized cost and at fair value through profit and loss. Financial assets are measured on the basis of the entity’s business model for managing the financial assets and the contractual cash flow characteristics of the financial assets or by applying fair value option in connection with the original acquisition. All purchases and sales of financial assets are recognized on the clearance date.
Financial assets measured at amortized cost are held to maturity date within a business model to collect contractual cash flows and these cash flows consist solely of payments of principal and interest on the principal amount outstanding. Financial assets measured at amortized cost include mainly trade receivables, prepaid income, accrued income and other receivables.
In initial recognition of financial asset classified as at amortized cost, the asset is measured at fair value including transaction costs that are directly attributable to the acquisition. Due to their nature current trade receivables’ and other receivables’ carrying amount approximates to its fair value. Interest income related to these financial assets is measured with the effective interest rate method and is included in the financial income. Financial assets are derecognized from the statement of financial position when the contractual rights to the cash flows from the financial asset expire or the entity substantially transfers the risks and rewards outside the group. Profit or loss related to the derecognition of financial assets from the statement of financial position is recognized in the statement of income. Impairment losses are recognized in the statement of income.
Financial assets recognized at fair value through profit and loss are financial assets that are held for trading purposes such as derivative financial instruments for which Vaisala does not apply hedge accounting according to IFRS 9. Realized and unrealized gains and losses arising from changes in fair value are recognized in the statement of income in the period in which they arise. Financial assets held for trading as well as those maturing within 12 months are included in current assets.
Consolidated financial statements

132
OUR YEAR SUSTAINABILITYCREATING VALUE GOVERNANCE FINANCIALS
Impairment of financial assets Credit loss allowance for trade receivables and contract assets is measured applying simplified approach according to IFRS 9 as no significant financing component is included in those assets. Lifetime expected credit losses are determined based on the provision matrix, utilizing different credit risk across different receivable groups. The groupings are based on aging buckets, geographical regions, existence of collaterals and insolvency proceedings or other evidence of an increased credit risk of the receivables. Expected credit loss risks for different receivable groups are based on historical loss rates and management estimates. Changes in the credit loss allowance based on lifetime expected credit losses as well as final credit losses are recognized in the statement of income.
Cash and cash equivalents are recognized in the statement of financial position at original cost. Cash and cash equivalents consist of cash on bank accounts and bank deposits.
Financial liabilitiesFinancial liabilities are classified into following categories: at amortized cost and at fair value through profit and loss. Financial liabilities are initially measured at fair value based on the original consideration received. Transaction costs are included in the original carrying amount of the financial liabilities. Subsequently all financial liabilities, except for derivative financial instruments, are measured applying the effective interest method at amortized cost. Financial liabilities are included both in current and non-current liabilities and those may be both interest-bearing and non-interest-bearing. Liabilities maturing in less than 12 months are presented in current liabilities. Financial liabilities are derecognized from statement of financial position when the obligation specified in the contract is discharged, cancelled or expires.
Derivative financial instruments The group’s all derivative financial contracts are foreign exchange forward contracts. The group has sales in a number of foreign currencies, of which the most significant are the USD, CNY, JPY and GBP. All derivative financial contracts are classified at fair value through profit and loss and are initially measured at fair value on the closing date of the derivative financial contract. Derivative financial contracts are subsequently measured at fair value through profit and loss at the end of each reporting date. The fair value of a foreign exchange forward contract is measured at the present value of the future cash flows. Unrealized and realized gains and losses arising from changes in the fair value are recognized in the statement of income in financial income and expenses in the period in which they arise. Derivative financial contracts are included in the statement of financial position in other receivables and payables. The group does not apply hedge accounting under IFRS 9 to foreign exchange forward contracts.
The fair value of the derivative financial contracts is based on information that is observable for the asset or liability, either directly (i.e. as prices) or indirectly (i.e. derived from prices). In addition to the quoted prices, Vaisala prepares own assessment using commonly acceptable valuation techniques. Hence Vaisala’s derivative financial contracts belong to the level 2 in fair value hierarchy. There were no transfers between the hierarchy levels in 2019 or 2020.
The group has a number of investments in foreign subsidiaries whose net assets are exposed to currency risk. The group does not hedge the currency risk related to subsidiaries’ net assets.
Classification of financial assets and liabilities as of December 31, 2020
EUR million
Fair value through profit
and loss Amortized
cost
Carrying amount of statement
of financial position items Fair value Note
Financial assets
Non-current receivables 0.0 0.9 0.9 0.9 20
Trade receivables and other receivables 1.2 62.9 64.0 64.0 12
Cash and cash equivalents 45.4 45.4 45.4 23
Total 1.2 109.0 110.2 110.2
Financial liabilities
Interest-bearing non-current loans from financial institutions 40.0 40.0 40.0 21
Interest-bearing non-current lease liabilities 9.2 9.2 9.2 17
Other non-current liabilities 0.1 2.5 2.6 2.6 21
Interest-bearing current loans from financial institutions 5.0 5.0 5.0 21
Interest-bearing current lease liabilities 2.7 2.7 2.7 17
Interest-bearing current liabilities 0.2 0.2 0.2 21
Trade payables and other liabilities 0.1 52.2 52.3 52.3 14
Total 0.2 111.8 112.0 112.0
Consolidated financial statements

133
OUR YEAR SUSTAINABILITYCREATING VALUE GOVERNANCE FINANCIALS
Classification of financial assets and liabilities as of December 31, 2019
EUR million
Fair value through profit
and loss Amortized
cost
Carrying amount of statement
of financial position items Fair value Note
Financial assets
Non-current receivables 0.9 0.9 0.9 20
Trade receivables and other receivables 0.3 65.8 66.1 66.1 12
Cash and cash equivalents 56.4 56.4 56.4 23
Total 0.3 123.0 123.3 123.3
Financial liabilities
Interest-bearing non-current loans from financial institutions 8.3 8.3 8.3 17
Other non-current liabilities 4.0 4.0 4.0 21
Interest-bearing current loans from financial institutions 40.0 40.0 40.0 21
Interest-bearing current lease liabilities 3.0 3.0 3.0 17
Interest-bearing current liabilities 0.2 0.2 0.2 21
Trade payables and other liabilities 0.4 21.7 22.0 22.0 14
Total 0.4 77.2 77.6 77.6
On May 25, 2020, Vaisala signed a EUR 40.0 million unsecured term loan agreement with one of its core banks and on May 29, 2020, the loan was fully utilized. The loan matures in three years from the signing date and has a financial covenant (gearing), which is tested semi-annually. On December 31. 2020, Vaisala
was in compliance with the covenant. This facility will be used for refinancing of existing indebtedness as well as for general corporate and working capital purposes. In addition, Vaisala has a EUR 50 million unsecured revolving credit facility which was signed on October 5, 2018. The committed credit facility agreement matures in 5 years from the signing and it has no financial covenants. The facility will be used for working capital needs, for financing of acquisitions and for general corporate purposes.
On December 31, 2020, Vaisala had interest-bearing liabilities totaling EUR 57.0 (51.5) million, of which EUR 5 (40) million related to utilized revolving credit facility, which matures within the next 12 months. Vaisala has no loans that would mature after five years or more.
Maturity and interest rates of interest-bearing liabilities 2020
EUR million 2021 2022-2025 2026-2030 2031-2033 Interest rate
Loans from financial institutions 40.0 1.1%
Revolving credit facility 5.0 0.65%
Other interest-bearing loans 0.2 1.0%
Lease liabilities 3.0 5.9 2.7 2.2 0.5-8.69%
8.2 5.9 2.7 2.2
Maturity and interest rates of interest-bearing liabilities 2019
EUR million 2020 2021–2024 2025–2029 2030–2033 Interest rate
Revolving credit facility 40.0 0.65%
Other interest-bearing loans 0.2 1.0%
Lease liabilities 3.3 4.9 2.2 2.7 0.5-11.67%
43.5 4.9 2.2 2.2
Derivative financial contracts
EUR million 2020 2019
Nominal value of derivative financial contracts made to hedge against exchange rate risk
Foreign exchange forwards 31.4 33.8
Nominal value, total 31.4 33.8
Consolidated financial statements

134
OUR YEAR SUSTAINABILITYCREATING VALUE GOVERNANCE FINANCIALS
Nominal value of derivative financial contracts in currencies
2020 2019
Currency million EUR million Currency million EUR million
USD 19.0 16.5 23.5 20.7
CNH 40.0 5.0 19.0 2.4
GBP - - 1.3 1.5
HRK 22.5 3.0 - -
JPY 250.0 2.0 350.0 2.9
SEK 33.0 3.1 43.0 4.0
SGD 3.0 1.9 3.5 2.2
Total 31.4 33.8
Maturity of derivative financial contracts
EUR million 2020 2019
Less than 90 days 9.6 8.2
Over 90 days and less than 120 days 2.7 5.3
Over 120 days and less than 180 days 5.8 8.5
Over 180 days and less than 365 days 9.1 11.8
Over 365 days and less than 545 days 4.2 -
Total 31.4 33.8
Fair value of derivative financial contracts made to hedge against exchange rate risk
EUR million 2020 2019
Fair values of derivative financial contracts, assets 1.2 0.3
Fair values of derivative financial contracts, liabilities 0.2 0.4
22. INTEREST-BEARING LIABILITIES AND OTHER ADJUSTMENTS IN CASH FLOW STATEMENT
Reconciliation of movements of interest-bearing liabilities to cash flow arising from financing activities
EUR million Dec 31, 2019 Cash flow effectNon-cash changes Dec 31, 2020
Loans from financial institutions - 40.0 40.0
Credit facility 40.0 -35.0 5.0
Lease liabilities 11.3 -3.3 3.8 11.9
Other interest-bearing liabilities 0.2 0.2
Exchange rate differences 0.0 0.1
Total 51.5 1.8 3.8 57.1
Reconciliation of movements of interest-bearing liabilities to cash flow arising from financing activities
EUR million Dec 31, 2018 Jan 1, 2019Cash flow
effectNon-cash changes Dec 31, 2019
Loans from financial institutions 0.2 -0.2 -
Credit facility 40.0 0.0 40.0
Lease liabilities* - 10.8 -4.1 4.6 11.3
Other interest-bearing liabilities 0.2 -0.0 0.2
Exchange rate differences -0.3
Total 40.5 10.8 -4.6 4.6 51.5
* As a result of implementation of IFRS 16 Leases, lease liabilities were generated as of January 1, 2019.
Consolidated financial statements

135
OUR YEAR SUSTAINABILITYCREATING VALUE GOVERNANCE FINANCIALS
Specification of other adjustments in the cash flow from operating activities
EUR million 2020 2019
Change in bad debt provision -0.3 -0.2
Change in excess and obsolete provision in inventory -3.6 0.1
Change in provisions -1.3 0.0
Adjustment related to share-based incentive plans 0.2 1.9
Other adjustments -0.7 -0.1
Total -5.6 1.6
23. CASH AND CASH EQUIVALENTSAccounting principles related to cash and cash equivalents are presented in Note 21, Financial Assets and Liabilities.
Cash and cash equivalents
EUR million 2020 2019
Cash and cash equivalents 45.4 56.4
The fair values of cash and cash equivalents are equivalent to their carrying amounts.
24. CONTINGENT LIABILITIES AND PLEDGES GIVEN
Contingent liabilities and pledges given
EUR million 2020 2019
Bank guarantees issued for obligations 17.4 16.7
In the end of the financial year 2019, Vaisala was committed to lease contracts for which the lease term had not yet started. Payments related to those contracts were estimated to be EUR 1.8 million. In the end of the financial year 2020, Vaisala did not have such commitments.
Investment commitments Group had commitments related to Vantaa building project in total of EUR 0.3 million as of December 31, 2020. Group had commitments related to Vantaa and Louisville building projects in total of EUR 8.8 million as of December 31, 2019. In addition, Vaisala had other commitments related to intangible and tangible assets for EUR 4 (2) million.
Purchase commitments Group had purchase commitments totaling to EUR 12 (15) million. Additionally, group had commitments under the purchase agreements totaling a maximum of EUR 18 (18) million, if realized.
Consolidated financial statements

136
OUR YEAR SUSTAINABILITYCREATING VALUE GOVERNANCE FINANCIALS
Consolidation25. BUSINESS COMBINATIONS
Business combinations in 2020There were no business combinations during financial year 2020.
Business combinations in 2019On October 1, 2019 Vaisala acquired all the shares in Vaisala Digital Oy offering business-to-business weather services from Foreca Oy. Foreca’s professional business-to-business weather services strengthens the offering and development of the Vaisala Digital product line for highly weather-dependent customers by bringing new expertise to the team, as well as industry leading technology platform for forecasting, modeling and weather impact analysis. Vaisala Digital Oy serves weather-dependent professional customers in transportation, energy, and industry segments.
Vaisala Digital Oy was established on September 1, 2019 as a result of demerger of Foreca Oy. Therefore, no information on net sales for 2018 is available.
Net sales of the acquired company between October 1, 2019 and December 31, 2019 were EUR 0.4 million and operating result EUR 0.0 million. If the acquisition had occurred on January 1, 2019, management estimates consolidated net sales would have been EUR 406 million and operating result EUR 41 million for the financial year 2019.
The consideration transferred was EUR 7 million. Goodwill was recognized for EUR 3.8 million and allocated to Weather and Environment Business Area
cash-generating unit. Goodwill reflects the synergies which Vaisala expects to realize especially from the access gained to automotive market. Vaisala also expects to realize synergies from possibilities to develop new epoch-making solutions by combining Vaisala’s competencies together with acquired competencies and expertise.
Acquisition related costs were immaterial.
The amounts of the assets acquired and liabilities assumed recognized and the cash flow from the acquisition were as follows:
EUR thousand Fair value recognized
Goodwill 3,764
Technology-based intangible assets 1,807
Customer related intangible assets 2,253
Brand 24
Non-current receivables 2
Trade receivables and other receivables 250
Cash and cash equivalents 139
Total assets 8,238
Deferred tax liabilities 817
Current liabilities 421
Total liabilities 1,238
Net assets 7,000
Purchase price paid in cash -7,000
Cash and cash equivalents acquired 139
Total net cash outflow on acquisition -6,861
In the financial year 2020 no contingent consideration relating to prior acquisitions was paid. In the financial year 2019 the paid amount totaled to EUR 0.2 million. The remaining contingent consideration liability related to prior acquisitions was EUR 3.3 (4.0) million in the end of financial year 2020 and its range of the outcome was from EUR 1.6 to 3.5 (1.0 to 6.6) million. In the financial year 2020, reversal of contingent consideration liability amounting to EUR 1.8 (0.1) million was recognized as other operating income based on the financial performance after the acquisition and based on the estimated future financial performance.
Consolidated financial statements

137
OUR YEAR SUSTAINABILITYCREATING VALUE GOVERNANCE FINANCIALS
26. SUBSIDIARIES
Name Country
Group ownership %, Dec 31, 2020
Group ownership %, Dec 31, 2019
Vaisala Holding Oy Finland 100 100
Vaisala Limited United Kingdom 100 100
Vaisala Pty Ltd Australia 100 100
Vaisala GmbH Germany 100 100
Vaisala KK Japan 100 100
Vaisala Inc. United States 100 100
Vaisala China Ltd China 100 100
Vaisala Canada Inc Canada 100 100
Vaisala SAS France 100 100
Vaisala Sdn Bhd Malaysia 100 100
Vaisala Servicos De Marketing Ltda Brazil 100 100
3TIER R&D India Pvt Ltd India 100 100
Vaisala East Africa Limited Kenya 100 100
Vaisala Mexico Limited, S. de R.L. de C.V. Mexico 100 100
Leosphere SAS France 92.22 92.53
Upwind SAS France 100 100
SCI Septentrion France 100 100
K-Patents Inc. United States - 100
K-Patents (Shanghai) Co.,Ltd. China 100 100
Vaisala Shanghai Sensors Ltd China 100 100
Vaisala Digital Oy Finland - 100
On April 1, 2020 Vaisala Digital Oy was merged into Vaisala Corporation. On November 1, 2020 K-Patents Inc. was merged into Vaisala Inc.
On August 31, 2019 K-Patents Oy and Janesko Oy were merged into Vaisala Corporation. On October 1, 2019 Vaisala Corporation acquired all the shares in Vaisala Digital Oy.
27. ASSOCIATED COMPANYAccounting principles related to associated companies are presented in Consolidation principles.
The group has one associated company, SAS Meteorage. SAS Meteorage is a French company, which maintains lightning detection networks and sells information related to lightning strikes. Ownership in Meteorage supports Vaisala’s role in the global lightning detection community.
Company namePlace of incorporation and principal place of business Share of ownership Measurement method
SAS Meteorage France 35% Equity method
Summarized financial information of the associated company
EUR million 2020 2019
Non-current assets 3.3 2.3
Current assets 3.4 3.3
Liabilities 3.4 2.6
Net assets 3.2 3.0
Vaisala's share of net assets 1.1 1.1
Net sales 4.0 3.9
Result for the financial year 0.5 0.4
The information presented in the table is based on the latest available financial information.
Consolidated financial statements

138
OUR YEAR SUSTAINABILITYCREATING VALUE GOVERNANCE FINANCIALS
Carrying amount of investments in associated company
EUR million 2020 2019
Carrying amount at Jan 1 1.1 1.0
Share of result 0.2 0.1
Dividend received -0.1 -0.1
Exchange rate differences 0.0 0.0
Carrying amount at Dec 31 1.1 1.1
The carrying value of the associated company does not include goodwill.
Transactions with associated company and receivables and liabilities
EUR million 2020 2019
Sales 0.3 0.6
Receivables 0.1 0.1
Other notes28. RELATED PARTY TRANSACTIONSRelated parties of Vaisala group are the parent company, subsidiaries, associated company, members of Board of Directors and Vaisala Management Group. Related party transactions are based on market prices of goods and services and on common market terms. Only transactions that are not eliminated in the consolidated financial statements are disclosed as related party information.
The subsidiaries are presented in note 26, Subsidiaries and the associated company in note 27, Associated company. Transactions with the associated company as well as receivables and liabilities are presented in note 27, Associated company.
Kjell Forsén served as the President and CEO until September 30, 2020 and Kai Öistämö assumed the position on October 1, 2020.
Employee benefits of management
EUR thousand 2020 2019
Salary and bonuses of the President and CEO (payment basis)
Öistämö Kai (Oct 1 - Dec 31, 2020)
Salary 114 -
Short term incentives - -
Share-based payment - -
Statutory pension 17 -
Supplementary pension 29 -
Total 159 -
Forsén Kjell (Jan 1 - Sep 30, 2020)
Salary 394 515
Short term incentives 363 263
Share-based payment 1,221 514
Statutory pension 121 135
Supplementary pension 90 120
Total 2,189 1,547
Consolidated financial statements

139
OUR YEAR SUSTAINABILITYCREATING VALUE GOVERNANCE FINANCIALS
EUR thousand 2020 2019
Remuneration of the members of Vaisala Management Group (excl. the President and CEO) (payment basis)
Salaries 1,424 1,492
Short term incentives 805 478
Share-based payment 2,606 1,061
Statutory pension 351 342
Supplementary pension 245 242
Total 5,430 3,616
In addition Kjell Forsén’s compensation for October 1 – December 31, 2020 was EUR 143 thousand and EUR 30 thousand supplementary pension. In 2021 Kjell Forsén will be paid short term incentive for 2020 which is 35% of his annual salary and share-based payment for LTI 2018 of 27,700 shares gross, for LTI 2019-2021 of 23,040 shares gross and for LTI 2020-2022 5,529 shares gross.
The President and CEO Kai Öistämö is entitled to participate in a supplementary defined contribution pension plan with an annual fee corresponding to three month’s base salary. The President and CEO’s retirement age is 62 years. The notice period for both parties is six months. If the company terminates the agreement, there is an additional severance pay equaling six times the monthly salary.
Remuneration of the Board of Directors 2020 (payment basis)
EUR thousand Annual remunerationCompensation,
Audit Committee
Compensation, Remuneration and Human Resources
CommitteeCompensation,
Nomination Committee Total
Castrén Petri Member of the Board 35 6 1 42
Jääskeläinen Antti Member of the Board (since June 3, 2020) 35 3 38
Lundström Petra Member of the Board 35 6 41
Rinnevaara Jukka Member of the Board 35 3 5 10 53
Ståhlberg Kaarina Member of the Board 35 8 10 53
Syrjänen Tuomas Member of the Board 35 35
Torstila Pertti Member of the Board (until June 3, 2020) - -
Voipio Raimo Chairman of the Board 45 10 55
Voipio Ville Vice Chairman of the Board 35 6 6 10 57
Total 290 26 18 40 374
Consolidated financial statements

140
OUR YEAR SUSTAINABILITYCREATING VALUE GOVERNANCE FINANCIALS
Remuneration of the Board of Directors 2019 (payment basis)
EUR thousand Annual remunerationCompensation,
Audit Committee
Compensation, Remuneration and Human
Resources Committee Total
Castrén Petri Member of the Board 35 4 5 44
Lundström Petra Member of the Board 35 4 39
Niinivaara Mikko Member of the Board (until March 26, 2019) 1 1 2
Rinnevaara Jukka Member of the Board (since March 26, 2019) 35 2 37
Ståhlberg Kaarina Member of the Board 35 6 41
Syrjänen Tuomas Member of the Board (since March 26, 2019) 35 35
Torstila Pertti Member of the Board 35 35
Voipio Raimo Chairman of the Board 45 1 46
Voipio Ville Vice Chairman of the Board (since March 26, 2019) 35 3 4 42
Total 290 16 15 321
To the President and CEO and the members of the Board have not been granted loans nor have guarantees or commitments been given on their behalf.
Consolidated financial statements

141
OUR YEAR SUSTAINABILITYCREATING VALUE GOVERNANCE FINANCIALS
29. AUDITOR’S FEES
Authorized Public Accountants Deloitte
EUR million 2020 2019
Audit 0.4 0.4
Tax advice 0.0 0.0
Statements 0.0 0.0
Other fees 0.1 0.0
Total 0.5 0.5
Other audit companies
EUR million 2020 2019
Audit 0.0 0.1
Other fees 0.0 0.0
Total 0.0 0.1
Other work than audit services given by the principal auditor Deloitte Oy during the year 2020 were EUR 0.1 (0.1) million.
30. APPLICATION OF NEW AND REVISED STANDARDS AND INTERPRETATIONS IN ISSUE BUT NOT YET EFFECTIVEAt the date of authorization of these financial statements, the group has not applied the following new and revised IFRS Standards that have been issued but are not yet effective and in some cases had not yet been adopted by the EU (*). The management expects that the adoption of the standards will have no or not material impact on the financial statements of the group in future periods.
IFRS 17 Insurance Contracts * and Amendments to IFRS 4 – deferral of IFRS 9IFRS 17 establishes the principles for the recognition, measurement, presentation and disclosure of insurance contracts and supersedes IFRS 4 Insurance Contracts. In June 2020, the IASB issued Amendments to IFRS 17 that defer the date of initial application of IFRS 17 (incorporating the amendments) to annual reporting periods beginning on or after January 1, 2023. The application of the new standard in the future is not anticipated to have an impact on the group’s consolidated financial statements as the group does not hold any insurance contracts.
Amendments to IFRS 10 and IAS 28 Sale or Contribution of Assets between an Investor and its Associate or Joint VentureThe amendments to IFRS 10 and IAS 28 deal with situations where there is a sale or contribution of assets between an investor and its associate or joint venture. Specifically, the amendments state that gains or losses resulting from the loss of control of a subsidiary that does not contain a business in a transaction with an associate or a joint venture that is accounted for using the equity method, are recognized in the parent’s profit or loss only to the extent of the unrelated investors’ interests in that associate or joint venture. Similarly, gains and losses resulting from the remeasurement of investments retained in any former subsidiary (that has become an associate or a joint venture that is accounted for using the equity method) to fair value are recognized in the former parent’s profit or loss only to the extent of the unrelated investors’ interests in the new associate or joint venture.
The effective date of the amendments has yet to be set by the Board; however, earlier application of the amendments is permitted. The application of these amendments may have an impact on the group’s consolidated financial statements in future periods should such transactions arise.
Amendments to IAS 1 – Classification of Liabilities as Current or Non-current * The amendments to IAS 1 affect only the presentation of liabilities as current or non-current in the statement of financial position and not the amount or timing of recognition of any asset, liability, income or expenses, or the information disclosed about those items. The amendments clarify that the classification of liabilities as current or non-current is based on rights that are in existence at the end of the reporting period, specify that classification is unaffected by expectations about whether an entity will exercise its right to defer settlement of a liability, explain that rights are in existence if covenants are complied with at the end of the reporting period, and introduce a definition of ‘settlement’ to make clear that settlement refers to the transfer to the counterparty of cash, equity instruments, other assets or services.
The amendments are applied retrospectively for annual periods beginning on or after January 1, 2023, with early application permitted. The adoption of the amendment is not expected to have an impact on the consolidated financial statements in future periods.
Amendments to IFRS 3 – Reference to the Conceptual Framework *The amendments update IFRS 3 so that it refers to the 2018 Conceptual Framework instead of the 1989 Framework. They also add to IFRS 3 a requirement that, for obligations within the scope of IAS 37, an acquirer applies IAS 37 to determine whether at the acquisition date a present obligation exists as a result of past events. For a levy that would be within the scope of IFRIC 21 Levies, the acquirer applies IFRIC 21 to determine whether the obligating event that gives rise to a liability to pay the levy has occurred by the acquisition date. Finally, the amendments add an explicit statement that an acquirer does not recognize contingent assets acquired in a business combination.
Consolidated financial statements

142
OUR YEAR SUSTAINABILITYCREATING VALUE GOVERNANCE FINANCIALS
The amendments are effective for business combinations for which the date of acquisition is on or after the beginning of the first annual period beginning on or after January 1, 2022. Early application is permitted if an entity also applies all other updated references (published together with the updated Conceptual Framework) at the same time or earlier. The application of this amendment may have an impact on the group’s consolidated financial statements in future periods should such transactions arise.
Amendments to IAS 16 – Property, Plant and Equipment—Proceeds before Intended Use *The amendments prohibit deducting from the cost of an item of property, plant and equipment any proceeds from selling items produced before that asset is available for use, i.e. proceeds while bringing the asset to the location and condition necessary for it to be capable of operating in the manner intended by management. Consequently, an entity recognizes such sales proceeds and related costs in profit or loss. The entity measures the cost of those items in accordance with IAS 2 Inventories. The amendments also clarify the meaning of ‘testing whether an asset is functioning properly’. If not presented separately in the statement of comprehensive income, the financial statements shall disclose the amounts of proceeds and cost included in profit or loss that relate to items produced that are not an output of the entity’s ordinary activities, and which line item(s) in the statement of comprehensive income include(s) such proceeds and cost.
The amendments are applied retrospectively, but only to items of property, plant and equipment that are brought to the location and condition necessary for them to be capable of operating in the manner intended by management on or after the beginning of the earliest period presented in the financial statements in which the entity first applies the amendments. The entity shall recognize the cumulative effect of initially applying the amendments as an adjustment to the opening balance of retained earnings (or other component of equity, as appropriate) at the beginning of that earliest period presented. The amendments are effective for annual periods beginning on or after January 1, 2022, with early application permitted. The application of this amendment may have an impact on the group’s consolidated financial statements in future periods should such transactions arise.
Amendments to IAS 37 – Onerous Contracts—Cost of Fulfilling a Contract *The amendments specify that the ‘cost of fulfilling’ a contract comprises the ‘costs that relate directly to the contract’. Costs that relate directly to a contract consist of both the incremental costs of fulfilling that contract (examples would be direct labor or materials) and an allocation of other costs that relate directly to fulfilling contracts (an example would be the allocation of the depreciation charge for an item of property, plant and equipment used in fulfilling the contract). The amendments apply to contracts for which the entity has not yet fulfilled all its obligations at the beginning of the annual reporting period in which the entity first applies the amendments. Comparatives are not restated. Instead, the entity shall recognize the cumulative effect of initially applying the amendments as an adjustment to the opening balance of retained earnings or other component of equity, as appropriate, at the date of initial application.
The amendments are effective for annual periods beginning on or after January 1, 2022, with early application permitted. The application of these amendments may have an impact on the group’s consolidated financial statements in future periods should such transactions arise.
Annual Improvements to IFRS Standards 2018-2020 Cycle Amendments to IFRS 1, IFRS 9, IFRS 16 and IAS 41 *The Annual Improvements include amendments to four Standards:
• IFRS 9 Financial Instruments: The amendment clarifies that in applying the ‘10 per cent’ test to assess whether to derecognize a financial liability, an entity includes only fees paid or received between the entity (the borrower) and the lender, including fees paid or received by either the entity or the lender on the oth-er’s behalf. The amendment is applied prospectively to modifications and exchanges that occur on or after the date the entity first applies the amendment. The amendment is effective for annual periods beginning on or after January 1, 2022, with early application permitted. The application of this amendment may have an impact on the group’s consolidated financial statements in future periods should such transactions arise.
• IFRS 16 Leases: The amendment removes the illustration of the reimbursement of leasehold improvements. As the amendment to IFRS 16 only regards an illustrative example, no effective date is stated. The amend-ment does not have an impact on the consolidated financial statements in future periods.
• IFRS 1 First-time Adoption of International Financial Reporting Standards and IAS 41 Agriculture: The amendments are effective for annual periods beginning on or after January 1, 2022, with early application permitted. The amendments do not have an impact on the consolidated financial statements in future periods.
Amendments to IFRS 9, IAS 39, IFRS 7, IFRS 4 and IFRS 16 Interest Rate Benchmark Reform – Phase 2In September 2020, the IASB issued the second phase of the two-phase project on Interest Rate Benchmark Reform. The amendments enable entities to reflect the effects of transitioning from benchmark interest rates, such as interbank offer rates (IBORs) to alternative benchmark interest rates without giving rise to accounting impacts that would not provide useful information to users of financial statements. The amendments affect the following key areas: changes in the basis for determining the contractual cash flows as a result of benchmark interest rate reform, hedge accounting and disclosures.
The amendments are effective for annual periods beginning on or after January 1, 2021 with early application permitted. The amendments are applied retrospectively and include reinstatement of hedge relationship that were discontinued solely due to changes directly required by the reform. The application of these amendments may have an impact on the group’s consolidated financial statements in future periods should such transactions arise.
Consolidated financial statements

143
OUR YEAR SUSTAINABILITYCREATING VALUE GOVERNANCE FINANCIALS
Parent company income statement
EUR NoteJan 1 - Dec 31,
2020Jan 1 - Dec 31,
2019
Net sales 2 258,042,714.61 266,326,391.86
Cost of production and procurement 4, 5 -125,568,131.61 -128,260,380.19
Gross profit 132,474,663.00 138,066,011.67
Cost of sales and marketing 4, 5 -28,955,777.72 -29,477,713.41
Cost of administration
Research and development costs 4, 5 -42,801,165.38 -39,747,647.97
Other administrative costs 4, 5 -34,679,430.27 -32,397,308.76
Other operating income 3 2,111,678.44 397,981.41
Operating result 28,149,968.07 36,841,322.94
Financial income and expenses 6 518,595.19 1,658,532.38
Result before appropriations and taxes 28,668,563.26 38,499,855.32
Result before taxes 28,668,563.26 38,499,855.32
Direct taxes 7 -5,190,623.55 -7,614,504.46
Result for the financial year 23,477,939.71 30,885,350.86
* The parent company financial statements are prepared in accordance with the principles of Finnish Accounting Standards (FAS).
Parent company financial statements*

144
OUR YEAR SUSTAINABILITYCREATING VALUE GOVERNANCE FINANCIALS
Parent company balance sheetEUR Note Dec 31, 2020 Dec 31, 2019
Assets
Non-current assets
Intangible assets 8
Goodwill 72,756.55 -
Intangible rights 1,141,366.40 1,571,161.36
Other intangible assets 15,871,708.60 12,194,377.05
Advance payments and intangible assets in progress 321,193.74 268,587.21
Total intangible assets 17,407,025.29 14,034,125.62
Property, plant and equipment 8
Land and waters 2,904,868.22 2,904,868.22
Buildings 41,056,640.74 19,625,625.01
Machinery and equipment 16,519,872.93 14,282,026.94
Other tangible assets 74,417.51 74,417.51
Advance payments and construction in progress 7,320,714.03 16,816,177.51
Total property, plant and equipment 67,876,513.43 53,703,115.19
Investments 8
Holdings in group undertakings 74,217,965.75 81,329,965.75
Other shares and holdings 100,000.00 111,714.29
Total investments 74,317,965.75 81,441,680.04
Total non-current assets 159,601,504.47 149,178,920.85
EUR Note Dec 31, 2020 Dec 31, 2019
Current assets
Non-current receivables
Other receivables 83,286.67 38,970.93
Total long-term receivables 83,286.67 38,970.93
Inventories
Materials, consumables and finished goods 29,506,789.86 25,882,341.23
Total inventories 29,506,789.86 25,882,341.23
Current receivables
Trade receivables 17 39,211,970.89 38,783,327.95
Loan receivables 17 13,853,801.65 22,444,428.94
Other receivables 9, 17 3,172,581.17 3,008,205.05
Prepaid expenses and accrued income 10, 17 23,713,151.75 19,605,675.93
Total current receivables 79,951,505.46 83,841,637.87
Cash and cash equivalents 35,224,956.85 45,525,976.64
Total current assets 144,766,538.84 155,288,926.67
Total assets 304,368,043.31 304,467,847.52
Parent company financial statements

145
OUR YEAR SUSTAINABILITYCREATING VALUE GOVERNANCE FINANCIALS
Parent company balance sheetEUR Note Dec 31, 2020 Dec 31, 2019
Shareholders´ equity and liabilities
Shareholders´ equity 13
Share capital 7,660,807.86 7,660,807.86
Fund of invested non-restricted equity 422,034.34 422,034.34
Retained earnings 148,598,395.02 139,213,466.46
Result for the financial year 23,477,939.71 30,885,350.86
Total shareholders´ equity 180,159,176.93 178,181,659.52
Provisions 12 97,119.25 97,119.25
Liabilities
Non-current
Loans from financial institutions 15 40,000,000.00 -
Other non-current liabilities 14 1,789,283.31 3,659,468.77
Current
Advances received 1,350,808.01 2,509,216.85
Trade payables 17 12,334,971.34 15,291,117.22
Loans from financial institutions 15 5,000,000.00 40,000,000.00
Other current loans 17 16,840,917.35 10,904,795.08
Other current liabilities 17 3,865,264.19 4,060,266.18
Provisions 12 914,206.85 1,731,381.81
Accrued expenses and deferred income 16, 17 42,016,296.08 48,032,822.84
Current liabilities total 82,322,463.82 122,529,599.98
Total liabilities 124,208,866.38 126,286,188.00
Total shareholders´ equity and liabilities 304,368,043.31 304,467,847.52
Parent company financial statements

146
OUR YEAR SUSTAINABILITYCREATING VALUE GOVERNANCE FINANCIALS
Parent company cash flow statement
EUR thousand NoteJan 1 - Dec 31,
2020Jan 1 - Dec 31,
2019
Result for the financial period 23,478 30,885
Depreciation, amortization and impairment 5 10,231 7,765
Financial income and expenses 6 -519 -1,659
Gains and losses on sale of intangible assets and property,
plant and equipment 3 -8 -293
Income taxes 7 5,191 7,615
Other adjustments -3,145 1,137
Inventories, increase (-) / decrease (+) -1,217 -4,416
Non-interest bearing receivables, increase (-) / decrease (+) -2,562 -6,609
Non-interest bearing liabilities, increase (+) / decrease (-) -11,608 8,007
Changes in working capital -15,387 -3,018
Paid financial items, net 6 -1,035 785
Dividend received from business operations 6 2,967 1,658
Income taxes paid -6,947 -6,660
Cash flow from operating activities 14,825 38,215
Cash flow from investing activities
Investments in shares 8 -164 -7,772
Investments in intangible assets 8 -324 -540
Investments in property, plant and equipment 8 -20,091 -16,822
Divestments 8 8 300
Proceeds from sale of shares 8 122 -
Loans granted 17 - -2,165
Repayments on loan receivables 17 7,249 6,454
Cash flow from investing activities -13,200 -20,545
EUR thousand NoteJan 1 - Dec 31,
2020Jan 1 - Dec 31,
2019
Cash flow from financing activities
Proceeds from short-term borrowings 14 104,656 80,000
Repayment of short-term borrowings 14 -95,000 -85,965
Dividend paid 13 -21,959 -20,810
Cash flow from financing activities -12,303 -26,775
Change in cash and cash equivalents increase (+) / decrease (-) -10,678 -9,105
Cash and cash equivalents at Jan 1 45,526 52,083
Change in cash and cash equivalents increase (+) / decrease (-) -10,678 -9,105
Cash received in merger 377 2,548
Cash and cash equivalents at Dec 31 35,225 45,526
The reporting of cash flows from operating activities has been changed from the direct method to the indirect method as of January 1, 2020. The comparative information has been reported accordingly.
Parent company financial statements

147
OUR YEAR SUSTAINABILITYCREATING VALUE GOVERNANCE FINANCIALS
Notes to the parent company financial statements
1. ACCOUNTING PRINCIPLESThe financial statements of the parent company Vaisala Corporation have been prepared according to the Finnish Accounting Standards (FAS). Financial statement data are based on original acquisition costs or nominal value, less possible impairment, if not otherwise stated in the accounting principles outlined below.
Net sales and revenue recognition principlesThe parent company’s net sales consist of revenue recognized from contracts with customers. Net sales are divided into products, projects and services. Indirect taxes and discounts have been deducted from sales revenue. Exchange rate differences are recognized in the financial income and expenses.
Product net sales include revenue from products, spare parts and system deliveries. A system delivery contains a standard product delivery with limited amount of configuration. Revenue from the sale of product is recognized at a point in time when the control is transferred to the customer.
Projects are integrated projects, in which observation solutions, consisting of products, services and software, are delivered. Solutions are integrated to customer systems according to customer specifications. Revenue for all projects is recognized over time using percentage of completion method. Progress is measured by cost-to-cost method, comparing incurred costs and forecasted costs. Projects meet the over-time revenue recognition criteria, mainly by creating an asset without an alternative use and Vaisala having an enforceable right to payment for performance completed to date. The applied revenue recognition principles fulfill the Finnish Accounting Standard requirement related to the predictability of project margin.
Services are divided into service contracts and one-off service deliverables. Services may include maintenance, calibration and repair, modernization, extended warranties and data-based solutions supporting decisions in weather-dependent operations. Service contracts are continuous services including for example extended warranty, availability of customer support and availability of spare part delivery. Service contracts are recognized over time or at a point in time depending on the nature of the service and content of a contract. In case of one-off request services, the revenue is recognized at a point in time when the service has been rendered.
Standard warranty period for products is one year and 2, 5 or 10 years for selected products. Standard warranty period for services is 6 or 12 months. Extended warranty is a separately sold and priced service over a separately agreed period. Revenue for extended warranty is recognized over time starting at the time of standard warranty expiration. Provision for warranty costs is recognized in the balance sheet.
Other operating income and expensesOther operating income and expenses include income and expenses, which are not directly attributable to operational activities.
Other operating income consists mainly of gains on the disposal of assets as well as income other than revenue from contracts with customers, such as reversal of liabilities related to acquisitions and indemnities. Other operating expenses consist mainly of losses on disposal of assets.
Research and development expensesResearch and development expenses are booked as cost in the financial period in which they occur.
Share-based incentive plansParent company’s share-based payments are related to share-based incentive plans. Share-based payments are recognized as costs in the income statement and as accrued expenses in the balance sheet during the vesting period. The costs are based on an estimate of the amount of shares to be paid at the end of the vesting period. Assumptions, on which the estimates are based, are updated whenever changes occur and the effects of changes in assumptions are recognized in the statement of income. As of January 1, 2018, the cost of the share part of the share-based payments as well as the cash part of the share-based payments correspond to the value of share closing price on the grant date of the incentive plan.
PensionsThe parent company’s statutory pension insurance and voluntary pension plans are managed by external pension insurance companies. The pensions are all defined contribution plans and the contributions are expensed to the statement of income as incurred.
The additional pension coverage of parent company personnel was arranged by Vaisala Pension Fund that was closed on January 1, 1983. The pension fund liability was transferred to a pension insurance company on December 31, 2005 and the fund was dissolved in 2006. The pension liability of the fund is fully covered.
Income taxesTax expense includes taxes based on taxable profit for the financial year and tax adjustments for previous years. Current taxes are calculated on the taxable income on the basis of the tax rates enacted by the end of the financial year.
Non-current assetsNon-current assets consist of intangible assets, property, plant and equipment as well as investments. Carrying amounts of non-current assets are measured at cost less accumulated depreciation, amortization and impairment and plus revaluations. Depreciation and amortization according to plan is calculated on a straight-line basis over the expected useful lifetime of the asset. Land and investments are not depreciated. The cost of assets produced for own use includes also overhead costs attributable to the production work.
Parent company financial statements

148
OUR YEAR SUSTAINABILITYCREATING VALUE GOVERNANCE FINANCIALS
No interest is capitalized in non-current assets. Estimated useful lifetimes for assets are:Intangible rights 3–10 yearsBuildings and structures 5–40 yearsMachinery and equipment 3–8 yearsOther tangible assets 3–8 years
Other intangible assets include assets that have an indefinite useful lifetime and are not amortized. Additionally, merger losses have been allocated to other intangible assets and their useful lifetime is 5-6 years.
InventoriesInventories are stated at the lower of standard cost and net realizable value. Inventory cost includes the cost of purchase (including mainly purchase price, import duties and transport), direct labor and a proportion of production overhead. An allowance is recorded for excess inventory and obsolescence.
ProvisionsProvisions are future expenditure and losses arising from obligations, for which the company is committed and for which it is not certain or likely that revenue will be generated in the future and which are likely to occur. A change in the provision is recognized in the same item of the income statement in which the provision was originally recognized.
Provisions can relate to restructuring of operations, loss-making contracts, warranties, legal disputes and other commitments.
Derivative financial contractsVaisala applies in its accounting of financial instruments valuation according to Accounting Act 5.2§ and follows Accounting Board’s opinion December 13, 2016 (“KILA 1963/2016”) on valuation of derivative financial instruments in fair value. All parent company’s derivative financial contracts are foreign exchange forward contracts. The parent company has sales in a number of foreign currencies, of which the most significant are USD, CNY and JPY. All derivative financial contracts are initially measured at fair value on the closing date of the derivative financial contract. Derivative financial contracts are subsequently measured at fair value through profit and loss at the end of the financial year. The fair value of a foreign exchange forward contract is measured at the present value of the future cash flows. Unrealized and realized gains and losses arising from changes in the fair value are recognized in the income statement in financial income and expenses in the period in which they arise. Derivative financial contracts are included in the balance sheet in prepaid and accrued expenses. The parent company does not apply hedge accounting.
Foreign currency translationTransactions in foreign currencies are recorded using the exchange rate on the date of transaction. Receivables and payables in foreign currency have been valued at the rates quoted by European Central Bank on the last trading date of the financial year. Foreign exchange gains and losses arising from revaluation of cash and cash equivalents, trade and other receivables, loan receivables as well as trade and other payables are recognized as financial income and expense in the income statement.
2. NET SALESDisaggregation of revenue
Net sales by market area
EUR thousand 2020 2019
Americas 70,030 78,551
of which United States 49,345 55,444
APAC 80,236 82,637
EMEA 107,777 105,139
of which Finland 9,308 8,959
Total 258,043 266,326
Net sales by business area
EUR thousand 2020 2019
Weather and Environment
Products 56,621 64,142
Projects 37,077 48,446
Services 6,798 5,871
Total 100,497 118,459
Industrial Measurements
Products 34,185 27,387
Services 2,029 1,952
Total 36,213 29,340
Net sales from subsidiaries 121,333 118,527
Total 258,043 266,326
Parent company financial statements

149
OUR YEAR SUSTAINABILITYCREATING VALUE GOVERNANCE FINANCIALS
Net sales by timing of revenue recognition
EUR thousand 2020 2019
Revenue recognized at a point in time 94,130 94,440
Revenue recognized over time 42,579 53,359
Net sales from subsidiaries 121,333 118,527
Total 258,043 266,326
Net sales from subsidiaries are mainly recognized at a point in time.
Payment termsPayment terms vary based on geographical areas. In product and service business, the standard payment term is 30 days net, but in some areas prepayments are commonly used. Project invoicing is based on milestones and typically follows the general project delivery terms (where 30% is advance payment, 60% against delivery documents and 10% after site acceptance test) or terms as per contract. In project business the most common payment terms are letter of credit or as per contract.
Assets and liabilities related to net salesThe following table provides information about receivables and liabilities from contracts with customers included in the balance sheet.
Assets and liabilities related to net sales
EUR thousand Dec 31, 2020 Dec 31, 2019
Trade receivables 39,212 38,783
Accrued revenue 17,102 15,451
Advances received 1,351 2,509
Deferred revenue 12,436 14,762
Accrued revenue includes the balance of project and service revenue recognized but not yet invoiced. In general, most of project revenue is recognized after the product manufacturing as percentage of completion increases and most of the performance obligation is satisfied. According to general project delivery terms, majority of a project is invoiced before the delivery. Therefore, the amount of accrued revenue is typically at its highest between product manufacturing phase of the project and delivery of the product to the customer. For services, which are satisfied over time, the customer is mainly invoiced in advance and only in some cases in arrears after the customer has received or consumed the service. Arrears invoicing generates accrued revenue as the revenue is recognized before invoicing.
Advances received are customer payments related to contracts not yet invoiced.Deferred revenue includes the balance of projects, services and products invoiced but revenue not yet
recognized. Project-related contract liabilities often arise in the early stages of a project, when the prepayment
has been invoiced, but the project is only at an early stage and there is none or little revenue recognized under percentage of completion method. Services, which are recognized over time, are often invoiced in advance and therefore deferred revenue is generated in the beginning of the service period. For products and services, which are recognized at a point in time, deferred revenue is generated when customer has been invoiced, but performance obligation has not been satisfied and consequently revenue has not been recognized.
In the financial year 2020, the parent company recognized EUR 7 (9) million revenue that was included in the deferred revenue balance at the beginning of the period.
On December 31, 2020, the order book amounted to EUR 67.0 (68.4) million. Of the order book, EUR 46.3 (49.8) million is scheduled to be recognized as revenue in 2021 (2020) and EUR 20.7 (18.6) million is scheduled to be recognized later.
3. OTHER OPERATING INCOMEEUR thousand 2020 2019
Gains on disposal of assets 8 293
Other operating income
Reversal of consideration related to investments in shares 2,032 91
Indemnities and other 72 14
Total 2,112 398
4. PERSONNEL EXPENSES AND NUMBER OF PERSONNEL
Personnel expenses
EUR thousand 2020 2019
Wages and salaries 79,536 72,753
Pension costs 11,858 12,078
Other personnel costs 2,319 2,088
Total 93,712 86,919
Parent company financial statements

150
OUR YEAR SUSTAINABILITYCREATING VALUE GOVERNANCE FINANCIALS
Personnel average
Persons 2020 2019
In Finland 1,210 1,086
Outside Finland 8 7
Total 1,218 1,093
Personnel Dec 31
Persons 2020 2019
In Finland 1,242 1,135
Outside Finland 8 8
Total 1,250 1,143
Kjell Forsén served as the President and CEO until September 30, 2020 and Kai Öistämö assumed the position on October 1, 2020.
Salary and remunerations of the President and CEO (payment basis)
EUR thousand 2020 2019
Öistämö Kai (Oct 1 - Dec 31, 2020)
Salary 114 -
Short term incentives - -
Share-based payment - -
Statutory pension 17 -
Supplementary pension 29 -
Total 159 -
Forsén Kjell (Jan 1 - Sep 30, 2020)
Salary 394 515
Short term incentives 363 263
Share-based payment 1,221 514
Statutory pension 121 135
Supplementary pension 90 120
Total 2,189 1,547
In addition Kjell Forsén’s compensation for October 1 – December 31, 2020 was EUR 143 thousand and EUR 30 thousand supplementary pension. In 2021 Kjell Forsén will be paid short term incentive for 2020 which is 35% of his annual salary and share-based payment for LTI 2018 of 27,700 shares gross, for LTI 2019-2021 of 23,040 shares gross and for LTI 2020-2022 5,529 shares gross.
The President and CEO Kai Öistämö is entitled to participate in a supplementary defined contribution pension plan with an annual fee corresponding to three month’s base salary. The President and CEO’s retirement age is 62 years. The notice period for both parties is six months. If the company terminates the agreement, there is an additional severance pay equaling six times the monthly salary.
Remuneration of the Board of Directors 2020 (payment basis)
EUR thousandAnnual
remuneration
Compensation,
Remuneration
and Human
Resources
Committee
Compensation,
Nomination
Committee Total
Castrén Petri Member of the Board 35 6 1 42
Jääskeläinen Antti Member of the Board
(since June 3, 2020) 35 3 38
Lundström Petra Member of the Board 35 6 41
Rinnevaara Jukka Member of the Board 35 3 5 10 53
Ståhlberg Kaarina Member of the Board 35 8 10 53
Syrjänen Tuomas Member of the Board 35 35
Torstila Pertti Member of the Board
(until June 3, 2020) - -
Voipio RaimoChairman of the
Board 45 10 55
Voipio VilleVice Chairman of the
Board 35 6 6 10 57
Total 290 26 18 40 374
Parent company financial statements

151
OUR YEAR SUSTAINABILITYCREATING VALUE GOVERNANCE FINANCIALS
Remuneration of the Board of Directors 2019 (payment basis)
EUR thousandAnnual
remuneration
Compensation, Audit
Committee
Compensation, Remuneration
and Human Resources
Committee Total
Castrén Petri Member of the Board 35 4 5 44
Lundström Petra Member of the Board 35 4 39
Niinivaara Mikko Member of the Board
(until March 26, 2019) 1 1 2
Rinnevaara Jukka Member of the Board
(since March 26, 2019) 35 2 37
Ståhlberg Kaarina Member of the Board 35 6 41
Syrjänen Tuomas Member of the Board
(since March 26, 2019) 35 35
Torstila Pertti Member of the Board 35 35
Voipio RaimoChairman of the
Board 45 1 46
Voipio Ville
Vice Chairman of the
Board (since March
26, 2019) 35 3 4 42
Total 290 16 15 321
To the President and CEO and the members of the Board have not been granted loans nor have guarantees or commitments been given on their behalf.
5. DEPRECIATION, AMORTIZATION AND IMPAIRMENT
EUR thousand 2020 2019
Amortization of intangible assets 3,963 1,761
Depreciation of property, plant and equipment 6,246 5,919
Impairment of intangible and tangible assets 22 85
Total 10,231 7,765
In the financial year 2020 amortization of intangible assets included amortization EUR 3.3 (1.1 million) related to merger losses included in other intangible assets.
6. FINANCIAL INCOME AND EXPENSES
EUR thousand 2020 2019
Dividend income
From group companies 2,967 1,658
Other interest and financial income
From group companies 456 904
From others 2,443 1,498
Write-down of loan receivables - -89
Interest and other financial expenses
To group companies -62 -253
To others -2,010 -2,903
Foreign exchange gains and losses -3,276 843
Total 519 1,659
7. DIRECT TAXES
EUR thousand 2020 2019
Taxes from the financial year 5,277 7,700
Taxes from previous years -87 -86
Total 5,191 7,615
Parent company financial statements

152
OUR YEAR SUSTAINABILITYCREATING VALUE GOVERNANCE FINANCIALS
8. NON-CURRENT ASSETS AND OTHER LONG-TERM INVESTMENTS
Intangible assets 2020
EUR thousand GoodwillIntangible
rights
Other intangible
assets
Advance payments and
intangible assets in progress Total
Acquisition cost Jan 1, 2020 29,756 13,428 269 43,453
Increases 218 6,933 105 7,257
Transferred in merger 88 88
Decreases -619 -619
Transfers between items 50 -53 -3
Acquisition cost Dec 31, 2020 88 29,406 20,361 321 50,175
Accumulated amortization and write-downs Jan 1, 2020 28,185 1,234 29,419
Accumulated amortization of
decreases and transfers -619 -619
Amortization and write-downs for
the financial year 15 698 3,256 3,968
Accumulated amortization and write-downs Dec 31, 2020
15 28,264 4,490 32,769
Carrying value Dec 31, 2020 73 1,141 15,871 321 17,407
Intangible assets 2019
EUR thousandIntangible
rights
Other intangible
assets
Advance payments and
intangible assets in progress Total
Acquisition cost Jan 1, 2019 29,535 3,376 248 33,158
Increases 245 10,050 99 10,393
Transferred in merger 270 3 272
Decreases -390 -390
Transfers between items 97 -78 19
Acquisition cost Dec 31, 2019 29,756 13,428 269 43,453
Accumulated amortization and write-downs Jan 1, 2019 27,887 135 28,023
Accumulated amortization of
decreases and transfers -390 -390
Amortization and write-downs for
the financial year 688 1,099 1,787
Accumulated amortization and write-downs Dec 31, 2019
28,185 1,234 29,419
Carrying value Dec 31, 2019 1,571 12,194 269 14,034
Parent company financial statements

153
OUR YEAR SUSTAINABILITYCREATING VALUE GOVERNANCE FINANCIALS
Property, plant and equipment 2020
EUR thousand Land and waters BuildingsMachinery and
equipment Other tangible assetsAdvance payments and
construction in progress Total
Acquisition cost Jan 1, 2020 2,820 49,497 59,663 74 16,816 128,872
Increases 13,641 2,111 4,714 20,466
Decreases -8,320 -8,320
Transfers between items 9,867 4,312 -14,209 -30
Acquisition cost Dec 31, 2020 2,820 73,006 57,766 74 7,321 140,987
Accumulated depreciation and write-downs Jan 1, 2020 35,489 45,381 80,870
Accumulated depreciation of decreases and transfers -8,320 -8,320
Depreciation for the financial year 2,077 4,169 6,246
Write-downs 16 16
Accumulated depreciation and write-downs Dec 31, 2020 37,566 41,246 78,812
Revaluation 84 5,618 5,702
Carrying value Dec 31, 2020 2,905 41,057 16,520 74 7,321 67,877
Parent company financial statements

154
OUR YEAR SUSTAINABILITYCREATING VALUE GOVERNANCE FINANCIALS
Property, plant and equipment 2019
EUR thousand Land and waters BuildingsMachinery and
equipment Other tangible assetsAdvance payments and
construction in progress Total
Acquisition cost Jan 1, 2019 2,820 49,309 55,464 69 5,846 113,509
Increases 122 3,654 13,064 16,840
Transferred in merger 279 5 284
Decreases -0 -1,513 -1,513
Transfers between items 66 1,778 -2,093 -249
Acquisition cost Dec 31, 2019 2,820 49,497 59,663 74 16,816 128,871
Accumulated depreciation and write-downs Jan 1, 2019 33,517 42,881 76,398
Accumulated depreciation of decreases and transfers -0 -1,505 -1,506
Depreciation for the financial year 1,973 3,946 5,919
Write-downs 0 59 59
Accumulated depreciation and write-downs Dec 31, 2019 35,489 45,381 80,870
Revaluation 84 5,618 5,702
Carrying value Dec 31, 2019 2,905 19,626 14,282 74 16,816 53,704
On December 31, 2020, the carrying amount of machinery and equipment used in production was EUR 11.1 (9.4) million.
Parent company financial statements

155
OUR YEAR SUSTAINABILITYCREATING VALUE GOVERNANCE FINANCIALS
Investments 2020
EUR thousand Holdings in group
undertakingsOther shares and
holdings Total
Acquisition cost Jan 1, 2020 81,330 112 81,442
Decreases -7,112 -12 -7,124
Carrying value Dec 31, 2020 74,218 100 74,318
In the financial year 2020, the decreases relate to Vaisala Digital Oy’s merger into the parent company on April 1, 2020 and sale of Elisa Oyj’s shares.
Investments 2019
EUR thousand Holdings in group
undertakingsOther shares and
holdings Total
Acquisition cost Jan 1, 2019 89,333 100 89,433
Increases 7,112 7,112
Transferred in merger 125 12 137
Decreases -15,240 -15,240
Carrying value Dec 31, 2019 81,330 112 81,442
In the financial year 2019, additions include acquisition costs of the shares of Vaisala Digital Oy. The decrease relates to K-Patents Oy’s and Janesko Oy’s merger into the parent company on August 31, 2019.
9. OTHER RECEIVABLES
EUR thousand 2020 2019
Advances paid 188 554
Value added tax receivables 2,221 2,070
Other 763 385
Total 3,173 3,008
10. DEFERRED ASSETS
EUR thousand 2020 2019
Tax receivables 1,445 507
Deferred revenue 17,102 15,451
Derivative financial contracts 1,177 280
Deferred interests 89 159
Other deferred assets 3,900 3,208
Total 23,713 19,606
Derivative financial contracts
EUR million 2020 2019
Nominal value of derivative financial contracts made to hedge against exchange rate risk
Foreign exchange forward contracts 31.4 33.8
Nominal value, total 31.4 33.8
Nominal value ofderivative financial contracts in currencies
2020 2019
Currency million EUR million Currency million EUR million
USD 19.0 16.5 23.5 20.7
CNH 40.0 5.0 19.0 2.4
GBP - - 1.3 1.5
HRK 22.5 3.0 - -
JPY 250.0 2.0 350.0 2.9
SEK 33.0 3.1 43.0 4.0
SGD 3.0 1.9 3.5 2.2
Total 31.4 33.8
Parent company financial statements

156
OUR YEAR SUSTAINABILITYCREATING VALUE GOVERNANCE FINANCIALS
Maturity of derivative financial contracts
EUR million 2020 2019
Less than 90 days 9.6 8.2
Over 90 days and less than 120 days 2.7 5.3
Over 120 days and less than 180 days 5.8 8.5
Over 180 days and less than 365 days 9.1 11.8
Over 366 days and less than 545 days 4.2 -
Total 31.4 33.8
Fair value of derivative financial contracts made to hedge against exchange rate risk
EUR million 2020 2019
Fair values of derivative financial contracts, assets 1.2 0.3
Fair values of derivative financial contracts, liabilities 0.2 0.4
11. DEFERRED TAX ASSETS AND LIABILITIES
Deferred tax assets
EUR thousand 2020 2019
Deferred depreciation and amortization 26 258
Share-based payments 1,212 1,255
Provisions 202 324
Total 1,440 1,837
Deferred tax assets and liabilities have not been recognized in the parent company’s balance sheet. Deferred tax liabilities arising from revaluation have not been taken into account. If realized, the tax effect of revaluation would be EUR 1.1 million at the current tax rate of 20%. Other deferred tax liabilities were not material.
12. PROVISIONS
Non-current provisions
EUR thousand 2020 2019
Provisions Jan 1 97 97
Provisions Dec 31 97 97
Current provisions
EUR thousand 2020 2019
Provisions Jan 1 1,731 1,734
Increases 125 832
Decreases -942 -835
Provisions Dec 31 914 1,731
The provisions in the financial years 2020 and 2019 include warranty provision, loss-making project provisions and other contractual provisions.
13. SHAREHOLDERS’ EQUITYThe parent company’s shares are divided into series K shares and series A shares. On April 24, 2019 Board of Directors of Vaisala Corporation decided to convert 27,264 series K share to series A shares. This conversion was registered into the Trade Register on May 27, 2019. On July 21, 2020 Vaisala Corporation’s Board of Directors decided to convert 20,306 K shares to series A shares. This conversion was registered into the Trade Register on July 31, 2020. After this Vaisala Corporation has 36,436,728 shares, of which 6,731,092 are series K shares and 29,705,636 series A shares. The shares do not have nominal value. The series K shares and A shares are differentiated by the fact that each series K share entitles its owner to twenty (20) votes at General Meeting of Shareholders while each series A share entitles its owner to one (1) vote. The shares have the same rights to dividend. Series K shares can be converted to series A shares according to specific rules stated in the Articles of Association.
On December 31, 2020 and 2019, the fully paid and registered share capital of Vaisala Corporation amounted to EUR 7,660,807.86.
Parent company financial statements

157
OUR YEAR SUSTAINABILITYCREATING VALUE GOVERNANCE FINANCIALS
Shareholders’ equity
EUR thousand 2020 2019
Share capital Jan 1 7,661 7,661
Share capital Dec 31 7,661 7,661
Fund of invested non-restricted equity Jan 1 422 415
Gain on transfer of treasury shares - 7
Fund of invested non-restricted equity Dec 31 422 422
Retained earnings Jan 1 170,099 159,142
Dividend paid -21,960 -20,810
Distribution of treasury shares 1,598 1,082
Loss on transfer of treasury shares -1,139 -201
Retained earnings Dec 31 148,598 139,213
Result for the financial year 23,478 30,885
Total equity 180,159 178,182
Distributable funds
EUR thousand 2020 2019
Retained earnings 148,598 139,213
Result for the financial year 23,478 30,885
Fund of invested non-restricted equity 422 422
Total 172,498 170,521
For the financial year 2019 a dividend of EUR 0.61 per share was paid, a total of EUR 22.0 million.
14. NON-CURRENT LIABILITIESOn December 31, 2020, the parent company had non-current non-interest-bearing liabilities in total of EUR 1.8 (3,7) million, of which EUR 1.7 (3.7) million was considerations related to acquisition of subsidiaries, and they will mature in 2022. During the financial year 2020, non-current liabilities related to acquisition of subsidiaries EUR 2.0 (0.1) million were reversed and recognized in other operating income. At the end of the financial year, the parent company had no non-current liabilities that will mature after five years.
15. LOANS FROM FINANCIAL INSTITUTIONSOn May 25, 2020, Vaisala signed a EUR 40.0 million unsecured term loan agreement with one of its core banks and on May 29, 2020, the loan was fully utilized. The loan matures in three years from the signing date and has a financial covenant (gearing), which is tested semi-annually. On December 31, 2020, Vaisala was in compliance with the covenant. This facility will be used for refinancing of existing indebtedness as well as for general corporate and working capital purposes.
In addition, Vaisala has a EUR 50 million unsecured revolving credit facility which was signed on October 5, 2018. The committed credit facility agreement matures in 5 years from the signing and it has no financial covenants.
The facility will be used for working capital needs, for financing of acquisitions and for general corporate purposes. On December 31, 2020, the parent company had interest-bearing liabilities totaling EUR 45.2 (40.2) million, of which EUR 5 (40) million related to utilized revolving credit facility, which matures within the next 12 months. Vaisala has no loans that would mature after five years or more.
16. ACCRUED EXPENSES AND DEFERRED INCOME
EUR thousand 2020 2019
Personnel expense accruals 24,586 26,884
Deferred revenue 12,436 14,762
Derivative financial contracts 111 360
Direct tax accruals 39 838
Other accrued expenses and deferred income 4,844 5,189
Total 42,016 48,033
Notes related to derivative financial contracts are presented in the note to the financial statements 10, Deferred assets.
Parent company financial statements

158
OUR YEAR SUSTAINABILITYCREATING VALUE GOVERNANCE FINANCIALS
17. RECEIVABLES AND LIABILITIES FROM OTHER COMPANIES IN VAISALA GROUP
EUR thousand 2020 2019
Reveivables
Current loan receivables 13,854 22,445
Trade receivables 20,286 16,826
Other receivables 17 6
Prepaid expenses and accrued income 3,993 2,222
Total receivables 38,149 41,499
Liabilities
Current loans 16,675 10,702
Trade payables 704 1,163
Other liabilities 1 1
Accrued expenses and deferred income 5,372 3,568
Total liabilities 22,752 15,433
18. CONTINGENT LIABILITIES AND PLEDGES GIVEN
Contingent liabilities and pledges given
EUR thousand 2020 2019
For own debt or liability
Bank guarantees issued for obligations 16,934 16,285
For group companies
Guarantees 194 67
Leasing commitments
Payable during the following financial year 224 197
Payable later 133 97
Total leasing liabilities 357 294
Total contingent liabilities and pledges given 17,485 16,646
Investment commitments On December 31, 2020, the parent company had commitments related to Vantaa building project in total of EUR 0.3 (2.7) million. In addition, the parent company had other commitments related to intangible and tangible assets for EUR 4 (2) million. Purchase commitments On December 31, 2020, the parent company had purchase commitments totaling to EUR 8 (10) million.
19. AUDITOR’S FEES
EUR thousand 2020 2019
Audit 287 357
Statements 12 16
Tax advice 17 11
Other fees 72 39
Total 388 422
Parent company financial statements
159
OUR YEAR SUSTAINABILITYCREATING VALUE GOVERNANCE FINANCIALS
Signing of the Board of Directors’ report and financial statementsVantaa, February 18, 2021
Petri Castrén Antti Jääskeläinen Petra Lundström
Jukka Rinnevaara Kaarina Ståhlberg Tuomas Syrjänen
Raimo Voipio Ville Voipio Kai ÖistämöChairman of the Board Vice Chairman of the Board President and CEO

160
OUR YEAR SUSTAINABILITYCREATING VALUE GOVERNANCE FINANCIALS
Auditor’s report (Translation of the Finnish original)
To the Annual General Meeting of Vaisala Oyj
Report on the Audit of the Financial StatementsOpinionWe have audited the financial statements of Vaisala Oyj (business identity code 0124416-2) for the year ended December 31, 2020. The financial statements comprise the consolidated income statement, statement of comprehensive income, balance sheet, statement of cash flows, statement of changes in equity and notes, including a summary of significant accounting policies, as well as the parent company’s income statement, balance sheet, statement of cash flows and notes.
In our opinion• the consolidated financial statements give a true and fair view of the
group’s financial position, financial performance and cash flows in accordance with International Financial Reporting Standards (IFRS) as adopted by the EU.
• the financial statements give a true and fair view of the parent company’s financial performance and financial position in accordance with the laws and regulations governing the preparation of financial statements in Finland and comply with statutory requirements.
Our opinion is consistent with the additional report submitted to the Audit Committee.
Basis for OpinionWe conducted our audit in accordance with good auditing practice in Finland. Our responsibilities under good auditing practice are further described in the Auditor’s Responsibilities for the Audit of the Financial Statements section of our report.
We are independent of the parent company and of the group companies in accordance with the ethical requirements that are applicable in Finland and are relevant to our audit, and we have fulfilled our other ethical responsibilities in accordance with these requirements.
In our best knowledge and understanding, the non-audit services that we have provided to the parent company and group companies are in compliance with laws and regulations applicable in Finland regarding these services, and we have not provided any prohibited non-audit services referred to in Article 5(1) of regulation (EU) 537/2014. The non-audit services that we have provided have been disclosed in note 29 to the consolidated financial statements.
We believe that the audit evidence we have obtained is sufficient and appropriate to provide a basis for our opinion.
Key Audit MattersKey audit matters are those matters that, in our professional judgment, were of most significance in our audit of the financial statements of the current period. These matters were addressed in the context of our audit of the financial statements as a whole, and in forming our opinion thereon, and we do not provide a separate opinion on these matters.
We have also addressed the risk of management override of internal controls. This includes consideration of whether there was evidence of management bias that represented a risk of material misstatement due to fraud.

161
OUR YEAR SUSTAINABILITYCREATING VALUE GOVERNANCE FINANCIALSOUR YEAR SUSTAINABILITYCREATING VALUE GOVERNANCE FINANCIALS
Key audit matter How our audit addressed the key audit matter
Revenue recognition of product and project sales
Refer to Notes 1,2 and 3
• Vaisala group net sales EUR 379,5 million consists of product, service and project sales. Product and project sales account for EUR 326,6 7 million of the net sales.
• Revenue from the product sales is recognized at a point in time when the control is transferred to the customer. Large number of sales contracts and different nature of terms of contracts increase the risk of misstatement in timing of revenue recognition.
• Revenue for projects is recognized over time using percentage of completion method. Progress is measured by cost-to-cost method, comparing incurred costs and forecasted costs.
• Revenue recognition over time under IFRS 15 requires management estimate related to cost throughout the project delivery.
• This matter is a significant risk of material misstatement referred to in EU Regulation No 537/241, point (c) of Article 10(2).
Inventory valuation
Refer to Note 13
• Vaisala consolidated balance sheet includes inventory amounting to EUR 44.5 million. Inventory valuation is associated with the excess and obsolescence risk.
• As disclosed in the note 13 Vaisala has recognized write-offs and excess and obsolescence allowances for slow moving and obsolete inventory.
• Estimation and judgment are required in determining the value of the allowance for excess and obsolete inventory. Management analyses estimates of demand and determines allowance for excess and obsolete inventory.
• This matter is a significant risk of material misstatement referred to in EU Regulation No 537/241, point (c) of Article 10(2).
• Our audit procedures included an assessment of revenue recognition process and assessment of controls relating to timing of revenue recognition.
• We have reviewed Vaisala´s accounting manual and principles regarding different types of revenue contracts to evaluate, whether they are in line with IFRS 15 accounting principles.
• We have audited the accurate timing and the amount of revenue arising from the sales of products and from the projects.
• As a part of our audit procedures covering the revenue recognition principles of product sales, we have compared the sales transactions recorded in accounting to the related sales agreements and delivery documentation.
• Regarding to the projects we have compared the project calculations to the existing agreements and to the possible amendments to the agreements.
• We have reviewed the project estimates prepared and reviewed by the management as well as the realization of these estimates and assessed the level of completion based on the documentation received.
• We have evaluated the appropriateness of the presentation in the financial statements.
• Our audit procedures included an assessment of inventory process and assessment of controls relating inventory valuation.
• We have assessed the valuation principles used by the group and analyzed the slow moving inventory to be able to assure the accuracy of obsolesce provision accounting.
• We have audited inventory valuation by comparing the accounting values to the acquisition and manufacturing costs as well as to the net realizable values to evaluate that value of inventory do not exceed the lower of the acquisition and manufacturing costs or net realizable value.
• We have assessed management judgements and estimates regarding the future life cycle and demand of products.
• We have evaluated the appropriateness of the presentation in the financial statements.
Auditor’s report

162
OUR YEAR SUSTAINABILITYCREATING VALUE GOVERNANCE FINANCIALSOUR YEAR SUSTAINABILITYCREATING VALUE GOVERNANCE FINANCIALS
Responsibilities of the Board of Directors and Chief Executive Officer for the Financial StatementsThe Board of Directors and Chief Executive Officer are responsible for the preparation of consolidated financial statements that give a true and fair view in accordance with International Financial Reporting Standards (IFRS) as adopted by the EU, and of financial statements that give a true and fair view in accordance with the laws and regulations governing the preparation of financial statements in Finland and comply with statutory requirements. The Board of Directors and Chief Executive Officer are also responsible for such internal control as they determine is necessary to enable the preparation of financial statements that are free from material misstatement, whether due to fraud or error.
In preparing the financial statements, the Board of Directors and President and CEO are responsible for assessing the parent company’s and the group’s ability to continue as going concern, disclosing, as applicable, matters relating to going concern and using the going concern basis of accounting. The financial statements are prepared using the going concern basis of accounting unless there is an intention to liquidate the parent company or the group or cease operations, or there is no realistic alternative but to do so.
Auditor’s Responsibilities for the Audit of Financial StatementsOur objectives are to obtain reasonable assurance on whether the financial statements as a whole are free from material misstatement, whether due to fraud or error, and to issue an auditor’s report that includes our opinion. Reasonable assurance is a high level of assurance, but is not a guarantee that an audit conducted in accordance with good auditing practice will always detect a material misstatement when it exists. Misstatements can arise from fraud or error and are considered material if, individually or in aggregate, they could
reasonably be expected to influence the economic decisions of users taken on the basis of the financial statements.
As part of an audit in accordance with good auditing practice, we exercise professional judgment and maintain professional skepticism throughout the audit. We also: • Identify and assess the risks of material misstatement of the financial
statements, whether due to fraud or error, design and perform audit procedures responsive to those risks, and obtain audit evidence that is sufficient and appropriate to provide a basis for our opinion. The risk of not detecting a material misstatement resulting from fraud is higher than for one resulting from error, as fraud may involve collusion, forgery, intentional omissions, misrepresentations, or the override of internal control.
• Obtain an understanding of internal control relevant to the audit in order to design audit procedures that are appropriate in the circumstances, but not for the purpose of expressing an opinion on the effectiveness of the parent company’s or the group’s internal control.
• Evaluate the appropriateness of accounting policies used and the reasonableness of accounting estimates and related disclosures made by management.
• Conclude on the appropriateness of the Board of Directors’ and Chief Executive Officer’s use of the going concern basis of accounting and based on the audit evidence obtained, whether a material uncertainty exists related to events or conditions that may cast significant doubt on the parent company’s or the group’s ability to continue as a going concern. If we conclude that a material uncertainty exists, we are required to draw attention in our auditor’s report to the related disclosures in the financial statements or, if such disclosures are inadequate, to modify our opinion. Our conclusions are based on the audit evidence obtained up to the date of our auditor’s report. However, future events or conditions may cause the parent company or the group to cease to continue as a going
concern. • Evaluate the overall presentation, structure and content of the
financial statements, including the disclosures, and whether the financial statements represent the underlying transactions and events so that the financial statements give a true and fair view.
• Obtain sufficient appropriate audit evidence regarding the financial information of the entities or business activities within the group to express an opinion on the consolidated financial statements. We are responsible for the direction, supervision and performance of the group audit. We remain solely responsible for our audit opinion.
We communicate with those charged with governance regarding, among other matters, the planned scope and timing of the audit and significant audit findings, including any significant deficiencies in internal control that we identify during our audit.
We also provide those charged with governance with a statement that we have complied with relevant ethical requirements regarding independence, and communicate with them all relationships and other matters that may reasonably be thought to bear on our independence, and where applicable, related safeguards.
From the matters communicated with those charged with governance, we determine those matters that were of most significance in the audit of the financial statements of the current period and are therefore the key audit matters. We describe these matters in our auditor’s report unless law or regulation precludes public disclosure about the matter or when, in extremely rare circumstances, we determine that a matter should not be communicated in our report because the adverse consequences of doing so would reasonably be expected to outweigh the public interest benefits of such communication.
Auditor’s report

163
OUR YEAR SUSTAINABILITYCREATING VALUE GOVERNANCE FINANCIALSOUR YEAR SUSTAINABILITYCREATING VALUE GOVERNANCE FINANCIALS
Other Reporting RequirementsInformation on our audit engagementWe were first appointed as auditors by the Annual General Meeting on March 26, 2014 and our appointment represents a total period of uninterrupted engagement of 7 years.
Other InformationThe Board of Directors and President and CEO are responsible for the other information. The other information comprises the Board of Directors’ Report and the information included in the Annual Report, but does not include the financial statements and our auditor’s report thereon.
Our opinion on the financial statements does not cover the other information.
In connection with our audit of the financial statements, our responsibility is to read the other information and, in doing so, consider whether the other information is materially inconsistent with the financial statements or our knowledge obtained in the audit, or otherwise appears to be materially misstated. With respect to the Board of Directors’ Report, our responsibility also includes considering whether the Board of Directors’ Report has been prepared in accordance with the applicable laws and regulations.
In our opinion, the information in the Board of Directors’ Report is consistent with the information in the financial statements and the Board of Directors’ Report has been prepared in accordance with the applicable laws and regulations.
If, based on the work we have performed we conclude that there is a material misstatement of the other information, we are required to report that fact. We have nothing to report in this regard.
Other opinionsWe support that the financial statements should be adopted. The proposal by the Board of Directors regarding the treatment of distributable funds is in compliance with the Limited Liability Companies Act. We support that the Board of Directors of the parent company and the President and CEO should be discharged from liability for the financial period audited by us.
Vantaa, February 18, 2021
Deloitte OyAudit Firm
Reeta Virolainen Authorised Public Accountant (KHT)
Auditor’s report

164
OUR YEAR SUSTAINABILITYCREATING VALUE GOVERNANCE FINANCIALS
ContactsKaarina MuurinenChief Financial [email protected]
Paula LiimattaBusiness Controller and Head of Investor Relations [email protected]
Nina EklundDirector, Corporate Communications and [email protected]
Marjo HietapuroSustainability Manager [email protected]
Vaisala CorporationP.O. Box 26FI–00421 Helsinki, Finland
vaisala.com
Follow us

vaisala.com
Vaisala Corporation P.O. Box 26
FI-00421 Helsinki, FinlandB211913EN