observation of f-layer and sporadic-e scatter at vhf in ... · journal of research of the national...
TRANSCRIPT

JOURNAL OF RESEARCH of the National Bureau of Standards-D. Radio Propaga tion, Vol. 65D, No.1, January- February 1961
Observation of F -Layer and Sporadic-E Scatter at VHF in the Far East 1
K. Miya , T. Sasaki, and M. Ishikawa
(April 26, 1960)
This p aper describes propert ies of sporad ic-E scatter and F-layer scaLtcr observed ove r t he Okinawa-to-Tokyo path ( 1480 kilometers) and the Philippines-to-To kyo path (2850 kilomet ers) operating at frequ encies of about 50 megacy cles per second.
Spora dic-E scatter is often obser ved on t he Okin awa signal in t he e \'cn ing homs and has t he closest correlation (0.94 in correlation ratio) wi t h the occurrence of sporadic E chara cterized by the descriptive symbol " M" of a ll ionospheric factors. Beari ng of t he Es sca tter shows a regular diurn al va riation simila r to t hat of t he normal E -layer scatter.
F-layer scatter ge nerally appears on t he Philippine signal in aut umn when t he F -IavC' l' at t he path midpoint displays an a nom aly denoted by t he symbol " R " o r "8" having a top frequency of higher t han J4 megacycles pel' second. A pulse test ex hibited a patLel'll of m ultipat ll s ignals extending over more t ha n 1 mill isecond . Bearing of t llC P-layer scatter an even ing phenomenon, gradua lly deviates \yestwards from the great-circle path \y it h th~ lapse of t ime.
1. Introduction
Great progress ba been made in the study of tran mission by way of inhomogenities in the iono-phere, commonly termed scatterin g in th e E-layer.
In addi tion , F-Iayer scatter in the Far East ha s been pointed out by R. Ba teman and others [1] 2 and a peculiar signal enhan cemen t has been repor ted recen tly by the authors [2] as a kind of scatter associated closely with poradie E. Con tinuous measuremen ts of signal strength, bearing, and angle of elevation at about 50 NIc/s have been carried ou t in Tokyo on Okina\'la and Philippine signals tran smitted until the end of October 1959 as th e continuation of a part of the United tates progTam for the IGY.
The orientations of bo th paths were almost from southwest to northeast . The tran smiLting a,ntenna used at Olwma was beamed to 35°13' E of N deviating northwards by 8.5° off the great-circl e patb to Tokyo. Surface path length between Okuma and Tokyo is 14 0 km, and Poro and Tokyo is 2850 km .
Aside from characteristics of Es propagation whi ch will be reported as nn interes t in th e field of communications engineering, the following will mainly describe the types of scatter men tion ed above.
2 . Scope of 0 bserva hon
2 .1. Signals Measured and Exp e rimental C ircuits
An outline of the experimental circuits is shown in figure 1. Continuous waves of 2-kw output were emitted towards the middle part of Japan at 49 ,68 Mc/s from Okuma, Okinawa, and at 49.84 :Mc/s from Poro , the Philippines. Each of the tran smitting antennas was a horizontal 5-element Yagi, having a gain of 7 db relative to a dipole , a height of 12 In above the ground, and a half-power beamwidth of 54°. The measurements were conducted at Fuk:uoka receiving station , near Tokyo , from October 1958 through October 1959. Pulse signals, from Poro, were observed in autumn 1959.
o one-bop E propag tion may exist over the former circuit and two-hop Es or one-hop F2 propagation over the lat ter .
The Yamagawa and Okinawa ionospher e station are located 330 km and 160 lun from the path midpoints, respectively, as seen in figure 1.
THE PACIFIC OCEAN
N
I 1 Contribution from Kokusai DCllSh ill Denwa Co. , To kyo, Japan. FIGURE 1. J1!Jap of the Far East, showing the forward scatter 2 F igures in brackets indica te the li terature references at the end of this paper. paths and the ionosphere stations.
93
/

2.2. Method of Observation
Three 5-element Yagis A, B, and 0 of same construction as the transmitting antenna were used for the measurements. Yagis A and B were mounted 30.6 m high on two iron poles separated by 105 m, directivities being shifted by 20 0 westwards and southwards from the true b earing of Okuma respect ively. Yagi 0 was mounted at a height of 12.6 m , being beamed to the same direction as Yagi A. Bearing and angle of elevation were obtained from the ratios of vol tages induced on Yagis A and B and on Yagis A and 0, respectively.
The ratio of voltages was continuously recorded using two sets of voltage ratio meters [2] which are capable of measuring angles of arrival accurately even on a low level of the signal strength. Tbe output voltage of the meter was 10g9.rithmically compressed and indicated by a pen recorded as opencir'cuit voltage measured at 75 n impedance in decibels above 1 !lV.
£ (':~fffiL 1 I 1 I I I II-I-i-I-Hl ~:;rrl I I lltrr I-II I I I c
.2 J I I I I I I I I I I I I I!!ltlrllx II IIll f ll iIIII I
3'1 : 1 1 1 I li e I 1 I 1 30
0
J--... o -10 C
J Ol 'Ui
- 20 o
Jan., 19591
6
b 100/,
~ ~ ~ 500/. ~ r-:::. 1
9CI%
.0
" 40 §
:;:: 50 g
2 60 0
u 70 ";;':
'" .r: 80 ~
o C
90 sa 10 12 14 J& 18 20 22 24
J.S . T.
FIGURE 2. Diw'nal curves of signal strength, angles of arrival.
3 . 0 bserva tional Results Okuma-'l'okyo, 49.68 Me/s, Jan uary 1959.
3 .1. Okuma-to-Tokyo Transmission
Figures 2 and 3 show typical results observed on the Okuma signal in winter and summer months, respectively. Figure 4 exhibits an example of appearance of the pen records during a period including all types of scatter.
In winter, the signal received is mainly the normal E-Iayer scatter including meteoric bursts throughout the day. Attenuation of the scatter in the ionosphere is estimated to be betwevn 72 and 82 db in the median value, showing the maximum at about 1800 J .s. t. and the minimum around midday.
As seen in figure 4, the signal strength sometimes rises to a maximum of 30 db above the level of the normal value, late in the evening. This phenomenon will be referred to as Es scatter and its characteristics will be discussed later.
Hourly median angles of arrival are indicated by dots, and ranges between upper and lower quartiles are shown by lengthwise lines in figures 2 and 3. Bearing data explicitly show a diurnal variation which deviates westwards off t he true bearing during the period of 1800 to 1000 J .s.t. and slightly southwards early in the afternoon. Seasonal and diurnal distributions of hourly median bearings are exhibited in figure 5 representing contours of equal bearings. The figure shows a feature of regular diurnal variation with a tendency of deviating westwards a few degrees off the true bearing on the average throughout a year. The fact that the main lobe of t he transmitting antenna IS beamed northwards off the greatcircle path may be one of the causes of the average deviation of bearing. However, attention must be drawn to the fact that the diurnal variation including the average deviation is quite similar to W. R. Vincent and others' results of best antenna angle for meteoric bursts [3]. The seasonal variation of bearing showed a complicated but periodic behavior.
94
.0
" .r:" 2 0
cr. ~ 10
Vi o
o c .Ql - I (fl
-2
0
0
June, 1959 I
\ f\ I" / ~
~
o 4 6
/ II j \ /
r----' \ ~ l"-r---i'---V
8 10 12 14 16
J .S.T.
biz II 1\ 5d%.1
J I~
.0 4 0 "
§ 50~
::J C
602 +o
70. 2
sot <J) o
22 2490 '§ I 18 20
FIGURE 3. Diurnal cW'ves of signal strength, angles of arrival. Okum a-'rokyo, 49.68 Me/s, June 1959.
No noticeabJ e variation of angl e of incidence was observed in the m edian value. The minimum, however, was clearly observed during a period of 1100 to 1200 J .s.t. during all the months except summer, when the normal E -Iayer scatter was mainly received.
In summer when Es reflections are most common, and produce an increase of many times the normal signal level, hourly values of angles of arrival are distributed in a wider range than those observed in winter as seen in figures 2 and 3.
The range of quartiles of signal strength, b earing, and angle of elevation shows the minimum excursion at about 0600 J .s. t. early in the morning.

30
W
~ 20
!l ~ 10 .-~ 229.5 .g ~ 10 ill
20 5
- 30
~
I c
0
~ " '0 ~
g
'"
J.5,T,
FIGURE ±. A typical record of angles of al'l"ival and signal st1'ength observed on J anumy 12, 1959.
FIfl U R E 5. Contow's of equal bearing. Okuma·T okyo, 49.68 Me/s, October 1958-0etobcr 1950.
3 .2 . Poro-to-Tokyo Transmission
The signal from Poro was r eceived only a small part of the timc, except in summer and au tumn. Judging from the characteristic appearance of sporadic E , most of the signals r eceived in summer ar e
95
infelTed to be two-hop propagation by way of the Es specular reflection. Most hourly median bearings observed in SUmlllCl' were nearly the true b earing. Hourly median angles of elevation were betwee n 3.50
and 3.90 and they showed lower values in the daytime. These angles observed are sligh tly lower than the calculated by esti mating heigh t of sporadic E to be 90 km.
On the other ha nd, it is obvious that the sign al received in au tumn was propagated via the F-region. Behavior of this signal will be desnibed in the later chapter.
4 . Sporadic-E Scatter
4 .1. General
As rnentioned above, a remarkable signal enhancement is nightly observed on Okuma signal, sometimes attaining a level 30 db higher than that of the normal E-layer scatter. The authors called the event "Es evening enhancement" [2], because it is closely associated with sporadic E and i t is likely to occur late in the evening. The enhancement appears to represent sporadic E scatter because of the following features. The Es scatter does not undergo as rapid a change in signal strength as sporadic E propagation and shows a gradual variation over an hour to several hours .
/

vVhen this takes place, variations of bearing and angle of elevation are always observed. These variations are quite different from that of Es propagation as shown in figure 4. The Es scatter closely correlates with some type of sporadic E at the path midpoint rather than the magnitude of the foEs itself. The relationship is now explored.
4.2. Rate of Occurrence
Judging from a statistical study of foEs and attenuation in the ionosphere, r , the signal of r ~45 db is assumed to be reflected by sporadic E and the signal of r > 70 db as the normal E-Iayer scatter. An analysis was made of the signal of 45 db < r ~ 70 db, the range in which most of the Es scatter is included.
Seasonal and diurnal distributions of signals of 45 db < r ~70 db are shown in figure 6(a) indicating contours, of equal occurrence rates of reception in percentage, N r. One of the most distinctive features in the figure is that the maximum rate appears late
(0) Nr ( 45db (r ~70db ) . Okumo -Tokyo, f • 49.68 MCls.
( b ) NM. Yomogowo.
F IGURE 6. Contours of equal m tes in percentage of N r and N M .
in the evening. The authors tried to find some ionospheric factor which had a close correlation with the distribution in figure 7 (a) . This was found to be the occurrence of the descriptive symbol "M" 3
associated with the "critical frequency" of sporadic E (foEs). Figure 6(b) indicates contours of equal occurrence of such sporadic E, NIl£, observed at the Yamagawa ionosphere station. Comparing the temporal distributions of figure 6(a) and figure 6(b), it is seen that there is a reasonably good correlation between the two sets of data.
FIGURE 7. Contours of equal rate in percentage of foEs above 7.5 Mc/s at Yamagawa .
N p (foEs ~ 7.5 Mc/s).
For reference, the occurrence of sporadic E with foEs above 7 Mc/s, N F , is shown in figure 7. This figure is pertinent enough for the purpose of investigating correlation because NF for any value of foEs gives a similar distribution to that of figure 7. Figures 6(a) and 7 have a resemblance to each other in seasonal variation, but not always in diurnal variation.
In order to obtain quantative relationship between N r and N M, hourly mean values of N r and N M for 3 months every season are plotted as a correlation diagram shown in figure 8. From the figure, the following relation is calculated :
Nr= 0.42 NiI,
where correlation coefficient between them is 0.9 and correlation ratio is 0.94.
An analysis using data observed at the Kokubunji ionosphere station, which is located 750 km from the path-midpoint, did not result in as good an association as the above. This may be because the station is too far away to give a good correlation .
4 .3 . Angles of Arrival
Needless to say, the measured angles of arrival are influenced by the signals from all the modes of propagation present. The data were, therefore,
Nr: rate of OCCUIrence of Es scatter, and NM: rate of occurrence of E s affixed 3 M , Measurement questionable because tbe ordinary and extraordinary by symbol "M " at t ile path midpoint. components are not distinguishable.
96

---- ------- --- --
50.
4 0.
*30 .S
L Z
20
10.
.-2
Nr = a NM a;o.4~
!---- " Summer months
x Winter months
.. / Vema I months
.-V . j .
. V& . " .
dO /~ . V:"" . 1
x • , . / l ' v ·· x •
~~-20. 40 60. 80. 10.0.
NM in %
FInUR E 8. COTrelation between Nr and N M •
Nr: rate of occurrence of Es scatter, am! N",: rate of occurrence of E s amxed by symbol "1\11 ".
arranged into three groups according to the previous classification of ionospheric attenuation, namely: r > 70 db , 45 db < r ~70 db, and r ~45 db . Arrangement was made, in this manner, of the data obtained during a period in July and August 1959, for which wide dyn amic range recordings were available. Figures 9 and 10 are the results of measurements.
From these figures the following features are noted : The normal E-Iayer scatter of r > 70 db showed a regular diurn al variation of angle of arrival with a narrow range of quartile distributions; on the contrary, the Es-reflected signal of r ~ 45 db displayed a wide distribution of angles of arrival with no clear diurnal variation and a westerly deviation of bearing of several degrees on the average. On the other hand, the bearings of the Es scatter of 45 db < r ~ 70 db exhibited a diurnal variation similar to that of the normal scatter , being accompanied with a wider distribution than that of the normal scatter.
From the r esults mentioned above, it is inferred that the Es evening enhancement or Es scatter is not caused by the normal reflection from sporadic-E clouds but by an irregularity of sporadic E , and that the diurnal variation of bearing of the Es scatter may b e related to the same mechanism as that of the normal E -layer scatter.
5 . F-Layer Scatter
F-layer scat ter was pointed out by R. Bateman and others [1] as an evening enhancement observed in the lrar East in autumn. The event frequently occurred over the Poro-to-Tokyo path in the evening hours in eptember and October . When this took
97
III Q)
~ (S)L--L __ ~~ __ -L __ L-~ __ ~ __ L-~-=~==~~ g' -u
.S (Jl c 'c
1l
-lo1 1 --i-t--t---t---t---r--j---G2==:=±.=,-l
J . S . T .
FIGURE 9. Bearing in each mnge of r ~45 db, 45 db < r ~ 70 db and r > 70 db.
Ok-uma-Tokyo, 49.68 Mc/s. Jul y 22-August 21, 1959.
5
4
III Q)
~ g -u
c
§ += 0 > Q)
Q)
'0 Q)
g> «
FIGURE 10. Angle of elevation in each Tange of r ~ 45 db, 45 db < r ~70 db and r >70 db .
OIruma-Tokyo, 49.68 Me/s, July 22-August 21, 1959.
place, F-layer measurements at the Okinawa ionosphere station quite near the path midpoint always indicated either of the following conditions:
(a) F2 critical frequency higher than the 18 M c/s r equired for the normal reflection in oblique incidence propagation at the used frequency, or
(b) F2-layer critical frequency qualified by the
symbol " R " 01' "S",4 'where the top frequency was higher than about 14 1V1c/s.
Figure 11 is a typical example illustrating such a correspondence of the signal strength with the 'j-plot" of ionospheric data. There is no doubt that the signal received in autumn is closely associated with the F2-layer. It is also obvious that ionosperic layers other than the F2-layer did not take part in the propagation during the period of autumnal observation where especially sporadic E was inactive. Figure 12 shows diurnal curves of reception of signal, N r , and N I , the occurrence of the t wo ionospheric conditions, "R" and "S", observed in October 1959. Fair agreement can be seen between N r and N I .
The spread-F condition was rarely observed at Okinawa which is quite near the path midpoint, during the observational period .
"." I""" "'J 60
50 .D "D
.~ 40
.J:: 30 +-
U> C ~
20 Vi
- -- \ J
r---I- I:lelow set hoise--H l ~ ~
0 10 C U>
'(j, 0
- 10
_ 20
:'" I 1--r--'-~-'-I---j---+--t-t----c.I ·' I
I-t_-I-_+_-_+-., : t~ ~--~--+--+-------{
i- ---
l<~a:i< )(~~ ~ J~ ~'S 1-l---+~){:O-O:~"ooO'--j---t---I--+ ~ ~~ "%~~ I-
0° 9 . ~
1-t_-:.+---t--t--t---1----t--1 -I"-
o *~: to )(,.x'-+__-t_-I~o4--+-+---t--t--+---+-+ S~-;.
~. x -X
8 1-·~:,~-+--~:~--+-~-+--1-~-~--r-~ • Xw.(
°fo~x 6 t--t~,r.x~ .•• ~.-t~-+---+--r-t--t--t---+-+____j
°cAoO!)l'; )(
o: :~o 4 I--t--+---+-+--c-~-t-J'.,-+.' 0 0 1--- - -f----
fJl'TTl1ll"'mh'1 ~"'TT'ITIl '1 rl11lh~[lml~l illl~iI IUtuillIJnJ 1 ~~illl~illlllW~~~~ooU~oo~~~'~oo~:~ooo~~~~~~~~~~ ~ L-______ ~~~~~~~~_~_~~~-= o 10 12 14 16 18 20 22 24
J . S . T.
FIGURE 11. Diurnal curves of signal strength and f-plot of i onospheric data observed at the Okinawa ionosphere station,
Poro, the Philippines-Tokyo, 49.84 Mc/s, October 7, 1959.
c
L Z
-0 C o
z
100
80
NI
~ A. .i0o.
I 1/'1 p-
i/ , 'v;l 1
60
~o
/! ~ k\ Nr 20
o o
\\ '0..,
~ 8 d ~
12
J.S .T. 16
F IGURE 12. Com parison of N r and N I .
Nr: rate of reccption of F-layer scatter .
20
Poro, the Phil ippines-Tokyo, 49.84 Mc/s, October 1959. J.h : I'ate of occurrence of the ionospllcric anolnalics at Okinawa.
~ \ Ii
2~
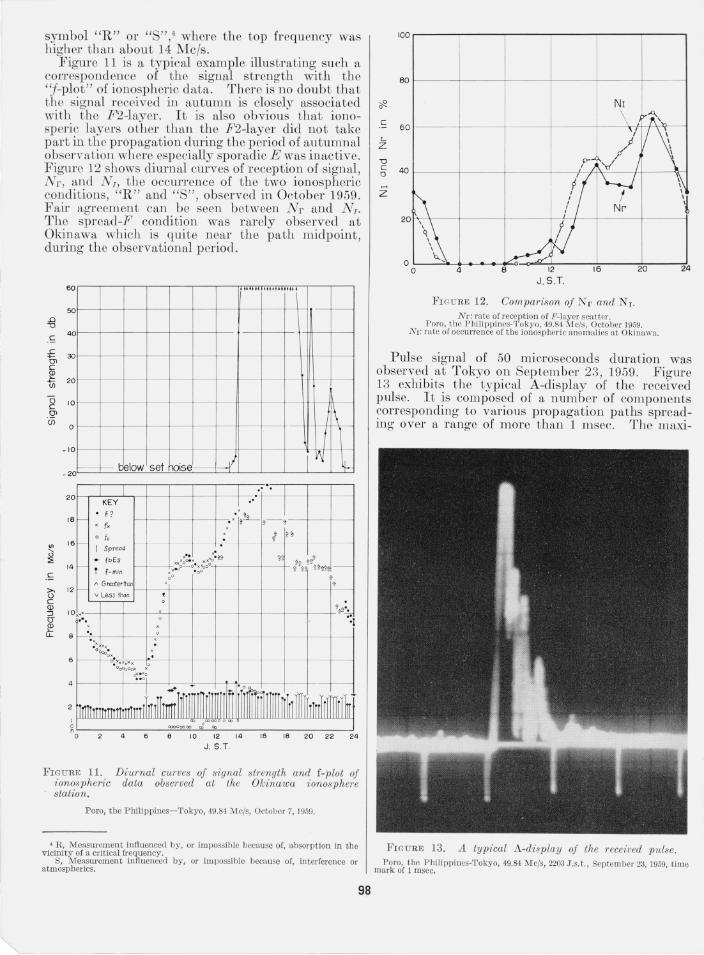
Pulse signal of 50 microseconds duration was observed at Tokyo on September 23, 1959. Figure 13 exhibits the typical A-display of the received pulse. It is composed of a number of components corresponding to various propagation paths spreading over a range of more than 1 msec. The maxi-
, n, Measurement influenced by, or impossible because of, absorption in the FIGURE 13. A typical A-display of the Teceived pulse. vicinity of a critical frequeJl ey.
S, Measurement inUuenced by, or impossible because of, interference or Poro, the Philippines-Tokyo, 49.84 Mc/s, 2203 J.s. t., September 23,1959, time atmospherics. mark of 1 msec.
98

mum delav Lime is of t he same oreier as that observed by ·R. BaLeman and others [1] for tue Poroto-Onna, Okin itwa, path (1347 k111 ). The ionospheric condiLion whcn thc picLurc was takcn corrcspondcd Lo LllC case (b) above. From these observations , it is infened that the received signal is propagaLed by way of scattcring f],om an anomaly in the F2-laycr peculiar to a region in the low latiLude in addition to the normal F'2-propagation.
F igur e 14 shows the results observed in October 1959. 1'110 signals generall y arrive from the true
£
)~l I (w 10
.1 , !, ~~, ~ 0 E
.~ - 10 (5 ) I
60 • leIl'.
40 \
20 \
0 25%\ ."J"'.. _I
I I I I J 1 ! l III ! I I f-I-f-l-f I
I I I I
1)'rJ t • • • • . • I
I 250/1 \ r1\ IN \
!I / ~ .• ;J\.% o 4 6 9 10 12 14 16 Ie 20 22 24
J.S. T.
Fwu RE 14. Diw'nal curves oj signal strength, angles of a1'1'ival.
Poro. the Philippincs·1'okyo, 49.84 M e/s, October 1959.
99
bearing early in the evening, bu t their bearings gradually deviate westwards with the lapse of time. It is one of the future problems to clarify wb ether the westerly deviation is caused by movement of the anomaly or by such mechanism as scattering from ficld-alincd blobs of ionization in the F region as suggestcd alr eady [lJ .
Tbe au thors express their thanks to Dr. S. N amba, Chief of R esearch Laboratory, K .D .D ., for his en couragement in the study , to CRPL and The Voice of America in t he U niLed SLates Government, and the Radio R esearch LabOJ'atories , J apan , for their cooperation and as istftllCe in the continuation of transmissions and in the data arrallgemen t .
6. References
fll ll. Bat eman, J . W. Finney, E. K. SmiLh, L. H . Tveten . and J . M . \Vatts, IG Y observacion of P - laycr scatter in the Far Eas t, J. Georhys. Resea rch 64" 403 (1959) .
[21 K . Miya , T. Sasaki, and M. I shikawa, Angles of arrival of a VHF s ignal in iono pheric forwa rd propagation, R ep. I onosphere and Space R esearch, J apa n 8, 187 (1959) .
f31 w. R. Vin cent , R. T . 'Wolfram, B. M. Sifford, W. E. Jaye, a nd A. M. P eterson, Analys is of obliq Ll e pat h meteo f'propagation data from t he eommLln ieaLio ns viewpoint. 1"roc. I.R.E. 45,1706 (1957) .
(Paper 65D1- 107)
)