objectives - city of brisbanedocs.brisbane.qld.gov.au/cp/docs/budget/20190612-annual... · web...
TRANSCRIPT

Annual Plan and Budget2019-20
Including forward estimates2020-21 to 2022-23
Presented and submitted to the Council on Wednesday 12 June 2019 by the Right Honourable the Lord Mayor of Brisbane (Councillor Adrian Schrinner)
Businesses and Council Providers
Businesses and council providers
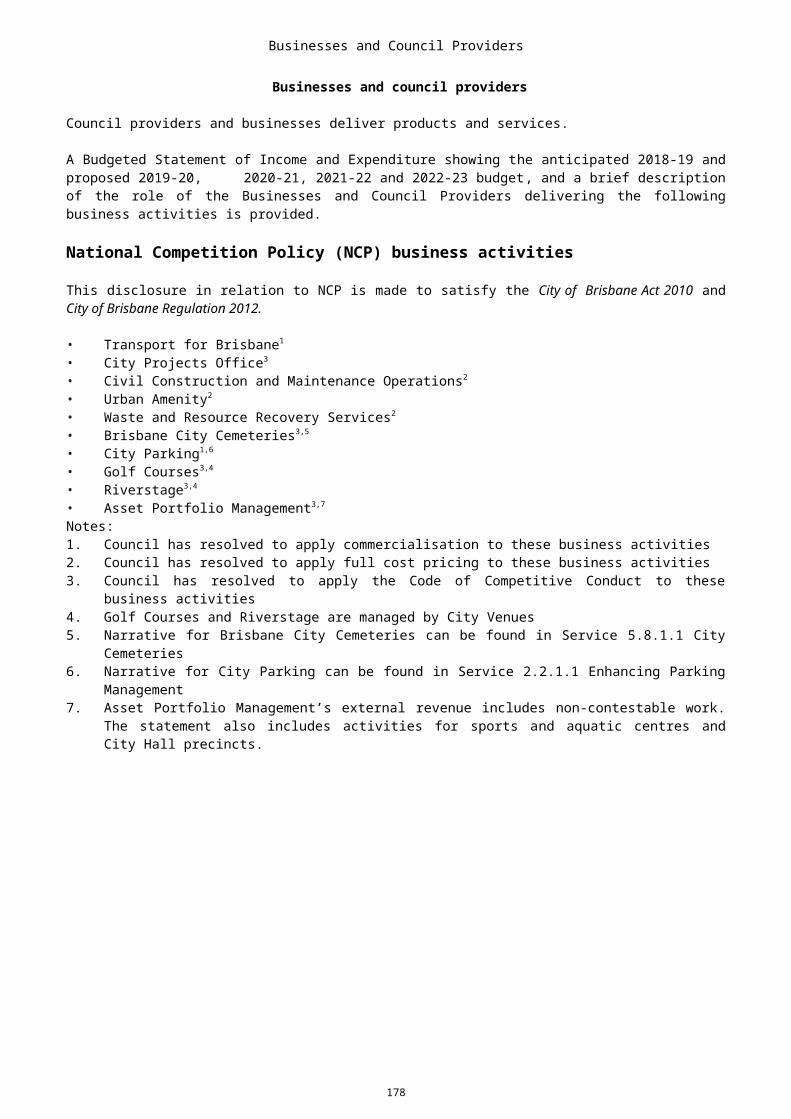
Council providers and businesses deliver products and services.
A Budgeted Statement of Income and Expenditure showing the anticipated 2018-19 and proposed 2019-20, 2020-21, 2021-22 and 2022-23 budget, and a brief description of the role of the Businesses and Council Providers delivering the following business activities is provided.
National Competition Policy (NCP) business activities
This disclosure in relation to NCP is made to satisfy the City of Brisbane Act 2010 and City of Brisbane Regulation 2012.
• Transport for Brisbane1
• City Projects Office3
• Civil Construction and Maintenance Operations2
• Urban Amenity2 • Waste and Resource Recovery Services2
• Brisbane City Cemeteries3,5 • City Parking1,6
• Golf Courses3,4
• Riverstage3,4
• Asset Portfolio Management3,7
Notes:1. Council has resolved to apply commercialisation to these business activities2. Council has resolved to apply full cost pricing to these business activities3. Council has resolved to apply the Code of Competitive Conduct to these business activities4. Golf Courses and Riverstage are managed by City Venues5. Narrative for Brisbane City Cemeteries can be found in Service 5.8.1.1 City Cemeteries6. Narrative for City Parking can be found in Service 2.2.1.1 Enhancing Parking Management7. Asset Portfolio Management’s external revenue includes non-contestable work. The statement also
includes activities for sports and aquatic centres and City Hall precincts.
178
Businesses and Council Providers
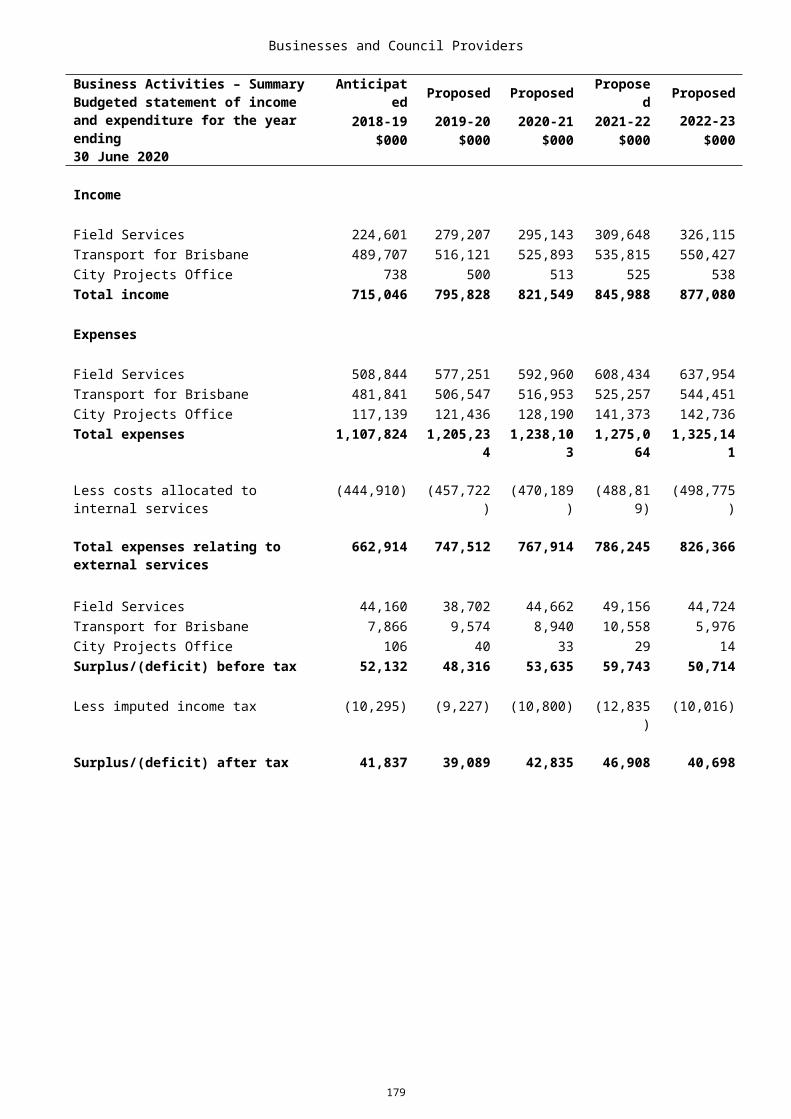
Business Activities – Summary Budgeted statement of income and expenditure for the year ending 30 June 2020
Anticipated Proposed Proposed Proposed Proposed2018-19 2019-20 2020-21 2021-22 2022-23
$000 $000 $000 $000 $000
Income
Field Services 224,601 279,207 295,143 309,648 326,115Transport for Brisbane 489,707 516,121 525,893 535,815 550,427City Projects Office 738 500 513 525 538Total income 715,046 795,828 821,549 845,988 877,080
Expenses
Field Services 508,844 577,251 592,960 608,434 637,954Transport for Brisbane 481,841 506,547 516,953 525,257 544,451City Projects Office 117,139 121,436 128,190 141,373 142,736Total expenses 1,107,824 1,205,234 1,238,103 1,275,064 1,325,141
Less costs allocated to internal services (444,910) (457,722) (470,189) (488,819) (498,775)
Total expenses relating to external services
662,914 747,512 767,914 786,245 826,366
Field Services 44,160 38,702 44,662 49,156 44,724Transport for Brisbane 7,866 9,574 8,940 10,558 5,976City Projects Office 106 40 33 29 14Surplus/(deficit) before tax 52,132 48,316 53,635 59,743 50,714
Less imputed income tax (10,295) (9,227) (10,800) (12,835) (10,016)
Surplus/(deficit) after tax 41,837 39,089 42,835 46,908 40,698
179

Businesses and Council Providers
Total project expenditure combined with rolling projects
Projects Proposed Proposed Proposed Proposed2019-20 2020-21 2021-22 2022-23
$000 $000 $000 $000
Bracalba Quarry Development 539 - - -Field Services Tools of Trade 4,409 4,489 4,581 4,699Field Services Total 4,948 4,489 4,581 4,699
Bus Telematics 429 610 49 -Depot Counter Automation 869 139 140 142Support Future Transport Integration 266 803 826 535Transport for Brisbane Incident Management System 1,642 92 92 93Transport for Brisbane Tools of Trade 7,361 6,744 6,901 7,081Work Order Activity Based Costing 126 - - -Transport for Brisbane Total 10,693 8,388 8,008 7,851
Business User Database Replacement 120 121 - -City Projects Office Tools of Trade 170 177 182 183Integrated Quality Management System Solution 708 114 117 118City Projects Office Total 998 412 299 301
180

Businesses and Council Providers
Field Services
As a quality endorsed business, Field Services objective is to enhance Brisbane’s liveability by providing waste management, civil construction, cleansing and urban maintenance services to Council, that meet customer expectations in productivity, availability and value for money.
Field Services fosters an innovative, motivated and dedicated team-based workforce by focusing on continuous improvement across five critical success factors of zero harm, people and leadership, delivery excellence, business capability and customer excellence.
Key branches include:• Asphalt and Aggregates • Construction • Urban Amenity • Commercial Services and Business Improvement • Asset Services • Waste and Resource Recovery Services and• Fleet Solutions
Note the NCP activities carried out under these operations are described in the Businesses and Council Providers overview.
Field Services is primarily funded from Council's Annual Plan and Budget, supplemented by revenue from services supplied to the Queensland and local government bodies. Surpluses after the application of the requirements of the Tax Equivalents Regime (TER) are returned back to Council's consolidated revenue. Field Services has nil outstanding or proposed borrowings.
The position of Executive Manager, Field Services has delegations under the Council's Administrative Arrangements for the general working and business operations of Field Services, with responsibility to the Chief Executive Officer of Council.
Field Services will report on financial and non-financial outcomes, indicators and targets as contained in the Annual Plan and Budget document.
181
Businesses and Council Providers
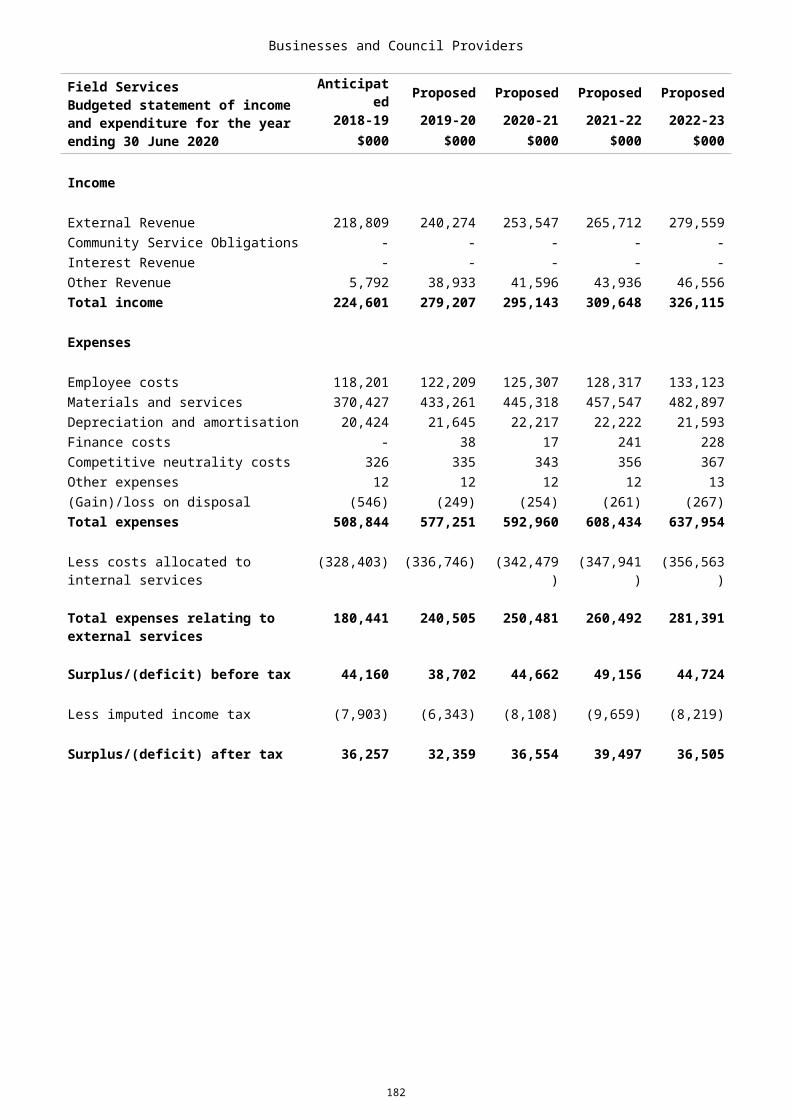
Field ServicesBudgeted statement of income and expenditure for the year ending 30 June 2020
Anticipated Proposed Proposed Proposed Proposed2018-19 2019-20 2020-21 2021-22 2022-23
$000 $000 $000 $000 $000
Income
External Revenue 218,809 240,274 253,547 265,712 279,559Community Service Obligations - - - - -Interest Revenue - - - - -Other Revenue 5,792 38,933 41,596 43,936 46,556Total income 224,601 279,207 295,143 309,648 326,115
Expenses
Employee costs 118,201 122,209 125,307 128,317 133,123Materials and services 370,427 433,261 445,318 457,547 482,897Depreciation and amortisation 20,424 21,645 22,217 22,222 21,593Finance costs - 38 17 241 228Competitive neutrality costs 326 335 343 356 367Other expenses 12 12 12 12 13(Gain)/loss on disposal (546) (249) (254) (261) (267)Total expenses 508,844 577,251 592,960 608,434 637,954
Less costs allocated to internal services
(328,403) (336,746) (342,479) (347,941) (356,563)
Total expenses relating to external services
180,441 240,505 250,481 260,492 281,391
Surplus/(deficit) before tax 44,160 38,702 44,662 49,156 44,724
Less imputed income tax (7,903) (6,343) (8,108) (9,659) (8,219)
Surplus/(deficit) after tax 36,257 32,359 36,554 39,497 36,505
182

Businesses and Council Providers
Transport for Brisbane
Objectives
Transport for Brisbane is one of the largest bus operators in Australia and Brisbane's major provider of public transport with the objective to provide frequent, reliable and safe services, more often, and at the most comfortable standard possible for our passengers. The business includes the provision of CityCat and ferry services, active travel options through CityCycle and Personalised Public Transport. Together, the business aims to deliver high-quality public transport services with a focus on customer service and sustainable transport options for residents and visitors to Brisbane.
Role
Transport for Brisbane has the second largest bus fleet in Australia, which will travel approximately 70 million kilometres delivering high-quality services focusing on accessibility, safety and customer service to contribute to reducing traffic congestion and associated adverse social, economic and environmental impacts.
Continued investment in modern environmentally friendly, air-conditioned and accessible buses, as well as the continued success of the popular Bus Upgrade Zones (BUZ), the Blue CityGlider and the Maroon CityGlider have helped to ensure Transport for Brisbane carries significantly more passengers than the entire South East Queensland city train network.
Transport for Brisbane provides scheduled network passenger bus services including high frequency BUZ and CityGlider services, school services, charter services and special event services. The services include non-commercial and community bus services and concessional travel for senior citizens, full time university students, school students and for disadvantaged members of the community. A modern, wheelchair-accessible, well-maintained, clean and carbon neutral bus fleet and strategically positioned depots ensure these services are delivered effectively.
Transport for Brisbane delivers public transport bus, CityCat and ferry services under contracts with TransLink, a division of Queensland Government’s Department of Transport and Main Roads. Under the TransLink contracts, fares are set by Queensland Government and all fare revenue belongs to TransLink.
CityCat and ferry services are an important part of the public transport network, stretching 22 kilometres along the Brisbane River. The ferry network provides access at 25 terminals for commuters along, and across the river. Brisbane's free inner-city ferry service, the CityHopper is included in this service. The Queensland Government provides a funding contribution for ferry operations.
The CityCycle public bike hire scheme operates within the inner-city to encourage short trips by bicycle. The scheme is delivered in partnership with the private sector. With up to 2000 bikes and 150 station locations conveniently positioned near key bus, train and ferry stations, the scheme provides another travel option for commuters and visitors around the inner-city, as part of our integrated public transport system.
Transport for Brisbane also delivers Personalised Public Transport. This service provides Council-funded access to public transport for residents in areas of Brisbane which do not meet the requirements for full TransLink services. Personalised Public Transport currently utilises maxi taxis to transport residents to key local destinations on set hail ’n’ ride routes and include bus interchanges or railway stations during peak periods and operates on a regular cycle.
Financial and non-financial targets
In 2019-20, achieve:• mean customer satisfaction with bus services of not less than 6.5 • take delivery of 60 new rigid equivalent buses.
Council transport operating subsidy
183

Businesses and Council Providers
Council subsidises Transport for Brisbane for the services it operates so that Transport for Brisbane can meet its community service obligations and provide a better service to Brisbane ratepayers.
184
Businesses and Council Providers
Notional capital structure and surpluses
Transport for Brisbane’s notional capital structure is via equity funding from Council. Surpluses are treated in accordance with Council's dividend policy for Business Units after the application of the requirements of the TER with any TER income tax remitted to Council.
Proposed major investments
Transport for Brisbane will take delivery of 60 new rigid equivalent buses in 2019-20 which help ensure the comfort of our bus fleet.
Borrowings
Transport for Brisbane has nil outstanding or proposed borrowings.
Service quality
Transport for Brisbane will provide exceptional responsive customer service with a commitment to zero harm. The organisation strives to be consistently high performing transport provider through a culture which is positive, professional and performance driven.
Delegations
The position of Divisional Manager, Transport for Brisbane has delegations under the Council's Administrative Arrangements for the general working and business operations of Transport for Brisbane, with responsibility to the Chief Executive Officer of Council.
Reportable information
Transport for Brisbane will report to Council regarding its operations and performance, including financial and non-financial targets.
185

Businesses and Council Providers
Transport for BrisbaneBudgeted statement of income and expenditure for the year ending 30 June 2020
Anticipated Proposed Proposed Proposed Proposed2018-19 2019-20 2020-21 2021-22 2022-23
$000 $000 $000 $000 $000
Income
External Revenue 335,679 345,686 352,010 359,415 369,240Council Transport Operating Subsidy 125,328 134,244 136,152 138,425 141,837Interest Revenue - - - - -Other Revenue 28,700 36,191 37,731 37,975 39,350Total income 489,707 516,121 525,893 535,815 550,427
Expenses
Employee costs 239,369 248,222 254,831 259,788 271,309Materials and services 226,011 207,232 208,642 210,181 216,538Depreciation and amortisation 16,231 47,249 49,779 51,379 52,527Finance costs - 3,614 3,470 3,678 3,845Other expenses 30 30 31 31 32(Gain)/loss on disposal 200 200 200 200 200Total expenses 481,841 506,547 516,953 525,257 544,451
Less costs allocated to internal services
- - - - -
Total expenses relating to external services
481,841 506,547 516,953 525,257 544,451
Surplus/(deficit) before tax 7,866 9,574 8,940 10,558 5,976
Less imputed income tax (2,360) (2,872) (2,683) (3,167) (1,793)
Surplus/(deficit) after tax 5,506 6,702 6,257 7,391 4,183
186

Businesses and Council Providers
City Projects Office
The objective of City Projects Office is to provide professional services across project management, built and natural environment and engineering disciplines. As an in-house project management and design group, emphasis is placed on value adding, quality, design best practice, innovation, and environmental sustainability. City Projects Office continues to maintain strong partnerships and stakeholder relationships to ensure expectations are realised, all within the wider goal of contributing to a better Brisbane.
In 2019-20, City Projects Office will continue to deliver high-quality professional services to meet Council's engineering, built environment, land management and natural environment needs, within the framework of the Brisbane Vision.
The business will support its partners to deliver across a broad range of programs across Council.
City Projects Office proposed investments in 2019-20 are focused on maintaining industry standard tools of trade, through a planned replacement program for high specification technical workstations and related design and modelling software, as well as replacing end-of-life survey equipment.
City Projects Office is primarily funded from Council's Annual Plan and Budget, supplemented by revenue from services supplied to Queensland and local government bodies. Surpluses after the application of the requirements of the TER are returned back to Council's consolidated revenue.
City Projects Office has nil outstanding or proposed borrowings.
The position of Executive Manager, City Projects Office has delegations under Council's Administrative Arrangements for the general working and business operations of City Projects Office, with responsibility through the Divisional Manager, Brisbane Infrastructure to the Chief Executive Officer of Council.
City Projects Office will report on financial and non-financial outcomes, indicators and targets as contained in the Annual Plan and Budget document.
187
Businesses and Council Providers
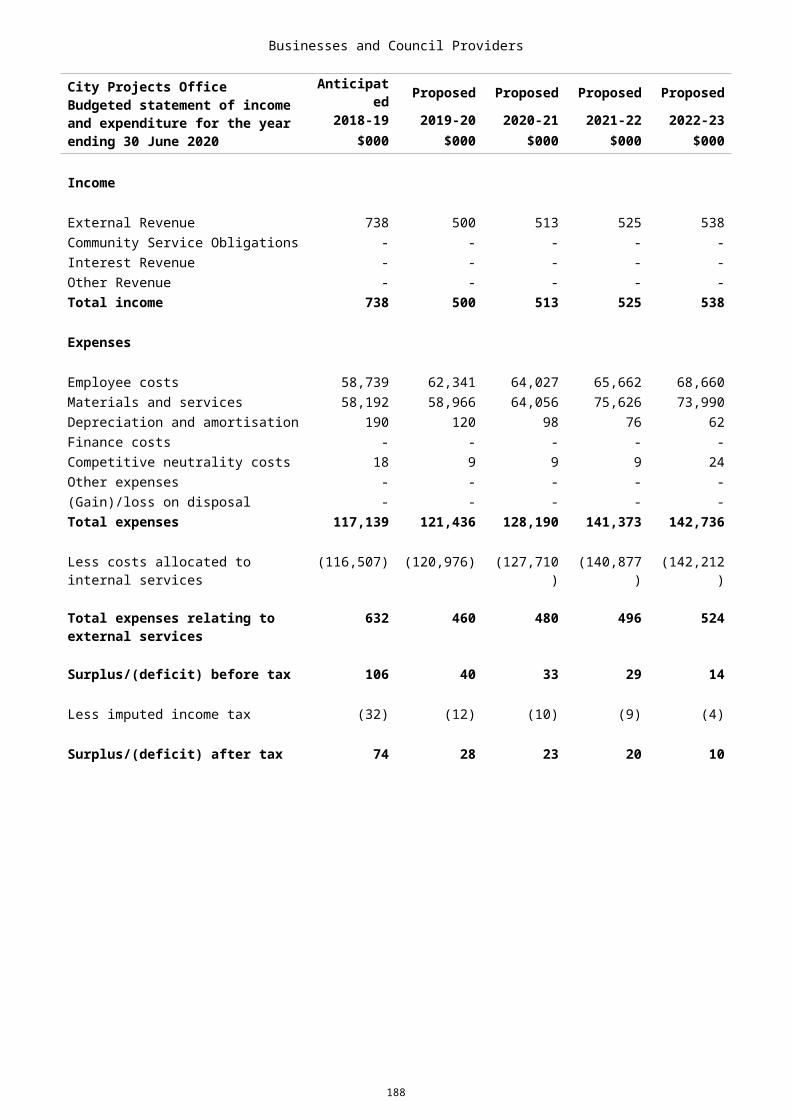
City Projects Office Budgeted statement of income and expenditure for the year ending 30 June 2020
Anticipated Proposed Proposed Proposed Proposed2018-19 2019-20 2020-21 2021-22 2022-23
$000 $000 $000 $000 $000
Income
External Revenue 738 500 513 525 538Community Service Obligations - - - - -Interest Revenue - - - - -Other Revenue - - - - -Total income 738 500 513 525 538
Expenses
Employee costs 58,739 62,341 64,027 65,662 68,660Materials and services 58,192 58,966 64,056 75,626 73,990Depreciation and amortisation 190 120 98 76 62Finance costs - - - - -Competitive neutrality costs 18 9 9 9 24Other expenses - - - - -(Gain)/loss on disposal - - - - -Total expenses 117,139 121,436 128,190 141,373 142,736
Less costs allocated to internal services
(116,507) (120,976) (127,710) (140,877) (142,212)
Total expenses relating to external services
632 460 480 496 524
Surplus/(deficit) before tax 106 40 33 29 14
Less imputed income tax (32) (12) (10) (9) (4)
Surplus/(deficit) after tax 74 28 23 20 10
188
Businesses and Council Providers
Civil Construction and Maintenance Operations
Civil Construction and Maintenance Operations is part of Field Services and provides relevant services to Council that meet customer expectations in quality, productivity, availability and value for money. This is achieved by maintaining continuous improvement in all parts of the business and by fostering an innovative, motivated and dedicated team-based workforce.
A diverse range of services are delivered across the following operational areas:
Asphalt and Aggregates• operates highly efficient asphalt plants located at Eagle Farm and Riverview• conducts quarrying operations at Mt Coot-tha and Bracalba quarries, producing an extensive range of
quarry products utilised in the road and civil construction industries• operates a recycling facility at Pine Mountain quarry which allows the re-use of concrete materials,
reclaimed road base and asphalt• conducts major road resurfacing, minor road maintenance services and line marking• road construction and rehabilitation.
Construction• construction and maintenance of bikeways, footpaths and kerb and channel• construction and maintenance of steel, timber and concrete bridges• construction and maintenance of retaining walls and embankments• construction of intersection and traffic improvements• assembly, installation and operation of traffic management systems• services in local and major drainage, stormwater projects and waterways rehabilitation • trade services and construction management for Council-owned offices, industrial locations,
entertainment facilities and heritage buildings.
Surpluses after the application of the requirements of the TER are returned back to Council's consolidated revenue.
The position of Executive Manager, Field Services has delegations under Council's Administrative Arrangements for the general working and business operations of Civil Construction and Maintenance activities, with responsibility to the Chief Executive Officer of Council.
Civil Construction and Maintenance Operations will report on financial and non-financial outcomes, indicators and targets as contained in the Annual Plan and Budget document.
189

Businesses and Council Providers
Civil Construction and Maintenance Operations Budgeted statement of income and expenditure for the year ending 30 June 2020
Anticipated Proposed Proposed Proposed Proposed2018-19 2019-20 2020-21 2021-22 2022-23
$000 $000 $000 $000 $000
Income
External Revenue 33,901 34,366 36,042 37,011 37,936Community Service Obligations - - - - -Interest Revenue - - - - -Other Revenue - - - - -Total income 33,901 34,366 36,042 37,011 37,936
Expenses
Employee costs 28,452 30,533 31,296 32,079 32,880Materials and services 93,792 86,767 86,321 87,262 89,863Depreciation and amortisation 4,463 4,399 4,467 3,880 3,720Finance costs - 9 6 3 9Competitive neutrality costs 50 50 52 53 54Other expenses - - - - -(Gain)/loss on disposal - - - - -Total expenses 126,757 121,758 122,142 123,277 126,526
Less costs allocated to internal services
(97,736) (93,937) (93,662) (94,195) (96,693)
Total expenses relating to external services
29,021 27,821 28,480 29,082 29,833
Surplus/(deficit) before tax 4,880 6,545 7,562 7,929 8,103
Less imputed income tax (1,464) (1,964) (2,269) (2,379) (2,431)
Surplus/(deficit) after tax 3,416 4,581 5,293 5,550 5,672
190

Businesses and Council Providers
Urban Amenity
Urban Amenity delivers a broad range of services including the following:• cleaning of urban precincts and streets, including bus stops, graffiti removal, road sweeping and
stormwater gully cleaning• delivery of arboriculture, natural area, parkland and horticultural maintenance services, including street
tree maintenance• delivery of pest, weeds and vermin control services• delivery of street and project sign maintenance and installation.
Surpluses after the application of the requirements of the TER are returned back to Council's consolidated revenue.
The position of Executive Manager, Field Services has delegations under the Council's Administrative Arrangements for the general working and business operations of Urban Amenity activities, with responsibility to the Chief Executive Officer of Council.
Urban Amenity will report on financial and non-financial outcomes, indicators and targets as contained in the Annual Plan and Budget document.
191

Businesses and Council Providers
Urban Amenity Budgeted statement of income and expenditure for the year ending 30 June 2020
Anticipated Proposed Proposed Proposed Proposed2018-19 2019-20 2020-21 2021-22 2022-23
$000 $000 $000 $000 $000
Income
External Revenue 895 917 935 958 982Community Service Obligations - - - - -Interest Revenue - - - - -Other Revenue - - - - -Total income 895 917 935 958 982
Expenses
Employee costs 36,179 37,753 38,961 39,726 41,631Materials and services 47,184 50,891 52,176 53,990 54,751Depreciation and amortisation 114 191 182 179 171Finance costs - - - - -Competitive neutrality costs 17 17 17 18 18Other expenses - - - - -(Gain)/loss on disposal - - - - -Total expenses 83,494 88,852 91,336 93,913 96,571
Less costs allocated to internal services
(82,824) (88,164) (90,635) (93,199) (95,837)
Total expenses relating to external services
670 688 701 714 734
Surplus/(deficit) before tax 225 229 234 244 248
Less imputed income tax (68) (69) (70) (73) (74)
Surplus/(deficit) after tax 157 160 164 171 174
192

Businesses and Council Providers
Waste and Resource Recovery Services
Waste and Resource Recovery Services provides waste management and resource recovery services that are competitive, sustainable and environmentally responsible. These services reflect a commitment to public health, whole of life cycle waste management and industry best practice.
Waste and Resource Recovery Services will:• undertake the collection and management of domestic waste and recycling materials• ensure that the resource recovery centres at Nudgee, Willawong, Chandler and Ferny Grove, tips shops
and the Brisbane Landfill are effectively managed, with a focus on innovation, resource recovery and environmental sustainability
• strive to achieve environmental excellence through raising the current operating standards by using new technology and investigating towards zero waste solutions
• deliver strategies on waste minimisation and litter in accordance with the ’Brisbane. Clean, Green, Sustainable 2017-2031’ plan
• work with industry to develop robust resource recovery markets• develop and deliver education and communication on waste management, waste minimisation and litter
to improve community understanding and influence behaviour change• work with the Queensland and Australian Governments to deliver waste reduction programs in
accordance with the current legislation and strategic frameworks.
Surpluses after the application of the requirements of the TER are returned back to Council's consolidated revenue.
The position of Executive Manager, Field Services has delegations under Council's Administrative Arrangements for the general working and business operations of Waste and Resource Recovery Services activities, with responsibility to the Chief Executive Officer of Council.
Waste and Resource Recovery Services will report on financial and non-financial outcomes, indicators and targets as contained in the Annual Plan and Budget document.
193

Businesses and Council Providers
Waste and Resource Recovery Budgeted statement of income and expenditure for the year ending 30 June 2020
Anticipated Proposed Proposed Proposed Proposed2018-19 2019-20 2020-21 2021-22 2022-23
$000 $000 $000 $000 $000
Income
External Revenue 167,581 188,815 200,356 212,253 224,820Community Service Obligations - - - - -Interest Revenue - - - - -Other Revenue 4,403 37,546 40,174 42,467 45,050Total income 171,984 226,361 240,530 254,720 269,870
Expenses
Employee costs 5,579 5,644 5,785 5,998 6,204Materials and services 140,938 201,501 210,784 219,747 240,622Depreciation and amortisation 3,773 4,554 4,446 4,428 3,484Finance costs - 29 11 238 219Competitive neutrality costs 259 268 274 285 295Other expenses - - - - -(Gain)/loss on disposal 200 - - - -Total expenses 150,749 211,996 221,300 230,696 250,824
Less costs allocated to internal services
- - - - -
Total expenses relating to external services
150,749 211,996 221,300 230,696 250,824
Surplus/(deficit) before tax 21,235 14,365 19,230 24,024 19,046
Less imputed income tax (6,371) (4,310) (5,769) (7,207) (5,714)
Surplus/(deficit) after tax 14,864 10,055 13,461 16,817 13,332
194

Businesses and Council Providers
Brisbane City Cemeteries Budgeted statement of income and expenditure for the year ending 30 June 2020
Anticipated Proposed Proposed Proposed Proposed2018-19 2019-20 2020-21 2021-22 2022-23
$000 $000 $000 $000 $000
Income
External Revenue 9,885 11,850 12,231 12,722 13,041Community Service Obligations 2,144 2,206 2,247 2,303 2,349Interest Revenue - - - - -Other Revenue (1,164) (1,189) (1,236) (1,286) (1,311)Total income 10,865 12,867 13,242 13,739 14,079
Expenses
Employee costs 4,130 4,225 4,331 4,439 4,615Materials and services 7,304 7,805 7,817 7,975 8,178Depreciation and amortisation 548 641 676 675 648Finance costs - - - - -Competitive neutrality costs - - - - -Other expenses - - - - -(Gain)/loss on disposal - - - - -Total expenses 11,982 12,671 12,824 13,089 13,441
Less costs allocated to internal services
- - - - -
Total expenses relating to external services
11,982 12,671 12,824 13,089 13,441
Surplus/(deficit) before tax (1,117) 196 418 650 638
Less imputed income tax - (59) (125) (195) (191)
Surplus/(deficit) after tax (1,117) 137 293 455 447
195

Businesses and Council Providers
City Parking
Objectives
City Parking’s objective is to meet customer needs and contribute to both liveability and economic outcomes by delivering accessible and reliable parking services.
Role
City Parking manages parking services in Council’s off street parking stations as well as temporary and event parking. In this role City Parking:• provides competitive car parking services to all customers• ensures customer focused service• partners with Council Programs to ensure Brisbane’s liveability• partners with third parties to establish cohesive working relationships• maintains Council assets and equipment to best practice standards.
Financial and non-financial targets
In 2019-20 achieve:• net surplus before tax as stated in the Budgeted Financial Statement• average number of vehicles per bay per day in King George Square car park• average number of vehicles per bay per day in Wickham Terrace car park.
Community service obligations
City Parking has no community service obligations.
Notional capital structure and surpluses
City Parking’s notional capital structure is by way of equity funding from Council. Surpluses are treated in accordance with Council’s dividend policy for Business Units after the application of the requirements of the TER with any TER income tax remitted to Council.
Proposed major investments
There are no proposed major investments.
Borrowings
City Parking has no outstanding or proposed borrowings.
Service quality
City Parking will provide accessible, reliable and competitive services.
Delegations
The positions of City Parking Manager and Asset Portfolio Management Manager have delegations under the Council’s Administrative Arrangements for the working and business operations of City Parking with responsibility to the Chief Executive Officer of Council.
196

Businesses and Council Providers
Reportable information
City Parking will report to Council regarding its operations and performance including financial and non-financial targets.
197
Businesses and Council Providers
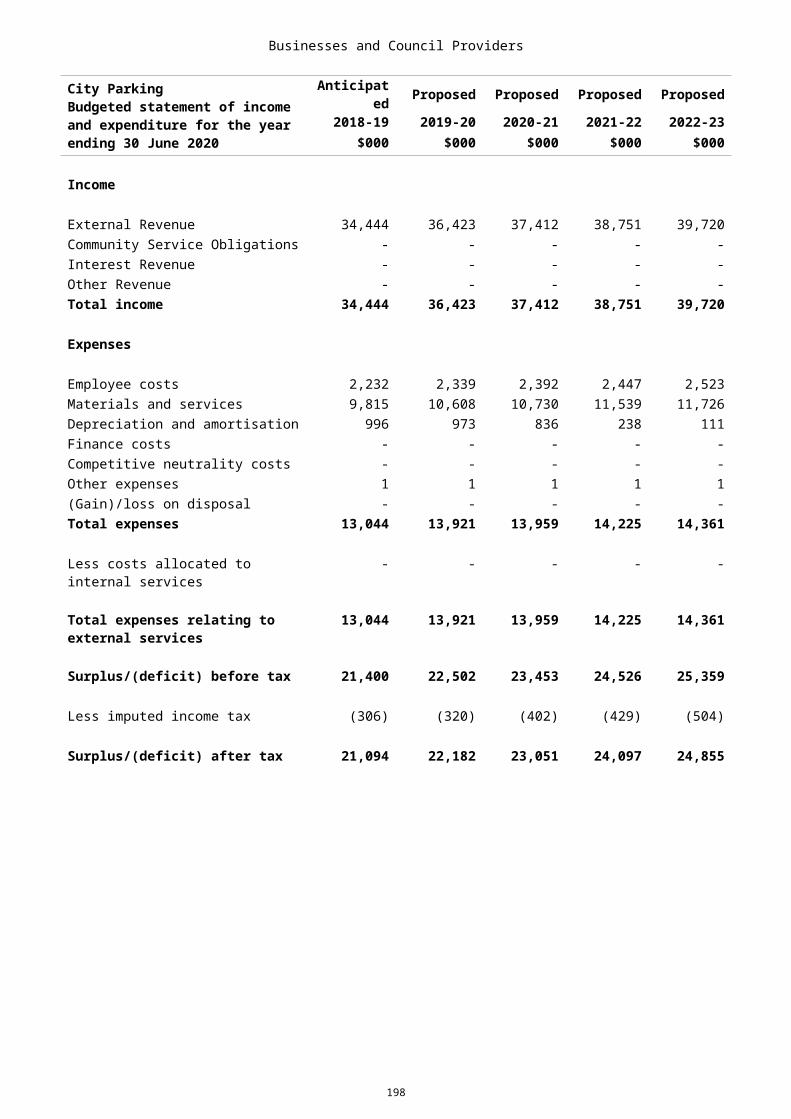
City Parking Budgeted statement of income and expenditure for the year ending 30 June 2020
Anticipated Proposed Proposed Proposed Proposed2018-19 2019-20 2020-21 2021-22 2022-23
$000 $000 $000 $000 $000
Income
External Revenue 34,444 36,423 37,412 38,751 39,720Community Service Obligations - - - - -Interest Revenue - - - - -Other Revenue - - - - -Total income 34,444 36,423 37,412 38,751 39,720
Expenses
Employee costs 2,232 2,339 2,392 2,447 2,523Materials and services 9,815 10,608 10,730 11,539 11,726Depreciation and amortisation 996 973 836 238 111Finance costs - - - - -Competitive neutrality costs - - - - -Other expenses 1 1 1 1 1(Gain)/loss on disposal - - - - -Total expenses 13,044 13,921 13,959 14,225 14,361
Less costs allocated to internal services
- - - - -
Total expenses relating to external services
13,044 13,921 13,959 14,225 14,361
Surplus/(deficit) before tax 21,400 22,502 23,453 24,526 25,359
Less imputed income tax (306) (320) (402) (429) (504)
Surplus/(deficit) after tax 21,094 22,182 23,051 24,097 24,855
198

Businesses and Council Providers
City Venues
Lifestyle and Community Services Division manages community facilities including golf courses, swimming pools, sports facilities, the Riverstage and the Sir Thomas Brisbane Planetarium. In addition to the venue management services associated with these facilities, Lifestyle and Community Services also provides event management and community contract management services to Council and community organisations.
Lifestyle and Community Services will:• provide a high level of customer service• provide value for money products and services• explore innovative and sustainable improvements to the productivity of its facilities• explore opportunities with private enterprise to improve services • manage events on behalf of Council and the community in a professional and cost-effective manner• maintain all venues to a high standard.
Golf Courses
Lifestyle and Community Services Division manages the two Council golf courses, St Lucia Golf Links and the Victoria Park Golf Complex. In addition to the venue maintenance services associated with these two courses, Lifestyle and Community Services also provides contract management of the leases and licences in place to operate the function centres and ancillary services at these sites.
Lifestyle and Community Services will:• provide a high level of customer service• provide value for money products and services• explore innovative and sustainable improvements to the productivity of its golf facilities• explore opportunities with private enterprise to improve services• maintain both golf courses to a high standard.
Surpluses after the application of the requirements of the TER are returned back to Council's consolidated revenue.
The position of Divisional Manager, Lifestyle and Community Services has delegations under the Council's Administrative Arrangements for the general working and business operations of City Venues, with responsibility to the Chief Executive Officer of Council.
City Venues will report on financial and non-financial outcomes, indicators and targets as contained in the Annual Plan and Budget document.
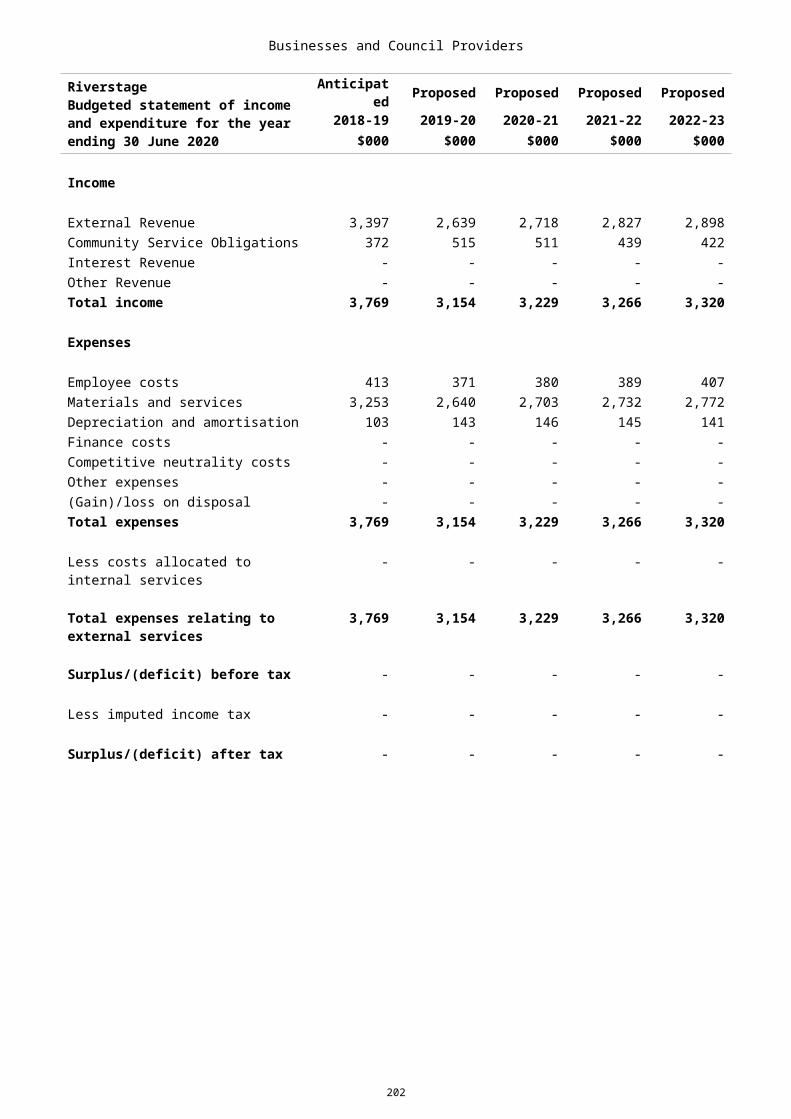
Riverstage
Lifestyle and Community Services Division manages Riverstage outdoor venue, located in the City Botanic Gardens. In addition to the venue operations associated with Riverstage, Lifestyle and Community Services also manages the venue maintenance services at this site.
Lifestyle and Community Services will:• provide a high level of customer service• provide value for money products and services• explore innovative and sustainable improvements to the productivity of Riverstage• explore opportunities with private enterprise to improve services• maintain the venue to a high standard.
Surpluses after the application of the requirements of the TER are returned back to Council's consolidated revenue.
The position of Divisional Manager, Lifestyle and Community Services has delegations under the Council's Administrative Arrangements for the general working and business operations of City Venues, with responsibility to the Chief Executive Officer of Council.
City Venues will report on financial and non-financial outcomes, indicators and targets as contained in the Annual Plan and Budget document.
199
Businesses and Council Providers
Golf Courses Budgeted statement of income and expenditure for the year ending 30 June 2020
Anticipated Proposed Proposed Proposed Proposed2018-19 2019-20 2020-21 2021-22 2022-23
$000 $000 $000 $000 $000
Income
External Revenue 3,672 3,761 3,836 3,932 4,030Community Service Obligations 1,453 1,211 1,225 1,194 1,229Interest Revenue - - - - -Other Revenue - - - - -Total income 5,125 4,972 5,061 5,126 5,259
Expenses
Employee costs 1,064 1,087 1,114 1,142 1,193Materials and services 2,850 2,745 2,781 2,827 2,919Depreciation and amortisation 994 919 940 927 909Finance costs - - - - -Competitive neutrality costs - - - - -Other expenses 217 221 226 230 238(Gain)/loss on disposal - - - - -Total expenses 5,125 4,972 5,061 5,126 5,259
Less costs allocated to internal services
- - - - -
Total expenses relating to external services
5,125 4,972 5,061 5,126 5,259
Surplus/(deficit) before tax - - - - -
Less imputed income tax - - - - -
Surplus/(deficit) after tax - - - - -
200

Businesses and Council Providers
Riverstage Budgeted statement of income and expenditure for the year ending 30 June 2020
Anticipated Proposed Proposed Proposed Proposed2018-19 2019-20 2020-21 2021-22 2022-23
$000 $000 $000 $000 $000
Income
External Revenue 3,397 2,639 2,718 2,827 2,898Community Service Obligations 372 515 511 439 422Interest Revenue - - - - -Other Revenue - - - - -Total income 3,769 3,154 3,229 3,266 3,320
Expenses
Employee costs 413 371 380 389 407Materials and services 3,253 2,640 2,703 2,732 2,772Depreciation and amortisation 103 143 146 145 141Finance costs - - - - -Competitive neutrality costs - - - - -Other expenses - - - - -(Gain)/loss on disposal - - - - -Total expenses 3,769 3,154 3,229 3,266 3,320
Less costs allocated to internal services
- - - - -
Total expenses relating to external services
3,769 3,154 3,229 3,266 3,320
Surplus/(deficit) before tax - - - - -
Less imputed income tax - - - - -
Surplus/(deficit) after tax - - - - -
201
Businesses and Council Providers
Asset Portfolio Management
Asset Portfolio Management's business activities aim is to deliver and manage a corporate real estate property portfolio to Council which can be benchmarked against industry standards.
Activities undertaken to achieve this aim include:• providing a knowledgeable resource for the management and delivery of property asset management
across the organisation• managing Council’s real estate portfolio in a manner that optimises the financial return and benefit to the
organisation, while facilitating Council’s urban renewal and development initiatives• managing Council's property lease portfolio for land, buildings (commercial, retail, industrial, residential),
advertising signs/billboards and telecommunication installations from initial identification of need through to surrender/termination
• providing comprehensive property services including management of the assigned built environment particularly relating to maintenance initiatives, corporate property services contracts, risk management practices and legislative compliance matters such as environmental and heritage management and workplace health and safety.
Community service obligations
With the inclusion of City Hall and aquatic centres within the Asset Portfolio Management business activity, this has given rise to a community service obligation, in consideration of the significant involvement of those facilities in achieving community objectives for which full cost recovery is not undertaken.
City Hall administers the Lord Mayor’s Community Service Obligation fund that supports community use of the facility for functions and events. The City Hall facility remains accessible to residents and visitors of Brisbane. Public areas in the facility are open daily. The facility is closed three days per year and open from 8am-5pm weekdays and 9am-5pm weekends.
Similarly, managing the aquatic centres incorporates Calamvale Community Sports Centre, Acacia Ridge Leisure Centre, Hibiscus Sports Complex and the 21 community pools. Asset Portfolio Management provides the operational maintenance and asset coordination at the venues.
In meeting community objectives, this business activity Asset Portfolio Management seeks to:• facilitate the service operators to provide a high level of customer service• facilitates the provision of value for money products and services which involves subsidising services• explore innovative and sustainable improvements to the productivity of its sports and aquatic facilities• explore opportunities with private enterprise to improve services• manage events on behalf of Council and the community in a professional and cost-effective manner• maintain facilities to a high standard and maintain the heritage facility to a high standard.
202

Businesses and Council Providers
Asset Portfolio Management Budgeted statement of income and expenditure for the year ending 30 June 2020
Anticipated Proposed Proposed Proposed Proposed2018-19 2019-20 2020-21 2021-22 2022-23
$000 $000 $000 $000 $000
Income
External Revenue 10,707 11,054 11,309 11,615 11,905Community Service Obligations 12,171 12,805 12,924 12,933 12,995Interest Revenue - - - - -Other Revenue - - - - -Total income 22,878 23,859 24,233 24,548 24,900
Expenses
Employee costs 492 504 524 538 559Materials and services 93,510 35,244 35,613 38,001 39,131Depreciation and amortisation 18,290 20,037 20,890 21,232 21,387Finance costs 10,247 72,903 71,403 70,261 68,285Competitive neutrality costs - - - - -Other expenses - - - - -(Gain)/loss on disposal - - - - -Total expenses 122,539 128,688 128,430 130,032 129,362
Less costs allocated to internal services
(104,817) (110,261) (109,769) (111,172) (110,286)
Total expenses relating to external services
17,722 18,427 18,661 18,860 19,076
Surplus/(deficit) before tax 5,156 5,432 5,572 5,688 5,824
Less imputed income tax (1,547) (1,630) (1,672) (1,706) (1,747)
Surplus/(deficit) after tax 3,609 3,802 3,900 3,982 4,077
203