objective insights (brett gaspers) capabilities presentation
TRANSCRIPT


© Copyright 2016 Objective Insights, Inc. All Rights Reserved.
Company Overview
• Our Approach • Consulting Services • OI Modeling Tools • Our Strengths
2
Background

© Copyright 2016 Objective Insights, Inc. All Rights Reserved.
Our Purpose
Objective Insights is a consulting firm dedicated to providing health care companies with the marketing and financial analysis they need to make informed decisions about their business opportunities.
3
Background

© Copyright 2016 Objective Insights, Inc. All Rights Reserved.
Our Background
• Company personnel have pharmaceutical industry experience – Merck Biogen Syntex
• Founded in 1994 • Provides ad hoc consulting and stand-alone forecasting and analysis
tools (OI Tools) • Consulting staff
– Brett Gaspers Charley Hooper • www.ObjectiveInsights.com • 530-271-1940 (CA) / 425-745-9667 (WA)
4
Background
© Copyright 2016 Objective Insights, Inc. All Rights Reserved.
Our People
• Brett Gaspers - Founder of Objective Insights – B.S. Chemical Engineering - Massachusetts Institute of Technology – M.B.A. - Stanford University Graduate School of Business – First Manhattan Consulting Group - Research analyst – Biogen - Process development and manufacturing – Syntex Laboratories - Forecasting, reimbursement, patient
assistance program, market research
5
Background

© Copyright 2016 Objective Insights, Inc. All Rights Reserved.
Projects and Clients
• Successfully completed 350 projects • More than 50 clients
Pharmaceutical • Biotechnology • Diagnostics • Vaccine • Device
• Clients include:
6
Background

© Copyright 2016 Objective Insights, Inc. All Rights Reserved.
Therapeutic Area Experience
7
Background
Analgesia Inflammation & Allergy
Autoimmune Disorders Metabolic Disorders
Cardiovascular Musculoskeletal
CNS / Psychiatric Oncology
Dermatology Ophthalmology
Diagnostics Pulmonary
Gastroenterology Urology
Infectious Diseases Vaccines

Approach

© Copyright 2016 Objective Insights, Inc. All Rights Reserved.
Our Analysis Philosophy
• Iteratively refine the approach and analytic model with the client to ensure our solution correctly addresses the problem
• Provide a usable, transparent, yet sophisticated analytic framework – Ensure analysis is transparent in structure and information
• Parametric & parsimonious design – All inputs are visible, not aggregated – Make the model as simple as possible
• Thoroughly documented assumptions, backed by data and research • Time and date stamps for version control • Model inputs, outputs, and calculations are clearly labeled (e.g., historical revenue
total prescriptions per month, in thousands) – Model calibrated to established data – Incorporate risk analysis
• Monte Carlo simulation, decision trees • Aid understanding of upsides and downsides • Sensitivity analysis to identify model drivers
9
Approach

© Copyright 2016 Objective Insights, Inc. All Rights Reserved.
Decision-Based ManagementSM
• From information to decision – “If we have good information, our company will be successful.” ...
not necessarily! – Information is expensive ($$$) and infinite (∞) – Too much information can confuse and slow progress – Much data gathering is useless for making decisions
• From decision to information to decision – “If we make good decisions, our company will be successful.”
10
Approach

© Copyright 2016 Objective Insights, Inc. All Rights Reserved.
Decision-Based ManagementSM Process
• Frame the problem: Solve the right one • Focus research efforts
– What affects the analysis most? – What is quickest to implement? – What is the least expensive to implement?
• Keep improving information and refining the model until solution is clear
11
Approach

© Copyright 2016 Objective Insights, Inc. All Rights Reserved.
Decision-Based ManagementSM Pyramid
12
Approach
Sales Forecast
Secondary Market Research
Primary Market Research
Decision/Objective

© Copyright 2016 Objective Insights, Inc. All Rights Reserved.
Decision-Based ManagementSM Benefits
• Better decisions • Clarity of action • Less costly; information acquisition is targeted to what is needed for
analysis • Faster resolution • Tailored for specific situations
– Reflects your situation and needs
13
Approach

Services & Tools

© Copyright 2016 Objective Insights, Inc. All Rights Reserved.
Services & Tools
• Forecasting & Forecast Modeling Tools – New product forecasts (patient-based, prescription-based) – Marketed product forecasts (patient-based, trend-based) – Market assessments – Epidemiology and patient dynamics/patient switch models – Buying Intensity Index™ (BII) – Improves trend-based forecasting
accuracy • Database and Epidemiology Analysis • Business/Problem Modeling • Business Development Deal Modeling • Pricing & Health Economics • Portfolio Analysis & Optimization
15

© Copyright 2016 Objective Insights, Inc. All Rights Reserved.
Forecasting
• Understanding the nature of the current and future market is essential to constructing your forecast – Patients
• Fundamental nature of disease – Disease incidence and prevalence, dynamics – Diagnosis and treatment rates
• What ultimately drives demand for your product? – Products
• Adoption rate, peak share, and erosion governed by: – Product characteristics – Competition from other products or substitutes – Level of unmet need – Other customer influences (physicians, hospitals, labs, payers, patients)
• These factors can be estimated from market research and analogs
16
Services

© Copyright 2016 Objective Insights, Inc. All Rights Reserved.
Forecast Types
• We help you select the forecasting method appropriate to your product’s characteristics and situation:
– Trend-based forecast (Short-Term Forecaster™) • Product already marketed or to be launched into a well-
established market, forecast out to year 3 – Patient-based forecast (Long-Term Forecaster™, custom dynamics
models) • Market demand still evolving, longer-term forecast needed • Model can be structured using simpler sequential segmentation
approach where complexity of patient dynamics not needed • Patient dynamic models can be used where warranted by
nature of disease (stage, line of therapy, etc.)
17
Services

© Copyright 2016 Objective Insights, Inc. All Rights Reserved.
Patient Dynamics Forecasting
• Modeling objectives – Explore particularly complicated disease states in greater depth to
gain understanding of disease progression or treatment regimens – Understand and quantify patient subgroups
• Several approaches to modeling – Accounting approach, Markov process, system dynamics
• OI often implements the accounting approach – Easy to understand and follow in a spreadsheet model – Adequately captures patient dynamics – Tracks the number of patients in each treatment state
• For each time period, some patients move between states • Flow is one-directional over time
18
Services

© Copyright 2016 Objective Insights, Inc. All Rights Reserved.
“Simple” Dynamics Example
19
Services
ActiveDisease
PresentwithNHL
First-Line Therapy
RelapseTherapy
RefractoryTherapy
NoTherapy
DiseaseRemission
NoTherapy "Cured"
Death

20
Antiviral Dynamics Example

© Copyright 2016 Objective Insights, Inc. All Rights Reserved.
Patient Switch Modeling
• Variant of patient dynamics model for marketed products – Uses longitudinal claims data to identify patients new to market,
switching to/from brand, and discontinuing or renewing therapy • Avoids some of the assumption sensitivity of patient dynamics models
by using patient-driven data • Provides better understanding of market dynamics and direction
21
Services

© Copyright 2016 Objective Insights, Inc. All Rights Reserved.
Database & Epidemiology Analysis
• Objective Insights can help you determine disease and procedure epidemiology (incidence/prevalence), patient characteristics, and treatment patterns – Produces a better (more accurate, more defendable) forecast – Helps you focus company resources on the right patient segments
• Objective Insights has considerable experience working with various government health databases – National Center for Health Statistics (NHANES, N(H)AMCS, NHDS, NSAS)
• Similar to IMS NDTI (greater level of detail) • NHDS and NSAS capture non-office based treatments
– Agency for Healthcare Research & Quality (MEPS, MCBS, HCUP) • Expenditures and other data related to various health conditions
– Cancer epidemiology (SEER, GLOBOCAN) • We have also researched epidemiology in a number of therapeutic areas
– Sourced from medical literature, databases shown above, and other surveys
22
Services

© Copyright 2016 Objective Insights, Inc. All Rights Reserved.
Decision Analysis and Modeling
• We are experts at handling problems that are complex, unique, ill-defined, uncertain, difficult, multidimensional, and/or important – We address your problem with sophisticated analytical methods, creative
“out of the box” thinking, and years of experience in the health care market – Examples
• Developed game theory model to predict competitor behavior • Analyzed sales and contracting data to determine price elasticity for a
marketed product, informing future pricing and contracting strategy • Developed CMC planning model to illuminate and resolve the capacity
decision timeline prior to launch of new pharmaceutical • Analyzed contracting data to determine how contracting terms
affected accounts and developed criteria to identify the most productive accounts relative to terms offered
• Constructed decision model to guide company regulatory filing strategy in conjunction with forecasting project
23
Services

© Copyright 2016 Objective Insights, Inc. All Rights Reserved.
Objective Insights Tools
• We distilled our approaches for repeated analyses into OI Tools – Standardization results in greater sophistication and fewer errors
than fully custom models can deliver – OI Tools allow you to focus on the analysis, not building the model
• OI Tools can be customized to fit your company’s situation • Objective Insights can also provide assistance in populating and
operating the models
24
Tools

© Copyright 2016 Objective Insights, Inc. All Rights Reserved.
Long-Term Forecaster™
• Patient-based long-term P&L forecast model – Annual, quarterly, and monthly forecasts – Incorporates product deal terms, development timelines, and success
probabilities • Consistent, easy, powerful system
– Forecasts can be set up quickly without a lot of manual tweaking – Assumptions and calculations are easy to document and follow – Easily performs 'what-if' analyses – Monte Carlo simulation for risk analysis, replacing tedious and misleading
upside/downside cases – Forecasts for multiple indications, products, & geographies easily consolidated
and analyzed as a portfolio
25
Tools
Monthly, quarterly, & annual forecasts

© Copyright 2016 Objective Insights, Inc. All Rights Reserved.
Long-Term Forecaster™ Structure
26
Tools

© Copyright 2016 Objective Insights, Inc. All Rights Reserved.
LTF Assumption Entry
27
Tools
Assumption entry includes notes, manual overrides, and graphic display of assumption outcomes
Patients Diagnosed with Indication XYZ Section Last Updated: 8/25/16 4:20:49 PM by Brett V. Gaspers• Enter your numerical assumptions in this section about the proportion of the prevalent or incident patient population that is diagnosed.
2016 2017 2018 2019 2020 2021 2022 2023Initial Values 51% 52% 54% 55% 57% 58% 60% 61%
Override 57% 57%Final Values 51% 52% 54% 55% 57% 57% 57% 61%
Diagnosed Patients (000) 469 487 506 525 545 553 558 605Gross Revenues ($M) $0.0 $0.0 $0.0 $0.0 $0.0 $0.0 $0.0 $0.0
Click (+) to reveal monthly values, (-) to hide
Distribution RangeMonte Carlo Factor Low Most Likely High MC On? Override Present?
12 Diagnosed Patients 90% 100% 110% TRUE Yes
Use arrows to add (up) or Valuedelete (down) population 2016curve segments 50.0%
1065.0%
NotesDiagnosis rate increases as new genotypic assays are developedSource: judgment
ParameterStart Year
Start Value
End ValueElapsed Years
0%
10%
20%
30%
40%
50%
60%
70%
2016
2017
2018
2019
2020
2021
2022
2023
2024
2025
2026
2027
2028
2029
2030
2031
2032
2033
2034
2035
PatientsDiagnosedwithIndicationXYZ
Linear

© Copyright 2016 Objective Insights, Inc. All Rights Reserved.
LTF Lifecycle Entry
LTF lifecycle entry allows flexible definition of the lifecycle shape or can use pre-defined analogs
28
Tools
© Copyright 2016 Objective Insights, Inc. All Rights Reserved.
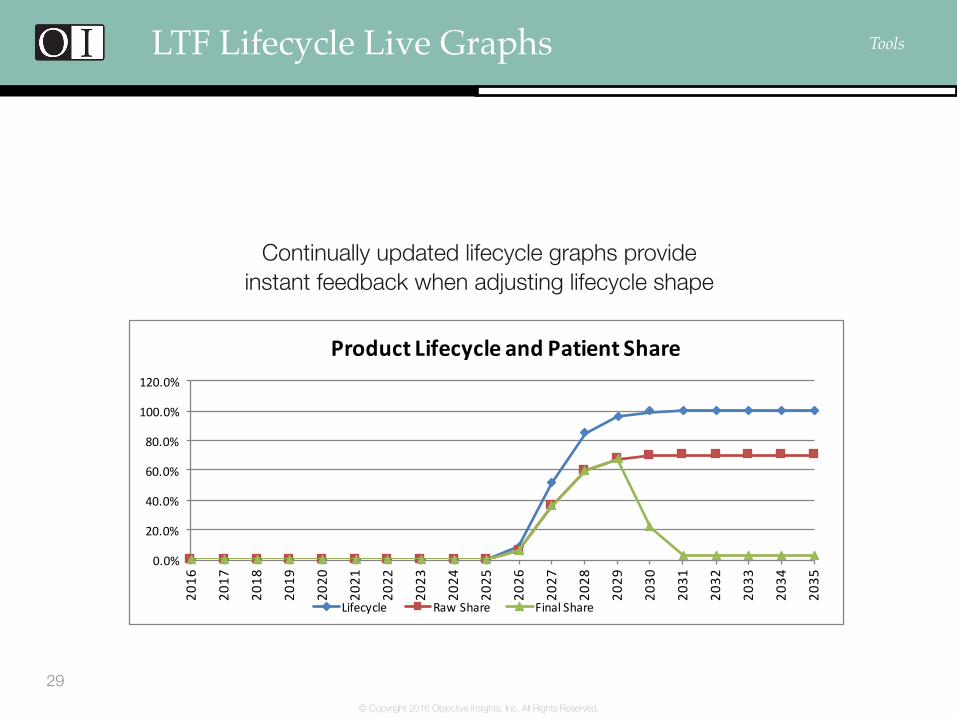
LTF Lifecycle Live Graphs
Continually updated lifecycle graphs provide instant feedback when adjusting lifecycle shape
29
Tools
0.0%
20.0%
40.0%
60.0%
80.0%
100.0%
120.0%
2016
2017
2018
2019
2020
2021
2022
2023
2024
2025
2026
2027
2028
2029
2030
2031
2032
2033
2034
2035
ProductLifecycleandPatientShare
Lifecycle RawShare FinalShare

© Copyright 2016 Objective Insights, Inc. All Rights Reserved.
LTF Competition
• LTF allows up to six competitors launching after your product – Includes specification of launch probability, competitor adoption
curve, and cannibalization pattern
30
Tools

© Copyright 2016 Objective Insights, Inc. All Rights Reserved.
LTF Events
• Events can be applied to individual products or all products in market – Events include probability and shape of event evolution
31
Tools
© Copyright 2016 Objective Insights, Inc. All Rights Reserved.
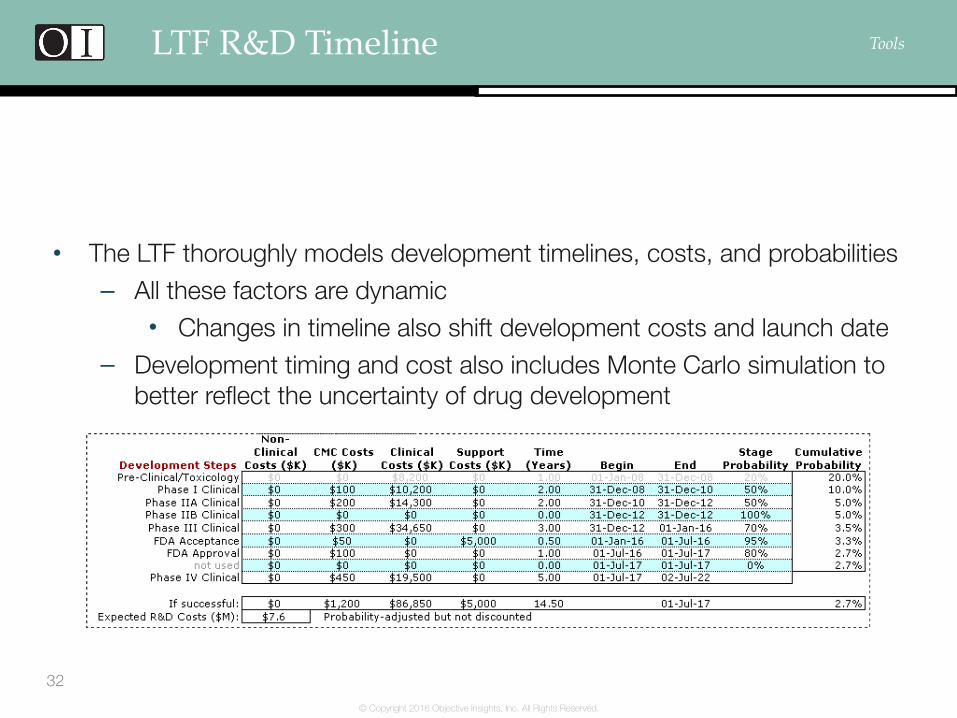
LTF R&D Timeline
• The LTF thoroughly models development timelines, costs, and probabilities – All these factors are dynamic
• Changes in timeline also shift development costs and launch date – Development timing and cost also includes Monte Carlo simulation to
better reflect the uncertainty of drug development
32
Tools
© Copyright 2016 Objective Insights, Inc. All Rights Reserved.
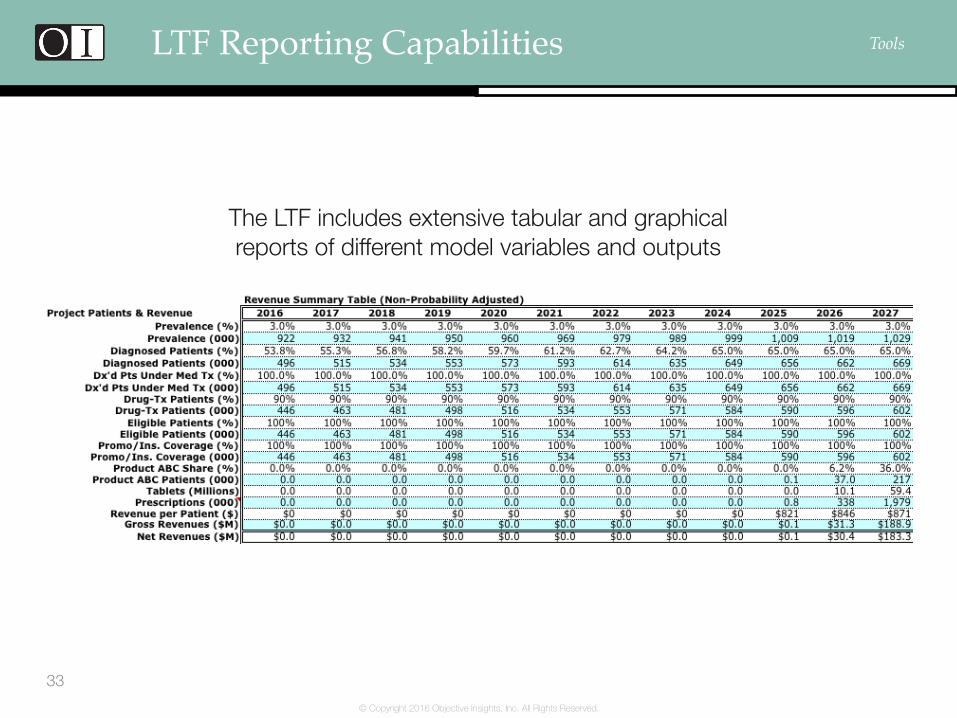
LTF Reporting Capabilities
The LTF includes extensive tabular and graphical reports of different model variables and outputs
33
Tools

© Copyright 2016 Objective Insights, Inc. All Rights Reserved.
LTF Assumption Reporting
The LTF provides a report to list all assumption notes entered in the model on a single page for easy reference
34
Tools
Model Notes Report Last Updated: 8/25/2016 4:24:07 PM
Input Page Variable Note
Patients per Year Diagnosed Patients Diagnosis rate increases as new genotypic assays are developedSource: judgment
Diagnosed Patients Seeking Medical Treatment All diagnosed patients seek treatmentEligible Patients Passthrough variable
Revenue per Patient Treatment Days per Year Chronic therapyDoses per Day QD dosingTablets Per Dose One tab per doseAdherence Assumes 75% compliance

Conclusion

© Copyright 2016 Objective Insights, Inc. All Rights Reserved.
Our Strengths
• Company principals work on all projects – Highly experienced in business analytics, healthcare industry background
• High value for quality work • We use powerful and time-tested analytical techniques
– Monte Carlo simulation (custom routine running in Excel models) – Statistical forecasting methods (exp. smoothing, ARIMA)
• Highly satisfied customers since 1994 – 80% of business is with repeat customers – 2009 customer survey showed:
• 85% of respondents said they would recommend OI to a colleague – Other 15% would recommend depending on the work needed
• Over 90% of respondents rated the value and quality of OI’s consulting services and models as good to excellent
36
Conclusion
“Simply an excellent choice for assistance” – OI client
© Copyright 2016 Objective Insights, Inc. All Rights Reserved.
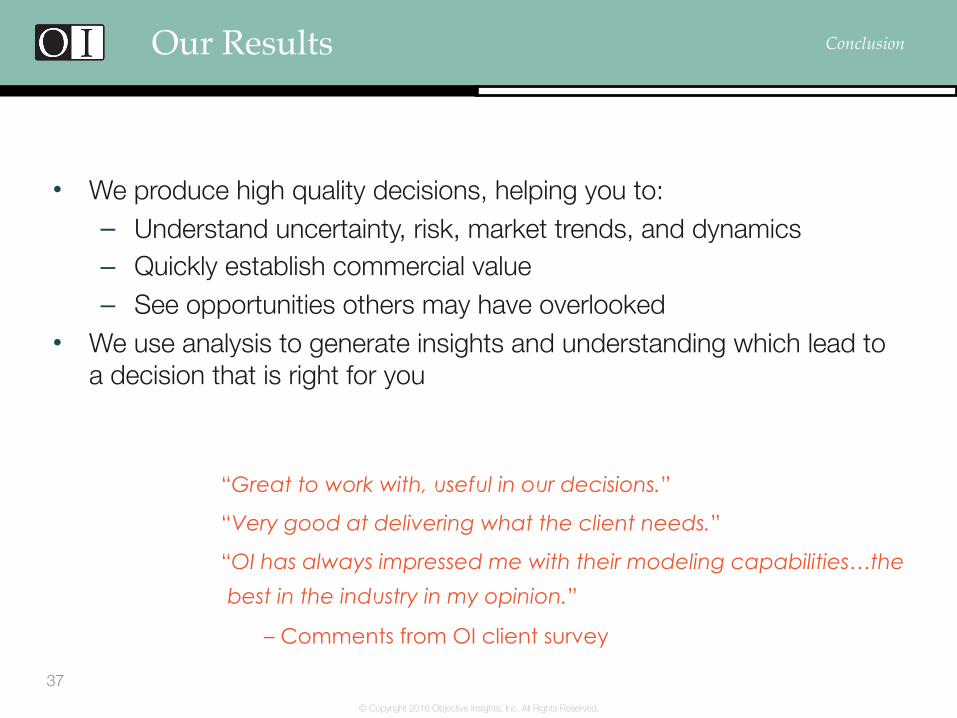
Our Results
• We produce high quality decisions, helping you to: – Understand uncertainty, risk, market trends, and dynamics – Quickly establish commercial value – See opportunities others may have overlooked
• We use analysis to generate insights and understanding which lead to a decision that is right for you
37
Conclusion
“Great to work with, useful in our decisions.”
“Very good at delivering what the client needs.”
“OI has always impressed me with their modeling capabilities…the
best in the industry in my opinion.”
– Comments from OI client survey
