object-oriented method to classify the land use and … · object-oriented method to classify the...
TRANSCRIPT

Object-Oriented Method to Classify the Land Use and Land Cover in San Antonio using eCognition Object-Oriented Image Analysis
Jayar S. Griffith
ES 6973
Remote Sensing Image Process and Analysis
Introduction According to the United States Census Bureau, San Antonio is the second fastest
growing city and eighth largest city in the United States. The advancement of high
resolution satellite and aerial imagery in conjunction with Object-Oriented Image
Analysis using eCognition software can be used to analyze the land use and land cover of
a region. Land Use refers to what people do on the land surface, such as agriculture,
commercial and residential development, and transportation (Jensen 2005). Land Cover
is the type of material present on the landscape. Materials such as water, different types
of vegetation, soil, and man-made materials like asphalt (Jensen 2005). This remote
sensing project will consist of using Object-Oriented method to classify the land use and
land cover in San Antonio. A workflow will be developed based on the eCognition
Object-Oriented Image Analysis for land use and land cover classification.
1

Data
Data to be used are high resolution (sub-meter to 1 meter) orthophotos of 1995,
2000, 2003, and 2004 of the San Antonio area. Imagery can downloaded from the City
of San Antonio Interactive Remote Sensing website at:
http://imageserver.sanantonio.gov. This remote sensing project will start with imagery of
a small region of San Antonio in 2003. During the data collection phase of this remote
sensing project, the required plug-ins used by the City of San Antonio Interactive Remote
Sensing website were unavailable due to administrative requirements in the University of
Texas at San Antonio Geospatial Analysis Lab. The data used for analysis is the Landsat
ETM+ image of San Antonio, ETMp27r40y01m7d21 (a subset of ETM+ image with
path27 row 40) from lab 3 of ES 5053 Remote Sensing class.
Methods
A better concept and understanding of Object Oriented Classification was
explained in Lecture 10 ES 6974 Remote Sensing Image Processing and Analysis (Xie
2005). During this lecture, a more detailed example of a workflow used in eCognition by
Laliberte et al. 2004 Remote Sensing Environment and a workflow based on a paper by
Mansor, Hong, and Shariff (Object Oriented Classification for Land Cover Mapping) was
used in this project. Object-oriented image analysis is divided into three steps:
Multiresolution Segmentation, Create General Classes, and Classification Rules. During
the first step, image segments are defined and calculated. Parameters are defined by the
2
user for the scale, spectral properties and shape properties. These image segments have
to be calculated on several hierarchical levels in a “trial and error” process to result in
final image segments to represent single objects of interest (Moeller et al. 2004).
The organization of the workflow is as follows: 1) Input images, 2) Multiresolution
segmentation, 3) Image object hierarchy, 4) Creation of class hierarchy, 5) Classification
using Training samples and standard nearest neighbor, 6) Classification base
segmentation, 7) Repeat steps for best result, and 8) Final merge classification (Laliberte
et al. 2004).
With an example workflow to follow, familiarity of the eCognition software is the
next step. eCognition software is loaded with practice tutorials to understand the basics
of the eCognition software and its tools. The first tutorials show how to load and display
raster data, perform image segmentation, create a simple class hierarchy, insert the
nearest neighbor classifier into the class description, classify, and perform classification
quality assessment. Analysis using the San Antonio Landsat ETM+ image
(ETMp27r40y01m7d21) was used and followed the first tutorial (Tour 1: Landsat TM
subset of Orange County (California, USA) eCognition User Guide 2000-2004).
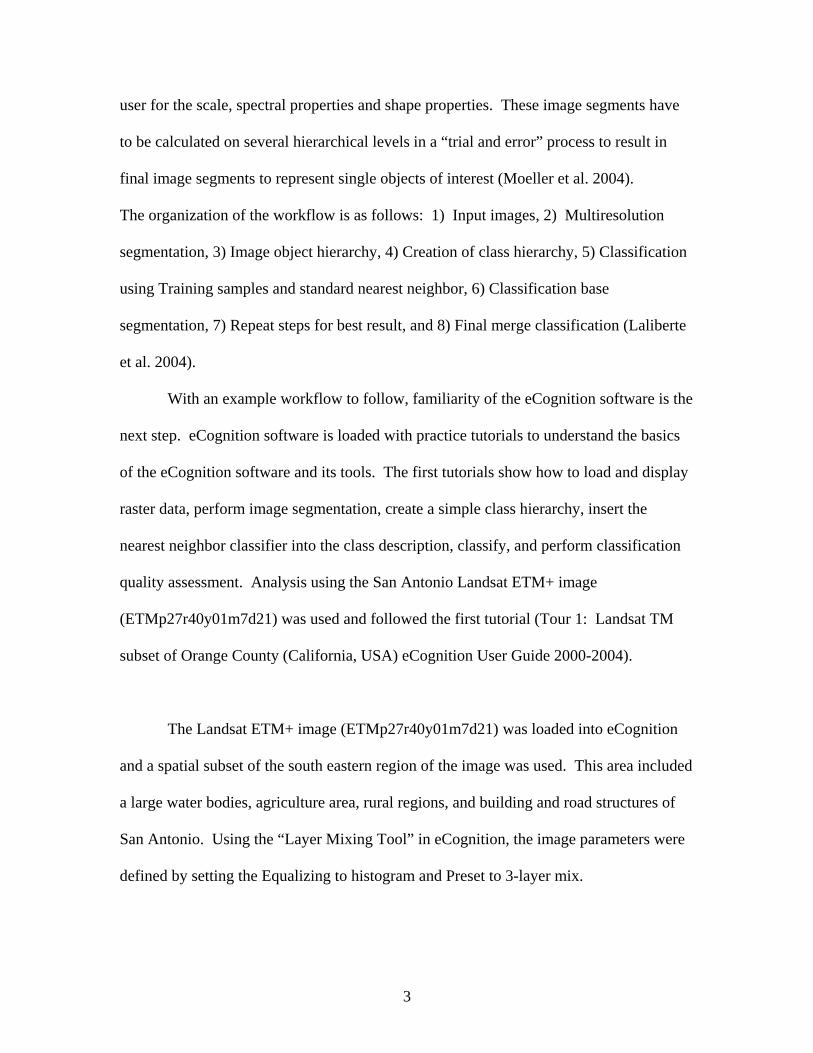
The Landsat ETM+ image (ETMp27r40y01m7d21) was loaded into eCognition
and a spatial subset of the south eastern region of the image was used. This area included
a large water bodies, agriculture area, rural regions, and building and road structures of
San Antonio. Using the “Layer Mixing Tool” in eCognition, the image parameters were
defined by setting the Equalizing to histogram and Preset to 3-layer mix.
3

Figure 1. Original subset image
Following the workflow example, the second step is the multiresolution
segmentation. The segmentation parameters were defined. Layer weights were set to
equal to one, scale equal to 20, shape factor to 0.3, and color to 0.7, and compactness and
smoothness to 0.5. The scale parameter is an abstract value to determine the maximum
possible change of heterogeneity caused by fusing several objects. Color is the pixel
value. Shape includes compactness and smoothness which are two geometric features
that can be used as "evidence." Smoothness describes the similarity between the image
object borders and a perfect square. Compactness describes the "closeness" of pixels
clustered in an object by comparing it to a circle (Xie 2005, Lecture 10). After defining
the parameters, eCognition produces a new image with the new grouping of pixels.
The next step includes creating Class Hierarchy by creating and defining classes.
Four classes were created: Agriculture, Rural, Water, and Impervious Areas. These
4

classes will be defined in the next following steps. After creating the four classes, the
tutorial defines the type of classifier (nearest neighbor or membership functions).
Nearest neighbor classifier is used by using the Edit Standard Nearest Neighbor Feature
Space Tool. For each class, the Standard Nearest Neighbor Expression was inserted.
In order to define the four classes, Training Sites of known areas from the image
can be created. With the specific class activated, training sites can be selected by double
clicking on the polygon. Image object data for the selected polygon can be used. Nearest
neighbor classification in eCognition is similar to supervised classifications in
common image analysis software. You have to declare training areas, which are typical
representatives of a class. In eCognition such training areas are referred to as samples or
sample objects (Defeniens Imaging. eCognition User Guide. 2004).
Figure 2. Image object data for
Water
5

Multiple training sites for an each class were created. The following color scheme for
the training sites are:
Yellow (Agriculture),
Blue (Water), Red
(Impervious Areas), a
Green (Rural).
nd
Figure 3. Training Sites Selected
After the Training sites were selected, the image can be classified by the classes
defined.
Figure 4. Object
image classified by
Training sites
6

Figure 5.
Comparing
original image
versus Object
Image
classification
using Training
Sites.
Statistics
An accuracy assessment of was performed on the classification results. The best
classification result shows statistics of the training sites and classification description.
These statistics will allow you to compare which classes have the best classification
based on the preliminary results.
Figure 6. Best Classification Result
7

A confusion matrix of the training sites with the classification was produced. The
overall accuracy is 100% because this statistics based on the samples, not the final
classification. A more accurate statistic can be produced by reclassifying the classes and
defining the class hierarchy with known field data. The known field data trainings sites
will reclassify the image and produce better statistics.
Figure 7. Error Matrix based
on samples
8

Results
Final classification of the ETM+ image of San Antonio resulted in further
classification. The image created illustrated most impervious areas of the San Antonio
region well, but miss classified roads in certain areas. Water bodies had the highest
accuracy with the easiest classification. Further classifications of the rural and
agriculture areas are needed. Following the tutorial and no field data to compare with the
training sites will produce an inaccurate classification. The eCognition guided tour:
Landsat TM subset of Orange County (California, USA), was a good method to be
introduced to eCognition software. The tutorial demonstrated: 1) How to load and
display raster data, 2) Perform an image segmentation, 3) Insert the nearest neighbor
classifier into the class description, 4) Classify, and 5) Perform classification quality
assessment.
Further Study
Further practice is needed with the eCognition software. Tutorials are missing
some data or have been modified which affect the understanding of the software.
9

References
• Gitas, I. Z., Mitri, G. H., Ventura G., 2004. Object based image classification for
burned area mapping of Creus Cape, Spain, using NOAA-AVHRR Imagery.
Remote Sensing of Environment.
• Harold, M., Guenther, S., Clarke, C. C., 2003. Mapping Urban Areas in the Santa
Barbara South Coast using Ikonos data and eCognition. Vol.4/Nr. 1. Available
online at: http://www.definiens-imaging.com
• Laliberte, A. S., Rango, A., Havstad, K. M., Paris, J.F., Beck, R.F., McNelly, R.,
Gonzales, A. L., 2004. Object-oriented image analysis for mapping shrub
encroachment from 1937 to 2003 in southern New Mexico. Remote Sensing of
Environment
• Mansor, S., Wong, T.H., Shariff, Abdul R.M., Object Oriented Classification for
Land Cover Mapping. Available online at:
http://ww.gisdevelopment.net/application/environment
• Moeller, M.S., Stefanov, W.L., Netzband, 2004. Characterizing Land cover
changes in a Rapidly Growing Metropolitan Area Using Long Term Satellite
Imagery. ASPRS Annual Conference Proceedings
• Xie, 2005. ES6973 Lecture 10 Object Oriented Classification. Remote Sensing
Image Process and Analysis
• Definiens Imaging. 2004. User Guide 4. eCognition
10