object level hsi-lidar data fusion for automated … level hsi-lidar data fusion for automated...
TRANSCRIPT

Object level HSI-LIDAR data fusion for
automated detection of difficult targets
A. V. Kanaev,1,*
B. J. Daniel,1 J. G. Neumann,
1 A. M. Kim,
2 and K. R. Lee
2
1Naval Research Laboratory, 4555 Overlook Avenue, Washington, DC 20375, USA 2Naval Postgraduate School, 833 Dyer Road, Monterey, California 93950, USA
Abstract: Data fusion from disparate sensors significantly improves automated man-made target detection performance compared to that of just an individual sensor. In particular, it can solve hyperspectral imagery (HSI) detection problems pertaining to low-radiance man-made objects and objects in shadows. We present an algorithm that fuses HSI and LIDAR data for automated detection of man-made objects. LIDAR is used to define a set of potential targets based on physical dimensions, and HSI is then used to discriminate between man-made and natural objects. The discrimination technique is a novel HSI detection concept that uses an HSI detection score localization metric capable of distinguishing between wide-area score distributions inherent to natural objects and highly localized score distributions indicative of man-made targets. A typical man-made localization score was found to be around 0.5 compared to natural background typical localization scores being less than 0.1. @ 2011 Optical Society of America OCIS codes: (280.0280) Remote sensing and sensors; (280.4788) Optical sensing and sensors.
References and links
1. I. S. Reed and X. Yu, “Adaptive Multiple-Band CFAR Detection of an Optical Pattern with Unknown Spectral Distribution,” IEEE Trans. Acoust. Speech Signal Process. 38, 10 (1992).
2. D. W. J. Stein, S. C. Beaven, L. E. Hoff, E. W. Winter, A. P. Schaum, and A. D. Stocker, “Anomaly detection from hyperspectral imagery,” IEEE Signal Process. Mag. 19(1), 58–69 (2002).
3. D. Manolakis, “Taxonomy of detection algorithms for hyperspectral imaging applications,” Opt. Eng. 44(6), 066403 (2005).
4. A. V. Kanaev and J. Murray-Krezan, “Spectral anomaly detection in deep shadows,” Appl. Opt. 49(9), 1614–1622 (2010).
5. M. A. Kolodner, “Automated target detection system for hyperspectral imaging sensors,” Appl. Opt. 47(28), F61–F70 (2008).
6. M. S. Foster, J. R. Schott, D. W. Messinger, and R. Raqueno, “Use of Lidar data to geometrically-constrain radiance spaces for physics-based target detection,” Proc. SPIE 6661, 66610J (2007).
7. D. E. Bar, K. Wolowelsky, Y. Swirski, Z. Figov, A. Michaeli, Y. Vaynzof, Y. Abramovitz, A. Ben-Dov, O. Yaron, L. Weizman, and R. Adar, “Target Detection and Verification via Airborne Hyperspectral and High-Resolution Imagery Processing and Fusion,” IEEE Sens. J. 10(3), 707–711 (2010).
8. M. Dalponte, L. Bruzzone, and D. Gianelle, “Fusion of hyperspectral and LIDAR remote sensing data for classification of complex forest areas,” IEEE Trans. Geosci. Rem. Sens. 46(5), 1416–1427 (2008).
9. D. Borghys, M. Shimoni, and C. Perneel, “Change detection in urban scenes by fusion of SAR and hyperspectral data,” Proc. SPIE 6749, 67490R (2007).
10. S. Kraut, L. Scharf, and L. T. McWhorter, “Adaptive sub-space detectors,” IEEE Trans. Signal Process. 49(1), 1–16 (2001).
11. A. P. Schaum and A. D. Stocker, “Hyperspectral change detection and supervised matched filtering based on Covariance Equalization,” Proc. SPIE 5425, 77–90 (2004).
12. G. A. F. Seber, Multivariate Observations (John Wiley & Sons Inc., 1984). 13. MATLAB version R2011a. Natick, MA The MathWorks Inc., 2011. 14. F. Maes, A. Collignon, D. Vandermeulen, G. Marchal, and P. Suetens, “Multimodality image registration by
maximization of mutual information,” IEEE Trans. Med. Imaging 16(2), 187–198 (1997).
#148537 - $15.00 USD Received 2 Jun 2011; revised 9 Sep 2011; accepted 15 Sep 2011; published 6 Oct 2011(C) 2011 OSA 10 October 2011 / Vol. 19, No. 21 / OPTICS EXPRESS 20916

Report Documentation Page Form ApprovedOMB No. 0704-0188
Public reporting burden for the collection of information is estimated to average 1 hour per response, including the time for reviewing instructions, searching existing data sources, gathering andmaintaining the data needed, and completing and reviewing the collection of information. Send comments regarding this burden estimate or any other aspect of this collection of information,including suggestions for reducing this burden, to Washington Headquarters Services, Directorate for Information Operations and Reports, 1215 Jefferson Davis Highway, Suite 1204, ArlingtonVA 22202-4302. Respondents should be aware that notwithstanding any other provision of law, no person shall be subject to a penalty for failing to comply with a collection of information if itdoes not display a currently valid OMB control number.
1. REPORT DATE SEP 2011 2. REPORT TYPE
3. DATES COVERED 00-00-2011 to 00-00-2011
4. TITLE AND SUBTITLE Object level HSI-LIDAR data fusion for automated detection of difficult targets
5a. CONTRACT NUMBER
5b. GRANT NUMBER
5c. PROGRAM ELEMENT NUMBER
6. AUTHOR(S) 5d. PROJECT NUMBER
5e. TASK NUMBER
5f. WORK UNIT NUMBER
7. PERFORMING ORGANIZATION NAME(S) AND ADDRESS(ES) Naval Research Laboratory,4555 Overlook Avenue,Washington,DC,20375
8. PERFORMING ORGANIZATIONREPORT NUMBER
9. SPONSORING/MONITORING AGENCY NAME(S) AND ADDRESS(ES) 10. SPONSOR/MONITOR’S ACRONYM(S)
11. SPONSOR/MONITOR’S REPORT NUMBER(S)
12. DISTRIBUTION/AVAILABILITY STATEMENT Approved for public release; distribution unlimited
13. SUPPLEMENTARY NOTES
14. ABSTRACT Data fusion from disparate sensors significantly improves automated man-made target detectionperformance compared to that of just an individual sensor. In particular, it can solve hyperspectralimagery (HSI) detection problems pertaining to low-radiance man-made objects and objects in shadows.We present an algorithm that fuses HSI and LIDAR data for automated detection of man-made objects.LIDAR is used to define a set of potential targets based on physical dimensions, and HSI is then used todiscriminate between man-made and natural objects. The discrimination technique is a novel HSIdetection concept that uses an HSI detection score localization metric capable of distinguishing betweenwide-area score distributions inherent to natural objects and highly localized score distributions indicativeof man-made targets. A typical man-made localization score was found to be around 0.5 compared tonatural background typical localization scores being less than 0.1.
15. SUBJECT TERMS
16. SECURITY CLASSIFICATION OF: 17. LIMITATION OF ABSTRACT Same as
Report (SAR)
18. NUMBEROF PAGES
14
19a. NAME OFRESPONSIBLE PERSON
a. REPORT unclassified
b. ABSTRACT unclassified
c. THIS PAGE unclassified
Standard Form 298 (Rev. 8-98) Prescribed by ANSI Std Z39-18
1. Introduction
Modern remote sensing systems collect such vast amounts of information that techniques for automated detection of objects of interest are necessary to make full use of acquired data. Many techniques have been developed over the last several decades for target detection on a wide range of data types including radar, traditional visible and infrared imaging systems, multi- and hyperspectral imagers. Hyperspectral imagery (HSI) is well suited for automated detection, as a spectral signature is recorded for each pixel in a scene and can be exploited for this purpose. Spectral anomaly detection algorithms that do not require a priori information about targets of interest have been developed and used successfully to find man-made objects in natural environments. One of the most widely exploited algorithms is RX [1]. While its effectiveness for hyperspectral detection has been proven with numerous experiments [2,3], it is known that the algorithm fails for some artificial materials, especially in scenes with variable radiance conditions such as presence of shadows or dark objects [4]. Detection probability can be significantly improved if some a priori information about the target set is known. Many detection techniques are based on the unique spectral signature for a given man-made material. However, the inherent spectral property of material in the VNIR (visible & near-IR) is defined in terms of reflectivity while the data collected in the field is radiance. The conversion introduces many errors because of the uncertainty of atmospheric, weather, and illumination conditions as well as the uncertainty of the bidirectional reflectance distribution function [5,6]. As a consequence, there are no universal radiance-to-reflectance conversions that allow unfettered use of spectral signature libraries under diverse sensing conditions. False alarm rates continue to plague these detection algorithms.
One way to mitigate the high false alarm rate problem is the integration of multiple sensors of different types onto a single platform. Some multi-sensor platforms employ data fusion techniques which present the operator with data from each sensor as an overlay on top of a common map or use results from one sensor to cue the other. However, systems that use raw data from multiple sensors to produce a single decision for automated target detection through a joint decision making algorithm are less common. This is because data from different sensor types can be “orthogonal,” in the sense that the phenomenology that causes a response in one sensor may not cause response in a sensor of a different type. Smart fusion algorithms can use the data from various sensors to detect targets by exploiting various phenomena that cause unique responses for each sensor, but still correlate with the presence of an object of interest. An algorithm that uses multiple sets of data simultaneously can both increase the probability of detection and reduce the probability of false alarms. Previous work on HSI-LIDAR data fusion used LIDAR information to reduce the uncertainties in the geometric parameters of the radiance-to-reflectance conversion and subsequently apply the standard HSI algorithms [6]. Other examples of HSI fusion can be found in Ref [7]. where spatial information is used to classify results of spectral anomaly detection, in Ref [8]. where HSI and LIDAR are fused for forest classification, and in Ref [9]. where SAR and HSI are fused for urban change detection.
In this paper, we present an automated man-made target detection algorithm that processes data from an airborne hyperspectral imager collected nearly simultaneously with an airborne LIDAR system. In this approach, the LIDAR sensor remotely selects a wide class of objects that fit into a range of possible target physical dimensions that do not conform to the expected Earth’s surface. The spectral signature of each object is extracted and tested for uniqueness in the scene by computing the localization of its correlation score obtained with detection methods that include the spectral matched filter (MF) and the adaptive cosine/coherence estimator (ACE) [10]. This process uses both HSI and LIDAR information and allows for the targets to be discriminated from natural background elevations found by LIDAR. The novelty of the approach is a new concept of HSI target detection in which a signature based test is applied not for spectral detection per se but for determination whether
#148537 - $15.00 USD Received 2 Jun 2011; revised 9 Sep 2011; accepted 15 Sep 2011; published 6 Oct 2011(C) 2011 OSA 10 October 2011 / Vol. 19, No. 21 / OPTICS EXPRESS 20917

the given in situ derived signature belongs to a spectrally unique man-made object or natural background.
2. Automated target detection fusion algorithm
The task of the presented fusion algorithm is to detect targets that avoided detection by standard hyperspectral anomaly detection test (e.g. RX, subspace RX), and variations of these algorithms at a reasonable false alarm rate [1,2]. Indeed, if the object can be detected by hyperspectral means alone there is no point in adding another sensor.
Statistical anomaly detectors classify hyperspectral image pixels into either background or anomaly clusters. The measured vector of radiances X, for each image pixel, is tested against the anomaly criterion described by the pair of statistical hypotheses:
1
0
:: .
H X Tt nH X Bb
(1)
In Eq. (1) columns of the matrix T span a subspace <T>, which is assumed to contain all essential target-signature features described by unknown amplitudes t. The term n in Eq. (1) represents noise. B and b are quantities analogous to T and t, but pertaining to the background subspace <B>. The basic assumption is that only a few pixels satisfy hypothesis H1, i.e. the image scene represents rare anomalous pixels on vast natural background.
The generalized model of the background probability density function allows a multi-modal Gaussian distribution. The standard approach to modeling the background probability density function is a uni-modal multivariate Gaussian:
/2 1/2 11( ) (2 ) || || exp ( ) ( ) .2
JBp x C x C x
(2)
In M-dimensional space, the mean μ, and the covariance matrix C, maximum likelihood estimates are:
1
1
1
1 ( )( ) .
M
iiM
i ii
xM
C x xM
(3)
When the parameter t in Eq. (1) is unknown, the Generalized Likelihood Ratio (GLR) is used to test for the H0 versus H1 hypotheses:
:{ }{ } ,
( )
T
B
Max p x tt k
p x
(4)
which leads to the standard anomaly detector, referred to as RX [1]:
1( ) ( ) .x C x k
(5)
Here, the rare data pixels for which the test score exceeds the threshold value, k, are labeled as anomalous. The RX algorithm is based on an idealized mathematical model where the target distribution t is uniform throughout the entire hyperspectral space. However, this assumption does not strictly hold for real data; therefore, algorithm performance can be improved by taking into account empirical considerations about the target’s spectral
#148537 - $15.00 USD Received 2 Jun 2011; revised 9 Sep 2011; accepted 15 Sep 2011; published 6 Oct 2011(C) 2011 OSA 10 October 2011 / Vol. 19, No. 21 / OPTICS EXPRESS 20918
distribution. One accepted approach, called Subspace RX (SSRX), is to exclude the contribution of higher variance spectral dimensions into Eq. (5) [2].
If no prior information (i.e. spectral signature) about the target is known, man-made object detection is usually accomplished by employing spectral anomaly detection using variations of the RX test, such as SSRX described above. Detection can be significantly improved if a target’s spectral signature is known. If we assume the mean target signature is t, the GLR solution is a more selective decision surface than defined by Eq. (3). The resulting detection score s for pixel x, called the matched filter (MF), is
1( ) ( ) ( ) .s x t C x k
(6)
The corresponding decision surface is a hyperplane perpendicular to the vector (t-μ) C-1/2. A more sophisticated approach in signature based detection is ACE, which examines the
angle between the test pixel and the known signature [10], and is written as
1 2
1 1
[( ) ( )]( ) .( ) ( )( ) ( )
t C xs x kt C t x C x
(7)
The major obstacle for signature-based methods is that it is extremely difficult to relate a hyperspectral signature library (nominally reflectance) in the same units as the imagery (nominally radiance). Signatures derived in situ demonstrate confident and robust detection results but it is infeasible to build a varied library of spectral signatures for every sortie. Transitioning signatures from one imagery collection into another is possible using “covariance equalization,” however, it works only for closely related scenes with closely related illumination conditions [11].
An approach proposed in this work allows effective use of the in situ derived signatures for detection by obtaining a finite list of possible targets using another sensing modality with phenomenology different from HSI. The problem of detection is now transformed into a problem of classifying the in situ signature as a real target or a background. A straightforward candidate for the initial task of target selection list is LIDAR, which provides scene information “orthogonal” to HSI, namely it supplies the information about 3D spatial dimensions and locations as opposed to the pure spectral information of HSI.
A flow chart of an automated data fusion algorithm based on the presence of HSI and LIDAR data types designed to detect targets missed by standard HSI anomaly detector is displayed in Fig. 1. The fusion algorithm starts with the segmentation of LIDAR-derived digital elevation map (DEM) into background and elevation classes (Step 1). The elevation class is further filtered by defining limits that describe the three spatial dimensions of the desired target, which are used to separate a potential target set from the broader elevation class (Step 2). The spectral signature for each potential target in the set is then derived from the co-registered hyperspectral data cube (Step 3). An HSI detection test, such as ACE, is then performed using each potential target’s signature (Step 4). A localization metric is defined to determine the spatial distribution of the HSI detection test score (Step 5). Finally, a threshold is applied to the localization values and targets are declared (Step 6). The remainder of this section describes the algorithmic steps in detail.
#148537 - $15.00 USD Received 2 Jun 2011; revised 9 Sep 2011; accepted 15 Sep 2011; published 6 Oct 2011(C) 2011 OSA 10 October 2011 / Vol. 19, No. 21 / OPTICS EXPRESS 20919

Fig. 1. Flow chart of HSI_LIDAR fusion algorithm.
DEM segmentation serves for separation of ground elevations from the background producing a binary output image (Step 1). Two competing factors determine the choice of segmentation method: the need to eliminate the inherent graininess of LIDAR data (for example pixels where the laser penetrates canopy) and the requirement to resolve objects with the minimal number of pixels on target. Computationally fast segmentation can be achieved using multi-dimensional clustering in which every input dimension represents the DEM image convolved with a different window size entropy filter,
2log ,j k kk
I I I
(8)
where Ij is intensity of jth pixel and Ω is its square neighborhood. Entropy filtering produces smooth LIDAR images while the choice of filter window sizes provides an approximate resolution scale. To preserve the maximum of the original DEM resolution, the first dimension data is produced by using a minimal window size of 3 pixels. As common practice, the filter window scale is approximately doubled for the each subsequent dimension. Using as few as two dimensions while employing the K-means clustering algorithm [12] leads to satisfactory segmentation results.
The segmented binary DEM displays all ground elevations present in the scene. Regions of connected elevation pixels are labeled using 8-pixel connectivity [13]. The resulting label map of all objects present on the scene allows for empirical discrimination of potential targets by height and size (Step 2). The initial discrimination, while conveniently narrowing down the number of possible targets providing a speed up to the detection process, is not an essential feature of the fusion process. In principle, it can be omitted depending on the allowed power draw of the computer running the detection algorithms and the time available
#148537 - $15.00 USD Received 2 Jun 2011; revised 9 Sep 2011; accepted 15 Sep 2011; published 6 Oct 2011(C) 2011 OSA 10 October 2011 / Vol. 19, No. 21 / OPTICS EXPRESS 20920
for computation. The only necessary condition to be satisfied is that the combined area of all potential targets is significantly smaller than the background area.
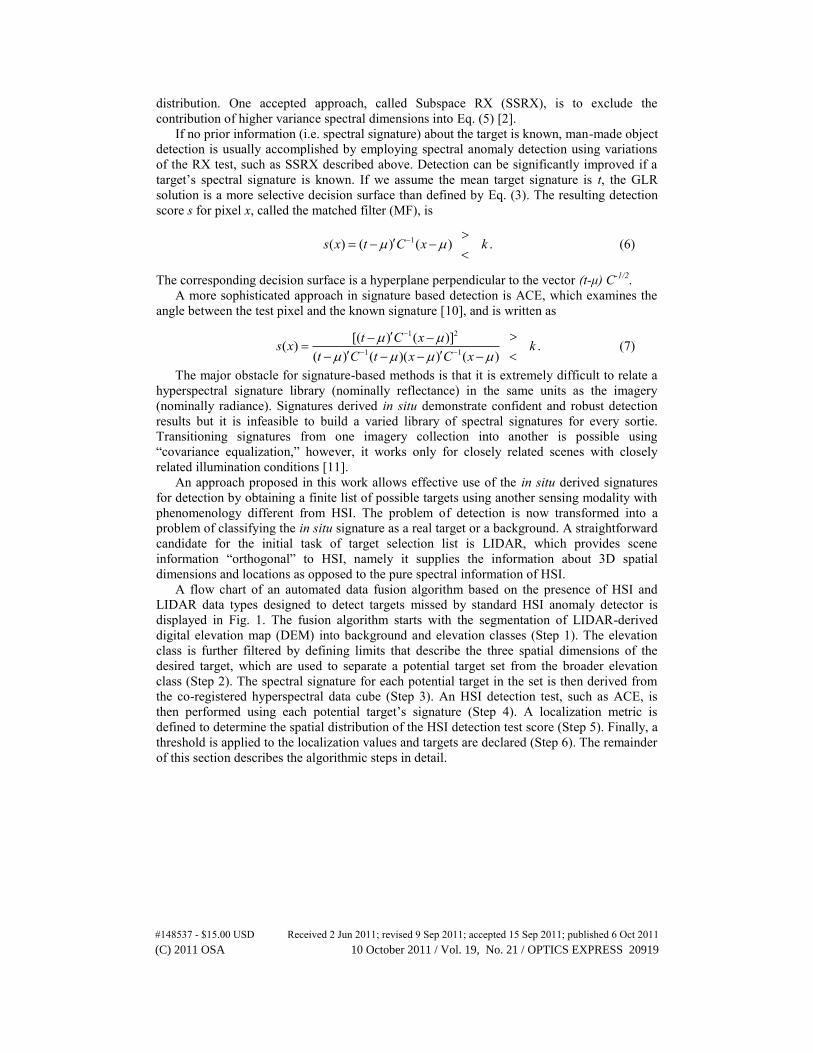
DEM detection produces a set of objects allowing for their spectral signatures to be derived in situ (Step 3) and tasking HSI data analysis to determine which of the objects are targets (i.e. man-made materials) and which objects consist of natural background, such as bushes, trees, or localized ground elevations. The object spectrum is best represented by the mean of several pixels around the centroid of each object. Using too few pixels subjects the signature to noise constraints, and using too many pixels increases the probability of the inclusion of a mixed pixel or background pixel due to registration errors.
Fig. 2. Georegistered false color RGB representation (red - 1032 nm, green - 1220 nm, and blue - 1570 nm) of HSI cube containing 83 bands (a); georegistered DEM of the same area generated from first return LIDAR data (b).
Each of the in situ derived signatures is used for HSI signature based detection (Step 4). A detection score is defined for every pixel of the image, and it represents a measure of how closely each pixel’s spectrum is related to the test signature.
It is implied that the RX test alone cannot detect any of the targets based on the spectral anomaly hypothesis. In this situation, instead of invoking the spectral anomaly property of the target spectral signature, another underlying assumption of HSI detection can be used for target discrimination. As stated in the statistical hypothesis of Eq. (1) manmade object pixels are expected to be rare in a vast natural background. This means that pixels containing the spectrum of a real target have a low probability of being found anywhere outside the target location. On the other hand pixels with the spectral content of natural background are likely to be found anywhere within the imaged scene. Note that rareness of a pixel spectrum can be considered to some degree as a measure of its spectral anomalousness. However, there is no contradiction as difficult-to-detect target pixels can be non-anomalous in the RX anomaly detection sense and at the same time can be rare as they are discriminated from background by more selective signature based detection.
The spatial distribution of the detection score over the imaged scene is characterized by the localization metric. It uses potential target location and shape information provided by the DEM (Step 5). The metric of the score localization L can be introduced in numerous ways, but the most straightforward approach followed in this work considers the ratio of the score inside the object’s boundaries to the overall score of the image,
2
2
( ),
( )OBJECT
IMAGE
s x d xL
s x d x
(9)
#148537 - $15.00 USD Received 2 Jun 2011; revised 9 Sep 2011; accepted 15 Sep 2011; published 6 Oct 2011(C) 2011 OSA 10 October 2011 / Vol. 19, No. 21 / OPTICS EXPRESS 20921

where ΩOBJECT signifies integration over the area inside the test object boundaries and ΩIMAGE signifies integration over the entire image. Before the integration the detection score is thresholded for noise reduction such that any value below one half of the maximum value is discarded. If the localization score is close to one, it is likely a target. If the localization score is much less than one, it is likely a background.
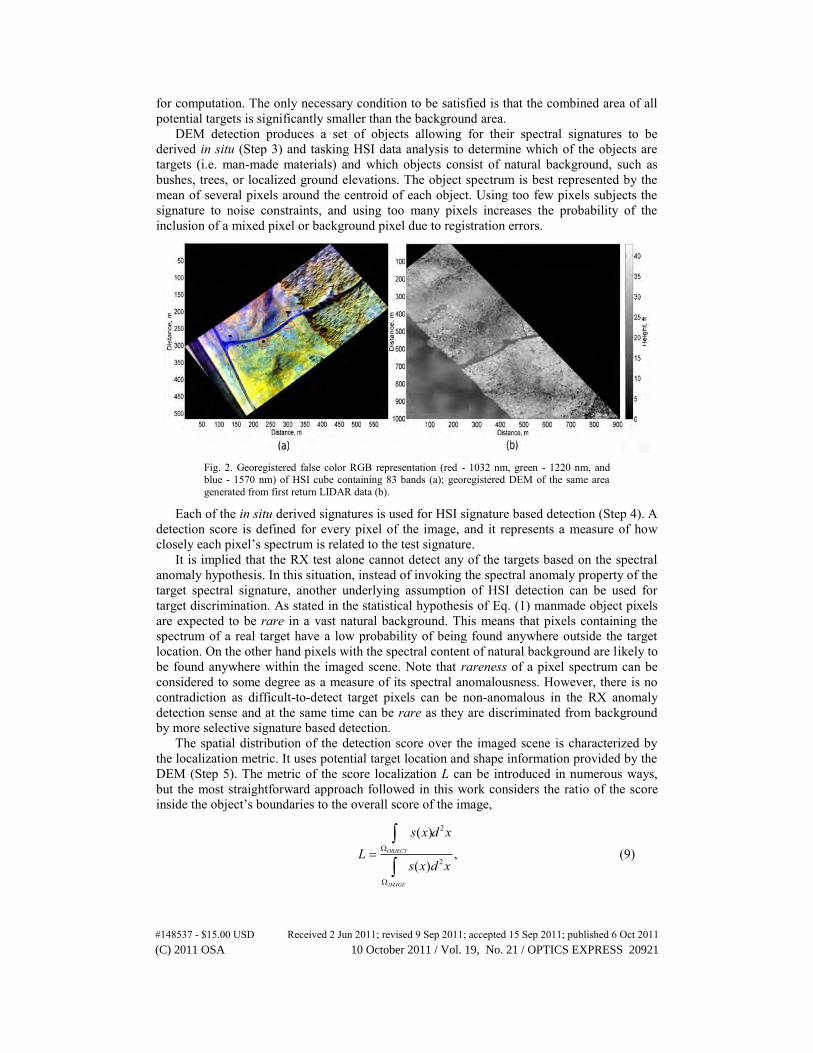
Fig. 3. Co-registered HSI cube and DEM.
One special case that needs to be taken into account is the presence of multiple targets with similar spectral properties which would penalize the localization ratio incorrectly. To avoid this effect, integration inside a single object’s boundary is replaced by integration inside the boundaries of all potential targets determined by the LIDAR discrimination. A potential increase in false alarm rate due to possible localization enhancement for false targets is negligible if the overall potential target area is a small fraction of the background.
3. Experiments and results
The presented fusion algorithm depends on the presence of two input data types, namely a hyperspectral data cube and the LIDAR generated digital elevation map. Ideally all data would be generated nearly simultaneously from the same platform. However, that kind of data is rare due to the formidable task of building such a conforming suite of sensors. Anticipating this sensor architecture's availability in the future, we use HSI and LIDAR data obtained from two different platforms on the same day over the same site. False color RGB representation of HSI data and DEM generated from the first LIDAR return are displayed on Figs. 2a-b. The false color image on Fig. 2a is formed by taking three hyperspectral bands to represent red, green, and blue resulting in two-dimensional color image representation of the HSI cube containing 83 bands spanning 0.9-1.7μm wavelengths. In this case, the three false color bands are located at 1032nm, 1220nm, and 1570 nm respectively. The choice of the first LIDAR return arises from the fusion algorithm logic which stipulates that both sensors must observe the same surface. Other LIDAR returns are able to penetrate canopy and sense surfaces mostly inaccessible to passive hyperspectral imagery.
The data were collected in the mid-Atlantic region of the United States during the spring. The vegetation includes trees, shrubs, and grasses naturally occurring in the region. The site consists of two primary backgrounds - a forest and a grassy field which are crossed by a road. Various spectrally different manmade objects including raised panels and vehicle were placed along the road.
One difficulty arising from using separate platforms is the co-registration of the data due to the HSI and LIDAR line-of-sight difference. In the ideal case of single platform collection,
#148537 - $15.00 USD Received 2 Jun 2011; revised 9 Sep 2011; accepted 15 Sep 2011; published 6 Oct 2011(C) 2011 OSA 10 October 2011 / Vol. 19, No. 21 / OPTICS EXPRESS 20922
HSI-LIDAR registration can be performed using pointing metadata or by utilizing known multi-modality image registration techniques such as the “maximization of mutual information” algorithm [14]. In this work, geo-rectification based on line of sight metadata from both data modalities serves as an initial registration stage. It is followed by a finer registration step involving tie points which are set at the location of three targets (three red ellipses on Fig. 2a), resulting in a co-registered HSI cube and DEM. All data are interpolated to the same ground resolvable distance (GRD) of 0.5m. Figure 3 shows the HSI data cube overlapping the LIDAR first return, on an Earth referenced grid.
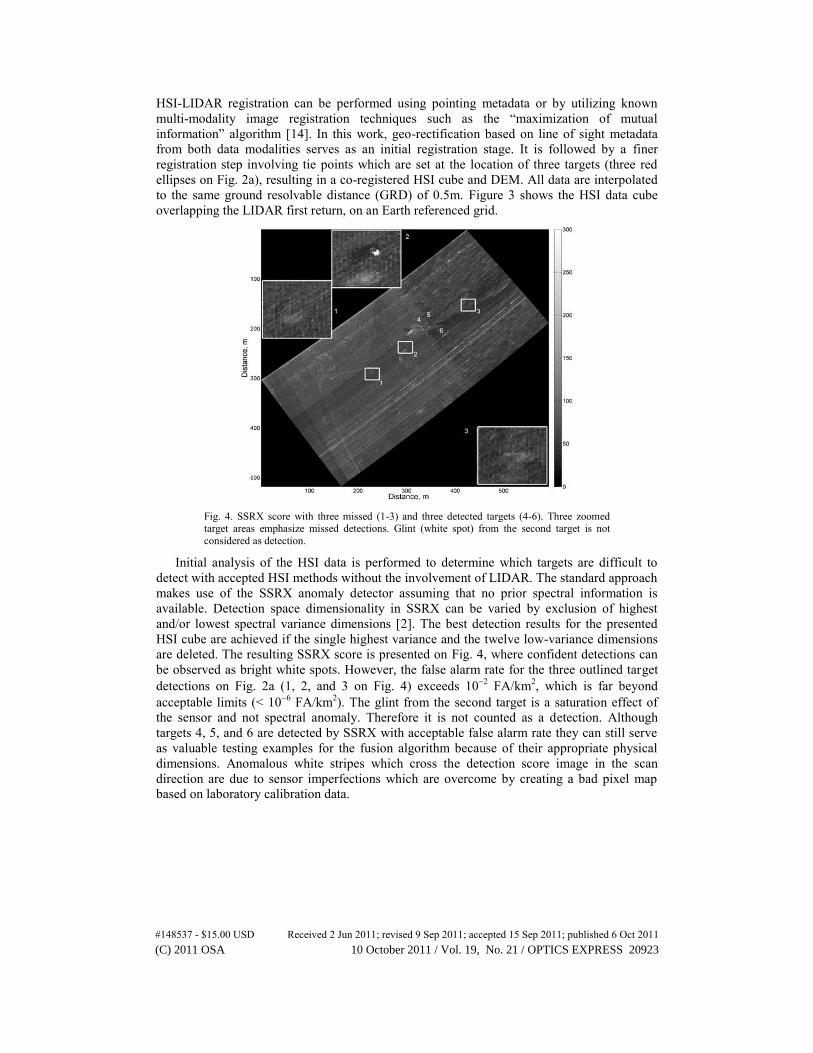
Fig. 4. SSRX score with three missed (1-3) and three detected targets (4-6). Three zoomed target areas emphasize missed detections. Glint (white spot) from the second target is not considered as detection.
Initial analysis of the HSI data is performed to determine which targets are difficult to detect with accepted HSI methods without the involvement of LIDAR. The standard approach makes use of the SSRX anomaly detector assuming that no prior spectral information is available. Detection space dimensionality in SSRX can be varied by exclusion of highest and/or lowest spectral variance dimensions [2]. The best detection results for the presented HSI cube are achieved if the single highest variance and the twelve low-variance dimensions are deleted. The resulting SSRX score is presented on Fig. 4, where confident detections can be observed as bright white spots. However, the false alarm rate for the three outlined target detections on Fig. 2a (1, 2, and 3 on Fig. 4) exceeds 102 FA/km2, which is far beyond acceptable limits (< 106 FA/km2). The glint from the second target is a saturation effect of the sensor and not spectral anomaly. Therefore it is not counted as a detection. Although targets 4, 5, and 6 are detected by SSRX with acceptable false alarm rate they can still serve as valuable testing examples for the fusion algorithm because of their appropriate physical dimensions. Anomalous white stripes which cross the detection score image in the scan direction are due to sensor imperfections which are overcome by creating a bad pixel map based on laboratory calibration data.
#148537 - $15.00 USD Received 2 Jun 2011; revised 9 Sep 2011; accepted 15 Sep 2011; published 6 Oct 2011(C) 2011 OSA 10 October 2011 / Vol. 19, No. 21 / OPTICS EXPRESS 20923

Fig. 5. Binary segmented DEM obtained by k-means clustering of entropy filtered images. Twelve objects which satisfy possible physical target dimensions are detected.
Data fusion of the HSI and LIDAR data is implemented according to the algorithmic steps described in Section 2. The LIDAR derived DEM is convolved with two entropy filters with 3 and 7 pixel windows resulting in relatively smooth images. These images are used as two input dimensions into the binary k-means clustering algorithm, separating background from elevations. The resulting segmented DEM is displayed in Fig. 5. All elevations are labeled and each elevation’s height and area are determined. Potential targets are declared for objects that have an area in the range of 7.5m2 to 75m2 and height between 3m and 5m measured from the mean background elevation. Once this discrimination is applied, twelve objects remain on the DEM as potential targets (Fig. 5). Of the twelve, three are actual targets that are missed by SSRX (1-3), three are actual targets that are detected by SSRX (4-6), and six objects are background locations where the elevation satisfies the area and height criteria (7-12, false alarms). The twelve objects are projected into the same coordinate space as the HSI cube.
#148537 - $15.00 USD Received 2 Jun 2011; revised 9 Sep 2011; accepted 15 Sep 2011; published 6 Oct 2011(C) 2011 OSA 10 October 2011 / Vol. 19, No. 21 / OPTICS EXPRESS 20924

Fig. 6. Example scores obtained by using signatures of two DEM detected objects: a) background elevation signature used in ACE b) target signature used in ACE c) background elevation signature used in MF d) target signature used in MF.
As mentioned in Section 2 in situ spectral signature derivation from an HSI cube is subject to tradeoff between noise reduction and increased probability of spectral mixing. This work settled on a four pixel average centered on the centroid of each object. Generally, this value will depend on the GRD of the HSI and LIDAR sensors.
#148537 - $15.00 USD Received 2 Jun 2011; revised 9 Sep 2011; accepted 15 Sep 2011; published 6 Oct 2011(C) 2011 OSA 10 October 2011 / Vol. 19, No. 21 / OPTICS EXPRESS 20925

Fig. 7. ACE and MF score localization values for twelve objects in the scene. 1-6 denote targets and 7-12 denote background elevations.
Next, the proposed algorithm is implemented by testing the entire scene against the spectrum of the 12 proposed targets with hyperspectral detection algorithms, in order to assess the rarity of the targets, and then classify the 12 as either part of the background or a target of interest. Two signature based detection algorithms, ACE and MF, are applied to the HSI data. Typical scores for each test are shown in Figs. 6a-d for two distinct cases: the first is natural background elevation (#12) (Figs. 6a and 6c) and the second is a real target (#2) (Figs. 6b and 6d). As expected, the tests with natural background spectral signature input exhibit detection scores distributed over a wide extent. There is some concentration of the test scores along the scanning line as observed on Figs. 6b and 6d due to small individual imperfections inherent to each focal plane array pixel. In contrast, detection scores of the man-made object’s spectral signature input are concentrated within the boundaries of the object. A detection plane comparison of the two algorithms shows selectivity is better with ACE compared to MF.
#148537 - $15.00 USD Received 2 Jun 2011; revised 9 Sep 2011; accepted 15 Sep 2011; published 6 Oct 2011(C) 2011 OSA 10 October 2011 / Vol. 19, No. 21 / OPTICS EXPRESS 20926

Fig. 8. Co-registered HSI cube and DEM. Dark target is outlined by ellipse.
The qualitative observation that the man-made material detection results are more localized than the natural background are made quantitative by computing the score localization according to Eq. (9). Figure 7 displays the result of the ACE and MF score localization calculations and reflects the robust ability of ACE to discriminate man-made materials from background. The lowest ACE score localization value for a target (object 4 on Fig. 7) is above 0.3 while the highest ACE score localization value for a background elevation is below 0.1 (object 6 on Fig. 7) leaving considerable room for separation between actual targets and background. This separation enables false alarm free detection of all six targets. MF test results fail for two targets (objects 1 and 4 on Fig. 7). This deficiency is the result of ACE’s higher selectivity compared to that of MF. In high-dimensional spectral space, the ACE target decision volume is defined by a hyper-cone stemming from the mean of the background which is smaller than the MF target decision volume defined by a hyper-plane. Lower score localization values of both algorithms for targets 4-6 are attributed to errors in registration, which is performed using tie points at targets 1-3. Their relatively small size (compared to the first three targets) only accentuates the problem.
#148537 - $15.00 USD Received 2 Jun 2011; revised 9 Sep 2011; accepted 15 Sep 2011; published 6 Oct 2011(C) 2011 OSA 10 October 2011 / Vol. 19, No. 21 / OPTICS EXPRESS 20927
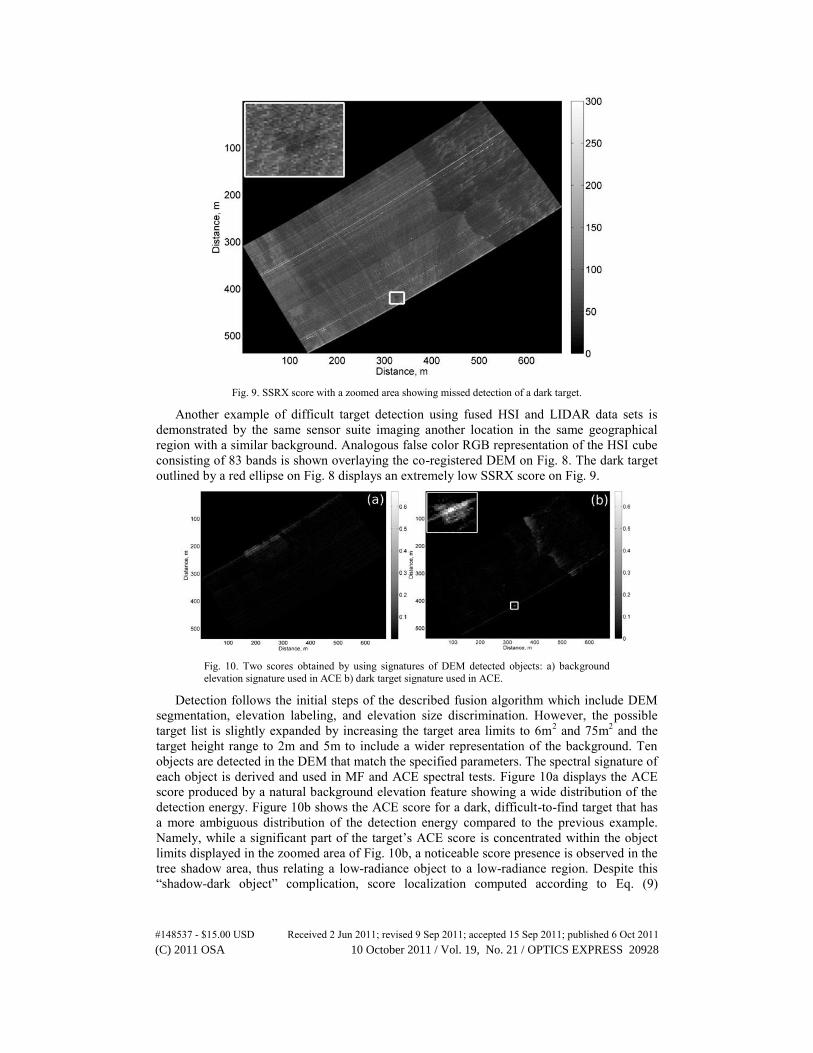
Fig. 9. SSRX score with a zoomed area showing missed detection of a dark target.
Another example of difficult target detection using fused HSI and LIDAR data sets is demonstrated by the same sensor suite imaging another location in the same geographical region with a similar background. Analogous false color RGB representation of the HSI cube consisting of 83 bands is shown overlaying the co-registered DEM on Fig. 8. The dark target outlined by a red ellipse on Fig. 8 displays an extremely low SSRX score on Fig. 9.
Fig. 10. Two scores obtained by using signatures of DEM detected objects: a) background elevation signature used in ACE b) dark target signature used in ACE.
Detection follows the initial steps of the described fusion algorithm which include DEM segmentation, elevation labeling, and elevation size discrimination. However, the possible target list is slightly expanded by increasing the target area limits to 6m2 and 75m2 and the target height range to 2m and 5m to include a wider representation of the background. Ten objects are detected in the DEM that match the specified parameters. The spectral signature of each object is derived and used in MF and ACE spectral tests. Figure 10a displays the ACE score produced by a natural background elevation feature showing a wide distribution of the detection energy. Figure 10b shows the ACE score for a dark, difficult-to-find target that has a more ambiguous distribution of the detection energy compared to the previous example. Namely, while a significant part of the target’s ACE score is concentrated within the object limits displayed in the zoomed area of Fig. 10b, a noticeable score presence is observed in the tree shadow area, thus relating a low-radiance object to a low-radiance region. Despite this “shadow-dark object” complication, score localization computed according to Eq. (9)
#148537 - $15.00 USD Received 2 Jun 2011; revised 9 Sep 2011; accepted 15 Sep 2011; published 6 Oct 2011(C) 2011 OSA 10 October 2011 / Vol. 19, No. 21 / OPTICS EXPRESS 20928

provides confident separation between the real target and background, as shown in Fig. 11. The real target has an ACE score localization of 0.21, which shows perfect separability from all background elevations with all localization values of 0.05 or below. MF performance in this case is satisfactory but inferior to performance of ACE.
In general, experiments show that robust discrimination between natural background objects and difficult to detect man-made targets is achievable using ACE score localization. The data and analysis presented here demonstrate that a typical natural background ACE score localization value stays below 0.1, and a typical target ACE score localization value exceeds 0.2 in the most difficult case and is about 0.5 in general. Although these exact values can depend on the type and quality of HSI sensor employed and GRD, they can be readily recalibrated for any specific circumstances.
Fig. 11. Score localization values for ten objects in the scene using MF and ACE. 1 - denotes dark target, 2-10 - denote background objects.
4. Summary
An HSI-LIDAR data fusion algorithm providing automated detection of difficult to detect man-made materials is presented. The introduced approach to data fusion starts with a list of potential targets based on the physical dimensions of objects derived from LIDAR data and proceeds with subsequent spectral signature testing of each object. The novel concept of “signature testing” based on HSI detection methods is employed to discriminate man-made targets from natural background objects. The concept exploits the rareness of a man-made material spectral signature within natural background by using the signature test score localization metric, where the HSI signature test results are correlated with spatial information provided by DEM. Experimental detection of targets missed by standard anomaly detection is demonstrated with the ACE test score localization value. The factors affecting the data fusion algorithm performance such as registration accuracy, variable radiance conditions of the imaged scene, and relative utilization of ACE versus MF have been discussed.
It's important to note that the introduced data fusion concept is not limited to just the HSI-LIDAR regimes. In fact, any sensor that is capable of providing an HSI imager with locations of possible targets and approximate target dimensions, for example synthetic aperture radar, or stereo imaging, can be used.
#148537 - $15.00 USD Received 2 Jun 2011; revised 9 Sep 2011; accepted 15 Sep 2011; published 6 Oct 2011(C) 2011 OSA 10 October 2011 / Vol. 19, No. 21 / OPTICS EXPRESS 20929