object detection in 3d scenes using cnns in multi-view imagesobject detection in 3d scenes using...
TRANSCRIPT

Object Detection in 3D Scenes Using CNNs in Multi-view Images
Ruizhongtai (Charles) QiDepartment of Electrical Engineering
Stanford [email protected]
Abstract
Semantic understanding in 3D scenes will become an im-portant topic for future VR and AR applications. Our workexplores object detection in 3D scenes. Instead of follow-ing traditional methods that directly detect objects in 3Dwith hand-crafted features and assumptions that 3D mod-els exist for observed objects, we lift 2D detection results inmulti-view images to a common 3D space. By taking ad-vantage of the state-of-the-art CNN (Convolutional NerualNets) detectors and aggreate information from hundreds offrames in 3D, we can robustly detect objects and generate aheat map showing probabilities of object existence in eachspatial location.
1. IntroductionRecently, we have witnessed a lot of industrial momen-
tum in commercializing virtual reality and augmented real-ity. Head mounted devices (HMD) like Microsoft HoloLensare expected to have huge impacts in entertainment, de-sign and medical treatment. While a lot of R&D focus ison low-level computer vision (e.g. localization, reconstruc-tion) and optics design, we believe for powerful future VRand AR applications, semantic understanding of 3D envi-ronment will play a very important role.
Without semantic understanding, the computer gener-ated world is actually separate from the real world. Tosupport interaction of the objects/agents from both worlds,computer needs to assign “meanings” to the pixels andpoints. For example, to create a ball rolling in a room, wehave to know where the floor is. If we want to create a vir-tual character sitting beside us on a sofa, we have to knowwhere the sofa is in the room and which part of it is for sit-ting. If we want to make a horror movie in AR to have aghost coming out from a screen, the algorithm should fig-ure out whether there are any monitors in the room. All ofthese applications require semantic understanding.
It’s easy for the virtual world since everything is gen-erated and all its properties (like category, shape, material
3D semantic heat map
Figure 2. Our algorithm can generate a semantic heat map of a 3Dscene (only points in voxels above a score threshold are shown).Left: point cloud of an office room. Right: semantic heat mapshowing three categories, where monitors are in red, chairs ingreen and sofas in blue. The heat map can enable instance seg-mentation, 3D bounding box detection and 3D/2D alignment.
etc.) are known, while it can be very challenging for thereal world. This project will focus on how to give meaningsto real data, i.e. to fill the semantic gap. Specifically, wewant to achieve object detection in 3D scenes.
While traditional object detection algorithms are avail-able for RGB images, they are not robust enough and can-not directly be applied to 3D cases. On the other side,mainstream object recognition methods on point clouds arenot data-driven. Usually, keypoint detection (using hand-crafted features), RANSAC and ICP methods are used andthey rely heavily on the assumption that a very similarmodel or point cloud to the object in real scene is avail-able, which is usually not the case for generic scenes. Ourmethod will avoid drawbacks of these two approaches buttake their strengths. We use an approch that takes ad-vantages of (1) advances in CNNs for understanding RGBimages and (2) 3D as a coherant information aggregationspace. By applying object detection on RGB images, back-project detection scores to 3D voxel grids and post-filteringand global adjustment, we are able to achieve robust objectdetection in 3D scenes. In Section 3 we present details ofthe algorithm and in Section 4 we show output results ofeach step of the pipeline.
How many are there? 200 frames used, point cloud subsampled by 50x. Negative voting successfully filters out bkg points
119
162
256
Object Detection in 3D Scenes using CNNs in Multi-view ImagesRuizhongtai (Charles) Qi
Department of Electrical Engineering, Stanford University�
Screenshot 2016-03-09 01.22.47Screenshot 2016-03-09 01.22.53Screenshot 2016-03-09 01.23.03�
Experimental Results�
frame 119
frame 162
frame 265
…
From range sensor:
4000 frames in total
Registered point clouds:
Each frame is associated with refined camera extrinsi
Object detection on 2D images
monitor monitor plant monitor
table chair …
back projection
0.1m
Screenshot 2016-03-09
01.22.47Screenshot 2016-03-09
01.22.53Screenshot 2016-03-09
01.23.03�
Monitor “saliency” (voxel grid)
Backprojected monitor points
Backprojected points with negative voting
Overlay onto entire scene
Technical Problems
1. Choice of key frames, based on frame quality and camera poses.
2. Shape prior for instance segmentation and 2D/3D alignment.
3. Joint�optimization among categories e.g. space occupancy exclusions.
Next Steps�
filtering
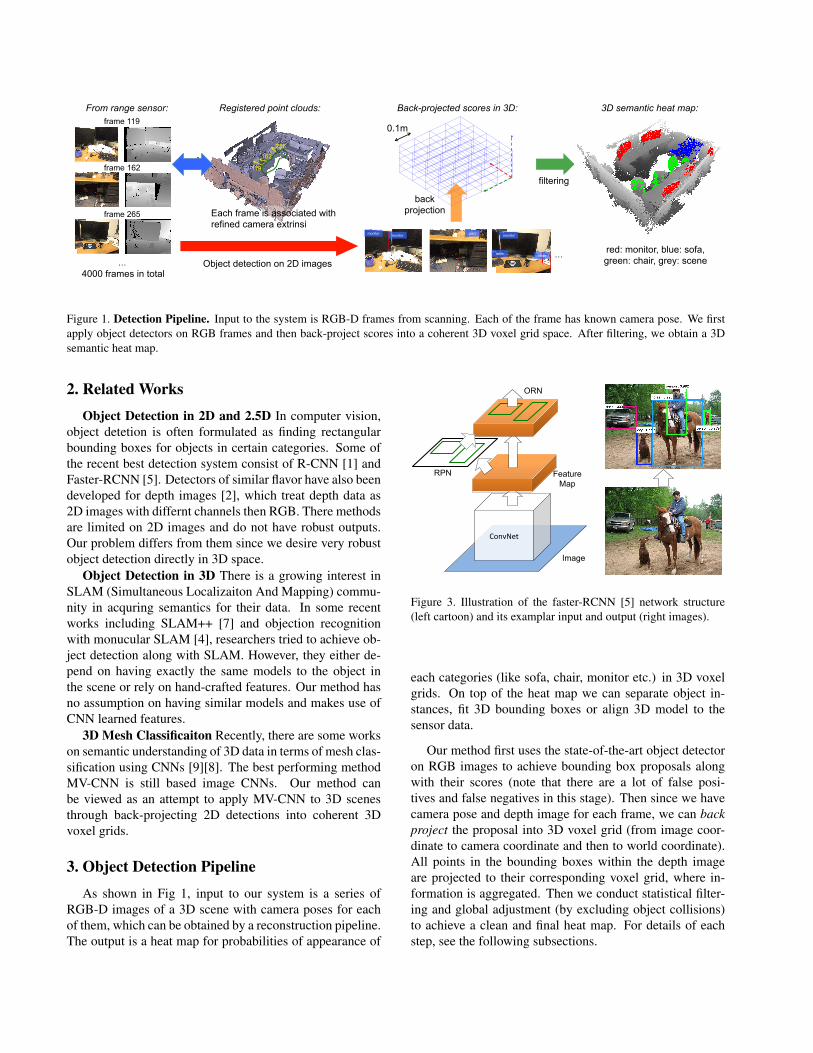
red: monitor, blue: sofa, green: chair, grey: scene
Back-projected scores in 3D: 3D semantic heat map:
Figure 1. Detection Pipeline. Input to the system is RGB-D frames from scanning. Each of the frame has known camera pose. We firstapply object detectors on RGB frames and then back-project scores into a coherent 3D voxel grid space. After filtering, we obtain a 3Dsemantic heat map.
2. Related Works
Object Detection in 2D and 2.5D In computer vision,object detetion is often formulated as finding rectangularbounding boxes for objects in certain categories. Some ofthe recent best detection system consist of R-CNN [1] andFaster-RCNN [5]. Detectors of similar flavor have also beendeveloped for depth images [2], which treat depth data as2D images with differnt channels then RGB. There methodsare limited on 2D images and do not have robust outputs.Our problem differs from them since we desire very robustobject detection directly in 3D space.
Object Detection in 3D There is a growing interest inSLAM (Simultaneous Localizaiton And Mapping) commu-nity in acquring semantics for their data. In some recentworks including SLAM++ [7] and objection recognitionwith monucular SLAM [4], researchers tried to achieve ob-ject detection along with SLAM. However, they either de-pend on having exactly the same models to the object inthe scene or rely on hand-crafted features. Our method hasno assumption on having similar models and makes use ofCNN learned features.
3D Mesh Classificaiton Recently, there are some workson semantic understanding of 3D data in terms of mesh clas-sification using CNNs [9][8]. The best performing methodMV-CNN is still based image CNNs. Our method canbe viewed as an attempt to apply MV-CNN to 3D scenesthrough back-projecting 2D detections into coherent 3Dvoxel grids.
3. Object Detection Pipeline
As shown in Fig 1, input to our system is a series ofRGB-D images of a 3D scene with camera poses for eachof them, which can be obtained by a reconstruction pipeline.The output is a heat map for probabilities of appearance of
ConvNet
Image
Feature Map
RPN
ORN
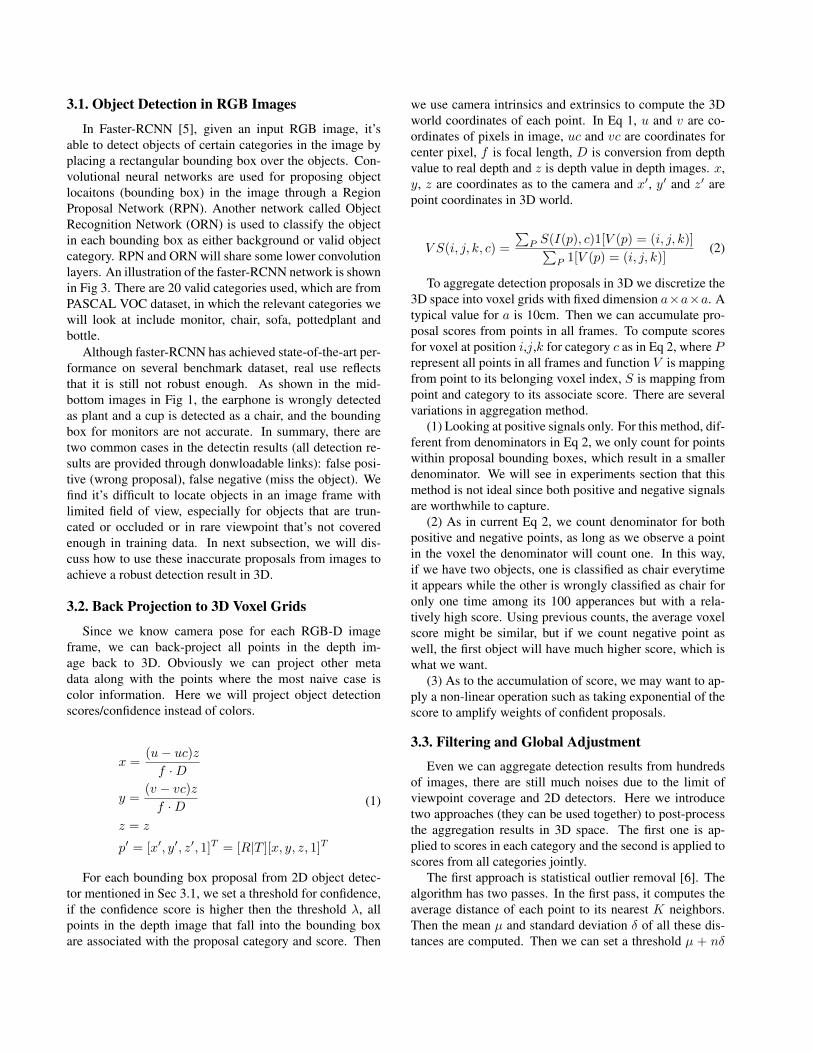
Figure 3. Illustration of the faster-RCNN [5] network structure(left cartoon) and its examplar input and output (right images).
each categories (like sofa, chair, monitor etc.) in 3D voxelgrids. On top of the heat map we can separate object in-stances, fit 3D bounding boxes or align 3D model to thesensor data.
Our method first uses the state-of-the-art object detectoron RGB images to achieve bounding box proposals alongwith their scores (note that there are a lot of false posi-tives and false negatives in this stage). Then since we havecamera pose and depth image for each frame, we can backproject the proposal into 3D voxel grid (from image coor-dinate to camera coordinate and then to world coordinate).All points in the bounding boxes within the depth imageare projected to their corresponding voxel grid, where in-formation is aggregated. Then we conduct statistical filter-ing and global adjustment (by excluding object collisions)to achieve a clean and final heat map. For details of eachstep, see the following subsections.
3.1. Object Detection in RGB Images
In Faster-RCNN [5], given an input RGB image, it’sable to detect objects of certain categories in the image byplacing a rectangular bounding box over the objects. Con-volutional neural networks are used for proposing objectlocaitons (bounding box) in the image through a RegionProposal Network (RPN). Another network called ObjectRecognition Network (ORN) is used to classify the objectin each bounding box as either background or valid objectcategory. RPN and ORN will share some lower convolutionlayers. An illustration of the faster-RCNN network is shownin Fig 3. There are 20 valid categories used, which are fromPASCAL VOC dataset, in which the relevant categories wewill look at include monitor, chair, sofa, pottedplant andbottle.
Although faster-RCNN has achieved state-of-the-art per-formance on several benchmark dataset, real use reflectsthat it is still not robust enough. As shown in the mid-bottom images in Fig 1, the earphone is wrongly detectedas plant and a cup is detected as a chair, and the boundingbox for monitors are not accurate. In summary, there aretwo common cases in the detectin results (all detection re-sults are provided through donwloadable links): false posi-tive (wrong proposal), false negative (miss the object). Wefind it’s difficult to locate objects in an image frame withlimited field of view, especially for objects that are trun-cated or occluded or in rare viewpoint that’s not coveredenough in training data. In next subsection, we will dis-cuss how to use these inaccurate proposals from images toachieve a robust detection result in 3D.
3.2. Back Projection to 3D Voxel Grids
Since we know camera pose for each RGB-D imageframe, we can back-project all points in the depth im-age back to 3D. Obviously we can project other metadata along with the points where the most naive case iscolor information. Here we will project object detectionscores/confidence instead of colors.
x =(u− uc)zf ·D
y =(v − vc)zf ·D
z = z
p′ = [x′, y′, z′, 1]T = [R|T ][x, y, z, 1]T
(1)
For each bounding box proposal from 2D object detec-tor mentioned in Sec 3.1, we set a threshold for confidence,if the confidence score is higher then the threshold λ, allpoints in the depth image that fall into the bounding boxare associated with the proposal category and score. Then
we use camera intrinsics and extrinsics to compute the 3Dworld coordinates of each point. In Eq 1, u and v are co-ordinates of pixels in image, uc and vc are coordinates forcenter pixel, f is focal length, D is conversion from depthvalue to real depth and z is depth value in depth images. x,y, z are coordinates as to the camera and x′, y′ and z′ arepoint coordinates in 3D world.
V S(i, j, k, c) =
∑P S(I(p), c)1[V (p) = (i, j, k)]∑
P 1[V (p) = (i, j, k)](2)
To aggregate detection proposals in 3D we discretize the3D space into voxel grids with fixed dimension a×a×a. Atypical value for a is 10cm. Then we can accumulate pro-posal scores from points in all frames. To compute scoresfor voxel at position i,j,k for category c as in Eq 2, where Prepresent all points in all frames and function V is mappingfrom point to its belonging voxel index, S is mapping frompoint and category to its associate score. There are severalvariations in aggregation method.
(1) Looking at positive signals only. For this method, dif-ferent from denominators in Eq 2, we only count for pointswithin proposal bounding boxes, which result in a smallerdenominator. We will see in experiments section that thismethod is not ideal since both positive and negative signalsare worthwhile to capture.
(2) As in current Eq 2, we count denominator for bothpositive and negative points, as long as we observe a pointin the voxel the denominator will count one. In this way,if we have two objects, one is classified as chair everytimeit appears while the other is wrongly classified as chair foronly one time among its 100 apperances but with a rela-tively high score. Using previous counts, the average voxelscore might be similar, but if we count negative point aswell, the first object will have much higher score, which iswhat we want.
(3) As to the accumulation of score, we may want to ap-ply a non-linear operation such as taking exponential of thescore to amplify weights of confident proposals.
3.3. Filtering and Global Adjustment
Even we can aggregate detection results from hundredsof images, there are still much noises due to the limit ofviewpoint coverage and 2D detectors. Here we introducetwo approaches (they can be used together) to post-processthe aggregation results in 3D space. The first one is ap-plied to scores in each category and the second is applied toscores from all categories jointly.
The first approach is statistical outlier removal [6]. Thealgorithm has two passes. In the first pass, it computes theaverage distance of each point to its nearest K neighbors.Then the mean µ and standard deviation δ of all these dis-tances are computed. Then we can set a threshold µ + nδ

where n is a parameter specified by user, such that in sec-ond pass all points with distance below the threshold will beclassified as inliers.
The second approach is based on the observation that twoobject cannot occupy the same voxel if the dimension of thevoxel grid is approaching zero. In an approximate case, wecan say in a setting with reasonably small voxel (e.g. 10cmdimension), each voxel only belongs to one object. There-fore, we can filter in the global 3D space for all categoriesby picking up the category wtih highest weighted score ineach voxel. Thus outliers that in the overlapped regions willbe resolved.
4. ExperimentsIn this section, we first introduce the dataset we used.
Next we present the output 3D semantic heat map from ouralgorithms and compare different methods for generatingit. At last, we show some applications that can be built ontop of the heat map, including instance segmentation and3D/2D alignments.
4.1. Dataset
In thie project, We use a scanning dataset containingRGB-D scans of an office1. There are 4003 frames in totalfrom 4 indivisual trajectories. There is also a reconstructedpoint cloud with colors by method in [3]. Camera posesof frames are globally optimized. For our experiments, weuse a random subset of 1000 frames. For a glimpse of thedataset, see Fig 1.
4.2. Qualitative Results of 3D Semantic Heat Maps
Back projection. In Fig 4, we see a visualization ofaggregated scores in 3D voxel space for monitor category.Although at this stage there are still lots of noises, we canalready see a strong pattern of where the monitors could be.This voxel grid map is the result of projecting scores from1000 images into the common 3D space.
Effect of different voting methods and filtering. InSec 3.2 we mentioned there are three candidate methods forscore voting in voxel grids. Fig 5 compared them, where wecan see that introducing counting of negative signals (pointsthat are not detected as any category), we can successfullyeliminate large amount of irrelavant points such as points onwalls and desks. Taking exponential on the score slightlyimprove the result. The bottom right image in the figureshows the output after a statistical outlier removal algorithmwith K = 50 and n = 1, we see that most outliers areremoved.
Multi-category result and global adjustment. In Fig 6,we show points of three categories (monitors in red, chairs
1dataset provided by Matthias Niessner
Figure 4. Left: visualization of scores of monitors in 3D voxelgrid. Right: visualization of points in those voxel grids. Thedarker the color the higher the score.
Figure 5. Improvement of using negative voting, exponential scoreand statistical outlier removal (for monitors). Top left: only countpositive singal. Top right: count negative signal as well. Bottomleft: based on top right, use exponential score. Bottom right: basedon bottom left, use statistical outlier removal.
in green and sofa in blue) in the common 3D space. Toachieve that we used results from plane detection and re-moved the points on the floor and desk plane. Also we gu-rantee that there is no collision among the three categories.
4.3. Applications of 3D Semantic Heat Map
Given a 3D semantic heat map, we can develop manyinteresting applications on top of it. Here we will demon-strate two of them: instance segmentation and 3D modelalignment. Note that the algorithm here is semi-automaticand mainly serves the purpose for presenting the opportuni-ties of using our pipeline’s output.
In Fig 7, we take chairs for example. By K-means clus-tering based on the coordinates of the chair points in vox-els that pass a score threshold, we can cluster chair pointsinto four clusters which correspond to four individual chairs(shown in different colors). Note that K-means is sensi-tive to initialization, so we can randomly re-initialize sev-

Figure 6. Visualization of heat map of chairs, sofas and monitors.Instead of showing probabilities we set a threshold to voxel scoresand present points in voxels that pass the threshold for the threecategories.
clustering
Figure 7. Application of instance segmentation (for chairs).
Figure 8. Application of 3D alignment (for monitors).
eral times and find the solution with minimum error. Also,it could be tricky to determine the number of clusters. Forthe chair example here we are able to try different numberof clusters and the errors will be very different. But for thecase of monitors as in Fig 6, when two monitors attach toeach other, it’s difficult to get them apart.
Idealy the ultimate goal of detection is to align 3D mod-els to the objects, as visualized in Fig 8. Once alignment isachieved, we can naturally get 3D bounding box, orienta-
tion and instance segmentation.
5. Conclusions
In this work, we demonstrated how to detect objects(finding an object heat map) in 3D scene by taking advan-tage of state-of-the-art object detectors in RGB images andaggregating signals in a common 3D space through back-projections. We have presented our modules for detectionscore back-projection into 3D voxel grids, a few methodsfor score aggregation and filtering, along with two possibleapplications built on top of our pipeline. While VR, AR androbotics are quickly being comercialized, 3D semantic un-derstanding will play an important role and we believe theideas and tools in our work will be very applicable.
Although steady steps have been made, we think ourwork is still preliminary and there are many interesting fu-ture works. For example, how to fully automatically accom-plish instance segmentation and 3D model alignment willbe a big topic to explore. At lower levels, currently we ran-domly pick up 1000 frames but there can be smart ways topick such as uniformly pick frames on the camera trajectoryor pick the most “discriminative” frames etc. Also it wouldbe interesting to study how to propagate scores to voxelsthat fall below the confidence threshold. For the chair case,we see only fractions of the chair backs and seats are high-lighed in Fig 6, if we can propaget them to the entire chairit will be helpful for both segmentation and alignment.
Acknowledgement
I’d like to express my gratitude to the wonderful teachingteam of the course. Many thanks to Gordon Wetzstein forgreat lectures and valuable project discussion, to TA Liangand Orly for helpful Q&A and discussions. Special thanksto Matthias Niessner for providing the dataset and valuablefeedbacks on the project.
References[1] R. Girshick, J. Donahue, T. Darrell, and J. Malik. Rich fea-
ture hierarchies for accurate object detection and semanticsegmentation. In Computer Vision and Pattern Recognition(CVPR), 2014 IEEE Conference on, pages 580–587. IEEE,2014.
[2] S. Gupta, R. Girshick, P. Arbelaez, and J. Malik. Learningrich features from rgb-d images for object detection and seg-mentation. In Computer Vision–ECCV 2014, pages 345–360.Springer, 2014.
[3] M. Nießner, M. Zollhofer, S. Izadi, and M. Stamminger. Real-time 3d reconstruction at scale using voxel hashing. ACMTransactions on Graphics (TOG), 32(6):169, 2013.
[4] S. Pillai and J. Leonard. Monocular slam supported objectrecognition. arXiv preprint arXiv:1506.01732, 2015.
[5] S. Ren, K. He, R. Girshick, and J. Sun. Faster R-CNN:Towards real-time object detection with region proposal net-works. In Advances in Neural Information Processing Systems(NIPS), 2015.
[6] R. B. Rusu, Z. C. Marton, N. Blodow, M. Dolha, andM. Beetz. Towards 3d point cloud based object maps forhousehold environments. Robotics and Autonomous Systems,56(11):927–941, 2008.
[7] R. Salas-Moreno, R. Newcombe, H. Strasdat, P. Kelly, andA. Davison. Slam++: Simultaneous localisation and map-ping at the level of objects. In Proceedings of the IEEE Con-ference on Computer Vision and Pattern Recognition, pages1352–1359, 2013.
[8] H. Su, S. Maji, E. Kalogerakis, and E. Learned-Miller. Multi-view convolutional neural networks for 3d shape recognition.In Proceedings of the IEEE International Conference on Com-puter Vision, pages 945–953, 2015.
[9] Z. Wu, S. Song, A. Khosla, F. Yu, L. Zhang, X. Tang, andJ. Xiao. 3d shapenets: A deep representation for volumetricshapes. In Proceedings of the IEEE Conference on ComputerVision and Pattern Recognition, pages 1912–1920, 2015.