obi otf main text
TRANSCRIPT

obesity
reviews
4
© 2004 The International Association for the Study of Obesity.
obesity
reviews
5 (Suppl. 1)
, 4–85
Blackwell Science, LtdOxford, UKOBRObesity Reviews????-????2004 The International Association for the Study of Obesity.
? 2004
5
Supplement: 1485
Original Article
Obesity in children and young peo-
ple IASOObesity in children and young people IASO
Correspondence: T. Lobstein, IASO
International Obesity TaskForce, 231 North
Gower Street, London NW1 2NS, UK.
E-mail: [email protected]
Obesity in children and young people: a crisis in public health
T. Lobstein, L. Baur and R. Uauy for the IASO International Obesity TaskForce
IASO International Obesity TaskForce, 231
North Gower Street, London NW1 2NS, UK
Keywords:
Adolescents, children, obesity, overweight, policy, WHO.
obesity
reviews (2004)
5
(Suppl. 1), 000–000
SUMMARY: THE RISING CRISIS
Ten per cent of the world’s school-aged children are esti-mated to be carrying excess body fat, with an increased riskfor developing chronic disease (Fig. 1). Of these overweightchildren, a quarter are obese, with a significant likelihoodof some succumbing to type 2 diabetes, heart disease,and other co-morbidities before or during early adulthoodThe prevalence of overweight is dramatically higher in economically developed regions, but is rising signifi-cantly in most parts of the world.
In many countries the problem of childhood obesity isworsening at a dramatic rate. Surveys during the 1990sshow that in Brazil and the USA, an additional 0.5% ofthe entire child population became overweight each year.In Canada, Australia and parts of Europe the rates werehigher, with an additional 1% of all children becomingoverweight each year.
The burden upon the health services cannot yet be esti-mated. Although childhood obesity brings a number ofadditional problems in its train – hyperinsulinaemia, poorglucose tolerance and a raised risk of type 2 diabetes,hypertension, sleep apnoea, social exclusion and depression– the greatest health problems will be seen in the nextgeneration of adults as the present childhood obesity epi-demic passes through to adulthood. Greatly increased ratesof heart disease, diabetes, certain cancers, gall bladder dis-ease, osteoarthritis, endocrine disorders and other obesity-related conditions will be found in young adult popula-tions, and their need for medical treatment may last fortheir remaining life-times. The costs to the health services,
the losses to society and the burdens carried by the indi-viduals involved will be great.
The present report has been written to focus attentionon the issue and to urge policy-makers to consider takingaction before it is too late. Specifically, the report:
• reviews the measurement of obesity in young peopleand the need to agree on standardized methods for assess-ing children and adolescents, and to compare populationsand monitor trends;
• reviews the global and regional trends in childhoodobesity and overweight and the implications of these trendsfor understanding the factors that underlie childhoodobesity;
• notes the increased risk of health problems that obesechildren and adolescents are likely to experience and exam-ines the associated costs;
• considers the treatment and management options andtheir effectiveness for controlling childhood obesity;
• emphasizes the need for prevention as the onlyfeasible solution for developed and developing countriesalike.
This document reflects contributions from experts work-ing in a wide range of circumstances with a diversity ofapproaches, but with many shared opinions. The report hasbeen endorsed by the Federation of International Societiesfor Paediatric Gastroenterology, Hepatology and Nutrition(FISPGHAN) and the International Paediatric Association(IPA).
obesity
reviews (2004)
5 (Suppl. 1)
, 4–85

obesity
reviews
Obesity in children and young people
IASO
5
© 2004 The International Association for the Study of Obesity.
obesity
reviews
5 (Suppl. 1)
, 4–85
Health professionals are aware that the rising trends inexcess weight among children and adolescents will put aheavy burden on health services (for example, 10% ofyoung people with type 2 diabetes are likely to developrenal failure by the time they enter adulthood, requiringhospitalization followed by life-long dialysis treatment (2).Health services, especially in developing countries, may noteasily bear these costs, and the result could be a significantfall in life expectancy.
In industrially developed countries, children in lower-income families are particularly vulnerable because of poordiet and limited opportunities for physical activity. Theremay also be an ethnic component; for example, in the USAthe prevalence of overweight among children aged 4–12years rose twice as fast in Hispanic and African–Americangroups compared with white groups over the period 1986–1998 (3).
In developing nations child obesity is most prevalent inwealthier sections of the population. However, child obe-sity is also rising among the urban poor in these countries,
possibly due to their exposure to Westernized diets co-inciding with a history of undernutrition.
Such rapid changes in the numbers of obese childrenwithin a relatively stable population indicate that geneticfactors are not the primary reason for change. Some migra-tion of populations may account for a proportion of theepidemic, but cannot account for it all. Although studiesof twins brought up in separate environments have shownthat a genetic predisposition to gain weight could accountfor 60–85% of the variation in obesity (4), for most ofthese children the genes for overweight are expressed wherethe environment allows and encourages their expression.These obesity-promoting environmental factors are some-times referred to as ‘obesogenic’ (or ‘obesigenic’). Putgraphically, a child’s genetic make-up ‘loads the gun’ whiletheir environment ‘pulls the trigger’ (5). A genetic predis-position to accumulate weight is a significant element inthe equation, but its importance might best be viewed fromanother perspective: the genes that predispose for obesityare likely to be commonplace, with only a small proportion
Figure 1
Prevalence of overweight and obesity among school-age children in global regions. Overweight and obesity defined by IOTF criteria. Children aged 5–17 years. Based on surveys in different years after 1990. Source: IOTF (1).
0
5
10
15
20
25
30
35
Wor
ldwid
e
Amer
icas
Europ
e
Near/m
iddle
East
Asia-P
acific
Sub-S
ahar
a Afri
ca
Pre
vale
nce
(%
)
overweight
obese

6
Obesity in children and young people
IASO
obesity
reviews
© 2004 The International Association for the Study of Obesity.
obesity
reviews
5 (Suppl. 1)
, 4–85
of children able to resist gaining weight in an obesogenicenvironment.
The changing nature of the environment towards greaterinducement of obesity has been described in WHO Tech-nical Report (6) on chronic disease as follows:
‘Changes in the world food economy have contributedto shifting dietary patterns, for example, increased con-sumption of energy-dense diets high in fat, particularlysaturated fat, and low in unrefined carbohydrates. Thesepatterns are combined with a decline in energy expendi-ture that is associated with a sedentary lifestyle—motorized transport, labour-saving devices at home, thephasing out of physically demanding manual tasks in theworkplace, and leisure time that is preponderantlydevoted to physically undemanding pastimes.’ (pp. 1–2)
This emphasis on the environmental causes of obesityleads to certain conclusions: first that the treatment forobesity is unlikely to succeed if we deal only with the childand not with the child’s prevailing environment, and secondthat the prevention of obesity – short of genetically engi-neering each child to resist weight gain – will require abroad-based, public health programme.
A doctor presented with an obese child must neverthelessattempt some form of remedial intervention to prevent thechild’s health deteriorating. The aim is to stabilize andhopefully reduce that child’s accumulation of body fat,using a range of approaches discussed in the next fewparagraphs.
Helping the obese child
For a great majority of obese patients, the first pointof contact is with a primary care physician or a pub-lic health nurse. Yet the relevant training in bariatricmethods (methods related to the assessment, preven-tion and treatment of obesity) at the undergraduatelevel remains inadequate. Two national surveys in theUSA conducted over 10 years, indicated that paediatricobesity was the most wanted topic for continuingmedical education (7).
For children who are moderately overweight, measuresto prevent further weight gain, combined with normalgrowth in height, can be expected to lead to a decrease inBMI – i.e. children may be able to ‘grow into’ their weight.For the more seriously obese child, treatment regimesare largely palliative and designed to manage and controlrather than resolve the problem. Weight control andimproved self-esteem may be achieved, but the child islikely to remain seriously overweight and at risk of chronicdisease throughout his or her life.
The clinical management of obese children may requirean extended amount of time and the assembly of a profes-
sional team including a dietitian, exercise physiologist andpsychologist in addition to the physician. As paediatricobesity becomes more common, patient management maynot be restricted to obesity clinics and other forms of man-agement may be developed. Obesity clinics may be neces-sary for morbid obesity, but less severe forms of obesitymay be better managed in primary care settings by a rangeof health practitioners.
Obesity control in adults relies on a range of options:improvements in nutritional habits, raised levels of physicalactivity, behavioural modification and psychotherapy,pharmaceutical treatment and as a last resort, surgery.These options can be used alone or in combination.
For children, neither surgery nor drug therapy cancurrently be recommended unless within a closelymonitored research study (8). Of the remainingchoices, no single method will ensure success, althoughsome consensus exists. For example, reducing the timeengaged in sedentary activities (such as watching tele-vision or playing computer and video games) has beenshown to facilitate better treatment outcome (9).Dietary interventions in combination with exercise pro-grammes have been reported to have better outcomesthan dietary modulation alone. Exercise programmesalone without dietary modification are unlikely to beeffective, because increased energy expenditure is likelyto be matched by increased energy intake (10). Awhole-family approach also appears vital, with severalstudies showing that outcomes are improved if theparents are engaged in the process, or even are thekey instigators of the process, at least for youngerchildren (11).
Very strict dietary limitations were reported to havebetter short-term results than moderate dietary limita-tions. However, strictly modified diets cannot be main-tained for long periods of time. More marked reboundeffects are observed after the discontinuation of strictdiets than after moderate dietary modifications. Twoadditional concerns regarding strict dietary limitationsare: (1) the risk of not meeting basic nutrient require-ments and thus adversely affecting growth; and (2) therisk of inducing adverse psychological effects, includingappetite or eating disorders, feelings of stigmatization,anxiety and low self-esteem, especially if the interven-tion is not successful or the child has prior psychologi-cal problems (12,13).
Many questions regarding what constitutes the besttreatment remain unanswered: there have been few suffi-ciently large multicentre clinical trials to test the efficacyand safety of well-defined obesity treatment programmes.Such trials may reveal which non-pharmacological andnon-surgical interventions can help manage obesity overthe long term. Losing weight over the short term, butthen experiencing a rebound gain in weight, remains the

obesity
reviews
Obesity in children and young people
IASO
7
© 2004 The International Association for the Study of Obesity.
obesity
reviews
5 (Suppl. 1)
, 4–85
usual experience for the majority of obese children andadolescents. The importance of further research cannotbe over stated, but it is not uncommon for research andtreatment to compete for limited financial resources, withresearch frequently being more successful in securingfinancial support. The lack of paediatric obesity clinics atmany well-respected academic institutions illustrates thispoint.
Prevention is the only realistic solution
If the current approach to treatment is largely aimed atbringing the problem under control, rather than effectinga cure, and if this aim is only successful when a multi-disciplinary and intensive regimen is mounted, then man-aging the obesity epidemic will be vastly expensive andprobably unaffordable for most countries. Pharmaceuticalapproaches may assist, but cannot replace, the multi-disciplinary management of obesity. Prevention is the onlyfeasible option and is essential for all affected countries.Yet effective techniques for prevention have also provedelusive.
Programmes to prevent obesity in children may start byidentifying those children at greatest risk, but there areproblems with this approach. Although screening forobesity potential may help target resources where they aremost needed, such screening also creates stigma among thechildren identified if they are singled out for special atten-tion. Furthermore, genetic studies suggest that most chil-dren are at risk of weight gain, and that strategies toprevent obesity in a child population – such as encouraginghealthful diets and plentiful physical activity – will benefitthe health of all children, whether at risk of obesity or not.
The most logical settings for preventive interventions areschool settings and home-based settings. A number of inter-ventions have been tried at these levels, and these arereviewed in the present report, but success has been hardto demonstrate. A Cochrane review of those trials of suffi-cient duration to detect the effects of intervention con-cluded that there was little evidence of success (14). Itsuggested that a more reliable evidence base is needed inorder to determine the most cost-effective and health pro-moting strategies that have sustainable results and can begeneralized to other situations.
As shown in the present report, there are several exam-ples of interventions designed to prevent the rising levels ofobesity – such as the school-based ‘Trim and Fit’ pro-gramme in Singapore and the ‘Agita Sao Paulo’ programmein Sao Paulo, Brazil. Favourable outcomes have beenshown with small-scale interventions, modifying children’sTV watching behaviour and promoting consumption ofhealthier foods by establishing a price differential.
Although the beneficial results of such interventions maybe detectable and significant, they are small compared with
the size of the problem. Moreover, the improvements tend todecline after the intervention ends. It must be concluded thatinterventions at the family or school level will need to bematched by changes in the social and cultural context so thatthe benefits can be sustained and enhanced. Such preventionstrategies will require a co-ordinated effort between themedical community, health administrators, teachers, par-ents, food producers and processors, retailers and caterers,advertisers and the media, recreation and sport planners,urban architects, city planners, politicians and legislators.
Public health requires multi-sectoral action
This report highlights the underlying social changes thathave led to rising levels of obesity in both the adult andchild populations. These underlying factors, as listed below,are often a part of, or a consequence of social developmentand urbanization. Such development based on economicgrowth to enhance consumption is generally regarded in apositive light and, especially in developing countries as theyemerge from poverty, may be aspired to.
Examples of problematic social trends
• Increase in use of motorized transport, e.g. to school.• Increase in traffic hazards for walkers and cyclists.• Fall in opportunities for recreational physical activity.• Increased sedentary recreation.• Multiple TV channels around the clock.• Greater quantities and variety of energy dense foods
available.• Rising levels of promotion and marketing of energy-
dense foods.• More frequent and widespread food purchasing
opportunities.• More use of restaurants and fast food stores.• Larger portions of food offering better ‘value’ for
money.• Increased frequency of eating occasions.• Rising use of soft drinks to replace water, e.g. in
schools.
Changes in these social trends may require increasedawareness by countries of the health consequences of thepattern of consumption as the first step in a strategy topromote healthier diets and more active lives. Severalauthors (15–18) have suggested that efforts to prevent obe-sity should include measures involving a wide range ofsocial actions, such as:
• public funding of quality physical education andsports facilities;
• the protection of open urban spaces, provision of saferpavements, parks, playgrounds and pedestrian zones, cre-ation of more cycling paths;

8
Obesity in children and young people
IASO
obesity
reviews
© 2004 The International Association for the Study of Obesity.
obesity
reviews
5 (Suppl. 1)
, 4–85
• taxes on unhealthy foods and subsidies for the promo-tion of healthy, nutritious foods;
• dietary standards for school lunch programmes;• elimination or displacement of soft drinks and confec-
tionery from vending machines in schools and offeringhealthier choices (i.e. low-fat dairy products, fruits andvegetables);
• clear food labelling and controls on inconsistent healthmessages;
• controls on the political contributions given by thefood industry;
• restrictions or bans on the advertising of foods tochildren;
• limits on other forms of marketing of foods tochildren;
• assessment of food industry initiatives to improve for-mulations and marketing strategies.
It is clear from these suggestions that policies and actionswill be needed at a variety of levels, some local and indi-vidually based, some national or internationally based. Allof them will require the support and involvement of depart-ments across the broad range of government and mayinclude education, social and welfare services, environmentand planning, transport, food production and marketing,advertising and media, and international trading and stan-dard-setting bodies.
Obesity prevention will involve work at all levels of theobesogenic environment. As Fig. 2 illustrates, attempts toimprove the environment at one level, for example theschool, may be undermined by a failure to improve theenvironment at another level, be it below in the home, orabove in the social and cultural context involving foodmarketing and advertising, lost recreational facilities orunsafe streets.
Children are vulnerable to the social and environmen-tal pressures that raise the risk of obesity. Although
they can be encouraged to increase their self-control inthe face of temptation, and although they can be givenknowledge and skills to help understand the context oftheir choices, children cannot be expected to bear thefull burden of responsibility for preventing excessweight gain. The prevention of childhood obesityrequires:
• improving the family’s ability to support a child inmaking changes, which in turn needs support from theschool and community, for example . . .
• ensuring the school has health-promoting policies ondiet and physical activity, and that peer group beliefs arehelping the child, which in turn requires that . . .
• the cultural norms, skills and traditional practicestransmitted by the school are conducive to health promo-tion, and that the community provides a supportive envi-ronment, such as . . .
• neighbourhood policies for safe and secure streets andrecreation facilities, and ensuring universal access tohealth-enhancing food supplies, which in turn requiresthat . . .
• authorities at municipal, and regional level are sup-porting such policies, e.g. for safe streets and improvedfood access through appropriate infrastructure, andthat . . .
• national and international bodies that set standardsand provide services are encouraging better public health,and commercial practices consistently promote healthychoices, which in turn may require . . .
• legislative and regulatory support to ensure that strat-egies for obesity reduction are fully resourced and imple-mented, and appropriate control measures are enforced,and that these are not contradicted by other governmentpolicies, and that . . .
• government and inter-governmental activities in alldepartments, including education, agriculture, transport,trade, the environment and social welfare policies areassessed for their health impact, and Government foodpurchases, e.g. for departmental staff, for the military,police, prisons, hospitals and schools and other agenciesinvolved in public sector supply contracts are consistentwith health and nutrition policies.
The present report is primarily addressed to health profes-sionals, social scientists and others in a position to influencepolicy at national and international level, by providing abackground to the problems and an indication of the pol-icies needed to tackle them. It is written in the context ofthe World Health Organization’s work on the preventionof nutrition-related chronic diseases and the developmentof strategies to promote physical activity and healthy diets.
The WHO’s consultation document (6) recommendsthe development of multi-sectoral strategies, with health
Figure 2
The opportunities for influencing a child’s environment.
so
cial policies and national legislation
orga
nizational and commercial practicesplan
ning controls and regional strategiescommunity and cultural traditions
scho
ol practices and peer influence
family
customs and choices
individ
ual self-controlthechild

obesity
reviews
Obesity in children and young people
IASO
9
© 2004 The International Association for the Study of Obesity.
obesity
reviews
5 (Suppl. 1)
, 4–85
ministries convening with other ministries and stakehold-ers to develop relevant policies, programmes and regula-tions. The consultation document calls for positiveaction, such as measures to support the greater availabil-ity of nutrient dense foods, to reduce dependence onmotorized transport, to increase access to recreation facil-ities and to ensure health information is widely availableand easily understood, and health messages are relevantand consistent.
The WHO has acknowledged the restrictions placed oncountries by international agreements, such as those thatregulate trade and marketing practices. The WHO canoffer a leadership role in prioritizing public health whennegotiating these agreements. This depends upon politicalpressure, which in part depends upon leadership from themedical profession and from non-governmental organiza-tions. The present report is designed to contribute to thatprocess.
The International Obesity TaskForce calls upon theWHO to assist member countries to develop National Obe-sity Action Plans and to prioritize childhood obesity
prevention within those plans. Examples of Action Planpriorities might be to:
• provide clear and consistent consumer information,e.g. on food labels;
• encourage food companies to provide lower energy,more nutritious foods marketed for children;
• develop criteria for advertising that promotes healthiereating;
• improve maternal nutrition and encourage breast-feeding of infants;
• design secure play facilities and safe localneighbourhoods;
• encourage schools to enact coherent food, nutritionand physical activity policies;
• encourage medical and health professionals to partic-ipate in the development of public health programmes.
The International Obesity TaskForce is committed to sup-porting the WHO in developing these priorities. Tacklingchildhood obesity will require much imagination and per-spiration, but the world’s children deserve no less.

10
Obesity in children and young people
IASO
obesity
reviews
© 2004 The International Association for the Study of Obesity.
obesity
reviews
5 (Suppl. 1)
, 4–85
1. ASSESSMENT OF OBESITY: WHICH CHILD IS FAT?
1.1. Measures of body fatness
Power
et al.
suggest that ‘an ideal measure of body fatshould be accurate in its estimate of body fat; precise, withsmall measurement error; accessible, in terms of simplicity,cost and ease of use; acceptable to the subject; and well-documented, with published reference values’ (19). Theyfurther comment that ‘no existing measure satisfies all thesecriteria’.
Measurement of adiposity in children and adolescentsoccurs in a range of settings, using a range of methods. Inthis section, both direct and indirect methods for assessingand evaluating fatness are described and the strengths and
weaknesses of these different methods used for populationand clinical judgements are analysed.
1.1.1. Body fat: direct measures and derived estimates
Direct measures of body composition provide an estima-tion of total body fat mass and various components of fat-free mass. Such techniques include underwater weighing,magnetic resonance imaging (MRI), computerized axialtomography (CT or CAT) and dual energy X-ray absorp-tiometry (DEXA). The methods are used predominantly forresearch and in tertiary care settings, but may be used as a‘gold standard’ to validate anthropometric measures ofbody fatness (20) (Table 1).
Table 1
Methods for measuring body composition
Procedure Description Comments
Underwater weighing(hydro-densitometry)
Fat has a lower density than lean tissue, and by measuring the density of the whole body the relative proportions of each component can be determined. If total body density and the specific densities of fat and fat-free mass are known, an equation can be generated for converting total body density to percentage body fat (20)
Requires a person to hold their breath underwater, and is unsuitable for use in young children or in older subjects who lack water confidence. There are theoretical concerns about the assumptions used to translate density measurements into estimates of fat mass and fat-free mass, both among normal children and the obese.
Magnetic resonanceimaging (MRI)
MRI provides a visual image of adipose tissue and non-fat tissue. Total body fat volume, total fat mass and percentage fat mass can be estimated.
MRI can accurately and reliably distinguish intra-abdominal from subcutaneous fat. MRI is expensive, time consuming and must be performed in a major medical facility. The procedure takes approximately 20 min, and requires the subject to lie still, enclosed in a scanner, and may be unsuitable for young children.
Computerizedtomography (CT)
CT scans produce high-resolution X-ray-derived images and can identify small deposits of adipose tissue. Total and regional body fat can be calculated, as well as percentage body fat.
The procedure allows intra-abdominal and subcutaneous fat to be quantified with a high degree of accuracy and reliability. The equipment is expensive and must be operated by a skilled technician. The procedure involves significant radiation exposure, takes 20 min and requires the subject to lie still within the scanner, so is unsuitable for routine use in children unless clinically indicated.
Dual-Energy X-rayAbsorptiometry (DEXA)
DEXA is based on the principle that transmitted X-rays at two energy levels are differentially attenuated by bone mineral tissue and soft tissue, and the soft tissue component is sub-divided into fat and lean tissue by using experimentally derived calibration equations (21).
DEXA cannot distinguish between intra-abdominal and subcutaneous fat. It has a high correlation with CT scan data in determining total fat mass (22). The procedure delivers lower radiation exposure than CT and is thus more suitable for use in children and adolescents. However, the test must be performed in a major medical facility with the DEXA equipment, the equipment is expensive and must be operated by a skilled technician, and the procedure may take up to 20 min and requires a very cooperative subject, therefore making it unsuitable for children aged less than 6 years. DEXA has not been fully evaluated in healthy child or adolescent populations or in very obese people.
Bioelectrical impedanceanalysis (BIA)
BIA is not strictly a direct measure of body composition, being based on the relation between the volume of a conductor (the body), the conductor’s length (height) and its electrical impedance (23). BIA assumes fat mass is anhydrous and that conductivity reflects fat-free mass. Prediction equations estimate the fat-free mass from the measured impedance and, by subtraction, the fat mass.
BIA measurements can be taken quickly and inexpensively, it is relatively non-invasive and has high inter- and intra-observer reliability. However, it requires equations specific to the instrument used and for the population under investigation, and the measurement may vary with hydration status and ethnic status (see Wabitsch
et al.
(24)). Although gaining acceptance in a range of settings, the limitations of BIA are sometimes overlooked.
Air-displacementplethysmography
A subject’s volume is determined indirectly by measuring the volume of air the subject displaces when sitting inside an enclosed chamber. Adjustment for thoracic gas volume is made. Once body volume and mass are known, the principles of densitometry are applied to estimate percentage body fat.
Air-displacement plethysmography measurements are comfortable, relatively quick, non-invasive and can accommodate a wide range of body types. Subjects should be reasonably cooperative (for accurate measurement the subject should breathe through a tube and wear a nose clip) and hence the technique may be unsuitable for younger children. Again, there are theoretical concerns about the assumptions used to calculate body fat (25).

obesity
reviews
Obesity in children and young people
IASO
11
© 2004 The International Association for the Study of Obesity.
obesity
reviews
5 (Suppl. 1)
, 4–85
Table 2
Indirect methods for estimating body composition
Procedure Description Validation Comments
Weight andweight-for-height
Total body weight can be recorded and compared with reference standards based on a child’s age. Low weight-for-age is a widely used marker of malnutrition for younger children. However, weight is correlated with height, and reference standards based on weight-for-height provide a more accurate measure of under-or overweight, and take account of possibly confounding from inadequate linear growth (stunting) when assessing nutritional status.
Growth charts are based on standard reference populations (usually the US National Center for Health Statistics reference population, although these may under-represent the growth patterns of breast-fed children (26,27) and may need to be revised (28). Weight-for-height charts are inaccurate beyond the age of around 10–11 years and the measure is not useful in older children and adolescents (29).
Weight and height (or length) are relatively easy to obtain, although they tend to me more accurate if taken by a trained person. Weight should be taken with the child in light, indoor clothing.
Body massindex (BMI)
BMI is defined as weight (kg) /height squared (m
2
), and is widely used as an index of relative adiposity among children, adolescents and adults. Among adults, the WHO recommends that a person with a BMI of 25 kg m
-
2
or above is classified overweight, while one with a BMI 30 kg m
-
2
or above is classified obese (16) although revisions of these guidelines are being proposed for certain populations (30). For children, various cut-off criteria have been proposed based on reference populations and different statistical approaches (see discussion below).
BMI has been compared with dual-energy X-ray absorptiometry (DEXA) in children and adolescents aged 4–20 years (31). BMI had a true positive rate of 0.67, and a false positive rate of 0.06 for predicting a high percentage of total body fat. Sardinha
et al.
(32) reported a true positive rate of 0.83 for 10–11 year olds, 0.67 for 12–13 year olds and 0.77 for 14–15 year olds, while the false positive rate ranged from 0.03 in 12–13 year olds to 0.13 in 10–11 year olds. Therefore, although some overweight children would be wrongly classified as being of normal weight when using BMI as a screening test, few children would be classified as overweight if they were not. Correlation coefficients between BMI and DEXA range from 0.50 in a study of 7–17-year-old white males, to 0.83 in a study of 7–17-year-old girls (33). A study of 198 white boys and girls aged 5–19 years found a correlation of 0.85 between BMI and total body fat measured with DEXA (34). (See also the discussion of ‘other measures’, below.)
BMI is more accurate when height and weight are measured by a trained person rather than self-reported. Measurement of height and weight has a high subject acceptance, which is particularly important for adolescents who may be reluctant to undress (measures are normally taken in light clothing, without shoes). There is low observer error, low measurement error and good reliability and validity. However, BMI may not be a sensitive measure of body fatness in people who are particularly short, tall or have an unusual body fat distribution, and may misclassify people with highly developed muscles. Hence two people with the same amount of body fat can have quite different BMIs (32). There may also be racial differences in the relationship between the true proportion of body fat and BMI (35).
Waistcircumferenceand Waist-to-hip ratio (WHR)
Waist circumference is an indirect measure of central adiposity. Central adiposity is strongly correlated with risk for cardiovascular disease in adults (36) and an adverse lipid profile and hyperinsulinaemia in children (37). Waist circumference is measured at the minimum circumference between the iliac crest and the rib cage using an anthropometric tape.W-to-hip ratio has been used among adults to identify people with high central adiposity. Waist circumference is measured as above and hip circumference is measured at the maximum protuberance of the buttocks. The ratio is then calculated.
In young people aged 3–19 years, the correlation between waist circumference and DEXA of trunk fat were 0.83 for girls and 0.84 for boys. In addition, children’s waist circumference correlates well with CT scan as a measure of subcutaneous abdominal adipose tissue (
r
= 0.93), and fairly well with intra-abdominal adipose tissue (
r
= 0.84) (22). Waist-to-hip ratios are less well correlated with trunk fat measures using DEXA (38).
Waist and hip circumferences are easy to measure with simple, low-cost equipment, have low observer error, offer good reliability, validity and low measurement error. However, there are no accepted cut-off values for the classification of overweight and obesity based on these measures, and there have been few studies of the relation between central adiposity and the metabolic disturbances associated with excess visceral fat among children and adolescents. Waist circumference and hip circumference are highly age dependent, and it is not recommended to use the ratio between them without first considering each measure separately (19).
1.1.2. Anthropometric measures of relative fatness
Among the anthropometric measures of relative adiposityor fatness are waist, hip and other girth measurements,skin-fold thickness and indices derived from measuredheight and weight such as Quetelet’s index (BMI or W
H
-
2
), the ponderal index (W H
-
3
) and similar formulae. Allanthropometric measurements rely to some extent on theskill of the measurer, and their relative accuracy as a mea-sure of adiposity must be validated against a ‘gold stan-dard’ measure of adiposity (Table 2).

12
Obesity in children and young people
IASO
obesity
reviews
© 2004 The International Association for the Study of Obesity.
obesity
reviews
5 (Suppl. 1)
, 4–85
1.2. Definitions of ‘overweight’ and ‘obesity’ in young people
The primary purposes for defining overweight and obesityare to predict health risks and to provide comparisonsbetween populations. Faced with a continuous distribution,criteria need to be created that define where cut-off pointsshould occur that best fulfil these purposes. For practicalreasons, the definitions have usually been based on anthro-pometry, with waist circumference and BMI being the mostwidely used both clinically and in population studies.
1.2.1. Weight for height
Although not validated against health criteria, weight forheight measurements have become a common means ofassessing populations of children, especially those agedunder 5 years, and are used to define both under- andover-nutrition. Low weight for height is termed thinness,and very low weight for height is termed wasting, usuallyfound as a consequence of acute starvation and/or dis-ease. A high weight for height is termed overweight andvery high weight for height is termed obese. The use ofweight for height has the advantage of not requiring
knowledge of the child’s age, which may be hard to assessin less developed areas, but it should not be used as asubstitute for height for age, or weight for age, as allthree measures reflect different biological processes (seeTable 16 in reference 42).
In 1995, the use of weight for height was recommendedby WHO for children below the age of 10 years, but aWHO review found that use of the US-based NationalCenter for Health Statistics should not be recommendedespecially as it did not take account of differences betweenbreast-fed and non-breastfed children (42). The WHO mayconsider new reference standards based on multinationalstudies of breast-fed children showing healthy growth (28).
The weight for height score is plotted on a chart basedon a standard reference population, which gives a Z-scorebased on the difference between the observed value andthe median reference value of a population, standardizedagainst the standard deviation of the reference population.Thus a Z-score of 0 is equivalent to the median or 50
th
centile value, a Z-score of +2.00 is approximately equiva-lent to the 98
th
centile and a Z-score of +2.85 is
>
99
th
centile. The use of a weight for height Z-score (WHZ)allows a more detailed statistical description of an individ-
Table 2
Continued
Skin-foldthickness
Skin-fold thickness can be measured at different sites on the body (e.g. triceps, subscapular) using skin-fold callipers. Prediction equations can then be used to estimate fat mass and percentage fat from the skin-fold measurements. New methods for measuring skin fold using portable echography equipment are under development.
Children’s abdominal skin-fold thickness correlates well (
r
= 0.88) with visceral adipose tissue as measured by CT scan or MRI (39). Triceps skin-fold thickness shows a sensitivity of 0.79 in 10–11 year olds, 0.78 in 12–13 year olds and 0.87 in 14–15 year olds when compared with DEXA in measuring obesity (
≥
30% body fat) (32). The corresponding false positive rates were 0, 0.03 and 0.07. However, triceps measures may be less indicative of central obesity among children in developing countries (40) compared with a US-based population.
Skin-fold thickness uses simple equipment and offers only a moderate respondent burden, and has the potential to determine total body fat and regional fat distribution. However, skin-fold thickness varies with age, sex and race, and the equations relating skin-fold thickness at several sites to total body fat need to be validated for each population. Measurement requires training and intra- and inter-observer reliability is poor (23). In very obese individuals the measurement of triceps skin-fold or other skin-fold thicknesses may not be possible. The relationship with metabolic problems is unclear.
Otheranthropometricmeasures
Various alternatives to the weight-to-height ratio have been developed examining different powers of N in the formula weight/height
N
, such as the ponderal index (w h
-
3
). ‘N’ is sometimes referred to as the Benn index.Another measure, the conicity index, is defined as waist circumference/(0.109 x square root of weight/height).
Both BMI and the ponderal index are intended to remove the height element from the estimation of relative weight, but instudies of child populations there is evidence that both measures show some residual association with height. An analysis of the Benn index, related to height at various stages in childhood, showed that N lay just below 3.0 for children aged 6 years, rising to 3.5 for children aged around 10 and fell to around 2.0 by age 18 (41). Thus the use of BMI (w h
-
2
) tends to give taller children a greater BMI than shorter children when their true relative weights are equal.
As with BMI, height and weight are more accurate when measured by a trained person rather than self-reported. Such measures have high subject acceptance and there is low observer error, low measurement error and good reliability and validity. However, none of these indices is widely used at present.
Procedure Description Validation Comments

obesity
reviews
Obesity in children and young people
IASO
13
© 2004 The International Association for the Study of Obesity.
obesity
reviews
5 (Suppl. 1)
, 4–85
ual or a population, and comparison between populationscan also be readily made and trends over time can bedescribed. Besides the difficulty in choosing an appropriatereference population, however, WHZ-scores require suit-able statistical skills or software programmes. In terms ofdefining non-overweight, overweight and obese the catego-ries are based only on statistical convenience (e.g.WHZ
>
2) rather than a known health risk.
1.2.2. Waist circumference
In a large-scale epidemiological study of young peopleaged 5–17 years, Freedman
et al.
showed that central fatdistribution (particularly as assessed by waist circumfer-ence) was associated with an adverse lipid profile andhyperinsulinaemia (37). A high waist circumference hasalso been shown to track well into adulthood (22).Although waist circumference percentile charts havebeen described (e.g. for the UK (43)), appropriate cut-offpoints for defining high or low health risks have not beenidentified.
Waist circumference may be useful in clinical practiceas a means of determining a child or adolescent’s responseto weight control measures. In epidemiological studies, itmay be used to characterize a population in terms ofabdominal fat distribution and to determine the preva-lence of risk factors. At present, however, waist circumfer-ence cannot be used to categorize a child as being at ahigh or low risk.
1.2.3. BMI
As suggested in Table 2 above, BMI is significantly associ-ated with relative fatness in childhood and adolescence,and is the most convenient way of measuring relativeadiposity (44).
BMI for age reference charts and BMI for age percentiles.
BMI varies with age and gender. It typically rises duringthe first months after birth, falls after the first year and risesagain around the sixth year of life: this second rise issometimes referred to as ‘the adiposity rebound’. (Forexamples of childhood BMI curves by age and gender, seeFigure 28 below.) A given value of BMI therefore needs tobe evaluated against age- and gender-specific reference val-ues. Several countries, including France, the UK, Singapore,Sweden, Denmark and the Netherlands, have developedtheir own BMI-for-age gender-specific reference chartsusing local data. In the USA, reference values published byMust
et al.
(45) derived from US survey data in the early1970s, have been widely used and were recommended forolder children (aged 9 years or more) by a WHO expertcommittee in 1995 (42). More recently, the US NationalCenter for Health Statistics (NCHS) has produced refer-ence charts based on data from five national health exam-inations from 1963–1994 (46), although to avoid an
upward shift of the weight and BMI curves, data from themost recent survey were excluded for children over the ageof six years (47).
The advantage of using BMI-for-age charts is that a childcan be described as being above or below certain centilelines (for example the 85
th
or 90
th
centile), which can beuseful in a clinical setting. Data, however, are usuallyderived from a single reference population, and classifyingan individual as overweight or obese assumes that theindividual is comparable to that reference population. Fur-thermore, clinicians may wrongly interpret the centiles asrepresenting an ideal population, when the figures may infact come from a reference population with a high preva-lence of obesity, such as the USA NCHS data.
The NCHS documentation (46) recommends that thosechildren with a BMI greater than or equal to the 95
th
percentile be classified as ‘overweight’ and those childrenwith a BMI between the 85
th
and 95
th
percentile be classi-fied as ‘at risk of overweight’. In some papers, US childrenat or above the 95
th
centile are referred to as ‘obese’ (18)and in others ‘obesity’ refers to US children above the 85
th
centile (48).
BMI for age Z-scores.
As with the use of weight-for-height measures compared with standard reference popula-tions, BMI can be compared with a reference data set andreported as Z-scores. A BMI Z-score is calculated asfollows:
(observed value)
-
(median reference value of a population) standard deviation of reference population
A Z-score of 0 is equivalent to the median or 50
th
centilevalue, a Z-score of +1.00 is approximately equivalent tothe 84
th
centile, a Z-score of +2.00 is approximately equiv-alent to the 98
th
centile and a Z-score of +2.85 is
>
99
th
centile. As with other measures, BMI Z-scores can be usedto compare an individual or specified population against areference population. BMI for age Z-scores, however,require suitable statistical skills or software programmes,there is difficulty in choosing an appropriate reference pop-ulation, and there are only arbitrary cut-off points forcategorizing into non-overweight, overweight and obese.
BMI based on adult cut-off points.
An expert committeeconvened by the International Obesity TaskForce in 1999determined that although BMI was not ideal as a measureof adiposity, it had been validated against other, more directmeasures of body fatness and may therefore be used todefine overweight and obesity in children and adolescents(44). As it is not clear at which BMI level adverse healthrisk factors increase in children, the group recommendedcut-offs based on age specific values that project to theadult cut-offs of 25 kg m
-
2
for overweight and 30 kg m
-
2
for obesity. Using data from six different reference popula-

14
Obesity in children and young people
IASO
obesity
reviews
© 2004 The International Association for the Study of Obesity.
obesity
reviews
5 (Suppl. 1)
, 4–85
tions (UK, Brazil, the Netherlands, Hong Kong, Singaporeand the USA) Cole
et al.
(47) derived centile curves thatpassed through the points of 25 kg m
-
2
and 30 kg m
-
2
atage 18 years. These provide age and gender specific BMIcut offs to define overweight and obesity, corresponding tothe adult cut off points for overweight and obesity.
The tables developed by Cole
et al.
(reproduced in Table3) are useful for epidemiological research in that childrenand adolescents can be categorized as non-overweight,overweight or obese using a single standard tool. The cut-off points were developed using several data sets, thereforethey represent an international reference that can be usedto compare populations world-wide. The authors, however,acknowledge that the reference data set may not adequatelyrepresent non-Western populations.
There are differences in body composition across adultethnic groups, with one study in whites and Asians showingdifferences of 2–3 BMI units in adults with the same bodyfat composition (35). Central obesity combined with thinlimbs appears to feature in some Indian populations, givinga higher health risk for a given BMI (49). Studies in theUSA have found that African American, Mexican Ameri-can and Mohawk Indian children carry more central fatthan white children (39). In the UK there is some evidencethat children of south Asian ethnicity are at greater risk ofcentral adiposity (50,51).
The implications of these studies is that the adult cut-offsof BMI 25 and 30 may not be universally applicable, andhence the use of those cut-offs to define the range of child-hood BMIs that correspond to them, may also be inappro-priate for some child populations. A WHO-sponsoredseminar on Asian obesity risks suggested that overweightand obesity might be defined at BMI 23+ and 25+ respec-tively (52). A study of Malaysians has shown that body fatlevels are higher than those found in Caucasians, and thatoverweight and obesity should be defined at BMI 23+ and27+, respectively (30). For Pacific Islanders, overweight andobesity may be better defined at 26+ and 32+ respectively(53).
Lastly, a proposal that child BMI cut-offs should beadjusted to take account of pubertal stage of developmentin addition to age and gender has been made (54), but thereappears to be no superiority compared with using BMIbased on age and gender alone in terms of predicting actualpercentage body fat assessed by dual-energy X-ray absorp-tiometry (55).
In summary, the reference cut-offs from Cole
et al. aresuitable for research use and for monitoring and evaluatingchanges in populations, because the cut-offs provide a stan-dard benchmark against which all population groups canbe compared and trends assessed. In terms of defininggroups at special risk of health problems due to excessweight, the cut-off points may need to be adjusted toaccount for local factors.
In clinical practice, the variations found in body fat massand non-fat mass for a given bodyweight may make anyjudgement based on weight (adjusted for height and/or forage) unreliable as an estimate of an individual’s actual bodyfat. At higher levels, BMI and the BMI cut-offs may behelpful in informing a clinical judgement, but at levels nearthe norm additional criteria may be needed. For clinicalassessment, more direct measures, such as bio-impedance,as well as indirect measures such as waist circumference,are sometimes used.
Comparisons of BMI cut-offs. Several studies have com-pared the US NHANES criteria for defining overweight orobesity using age- and gender-specific 85th and 95th centilecut-offs with those of the more recent US Centres for DiseaseControl (CDC) using similar percentile cut-offs, and the
Table 3 International cut-off points for body mass index for overweight and obesity by sex between 2 and 18 years
Age (years) Body mass index25 kg m-2
Body mass index 30 kg m-2
Males Females Males Females
2 18.41 18.02 20.09 19.812.5 18.13 17.76 19.80 19.553 17.89 17.56 19.57 19.363.5 17.69 17.40 19.39 19.234 17.55 17.28 19.29 19.154.5 17.47 17.19 19.26 19.125 17.42 17.15 19.30 19.175.5 17.45 17.20 19.47 19.346 17.55 17.34 19.78 19.656.5 17.71 17.53 20.23 20.087 17.92 17.75 20.63 20.517.5 18.16 18.03 21.09 21.018 18.44 18.35 21.60 21.578.5 18.76 18.69 22.17 22.189 19.10 19.07 22.77 22.819.5 19.46 19.45 23.39 23.4610 19.84 19.86 24.00 24.1110.5 20.20 20.29 24.57 24.7711 20.55 20.74 25.10 25.4211.5 20.89 21.20 25.58 26.0512 21.22 21.68 26.02 26.6712.5 21.56 22.14 26.43 27.2413 21.91 22.58 26.84 27.7613.5 22.27 22.98 27.25 28.2014 22.62 23.34 27.63 28.5714.5 22.96 23.66 27.98 28.8715 23.29 23.94 28.30 29.1115.5 23.60 24.17 28.60 29.2916 23.90 24.37 28.88 29.4316.5 24.19 24.54 29.14 29.5617 24.46 24.70 29.41 29.6917.5 24.73 24.85 29.70 29.8418 25 25 30 30
Source: Cole et al. (47).

obesity reviews Obesity in children and young people IASO 15
© 2004 The International Association for the Study of Obesity. obesity reviews 5 (Suppl. 1), 4–85
IOTF alternative set of cut-offs based on centiles passingthrough BMI 25 and BMI 30 at age 18. Using the NHANESIII data, Flegal et al. (56) show that the different methodsgive approximately similar results, but with some significantdiscrepancies especially among younger children (see Table4).
In a study that examined data from children in nationalsurveys in the USA, Russia and China, a comparison ofthree different methods for defining cut-offs found that themethods produced similar estimates for the prevalence ofoverweight (>85th centile US references and >BMI 25 equiv-alent for the IOTF method), but that estimates of obesity(>95th centile US references and >BMI 30 equivalent IOTFmethod) showed some differences (57). For adolescents theIOTF method tended to give slightly lower estimates forthe prevalence of obesity, while for younger children theIOTF method gave more significantly lower estimates forthe prevalence of obesity. The IOTF method also gavesignificantly lower estimates of obesity prevalence com-pared with figures based on weight-for-height Z score >2,for children aged 6–9 years (older children were notassessed on this score).
In general, the IOTF method appears to give a moreconservative view of the extent of overweight and obesityamong paediatric populations compared with methodsbased on the 85th and 95th centiles of US-based referencepopulations or based on the use of weight-for-height Zscores.
BMI cut-offs based on alternative criteria. The IOTF BMIcut-offs discussed above are based on adult BMI cut-offsextrapolated back into childhood. Alternative approachescan be suggested, for example that child BMI cut-offs canbe defined in relation to health in childhood. This approachhas been developed in Taiwan, where cut-offs have beenestimated using definitions of fit or unfit according to a setof physical fitness criteria (58). Using data from nearly amillion young people recorded in a nation-wide fitnesssurvey, those individuals deemed physically fit (i.e. exclud-ing those in the bottom quartile on the fitness tests) at age18 showed 85th and 95th centile points at around 23 kgm-2 and 25 kg m-2, respectively. These values tie in withadult recommendations for Asian populations of BMI 23and 25, reflecting overweight and obesity cut-off pointsrespectively.
The development of BMI norms for children based onthe BMIs of standardized ‘fit’ populations opens new pos-sibilities for defining overweight and obese children, andneeds further exploration.
Table 4 Comparison of prevalence rates of overweight and obesity using different criteria
Age 6–8 years Age 12–14 years
Boys Girls Boys Girls
OverweightNHANES/WHO >85th 25% 31% 30% 30%CDC >85th 23% 23% 29% 31%IOTF >BMI 25 equivalent 18% 23% 29% 31%
ObeseNHANES/WHO >95th 13% 17% 11% 12%CDC >95th 11% 11% 12% 12%IOTF >BMI 30 equivalent 8% 8% 9% 10%
Source: Flegal et al. (56).
Recommendations for the definition of ‘overweight’ and ‘obesity’
• Body mass index should be used as the main mea-sure of overweight and obesity in childhood and ado-lescence for survey purposes.
• Research studies involving epidemiological or clin-ical data should ensure that BMI is expressed in termsof mean +/- SD as well as prevalence using establishedcut-offs based on accepted reference values. Thiswill allow international comparison of data.
• Researchers should be encouraged to collect dataon waist circumference in childhood and adolescencewhen performing epidemiological or clinical studies.
• Further research is needed to validate the BMI-for-age or waist-for-age cut-off points associated withhealth risks in childhood and adolescence.
• Further research is needed into the effect of ethnic-ity on the interpretation of the definitions of ‘over-weight’ and ‘obesity’.
• Further work is needed in establishing clinical def-initions of ‘overweight’ and ‘obesity’ that are congruentwith research definitions.

16 Obesity in children and young people IASO obesity reviews
© 2004 The International Association for the Study of Obesity. obesity reviews 5 (Suppl. 1), 4–85
2. PREVALENCE AND TRENDS IN CHILDHOOD OBESITY
Our understanding of the global circumstances surroundingobesity in children and adolescents is limited due to thelack of comparable representative data from different coun-tries and, in particular, due to the use of varying criteria fordefining obesity among different countries and researchers.This methodological problem of consistency between classi-fications of childhood obesity is the major obstacle in study-ing global secular trends for younger age groups (16). Here,we review the published data and some additional unpub-lished data collected by the International Obesity TaskForcein collaboration with regional task forces and members ofthe International Association for the Study of Obesity.
It should be noted that there are several constraints onthe use of survey data for interpreting trends in obesity inchildren and adolescents.
• Sampling issues. Some of the results presented in thissection are based on national representative surveys, whileothers are based on smaller surveys that do not representnational populations.
• Sexual maturation. Sexual maturation influences bodyfatness: fat gain occurs in both boys and girls early inadolescence, then ceases and may even temporarily reversein boys but continues throughout adolescence in girls (seelater in this report). There are large intra- and inter-popula-tion variations in the patterns of sexual maturation (57,59).
• Secular trends in growth and development. Overrecent decades, children world-wide have become taller,they mature earlier, and in some cases, become heavier fora given age. These trends have affected some populationsmore than others, and at different rates of change. Com-parisons between populations should take these seculartrends into account.
• Stunting. Stunted children are more likely to be over-weight in countries undergoing a rapid nutrition transition(60) (see later in this report). This is of particular signifi-cance when examining the trends in obesity in developingcountries, where the secular trends in linear growth con-tinue and the prevalence of stunting has declined.
• Adiposity rebound (see sections 4.2.2 and 4.4.2,below). Considerable differences may exist in the timingand patterns of adiposity rebound between populations—in particular between populations in industrialized and indeveloping countries. This may affect the estimate of obe-sity prevalence for children from developing countries ataround the age of adiposity rebound when using the so-called international references developed using data col-lected in wealthy societies, such as the NHANES and WHOreferences. The IOTF references are based on six countries:USA, Netherlands, UK, Brazil, Hong Kong and Singapore.
• Measurement errors. Data collected in different studiesand countries and over time may not have the same quality.
The potential influence of measurement errors should notbe ignored. All these factors may influence the observedsecular trends.
Nonetheless, survey material is an invaluable source of datafor understanding the rising epidemic of childhood obesity.The continued collection of such data is essential, andseveral recommendations can be made to improve the valueof the data.
• The international reference charts for making interna-tional comparisons and for monitoring the secular trendsin childhood obesity need to be continually refined andevaluated, especially in developing countries where chil-dren and adolescents have very different growth and devel-opment patterns, which occur in a different culturalcontext, compared with their counterparts in industrializedcountries.
• Nationally representative data in developing countriesis particularly needed, especially for older children (>5years old) and adolescents, and these data will be especially
Note
In the descriptions below it will be seen that some sur-veys have used definitions based on 85th and 95th cen-tiles. This means that 15% and 5% of children wouldbe expected to have weights above the 85th and 95th
centiles respectively if the sampled population is identi-cal to the reference population.
Similarly, statements apply to the use of definitions ofoverweight (and underweight) based on standardizeddeviation (Z) scores. For a normal Gaussian distribu-tion, a Z score of 1 is approximately equivalent to the16th (lower) and 84th (upper) centile, while a Z score of2 is approximately equivalent to the 2nd (lower) or 98th
(upper) centile. Thus 16% of children would beexpected to have a Z score of greater than +1, and 2%of children would be expected to have a Z score greaterthan +2, if the sampled population is identical to thereference population.
A few surveys define overweight and obesity respec-tively as being greater than 120% and 140% above anideal or standard reference point. For BMIs in childrenthis does not relate to a specified centile, but can be readas approximately equivalent to the 85th and 95th centiles,respectively, of that standard reference group.
The IOTF definitions, as noted above, do not relateto specified centiles but to age- and gender-adjustedBMIs equivalent of BMI 25 (overweight) and BMI 30(obese) at age 18.

obesity reviews Obesity in children and young people IASO 17
© 2004 The International Association for the Study of Obesity. obesity reviews 5 (Suppl. 1), 4–85
valuable for monitoring trends in obesity during periods ofeconomic change and urbanization.
• Collection of longitudinal data, which can be usedto track the development of obesity and evaluate inter-ventions, needs to be encouraged. Longitudinal studiesmay prove particularly valuable for examining thesocial, environmental, behavioural and biological factorsthat may contribute to the secular trends in childhoodobesity.
2.1. Global secular trends and prevalence of obesity in children and adolescents
Representative data for examining the problem of child-hood obesity have been collected in many industrializedcountries, especially in North America and Europe aswell as in a number of developing countries, although formost developing countries the data are more limited,especially data on older children (>5 years) and adoles-cents. Nevertheless, data collected in national and localsurveys from different parts of the world provide usefulinsights into the global obesity situation among youngpeople. These data are listed in Appendix 1, Tables A1(1)to A1(5).
In summary, the available data suggest the following:
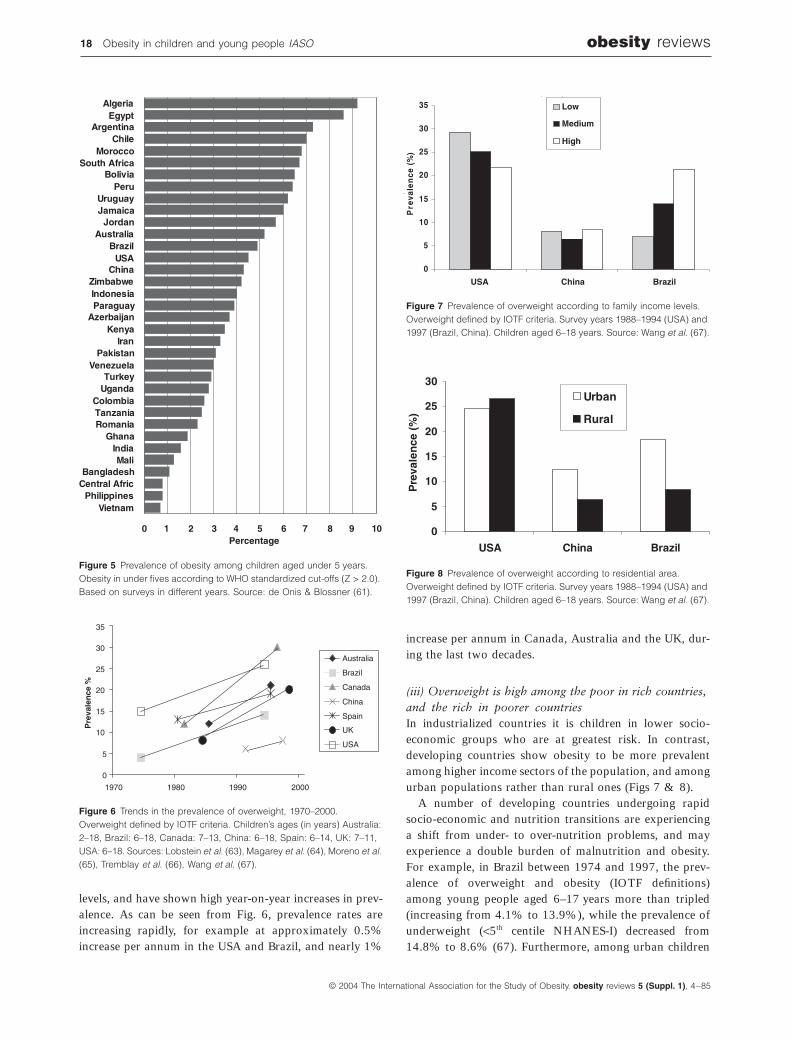
(i) Global prevalence is unequally distributedTaken overall, the data available from surveys of youngpeople aged 5–17 years, collated for the WHO GlobalBurden of Disease report and extrapolated to countrieswhere no data are available, indicates the prevalence ofoverweight (including obesity) to be approximately 10%in this age range, and the prevalence of obesity to be 2–3% (1). This global average reflects a wide range ofprevalence levels, with the prevalence of overweight inAfrica and Asia averaging well below 10% and in theAmericas and Europe above 20% (Figs 3 (boys) & 4(girls)).
Two recent comprehensive studies examined obesity inpre-school children (61,62), and one estimated that theoverall prevalence of obesity (defined as WHZ > 2) was3.3% in developing countries among this younger agegroup in 1995 (61). For those countries with data recordedduring the 1990s, the figures for obesity (WHZ > 2) amongchildren under 5 years old are shown in Fig. 5.
(ii) Childhood overweight is rising rapidly The prevalence of excess weight among children is increas-ing in both developed and developing countries, but at verydifferent speeds and in different patterns. North Americaand some European countries have the highest prevalence
Figure 3 Prevalence of overweight and obesity among school-age boys by global region. Overweight and obesity defined by IOTF criteria. Chil-dren aged 5–17 years. Based on surveys in different years after 1990. Source: IOTF (1).
0
5
10
15
20
25
30
35
Wor
ldwide
Amer
icas
Europ
e
Near/m
iddle
East
Asia-P
acific
Sub-S
ahar
a Afri
ca
Pre
vale
nce
(%)
overweight
obese
Figure 4 Prevalence of overweight and obesity among school-age girls by global region. Overweight and obesity defined by IOTF criteria. Chil-dren aged 5-17 years. Based on surveys in different years after 1990. Source: IOTF (1).
0
5
10
15
20
25
30
35
Wor
ldwide
Amer
icas
Europ
e
Near/m
iddle
East
Asia-P
acific
Sub-S
ahar
a Afri
ca
Pre
vale
nce
(%
)
overweight
obese
18 Obesity in children and young people IASO obesity reviews
© 2004 The International Association for the Study of Obesity. obesity reviews 5 (Suppl. 1), 4–85
levels, and have shown high year-on-year increases in prev-alence. As can be seen from Fig. 6, prevalence rates areincreasing rapidly, for example at approximately 0.5%increase per annum in the USA and Brazil, and nearly 1%
increase per annum in Canada, Australia and the UK, dur-ing the last two decades.
(iii) Overweight is high among the poor in rich countries, and the rich in poorer countries In industrialized countries it is children in lower socio-economic groups who are at greatest risk. In contrast,developing countries show obesity to be more prevalentamong higher income sectors of the population, and amongurban populations rather than rural ones (Figs 7 & 8).
A number of developing countries undergoing rapidsocio-economic and nutrition transitions are experiencinga shift from under- to over-nutrition problems, and mayexperience a double burden of malnutrition and obesity.For example, in Brazil between 1974 and 1997, the prev-alence of overweight and obesity (IOTF definitions)among young people aged 6–17 years more than tripled(increasing from 4.1% to 13.9%), while the prevalence ofunderweight (<5th centile NHANES-I) decreased from14.8% to 8.6% (67). Furthermore, among urban children
Figure 5 Prevalence of obesity among children aged under 5 years.Obesity in under fives according to WHO standardized cut-offs (Z > 2.0). Based on surveys in different years. Source: de Onis & Blossner (61).
AlgeriaEgypt
ArgentinaChile
MoroccoSouth Africa
BoliviaPeru
UruguayJamaica
JordanAustralia
BrazilUSA
ChinaZimbabweIndonesiaParaguay
AzerbaijanKenya
IranPakistan
VenezuelaTurkey
UgandaColombiaTanzaniaRomania
GhanaIndiaMali
BangladeshCentral Afric
PhilippinesVietnam
0 1 2 3 6 7 8 9 10Percentage
54
Figure 6 Trends in the prevalence of overweight, 1970–2000.Overweight defined by IOTF criteria. Children’s ages (in years) Australia: 2–18, Brazil: 6–18, Canada: 7–13, China: 6–18, Spain: 6–14, UK: 7–11, USA: 6–18. Sources: Lobstein et al. (63), Magarey et al. (64), Moreno et al. (65), Tremblay et al. (66), Wang et al. (67).
0
5
10
15
20
25
30
35
1970 1980 1990 2000
Pre
vale
nce
%
Australia
Brazil
Canada
China
Spain
UK
USA
Figure 7 Prevalence of overweight according to family income levels.Overweight defined by IOTF criteria. Survey years 1988–1994 (USA) and 1997 (Brazil, China). Children aged 6–18 years. Source: Wang et al. (67).
China Brazil
0
5
10
15
20
25
30
35
USA China Brazil
Pre
vale
nce
(%
)
Low
Medium
High
Figure 8 Prevalence of overweight according to residential area.Overweight defined by IOTF criteria. Survey years 1988–1994 (USA) and 1997 (Brazil, China). Children aged 6–18 years. Source: Wang et al. (67).
0
5
10
15
20
25
30
USA China Brazil
Pre
vale
nce
(%
)Urban
Rural

obesity reviews Obesity in children and young people IASO 19
© 2004 The International Association for the Study of Obesity. obesity reviews 5 (Suppl. 1), 4–85
in China within a 6-year period between 1991 and 1997,the prevalence of overweight and obesity increased from7.7% to 12.4%, while the prevalence of underweightdropped from 12.4% to 10.0%. In rural areas thesechanges were far less marked, with 1997 figures for over-weight (6.4%) and underweight (13.9%) little changedfrom 1991 (67).
It is likely that many other developing countries willshow similar trends as economic conditions develop. OnlyRussia shows a reversal of the trend – probably attributableto the dramatic fall in economic prosperity suffered by thatcountry during the early 1990s (see Fig. 9).
2.1.1. Prevalence of overweight in different regions
Americas. Extensive data have been collected over the pastthree decades that allow examination of the prevalencerates and secular trends of childhood obesity in the Amer-
icas (see Appendix 1). An estimate for the region as a wholeis shown in Fig. 10.
The most comprehensive and comparable national rep-resentative data on trends in the prevalence of obesity arefrom the USA, which are the NHE I and II data collectedin the 1960s and the four NHANES collected between1971 and 2000. These data show that the combined prev-alence of obesity and overweight among American childrenand adolescents has more than doubled, while the preva-lence of obesity has increased fourfold – and the ratescontinue to increase (68,69). Among US children and ado-lescents aged 6–18 years, the prevalence of overweight(including obesity)(IOTF definitions) has increased from15.4% in 1971–1974 to 25.6% in 1988–1994. Some socio-economic status groups, however, are disproportionatelyaffected. US data for overweight prevalence among chil-dren according to household income are shown earlier inthis section. Racial background is also a highly relevantfactor in the US: the most recent figures for 1999–2000(using obesity defined as >95th centile, CDC 2000 reference)show that black and Hispanic children are approximatelytwice as likely to be obese as white, non-Hispanic children(Fig. 11), their prevalence rates having risen rapidly withinthe previous decade (69).
In Canada in 1981, only 11% of boys and 13% of girlswere overweight or obese according to the IOTF reference,while by 1996 these figures reached 33% and 27% for boysand girls, respectively (66).
Data from Brazil and Chile are good examples to showthat the rate of increase of obesity among children in somedeveloping countries is similar to or even faster than thatin the USA. In Brazil, three nation-wide, large-scale surveyswere conducted in 1974–75, 1989 and 1997. The preva-lence of overweight (including obesity)(IOTF criteria) tri-pled between the 1970s and the late 1990s, increasing from4.1% to 13.9% among children and adolescents aged 6–18 years (67). In contrast, among pre-school children the
Figure 9 Changes in the prevalence of under- and overweight in Brazil, China and Russia. Overweight defined by IOTF criteria, underweight defined by <5th centile on US NHANES-I. Children aged 6–18 years. Source: Wang et al. (67).
0
5
10
15
20
1974Brazil
1997 1991China
1997 1992Russia
1998
Pre
vale
nce
(%
)
Underweight Overweight
Figure 10 Prevalence of overweight and obesity in the Americas.Overweight and obesity defined by IOTF criteria. Based on surveys in different years after 1990. Source: IOTF (1).
0
5
10
15
20
25
30
35
40
5–9 yearsBoys
13–17 years 5–9 yearsGirls
13–17 years
Pre
vale
nce
(%)
Obese Overweight
Figure 11 Obesity among children according to racial group. Obesity according to 95th centile, CDC 2000 reference. Survey (NHANES) 1999–2000. Source: Ogden et al. (69).
0
5
10
15
20
25
White, non-Hispanic Black, non-Hispanic Mexican-American
Pre
vale
nce
(%
)
Age 6–11 years
Age 12–19 years
20 Obesity in children and young people IASO obesity reviews
© 2004 The International Association for the Study of Obesity. obesity reviews 5 (Suppl. 1), 4–85
prevalence of obesity (WHZ > 2) fell by a third from 7.6%in 1975 to 4.5% in 1996 (61), which might be related tothe decline of stunting. In Chile, two large surveys con-ducted in 6-year-old children showed a remarkable increasein childhood overweight (including obesity) between 1987and 2000, from 12% to 26% in boys and from 14% to27% in girls, based on the IOTF reference (70).
There are few data available for schoolchildren in mostother South and Central American countries, but some datahave been collected for pre-school children. In general,these data suggest a fast or moderate increase in obesityamong pre-schoolers over the survey periods. In Bolivia,the prevalence of overweight (WHZ > 1) increased from15.9% in 1989 to 22.7% in 1997 (62), and in the Domin-ican Republic it rose from 12.3% to 15.3% between 1986and 1996 (62). On the other hand, the prevalence of obe-sity (WHZ > 2) in pre-school children has dropped in somecountries in this region, such as Columbia where itdecreased from 4.6% to 2.6% between 1986 and 1995(61).
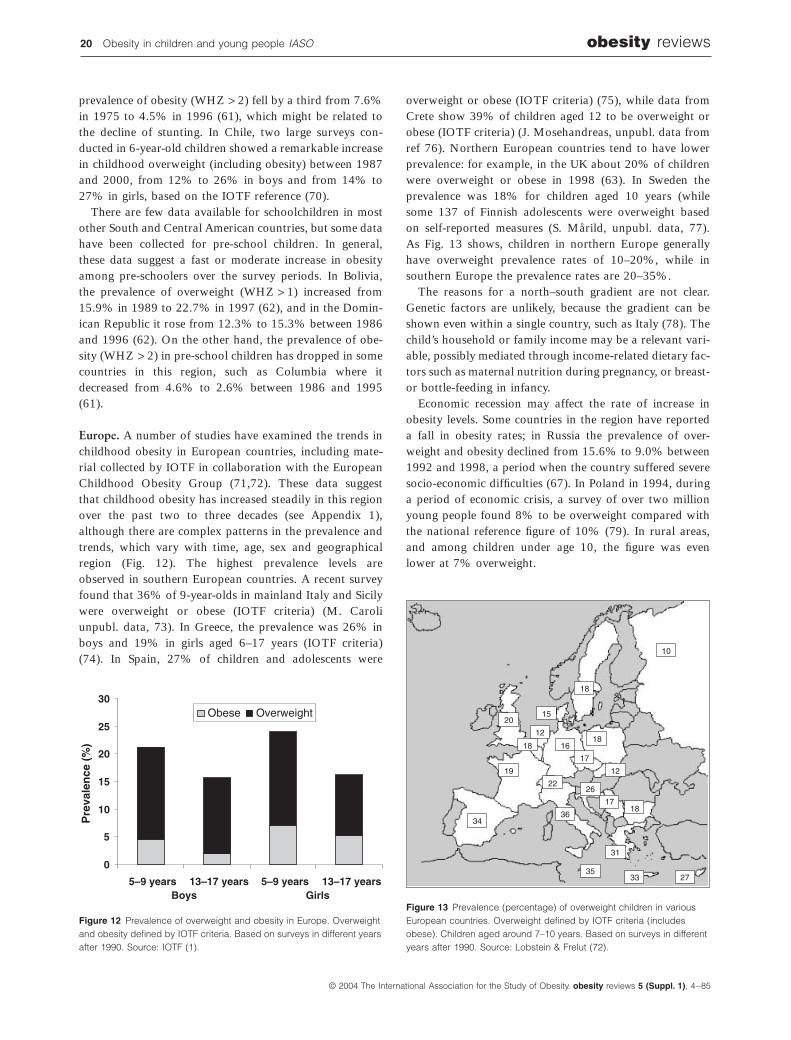
Europe. A number of studies have examined the trends inchildhood obesity in European countries, including mate-rial collected by IOTF in collaboration with the EuropeanChildhood Obesity Group (71,72). These data suggestthat childhood obesity has increased steadily in this regionover the past two to three decades (see Appendix 1),although there are complex patterns in the prevalence andtrends, which vary with time, age, sex and geographicalregion (Fig. 12). The highest prevalence levels areobserved in southern European countries. A recent surveyfound that 36% of 9-year-olds in mainland Italy and Sicilywere overweight or obese (IOTF criteria) (M. Caroliunpubl. data, 73). In Greece, the prevalence was 26% inboys and 19% in girls aged 6–17 years (IOTF criteria)(74). In Spain, 27% of children and adolescents were
overweight or obese (IOTF criteria) (75), while data fromCrete show 39% of children aged 12 to be overweight orobese (IOTF criteria) (J. Mosehandreas, unpubl. data fromref 76). Northern European countries tend to have lowerprevalence: for example, in the UK about 20% of childrenwere overweight or obese in 1998 (63). In Sweden theprevalence was 18% for children aged 10 years (whilesome 137 of Finnish adolescents were overweight basedon self-reported measures (S. Mårild, unpubl. data, 77).As Fig. 13 shows, children in northern Europe generallyhave overweight prevalence rates of 10–20%, while insouthern Europe the prevalence rates are 20–35%.
The reasons for a north–south gradient are not clear.Genetic factors are unlikely, because the gradient can beshown even within a single country, such as Italy (78). Thechild’s household or family income may be a relevant vari-able, possibly mediated through income-related dietary fac-tors such as maternal nutrition during pregnancy, or breast-or bottle-feeding in infancy.
Economic recession may affect the rate of increase inobesity levels. Some countries in the region have reporteda fall in obesity rates; in Russia the prevalence of over-weight and obesity declined from 15.6% to 9.0% between1992 and 1998, a period when the country suffered severesocio-economic difficulties (67). In Poland in 1994, duringa period of economic crisis, a survey of over two millionyoung people found 8% to be overweight compared withthe national reference figure of 10% (79). In rural areas,and among children under age 10, the figure was evenlower at 7% overweight.
Figure 12 Prevalence of overweight and obesity in Europe. Overweight and obesity defined by IOTF criteria. Based on surveys in different years after 1990. Source: IOTF (1).
0
5
10
15
20
25
30
5–9 yearsBoys
13–17 years 5–9 yearsGirls
13–17 years
Pre
vale
nce
(%
)
Obese Overweight
Figure 13 Prevalence (percentage) of overweight children in various European countries. Overweight defined by IOTF criteria (includes obese). Children aged around 7–10 years. Based on surveys in different years after 1990. Source: Lobstein & Frelut (72).
10
1718
31
36
22
19
18
12
2015
1618
18
33 2735
34
26
12
17

obesity reviews Obesity in children and young people IASO 21
© 2004 The International Association for the Study of Obesity. obesity reviews 5 (Suppl. 1), 4–85
In Croatia, which experienced less economic recession,there appeared to be little change in excess weight levels inschoolchildren between the early and later 1990s (80),while in the Czech Republic, also less economically dam-aged than Russia, overweight (above 90th centile 1991reference) rose modestly from 10% to 12.5% in the period1991–1999 (81).
North Africa, Eastern Mediterranean and Middle Eastregion. Several countries in this region appear to be showinghigh levels of childhood obesity. In Egypt, for example, theprevalence of overweight (including obesity) (based onWHZ > 1) was over 25% in pre-school children (62) and14% in adolescents (82). The prevalence of obesity(WHZ > 2) in pre-school children increased from 2.2% inthe 1970s to 8.6% in the 1990s (62). Similar trends arefound in other parts of North Africa. In Morocco, theprevalence of obesity (WHZ > 2) among pre-school childrenrose from 2.7% in 1987 to 6.8% in 1992 (61), and in Tunisiafrom 1.3% in the 1970s to 3.5% in the late 1980s (61).
A 1999–2000 survey in Cyprus found that 25% of chil-dren aged 6–17 years were overweight or obese (IOTF)(83). Similarly, a fifth of adolescents aged 15–16 years inSaudi Arabia had BMI values more than 120% abovereference median values (84). Estimates for the region areshown in Fig. 14.
Asia Pacific region. Just as for countries in Africa and inSouth and Central America, there are fewer data availablefor school children than for pre-school children from devel-oping countries in this region, which makes it difficult toconduct a full examination of the secular trends in obesity.As shown in Appendix 1, the available data indicate thatthe prevalence of overweight varies considerably betweendifferent countries in this region. An estimate of the overallregional prevalence is given in Fig. 15.
The prevalence of obesity (WHZ > 2) among pre-schoolchildren remains very low in many developing countries in
this region: Bangladesh (1.1%), the Philippines (0.8%),Vietnam (0.7%) and Nepal (0.3%) (61). It should be notedthat no data are available for some countries in the region(e.g. Nauru, Cook Islands, Fiji) where adult obesity preva-lence rates are known to be high. In these countries, prev-alence rates in the child and adolescent populations are alsoexpected to be high.
In most countries where trends data are available, child-hood obesity has increased. In some countries this has beenvery rapid, while in other countries it has occurred at amuch slower pace. For example, among Australian childrenand adolescents aged 2–18 years, the prevalence of over-weight and obesity nearly doubled in 10 years, 1985 to1995, from 12% to over 20% (IOTF criteria) (64). InJapan, between 1974 and 1995, the prevalence of over-weight (including obesity) doubled, rising from 5.5% to10.8% (>120% standard body weight) (85). Middle-income countries in this region, such as Singapore, SouthKorea and Thailand, have also all experienced an increasein childhood obesity.
In mainland China, whose population accounts for one-fifth of the global population, the prevalence of obesity hasbeen rising quickly in both adults and children during thepast two decades. Based on the IOTF reference, over a 6-year period from 1991 to 1997, China faced a moderateincrease in the prevalence of overweight, from 6.4% to7.7% (67), but the increase was more prominent in urbanareas (67,86), where it went from 7.7% to 12.4% between1991 and 1997. Furthermore, the increase is higher amongurban pre-school children (87) with the prevalence of over-weight rising from 15% to 29% (IOTF definition). In HongKong and Taiwan the prevalence also increased in the1990s (88,89), although the increase was not as dramaticas that in mainland China.
Even in low-income countries where obesity remainsrare, the prevalence has started to increase. In Bangladesh,for example, the prevalence of obesity in pre-school chil-dren increased from 0.1% in 1982–1983 to 1.1% in 1996–1997 (61).
Figure 14 Prevalence of overweight and obesity in the North African and Middle East region. Overweight and obesity defined by IOTF criteria. Based on surveys in different years after 1990. Source: IOTF (1).
0
5
10
15
20
25
30
5–9 yearsBoys
13–17 years 5–9 yearsGirls
13–17 years
Pre
vale
nce
(%
)
Obese Overweight
Figure 15 Prevalence of overweight and obesity in the Asia-Pacific region.Overweight and obesity defined by IOTF criteria. Based on surveys in different years after 1990. Source: IOTF (1).
0
5
10
15
5–9 yearsBoys
13–17 years 5–9 yearsGirls
13–17 years
Pre
vale
nce
(%
)
Obese Overweight

22 Obesity in children and young people IASO obesity reviews
© 2004 The International Association for the Study of Obesity. obesity reviews 5 (Suppl. 1), 4–85
As with some parts of Africa, the prevalence of obe-sity in pre-school children has dropped in some coun-tries in the Asia-Pacific region. It is worth noting,however, that although the epidemic of obesity seems tohave affected a wide range of countries, under-nutritionis still a major problem. In China, the prevalence ofunderweight (<5th percentile BMI of the US NCHS refer-ence) was 9% among children aged 6–9 years, and 15%among children aged 10–18, in 1997 (67). In Indonesiaover 25% and in Bangladesh and India over 45% ofchildren under 5 years old are underweight (90,91).Thus, several of the most populous countries in thisregion are facing a double burden of continued under-nutrition and rising over-nutrition.
Sub-Saharan Africa. There are very limited representativedata available from African countries for studying the sec-ular trends in childhood obesity, because most publichealth- and nutrition-related efforts have been focused onmalnutrition and food safety problems. Most of the avail-able data that do exist are collected for pre-school childrenand focus on malnutrition (see Appendix 1). In general, theprevalence of childhood obesity remains very low in this
region, except for countries such as South Africa whereobesity has become prevalent in adults, particularly amongwomen, and where childhood obesity is also rising.
According to a recent comprehensive study conductedamong pre-school children from 24 sub-Saharan countriesexcluding South Africa (62), the prevalence of overweightincluding obesity (defined as a weight-for-height standard-ized score greater than one, i.e. WHZ > 1) was below 10%in 18 countries, and the prevalence of obesity alone(defined as WHZ > 2) was below 5% in all countries exceptone (Malawi). Overall, the prevalence of overweight(including obesity) was 8.4% while for obesity alone theprevalence was 1.9%.
In some countries, the prevalence of obesity in pre-schoolchildren has dropped over the past two decades – in Mau-ritius it fell from 5.6% in 1985 to 4.0% in 1995 and inTanzania it fell from 3.4% in 1991–1992 to 2.5% in 1996(61). Among older children the IOTF estimates that, forthe region as a whole, overweight and obesity affects lessthan 1% of children aged 5–17 years (see Fig. 16) althoughit is likely that sub-groups in urban locations or with higherfamily incomes will have substantially higher prevalencelevels.
Data from South Africa (92) show the prevalence ofoverweight (including obesity) to be amongst the highest inthe whole region. Data for young people aged 13–19 yearsshows the prevalence of overweight to be over 17% (IOTFcut-offs) with boys generally less at risk (7%) than girls(25%). Prevalence was highest (over 20% for both boysand girls) in white and Indian population groups.
Of all regions in the world, Sub-Saharan Africa showsthe highest rates of poverty and has been subjected to war,recurrent famine and high rates of child mortality. In addi-tion it is experiencing a widespread epidemic of HIV/AIDSaffecting 5–10% of the adult population in the region,and in some areas affecting over 20%. A reduction in adultproductivity through sickness or through having to care fora sick family member will reduce family earnings andreduce access to food supplies for children as well as adults.Medical costs may mean that land and livestock are sold,jeopardizing food security.
Figure 16 Prevalence of overweight and obesity in Sub-Saharan Africa.Overweight and obesity defined by IOTF criteria. Based on surveys in different years after 1990. Source: IOTF (1).
0
5
10
5–9 yearsBoys
13–17 years 5–9 yearsGirls
13–17 years
Pre
vale
nce
(%
)
Obese Overweight

obesity reviews Obesity in children and young people IASO 23
© 2004 The International Association for the Study of Obesity. obesity reviews 5 (Suppl. 1), 4–85
3. COUNTING THE COSTS: THE PHYSICAL, PSYCHO-SOCIAL AND ECONOMIC CONSEQUENCES OF CHILDHOOD OBESITY
The rise in childhood obesity has been accompanied byhigher rates of the correlates of obesity and the emergenceof new, or newly identified, health conditions. Once con-sidered rare in children, cardiovascular risk factors, type 2diabetes and menstrual abnormalities began to be reportedin paediatric literature in the 1980s and 1990s. Theiroccurrence in some populations is now routinely observed.As Pinhas-Hamiel & Zeitler have suggested (93), ‘life-style-related diseases are no longer the exclusive domain of adultmedicine’ (p. 704).
The health effects of the rise in prevalence in child-hood obesity are made more serious by the increasedseverity of the condition. Not only is a greater propor-tion of the population overweight, but those that areoverweight are more overweight than typically observedbefore, with the most extreme levels in particularappearing more frequently. The delineation of the fullrange of health consequences linked to excess body-weight among children and adolescents may help todirect resources to their prevention.
3.1. Physical health consequences
Until recently, the complications of childhood obesity wereunlikely to be clinically apparent for many years after theobesity developed, so that the consequences of obesity dur-ing childhood were rarely seen. Clinical studies of obesechildren have suggested a range of medical conditions forwhich obese children are at greater risk (94). As shown inTable 5, there are few organ systems that severe obesitydoes not affect. These conditions are important becausethey are widely prevalent, potentially serious and carry life-time consequences for health and well-being.
3.1.1. Sleep-disordered breathing and asthmaA well-established pulmonary consequence of childhoodobesity is ‘sleep-associated breathing disorder’, most clearlyseen in severe obesity. The term refers to a broad spectrumof sleep-related conditions including increased resistance toairflow through the upper airway, heavy snoring, reductionin airflow (hypopnoea) and cessation of breathing(apnoea). Obesity-linked hypoventilation syndrome, some-times referred to as Pickwickian syndrome, is a seriouscondition associated with pulmonary embolism and suddendeath in children (95). In one small study, one-third ofsubjects with severe obesity had symptoms consistent withsleep apnoea, and 5% had severe obstructive sleep apnoea(96). Another study found abnormal sleep patterns in 94%of obese children (97), with oxygen saturation below 90%for approximately half of total sleep time and with 40%
of severely obese children showing central hypoventilation.Secondary metabolic correlates of obstructive sleep apnoeainclude hyperinsulinaemia, after accounting for obesityseverity (98). Clinically significant effects on learning andmemory function in obese children with obstructive sleepapnoea represent a troubling consequence of severe obesity(99).
Several cross-sectional studies have suggested an associ-ation between childhood overweight and asthma (100–102). In a representative survey of US children aged2 months to 18 years, BMI above the 85th centile waslinked to increased asthma prevalence, independent of age,sex and ethnicity (103), although socio-economic statusand smoking were associated predictors. A representativesurvey in the UK showed asthma and obesity linked amonggirls in an inner city area, but not among boys (104). A 4-year prospective study in the UK indicated a relative riskof at least 4 for asthma, or asthma symptoms, in a high-weight group compared with a normal-weight referencegroup (102). Asthma and its symptoms are a difficult topic
Table 5 Physical consequences of childhood and adolescent obesity
PulmonarySleep apnoeaAsthmaPickwickian syndrome
OrthopaedicSlipped capital epiphysesBlount’s disease (tibia vara)Tibial torsionFlat feetAnkle sprainsIncreased risk of fractures
NeurologicalIdiopathic intracranial hypertension (e.g. pseudotumour cerebri)
GastroenterologicalCholelithiasisLiver steatosis / non-alcoholic fatty liverGastro-oesophageal reflux
EndocrineInsulin resistance/impaired glucose toleranceType 2 diabetesMenstrual abnormalitiesPolycystic ovary syndromeHypercorticism
CardiovascularHypertensionDyslipidaemiaFatty streaksLeft ventricular hypertrophy
OtherSystemic inflammation/raised C-reactive protein

24 Obesity in children and young people IASO obesity reviews
© 2004 The International Association for the Study of Obesity. obesity reviews 5 (Suppl. 1), 4–85
for study and a causative biological link between excessweight and asthma should not be assumed: children withasthma may have reduced physical activity levels, andasthma treatment medication may cause weight gain (103).Nonetheless, the observation that weight loss can improvelung function in obese adults (105) suggests that obesityprevention may decrease the impact of asthma, if not itsoccurrence.
3.1.2. Fatty liver diseaseNon-alcoholic fatty liver disease (NAFLD) is increasinglyrecognized as a major health burden in obese children.NAFLD is a spectrum, ranging from fatty infiltration of theliver alone (steatosis) that is relatively benign to fatty infil-tration with inflammation known as steatohepatitis or non-alcoholic steatohepatitis (NASH) and characterized by thepotential to progress to fibrosis, cirrhosis and end-stageliver disease (106). Current prevalence estimates indicatethat NAFLD affects approximately 3% of all children invarious countries and from 23% to 53% of children whoare obese, with up to 70% of these having steatohepatitis,severe fibrosis or cirrhosis (107,108). NAFLD thereforeappears to be a common form of liver disease in manychildren, especially in developed countries where the obe-sity epidemic is most advanced.
Childhood NAFLD is typically a silent disease detectedas asymptomatic elevation of the hepatic transaminases.Certain children complain of malaise, fatigue or a sensa-tion of fullness or discomfort in the right upper abdomen,and some may have acanthosis nigricans on physicalexamination. The natural history of NASH is generallyone of slow progression with manifestation of clinical dis-ease in adulthood, although advanced liver disease includ-ing cirrhosis is known to occur in association withchildhood obesity.
Severity of obesity and the presence of diabetes orhyperlipidaemia are clinical predictors of more advancedNAFLD. The coexistence of obesity and diabetes is likelyto be additive – in a study of severely obese diabeticadults, all had some degree of steatosis, 50% had steato-hepatitis and 19% had cirrhosis (109). Elevation of thehepatic enzymes aspartate aminotransferase and alanineaminotransferase are additional predictors of the pres-ence of NAFLD and NASH, although significant liverdisease can exist with levels of these transaminases in thenormal range. The degree of elevation of serum ami-notransferase concentration, therefore, has little predic-tive value and does not distinguish between steatosis andsteatohepatitis. Similarly, while hepatic ultrasound orMRI can detect a fatty liver and NAFLD, they providelittle or no information on the presence or degree offibrosis or cirrhosis. The identification of an accuratenon-invasive or blood marker for NASH is the subject ofintense research, yet at present liver biopsy is the only
means to distinguish between steatosis and steatohepati-tis, fibrosis or cirrhosis
The pathogenesis of NAFLD and mechanisms that resultin steatosis versus steatohepatitis and its sequelae areincompletely understood, but probably involve a combina-tion of insulin resistance leading to accumulation of fat inhepatocytes and the generation of reactive oxidative speciesresulting in oxidative hepatocyte damage (110,111). Thishas led to treatment attempts utilizing antioxidants, withvarying degrees of success. To date, the results of treatmentstudies for NASH are not conclusive because of designlimitations such as small patient numbers and differencesin definitions of NASH and endpoints. While the efficacyand role of other therapeutic strategies including pharma-ceuticals remain to be proven, exercise and diet resultingin controlled weight loss can reverse the progress of fattyliver disease (112), and hence remain the cornerstones oftherapy.
3.1.3. Menstrual problems and early menarcheAbnormalities in menstruation and early menarche repre-sent part of the endocrine response to excess body weightin girls. Previous studies have established a relationshipbetween obesity and lowered fertility (113,114) but theimpact of excess weight on menstrual problems in adoles-cence is less well established.
Oligomenorrhoea or amenorrhoea associated with obe-sity, insulin resistance, hirsutism, acne and acanthosisnigricans comprise a ‘polycystic ovary syndrome’. Theappearance of insulin resistance in youth, associated withoverweight, may foreshadow an increased prevalence ofpolycystic ovary syndrome in adolescence. The prevalenceof polycystic ovary syndrome in youth is unknown, and itis often undiagnosed because adolescents rarely have thecharacteristic ultrasonic ovarian morphology or becausealtered menstrual patterns or late menstruation may gounrecognized. Hormonal patterns typical of polycysticovary syndrome, however, are increasingly described inobese children (115,116). In a case-control study, increasedBMI at age 18 (based on recalled weight and height) wasassociated with elevated risk of ovulatory-related infertilityin young women (117). This study, of the US Nurses IIcohort, also indicated a positive association between BMIat age 18 and irregular menstrual cycling.
Menarcheal timing is influenced by weight status, withhigher relative weights associated with earlier menarche(118,119). The rise in childhood obesity seen in the lastdecade among younger children may result in a furtherlowering of the population average age of menarche. Evi-dence from the US NHANES II study shows that the fre-quency of early menarche is closely linked to obesity status:33% of higher-weight girls attained menarche before age11 compared with less than half that proportion amonglower-weight girls, and the difference is even more marked

obesity reviews Obesity in children and young people IASO 25
© 2004 The International Association for the Study of Obesity. obesity reviews 5 (Suppl. 1), 4–85
when looking at the proportions of girls attainingmenarche below the age of 10 years (see Table 6). Thepossible health consequences of early menarche are bothimmediate and delayed. Early menarche is an establishedrisk factor for breast cancer and has been linked to othercancers of the female reproductive system (120,121). Earlymenarche has been proposed as a risk factor for commonpsychiatric problems experienced by adolescent girls:depression, disordered eating and substance abuse(122,123). The mechanism for these effects may be affilia-tion with an older peer group. Finally, early menarche hasbeen associated with increased risk of spontaneous abor-tion in adulthood (124).
Delayed maturation linked to obesity in adolescent boys.Overweight boys tend to show later maturation than theirnon-overweight counterparts. Although early sexual matu-rity is associated with overweight in girls, in boys thereverse appears to be the case, with the prevalence of over-weight and obesity higher in late maturers than in earlymaturers (59). The differences are also reflected in thechanging body composition that occur during puberty,when girls tend to increase fat mass as a result of matura-tion while boys tend to increase muscle and other non-fatbody mass.
3.1.4. Type 2 diabetesPreviously only seen in adults, the emergence of type 2diabetes in youth represents a particularly alarming conse-quence of the obesity epidemic in children. The onset ofdiabetes in youth will increase the risk in early adulthoodof the advanced complications of the disorder – cardiovas-cular disease, kidney failure, visual impairment and limbamputations. A review by the American Diabetes Associa-tion suggests that as many as 45% of paediatric diabetescases are the type 2 non-insulin dependent form (125).
Although other factors are associated with type 2 diabe-tes in children (including family history, ethnicity and thepresence of acanthosis nigricans), the most important riskfactor is obesity. In a study of childhood diabetes, Scottet al. (126) found excess bodyweight among over 90% ofadolescents with type 2 diabetes while among children withtype 1 diabetes excess bodyweight was found in about 25%of cases (see Fig. 17).
The prevalence of type 2 diabetes among children isdifficult to establish. In a multi-ethnic study of a clinicalpopulation of 167 obese children and adolescents in theUS, impaired glucose tolerance was present in 25% ofyounger obese children and 21% of obese adolescents by2 h tolerance test (127). Undiagnosed diabetes was detectedin 4% of the adolescents. Similar findings had been noted30 years earlier, when 17% of a group of 66 obese childrenshowed impaired glucose tolerance, and 6% met the crite-ria for type 2 diabetes (128).
As the prevalence of obesity rises, the prevalence of dia-betes type 2 can be expected to follow. In Cincinnati theprevalence of adolescent diabetes type 2 increased 10-foldfrom 0.7 to 7.2 cases per 100 000 population in the period1982 to 1994 (129). Similar rising numbers have beennoted in Arkansas Children’s Hospital, even among pre-adolescent children (see Fig. 18).
Ethnic minority groups that are known to be at risk ofhigh levels of adult diabetes may also show high levels ofdiabetes among adolescents. Rates as high as 5% have beenfound among adolescents in native American populations
Figure 17 Prevalence of excess bodyweight (>85th centile) in newly diag-nosed diabetic adolescents, USA. Source: Scott et al. (126).
0%
20%
40%
60%
80%
100%
NIDDM IDDM
Table 6 Proportion of girls attaining menarche below 11 and below 10 years of age, by weight status
NHANES II 1988–94 Below 95thcentile weight
Above 95thcentile weight
Age below 11 years 12.6% 33.0%Age below 10 years 2.0% 20.1%
Source: Anderson et al. (119).
Figure 18 Rising numbers of type 2 diabetic patients in a paediatric department in Arkansas. Children aged 8–12 years. Source: Scott et al. (126).
0
2
4
6
8
10
12
14
16
18
1988 1989 1990 1991 1992 1993 1994 1995
No
. of
pat
ien
ts
Years

26 Obesity in children and young people IASO obesity reviews
© 2004 The International Association for the Study of Obesity. obesity reviews 5 (Suppl. 1), 4–85
(see Table 7). The prevalence and incidence of diabetesamong indigenous Australians living in urban areas aresignificantly higher compared with those living in tradi-tional homelands (131).
In Europe, both type 2 diabetes and impaired glucosetolerance are being reported among obese adolescents. Fre-lut (132) reports type 2 diabetes prevalence rates of 1.9%in obese adolescent populations in Hungary, and impairedglucose tolerance of 15% among this group. In the UK,several cases of type 2 diabetes in childhood have beenreported among ethnic minority groups known to be athigher risk (133), and in 2002 the first cases were reportedamong white children (four cases aged 13–15 years, all ofwhom were obese) (134) (Table 8).
In Japan, the prevalence of type 2 diabetes is reported tohave nearly doubled in the period from the late 1970s tothe early 1990s, from 7.3 to 13.9 cases per 100 000 ado-lescents (135). A study in Tokyo of 1400 children attendinga diabetes clinic during the 1980s found that none underthe age of 9 years had type 2 diabetes, but by the age of13–14 years the proportions where roughly equal betweentype 1 and type 2 diabetes, with the proportion of type 2diabetes rising further into young adulthood (136).Japanese children with type 2 diabetes were both taller andheavier than the national average, and about 80% of thesechildren were obese (137).
Diagnosis of type 2 diabetes among children and adoles-cents is complicated. The majority of patients are asymp-tomatic or present with symptoms such as vaginalmonolilal infection, rather than the classic triad of poly-uria, polydipsia and weight loss (126).
Hyperinsulinaemia is a common feature in obese childrenand adolescents (138). The relationship appears non-linear,with little increased risk of hyperinsulinaemia as BMIincreases up to the 85th or 90th centile, but with dramaticallyincreased risk above the 95th and especially the 97th centileof BMI (see Fig. 19). Adolescents (aged 11–18 years) abovethe 90th centile for BMI had higher levels of plasma insulin(mean 23.7 mU mL-1) than those below the 90th centile BMI(mean plasma insulin 11.7 mU mL-1) (140).
As a progressive condition for which treatment reliesheavily on self-management, type 2 diabetes in youth willrequire particular attention from health care providers andcarers. Physical activity improves insulin resistance in bothobese and non-obese youth (141) and weight loss improvesinsulin sensitivity and decreases hyperinsulinaemia (138),although obese children who maintain weight loss continueto show elevated insulin levels in spite of improved glucosetolerance (142).
Maternal diabetes increases the risk of having an over-weight child (see later in this report on risk factors forchildhood obesity). A diabetic cycle may thus be estab-lished in which overweight adolescent girls and youngwomen develop diabetes and become pregnant, are thenlikely to have heavier babies which in turn are at risk ofchild and adolescent obesity and hence at risk of becomingdiabetic.
3.1.5. Cardiovascular risk factorsThe Bogalusa study in Louisiana has provided detailedinformation on cardiovascular risk factors in childhood(see Fig. 20) and their persistence into adulthood (143). Inthe study, overweight during adolescence was associatedwith an 8.5-fold increase in hypertension, a 2.4-fold increase in the prevalence of high total serum choles-terol values, a 3-fold increase in high LDL serumcholesterol values and an 8-fold increase in low HDL serumcholesterol levels as adults aged 27–31 years (144). Simi-larly, the Muscatine study in Iowa has shown that adoles-cent obesity, especially in males, is associated with higherlevels of total and LDL cholesterol in adulthood (145).
Table 8 Type 2 diabetes and impaired glucose tolerance among obese adolescents in various European countries
Sample size Type 2diabetes (%)
Impaired glucosetolerance (%)
Hungary 207 1.9 14.9Germany 512 1.6 5.3Italy 800 <0.3 4.4France 256 <0.2 5.0
Source: Frelut (132). Definitions of obesity differ.
Table 7 Diabetes type 2 in US and Canadian populations aged 15–19 years
Population group Type 2 diabetes prevalence (%)
All native Americans 0.5Pima native Americans 5.1Cree native Canadians 0.2
Source: Fagot-Campagna et al. (130).
Figure 19 Proportion of children with raised insulin levels by BMI centiles.Percentage with insulin levels above the 95th centile. Children aged 5–10 years. Source: Freedman et al. (139).
0%
5%
10%
15%
20%
25%
30%
<25 25-49 50-74 75-84BMI centiles
85-94 95-97 >97

obesity reviews Obesity in children and young people IASO 27
© 2004 The International Association for the Study of Obesity. obesity reviews 5 (Suppl. 1), 4–85
Hypertensive children who continue to have high bloodpressure in adulthood are more likely to have higher bodyweight, BMI, skin-fold thickness and substantially greaterwaist and hip circumferences (146).
Several studies have shown links between weight gain inchildhood and a subsequent increase in cardiovascular riskfactors in urban African-Americans (147) and in popula-tions in Finland (148,149). The Finnish data suggest thatthe cluster of cardiovascular risk factors in adulthood –including hypertension, hypertriglyceridaemia, low HDLcholesterol and hyperinsulinaemia – sometimes referred toas the metabolic syndrome, is especially common among
obese adults who were also obese as children (Table 9). Theprevalence of a metabolic syndrome among adolescentsaged 12–19 years has been investigated in the NHANES1988–1994 cohort (150). The overall prevalence of thesyndrome was 4.2% (6.1% among males and 2.1% amongfemales). The prevalence was significantly related to weightstatus, being found among less than 0.1% of adolescentsof normal weight (BMI below 85th centile), rising to 6.8%among overweight adolescents (BMI 85th-95th centiles) andan extraordinary 28.7% among obese adolescents (BMI95th centile and above).
Hypertension. The Task Force on Blood Pressure (151)indicated that detection and prevention of hypertension ina paediatric population and its early treatment contributeto a reduction in the high risk of morbidity in adulthood.
Obesity is frequently associated with hypertension inadults and the same appears true in children (Fig. 21). Upto 30% of obese children suffer from hypertension (152),and among adolescents one survey found 56% of thosewith persistent elevated blood pressure were also signifi-cantly overweight (153). A second study has shown that
Table 9 Prevalence of metabolic syndrome among adults according to childhood obesity status
Prevalence Odds ratio
Obese as adults, not obese inchildhood (n = 71)
10% 16
Obese as adults, obese inchildhood (n = 75)
28% 56
Not obese as adults (n = 293) 1% 1
Source: Vanhala et al. (149).
Figure 20 Prevalence of excess weight among children with up to four risk factors for cardiovascular disease. (Risk factors: elevated TG, LDL, insulin, or BP; low HDL.). Source: Freedman et al. (139).
0 1 2 3 4+
0
10
20
30
40
50
60
70
80
90
100
No. of risk factors
11–17 years
0 1 2 3 4+
0
10
20
30
40
50
60
70
80
90
100
No. of risk factors
5–10 yearsO
verw
eig
ht
(% )
Ove
rwei
gh
t (%
)
Figure 21 Proportion of children with raised systolic and diastolic blood pressure by BMI centiles. Percentage with blood pressure measures above 95th centiles. Children aged 5–10 years. Source: Freedman et al. (139).
0%
5%
10%
15%
20%
25%
<25 50-74 85-94 >97
Diastolic
Systolic
BMI centiles

28 Obesity in children and young people IASO obesity reviews
© 2004 The International Association for the Study of Obesity. obesity reviews 5 (Suppl. 1), 4–85
measures of resting blood pressure are correlated withwaist circumference and skin-fold measurements in chil-dren (154). Measures of blood pressure during exercisemay provide further evidence of the links between obesityand hypertension in children (155).
Insulin resistance and hypertension may be present aspart of the metabolic syndrome associated with obesity.Overweight young people with blood pressure valuesabove normal levels show a tendency to higher fastingplasma insulin levels. The Bogalusa Heart Study on car-diovascular risk factors showed a significant positive cor-relation between insulin levels and blood pressure inchildren aged 5–12 years, but not in adolescents. Otherresearchers, however, suggest that blood pressure is medi-ated by the secretion from fat tissue of factors such asleptin and angiotensinogen (156) or possibly adiponectin(157).
Serum lipids and lipoproteins. Increased levels of LDLcholesterol, decreased levels of HDL cholesterol and raisedserum triglyceride levels are highly correlated withincreased triceps skin-fold thickness among adolescents(158) and with centile scores of BMI (159). The relation-ship may be non-linear, however, with no significantincreases in these measures in children with BMIs belowthe 85th BMI centile, but with dramatic increases foundamong children above the 97th BMI centile (see Fig. 22).
Prospective studies show that the serum lipid and lipo-protein levels can track from childhood into young adult-hood and are predictive of adults levels. A longitudinalstudy over 15 years of 1169 children aged 5–14 years atthe beginning of the study found that their lipoproteinlevels in childhood were associated with their levels whenthey became adults; more strongly for total cholesterol(r = 0.6) and LDL (r = 0.4–0.6) than for high-density lipo-
protein cholesterol (r = 0.4) and triglycerides (r = 0.1–0.4)(160). The best predictor for adult dyslipidaemia was child-hood LDL level. An effect of weight gain on future lipidand lipoprotein levels was also demonstrated. Weight gainwas second only to initial levels of lipid and lipoprotein inpredicting adult levels. The link between weight gain andadult lipid and lipoprotein levels increased during the tran-sition from adolescence to young adulthood, and was espe-cially strong in males.
3.2. Psychological and social consequences
Obesity in children and adolescents may have its mostimmediate consequences in the psychological and socialrealms. Stigmatization of obese children and adolescentshas long been recognized in Westernized cultures, and iswell documented among the children’s peers. A 1967 studyshowed that young boys (aged 6–10 years) described obesebody types as being indicative of negative personality char-acteristics – cheating, lazy, sloppy, lying, naughty, mean,ugly, dirty or stupid (161). Similar observations have beenmade among Australian boys and girls (aged 8–12 years)(162). In younger children the degree of negative stereotyp-ing increased with age (163). Among adolescents, girls maybe more affected than boys, although both genders reportsome negative experiences (164).
Providing children with medical explanations for thedevelopment of obesity did not appreciatively affect theirnegative characterization of a hypothetical obese peer(especially among older children) and did not influencetheir aversion for sharing activities with an obese peer(165). In a study where boys and girls (aged 10–11 years)were asked to rank order a series of drawings of childrenwith various handicaps (crutches, wheelchair, missing ahand, facial disfigurement, obesity) based on which childthey ‘liked best’, the drawing of an obese child was rankedlowest, irrespective of the ranking child’s sex, race, socio-economic status, living environment or own disability(166) and this finding has been replicated recently (167).Thus, although childhood obesity is far more common, thesocial reaction to an obese child does not appear to havesoftened.
Both the social and the economic consequences of obe-sity in childhood and adolescence are pervasive in Westernsocieties. American women who were obese as adolescentsbecame adults with lower educational attainment, earningless money, experiencing higher rates of poverty and havinga lower likelihood of marriage, compared with thinnerwomen (168). Similar results have been observed in a Brit-ish cohort (169). Obese youths have experienced greaterdiscrimination in attempting to rent apartments (170) andin gaining admission to colleges, although there is no evi-dence that obesity is related to lower academic aptitude orto a lesser desire to attend college (171,172).
Figure 22 Proportion of children with raised triglycerides (TG > 130 mg dL-1), raised low-density-lipoprotein cholesterol (LDL > 130 mg dL-1), and lowered high-density-lipoprotein cholesterol (HDL < 35 mg dL-1), by BMI centile. Children aged 5–10 years. Source: Freedman et al. (139).
0%
5%
10%
15%
20%
25%
<25 25-49 50-74 75-84 85-94 95-97 >97
BMI centile
Raised triglycerides
Raised LDL
Lowered HDL

obesity reviews Obesity in children and young people IASO 29
© 2004 The International Association for the Study of Obesity. obesity reviews 5 (Suppl. 1), 4–85
Given the stereotyping and discrimination experiencedby obese children, it might seem likely that obese youngpeople have fewer friends, and this has been shown inwork by Strauss (173), demonstrating the reduced num-bers of friends claimed by overweight girls compared withnon-overweight girls (see Fig. 23). In contrast, a study of9-year-old girls in the UK did not find that overweightchildren were less popular (175). Peer rejection and lackof friends in childhood, when it does occur, has beenassociated with reduced psychological functioning inadulthood (176).
The effect of obesity on a child’s self-esteem has receivedconsiderable study, although how self-esteem is measuredvaries and may include school academic performance, bodyappearance, athletic ability, social networking, behaviourand conduct attributes (177,178). Results generally indi-cate either a weak association between low self-esteem andobesity or no association (177,179), although there is someevidence that the association may differ by race (178) andthat athletic and body appearance aspects of self-esteemdiminish with increasing obesity (175).
Body dissatisfaction and a desire to lose weight has beenfound even in young children (180), but this desire is notlimited to children who are overweight and appears torepresent a separate construct. A study following childrenfor 4 years from the age of 9–10 years found that obesechildren did not differ in self-esteem from normal-weightchildren at the start of the period, but that their self-esteemwas more likely to decline over the following years; theeffects were most marked among white and Hispanic girlsbut were also detectable among black girls and among boys(179). Among older children there is a general finding ofdecreased self-esteem in obese compared with non-obeseyouth (177,179,181,182) but the effect is not universallyobserved (168,183). In a 7-year follow-up of adolescents
initially aged 16–24 years, those with a BMI above the 95thcentile did not show decreasing self-esteem according to asimple assessment method (168).
Few studies have assessed the association of obesity withconcurrent or subsequent psychiatric pathology, such asdepression or anxiety states. Braet et al. (184) comparedobese children from clinical and non-clinical settings withnormal weight controls and found that while self-esteemwas reduced in both obese groups, increased psychiatricpathology was only present among obese children in theclinical group, suggesting that the factors which led theparents to bring their child to seek treatment may be moreresponsible for the psychological effects than the obesityper se. Among Californian elementary school children amodest but statistically significant association betweenincreasing symptomatology of depression and higher BMIhas been observed for girls although not for boys (185).Eisenberg et al. (186) have reported increased suicidalideas, and suicidal attempts, among overweight adolescentswho reported being teased by peers or family members.
Being teased and feeling unhappy with one’s appearance– frequent correlates of childhood obesity – may influencethe psychological consequences of obesity (187). In a 1-year study of US adolescents, however, Goodman &Whitaker (188) found no evidence for obesity increasingthe risk of depression, although the instruments used (adichotomous screening questionnaire) may have reducedthe likelihood of detecting an effect.
Some of the negative consequences of adolescent obesityresult from unhealthy eating behaviours that accompanyelevated weight. In a large survey of high-school studentsin Minnesota, overweight adolescents were more likely toreport dissatisfaction with their weight and there wasevidence that unhealthy eating behaviours – binge eating,chronic dieting – were more common; after controlling forage, ethnicity and socio-economic status there was a resid-ual weak association between obesity and emotional healthin boys, and a similar weak association between obesityand suicidal ideation in girls (189). In a similar study ofConnecticut youth, overweight adolescent girls were morelikely to report hopelessness and to have attempted suicidethan normal weight girls (164). Results were attenuated forboys and did not reach statistical significance.
The evidence regarding the psychological consequencesof child and adolescent obesity is equivocal and is largelybased on studies of children in Western populations. Therehave been few reports of psychiatric pathology associatedwith excess weight, although occasional reports have beenpublished (190). Two recent review articles (191,192) pro-vide useful organizing frameworks for further studies inthis field.
The direction of causality needs to be considered,because depression or anxiety may be linked to weight gainthrough a number of changes in behaviour leading to
Figure 23 Friendship numbers according to overweight status. Source: Strauss & Pollack (174).
0
5
10
15
20
25
30
35
Six or more One or none
OverweightNormal weight
Number of friendshipnominations
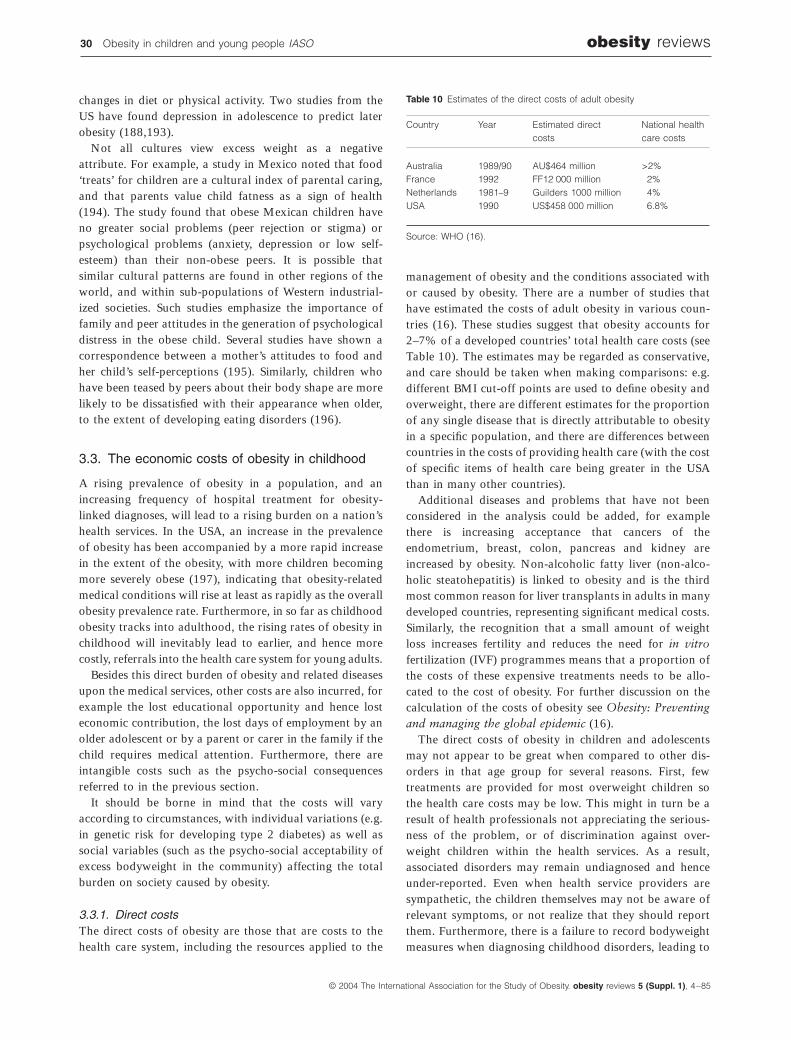
30 Obesity in children and young people IASO obesity reviews
© 2004 The International Association for the Study of Obesity. obesity reviews 5 (Suppl. 1), 4–85
changes in diet or physical activity. Two studies from theUS have found depression in adolescence to predict laterobesity (188,193).
Not all cultures view excess weight as a negativeattribute. For example, a study in Mexico noted that food‘treats’ for children are a cultural index of parental caring,and that parents value child fatness as a sign of health(194). The study found that obese Mexican children haveno greater social problems (peer rejection or stigma) orpsychological problems (anxiety, depression or low self-esteem) than their non-obese peers. It is possible thatsimilar cultural patterns are found in other regions of theworld, and within sub-populations of Western industrial-ized societies. Such studies emphasize the importance offamily and peer attitudes in the generation of psychologicaldistress in the obese child. Several studies have shown acorrespondence between a mother’s attitudes to food andher child’s self-perceptions (195). Similarly, children whohave been teased by peers about their body shape are morelikely to be dissatisfied with their appearance when older,to the extent of developing eating disorders (196).
3.3. The economic costs of obesity in childhood
A rising prevalence of obesity in a population, and anincreasing frequency of hospital treatment for obesity-linked diagnoses, will lead to a rising burden on a nation’shealth services. In the USA, an increase in the prevalenceof obesity has been accompanied by a more rapid increasein the extent of the obesity, with more children becomingmore severely obese (197), indicating that obesity-relatedmedical conditions will rise at least as rapidly as the overallobesity prevalence rate. Furthermore, in so far as childhoodobesity tracks into adulthood, the rising rates of obesity inchildhood will inevitably lead to earlier, and hence morecostly, referrals into the health care system for young adults.
Besides this direct burden of obesity and related diseasesupon the medical services, other costs are also incurred, forexample the lost educational opportunity and hence losteconomic contribution, the lost days of employment by anolder adolescent or by a parent or carer in the family if thechild requires medical attention. Furthermore, there areintangible costs such as the psycho-social consequencesreferred to in the previous section.
It should be borne in mind that the costs will varyaccording to circumstances, with individual variations (e.g.in genetic risk for developing type 2 diabetes) as well associal variables (such as the psycho-social acceptability ofexcess bodyweight in the community) affecting the totalburden on society caused by obesity.
3.3.1. Direct costsThe direct costs of obesity are those that are costs to thehealth care system, including the resources applied to the
management of obesity and the conditions associated withor caused by obesity. There are a number of studies thathave estimated the costs of adult obesity in various coun-tries (16). These studies suggest that obesity accounts for2–7% of a developed countries’ total health care costs (seeTable 10). The estimates may be regarded as conservative,and care should be taken when making comparisons: e.g.different BMI cut-off points are used to define obesity andoverweight, there are different estimates for the proportionof any single disease that is directly attributable to obesityin a specific population, and there are differences betweencountries in the costs of providing health care (with the costof specific items of health care being greater in the USAthan in many other countries).
Additional diseases and problems that have not beenconsidered in the analysis could be added, for examplethere is increasing acceptance that cancers of theendometrium, breast, colon, pancreas and kidney areincreased by obesity. Non-alcoholic fatty liver (non-alco-holic steatohepatitis) is linked to obesity and is the thirdmost common reason for liver transplants in adults in manydeveloped countries, representing significant medical costs.Similarly, the recognition that a small amount of weightloss increases fertility and reduces the need for in vitrofertilization (IVF) programmes means that a proportion ofthe costs of these expensive treatments needs to be allo-cated to the cost of obesity. For further discussion on thecalculation of the costs of obesity see Obesity: Preventingand managing the global epidemic (16).
The direct costs of obesity in children and adolescentsmay not appear to be great when compared to other dis-orders in that age group for several reasons. First, fewtreatments are provided for most overweight children sothe health care costs may be low. This might in turn be aresult of health professionals not appreciating the serious-ness of the problem, or of discrimination against over-weight children within the health services. As a result,associated disorders may remain undiagnosed and henceunder-reported. Even when health service providers aresympathetic, the children themselves may not be aware ofrelevant symptoms, or not realize that they should reportthem. Furthermore, there is a failure to record bodyweightmeasures when diagnosing childhood disorders, leading to
Table 10 Estimates of the direct costs of adult obesity
Country Year Estimated directcosts
National healthcare costs
Australia 1989/90 AU$464 million >2%France 1992 FF12 000 million 2%Netherlands 1981–9 Guilders 1000 million 4%USA 1990 US$458 000 million 6.8%
Source: WHO (16).

obesity reviews Obesity in children and young people IASO 31
© 2004 The International Association for the Study of Obesity. obesity reviews 5 (Suppl. 1), 4–85
a lack of information that could relate a range of possibledisorders to a child’s excess weight. Calculation of the truecosts of child obesity will need a methodology that takesinto consideration the associated disorders and their treat-ment costs.
One study that attempted to establish the costs forhospital treatment of obesity-related disorders in childrenhas been published by Wang & Dietz (198). Using UShospital discharge diagnoses during 1997–1999, theylisted the most frequent principal diagnoses where obesitywas listed as a secondary diagnosis. The most commonco-morbidities, accounting for over 40% of principaldiagnoses observed in obese children, are shown in Table11. Wang & Dietz then compared hospital diagnosis fig-ures in 1997–1999 with those around 18 years earlier,1979–1981, for the age group 6–17 years. They foundthe rate of asthma as an obesity-related co-morbidityincreased from 5.9% to 8.1% of hospital episodes. Dia-betes linked with obesity rose from 1.4% to 2.4%. Sleepapnoea rose fourfold to 0.8% and gall bladder diseaserose twofold to 0.6%. There will be some overlap ofdiagnoses, but from these figures it appears that thesefour obesity-related disorders alone account for over10% of child hospital episodes, and that this figure isnearly twice that found two decades earlier. These datamay be an under-representation of the true prevalence,given that it is likely that obesity was under-reported as asecondary diagnosis. In addition, Wang & Dietz showedthat hospital in-patient time for obese children hadlengthened during the period, typically from 5 to 7 days.The total number of days of care had doubled to over300 000 for this US population. The cost per episode hadalso increased so that the final figure provided by Wang& Dietz for children with an obesity diagnosis was overUS$127 million in the late 1990s, rising from US$35 mil-lion per year (adjusted for inflation) two decades earlier.The figure of US$127 million amounts to 1.7% of annualtotal US hospital costs.
This analysis did not report the specific treatmentcosts of obesity-related disorders, and based the cost esti-mates on average charges across all hospitalizations. Inadults, the severity of various disorders tends to begreater for more obese adults than it is for normal ormoderately overweight adults (199–201) thus the treat-ment costs will be correspondingly higher for treatingthe same diagnosis among obese compared with non-obese patients. It is plausible that a similar cost premiummay apply to the treatment of disorders in children whoare obese.
The costs to the health services of failing to intervene inchildhood obesity may also be mentioned. If childhoodobesity is a risk factor for adult diseases, then rising ratesof childhood obesity, especially among the heaviest chil-dren, can be predicted to lead to earlier onset of adultobesity-associated disorders. Earlier onset in adulthoodwill then lead to a longer subsequent lifetime of disabilityand treatment, creating a significant extra financial burdenon national health services.
3.3.2. Indirect costsThe indirect costs of obesity are those relating to areduction in the level of economic activity following ill-ness or premature death attributable to obesity. Indirectcosts of adult obesity were estimated to be AU$272m inAustralia (population around 18 million) and US$23bnin the USA (population around 280 million) (1989–1990figures) (16). In a study of Swedish women, approxi-mately 10% of the total costs of lost productivity due tosick leave and payment of disability pensions wererelated to obesity (202). It should be noted that there aredifferences in methodology and in the costings used forthese analyses.
It is difficult to calculate equivalent costs for childhoodobesity because the contribution of children to a nation’seconomy is highly variable. Although the standard mea-sures for indirect costs e.g. premature death, loss of pro-ductivity, absenteeism, sick leave and disability pensions,may be applied to older adolescents, other more innovativefactors will need to be considered, especially for youngerchildren. These might include the need to take time offwork for parents caring for ill obese children, time offschool, specific costs to the education system, the problemof those who are unemployable or made redundant becauseof their early onset obesity, and so on. It may be possiblein the future to consider more specifically the costs to theeducation system, for example, of absenteeism of obesechildren and the effect this has on the school, and on thecosts of providing special equipment and teaching, espe-cially in the physical education sphere. Childhood obesitymay also have effects on the provision of other services andgoods: school transport, leisure facilities, fuel, clothing andeven food supplies. Lastly, the costs of premature death
Table 11 Principal diagnosis (and ICD-9 reference) when obesity was given as a secondary diagnosis
Asthma (ICD 493) 8.1%Conduct disturbance (ICD 312) 4.7%Diabetes (ICD 250) 4.6%Outcome of delivery (ICD V27) 4.6%Other cellulitis or abscess (ICD 682) 4.2%Depressive disorder (ICD 311) 3.9%Neurotic disorders (ICD 300) 3.9%Adjustment reaction (ICD 309) 2.7%Gall bladder disease (ICD 574-5) 2.3%Chronic disease of tonsils and adenoids (ICD 474) 2.2%Disturbance of emotions specific to childhood or
adolescence (ICD 313)1.5%
Source: Wang & Dietz (198).

32 Obesity in children and young people IASO obesity reviews
© 2004 The International Association for the Study of Obesity. obesity reviews 5 (Suppl. 1), 4–85
produced by obesity in childhood will need to be studiedspecifically.
3.3.3. Intangible costsThe intangible costs of obesity are the social and personalcosts or losses associated with obesity. The costs spent byfamilies on commercial weight loss programmes would beone intangible cost that might be relatively easy to collect.Other intangible costs, however, are far more difficult todefine, are more variable and might be subject to the inter-ests and biases of the individual researcher. For example, itis agreed that obesity reduces the quality of life of individ-uals – they tend to have lower self-esteem. There is nostandard approach either to the measurement of these psy-cho-social factors or to the costs or losses they may pro-duce. In a paper for the IOTF, Segal and co-workersestimated that the intangible costs of adult obesity in Aus-tralia were of the order AU$13–18bn, 10 times the directcosts of obesity (203). The same is likely to be true of otherdeveloped economies.
In the calculation of the intangible costs of obesity thereare probably more suppositions, estimations and outrightguesses than in the calculation of the direct and indirectcosts of obesity. These intangible costs of obesity, however,probably have the most impact on the individual, andparticularly on the child, who is overweight or obese. It isimportant to design studies to estimate the intangible costsof obesity that children bear and not to assume that thecosts and effects are similar or smaller compared to thosefound in studies on adults. In one study of severely obesechildren in the USA the quality of life scores were substan-tially lower than those of non-obese children, and weresimilar to the scores of children diagnosed as having can-cer (204). Studies are needed that investigate the conse-quences of psycho-social factors on school performance,job prospects and employment. Such intangible costs willhave a major impact for the child and for society. A sys-tematic analysis of the quality of life needs to be under-taken so that an assessment of the intangible costs ofobesity in childhood can be made.

obesity reviews Obesity in children and young people IASO 33
© 2004 The International Association for the Study of Obesity. obesity reviews 5 (Suppl. 1), 4–85
4. THE BIOLOGY OF WEIGHT CHANGE IN CHILDHOOD
This report has looked at the extent of childhood obesityand the consequences and costs of obesity. In order to makeinterventions – through the treatment of obese children andadolescents or through prevention of the problem in pop-ulations at risk – it is necessary to understand how a childbecomes obese.
Many studies have shown that obesity tends to trackacross the life course, so that once a child becomes fat, heor she is more likely to be fat later in life, although themagnitude of this risk depends on the measures used andstudy duration. These factors are considered in more detailin the following sections, which look at the developmentalaspects of growth and body weight, the current views onthe genetic, molecular and cellular aspects of weight gain,and the various physical and environmental risk factorsthat increase the likelihood that a child will accumulateexcess weight.
4.1. Molecular and cellular aspects of adiposetissue development
The storage and use of energy in the human body is con-trolled by several regulatory systems, producing a varietyof signals: appetite, satiety, messages via the sympatheticand parasympathetic nervous system and a complex rangeof messages from the endocrine system. In the short term,food-modulated regulatory signals from the gastrointesti-nal tract along with signals generated from dietary factorsbefore and during food metabolism inform the central ner-vous system about food intake and regulate hunger andsatiety. In the longer term, a series of homeostatic mecha-nisms are involved in regulating fat storage and release,resting metabolic rate and energy expenditure, which maybe largely determined by genetic mechanisms and suscepti-ble to genetic variation.
Adipocytes in white adipose tissue are the body’s principalenergy stores. A relatively lean child weighing, for example,30 kg will have about 4.5 kg of triglycerides stored in adi-pose tissue, equivalent to 1.3 million kJ in energy (205).Energy stored in protein (mostly in muscle mass) amountsto some 26 000 kJ and as glycogen only 2100 kJ.
Adipose tissue may be found in the fetus after the 14thweek of gestation. By birth adipose tissue amounts to about13% of the newborn’s body mass, doubling to around 28%by the end of the first year for a normal-weight infant. Thisperiod of adipose tissue accumulation, recognized over acentury ago by Stratz (206) has been referred to as the ‘firstfilling period’ to be followed by a fall in the fat proportionof body mass over the next 6–10 years, referred to by Stratzas the ‘first stretching period’. He noted a second fillingperiod during puberty, a post pubertal stretching period,and a final filling period during later adolescence, around
16–20 years. Various researchers have estimated the averagepercentage of fat in the body mass of children (207–209),and this can be seen diagrammatically in Fig. 24.
The two periods in which body fat is gained differ in oneimportant respect. During the first year of life, fat accumu-lation is largely by means of increased volume of the adi-pocytes. During the pubertal period, the fat accumulateslargely through an increase in the number of adipocytes,without significant further change in fat cell volume (205).This indicates two distinct mechanisms at work, one whichregulates the breakdown or storage of fat within the cellthrough lipolytic and lipogenic mechanisms, and one whichregulates the number of cells through proliferation (frompre-adipocytes) or removal through apoptosis or merger offat cells.
The formation of adipose cells from pre-adipocytesshows age-dependent differences in proliferative activity,with maximum proliferation and capacity for differentia-tion during the first year of life and in the period just beforepuberty. Adipose tissue in children generally contains amuch higher proportion of smaller fat cells than such tissuedoes in adults, indicating a higher rate of formation of newcells during childhood.
Various medical conditions are linked to adipocyte sizeand numbers: for example hypothyroidism is associatedwith a decreased number of fat cells with or without acorresponding change in total adipose tissue mass (205).Growth hormone-deficient children have slightly increasedbody fat stores through enlarged fat cells, but fewer innumber than found in the equivalent tissue from healthychildren (205). Glucocorticoids, which are potent stimula-tors of adipocyte proliferation, in excess can lead to fea-tures characteristic of Cushing’s syndrome, with an increasein adipose tissue mass especially in the abdominal region.
IGF-1 receptors and insulin receptors can be found inadipocytes and pre-adipocytes, and insulin is able to stim-
Figure 24 Percentage fat in the body mass of children and adults.From: McLaren (209).
Bod
y fa
t (%
)
Male
Female
Birth 1 2 3 6 9 12 18 25 45 65 85
50
40
30
20
10
0
Age

34 Obesity in children and young people IASO obesity reviews
© 2004 The International Association for the Study of Obesity. obesity reviews 5 (Suppl. 1), 4–85
ulate glucose uptake and lipogenesis as well as to inhibitlipolysis. Other factors act to inhibit the proliferation ofadipocytes, including tumour necrosis factor, epidermalgrowth factor and platelet derived growth factor.
One special function of the fat cell is the secretion ofleptin, which has been shown to inform the brain aboutthe status of energy reserves. There is a direct relationbetween adipocyte volume and leptin secretion. The disap-pointing therapeutic results with leptin in obese patientscould be due to leptin playing a role as a starvation signalrather than an adiposity signal (210).
Adipocytes are able to secrete a large number of peptidesand cytokinenes, including prostaglandins and the steroidhormones androgen and oestrogen. In this respect adiposetissue is not only an important repository for energy but isalso an active endocrine organ, with an influence on cardio-vascular and metabolic function, fertility and sexual mat-uration (Fig. 25).
Levels of serum IGF-1 and IGFBP-3 appear linked to theformation of adipocytes, adding support to the suggestionthat the protein content of the diet, which leads toincreased levels of IGF-1, may influence adipose tissuegrowth early in life (211). This link to dietary proteinintake is reflected in Waterlow’s observation that in under-nourished children, IGF-1 levels are low while growth hor-mone levels are high (212), the reverse of that noted inobese children, while Rolland-Cachera has suggested thatexcess protein, especially during the earliest stages of child-hood, may be a risk factor for obesity later in childhood(213).
4.2. Developmental aspects of weight gain
4.2.1. Intrauterine environment and post-natal growthA number of studies have shown that birth weight, acrude summary of growth in utero, is positively related tosubsequent fatness (214,215), suggesting that the fetalenvironment plays a role in the development of obesity.Although limited data indicate the association betweenbirth weight and later fatness to be independent of gesta-
tional age (216,217) and socio-economic status (218,219),parental fatness (particularly maternal fatness) may belargely responsible for the relationship (220–222). A studyof 35 000 young people called for army service in Israelfound that those with the very heaviest birthweights wereat threefold risk of becoming severely overweight at age17 years (defined as BMI >27.9 kg m-2) (223,224). Therisk was particularly high among the fattest female babies(Fig. 26).
Fig. 26 does not explore the relationship between verylow-weight-for-date babies and subsequent risk of exces-sive weight gain. Several studies report a J- or U-shapedrelationship, with a higher prevalence of obesity seen forboth the lowest and highest birth weights (215,225), sug-gesting a more complex association between growth inutero and obesity. Just such a U-shaped relationshipbetween birthweight and subsequent age-adjusted adultBMI was found in the US Nurses Health Study 1 (226) (seeFig. 27).
Studies of famine or maternal smoking during pregnancyalso suggest the picture is complicated, and that an adverse
Figure 25 Complex hormone interactivity in adipose cells. Sources: Wabitsch (205), Hofbauer (210).
Fat storage
Insulin
Steroid hormones, androgen, oestrogen
Prostaglandins
IGF-1 and IGFBP-3
Angiotensinogen
Adiponectin, leptin,
TNFa, FFA
resistin
Steroid hormones
Precursors of steroid
hormones
Catecholamines
Growth hormone, TSH
White adipose tissue
Figure 26 Risk (odds ratio) for obesity among 17-year-old youths accord-ing to birthweight. Source: Martorell et al. (223), Seidman et al. (224).
<2500 2500–2999 3000–3499 3500–3999 4000–4499 >5000
Birth weight (g)
2.5
0.5
5
4.5
4
3.5
3
1.5
2
1
0
Male
Female
Figure 27 Birthweight and age-adjusted adult BMI. Source: Martorell et al. (227).
Birth weight (lb)
26
27.5
27
26.5
25
25.5
24.5<5 5-5.5 5.6-7.0 >107.1-8.5 8.6-10

obesity reviews Obesity in children and young people IASO 35
© 2004 The International Association for the Study of Obesity. obesity reviews 5 (Suppl. 1), 4–85
foetal environment may promote obesity independent ofany effect on foetal growth (227,228). (For more on mater-nal and early childhood risk factors see part 4 of thissection.) Maternal diabetes during pregnancy results in off-spring with higher birth weight and higher risk of obesityin childhood, although only after 4–5 years (229). Thelatter association seems to be independent of birth weightand maternal weight, suggesting that the effect is due toalterations to the intrauterine environment.
Further work is required to determine whether differenttypes of diabetes, insulin and non-insulin dependent, andgestational diabetes have different effects. Another possi-bility is that post-natal weight gain is important: a recentstudy reported that rapid weight gain during the first4 months of life increased risk of obesity at 7 years of age,independently of birth weight and gestational age, weightat 1 year, maternal BMI and education (219). Other studiessuggest that it is the combination of foetal growth andsubsequent growth that is relevant, and that light babieswho show post-natal catch up growth or rapid childhoodgrowth are at increased risk of obesity (222,230). See alsopart 4.4 of this section.
4.2.2. Weight gain in infancy and childhoodIt is normal for young infants to put on a high percentageof body fat, but the rate of fat deposition slows fromaround the age of weaning onwards. If children are becom-ing progressively and excessively fat at ages when otherchildren are tending to show a fall in fatness and in BMI(i.e. between around 6 months and 5 years old), this isprobably a warning sign for significant and perhaps, sinceit is developing when other children are tending to reducefat, persistent obesity.
Studies vary on the relationship of overweight/obesity ininfancy and their links to excess bodyweight in later child-hood and adolescence. Risk factors, such as lack of breast-feeding, are discussed in part 4.4 of this section, below. Oneproblem in making links between early and later childhoodis the changing prevalence among the populations; as theprevalence of obesity in childhood increases, the probabil-ity of obesity in infancy leading on to obesity in childhoodis likely to increase. In the 1970s, infants that were obesein the first 6 months of life showed no significant increasein the risk of being obese at age 5 years for example. Morerecent research, looking especially at the patterns of BMIduring the first 5 years, suggests that there are detectablepredictors of later obesity.
Plotted over time, the body mass index shows an initialfall during the second to fifth year of life and then a gradualrise from the sixth year through adolescence and most ofadulthood. The age at which this second increase starts hasbeen termed the ‘adiposity rebound’ (Fig. 28). For furtherdiscussion of adiposity rebound as a predictor of childhoodobesity, see part 4.4.2 of this section, below.
Figure 28 BMI plotted against age for six large-scale surveys of children, showing the ‘rebound’ after age 5 years. Source: Cole et al. (47).
14
15
16
17
18
19
20
21
22
23
0 2 4 6 8 10 12 14 16 18 20
Age (years)
Bo
dy
Mas
s In
dex
Brazil
Britain
Hong Kong
Netherlands
Singapore
USA
14
15
16
17
18
19
20
21
22
23
0 2 4 6 8 10 12 14 16 18 20
Age (years)
Bo
dy
Mas
s In
dex
Brazil
Britain
Hong Kong
Netherlands
Singapore
USA
Males
Females

36 Obesity in children and young people IASO obesity reviews
© 2004 The International Association for the Study of Obesity. obesity reviews 5 (Suppl. 1), 4–85
Later in childhood, there is a remarkably consistent rela-tionship between adolescent markers of maturation –namely age at menarche, stage of puberty or peak heightvelocity – and subsequent fatness (214). Those maturingearlier or more rapidly are at greater risk of obesity. Severalstudies show that increased fatness earlier in childhoodpredicts earlier maturation, at least after 3–4 years ofage (214), and that this partly explains the relationshipbetween early maturation and greater subsequent fatness(231). Higher activity levels, energy intake and proteinintake have been noted in later maturing adolescents (232),but the underlying pathways in the relationships with obe-sity are unclear.
4.2.3. Weight gain in adolescenceAdolescence is an important period in human development,characterized by significant somatic growth and matura-tion of secondary sexual characteristics. Because of markedvariability in the timing of maturational changes, evalua-tion of growth based on chronological age alone can beinaccurate or misleading.
The onset of puberty is believed to occur as a conse-quence of a change in the pituitary–gonadal axis resultingin a dramatic rise in testosterone in boys and oestrogen ingirls (138). Somatic growth is orchestrated primarilythrough the action of growth hormone (GH) and insulin-like growth factors (IGF). Obese children characteristicallyhave accelerated growth. In the early pubertal stages obesechildren show advanced height and bone age, howevertheir pubertal growth spurt is less pronounced resulting ina reduction in height centile and ultimately adult heightsnot different from non-obese counterparts. Basal GHconcentration, GH response and 24-h GH secretion andpulsatility are usually reduced in obese children; theiradvanced maturation is thought to be mediated throughincreased IGF-1 secretion (138).
Pubertal growth spurt is associated with significantchanges in body composition (234). Girls tend to accumu-late more fat than boys. Fat gain occurs in boys and girlsearly in adolescence, but then ceases and even reversestemporarily in boys, and continues throughout adolescencein girls. Menarche usually occurs shortly after the peak inheight velocity. The rise in serum oestradiol relates tempo-rally to breast enlargement, widening of hips and anincrease in body fat. As height velocity decelerates there isan acceleration in fat gain (234). Lean body mass increasesrapidly during adolescence to reach a maximum at 20years. The rise in testosterone with its strong anabolicproperties coincides with the rise in lean body mass.
Normal puberty is also associated with insulin resistance,which is compensated for by increased insulin secretion inresponse to glucose (235). Basal glucose flux is identical inpre-pubertal and pubertal children, although insulin-stimulated glucose uptake in peripheral tissues is lower in
pubertal children. During euglycaemic clamp studies,pubertal status does not affect the response of branched-chain amino acids, free fatty acids and B-hydroxybutyrateto low or high doses of insulin. During hyperglycaemicclamp studies, the rise in plasma insulin is twofold higherand the uptake of branched-chain amino acids greater inpubertal children, amplifying the anabolic effects of insulinon protein metabolism. The insulin resistance of puberty isattributed to the rise in circulating GH, IGF-1 and adrenalandrogens.
BMI as a measure of body fatness in adolescents is influ-enced by maturation status, race and distribution of bodyfat (236). The relationship between percentage body fatand BMI is dependent on the stage of maturation (forequivalent BMI, lower percentage body fat in more sexu-ally mature than less sexually mature), race (for an equiv-alent BMI, whites have a higher percentage body fat thanblacks), and waist : hip ratio or waist circumference (forequivalent BMI, central obesity is associated with a higherpercentage body fat than peripheral obesity). It is impor-tant to consider maturation stage, race and body fat distri-bution in the interpretation of BMI in adolescents.
Improvement in environmental conditions, primarilynutrition and infectious diseases, is the major cause ofearlier maturation (214). The age of menarche hasdecreased from 16–17 years in the 19th Century to 13–14 years in the 1960s to 1970s in many European countriesand 12.8 years by the 1970s in the US. Earlier maturerstend to be taller, heavier and fatter than later maturers ofthe same chronological age. In a systematic review, Parsonset al. (214) found a negative relationship between matura-tion age and adult BMI in 15 out of 21 studies.
Among girls enrolled in a US National Heart, Lung, andBlood Institute study of growth and health, weight, sum ofskin-folds and BMI were greatest in early maturers andleast in late maturers (237). Girls who matured early wereshorter in early adulthood, despite having greater peakheight velocity and post-menarchal increment in height.Throughout puberty and into adulthood early maturerswere heavier and had higher BMI. Early maturation nearlydoubled the odds of being overweight in girls participatingin US National Longitudinal Study of Adolescent Health(238). Overweight prevalence was significantly higher inearly maturers of all racial groups (41.7% in early vs. 25%in average and 18.7% in late matures), but it was highestamong early maturing black girls (57.5%). Early matura-tion is associated with a greater risk of obesity not only inadolescence, but later on in adulthood (214).
For early and late maturing children, BMI as a proxy forbody fatness should be interpreted with caution. Wang &Adair (239) examined the effect of adjustment for differ-ences in timing of maturation on the assessment of over-weight prevalence in adolescents from different countriesusing the WHO international reference. Maturity adjust-

obesity reviews Obesity in children and young people IASO 37
© 2004 The International Association for the Study of Obesity. obesity reviews 5 (Suppl. 1), 4–85
ment increased the estimated prevalence of overweight incountries where girls mature later than the reference pop-ulation and decreased it slightly in populations where girlsmature earlier. While the overall adjustment is small,maturation status should be considered particularly whenassessing young adolescents and populations with mark-edly different maturation rates relative to the internationalreference.
Persistence or tracking of fatness from childhood andadolescence to adulthood has been demonstrated in a num-ber of studies, although the magnitude of the effect dependson the cut-offs used to define overweight or obesity, the ageof initial assessment and the length of follow-up (19). Cor-relations between childhood and adulthood adiposity arepoor to moderate, in the order of 0.30, whereas correla-tions between ages 13–14 years and 25–36 years vary from0.46–0.91 for boys and 0.60–0.78 for girls. As the preva-lence and degree of childhood obesity increases in popula-tions, the strength of the correlations may also increase.
Adolescence is one of the most vulnerable periods for thedevelopment of overweight/obesity. Risk factors for cardio-vascular disease, insulin resistance, hepatic steatosis, poly-cystic ovary syndrome and orthopaedic complicationsassociated with obesity increase and the probability ofbecoming an obese adult also increases in adolescence.Adolescence seems to be a period for entrainment of obe-sity-related morbidity (240). Increased morbidity and mor-tality seen in adulthood has been attributed to adolescentobesity directly, rather than the effects of adolescent obesityon adult weight (241). Although the mechanism is unclear,it is possible that fat distribution patterns established dur-ing adolescence play a role. Boys tend to deposit fat cen-trally and lose fat peripherally as they mature, showing apattern predictive of diabetes, heart disease, hypertensionand hyperlipidaemia in adults.
4.2.4. Normal energy requirementsConsiderable attention has been focussed on energy bal-ance and the need to define the energy required forhealthy growth. Energy requirements for growth havetwo components (1) the energy used to synthesize grow-ing tissues; (2) the energy deposited in those tissues, basi-cally as fat and protein, because carbohydrate storage isnegligible.
A recent analysis of energy balance in healthy childrenand adolescents (242) has led to a reappraisal of the rec-ommendations for food supply used by international bod-ies such as the WHO. The revised proposals for energyintake, based on doubly labelled water methods for moni-toring energy intake and expenditure, are shown in Fig. 29with the previous recommendations.
The proposed new energy requirements are 18–20%lower for boys and girls under 7 years of age, and 12%lower for boys 7–10 years old. From age 12 onwards, the
proposed requirements are 12% higher for both boys andgirls, assuming moderate levels of physical activity. Inter-ventions such as child feeding programmes, if based uponthe previous recommendations, could have led to excessenergy intake among target populations, with a potentialproblem of encouraging the consumption of nutrient-poor,energy-rich diets, and of encouraging excessive weight gainamong these children (see also the section Stunting inChildhood, in 4.4.2 below).
4.3. Genetic, familial and gene–environment interactions
Observations in twins, siblings, nuclear families andextended pedigrees have shown that an individual’schances of being obese are increased when he or she hasrelatives who are obese. Obesity persistence from child-hood to adulthood is also linked to family obesity: datafrom the British 1958 birth cohort demonstrated thatobese children of obese parents are more likely to be obesein adulthood, especially when both of the parents areobese (243).
Figure 29 Comparison of proposed energy requirements with FAO/WHO/UNU 1985 requirements, (A) boys and (B) girls. Source: Torún (242).
(A) Boys
1 2 3 4 5 6 7 8 9 10 11 12 13 14 15 16 17 18
Age (years)
160
180
200
220
240
260
280
300
320
340
360
380
400
420
440
460
ER
(kJ
kg–1
d–1
)
FAO/WHO/UNU 1985 estimates
PROPOSED2001 estimates
(B) Girls
160
180
200
220
240
260
280
300
320
340
360
380
400
420
440
460
1 2 3 4 5 6 7 8 9 10 11 12 13 14 15 16 17 18
Age (years)
ER
(kJ
kg–1
d–1
)
PROPOSED2001 estimates
FAO/WHO/UNU 1985 estimates

38 Obesity in children and young people IASO obesity reviews
© 2004 The International Association for the Study of Obesity. obesity reviews 5 (Suppl. 1), 4–85
The relative influence of parental and childhood weightstatus on the persistence of childhood overweight intoadulthood appears to vary substantially with the age of thechild. A large retrospective cohort study that exploitedmedical record data on parents and children indicated thatthe influence of parental obesity on weight status in earlyadulthood was stronger from age 2 through age 10 years.By adolescence, the child’s own weight status was a farstronger determinant of obesity in early adulthood (48).Whitaker found that parental obesity was a more impor-tant predictor of offspring obesity in early childhood, butwas less important in determining the fatness of childrenabove 9 years of age (48).
In the Ten-State Nutrition Study of 1968–1970, the rel-ative fatness of children increased systematically fromparental combinations of two lean to two obese parents.Generally, the leanest children had two lean parents; thefattest children had two obese parents, with intermediatelevels of fatness seen for one lean and one obese parent.Maternal fatness did not appear more obesogenic thanpaternal fatness (244).
The findings from a study based on the Danish AdoptionRegister further confirmed the strong influence of geneticsin obesity. A comparison of the correlations of adoptees’BMI with their adoptive and biological parents showed fargreater concordance of BMI with the biological parentsthan the adoptive ones (245).
A series of elegant analyses conducted by Bouchardand colleagues have looked at twin pairs exposed tounder- and overfeeding, and indicate a substantial geneticcomponent in weight gain in response to food intake(246) accounting for up to 50% of the variability. Theauthors suggest that the genetic components are complexand that amount and rate of weight gain are unlikely tobe related to a single gene in the majority of cases ofobesity (247).
Results of family studies suggest that energy expenditure,in terms of measurements of physical activity and sedentarybehaviour, exhibits characteristics that suggest a moderategenetic component. A review of the field by Allison et al.(4) noted that monozygotic twin studies have found theheritability of BMI to be as high as 85%, while adoptionand family studies have found heritability in the range 25–50%. The authors suggest that the true figure is likely tobe around 70%.
That genes should account for so much of the variationin BMI might lead to the conclusion that the environmenthas little impact, but this would be erroneous. Genes arebest expressed in appropriate environments and with therise in obesity prevalence being noted in so many countries,it is clear that the environmental conditions for obesityexpression are being created in several parts of the world,especially in urban, industrialized regions. As Allison et al.conclude:
‘If we are to be responsive to the obesity problem thatthe population has as a whole, the environment must bechanged to become less obesegenic and more promotingof healthy diets and activity patterns’ (p. 160).
The argument can be posited differently – what propor-tion of the rise in obesity seen in the population can beattributed to a ‘purely’ genetic factor, virtually unaffectedby environmental stimuli? The review by Allison et al. (4)suggests that some 10% of population may become over-weight even in environments that mitigate against weightgain, and a similar proportion of the population might havea strong genetic predisposition to remain thin in obesogenicenvironments. The majority of the population carry com-binations of genes that may have evolved to cope with foodscarcity, a genetic predisposition that is maladaptive in anenvironment of ready availability of calorie-dense foodwhere low energy expenditure is the norm.
The influence of the environment is clearly illustrated in acomparison of weight status of Pima Indians living in themountain state of Sonora in Mexico and genetically similarPima Indians living on the Gila River Indian reservation inArizona. The Pimas who reside in Mexico have an averageBMI of 25, whereas Pima men and women living in Arizonahave average BMIs of 31 and 36, respectively (248). Simi-larly, studies of immigrants into the USA from countries withlower obesity rates, such as China and Japan, show that theUS immigrants develop higher obesity rates than the popula-tion they left, and the immigrants’ offspring continuing tolive in the US develop even higher rates of obesity than theirparents (249). Similarly, studies of hunter-gatherers in Aus-tralia show a raised prevalence of diabetes, hypertension andobesity among those that moved to urban areas comparedwith those remaining on their homelands (131).
The nascent field of behavioural genetics seeks to under-stand both the genetic and environmental contributions toindividual variations in human behaviour. As it relates toobesity, the primary behaviours of interest are food con-sumption patterns, sedentary behaviour and physical activ-ity. The complexities and challenges are many, because thebehaviour patterns and the obesity itself may reflect multi-ple genes, and dietary intake and energy expenditure mea-sures are liable to substantial error. The analysis is furthercomplicated by the fact that familial aggregation of char-acteristics may have both genetic and non-genetic aspects.Dietary, activity and sedentary behaviours have all beendemonstrated to ‘run’ in families (221,250,251). Thus ourability to ascribe the degree to which parent and childweight status concordance is due to genes, environment orculture is, by necessity, limited, and estimates of ‘heritabil-ity’ (the amount of variation in a population that is attrib-utable to genetic factors) apply only to the specificpopulation studied and only to the environment in place atthe time the study was conducted.

obesity reviews Obesity in children and young people IASO 39
© 2004 The International Association for the Study of Obesity. obesity reviews 5 (Suppl. 1), 4–85
The role of the environment in the linkage between par-ent and child overweight is difficult to study directly,although two lines of evidence suggest that there is a sub-stantial non-genetic component. First are studies that doc-ument dramatic increases in the prevalence of childhoodobesity as developing countries adopt the diets and physicalactivity levels of populations in the industrialized econo-mies (67,252). Studies in developing countries have alsodocumented the coexistence of underweight and over-weight within the same family (253), which implies thatenvironmental rather than genetic factors are involved. Sec-ond are migrant studies, where obesity rates in second-generation children are seen to significantly exceed rates infirst generation children (254). Again, environment factorsare likely to be responsible.
4.3.1. Specific syndromes linked to obesityAlthough the vast majority of obese children and adoles-cents do not have a specific syndrome, there are about 30inherited disorders in which childhood obesity is a clinicalfeature. These may be associated with mental retardation,dysmorphic features and organ-specific developmentalabnormalities. These disorders explain a very small propor-tion of childhood obesity, representing at most 1–2% oftotal cases, but practitioners should be particularly alertfor indications of intellectual disability, short stature andunusual stigmata. Children with more extreme levels ofobesity are best sent to tertiary referral centres where diag-nostic facilities are more readily available and appropriatetreatment can be initiated.
Down syndrome. Children with Down syndrome maybecome obese as they progress through rather deficientpubertal development. Autoimmune thyroiditis is a com-mon problem in Down syndrome and thyroid status shouldbe checked in an overweight child with Down syndrome.Associated problems such as congenital heart disease willaffect the predisposition to obesity, and managementshould be adapted for the individual’s needs. Growthcurves for the ‘normal’ growth of children with Downsyndrome exist.
Prader-Willi syndrome. This is the most common syndro-mal cause of human obesity with an estimated preva-lence of about 1 in 25 000. The Prader-Willi syndrome ischaracterized by diminished fetal activity, obesity, hypo-tonia, mental retardation, short stature, hypogonadotro-pic hypogonadism, and small hands and feet; thediagnostic criteria have been summarized by a consensusgroup (255). It is caused by deletion or disruption of apaternally imprinted gene or genes on the proximal longarm of chromosome 15. Although the precise genesinvolved are not known, there are now reliable labora-tory tests for the diagnosis of this syndrome (256,257),
which has implications for the management of suchpatients.
In infancy these children may present with feeding diffi-culties. This can make it difficult for carers to move froma situation of dealing with failure to thrive to a situationof controlling obesity. Low IQ and behavioural distur-bances exacerbate the difficulties in altering lifestyles inthese children who have a strong predisposition to severeoverweight and often considerable determination and obsti-nacy. Lifestyle advice should be offered at diagnosis.Growth hormone treatment at levels of 1.0 mg m-2 inschool-age children has been associated with lowered bodyfat, increased lean body mass, increased growth velocityand increased resting energy expenditure over periods of atleast 4 years. Growth hormone treatment started in earlychildhood is also associated with normalization of growthand body proportions, but not to the extent of leading tototally normal fat distribution and body composition.Growth hormone treatment has also been associated withimproved emotional, behavioural and cognitive functioningproviding positive effects on psychosocial as well as anthro-pometric status. There is need for more research on the ageof introduction, level of treatment in terms of dose andfrequency, and optimal duration of treatment, as well as onwhich children will benefit significantly from the treatment.
The prevalence of orthopaedic complications, type 2 dia-betes mellitus, hypertension and other secondary problemsincreases with age and contribute to a low quality of lifein later adolescence and early mortality.
Duchenne muscular dystrophy (DMD). Boys with DMDfrequently become obese from around 7 years of age witha peak prevalence at 13 years (>50%), probably as a resultof both the deteriorating muscles being replaced by fat andpositive energy balance due to inactivity, poor dietary con-trol associated with low IQ and, sometimes, overindul-gence of children with a miserable prognosis. Obesity iscentralized body fat suggesting that the obesity is nottotally related to muscle degeneration. Undernutritiontends to develop in later adolescence (from 14 years of age)and affects >50% boys of 18 years. Carers thus need to beaware of the child’s current state in order to offer appro-priate advice on diet and activity.
Albright hereditary osteodystrophy (AHO). This is anautosomal dominant disorder due to gene mutations thatdecrease expression or function of G-alpha-S protein.Maternal transmission of the mutations leads to short stat-ure, obesity, skeletal defects and impaired olfaction plusresistance to several hormones (e.g., parathyroid hormone)that activate G-alpha-S in their target tissues (pseudohypo-parathyroidism type IA), while paternal transmission leadsonly to the pseudopseudohypoparathyroidism phenotype(258).

40 Obesity in children and young people IASO obesity reviews
© 2004 The International Association for the Study of Obesity. obesity reviews 5 (Suppl. 1), 4–85
Fragile X syndrome. This is characterized by moderate tosevere mental retardation, macro-orchidism, large ears,prominent jaw and high-pitched jocular speech associatedwith mutations in the FMR1 gene (259). It has been sug-gested that a reasonable estimate of frequency is 0.5 per1000 males. Not all children with fragile X syndrome willbecome obese.
Bardet-Biedl syndrome (BBS). BBS is a rare (prevalence<1/100 000), autosomal recessive disease characterized byobesity, mental retardation, dysmorphic extremities (syn-dactyly, brachydactyly or polydactyly), retinal dystrophy orpigmentary retinopathy, hypogonadism or hypogenitalism(limited to male patients) and structural abnormalities ofthe kidney or functional renal impairment. BBS is a genet-ically heterogeneous disorder that is now known to map toat least six chromosomal regions (260). As yet althoughsome causative genes have been identified, in no case has alink between a certain gene or protein and the disease beenestablished.
Single gene disorders causing childhood obesity. Fivegenetic disorders result in morbid obesity in childhoodwithout the developmental features characteristic of theabove-mentioned multi-organ syndromes of childhood obe-sity. The first monogenic human obesity syndrome to bereported was congenital leptin deficiency. Children areseverely hyperphagic, constantly demanding food, with anintense drive to eat, but without any of the clinical featuressuggestive of the recognized childhood obesity syndromes.They have impaired T-cell mediated immunity thus are atrisk of frequent infections and have hypogonadotropichypogonadism and so fail to undergo pubertal development(261). A similar clinical picture is seen in children withdefects in the leptin receptor (262). Defects in pro-opiomel-anocortin (263) and pro-hormone convertase 1 (264) alsocause severe childhood obesity and other endocrine andmetabolic problems. Defects in the melanocortin 4 receptorcause a severe obesity syndrome that is dominantly inher-ited and may account for up to 5% of patients with severe,early-onset obesity (265). The nature of mutations in thisgene determines the severity of the disease phenotype.
Endocrine disorders. Cushing’s syndrome, hypothyroid-ism, hyperadrenocorticism, hypophosphataemic rickets,growth hormone resistance and other endocrine disorderscan be associated with some degree of obesity. Short statureand growth retardation are characteristic of many suchdisorders, as opposed to height over-growth commonlyseen in over-nutrition. In adolescents the diagnosis of shortstature may be harder to distinguish from normal cessationof growth.
The degree of obesity found in these children may besecondary to other factors, for example poor vision or
other physical disability may lead to reduced physical activ-ity, while family indulgence of the child may encourageexcess calorie intake.
4.3.2. Testing for syndromic childhood obesityCurrently obese children with the classical obesity syn-dromes are often looked after by paediatricians and genet-icists in tertiary referral centres. There is a growing needfor wider access to diagnostic facilities and multi-disciplin-ary team-based management programmes for the care ofthese specific patients. Increasing understanding of thephysiology of these syndromes will enhance options fortherapy, such as the use of growth hormone in patients withPrader-Willi syndrome (266).
The discovery of single gene defects as a cause of child-hood obesity has biological and clinical implications thatare greater than the rarity of the individual diseases mightsuggest. Most importantly, at least one disorder, namelyleptin deficiency, is amenable to treatment. Three leptin-deficient children have been treated with daily subcutane-ous injections of recombinant human leptin for up to4 years with sustained, beneficial effects on appetite, fatmass and hyperinsulinaemia (267). Leptin treatment hasreversed the immune defects and risk of infection seen inthese children and allows the appropriate development ofpuberty. Such treatment represents the first, rationallybased, hormone replacement therapy for any form ofhuman obesity.
Assessment of patients with severe obesity in child-hood might in the future include the measurement ofserum leptin to exclude leptin deficiency, which is treat-able. This is currently available only as part of researchstudies and, given the rarity of these disorders, a generalrecommendation for testing may not be justifiable atpresent. However, training and education of health careworkers is important so that such children are referredto the appropriate centres for further evaluation andgenetic counselling. As more is learnt about the genesthat regulate body weight and more syndromes aredescribed, it is likely that the need to evaluate severelyobese children in recognized centres will grow and closecollaboration with academic centres with experience inthis field is needed to ensure that the benefits of labora-tory research are made available to the patients thatneed them.
4.4. Children at risk of weight gain
Given the high level of genetic predetermination of obesityrisk (see above) it is clear that large numbers of childrenare likely to develop excess body weight wherever the sit-uation permits it. However, there appear to be certainphysical and social environments that particularly encour-age weight gain, and certain groups of children that might

obesity reviews Obesity in children and young people IASO 41
© 2004 The International Association for the Study of Obesity. obesity reviews 5 (Suppl. 1), 4–85
be at special risk. This section looks in more detail at therisk factors that encourage the accumulation of excessweight in childhood.
4.4.1. Individual children at special riskClinicians and health professionals treating children withspecific conditions should be aware that some children areat particular risk of developing excess bodyweight. Theseinclude the following.
Children with physical disability. The effect of physicaldisability on a child’s nutritional status is very dependenton the nature and severity of the problem. For example,children with cerebral palsy may become obese if theyhave hypotonic cerebral palsy and are relatively inactiveand lethargic. Children with spastic or choreo-athetoidcerebral palsy who have great difficulty in locomotion arecommonly underweight. Severely mentally handicappedchildren may have growth problems and poor weight gainin association with their brain damage. Management ofthese children is often difficult because there may be areluctance by relatives to put the burden of obesity con-trol on an already disadvantaged child and physical dis-ability may make it almost impossible to increase energyexpenditure.
Adolescents with type 1 diabetes. Adolescents with type 1diabetes mellitus commonly gain excess weight, usuallyassociated with poor diabetic control, blood glucose insta-bility and high insulin dosage. Weight loss in type 1 diabe-tes is not easy because of the need for insulin and regulardietary intakes. Poor diabetic control may be associatedwith episodes of hypoglycaemia with over-eating to com-pensate, or with hyperglycaemia and over-dosing with insu-lin to control blood sugar levels. Raised levels of glycatedhaemoglobin HbA1c (indicating poor control) tends to beassociated with high BMI or high intra-abdominal fat, atleast in adult groups (268,269).
Adolescents with type I diabetes mellitus do not have ahigher prevalence of eating disorder symptoms when com-pared with non-diabetic adolescents although, when chil-dren with diabetes do show symptoms of bulimia (13–14-year-old girls particularly), BMI is likely to be higher thanin those without these symptoms.
Children treated for epilepsy. Sodium valproate treatment(usually given for epilepsy) is particularly associated withabnormal weight gain and fatness. This may be related tohyperinsulinaemia developing in association with treat-ment. In adolescent epileptic girls the sudden developmentof obesity, perhaps particularly with sodium valproatetreatment, may be associated with the development of poly-cystic ovary syndrome. Other anti-epileptic drugs, such astopiramate, may have weight reducing effects.
Children treated with other centrally-acting drugs. Theuse of anti-depressants, anti-psychotics and centrally-actingdrugs designed to assist behaviour control may encouragereduced physical activity and increased sedentary behav-iour, and there may also be changes in dietary patterns,such as more regular meal attendance and greater foodconsumption – all of which can lead to weight gain. Weightgain is also associated with other centrally-acting medica-tions including risperidone and possibly methylphenidate(Ritalin) (270,271).
Children treated with glucocorticoids. Increased weightgain is a well-recognized complication of long-term sys-temic glucocorticoid therapy for paediatric disorders suchas nephrotic syndrome, juvenile rheumatoid arthritis,inflammatory bowel disease, chronic severe asthma andother inflammatory diseases. Obesity is also one of the side-effects that have been reported in children on high-doseinhaled steroid therapy (272).
Children with psychological problems. Children with mildlearning difficulties and/or those who have difficulty mak-ing friends may show a predisposition to obesity. Retreat,withdrawal and lack of self-confidence may lead childrento more sedentary lives and their withdrawal to the solaceof computers or television. These children are often pre-sented to clinicians as failing at school because of theirobesity or having social difficulties because of their obesity.Whilst some obese children do suffer significant bullying,many of these children had psychosocial and learning prob-lems before they became obese. Successful reduction infatness can induce very welcome improved self-esteem, butweight reduction in children with psychosocial and learn-ing problems can be extremely difficult to achieve andmaintain. As with most forms of treatment (see below)initiatives need to be developed that involve both home andschool environments.
Children with eating disorders. Bulimia. The evidencethat bulimia is linked to obesity, or that obese childrenare more prone to bulimia, is not strong. However, thepresence of bulimia in an obese child may contribute topoor diet control. Anorexia. Despite common concernthat dieting in childhood obesity increases the risk ofanorexia nervosa, there is no persuasive evidence thatthis is the case. There is a risk, however, that a popularemphasis on dieting as a means of managing bodyshape may contribute to the development of anorexia inpsychologically at-risk non-obese children – i.e. thesocial pressures that discriminate against the obese childmay encourage vulnerable non-obese children to developeating disorders. A greater emphasis on health ratherthan weight control per se might help to resolve thisproblem.
42 Obesity in children and young people IASO obesity reviews
© 2004 The International Association for the Study of Obesity. obesity reviews 5 (Suppl. 1), 4–85
Survivors of cancer. There is some evidence that childrenthat are being treated for cancer, or who have survivedcancer, may be at increased risk of obesity (273–275).Cranial irradiation and growth hormone deficiency are pre-dictors for later weight gain in this population (273,276).Additional biological and social factors may also be impor-tant in the pathogenesis of obesity.
4.4.2. Population groups at higher risk for obesityApart from children with specific medical conditions thatlead to obesity, or children whose treatment for other con-ditions may lead to obesity as a complication, there areidentifiable risk factors within the population of normalchildren that increase their risk of becoming obese.
Ethnicity. It is a common impression that schoolchildrenfrom non-Caucasian backgrounds living in Westernizedsocieties have greater propensity for developing obesitythan white Caucasian children, but when socio-economiccircumstances and parental education are taken intoaccount, the differences may not be great. In the USA, forexample, African–Americans and Hispanic–Americansappear to contribute more to the obesity epidemic, withmore rapid rates of change in their populations, than doesthe white American population (69). In the UK, childrenfrom South-East Asian backgrounds tended to have a lowerponderal index than white children, but showed higherinsulin levels and a stronger relationship between adiposityand raised insulin concentration (51). A survey in the Neth-erlands of Turkish and Moroccan immigrant groups foundthe children to be more at risk of overweight than Dutchchildren (277). These racial/ethnic disparities may be par-tially but not fully explained by family income and othersocial inequalities (3).
A compilation of nationally representative surveys ofAustralian children and adolescents in 1995 and 1997showed that there is a higher prevalence of overweight andobesity among schoolchildren with backgrounds of Mid-dle-Eastern or continental European origins, comparedwith children from either Asian or English-speaking back-grounds (278).
Cultural issues are important for management and pre-vention. They may influence concepts of the attraction orrisks associated with childhood obesity and thus willing-ness of families to comply with therapeutic advice. Theyalso influence lifestyles and self-esteem of the obesewithin a society. They can have considerable impact onwhat should be included in dietary recommendations andon compliance with activity recommendations. The easewith which children can participate in activities awayfrom home can be influenced by cultural norms andsocial integration of minority communities. Girls areprobably affected particularly in relation to this latterpoint.
The prevalence of complications of obesity such as type2 diabetes mellitus and hypertension amongst populationsfrom the Indian subcontinent, together with the lower BMIlevels for risk of complications in adults, have implicationsfor the development of obesity in children from the Indiansubcontinent. There is need for more research on bodycomposition in ethnic minorities in different countries andon the outcomes for childhood obesity in these groups.
Parental obesity. As noted at the start of part 4.3 of thissection, above, the risk of a child becoming overweightincreases with parental overweight and obesity (48,243). Itis likely that the family association is due partly to geneticfactors and partly to shared lifestyles, i.e. diets and patternsof activity. In some cases obese parents show less concernthan average for their children’s obesity, although in othercases the opposite may be true. Lack of parental concernprobably leads to less active attempts at management andexacerbation of obesity. It would seem wise to advise obeseparents very carefully about diet, increased activity andreduced inactivity as early in a child’s life as practical. Suchadvice should be continued throughout childhood in waysappropriate to the children’s age and children and parents’understanding.
Some data suggest that the parent–child fatness relation-ship may be stronger between mothers and their offspringthan fathers and offspring, and that the mother–offspringrelationship strengthens as the child gets older (279). Otherdata shows that parental obesity becomes less importantwith increasing age of the child, and is a more importantpredictor of offspring obesity earlier in childhood(<6 years) (48). Importantly, parental obesity may influencetracking of the offspring’s own obesity, which is muchstronger if both parents are obese (243,280). Recent workhas begun to look at lifestyle factors that might contributeto the parent–child fatness relationship, and suggests thatobesogenic and non-obesogenic family clusters can be iden-tified based on parents’ diet and activity patterns. Childrenin obesogenic families are not only fatter but show greaterincreases in BMI or skin-fold measures at age 5–7 years(281).
Maternal diabetes. As mentioned earlier in this report, theoffspring of women who had diabetes during pregnancyare more likely to become obese later in childhood and tohave a higher prevalence of impaired glucose tolerance thanthe offspring of women who were non-diabetic. The mostconvincing evidence is an increased risk of overweightamong offspring born after the mother developed diabetescompared to the siblings born before (282). A study bySilverman et al. found the insulin levels in the amnioticfluid during pregnancy showed a close association with theoffspring’s risk of impaired glucose tolerance in adolescenceas well as with their BMI in adolescence (after adjusting

obesity reviews Obesity in children and young people IASO 43
© 2004 The International Association for the Study of Obesity. obesity reviews 5 (Suppl. 1), 4–85
for the correlation with the mother’s BMI) (283). Impairedglucose tolerance was found in 36% of offspring of diabeticmothers.
Although maternal diabetes during pregnancy results inoffspring with higher birth weights, Silverman et al. foundthat heavier babies tend to revert to normal weights by1 year of age (283), but then show increases in BMI afterabout age 4 years compared with national reference stan-dards, i.e. the children showed an early adiposity rebound(see below). This normalization followed by departurefrom normal implies that these children’s obesity is meta-bolically programmed during their intrauterine experience,rather than reflecting a persistence of obesity acquiredbefore birth.
Similar links have been shown in the Bogalusa HeartStudy, which found that children (average age 15 years) ofdiabetic mothers showed greater body fatness, higher bloodpressure and raised fasting levels of blood glucose, insulin,glucagons and triglycerides (284). The latter measuresremained significantly raised after controlling for the higherBMI levels in these children.
Smoking in pregnancy. Maternal smoking has been linkedto subsequent adiposity in children (227,285). Althoughseveral confounders may limit the interpretation of theresults, von Kries et al. have shown a dose-dependent rela-tionship between maternal smoking during pregnancy andprevalence of overweight and obesity in children aged 5–7 years, which could not be explained by social class,mother’s weight or child’s birthweight (286). In this study,smoking after pregnancy appeared unrelated to child obe-sity, suggesting that intrauterine exposure to the productsof smoking, rather than family lifestyle factors, were instru-mental in raising the risk of childhood obesity.
Low birth weight. As noted earlier, a U-shaped relation-ship between birth weight and subsequent risk of obesityappears to apply, with the heaviest babies and the lightestbeing at risk of excess weight gain during subsequent child-hood and adulthood. An excess risk of obesity has beenobserved in young Dutch adults who had been born tomothers who had faced famine conditions in early preg-nancy (287) and several reviews have noted an associationbetween poor intrauterine growth and later obesity(288,289). Considerable evidence now exists that obesechildren and obese adults who had low birth weights aremore vulnerable to both coronary heart disease and type 2diabetes than similarly obese people who had higher birth-weights (290).
The links between the intra-uterine experience of thefoetus and the subsequent risk of coronary heart disease inadulthood may be mediated by several factors. Low birthweight appears linked to the development of stunting andabdominal obesity (see below) and the metabolic syndrome
in later life. Stunting at birth appears closely linked toinsulin resistance in pre-pubertal children, with the highestinsulin resistance among those children who have becomethe heaviest by this age (291).
The relationship between birthweight and risk of subse-quent heart disease or diabetes among adults in the Indiansubcontinent is more pronounced among urban popula-tions than rural ones, although birthweight records wouldindicate that lower birthweights are more common amongrural populations. Yajnik has demonstrated that a combi-nation of low birthweight and weight gain in childhoodled to the highest risk of developing insulin resistance andcardiovascular risk factors (49,292). Low birthweightbabies in Indian populations appear to have depleted mus-cle mass and visceral mass, but preserved subcutaneousfat, and are prone to gain weight by increasing their cen-tral obesity. This high-risk pattern was associated with alack of fruit and vegetables in the mother’s diet and toindications of malnutrition in the mother’s own early lifegrowth, such as shortness of stature and small head cir-cumference (292). It can be appreciated that the risk fac-tors for developing obesity, diabetes and coronary heartdisease can be detected in previous generation’s nutritionalstatus. It can also be appreciated that supplemental feed-ing programmes for low birthweight babies may encour-age rapid weight gain, exacerbating their risk ofsubsequent chronic disease.
Stunting in childhood. Stunting (short height for age)affects one-third of all children aged under 5 years globally(i.e. around 270 million children), most of them in lessdeveloped or transitional economies (293).
Evidence from several surveys has shown the co-exist-ence of stunting and overweight or obesity in the same childand/or among other members of the same household, inurban areas in developing countries (60,253,294,295) andpoorer communities in developed countries (296). Theprevalence of overweight among stunted children has beenestimated at 45% in the 1994–5 Russian LongitudinalMonitoring Survey of children aged 3–9 years, and approx-imately 20% in the 1991–3 China Health and NutritionSurvey (60). The incidence was lower in surveys of stuntedchildren in South Africa (13% overweight) and Brazil (4%overweight). Longitudinal studies suggest that stuntingincreases the risk of central obesity (e.g. as measured bywaist : hip ratios) but does not raise the risk of overweight(assessed by BMI) in later childhood (297) or adulthood(298). A longitudinal study in Guatemala found thatalthough stunting in childhood was not linked to BMI,some 15–20 years later, children with severe stunting hadsignificantly greater abdominal fatness (waist : hip ratios)when they were adults, and the effect was most pronouncedamong women who had migrated to urban areas (298).There is also some evidence that stunting during early
44 Obesity in children and young people IASO obesity reviews
© 2004 The International Association for the Study of Obesity. obesity reviews 5 (Suppl. 1), 4–85
childhood increases the strong link between overweightand high blood pressure in later childhood (299).
The timing and duration of the physiological insults thatlead to retarded linear growth are likely to have differentphysiological consequences. Growth retardation is one fea-ture of a complex syndrome including developmental delay,impaired immune function, reduced cognitive function andmetabolic disturbances that may raise the risk of obesityand hypertension (300).
The suggestion that stunted children may be less likelyto undertake physical activity, and that obesity is a corol-lary, does not appear to be supported by the evidence – astudy of energy expenditure among stunted and matchedcontrol children in Brazil using doubly labelled watershowed no association between stunting and resting energyexpenditure or total energy expenditure (301). The studynoted that girls had a lower total energy expenditure thanboys, which the authors suggest may help to explain thehigher risk of obesity in stunted adolescent girls andwomen in urban areas of developing countries.
An alternative suggestion is that stunting may increasesusceptibility to weight gain especially in children consum-ing diets relatively high in fat (302) or where extra food isavailable opportunistically (303). Physiological mecha-nisms that are triggered by famine and chronic undernutri-tion might encourage excess weight gain when exposed toenvironments where high energy foods are plentiful (253).
Prevention of obesity in supplementary feedingprogrammes. Underweight children are usually stunted,thus most malnourished children will be of low weight andlength for age, but will have a near normal weight forlength/height. They are underweight and stunted but notwasted. Recovery in length for age is likely to be incompleteif nutrition improvement occurs after 24–36 months of age,therefore these children when given additional food willgain significantly more weight for age than length for age,raising the risk of overweight (304).
Food supplementation of underweight children mayinduce weight gain, while length deficit may not bereversed. If protein-energy malnutrition (PEM) preventionprogrammes are implemented, stunted children maybecome obese (overweight for height/length), while remain-ing underweight for age. Unless underweight is universal,supplemental feeding programmes should use targetingstrategies to prevent providing excess food to those that arewithin the normal range of weight for height/length. MostPEM prevention programmes use food supplements thatprovide ample energy and protein, but may be deficient inmicronutrients, thus limiting linear growth. Cereal anddairy foods are poor in zinc, vitamin A and iron, and thefibre content of cereals may inhibit micronutrient bioavail-ability, while energy intakes may exceed energy needs. Thequality of the foods provided is crucial in pre-school and
school feeding programmes; fruits and vegetables shouldbe included in the diet of children to secure micronutrientsand prevent energy excess, while zinc and iron fortificationof fat-reduced milk may also be valuable where stuntingand obesity co-exist (304).
Early adiposity rebound. The tendency for indicators ofadiposity, such as BMI, to fall from around the age of1 year, only to rise again around the fifth year, has beennoted earlier in this section. Several studies have shownthat the earlier the rebound occurs the greater the risk ofsubsequent obesity (214), although what drives the timingof the adiposity rebound remains obscure.
One study has suggested that earlier adiposity reboundis induced by thinness at around the age of 1–2 years, andthis is linked to later risk of diabetes (305). At this age itappears to be the thin infant who is likely to becomeoverweight and diabetic in later life rather than the fat one,an important finding for public health policy which mightotherwise assume that fat 2-year-olds are at greater risk oflater ill-health than thin ones (290). Interestingly, one studyreports that girls with a higher BMI at 3 years of ageexperience adiposity rebound later (no relationship inboys), and that in both sexes, an earlier rebound occurredin children that were taller at age 3 years (306).
It is not clear whether the importance of the early adi-posity rebound lies in a biological mechanism for enhancedweight gain during childhood as a causative factor, orwhether it is merely indicative of a tendency to gain weightmore rapidly than other children – due to prevailing geneticor environmental conditions. Dietary variables do notappear to predict adiposity rebound (307), although thisrequires confirmation in further studies. The effect of anearly adiposity rebound may be independent of BMI atrebound (greater in those with an early rebound) or paren-tal obesity (more prevalent in those with an early rebound)(308). Age of rebound, however, may add little to theprediction of adult obesity, if BMI at age 7 years (i.e. afterrebound) and height in childhood are known (309). For agiven BMI in childhood the taller child is more likely to bean obese adult (310).
Social deprivation. In most Western societies childrenfrom socio-economically deprived environments have agreater risk of obesity than those from more affluentgroups (214). The reasons for this are not clear althoughdietary differences can often be shown. Low self-esteemand feelings of disempowerment may be relevant to howdeprived families cope with children who are overweight.However conditions such as a depressed environmentwith nowhere safe for children to play; a lack of oppor-tunity for away-from-home activities so television watch-ing becomes the only leisure activity; and distance fromshops where fruit, vegetables and low-energy density

obesity reviews Obesity in children and young people IASO 45
© 2004 The International Association for the Study of Obesity. obesity reviews 5 (Suppl. 1), 4–85
foods are affordable and readily available, may all con-tribute to obesity prevalence.
It is possible that some of the effect of socio-economicstatus is mediated through an individual’s education level,but data from the UK have demonstrated both factors tobe independently related to adult BMI, suggesting thatcircumstances in early life have an enduring and importanteffect (311).
In countries with less industrialized diets, the patterns ofobesity related to socio-economic status of the family aremore complex, with a tendency for urban children andchildren in high-earning families to be more at risk ofexcessive weight gain. In China, for example, children fromadvantaged backgrounds tend to be fatter than those fromdisadvantaged backgrounds (280).
In both industrial and developing countries, access to anenergy-rich, nutrient-poor diet appears most closely linkedto weight gain, and those socio-economic groups withgreatest access to such diets are likely to have children mostat risk. Access to obesogenic diets is determined by manyfactors, including family income, access to transport, thedistribution and marketing practices of the producer com-panies, and lack of access to healthier alternatives.
There is little objective evidence available on the socialissues leading to obesity. Family size, position of the obesechild in the family, lone- or both-parent families have allbeen found relevant to prevalence of childhood obesity insome studies. In developing countries underweight may co-exist with overweight within the same household; one esti-mate (for households in Asia) suggests that the coexistenceof both forms of mis-nutrition is up to 15% of all house-holds, and that between 30% and 60% of all householdswhere one member is underweight will have another mem-ber who is overweight (312). Public health policies aimingto reduce underweight may inadvertently serve to encour-age excess weight (313).
Family and school functioning. Aspects of family structure(single parent families, number of siblings, birth order ofchild, age of mother at the birth of her child) have beenonly rarely examined and the results are inconsistent (214).Family functioning, which may also be linked to behav-ioural and psychological factors, has also been little inves-tigated, but a Danish study reported that parental neglectand lack of parental support of children were both riskfactors for developing obesity in early adulthood (314). Inthe Danish context, the quality of the home, the localenvironment and the level of ‘care’ within a family may bemore relevant to the development of obesity than the fam-ily’s size or specific economic status.
Psychological factors in parents may also be important;children with parents who show high levels of dietary dis-inhibition (abandonment of control of dietary intake in thepresence of certain external food cues), especially with
concurrent dietary restraint (conscious restriction of diet tocontrol weight) show greater increases in fatness (315). Ininfancy, a vigorous feeding style (316) and distress at lim-itations (317) were related to increased subsequent fatness,and soothability to decreased fatness. In childhood, predic-tors of fatness included decreased adaptability, increasedintensity and withdrawal (318), various aspects of self-esteem and family functioning (181,319), and feelings ofinadequacy (320).
At school, studies have found a higher percentage ofoverweight children among low-achievers, and this associ-ation between overweight and under-achievement persistsinto adulthood (321). A study in Thailand found that beingor becoming overweight in adolescence was associated withpoor school performance, although this was not the casefor younger children (322). In young adults, intelligencetest scores and educational levels are higher among thosewith below median BMI (323).
4.4.3. Environmental risk factorsThe areas that have attracted most attention in terms ofpossible realms for the management or prevention of obe-sity are those concerned with the environmental conditionsthat encourage the consumption of greater food energythan is required, or that encourage sedentary behaviour ordiscourage physical activity.
In modern industrialized societies, food and drink aremore available and affordable than ever before, fewer peo-ple have jobs requiring hard physical labour, car owner-ship has increased rapidly and homes have labour-savinggadgets. Yet human metabolism evolved under very differ-ent conditions with a sparse and erratic food supply andhuge physical demands for survival, which has selectedindividuals with a ‘thrifty’ genotype. This genotype is ill-suited for the modern world. Excessive fat storage, leadingto obesity, is the default situation unless specific action istaken.
The recent WHO/FAO expert consultation on diet,nutrition and the prevention of chronic diseases recog-nizes this link between the wider environment and thegrowing problem of obesity in adults (6). It is probablethat similar factors are linked to the rise of overweight inchildren; for example, a decline in walking to school anda rise in snack food consumption and the popularity offast-food outlets. Within this ‘obesogenic’ environmentthere are a number of factors that warrant specific consid-eration with respect to the risk of overweight in childrenand adolescents. It is also important to consider, however,the micro-environment created in the home. For youngerchildren in particular the family environment plays animportant role in determining their risk of obesity, forexample parental physical activity levels (214,279), thefamily’s eating behaviours (48,279) and television viewinghabits (243).

46 Obesity in children and young people IASO obesity reviews
© 2004 The International Association for the Study of Obesity. obesity reviews 5 (Suppl. 1), 4–85
4.4.4. Diet Energy intake is one side of the energy balance equation,thus dietary factors are obvious candidates as risk factorsfor obesity. Despite more general acceptance that the post-weaning diet is involved in obesity development, evidencefrom longitudinal studies is sparse, and findings arevariable. It would seem logical that the rise in obesityprevalence might be partly due to increases in energy intake,but paradoxically, in the US at least, while the prevalenceof obesity in adolescents has doubled (16) energy intakes(in adolescents) have apparently decreased (324). There are,however, concerns about the accuracy of measures relyingon reported food intake. Food disappearance data suggestthat energy intakes have actually increased while reportedfood intakes show a decrease (325).
Infant feeding. Several recent large studies have examinedwhether breast-feeding might have a protective influenceon subsequent childhood obesity. Most studies suggesta protective effect of breast-feeding on obesity(286,326,327), and on the risk of type 2 diabetes duringchildhood and adolescence among high-risk groups (328),but others argue that the apparent effect may be due toconfounding factors such as social class, maternal fatness,maternal diabetic status, maternal reluctance to breast-feed, or infant birthweight (329–332).
von Kries and co-workers’ study of 10 000 children inBavaria found significantly greater proportions of thosechildren who had been formula-fed as infants were over-weight at the age of school entry (5 or 6 years old), com-pared with those who had been breast-fed (286). Theprotective effect of breast-feeding was dose-dependent,with better protection against excess weight gain amongthose children with the longest duration of breast-feedingas infants. The authors acknowledge, however, the poten-tial role of confounding factors, including social class,smoking during pregnancy and general family dietary hab-its.
A study by Armstrong & Reilly of 32 000 childrenaged approximately 3.5 years found obesity to be lower inbreast-fed children, after adjusting for socio-economic sta-tus, birthweight and gender (327). A longitudinal study byBergmann et al. of a cohort of nearly 1000 infants foundno difference in BMI at birth, a raised BMI among breast-fed babies at 1 month, but after 2 months a raised BMI andincreased skin-fold thickness among bottle-fed babies com-pared with those that had been breast-fed for 2 months ormore (333). For the next year, the bottle-fed babies had aconsistently higher risk of being overweight or obese. At18 months the two groups showed little difference in skin-fold thickness, but the differences emerged again, withbottle-fed babies having significantly raised risk of showingexcess weight at age 2 years through to age 6 years (the endof the study period). The mother’s smoking behaviour, BMI
and socio-economic status had a strong influence on thechild’s risk of overweight, but the differences between bot-tle and breast-fed babies remained after controlling forthese factors.
Two further studies have been published in 2003, onefrom UK data showing no significant protective effects ofbreast-feeding, and one from Brazil showing protectiveeffects when breast-feeding was of 3–5 months duration,but not for shorter or longer periods (334,335). A recentreview raises concerns over the designs of the trials thatreport on breast-feeding and subsequent obesity (336).
The introduction of solid foods can lead to excess energyintake by increasing the energy density of the diet. Theduration of breast-feeding and the age of introduction ofsolid foods might thus influence the infant’s regulationof energy intake and consequent weight gain, with earlierintroduction of solid foods leading to more rapid weightgain in this age group than continued breast-feeding, orpossibly continued bottle-feeding.
The protein content of the infant’s diet has also beenindicated as potentially raising the risk of early excessweight gain (213) and it is possible that bottle-feeding orearly weaning may specifically increase protein consump-tion in this age group.
Macronutrients and energy density. ‘Energy density’reflects the energy content of foods, usually expressed perunit weight. Energy density (measured per unit weight offood) is highest in foods containing high levels of fat.However, energy density can also be viewed as an inverseof nutrient density, i.e. a high level of energy for a givenlevel of non-calorific micronutrients such as vitamins oressential minerals. In this view, energy density will also behigh in foods containing significant amounts of refinedcarbohydrates such as sugar, while energy density will berelatively low in foods such as fresh fruit and vegetables,lean meats, pulses and wholegrain products.
There are few laboratory studies of energy density infoods in relation to children’s energy balance. Research inyoung children has shown relatively good compensationfor changes in the energy density of meals (281), but long-term studies are lacking. Moreover, there are few studiesof the effects of energy density on appetite control inschool-age children.
A study by Bowman et al. (337) found that on those dayswhen children consumed fast food products their diet waslikely to be less healthful than on other days – the energylevels were higher, the energy density per gram was higher,the fat intake was higher and the fruit and vegetable intakelower. Figures show the consumption of fast food by chil-dren has increased by 300% in two decades (338). In ananalysis of typical foods served at fast food outlets in theUK, Prentice & Jebb (339) found the food to have greaterenergy density (by weight) than that found typically in UK

obesity reviews Obesity in children and young people IASO 47
© 2004 The International Association for the Study of Obesity. obesity reviews 5 (Suppl. 1), 4–85
diets, and to be more than twice the energy density of foodsrecommended for healthful diets.
Outside of the controlled conditions of a laboratory,cross-sectional surveys of food intake in children (e.g. inthe UK) show that the mean proportion of fat in the dietof children is lower than adults and close to recommendedintakes, but there are large variations in fat intake betweenchildren (340). Overall these studies indicate a positiveassociation between percentage energy intake as dietary fatand measures of body weight (341–344), but in longitudi-nal studies the results are less clear (345–348). These free-living studies are often hindered by the mis-reporting ofintake, which may be different between macronutrients,as well as differences between studies in the estimation ofbody fatness, for example using BMI versus skin-fold thick-nesses.
The type of carbohydrate in the diet may affect energydensity but has received relatively little attention. An analy-sis of the diet of pre-school children confirmed the positiverelationship between dietary fat and energy density and thereciprocal relationship with carbohydrate. Those withthe highest energy density also consumed less sugar (349).However this analysis did not exclude sugars consumed asdrinks, which may confound the analysis (see below).Dietary surveys show low consumption of fruit and vege-tables among young people increases the energy density ofthe overall diet.
There are reports of an association between high proteinintakes in early childhood and a relatively early ‘adiposityrebound’, which may increase the risk of being obese inchildhood and adolescence (348) – the authors suggest apossible mechanism for the protective role of breast milk(relatively high in energy from fat) and propose that a diethigh in protein during infancy may increase the risk ofadiposity and other pathologies in later life. In older chil-dren, there is some evidence showing a secular increase inenergy from protein in the USA, 1973–1988 (350), as wellas an increase in carbohydrates, and a decrease in totalenergy from fats. The authors noted that ‘few children meetthe prudent diet recommendations’.
Soft drinks. Energy consumed as drinks should be consid-ered separately from solid food because experimental stud-ies suggest that the post-ingestive effects on appetite maydiffer. Soft drinks make a growing contribution to the dietof young people, even young children (351). The quantityof soft drinks consumed, especially carbonated soft drinksincreases with age and can account for the largest singlesource of non-milk-extrinsic sugar intakes among youngpeople (340).
One prospective study has reported a positive associationbetween consumption of sugar-sweetened drinks and obe-sity in 11–12-year-olds over 19 months follow-up (352).Those consuming more soft drinks, however, had other
dietary differences compared with those consuming fewersoft drinks, and the association may not be related to softdrink intake per se, but may instead relate to broaderdietary or lifestyle habits associated with soft drink con-sumption. In the above study, increased ‘diet’ (low calorie)soft drink consumption was negatively related to obesityincidence, but this association may be confounded as thesedrinks may be preferred by individuals trying to controlweight.
In a study of adults, there was a significant increase inweight following a 10-week intervention with increasedsugar-sweetened foods (80% of which were beverages) anda decrease in weight in those consuming artificially-sweetened foods (353). There is no comparable medium-or long-term study in children. In a study of children givena single meal accompanied either by a sugar-sweeteneddrink or an aspartame-sweetened drink, there was no sig-nificant difference in energy consumed from the other foodsat the meal, and the children consumed more energy intotal when the sugar-sweetened drink was served (354).
Eating patterns. Babies and young children characteristi-cally have frequent eating episodes. In most Westernizedsocieties, this behaviour has generally been replaced with a‘three-meals-a-day’ culture as children get older. However,there is an increasing tendency in these industrial societiesfor more frequent and less well-defined eating occasions inboth adults and young people (355) with increases in ‘graz-ing’ or snack food consumption at more frequent or irreg-ular intervals.
Experimental research in adults has shown that underisoenergetic conditions changes in the number of eatingepisodes per day has little effect on body weight. Howeveroutside of controlled laboratory conditions differences ineating frequency may also be associated with differences inthe amount or types of food and drink consumed. A seriesof studies by Marmonier et al. on adults who were beingcontinually monitored for blood glucose, insulin and fattyacid composition for a period of 3–4 h following a mealhave shown that snacks of 1 MJ delayed the request for thenext meal by less than an hour, and did not reduce theenergy consumed at that subsequent meal (356–358)implying that snack eating can be a significant contributorto positive energy balance and subsequent weight gain.Self-reported snack consumption can be misleading: astudy of obese women found no difference in self-reportedhabitual consumption of sweet foods compared withwomen of normal weight, but analyses of their salivashowed a highly significant increase in levels of mutansstreptococci (P < 0.0001) indicating a higher level of sugaryfoods had been eaten (359) especially pre-menstrually.
The impact of snacking on body weight may also beinfluenced by the types of food consumed as snacks. Out-side of the home, the types of foods commonly consumed

48 Obesity in children and young people IASO obesity reviews
© 2004 The International Association for the Study of Obesity. obesity reviews 5 (Suppl. 1), 4–85
as snacks are often high in fat or high in carbohydrates(sugar and/or starch). In one of the studies by Marmoneiret al. (357), isocaloric snacks of 1 MJ were effective indelaying a request for a subsequent meal differentiallyaccording to the principal macronutrient in the snack: highfat and high carbohydrate snacks delayed meal requests byan average of 25 and 34 min respectively, while high pro-tein snacks delayed meal requests by an average of 60 min.It is worth noting the authors’ comment that a 1 MJ snackmight have been expected to delay meal requests by200 min according to the subjects’ average basal energyexpenditure, implying that all snacks had poor satiatingefficiency.
Short-duration studies may not predict behaviour in thelonger-term. A study of snacking behaviour by Johnstoneet al. (360) showed no higher energy intake over a 7-dayperiod between snackers and non-snackers. On the otherhand, Blair has reported that obese subjects on a weight-reducing programme lost more weight when they stoppedeating between meals (361). Few studies have examined theassociation between eating frequency and body weight inyoung people, although irregular snacking was found to becorrelated with a raised risk of obesity among 3-year-oldchildren in Japan (362).
Children who skip breakfast may be at increased risk ofweight gain (363,364). There is clearer evidence for thisamong adults (365) although the exact mechanism remainsunclear; eating breakfast may be associated with decreasedfat intake and decreased snacking later in the day, or eatingbreakfast may be a marker of more organized family rou-tines that are indicative of better health behaviour generally.
Portion size. In North America, and to some extent in othercountries with a well-established industrialized food sup-ply, increases in standard portion sizes have occurred acrossa range of foods eaten in and outside the home (366).Academic research suggests that while very young childrenhave innate control of appetite and are able to match intaketo energy needs, this biological mechanism can more easilybe overridden by environmental and social factors in olderchildren.
A study of the effect of portion size on food intake at agiven meal showed no change in energy intake among 3-year-old children but a positive association in 5-year-oldchildren (367), however the impact on subsequent foodconsumption was not studied. A second study showed thatin very young children, aged 12–18 months, body weightwas positively related to energy intake and to portion sizebut not to the number of eating occasions (368). Moreresearch is needed, particularly in relation to the effect ofportion size on subsequent energy intake in older childrenand the contextual factors that may influence this. Never-theless, it is immediately apparent that a ‘Supersize’ snackor beverage can provide a disproportionately large contri-bution to a child’s energy needs in a single food item.
4.4.5. Physical activity and sedentary behaviourEnergy expenditure, like energy intake, is an importantfactor in the development of, or protection against obesity.Studies of energy expenditure may measure direct energyoutput using calorimetric methods, or may measure theincidence or prevalence of specific physical activities asindicators of raised energy expenditure, or may measurelevels of inactivity, or sedentary behaviour, as indicators oflow energy expenditure.
Direct evidence of decreasing energy expenditure amongchildren in recent years is lacking. Some data suggestreduced walking and cycling behaviour between the 1980sand 1990s, among children in the UK and USA, along withincreasing use of cars (e.g. to travel to school) (369,370).In the UK, children appear to become less active as theyget older, and show decreases in activity levels during ado-lescence, starting earlier in girls than in boys (371). Asystematic review identified a number of longitudinal stud-ies estimating the effect of physical activity measured inchildhood, usually by questionnaire, on subsequent fatness;the studies were generally small, and roughly dividedbetween finding no effect, or a protective effect of activity(214).
Multivariate studies have found that television viewingand playing video games for longer periods of time, or notparticipating in sports outside of school, promotes obesity,whilst physical activity shows protective effects or no rela-tionship (372–374). Several studies have specifically exam-ined the links between television viewing and children’s riskof overweight. Although some find only weak relationships
Figure 30 BMI and television viewing among over 2500 children aged 6–17 years in northern Greece. The association was significant at the P<0.0001 level after potential confounders were excluded.Source: Krassas et al. (380).
16.5
17
17.5
18
18.5
19
19.5
20
20.5
0 1 2 3 4 >5
Hours viewing per day
Mea
n B
MI
Boys Girls

obesity reviews Obesity in children and young people IASO 49
© 2004 The International Association for the Study of Obesity. obesity reviews 5 (Suppl. 1), 4–85
(347,375), several others have found that hours of televi-sion viewing were closely associated with increased levelsof obesity in cross-sectional and prospective studies, amongchildren in the USA (376), Australia (377), Mexico (378),Thailand (379), Greece (380) (see Fig. 30) and NativeCanadian groups (381). One study, however, showed thatafter adjusting for differences in food intake and for generalactivity level, television ceased to be independently signifi-cantly related to child BMI, implying that the effect oftelevision viewing on obesity may be mediated through oneor both of these influences (377).
A prospective study by Gortmaker et al. (382) monitoreda cohort of over 700 children aged 10–15 years during a4-year period. The results showed a strong dose–responserelationship between hours of television viewing and theprevalence of overweight at the end of the period, even afteradjusting for previous overweight, baseline maternal over-weight, socioeconomic status, household structure, ethnic-ity, and maternal and child aptitude test scores. Thosechildren watching television the most (over 5 h day-1) werefive times as likely to be overweight than those watchingfewer than 2 h day-1. They were also the most likely to gainweight during the period, and least likely to cease to beoverweight if they had been overweight at the start.
Various factors are likely to be important in determin-ing the amount of time spent viewing television. A studyby Wiecha et al. (383) showed that the presence of a tele-vision in a child’s bedroom increases the time spentwatching television by an average of 38 min day-1. Thisstudy also showed that other significant factors include:
the presence of additional televisions outside the youth’sbedroom (7 min more viewing per additional set in thehousehold), the child never or seldom has family dinners(33 min more viewing) and the child experiences noparental limits on television viewing time (29 min moreviewing). The presence of parental limits on televisionviewing time was associated with 13 min more readingper day.
An Australian study showed that after adjusting for dif-ferences in food intake and for general activity level, tele-vision ceased to be independently significantly related tochild BMI, implying that the effect of television viewingon obesity is mediated through one or both of these influ-ences (377). Television viewing may be associated withchanges in eating behaviour, for example by encouragingcasual snacking, or may modulate eating habits throughgreater exposure to advertisements for foods high inadded sugars and/or fat (384). Exposure to 30 s televisionfood commercials can influence the subsequent foodchoices made by pre-school children (385). Television mayalso provide confusing messages about lifestyle and healthfrom the content of advertisements or programmes(386,387).
The links between television viewing and weight gainmay also be affected by other social factors, for examplethe use of television as a child-care substitute, especially inlarger families. In one study the time spent watching tele-vision correlated positively with fatness in children frompoorer socio-economic communities, but not in childrenfrom better-off communities (388).

50 Obesity in children and young people IASO obesity reviews
© 2004 The International Association for the Study of Obesity. obesity reviews 5 (Suppl. 1), 4–85
5. THE MANAGEMENT AND TREATMENT OF THE OBESE CHILD
The successful treatment of obesity in children or adoles-cents has proved elusive. Reviews of the treatment of pae-diatric obesity have shown that the success of thesetreatments have been limited (8,389), although whenweight reduction is achieved several co-factors alsoimprove (390). Paediatric approaches are generallydesigned to bring weight gain under control and to manageand alleviate the associated co-morbidities.
The present report will describe briefly the managementand treatment options available. It does not attempt toprovide detailed principles of treatment, nor does it givespecific guidance on risk reduction or the management ofcomplications of obesity. There are several areas wherefurther research is required to support the development ofthe management of obesity and its co-morbidities, such asthe most appropriate management of insulin resistance,effective screening for, and management of, obstructivesleep apnoea, and the recognition and management of non-alcoholic fatty liver disease. Guidelines need to be devel-oped, and the appropriate training made available, toensure that primary health care staff are able to deal mosteffectively with the increasing burden that child obesity willplace upon them.
For more details on management and treatment optionsthe reader may wish to look at the literature suggested inSection 5.4.1 below. In addition, a report dealing morespecifically with the clinical management of childhood obe-sity is being published by the Federation of InternationalSocieties for Pediatric Gastroenterology, Hepatology andNutrition (391).
5.1. Principles of childhood obesity management
With the strongest links being found between adolescentobesity and subsequent adult obesity and its concurrenthealth problems, it might be argued that resources shouldbe directed towards research and evaluation of the treat-ment of obesity in adolescents. However, younger chil-dren are used in the majority of studies of obesitymanagement and, although the success of current obesitytreatment programmes over the longer term (5–10 years)is unsatisfactory, the achievements appear to be better inthe younger paediatric groups than in older ones or inadults (389).
Obesity management at a younger age may have agreater effect for several reasons, including:
• motivation may be easier to generate and maintain, forboth the child and the other family members while the childis young;
• it can be easier to control and modify behaviour inyounger individuals, there may be less resistance to treat-
ment stigmatization and greater influence of the family onthe child;
• there may be more frequent opportunities for medicalobservation during earlier childhood compared with lateryears;
• longitudinal growth and an increase of lean body massoccur during childhood so that children can ‘grow intotheir weight’.
Compared with younger children, adolescents are lesslikely to accept a highly controlled home or school regimenand may provide greater difficulty as subjects in random-ized controlled trials, with a higher drop-out rate and awider range of strategies for treatment avoidance and inac-curate self-reporting. Adolescents are in danger of fallingin the ‘gap’ between paediatric services and adult services,with adolescent patients refusing to be treated ‘like chil-dren’ and failing to attend appointments (392). New strat-egies, for example involving communication through theInternet, better involvement of adolescents in their ownmanagement programmes and peer support strategies, needto be explored (393).
Motivation is essential: if the child or an influentialparent is not motivated then the prospects for success-ful intervention are poor. Practitioners may need tomake themselves familiar with techniques for gainingand increasing motivation among children and theirfamilies.
5.1.1. Dietary managementA reduction of dietary energy intake while maintaining orincreasing physical activity will reduce relative body weightin children, but the long-term sustainability of dietaryrestrictions may be questioned. Reviewing the literature,Caroli & Burniat (394) conclude that several benefits canbe achieved through dietary controls, but several negativeconsequences may also arise. On the positive side theyhighlight the following:
• Fat mass reduction and healthier body fat distribution.Dietary management appears to encourage the loss ofabdominal fat mass in preference to subcutaneous fat, andsignificant metabolic improvements may result.
• Reduced plasma lipids and apolipoprotein levels, andenhanced insulin sensitivity and glucose tolerance. Dietarymanagement can assist in decreasing baseline levels forplasma lipids and can improve glycaemic response to anoral glucose load.
• Reduced blood pressure. Blood pressure in obese chil-dren and adolescents appears highly sensitive to sodiumintake, and that dietary management which reduces weight

obesity reviews Obesity in children and young people IASO 51
© 2004 The International Association for the Study of Obesity. obesity reviews 5 (Suppl. 1), 4–85
and decreases sodium intake may have a twofold impacton reducing blood pressure levels.
On the negative side, Caroli & Burniat warn that dietarycontrols can cause problems, such as:
• Loss of lean body mass. Diets that restrict nitrogenintake may especially lead to excessive loss of muscle andother lean body tissue. Generally, if no more than 25% ofweight loss is from lean body mass then it is deemed withinthe ‘safe’ weight loss range and can be viewed as a loss ofexcess lean tissue and a regression towards the lean bodymass levels of people of normal body weight.
• Reduced linear growth. Dietary restrictions may leadto reduced linear growth and a lowering of predicted adultheight.
• Binge eating and anorexia. These disorders may pre-cede the introduction of a controlled dietary regimen, butcare should be taken that such problems are not introducedor exacerbated.
• Increased serum uric acid. Several studies have shownraised uric acid levels during low-calorie dieting, but theseresolve when the diet returns to a more normal, weightmaintenance regimen.
• Raised risk of gallstones. This problem has beenreported among severely obese adults on liquid very-low-calorie diets, but has not been reported for obese childreneating normal foods in a managed diet.
In making recommendations for treatment, Caroli & Bur-niat suggest that weight maintenance regimens (with nutri-tional counselling) are preferred for all but the very obeseuntil after puberty. For the very obese child, or the moder-ately obese child with additional complications, a balancedlow-calorie diet using normally available foods is recom-mended. They recommend a more restricted very-low-calorie diet only when children suffer severe obesity withadditional complications that justify such treatment. Over-all, Caroli & Burniat suggest that dietary changes alone are‘unlikely to have much effect without other long-term life-style changes’, which include increased physical activity,psychological support and an interdisciplinary managementregimen. Dietary intervention in combination with exerciseprogrammes has been reported to have better success ratesthan dietary modulation alone, with enhanced weight lossand better maintenance of lost weight (395). The optimalexercise programme, most appropriate for obese childrenand adolescents, remains to be established. Research todefine the most effective combination of diet and exerciseis a high priority for supporting treatment programmesaction.
5.1.2. Physical activityA reduction of inactivity, an increase in ambulation and thedevelopment of an activity programme can increase the
effectiveness of obesity therapy, and even when these donot reduce obesity they can independently reduce morbid-ity (10). Strategies for raising energy expenditure involveincreases in physical activity and, as a separate strategy,decreases in sedentary behaviour such as television watch-ing – with such sedentary behaviour being linked not onlyto low energy expenditure but also to increased snackingbehaviour and exposure to food advertising.
Strategies for raising physical activity levels will encour-age specific sessions of activity, but it should be recognizedthat the amount of energy that is expended during suchphysical exercise is generally modest compared with theenergy deficit that can be achieved by dietary restriction.Nonetheless, exercise can produce useful reductions inbody weight and fat mass. When evaluating changes inadiposity using weight or BMI, an adjustment for anincrease in the muscle mass induced by isometric exercisemay need to be made.
Interventions that target energy expenditure are moresuccessful when reductions in sedentary behaviour are tar-geted rather than increases in the level of exercise (396,397).Simple measures such as the reduction of children’s televi-sion, videotape and video game use can significantly con-tribute to decreasing overweight in children.
Epstein et al. (398) have shown that participation ofchildren in an exercise programme during treatment forobesity is often poor, but those that are most compliant aremost likely to maintain long-term weight control. The typeof exercise employed (i.e. ‘lifestyle’ exercise involvinggames, swimming, sports, dance, cycling, etc. as opposedto programmed aerobic exercise) also appears to be impor-tant for sustained weight loss; while both forms of exercisehelp promote weight loss in the initial phase, the child oradolescent is more likely to continue longer-term with the‘lifestyle’ form of exercise (399). Families and young peopleneed to be reminded that increased physical activity maybest result from a change in incidental activity and notnecessarily from organized exercise-focused activities.Importantly, children and adolescents should be encour-aged to choose activities that they enjoy and which aretherefore likely to be more sustainable
Reviewing the evidence, Parizkova et al. (10) recommendthat exercise programmes need to be individually tailoredto the particular child. ‘Supportive help from family, peers,physical educators and teachers can combine to guaranteelasting positive effects of physical activity therapy untiladulthood. High rates of drop-out can be reduced by pro-grammes which are cheap, which involve group aerobicactivities, and which are of low intensity but of more than30 minutes duration.’ (p. 322–323). Competitive sportsmay not be appropriate for the obese child, and mayincrease psychological and social problems if they arerequired to participate, and equally lead to stigmatizationif they are noticeably excluded. Swimming may be consid-

52 Obesity in children and young people IASO obesity reviews
© 2004 The International Association for the Study of Obesity. obesity reviews 5 (Suppl. 1), 4–85
ered, but the social aspects of children’s use of changingrooms and feelings of exposure in an undressed stateshould be allowed for. Alternative arrangements need to beconsidered, and non-competitive forms of exercise devel-oped, such as dancing.
Regimens for physical activity need to take account of thecapacity of the patient to endure the exercise, and this in turndepends on the severity of the obesity. Thus for those whoare extremely obese, exercise may be limited to activities inlying and sitting positions or in swimming pools. For the lessseverely obese child, standing, walking, cycling on an ergo-meter, dancing and stretching may be suitable. It should benoted that energy expenditure may be as much as twice asgreat for an obese child as for non-obese child undertakingthe same exercise (400). For the mildly obese child teamgames and sports can be considered as well as the rangedescribed above. For those who have lost weight and need tomaintain this loss, all these activities can be recommendedalong with more extensive aerobic and endurance regimens.In all cases, care should be taken to ameliorate the discom-fort that can be experienced with exercise. Chafing, sweat-ing, heat rashes and breathlessness can be major deterrentsto physical activity (401).
As with dietary changes, the support of family andschools is important in continued success of a physicalactivity programme. From the child’s viewpoint, it is essen-tial that success is not measured in terms of weight or fatloss but in terms of benefits such as increased skills andcapacities, for example gaining ball game skills, dancingskills or self-defence skills.
5.1.3. SurgeryAt present, surgical interventions are not recommended foruse in children and adolescents with common forms ofobesity. The safety and effectiveness of surgical treatmentshave not been sufficiently established in these patientgroups and other approaches should be tried first (8).Reviewing the literature, Salvatoni (402) suggests that sur-gery should be considered only when all else has failed,when children have achieved adult height and when severe,potentially life threatening complications of obesity arepresent. He notes that:
‘Certainly, bariatric surgery cannot, and never will, solvethe problems of management for the vast majority ofobese and morbidly obese children and adolescents.’(p. 358)
5.1.4. PharmacotherapySeveral drug therapies for adults have been developed andthe field is rapidly progressing. The mode of operation ofthese drugs can be categorized into four main fields: sup-pressing food intake, increasing thermogenesis, inhibitingthe absorption of food in the digestive tract and acting on
the hormonal system. These have been summarized byMolnár & Malecka-Tendera (403) (see Table 12). Furthertherapeutic developments are currently underway.
Caffeine–ephedrine mixtures in adolescents showedsome success, while dexfenfluramine has been reported tobe successful for treating obese children in two trials, butwas reported as not superior to dietary modification in athird trial (403).
A recent study on sibutramine in combination withbehavioural therapy in adolescents showed some success(404). The study required a resource-intensive behaviourmodification programme with 13 weekly session and sixbi-weekly sessions in the first 6 months, in combinationwith the drug or a placebo. Adherence to the behaviouralprogramme accounted for a significant proportion of thechanges in body weights, greater than the effects ofsibutramine versus placebo (8). Furthermore, the sibutra-mine treatment led to an increase of blood pressure at 3months, and the dose had to be reduced or discontinuedin nearly half of the treated adolescents in the first 6months. There appeared to be no difference betweensibutramine and placebo in the improvements in co-morbid conditions such as insulin resistance anddyslipidaemia. The authors of the research paper (404)comment ‘Until more extensive safety and efficacy dataare available, medications for weight loss should be usedonly on an experimental basis in adolescents and chil-dren’ (p. 1805).
The beta-agonists and the hormonal drugs are cur-rently under development. The results of the use ofgrowth hormone in Prader-Willi syndrome appear to besignificant and beneficial (405), although others have sug-gested further trials should be undertaken before recom-mending growth hormone treatment (403).There appearto be few reports of the use of appetite suppressants orof the use of Orlistat in children or adolescents. The use
Table 12 Pharmaceutical approaches to obesity control
Food intake suppressorsNoradrenergic: benzphetamine, phendimetrazine, diethylproprion,
mazindol, phenylpropanolamine, phentermineSerotoninergic: fluoxetine (and the withdrawn drugs fenfluramine,
dexfenfluramine)Adrenergic/serotoninergic: sibutramine
Thermogenic agentsAdrenergic stimulants: ephedrine, caffeineBeta-agonists
Food absorption inhibitorsLipase inhibitor: Orlistat®Non-digestible fat substitute: Olestra®
Hormonal agentsLeptin analoguesNeuropeptide Y antagonistsCholecystokinin promoters

obesity reviews Obesity in children and young people IASO 53
© 2004 The International Association for the Study of Obesity. obesity reviews 5 (Suppl. 1), 4–85
of a non-digestible fat substitute, Olestra, may be consid-ered, although anecdotal reports of gastrointestinal side-effects in some patients and a possible reduced availabil-ity of fat soluble vitamins in the diet should be notedbefore using Olestra extensively.
5.1.5. Psychological and familial supportThe child’s family will influence the child’s food and activityhabits and any effective treatment must take this intoaccount. Parental involvement in treatment programmes isnecessary for successful weight loss both in young childrenand, to a lesser extent, in adolescents. Several studies haveshown that long-term maintenance of weight loss (i.e. from2 to 10 years) can be achieved when the intervention isfamily-based (395,406,407) (for example, see Fig. 31). Thelong-term improvements against origin were small, withmuch of the apparent improvement due to the worseningobesity among the non-specific control groups.
These results imply that long-term weight control‘success’ in childhood obesity is associated with parentalinvolvement, and related factors including the amount ofweight the parent loses (in families with overweight par-ents participating in the studies), the use of reinforcementtechniques such as parental praise and a change in eatinghabits such as eating meals at home or a moderate reduc-tion in fat intake (406,407). Altered food patterns withinthe whole family, as well as support of the child andparental reinforcement of a healthy lifestyle, are impor-tant factors in successful outcomes. The child should notbe isolated within the family and should be participatingin meals and eating similar foods with other familymembers.
There is increasing evidence that treatment of pre-ado-lescent obesity with the parents as the exclusive agents oflifestyle change is superior to a child-centred approach.An Israeli study randomized obese children aged 6–11 years and their parents to either an experimentalintervention where only the parents attended group ses-sions (with an emphasis on general parenting skills), or acontrol intervention where only the children attendedgroup sessions (11,408). There was a greater reduction inoverweight in the experimental, parent-only group, andin contrast children in the control, child-only group hadhigher rates of reported anxiety and of withdrawal fromthe programme. Thus, when dealing with the obese pre-adolescent child, sessions involving the parent or parentsalone, without the child being present, are likely to bethe most effective.
There are barriers to parental involvement in the treat-ment of the child. In some families, for cultural or psycho-logical reasons, parents may not perceive the child to beobese (409). In other families parents may acknowledgethat the child is obese but deny that this is of any conse-quence (410). The implementation of treatment pro-grammes may have to start by raising the parents’awareness of the need to intervene, especially when familybehaviour changes are required.
A different approach is needed for the adolescent patient.Features of successful interventions in adolescent obesityinclude the provision of separate sessions for the adolescentpatient and the parent, and having a structured, althoughflexible, programme that encourages sustainable modifica-tions in lifestyle, relationships and attitudes (411,412).There is also a report of at least short-term success in the
Figure 31 Percentage of overweight children over a 10-year follow-up. Source: Epstein (395).
0 20 40 60 80 100 12010
20
30
40
50
60
70
Non-specific control
Child alone
Child and parent
Years0 1 2 5 10
Ove
rwe
igh
t (%
)

54 Obesity in children and young people IASO obesity reviews
© 2004 The International Association for the Study of Obesity. obesity reviews 5 (Suppl. 1), 4–85
management of adolescent obesity with a phone- and mail-based behavioural intervention initiated in a primary caresetting (413).
Behavioural and psychological forms of therapy thathelp to enhance physical activity and healthy eating habitsare considered valuable for the long-term success of treat-ment in obese children and adolescents (414). Suchapproaches can help to stabilize and reinforce health-pro-moting behaviour, and to strengthen self-confidence andindependence in the child. A large variety of approachesexist with respect to behavioural treatment, and manyopen questions exist such as the choices of methods,types, times and intensity of intervention and degree ofindividualization of treatment, which need to be studiedfurther.
In a review of psychological approaches to treatment,Flodmark & Lissau (414) suggest that age is a major factorin influencing the choice of strategy for influencing behav-
iour. With pre-school children, group teaching is moreimportant than individual treatment, and the whole familyshould be involved. By the time children pass puberty theyare creating their own groups and social networks, andindividual treatment may be more appropriate. Forms oftreatment can range from cognitive behavioural therapy,family therapy, specialized schools and hospital treatment.Little is known about the value of psychodynamic therapiesas these are not widely used. Behavioural and cognitivetherapies assume that obesogenic behaviour is learned andcan be unlearned through behavioural modification tech-niques. Family therapy improves an individual’s healththrough analysing family interactions and improving afamily’s ability to use its own resources. In the Europeancontext, Flodmark & Lissau recommend approaches basedon the schema in Table 13.
The ideal approach will vary from region to regiondepending upon existing health care services and expertise,
Table 13 Behavioural and psychotherapeutic approaches to child obesity
Childhood obesity (4–10 years)Recommended treatment: Education in pre-school settings and in schools, with the provision of dietary advice, healthful foods and physical activity in
groups. Interventions include cognitive behavioural therapy and family therapy.Older child and adolescent obesity (10–18 years)Recommended treatment: Obesity to be treated at the school health centre. Severe obesity to be treated with family therapy and social support or
cognitive behavioural therapy. Interventions also include day-care programmes and specialized boarding schools.Adolescent eating disordersRecommended treatment: Child guidance clinic, family therapy, cognitive behavioural therapy and individual psychotherapy. Additional interventions
include day-care programmes and hospital treatment using environmental therapy where individuals learn how to interact with their social environment.Syndromes with impaired cognitive functioning Family therapy along with social and educational specialized home support. Additional interventions include day-care programmes and hospital
treatment using environmental therapy.
From Flodmark & Lissau (414).
Residential schools or ‘fat camps’
An alternative to a hospital inpatient programme is aresidential weight loss school or camp programme (425–427). As with inpatient programmes, the regimens canvary. In different reports, the duration of the programmesranges from 10 days to 8 weeks, during which activityprogrammes can include ‘exercise’ (425), ‘3 hours ofphysical activity’ (426), ‘5 hours of skill based fun typephysical activity’ (427) and 5 hours ‘daily lifestyle exer-cise’ (428).
Dietary components may include a high protein, hypoc-aloric diet of 1200–1400 kcal day-1 (426), 1300–1500 kcal day-1 (425), a low-fat low-calorie diet based onestimated basal metabolic rate (427) or 1500 kcal day-1
(428). All programmes reported involved forms of behav-iour modification: ‘nutrition education’ (426), ‘behaviour
and education change programme’ (427), and ‘CognitiveBehavioural Treatment’ (428). Despite the acknowledgedimportance of family support, only Braet & Van Winckel(428) and Gately et al. (427) allude to any form of familysupport during or following the intervention.
The outcomes of these camps appear impressive. Usingdifferent measures, they report a fall of ‘13.7 kg’ (426),‘12.1 kg’ (425), ‘4.4 kg m-2’ (427), or ‘18% overweight’(428). Where subsequent follow up was undertaken, suc-cess compared with baseline figures was reported: downby 11.1 kg at 6 months (426), down by 2.6 kg m-2 at1 year (427), or down by 15% overweight at 4.6 years(428). The lack of common methods and measurementsmakes a detailed comparison between these different pro-grammes difficult. Evaluations are also hampered by alack of control group or standardized reference dataagainst which the target group can be compared.

obesity reviews Obesity in children and young people IASO 55
© 2004 The International Association for the Study of Obesity. obesity reviews 5 (Suppl. 1), 4–85
and upon cultural attitudes towards obesity treatment. Inaddition, it should be recognized that in developed econo-mies as many as 50% of marriages end in divorce, creatingdifficulties in the health care provision for obese childrenin affected families.
5.1.6. Residential treatmentMost treatment or management programmes aredirected through out-patient or family health servicesand occur in the home or school environment, deliveredby a team of specialists through an interdisciplinaryprogramme (13). Occasionally, as noted above, interven-tions may be considered more effective if delivered in amore controlled environment, in the hospital or special-ized school or residential setting, particularly when out-patient management has proved ineffective and theburden on the child or adolescent becomes overwhelm-ing (415).
Inpatient or residential treatment does not differ inprinciple from other treatment profiles, and it requires aprogrammed combination of therapeutic approaches totackle the range of health consequences of obesity(416,417). Hospital and research institution inpatienttreatment programmes have had varied success (24,418–424). The outcomes of these programmes varied from afall of 4.6 kg to 13.5 kg and a fall of between 4% and29% in overweight. Of eight inpatient programmereports, however, only two undertook a follow up; onereported that 48% of subjects sustained weight lossover a year (422) while the other showed a weight lossamounting to 20–25% sustained over a 5-month pro-gramme (423). The variation in methods used and out-comes achieved limits the general applicability of theseimportant intervention programmes.
Residential programmes are best reserved for older chil-dren who can accept staying away from the family homeand are able to form social networks with peers undergoingthe programme. The high costs of such programmes shouldbe contrasted with the costs of failing to deal with severeobesity in adolescents, whose health problems will becomemanifest early in adulthood and require many years ofattention. However, there has been little long-term evalua-tion of the benefits to the patient of these intensiveprogrammes.
The assessment of residential programmes as treatmentmodels is currently restricted by variations in treatmentmethods, lack of reports on the specifics of the treatmentprogrammes and resource requirements. Despite this, resi-dential treatment programmes appear to serve usefulpurposes:
• by providing an intensive resource for the efficienttreatment of the morbidly obese with associatedco-morbidities;
• by providing a controlled setting for the develop-ment of a range of treatment models and strategies totackle obesity;
• by demonstrating the cultural, social and physicalbarriers to effective treatment in the home and schoolenvironments, which may be overcome in residentialsettings.
5.2. Systematic reviews of obesity management
A review by Glenny et al. (429) reports thirteen ran-domized controlled trials covering a range of treatmentapproaches for childhood obesity. These include treat-ment of parents and children together, parental involve-ment in treatment, addition of controlled exercise todiet, reinforcement of behavioural diet and exercisestrategies, the use of protein-sparing modified fasts andthe promotion of lifestyle changes. Glenny et al. reportthat the evidence supporting the use of most treatmentmethods is equivocal, although the results of studiesexamining lifestyle changes appear promising. A com-prehensive review by Epstein et al. (430) came tosimilar conclusions.
A Cochrane systematic review on the treatment ofobesity in childhood (389) evaluated 18 randomizedcontrolled studies. These shared similar goals and objec-tives, but had different study designs, sample size andoutcome measures. Most studies were generated in theUSA among children aged between 7 and 12 years, andwere under-powered (15 studies had less than 23 chil-dren in one or more of the groups being compared).Seven of the studies were carried out by the sameresearch team, which has implications for generalizingthe results of this review to other contexts. Many ofthe 18 trials were run from a specialist obesity clinicwithin a hospital setting. The results were not stronglyconvincing. There may be some additional benefit tobehaviour therapy where parents, rather than the child,are given the primary responsibility for behaviourchange. Although there were many trials which focusedon changing levels of physical activity and/or sedentarybehaviour, these trials were too small to reach anyconclusions with confidence.
Several points arose from this review that need to beconsidered when evaluating the effectiveness of inter-ventions in child obesity. The first was the disagreementregarding the definition of fatness in children. Develop-ing consistent approaches to the measurement of child-hood obesity is a priority issue in this field. Second,the measurement of predicted behaviours, such asdietary intake and physical activity, remains relativelyweak and undermined the ability to validate the trials.In undertaking new studies, the review noted, particular

56 Obesity in children and young people IASO obesity reviews
© 2004 The International Association for the Study of Obesity. obesity reviews 5 (Suppl. 1), 4–85
attention should be given to the following aspects ofdesign:
• sufficient power – adequate numbers;• adequate follow-up of participants;• reliability of outcome measurements (reporting of
height, weight, BMI);• process indicators – indication of whether the study
was adhered to and conducted as it was intended;• cost effectiveness;• appropriate and adequate statistical analysis;• sustainability of the effect;• generalizability of the results.
In a recent overview on the treatment of child and adoles-cent obesity, Yanovski & Yanovski (8) consider theprogress that is being made and conclude:
‘At the present time, however, it remains exceedinglydifficult for overweight children and adolescents to loseweight, and even more difficult for them to sustain thatweight loss long term. The ultimate goal must be preven-tion of the development of overweight in children andadolescents.’ (p. 1852).
5.3. Screening and identifying needs
Screening is the practice of investigating seemingly healthychildren with the object of detecting unrecognized diseaseor children with an exceptionally high risk of developingdisease, and of intervening in ways that will prevent theoccurrence of disease or improve the prognosis when itdevelops (431,432). A screening test is not intended to bediagnostic, hence it must be followed by comprehensiveassessment to confirm or dismiss the impressions raisedduring screening (433,434).
Experience with childhood obesity screening has devel-oped in the last two decades (435–437). There are fewguidelines on the details of screening procedures or therecommended frequency, although some practitioners rec-ommend childhood obesity screening to be performedannually (435).
It is controversial whether childhood obesity screeningshould be introduced (436), because the early detection ofobesity may create expectations without improving theprognosis (438). Childhood obesity screenings might onlybe of value under the following conditions:
• the screened obese individuals are ready to have fur-ther assessments and make changes to achieve a healthyweight (436);
• further assessment or other necessary treatment facil-ities are available in the community (433);
• effective intervention programmes and follow-upactivities for the identified children are accessible and avail-able (439).
It is important to consider two further points beforeembarking on a childhood obesity screening programme(438). First, apparently healthy children should be willingto present themselves for examination. Second, screeninglarge numbers of children is expensive and can divertboth staff and financial resources from other health ser-vices activities. It is essential, therefore, to weigh up thepotential benefits both for the individuals screened andfor the health of the community, against the cost of theresources.
5.3.1. Settings for childhood obesity screeningScreening may be applied in different settings and differentterms have been coined.
• Mass screening can be done in large populations whowill be tested in community-wide programmes, such asimmunization programmes and nutrition surveys (439).These also provide useful data for monitoring trends in thepopulation and the evaluation of intervention at popula-tion level (440).
• Group screening can be done on groups of childrenwho are selected as being especially at risk (for example,families with history of obesity or obesity-related diseases,certain ethnic groups) (432).
• In healthcare services, opportunistic screening occursif overweight or obese children are screened when theypresent for other conditions such as infections.
• Public health screening involves the simultaneousidentification of obese children during public health serviceactivities and programmes such as immunization, motherand child welfare clinics (16).
Screening overweight and obese children can be conductedin schools (including pre-school and day-care centres) (433)or healthcare organizations (such as polyclinics or healthcentres) (437). Depending on the definition of obesity, thepopulation size, the socio-economic status of the country,and the purpose of screening (e.g. for establishing preva-lence, for implementing intervention, etc.), each setting hasits advantages and disadvantages.
5.3.2. School-based screeningIn countries where education is compulsory or wherethe majority of children are in the education system,schools (including pre-schools) (433) are the best placefor childhood obesity screening (441). The screeningcould be conducted periodically by school personnel

obesity reviews Obesity in children and young people IASO 57
© 2004 The International Association for the Study of Obesity. obesity reviews 5 (Suppl. 1), 4–85
during other school functions. For example, in Sin-gapore, weight and height of the students are takenannually by teachers during physical education lessonsand the collected information is conveyed to relevanthealth organizations. The measurements could also bedone by a team of doctors and nurses as part of thecomprehensive health screening routine in a medicalroom provided by schools at some or all school levels.In Hong Kong the student health service provideshealth screening for all school children annually,although not all children utilize the service, with thehighest attendance in the earliest years (434,442, A.E.Nelson, unpubl. data based on 443).
The advantages of school-based screening include feasi-bility, cost-effectiveness and good coverage. The disadvan-tages of such screening are the extra workload for theschool personnel, the conduct of screening by teacherswithout specialized training, and a lack of standardizedequipment among schools. All these factors might con-tribute to inaccurate measurements that are not uniformacross schools. Additionally, the identified children haveto be referred to organizations outside the school formanagement.
5.3.3. Healthcare organization-based screeningHealthcare organization-based screening – involving healthcentres, polyclinics or private clinics – offers an alternativesetting to school-based screening, and may catch childrenwho were not included in school-based screening. Health-care facilities may provide intervention programmes, andmanagement of the identified overweight and obese chil-dren can be carried out with little delay. Moreover, screen-ing is conducted by trained health professionals, hencemeasurement errors are minimized.
Healthcare outreach, however, may be no better thanschool-based outreach, and clinics, like schools, may suffera lack of standardized equipment. A mobile examinationcentre such as that used for the National Health and Nutri-tion Examination Surveys might overcome some of theseproblems (439).
5.3.4. Staff training needs for childhood obesity screeningStaff involved in childhood obesity screening includehealth personnel (e.g. doctors, nurses, dietitians), teachersand trained lay persons including parents (433,438,441).To protect the identified obese child’s feelings, staff needto convey the message about the child’s condition sensi-tively while referring him or her for further assessment(16).
Weight and height (and other derived indices) are thetwo major determinants of a child’s nutritional status.The staff involved must be trained in taking measure-
ments as accurately and precisely as possible, especially todetect changes over time (431). Factors such as how thechildren should stand, what they should wear, where theequipment should be placed, what time the measurementshould be done, etc. (444,445) must be taken into consid-eration. A short refresher course or the provision of guid-ance notes before the screening is conducted couldminimize carelessness.
For screenings involving more sophisticated bodycomposition tools, such as skin-fold measurements,bioimpedance or dual energy X-ray absorptiometry, staffmust be trained in calibrating the machines and using theequipment.
5.4. Guidelines for treating and managing overweight children
Clinical practice guidelines are valuable tools for practitio-ners making decisions about appropriate health care forspecific clinical circumstances (446). Guidelines may alsobe valuable for families, nurseries and schools as well asthe child involved. In addition, guidelines may beextended to include decision-makers in the wider commu-nity, including food industry and catering sectors, themedia, and local and national government agencies withresponsibilities that affect the community’s health and life-style choices.
Most guidelines to date have focused on providing guid-ance to clinical practitioners. Such guidelines should berigorously evidence-based, using systematic reviews of theliterature when possible, but there are many circumstancesin clinical practice where there is insufficient high-qualityevidence to meet these requirements, and the guidance isbased on a combination of available research evidence,expert opinion and consensus.
Where guidelines are developed for non-clinical use, forexample in nurseries and pre-school centres, then addi-tional information may be needed, along with training andsupport services, to ensure that the guidelines are under-stood and can be implemented. This may mean findingresources, for example to adapt play equipment or to re-train catering staff.
At the present time several countries have developednational guidance statements on childhood obesity treat-ment based on expert consensus views. The US ExpertCommittee recommendations on obesity evaluation andtreatment are a widely used example (447). The FrenchInstitute of Health and Medical Research (INSERM) doc-ument is another (448) and so is the recent publicationfrom the Australian National Health and Medical ResearchCouncil (see http: http://www.obesityguidelines.gov.au/).Further examples are listed in the box ‘Guidelines andresources’ below.

58 Obesity in children and young people IASO obesity reviews
© 2004 The International Association for the Study of Obesity. obesity reviews 5 (Suppl. 1), 4–85
5.4.1. Guidelines and resources
Resources for health professionalsUSA: The Maternal and Child Health Bureau, HealthResources and Services Administration, Department ofHealth and Human Services: Barlow SE, Dietz WH. Obe-sity evaluation and treatment: Expert Committee Recom-mendations. Pediatrics 1998; 102(3).
France: Expert advisory group ‘Childhood Obesity.Screening and prevention. Synthesis and recommenda-tions’ http://www.inserm.fr (English synopsis available onhttp://www.inserm.fr/servcom/servcom.nsf/7f476b2583842f98c12569b400384eee/6477a23a05c9289180256b7d004cda49/$FILE/Obe-sity%20Synthesis.pdf).
UK: NHS Centre for reviews and dissemination ‘The Pre-vention and Treatment of Childhood Obesity’ EffectiveHealth Care 2002; 7(6).
UK: Royal College of Paediatrics and Child Health, andNational Obesity Forum ‘An approach to weight manage-ment in children and adolescents in primary care’ 2002(available on http://www.rcpch.ac.uk/publications/recent_publications/Approach_2PAGES_TOGETHER.pdf). See also http://www.nationalobesityforum.org.uk
Scotland: Scottish Intercollegiate Guidelines Network‘Obesity in children and young people. A national clinicalguideline’ 2003 (available at http://www.sign.ac.uk/pdf/sign69.pdf). See also http://www.hebs.scot.nhs.uk/learn-ingcentre/obesity/childhood
Italy: Italian Society of Pediatric Nutrition Diet therapyfor pediatric obesity. Consensus document.
Germany: Guidelines for assessment, treatment and pre-vention, of the German Society for Paediatrics and Ado-lescent Medicine, Adipositas (see http://www.a-g-a.de).
Yugoslavia: Expert Committee National Guidelines forClinical Practice in Serbia. Primordial prevention: Pri-mary prevention of cardiovascular risk factors in child-hood (M. Pavlovic) 2002 (see also health promotion onhttp://www.zzzzsu.org.yu/aw).
Australia: The National Health and Medical ResearchCouncil of Australia has developed clinical practice guide-lines on the management of overweight and obese adultsand children (see http://www.obesityguidelines.gov.au/).
Resources for children and familiesUK: See http://www.bbc.co.uk/science/hottopics/obesity/children and http://www.toast-uk.org.uk
USA: See http://www.familydoctor.org/handouts
‘Obesity and children: Helping your child lose weight’
‘Obesity and children: Helping your child keep a healthyweight’
http://www.kidsource.com/kidsource/content2/obe-sity.html
Resources for schoolsUSA: CDC guidelines for schools:
• physical activity: http://www.cdc.gov/nccdphp/dash/healthtopics/physical_activity/guidelines;
• food: http://www.cdc.gov/nccdphp/dash/healthtop-ics/nutrition/guidelines.
UK: National Healthy School Standard – http://www.wiredforhealth.gov.uk/
5.4.2. Obesity guidelines: concordance with otherhealth adviceHealth professionals may need assistance to translateevidence-based guidelines into everyday practice. It isimportant that every effort is made to ensure that prac-tical advice is safe. For example, clinical interventionsmay serve to raise anxiety and lower self-esteem, espe-cially if there is little tangible weight loss, andapproaches are needed which can avoid these hazards.For this reason, families, schools and primary healthcare services should be encouraged to focus on promot-ing healthy lifestyles in all children, as well as helpingthe obese child.
The principles of healthy eating and active lifestylesare fully compatible with the prevention of diseases
such as coronary heart disease, type 2 diabetes andmany cancers. There may be an increased risk, however,of traffic accidents if children play in the streets or taketo cycling and walking. Safe routes to school should bedeveloped.
There may also be some concern about the possibilityof dietary restriction leading to eating disorders. Asnoted earlier, obesity is occasionally associated withbinge eating disorder, but there is no published evidencefor a causal link between obesity and anorexia nervosato date. Both are increasing in prevalence in modernsociety. The development of healthy (but not unneces-sarily restrictive) eating habits should be compatiblewith prevention of eating disorders. However the treat-ment of eating disorders and obesity may be very differ-

obesity reviews Obesity in children and young people IASO 59
© 2004 The International Association for the Study of Obesity. obesity reviews 5 (Suppl. 1), 4–85
ent. For example, close self monitoring and restrictingof food intake may be encouraged in some obesity regi-mens but discouraged in anorexia. If possible, strategiesshould be used that are concordant for weight problemsat both ends of the spectrum i.e. ‘an integratedapproach to prevention and treatment of weight relatedproblems’ (449). Such strategies might focus on self-esteem along with enhanced physical activity and theconsumption of healthful foods.
5.4.3. Dissemination and implementationGuidelines are only useful if they are widely known about,recognized as appropriate and put into practice. This willrequire widespread discussion during and after their prep-aration, distribution with additional information andappropriate training or support during implementation(446,447). Evaluation, regular review and updating ofguidelines are essential.
Guidelines and advice must be clearly presented, rele-vant and easily accessible. There is a need for more infor-mation about the implementation of interventionstrategies in everyday life in families, schools and thehealth service. Strategies should cover psycho-socialaspects, physical activity and inactivity, and diet and eat-ing habits (447). Where adequate evidence is lacking,every effort must be made to ensure interventions will besafe.
Advice is needed to help services cope with rapidlyincreasing demands and the needs of obese children. Thereis inconclusive evidence about the importance of the atti-tude and commitment of professionals to the success oftreatment (413,447,450,451). However, it seems appropri-ate for guidelines and advice to encourage positive, sup-portive help. The implementation of guidelines and theresults of intervention need to be evaluated in order toinform future practice.

60 Obesity in children and young people IASO obesity reviews
© 2004 The International Association for the Study of Obesity. obesity reviews 5 (Suppl. 1), 4–85
6. PREVENTION – THE ONLY SOLUTION
This report has identified the dramatically rising trends inthe prevalence of child and adolescent obesity and hasindicated some of the serious health problems that areemerging as a result. The great majority of children are atrisk, especially if the environmental factors that encourageobesity are present – as they are in most industrializedcountries and urbanized populations. This report has alsonoted the relative lack of success of treating obesity onceit has become established. Virtually all reviews have indi-cated that they believe that the prevention of obesity is notonly possible but is the most realistic and cost effectiveapproach for dealing with childhood obesity (18,452) as itis for adult obesity (16).
Despite the traditional mission of paediatric practice tobe a preventative service, there has been little explorationof the effectiveness of using the clinical setting for prevent-ing child obesity. Additional research in this area is needed.At primary care level, practitioners can have a role provid-ing information on healthy eating and physical activity toall members of the family as well as supporting effectiveparenting skills, summarized by Dietz & Gortmaker as‘anticipatory guidance’ (453). At specialized paediatricclinics the early prevention of obesity among those atgreater risk (e.g. members of population groups describedin section 4.4.2 above) may be considered when childrenare referred for other reasons, especially if the children arealready showing overweight or mild obesity. Proactivescreening of child populations, e.g. in schools, has beendiscussed above (5.3).
The following section gives some examples of preventivestrategies that have been tried, and summarizes the litera-ture reviews available. This leads to the conclusion thatsmall-scale preventive activities have only modest effects,and that a larger-scale approach will need to be taken ifthe environmental stimuli that encourage weight gain areto be properly challenged (454). Strategies for encouraginghealth and preventing obesity at national level are dis-cussed, and the role of health ministries in developing pub-lic health, food and physical activity policies underlined.
6.1. What prevention works?
In this section, six examples of preventive approachesdirected at children are discussed. This is followed by ageneral review of intervention trials, which concludes thatsome approaches are worth further investigation but thatthere has been no outstanding breakthrough that will ensurethat the rise in child obesity can be halted or reversed.
6.1.1. The school approachIn principle, schools provide an excellent setting for prevent-ing obesity (455–457), and are also the target of the World
Health Organization’s ‘Health Promoting Schools’ pro-gramme (458). They offer regular contact with childrenduring term-time and provide opportunities for nutritioneducation and promotion of physical activity both withinthe formal curriculum, and informally via the provision ofappropriate facilities within the school environment such ashealthy school meals, break-time snack provision and play-ground equipment. Thus schools not only influence theknowledge and attitudes of children but also provide oppor-tunities for experiential learning and the development of asense of self-efficacy. Furthermore the school can alsoprovide links with the family and the wider community.
Apples. A UK trial involving 10 primary schools in thenorth of England (the ‘APPLES’ study) tackled the schoolenvironment at several levels simultaneously (459,460). Theintervention took the form of teacher training, modificationof school meals, and the development of school action planstargeting the curriculum, physical education, tuck shops andplayground activities. The results were mixed. The interven-tion group showed an increase in vegetable consumption,but those children who were more overweight in the inter-vention group showed an increase in the consumption ofsugar-containing foods, a fall in fruit consumption and anincrease in sedentary behaviour. Measures of self worthshowed that overweight children in the intervention groupgained from the trials. Intervention children also showed ahigher score for knowledge, attitudes and self-reportedbehaviour for healthy eating and physical activity (460).
Trim and Fit in Singapore. In Singapore a nationalhealthy lifestyle programme called ‘Trim and Fit’ has hadsome success at reducing obesity prevalence in school agestudents (461). Trim and Fit involves a variety of changesin the school environment, backed up by resources directedto the schools from the Ministry of Education.
Trim and Fit sessions for overweight children consist of:
‘an exercise programme and counselling on proper nutri-tion. Teachers monitor the children’s weight regularly.Physical activity takes the forms of games and exercisesduring recess or outside curriculum time. Parents of over-weight children are invited to support the programmethrough seminars and meetings. Besides physical activi-ties, overweight children are given nutrition counselling,including choice of low-calorie foods in schools canteens.School canteen vendors are also advised on healthiermethods of cooking. More fruit and vegetables areencouraged.’ (462).
Ministry of Education support has included intensiveteacher training for all teachers, including head teachers,

obesity reviews Obesity in children and young people IASO 61
© 2004 The International Association for the Study of Obesity. obesity reviews 5 (Suppl. 1), 4–85
specialized instruction in home economics and physicaleducation, approval and monitoring of school canteens,provision of catering equipment, school fitness equipmentand printed educational materials.
The results show modest success, with decrease in theprevalence of obesity (from around 16% to 14% over an8-year period) (Fig. 32). Control group figures are notavailable, and it should be noted that the degree of obesityprevention achieved in this programme has not been fullyevaluated or peer reviewed. The reported reductions mightbe set against an expected increase: adult obesity ratesshowed a non-significant increase from 5.1% to 6.0% overthe period 1992–1998 (463).
Crete: tackling the record rise in obesity. Based on theGreek island of Crete, Mamalakis and colleagues havemonitored a group of children over a period of 6 years, withhalf of the children experiencing an intervention programmeand the remainder acting as controls (464). Crete has one ofthe highest rates of childhood obesity reported for anypopulation, and any successful intervention programmewould prove particularly significant for such populations.
The interventions involved 24 schools, with a further 12schools acting as controls. Interventions included healtheducation, improvements in nutrition and encouragementto take physical exercise – delivered as a taught subject andas physical activity periods during school hours. The pro-gramme continued for 6 years, with a cohort of childrenmonitored during the first year (aged around 6 years old)and again at age 9 and 12 years.
The prevalence of overweight (using IOTF criteria)among children at each of the three evaluation phases – at
the outset, mid-way and at the end of the trials – are shownin Fig. 33. Results in terms of several cardiovascular riskfactors showed significant improvements in the interven-tion children compared with controls (76). Results in termsof BMI also showed improvements in the interventiongroup compared with the control group, although BMIlevels in both groups rose during the period with increasesin the proportion of children overweight. The interventionappeared to show its greatest effects in the first 3 years,possibly because older children are less amenable to school-based health messages. However, the rise in the numbersof overweight children, even among the intervention group,is a cause for continued concern.
Paying less for health. A series of trials by researchers atthe University of Minnesota (465–467) has shown thathealthful behaviour, such as the selection of healthier fooditems at a school canteen or from a vending machine, canbe influenced by changes in the price of the products beingpurchased. In trials of vending machine price manipulationof more and less healthful foods undertaken in secondaryschools (children aged 12–16 years) price differentials of10%, 25% and 50% in favour of healthful foods led to9%, 39% and 93% increases in purchases, respectively(468), indicating that switches from less healthful to morehealthful choices are strongly influenced by pricing factors.When the price advantages are removed the purchase pref-erences for healthier foods disappear (Fig. 34).
Watching less TV. Several studies have indicated that tele-vision watching is linked to overweight (see earlier). Trialsby Robinson (470,471) have shown that restrictions on TVwatching can lead to beneficial effects measured by severaldifferent approaches. In one trial, primary school childrenaged around 8–9 years old received 18 lessons over
Figure 32 Results of the Trim and Fit programme in Singapore.Obesity definition not reported. Source: Toh et al. (461).
0
2
4
6
8
10
12
14
16
18
Primary students Secondarystudents
Ob
esit
y p
reva
len
ce (
%)
19922000
Figure 33 Prevalence of overweight among two cohorts of Cretan children. Overweight by IOTF definition. Source: Moschandreas (76).
0
5
10
15
20
25
30
35
40
45
1992 1995Years
1998
Pre
vale
nce
of
ove
rwei
gh
t (%
)
Intervention Control

62 Obesity in children and young people IASO obesity reviews
© 2004 The International Association for the Study of Obesity. obesity reviews 5 (Suppl. 1), 4–85
6 months encouraging them to reduce television watchingand video game usage, and were matched with similarlyaged children in a school of similar sociodemographic andacademic status (470). Relative to controls, the interven-tion group showed an improvement in many of the evalu-ative measures taken, including measures related toadiposity and to the extent of television viewing and ofeating meals in front of the television (Table 14). Measuresof high-fat food intake showed no significant difference,and nor did measures of vigorous physical activity or car-diorespiratory fitness.
Agita São Paulo programme. In Brazil, the Agita SãoPaulo programme promotes physical activity and theknowledge of the benefits of physical activity in the Stateof São Paulo, with a population of over 36 million inhab-itants (472).
Agita is organized by the Center of Studies of the Phys-ical Fitness Research Center (CELAFISCS) with the StateSecretary for Health and more than 250 governmental,non-governmental and private institutions. The pro-gramme was launched in February 1997, and because ofits impact has now been adopted throughout Brazil (AgitaBrasil). It has served as the basis for similar programmesin other countries in South America and provided inspira-tion for the celebration of World Health Day 2002 (1987events in 148 countries).
Children and adolescents are among the three targetgroups (the two others are elderly people and the work-force). The main message of the programme states thatevery person should take physical activity on most days ofthe week, at moderate intensity (and even light for specialgroups), in continuous or cumulative sessions. Young peo-ple should take at least 20 min of sustained vigorous phys-ical activity, on 3 days of the week.
The Agita strategy has included an emphasis on thebenefits of physical activity, but these are not in themselves
enough to motivate educational authorities, schools orteachers. For that reason, the Agita São Paulo Programmehas also highlighted the psychosocial and educational ben-efits, including an improvement in self-image, self-esteemand well-being, and reduced stress and depression. Thepotential educational benefits include improvement in aca-demic performance, a decline in behavioural disturbance,a decrease in high-risk behaviours such as substance abuse,and an increase in the student’s sense of responsibility.
The programme for young people is largely based aroundschools, with attention paid to increasing time spent inphysical activity in physical education classes, other classes,in breaks and in the community. With restricted access topublic spaces for physical activity, particularly in large cit-ies, schools in some of the poorest and most violent regionsof São Paulo city have opened their facilities at the week-ends. The initiative is largely based upon volunteer support,and has become a success involving 400 schools.
Evaluation measures show a significant increase in timeinvolved in vigorous physical activity in girls and a trendtowards increased vigorous physical activity in boys. Therewas a similar trend towards an increase in moderate phys-ical activity among boys, although not in girls. Theseresults confirm a positive effect of a media–community–school intervention approach in promoting physical activ-ity among adolescents.
Agita Galera or Active Community Day, is scheduledeach year to give more visibility to the programme. Itincludes approximately 6000 public elementary and highschools and several hundred private and special schools.Preparation includes teacher awareness and training and acable TV conference. The event provides a chance to spreadthe message on TV, radio and newspapers. TV coverage ofAgita Galera reached an estimated 20 million viewers.
6.1.2. Reviews of intervention trialsThis section reviews the school and community trials inwhich randomized control procedures were conducted. TheTable in Appendix 2 shows the results of a literature search
Table 14 Effects of a 7-month programme to reduce TV, video and video game use
Change vs. control group Statisticalsignificance
TV watching reduced by 4.49 h week-1 P < 0.001Use of video games reduced by 2.54 h week-1 P < 0.01Meals in front of TV reduced by 1.07 meals week-1 P < 0.01Triceps skin-folds reduced by 1.47 mm P < 0.002Waist circumference reduced by 2.3 cm P < 0.001Waist–hip ratio reduced by 0.02 P < 0.001Body Mass Index reduced by 0.45 kg m-2 P < 0.002
Source: Robinson (470,471).
Figure 34 Vending sales of low-fat snacks before, during and after a 3-week 50% discount period. Source: French et al. (469).
0.0
5.0
10.0
15.0
20.0
25.0
30.0
35.0
40.0
45.0
50.0
Same price 50% low-fat discount Same price (after)
Lo
w-f
at s
nac
k sa
les
(% a
ll sa
les)

obesity reviews Obesity in children and young people IASO 63
© 2004 The International Association for the Study of Obesity. obesity reviews 5 (Suppl. 1), 4–85
conducted by Schmitz & Jeffery, and shows studies thatfocused on improving eating and energy expenditurebehaviours of children in the general population, not over-weight or obese children or children at high risk for obesity,and have included measurement of some physiological,obesity-related outcome and have a control group. Allpapers up to the year 2000 were examined.
All of the studies in Appendix 2 included a strong school-based intervention component. Schools are an attractivesetting for obesity prevention efforts in children because ofthe relatively large amount of time children spend inschool, the ability to use existing organizational, commu-nication and social structures and the ability to reach alarge portion of children in the general population. In addi-tion, one to two meals per day may be eaten at school for5 days of the week. Other social settings, however, such asthe family and community may have more significant influ-ences on youth behaviours. Recent US Centers for DiseaseControl guidelines for promoting physical activity andhealthy eating note the importance of including communityand family efforts in addition to school-based programmes(473,474). Interventions should also take account ofnational changes in dietary trends that may be occurringduring the period of intervention: a 5-year school-basednutrition education programme showed significantly raisedawareness of nutritional knowledge among interventionchildren compared with controls, but no difference inenergy or macronutrient intake, while both interventionand control groups showed reduced consumption of Frenchfries and an increased use of olive oil over the period (475).
The studies included in Appendix 2 indicate that envi-ronmental changes, such as alterations in school physicaleducation or monitoring television viewing time, are atleast as important as classroom-based educational interven-tions. Of the studies included, those conducted in less-diverse settings were more likely to show significant obe-sity-related treatment effects. This was particularly true forstudies where the outcomes included multiple chronic dis-ease risk factors or multiple behaviours, such as the PlanetHealth programme. Planet Health describes itself as ‘aninterdisciplinary curriculum focused on improving thehealth and well-being of sixth through eighth grade stu-dents while building and reinforcing skills in language, arts,math, science, social studies, and physical education’,which ‘aims to increase activity, improve dietary quality,and decrease inactivity’. The Planet Health programme hasreported significant success for obesity-related outcomes(476). It has been employed in diverse settings and amongminority ethnic groups. Further details can be found on<http://www.hsph.harvard.edu/prc/planet.html>.
The absence of long-term follow-up in the studiesincluded in Appendix 2 makes it difficult to evaluate theefficacy of these interventions for population-wide effectson obesity prevalence. Most of the studies were able to
show improvements in eating and/or exercise habits ofchildren and the large trials indicate the feasibility of imple-menting school-wide changes for the purpose of obesityprevention. The effects of these interventions when thechildren become adults, in terms of their health-relatedbehaviour or their health status, remain to be assessed.Future studies will therefore need to evaluate the cost-effectiveness of school- and/or community-based obesityprevention interventions in youth, including long-term fol-low-up of obesity prevalence and incidence.
Cochrane review of prevention trials. Campbell and col-leagues (14) have undertaken a systematic review of inter-ventions for the prevention of obesity in children, andincluded non-English language papers in the literaturesearch. Randomized control trials and non-randomized tri-als with concurrent control groups, in which participantswere observed for a minimum of 3 months, were selectedfor review. The review found only 10 studies of sufficientquality, of which seven observed children for over a yearand three for less than a year but more than 3 months.Eight were school- or nursery-based interventions, one wasa community-based intervention targeting African–American families and one was a family-based interventiontargeting non-obese children of obese parents.
The Cochrane review authors concluded that three outof four long-term studies that combined dietary educa-tion with physical activity interventions resulted in nodifference in overweight. A fourth reported an improve-ment in favour of the intervention group. In two studiesof dietary education alone, a multimedia strategyappeared to be effective, but other strategies did not. Theone long-term study that focussed only on physical activ-ity resulted in a slightly greater reduction of overweightamong the intervention group, as did two short-termstudies.
Campbell et al. concluded that current efforts for obesityprevention need to build a reliable evidence base to deter-mine the most cost-effective and health promoting strate-gies for ensuring a healthy weight for all children.Particular attention needs to be paid to ensuring studieshave sufficient numbers of participants, have adequate fol-low-up, use reliable outcome measures, and can providesustainable and generalizable conclusions.
Hamilton reviews. Similar conclusions were reached in a‘review of reviews’ on interventions to prevent chronicdisease conducted by an inter-university team for the Cityof Hamilton, Ontario, Canada (477). On the effectivenessof school-based strategies for the prevention of obesity, thereview concluded that the most effective interventionsshould be based on a whole school approach includingcafeterias, PE classes, lunch and recess activities, classroomteaching, and include links to home and the community.

64 Obesity in children and young people IASO obesity reviews
© 2004 The International Association for the Study of Obesity. obesity reviews 5 (Suppl. 1), 4–85
The longer the intervention the greater the change in out-come measures. Different age groups, ethnic groups andgenders needed different approaches.
The inter-university team also reviewed school-basedinterventions designed specifically to encourage physicalactivity (478). The reviewers found moderate improvementin physical activity among children and among adolescentgirls exposed to promotional campaigns, but with littlemeasurable effect on blood pressure, BMI or heart rate.The most effective initiatives involved children through thewhole school day, including lunch and recesses as well asclass time and physical education lessons.
In one of the key conclusions, the report noted thatadults who had participated in school-based physical activ-ities as children were more likely to be active in adulthoodthan those that had not. A report by the US Centers forDisease Control made a similar point, noting that physicalactivity tends to decline during adolescence and that ‘com-prehensive school health programmes have the potential toslow this age-related decline in physical activity and helpstudents establish lifelong, healthy physical activity pat-terns’ (474).
Keys to success. These reviews show that tackling excessweight among children requires a broad-based approachinvolving all the school. This approach can lead to longer-lasting benefits that continue into adult health and well-being. However, the resources and the change in thinkingthat would be needed to implement such policies are noteasily found and may lead to frustration.
In an invited commentary on school-based interven-tions, Lytle et al. (479) note that only a few interventionshave had significant effect. The authors suggest severalfactors that may improve success rates, notably ensuringan adequate length of intervention and ensuring theinvolvement of all participants to prevent drop-out. Theyalso note that heterogeneity, i.e. the involvement of partic-ipants from diverse cultural backgrounds, is rarely cateredfor in the experimental designs where ‘one size fits all’,and this may compromise the ability to show significanteffects. The authors recommend programmes that aremore flexible and responsive to the social and culturalenvironments in which they occur, perhaps inviting theactive participation of community members during thedesign of the intervention. They also note Richter et al.’sevidence that school and community interventions aremore likely to be successful if they occur in the context ofwider health-promoting environments (480).
6.1.3. Alternatives to randomized control trialsThe previous section indicated the pressing need to developthe appropriate measures and study designs to find effectivepreventive interventions for obesity. The studies need tocapture changes in environments and behaviours as well as
outcomes such as body mass index. They also need to beadministered over long periods of time and across popula-tions. This puts a burden on the resources and on theparticipants in the studies, and it means that the normalapproach, using small-scale randomized control trials maynot be appropriate. Some alternative approaches may beneeded.
Recent experience in evaluation has suggested that therandomized control trial (RCT) design can be inappropri-ate for a number of reasons. The RCT approach assumesthat there is full control of the intervention, its delivery andthe context in which it is implemented. This is certainly nottrue for most health promotion programmes, which arecomplex in nature, delivered in complex contexts over longperiods of time, and present difficulties in controlling allvariables. In reality it is difficult to find matched controls,ensure standardization of programme implementation inall contexts and ensure standardization of contexts. Fur-thermore there is a constant threat of ‘contamination’ ofthe control group because health promotion relies on theeffects of the intervention permeating the target commu-nity. It is therefore difficult to control for spill-over to thecomparison community, thereby potentially reducing anyeffect of the intervention. Other problems include:
• the individuals recruited may not represent thepopulation;
• randomization may not be feasible and may not ensurecomparability;
• control conditions are difficult to implement and raiseethical problems;
• the intervention is too disruptive of reality;• energy balance cannot be directly assessed;• other effect sizes may be too small to detect.
Obesity prevention programmes, like other health promo-tion programmes, are complex, often targeted at groupsand individuals simultaneously, aiming to influence individ-ual behaviour and lifestyle but also address public healthpolicy in order to change social and environmental factorsthat affect health. Consequently health promotion evalua-tion requires multiple approaches in order to assess effec-tiveness in all these areas.
The selection of method depends on the nature of theinformation required to answer the questions asked. It istherefore advised that both qualitative and quantitativemethods are used, and methods for rapid appraisal andhealth impact assessment may also prove valuable(481,482).
Monitoring obesity trends. The epidemic of childhoodobesity is already present in most high-income countriesand emerging in some low-income countries. The first stepto evaluating the causative (and preventative) factors is to

obesity reviews Obesity in children and young people IASO 65
© 2004 The International Association for the Study of Obesity. obesity reviews 5 (Suppl. 1), 4–85
monitor trends in obesity in a range of populations. Ironi-cally, it may be the low-income countries that will be bet-ter equipped to monitor trends in childhood obesitybecause most of them already systematically measure theheight and weight of infants and children to monitorunder-nutrition trends. The reliance on occasional, largenutrition surveys to determine the trends in overweightand obesity means that available data are usually spas-modic, delayed and used more by universities than healthdepartments.
There is an urgent need to establish more formal moni-toring programmes. These need to have the following char-acteristics:
• Owned and used by governments to assess progresstowards targets for childhood obesity, eating and phys-ical activity behaviours and environments.
• Regularly implemented and assured of sustainablefunding.
• Measure the key outcomes and determinants ofinterest:
height, weight and waist;eating behaviours and attitudes;physical activity behaviours and attitudes;key nutrition-related environmental factors;key physical activity-related environmental factors.
• Potentially serve as the ‘comparison group’ for effec-tiveness studies (see later).
• Monitor the reach, sustainability and populationimpact of programmes (see later).
• Potentially use for benchmarking purposes for schoolsand local governments (see later).
Assessing interventions. The assessment of interventions isusually achieved using standard experimental methodolo-gies (randomized controlled trials, cross-over studies,quasi-experimental studies etc). Unless the interventionbeing tested can deliver a ‘high dose’ of change in activitylevels and/or energy intake, it is unlikely to show an impacton body size. For example, reducing television viewing by30 min to 1 h day-1 as achieved by Robinson (470) andGortmaker et al. (476) appears to achieve a high enoughdose to influence body weight, but other school-basedinterventions, although well implemented, cannot achievethis dose (459,460).
The effectiveness of ‘real world’ interventions needs tobe assessed in the knowledge that tight control of extrane-ous variables is very difficult and the use of randomizedcontrol groups is usually not possible. An alternativeframework is required:
• an initial formative evaluation to establish clear aimsand objectives;
• a needs assessment, literature review etc;• a process evaluation to measure the inputs into an
intervention and to describe the processes during theimplementation;
• an impact evaluation to measure whether the specificobjectives have been achieved (e.g. changes in physicalactivity behaviours);
• an outcome evaluation to measure the longer termeffects (e.g. changes in body mass index).
To be rigorous, however, the impact and especially theoutcome measures need to be controlled for confoundingfactors. For example, no change in BMI may represent asuccessful or a non-successful outcome depending on thebackground changes in BMI in the rest of the population.
Randomization by individual is the design that is mostlikely to spread the confounding factors evenly across inter-vention and control group, but this design is usually notfeasible for long-term prevention studies where a variety ofinterventions, including environmental ones, are used. Infact, because the ‘dose’ of intervention needed to preventunhealthy weight gain is high, it requires a multi-strategy,multi-setting approach and this virtually excludes the indi-vidual randomized design. A quasi-experimental design(for example, five intervention schools and five controlschools) gives some ability to control for confounding vari-ables, but usually the number of units (e.g. schools) is smalland systematic differences may confound the results (e.g.the control schools have a different socio-economic back-ground than the intervention schools).
There is a potential for using population monitoring datafor not only measuring trends (above) but also for compar-ative purposes for effectiveness studies. For example, aschool-based, region-wide monitoring programme mayroutinely measure BMI (outcomes), school food sales(behaviours), and school food policies (environments). Anintervention programme in a town within that region maybe able to compare changes in these variables againstchanges across the region. There would still be the potentialfor residual confounding factors but at least such a designwould allow reasonable confidence on the overall impactof a population-based intervention programme on the pre-vention of obesity.
Assessing sustainability, reach and population impact.Many intervention studies aimed at influencing long-termbehaviours at a population level have a start and finishdate. The longer-term sustainability and wider reach, andpopulation impact across the population are rarely mea-sured. In the end, this is the information that the govern-ment funding agencies really need to know. Indeed, suchcharacteristics as ‘reach’ are usually specifically designedout of studies because it is considered ‘contamination ofthe control group’. For example, in the North Karelia

66 Obesity in children and young people IASO obesity reviews
© 2004 The International Association for the Study of Obesity. obesity reviews 5 (Suppl. 1), 4–85
project (483), dietary changes first occurred in this demon-stration province but within 5–10 years, the rest of thecountry had also made the changes. Quite appropriately(from a public health perspective) they had become ‘con-taminated’.
Again the judicious choice of indicators with a compre-hensive monitoring programme can capture the reach, sus-tainability and population impact of interventionprogrammes as they move from demonstration areas to thewider region.
Local benchmarking. A further role for monitoring popu-lation trends is to allow the communities that provided thedata to use the results as a stimulus and yardstick for theirown efforts. A school-based or local government-basedmonitoring programme that could measure, in a consistentmanner, environmental and behavioural factors that areunder its control would be very empowering if it were tobe used for benchmarking. Schools regularly use bench-marking for literacy and numeracy outcomes whereby theirresults are fed back to them as trends over time and incomparison with other schools. If nutrition and physicalactivity data were to be used in a similar manner it couldstimulate action in the area and allow schools to measurethe impact of their efforts.
6.2. Prevention and public health: next steps
Child and adolescent obesity prevention has the aim ofpromoting healthy growth in young people, where healthygrowth includes achievement of stature potential as well asweight gains that tracks within the range considered nor-mal weight (453). Given the genetic propensity for a largesection of the population to develop obesity in conduciveenvironments, prevention is best targeted at all young peo-ple. Public health obesity prevention efforts should thusfocus on the entire population, including children and ado-lescents at high risk for obesity development, but alsoreaching the larger proportion of young people whoseweight is still within normal ranges.
Preventative activities cover a broad spectrum from indi-vidual and local group-based initiatives – which are theones most closely researched and discussed in the previoussection – through to organizational, national and interna-tional policies. This can be visualized with the diagramgiven in the introduction and reproduced below, showinghow each level of intervention is set within a wider context(Fig. 35).
The recent increases in obesity prevalence are largelyattributed to social and environmental forces that are notunder individual control – certainly not under the controlof children – and which influence eating and physical activ-ity behaviours in the aggregate (484). Thus, althoughactions to improve individual lifestyles are needed and are
perhaps the only recourse for limiting obesity developmentin the short-term, longer term remedies undertaken from abroader public health and policy perspective will be neededto have a significant impact on the problem. Not only areindividually-oriented approaches likely to have limited suc-cess if undertaken without supporting social and environ-mental changes, but an over-reliance on individualapproaches with insufficient public health actions mayallow the situation to worsen and, particularly, to becomeconcentrated in socially disadvantaged populations (485).
‘Many people believe that dealing with overweight andobesity is a personal responsibility. To some degree theyare right, but it is also a community responsibility. Whenthere are no safe, accessible places for children to playor adults to walk, jog or ride a bike, that is a communityresponsibility. When school lunchrooms or office cafete-rias do not provide healthy and appealing food choices,that is a community responsibility. When new or expect-ant mothers are not educated about the benefits ofbreast-feeding, that is a community responsibility. Whenwe do not require daily physical education in ourschools, that is also a community responsibility . . . Thechallenge is to create a multi-faceted public healthapproach capable of delivering long-term reductions inthe prevalence of overweight and obesity. This approachshould focus on health rather than appearance, andempower both individuals and communities to addressbarriers, reduce stigmatization and move forward inaddressing overweight and obesity in a positive and pro-active fashion.’ Dr D. Satcher, US Surgeon General, 2001(foreword) (484)
Several authors have identified the macro-environmentalfactors that promote obesity, such as the trend towardsglobalization of markets and patterns of economic devel-opment, food production, urbanization, media develop-ment, and mechanization (16,18,486,487). The societal
Figure 35 Opportunities for influencing a child’s environment.
so
cial policies and national legislation
orga
nizational and commercial practicesplan
ning controls and regional strategiescommunity and cultural traditions
scho
ol practices and peer influence
fa
milycustoms and choices
individ
ual self-controlthechild

obesity reviews Obesity in children and young people IASO 67
© 2004 The International Association for the Study of Obesity. obesity reviews 5 (Suppl. 1), 4–85
factors that predispose populations to obesity are oftenviewed as desirable, such as greater accessibility of essentialgoods and services as well as improvements in householdincome and standard of living. Depending on cultural vari-ations, the changes in lifestyles may include decreased timespent in home food preparation, increased consumption ofprocessed and catered foods, increased mechanization ofwork and home activities, increased reliance on motorizedvehicles and increased access to and use of televisions andcomputers. These changes inevitably influence social valuesand cultural norms about eating and physical activitywithin families, in schools and workplaces and in the soci-ety at large.
The following are examples of problematic social trends:
• increase in the use of motorized transport, e.g. toschool;
• increase in traffic hazards for walkers and cyclists;• fall in opportunities to take recreational physical activ-
ity;• increased playing of sedentary games;• multiple TV channels around the clock;• greater quantities and variety of food available;• more frequent and widespread food purchasing
opportunities;• larger portions of food;• rising use of soft drinks to replace water;• more use of restaurants and fast food stores.
Obesity-promoting social and environmental trends arelikely to be self-perpetuating unless they are challenged
and successfully redirected. In this respect, the trends inchild and adolescent obesity and the emergence of obe-sity-related diseases during childhood and adolescencetake on particular importance in motivating socialchange, because the importance of contextual influenceson behaviour is more easily recognized where children areconcerned. In discussions of adult obesity it is often heldthat environmental forces are subordinate to personalchoices in promoting obesity or preventing weight loss.However, the holders of these views will usually acknowl-edge that the rising prevalence of childhood obesityreflects the potency of environmental influences, includingthe home environment along with the wider community,and that public health actions may be needed to curtailthese influences.
The International Obesity TaskForce (IOTF) causal webof societal policies and processes, shown in Fig. 36, is usefulas a general framework for identifying the nature and scopeof targets for action and the stakeholders potentiallyaffected (17). No single aspect of this web of policies andprocesses can be addressed without having a potentialimpact on other areas, and the interests in these areas maybe competing.
A primary goal of public health initiatives to addressobesity is to increase the consciousness in the non-health sectors of the potential adverse effects of theiractions on the ability of people to maintain energy bal-ance and to increase their interest in and ability to min-imize these adverse effects. Furthermore, so fundamentalto society are the processes that relate to food intakeand physical activity that any initiatives undertaken in
Figure 36 Societal policies and processes with direct and indirect influences on the prevalence of obesity. Vertical and horizontal links will vary between different societies and populations. Source: Kumanyika et al. (17).
Development
Globalisation of
Markets
SchoolFood
WORK/SCHOOL/
HOME
Infections
Labour
WorksiteExercise
SchoolActivity
LeisureActivity/Facilities
WorksiteFood
Agriculture/Gardens/
Local Markets
COMMUNITIES
Health Care System
PublicTransport
Manufactured/Imported
Food
Sanitation
NATIONAL/STATE
Food Policy
Urbanisation
TransportPolicy
EducationPolicy
Health Policy
OBESITY
PREVALENCE
INDIVIDUAL
EnergyExpenditure
Food Intake:
NutrientDensity
PublicSafety
INTERNATIONALFACTORS

68 Obesity in children and young people IASO obesity reviews
© 2004 The International Association for the Study of Obesity. obesity reviews 5 (Suppl. 1), 4–85
relation to obesity must be harmonized with pro-grammes undertaken to maintain other societal coreprocesses.
The need for global co-ordination is also evidentfrom this framework. Many of the economic forcesinvolved are global in nature and any effects of obesity-reducing policies on the relevant industries willundoubtedly have global consequences. Principles under-lying general obesity prevention initiatives at thepopulation level have been outlined by IOTF and areshown in Table 15.
Targets for action focus on changes in the nature of thefood supply and in the mechanization of physical activity.Strategies can be modelled partly after successful cam-paigns for tobacco control, automotive safety and recycling– all of which have involved a successful combination ofconsumer education and advocacy, legislative and policychanges, and community-based programmes (488). Table16 lists some strategies for obesity prevention initiativesimplemented through different sectors, recognizing that thespecific type of initiatives needed will differ culturally andbetween and within countries.
Many of the strategies listed in Table 16 would influencethe environments of children. Approaches that specificallytarget children include changes in the food and activityoptions in schools, improving infrastructure for walkingand access to safe and affordable outdoor play areas, andregulating food advertising on television, particularlyadvertising that is aimed at children.
The goal is not to find a single programme that works,as this is unlikely to be found, but to stimulate regional,
national and local initiatives that are suitable for theircontext. Initiatives to meet the rising problem must beproportional to their target, for example:
• school curriculum development for health educationmay need to be set as a national policy;
• sports promotion may need to be centred on schooland community programmes;
• food marketing controls may need to be introduced atnational, regional or even global level;
• reduced car use and increased walking or bicycle usemay be the responsibility of municipal planners work-ing under national guidelines.
6.2.1. Involvement of other sectorsIt is clear from this approach that some influential stake-holders outside of the health sector may have interestscomplementary to health sector obesity prevention objec-tives. Policy development can identify and capitalize uponpartnerships with such interested agencies and stakehold-ers. Within the health sector itself, nutritional objectives forobesity prevention are highly compatible with those for thepromotion of cardiovascular health as well as cancer pre-vention. Similarly, efforts to improve breast-feeding adop-tion and to increase consumption of fruits and vegetablesare consistent with general guidelines for infant and childnutrition.
Outside of the health sector, allies in efforts toincrease children’s physical activity may be foundamong those working to increase the sustainability ofthe environment, including proponents of sustainabletransport and of safer streets or of the development ofparks and recreational facilities. In addition, teachersand school administrators, when convinced that health-ful eating and physical activity are favourable to aca-demic performance, can also become powerful allies forimplementing changes in school environments andextend school sports facilities for local community use.(See for example, the transcripts from the US HealthySchools Summit at <http://www.actionforhealthykids.org/hss/presentations.htm>.)
School boards may also be encouraged to review theirschool nutrition policies by direct exhortation from healthcare professionals. A recent Policy Statement from theAmerican Academy of Pediatrics (489) identifies softdrinks in schools as a risk factor for obesity and is intendedfor school superintendents, school board members andparents as well as health professionals. It calls on paedia-tricians to assist in educating school authorities about theirresponsibilities for the nutritional health of their studentbody.
Barriers to obesity prevention are economic, culturaland practical. It is well-documented within the field of
Table 15 Ten principles upon which to base obesity prevention at the population level
1. Education alone is not sufficient to change weight-related behaviours. Environmental and societal intervention is also required to promote and support behaviour change.
2. Action must be taken to integrate physical activity into daily life, not just to increase leisure time exercise.
3. Sustainability of programmes is crucial to enable positive change in diet, activity and obesity levels over time.
4. Political support, intersectoral collaboration and community participation are essential for success.
5. Acting locally, even in national initiatives, allows programmes to be tailored to meet real needs, expectations and opportunities.
6. All parts of the community must be reached – not just the motivated healthy.
7. Programmes must be adequately resourced.8. Where appropriate, programmes should be integrated into existing
initiatives.9. Programmes should build on existing theory and evidence.
10. Programmes should be properly monitored, evaluated and documented. This is important for dissemination and transfer of experiences.
Source: Kumanyika et al. (17).

obesity reviews Obesity in children and young people IASO 69
© 2004 The International Association for the Study of Obesity. obesity reviews 5 (Suppl. 1), 4–85
Table 16 Potential societal level solutions for obesity prevention
Setting or sector Potential societal intervention
1. National government • Integrate nutrition, physical activity and obesity prevention objectives into relevant policies and programmes e.g. Conduct obesity impact assessments for all new and existing policies.
e.g. food and nutrition,transport, education,health, welfare
• Increase ability of low-income populations to buy foods that are rich in micronutrients but low in fat and sugar, e.g. Provide price support for healthy food.• Reduce dependence on sugary soft drinks e.g. Provide a safe, palatable and affordable water supply for all.• Improve general food supply e.g. Provide economic incentives for supply of ‘healthy’ foods and disincentives for supply of ‘unhealthy’ foods.• Increase cycling and walking for short journeys and leisure, especially in urban areas e.g. Develop and implement sustainable transport policies.
2. Food supply • Improve nutrition quality of food served in catering outlets e.g. Introduce award or accreditation schemes for preparation, provision and promotion of healthy food options in catering outlets.
e.g. manufacture,marketing, distribution,retail, catering
• Improve nutrition quality of general food supply e.g. Develop, produce, distribute and promote food products that are low in dietary fat and energy.• Help consumers to make informed food purchase choices e.g. Introduce new and improved food labelling schemes (covering fat, energy and salt) which do not mislead the consumer.
3. Media • Reduce advertising and marketing practices that promote over-consumption of food and drink e.g. Regulate television food advertising aimed at children.• Promote a healthy lifestyle culture e.g. Incorporate positive behaviour change messages into television programmes and popular magazines.
4. Non-governmental/international organizations
• Support action on diet, physical activity and obesity e.g. Develop and implement healthy eating, physical activity and obesity prevention programmes; Advocate for action on diet, physical activity and obesity.
5. Healthcare services • Promote healthcare intervention before obesity develops e.g. Provide training in obesity prevention and management for doctors and other healthcare workers.• Promote adoption of healthy activity and dietary habits by patients e.g. Provide physical activity and/or nutrition and cooking skills programmes for patients.
6. Education sitese.g. pre-school, school,further education
• Improve nutrition quality of foods available e.g. Introduce nutrition standards for school meals.• Encourage choice of healthy foods e.g. Introduce reward schemes for choice of healthy foods.• Empower students to prepare healthy meals e.g. Provide classes in practical food preparation and cooking.• Encourage uptake of physical activities e.g. Increase range of enjoyable, non-competitive physical activities on offer at school.• Encourage integration of walking or cycling into daily routine e.g. Develop and implement ‘Safe-routes-to-school’ programmes.
7. Worksites • Improve nutrition quality of foods available e.g. Provide appetising healthy food and drink options in staff restaurants.• Encourage choice of healthy foods e.g. Subsidize healthy options in staff restaurants.• Empower employees to integrate physical activity into work day e.g. Provide exercise and changing facilities.• Encourage integration of walking or cycling into daily routine e.g. Provide incentive schemes for walking and cycling to work.• Empower employees to integrate physical activity into work day and reduce reliance on convenience pre-processed food e.g. Implement flexible work hours.
8. Neighbourhoods,homes and families
• Increase access of low income groups to healthy food e.g. Set-up community garden programmes and food co-operatives.• Increase access to safe exercise and recreation facilities e.g. Pedestrianize city centres and residential areas.• Promote walking (and cycling), e.g. Set-up walking programmes in shopping malls, parks etc, open safe-cycling routes.• Increase access to, and consumption of, fruit and vegetables (and encourage physical activity) e.g. Home gardening projects.
Source: Kumanyika et al. (17).
tobacco control and also reported with respect to thepromotion of healthy eating (490) that initiatives to cur-tail the advertising and sale of food elicit strong opposi-tion from commercial interests. For example, in the USAand some European countries, exclusive marketing con-tracts to sell food and beverage products to school chil-dren have been negotiated with some schools, withincentives to school administrators who use the associ-
ated revenues to increase resources for school pro-grammes (490). Such policies need to be reviewed andassessed for their potential health impact.
6.2.2. Cultural resistance to changeTo find economically viable strategies that can prevent acontinuing escalation of the absolute amount of food andcalories marketed within countries and across national

70 Obesity in children and young people IASO obesity reviews
© 2004 The International Association for the Study of Obesity. obesity reviews 5 (Suppl. 1), 4–85
boundaries is extremely challenging. Restrictions on mar-keting and advertising are opposed on the grounds of strongand legally-protected cultural values such as the right tofree speech, although marketing and advertising that isaimed at children has come under criticism from consumerorganizations. Professional bodies for paediatrics and psy-chology have also taken positions against the marketing ofproducts that could undermine the health of children.
In addition, consumer demand is a barrier to obesityprevention. Once consumers have become accustomed toand relatively dependent upon the modern food environ-ment, for example abundant quantities of convenientlypackaged foods at low cost, efforts to alter this environ-ment in the name of obesity prevention may encounterstrong cultural resistance.
There are major economic and cultural implicationsassociated with initiatives to decrease physical inactivity orto increase activity. Small-scale programmes to reduce thetime spent in sedentary activities such as television viewingor use of computers or computer games can be effectiveand tolerated, but large-scale initiatives of the same typemay encounter substantial economic and cultural barriers.Sedentary lifestyles are culturally normative and defendedas such.
In summary, long-term obesity prevention strategiesmust be economically viable, culturally acceptable and
futuristic. Obesity prevention cannot be accomplished by‘turning back the clock’ to reverse development and eco-nomic advancement. Rather, the challenge is to create envi-ronmental incentives and opportunities that will preventexcess weight gain and that are compatible with otheraspects of the desired aggregate lifestyles.
6.2.3. Reviewing the science of obesity preventionAs suggested in the discussion of the systematic reviewsof management and preventive aspects of child obesity,there is a paucity of properly-conducted randomized con-trol trials of various intervention approaches. Far greaterresources are applied to the biological sciences investigat-ing genetic, cellular and hormonal aspects of obesitydevelopment than on the social sciences of obesity gener-ation or the costs of obesity in financial, psychological orsocial terms. Yet obesity is unlikely to prove to be a dis-order amenable to a ‘magic bullet’ solution – there is lit-tle likelihood that it can be prevented in the mass of thepopulation through the means of pharmaceutical inter-ventions affecting cell activity, say, or through geneticinterventions preventing the transcription of obesogenicgenes.
Expressed diagramatically (see Fig. 37), the presentscientific effort is largely devoted to investigation of fac-tors in the upper boxes, while the most likely arena for
Figure 37 Transforming the focus of science.
SCIENTIFICENDEAVOUR
POTENTIALFORPREVENTINGOBESITY
Genetic correlates of obesityReceptor mechanisms and ligands
Adipocyte cell growthHormone impact on growth
Hormone response to micronutrientsMicronutrient supply and growth
Pre- and post-natal growthEnergy balanceAppetite control
Diet and nutrition educationBehaviour modification and incentives
Social psychology of food-related behaviourFood preparation skills and knowledge
Household food securityHousehold kitchen facilities and design
Access to food variety, cost of food varietyRetail planning and distribution, retail
competition policiesUrban facilities for play and activity, safe and
secure parks and play areasAccess to sport facilities, cost of accessRegulation of marketing and advertisingControls on food prices and subsidies
Agriculture and transport policies and subsidiesInternational agreement on food supply
policies, fuel prices and taxationCommunity empowerment for health policies
and public health protection

obesity reviews Obesity in children and young people IASO 71
© 2004 The International Association for the Study of Obesity. obesity reviews 5 (Suppl. 1), 4–85
a genuine long-lasting solution to obesity will be inter-vention involving factors in the lower boxes. In thisrespect, science funding bodies need to reassess thedirection of their funding and the end results they arehoping to support.
6.2.4. Role of the World Health OrganizationThe WHO is aware of the need to identify and addressinternational trade and development issues in relation tonutritional health, including advertising and mass com-munication, world trade agreements, food labelling, novelfoods, urban planning and transportation (491). Further-more, the WHO is committed to providing support tomember states to develop national policies and pro-grammes in this area, and is itself developing a globalstrategy and is seeking interaction with industry to stressthe responsibility of the commercial sector in the need toimprove diet, physical activity and health. In particular,resolution WHA 55.11 (2002) on sustainable develop-ment and health committed WHO to providing assistanceto countries to frame policies and implement nationalplans that promote consumption patterns that are sus-tainable and health promoting; and resolution WHA 55.2(2002) urged member states to develop national plans ofaction on nutrition and physical activity, with strategieson diet that involved all sectors, including civil societyand the food industry. The resolution committed WHOto developing a global strategy on diet, physical activityand health within the strategy for non-communicable dis-ease prevention and control.
In the report of the WHO expert consultation on diet,nutrition and the prevention of chronic disease (6), thefollowing recommendations for promoting healthy dietsand physical activity are proposed:
• Strategies should be comprehensive in addressing allmajor dietary and physical activity risks for chronic diseasetogether, alongside other risks – such as tobacco use – froma multi-sectoral perspective.
• Each country should select the optimal mix of actionsin accord with national capabilities, laws and economicrealities.
• Governments have a central steering role in developingstrategies, ensuring they are implemented and their impactmonitored over the long term.
• Health ministries have a crucial role in conveningother ministries to ensure effective policy design andimplementation.
• Governments need to be supported by private sectorbodies, health professions, consumer groups, academicsand the research community.
• A life-course approach, in which the origins of chronicdisease such as obesity are recognized in maternal andinfant nutrition and care practices, is essential.
• Strategies need to address inequalities and focus on theneeds of poorer communities and population groups, andbe gender sensitive.
• Individual countries may be limited in their actions byinternational norms and standards, for example in theregulation of trade and marketing practices, and WHO’sinternational leadership role is essential in these respects.
The document also calls for more ‘enabling’ environments(which enable people to make healthier choices) and inparticular:
• Supporting the greater availability of nutrient-richfoods such as vegetables, legumes, whole grains, lean meatsand low-fat dairy products.
• Promoting changes in agricultural policies whichincrease sustainability of food production and the environ-mental resources, including changes away from resource-intensive forms of farming and the production of tobaccoand animal-based foods.
• Protecting traditional diets where these promotehealth and are environmentally sustainable.
• Encouraging reduced dependence on motorized trans-port and increased access to recreation facilities thatencourage physical activity.
• Encouraging standards to ensure health information iswidely available and easily understood, and health mes-sages are relevant and consistent.
6.2.5. Professional bodies and international organizations can assist the processProfessional organizations and groups such as the Interna-tional Association for the Study of Obesity and the Inter-national Obesity TaskForce can offer support to the WHOand to member countries to develop National ObesityAction Plans. Such Action Plans may need to prioritizechild and adolescent obesity prevention. Examples ofAction Plan priorities might be to:
• encourage schools to enact coherent food, nutritionand physical activity policies;
• design secure play facilities and safe local roads, parksand open spaces;
• restrict advertising and marketing to children ofenergy-dense, low nutrient foods;
• develop fiscal incentives to help provide more nutri-tious food for children;
• ensure the participation of child health professionalsin national policy formulation;
• develop obesity prevention guidelines and best practicecase studies for policy implementation.
Polices at international and national level down tolocal and community level need to be examined for

72 Obesity in children and young people IASO obesity reviews
© 2004 The International Association for the Study of Obesity. obesity reviews 5 (Suppl. 1), 4–85
their potential impact on health. Where direct evidenceis lacking, assessments of policies and interventionsmust be made on the basis of indirect evidence andon the probabilities of hazards and benefits. Profes-sional organizations and international groups are wellplaced to contribute to this process.
The present report has been prepared by the Interna-tional Obesity TaskForce, a component of the InternationalAssociation for the Study of Obesity, and represents theIOTF’s commitment to encouraging the prevention of childand adolescent obesity and to providing advice and supportto the WHO and to member countries in the developmentof appropriate strategies and policies. The process needs tobe started urgently – targets need to be set and evaluationschemes put into place. Continued monitoring of theprogress towards the goals will help to ensure that thepolicies are being enacted and that they are having thenecessary effect.
Achieving these aims will require much imagination andperspiration, but the world’s children deserve no less.
References
1. International Obesity Task Force data, based on population-weighted estimates from published and unpublished surveys,1990–2002 (latest available) using IOTF-recommended cut-offsfor overweight and obesity. [http://www.iotf.org].2. Dean H, Flett B. Natural history of type 2 diabetes diagnosedin childhood: long term follow-up in young adult years. Diabetes2002; 51: A24 (Abstract) [cited in Ebbeling CB, Pawlak DB,Ludwig DS. Childhood obesity: public health crisis, common sensecure. Lancet 2002; 360: 473–482].3. Strauss RS, Pollack HA. Epidemic increase in childhood over-weight 1986–1998. JAMA 2001; 286: 2845–2848.4. Allison DB, Matz PE, Pietrobelli A, Zannolli R, Faith MS.Genetic and environmental influences on obesity. In: Bendich A,Deckelbaum RJ (eds). Primary and Secondary Preventive Nutrition.Humana Press: Totowa, New Jersey, 1999, pp 147–164.5. Bray G. Press Statement. Finger points to corn syrup in obesityepidemic. International Congress on Obesity, Sao Paulo, Brazil,26–30 August 2002 [http://www.iotf.org/media/syrup.htm].6. World Health Organization. Report of a Joint WHO/FAOExpert Consultation. Diet Nutrition and the Prevention ofChronic Diseases. WHO Technical Report Series no. 916. WHO:Geneva, 2002.7. Kimm SY, Obarzanek E. Childhood obesity: a new pandemicof the new millennium. Pediatrics 2002; 110: 1003–1007.8. Yanovski JA, Yanovski SZ. Treatment of pediatric and adoles-cent obesity. JAMA 2003; 289: 1851–1853.9. Fulton JE, McGuire MT, Caspersen CJ, Dietz WH. Interven-tions for weight loss and weight gain prevention among youth:current issues. Sports Med 2001; 31: 153–165.10. Parizkova J, Maffeis C, Poskitt EME. Management throughactivity. In: Burniat W, Cole T, Lissau I, Poskitt EME (eds). Childand Adolescent Obesity. Causes and Consequences; Preventionand Management. Cambridge University Press: Cambridge, 2002pp 307–326.11. Golan M, Fainaru M, Weizman A. Role of behaviourmodification in the treatment of childhood obesity with the par-
ents as the exclusive agents of change. Int J Obes 1998; 22: 1217–1224.12. Wilson GT. Behavioral treatment of childhood obesity: theo-retical and practical implications. Health Psychology 1994; 13:371–372.13. Bauer B, Maffeis C. Interdisciplinary outpatient management.In: Burniat W, Cole T, Lissau I, Poskitt EME (eds). Child andAdolescent Obesity. Causes and Consequences; Prevention andManagement. Cambridge University Press: Cambridge, UK, 2002pp 361–376.14. Campbell K, Waters E, O’Meara S, Kelly S, Summerbell C.Interventions for preventing obesity in children. Cochrane Data-base Syst Rev 2002; 2: CD001871.15. Egger G, Swinburn B. An ‘ecological’ approach to the obesitypandemic. BMJ 1997; 315: 477–480.16. World Health Organization. Obesity: Preventing and Manag-ing the Global Epidemic. Report of a WHO Consultation. WHOTechnical Report Series no. 894. WHO: Geneva, 2000.17. Kumanyika S, Jeffery RW, Morabia A, Ritenbaugh C,Antipatis VJ. Public health approaches to the prevention ofobesity. Working Group of the International Obesity TaskForce.Obesity prevention: the case for action. Int J Obes 2002; 26: 425–436.18. Ebbeling CB, Pawlak DB, Ludwig DS. Childhood obesity:public health crisis, common sense cure. Lancet 2002; 360: 473–482.19. Power C, Lake JK, Cole TJ. Measurement and long-termhealth risks of child and adolescent fatness. Int J Obes 1997; 21:507–526.20. Goran MI. Measurement issues related to studies of childhoodobesity: assessment of body composition, body fat distribution,physical activity, and food intake. Pediatrics 1998; 101: 505–518.21. Goran MI, Driscoll P, Johnson R, Nagy TR, Hunter G. Cross-calibration of body-composition techniques against dual-energyX-ray absorptiometry in young children. Am J Clin Nutr 1996;63: 299–305.22. Goran MI, Gower BA, Treuth M, Nagy TR. Prediction ofintra-abdominal and subcutaneous abdominal adipose tissue inhealthy pre-pubertal children. Int J Obes 1998; 22: 549–558.23. Wells JCK. A critique of the expression of paediatric bodycomposition data. Arch Dis Child 2001; 85: 67–72.24. Wabitsch M, Braun U, Heinze E, Muche R, Mayer H, TellerW, Fusch C. Body composition in 5–18-year-old obese childrenand adolescents before and after weight reduction as assessed bydeuterium dilution and bioelectrical impedance analysis. Am J ClinNutr 1996; 64: 1–6.25. Fields DA, Goran MI, McCrory MA. Body-compositionassessment via air-displacement plethysmography in adults andchildren: a review. Am J Clin Nutr 2002; 75: 453–467.26. Whitehead RG, Paul AA. Growth charts and the assessmentof infant feeding practices in the western world and in developingcountries. Early Hum Dev 1984; 9: 187–207.27. Cole TJ, Paul AA, Whitehead RG. Weight reference charts forBritish long-term breastfed infants. Acta Paediatr 2002; 91: 1296–1300.28. World Health Organization Working Group on the GrowthReference Protocol and Task Force on Methods for the NaturalRegulation of Fertility. Growth patterns of breastfed infants inseven countries. Acta Paediatr 2000; 89: 215–222.29. Cole T, Rolland-Cachera MF. Measurement and definition.In: Burniat W, Cole T, Lissau I, Poskitt EME (eds). Child andAdolescent Obesity. Causes and Consequences; Prevention andManagement. Cambridge University Press: Cambridge, 2002; pp3–27.

obesity reviews Obesity in children and young people IASO 73
© 2004 The International Association for the Study of Obesity. obesity reviews 5 (Suppl. 1), 4–85
30. Deurenberg-Yap M, Chew SK, Deurenberg P. Elevated bodyfat percentage and cardiovascular risks at low body mass indexlevels among Singaporean Chinese, Malays and Indians. Obes Rev2002; 3: 209–215.31. Lazarus R, Baur L, Webb K, Blyth F. Body Mass Index inscreening for adiposity in children and adolescents: systematicevaluation using receiver operating characteristic curves. Am JClin Nutr 1996; 63: 500–506.32. Sardinha LB, Going SB, Teixeira PJ, Lohman TG. Receiveroperating characteristic analysis of body mass index, triceps skin-fold thickness, and arm girth for obesity screening in children andadolescents. Am J Clin Nutr 1999; 70: 1090–1095.33. Himes JH, Dietz WH. Guidelines for overweight in adolescentpreventative services: recommendations from an expert commit-tee. Am J Clin Nutr 1994; 59: 307–316.34. Pietrobelli A, Faith MS, Allison DB, Gallagher D, ChiumelloG, Heymsfield SB. Body Mass Index as a measure of adiposityamong children and adolescents: a validation study. J Pediatr1998; 132: 204–210.35. Wang J, Thornton JC, Russell M, Burastero S, Heymsfield S,Pierson RN Jr. Asians have lower body mass index (BMI) buthigher percent body fat than do whites: comparisons of anthropo-metric measurements. Am J Clin Nutr 1994; 60: 23–28.36. Ross R, Fortier L, Hudson R. Separate associations betweenvisceral and subcutaneous adipose tissue distribution, insulin andglucose levels in obese women. Diabetes Care 1996; 19: 1404–1411.37. Freedman SE, Serdula MK, Srinivasan SR, Berenson GS. Therelation of circumferences and skinfolds to levels of lipids andinsulin: the Bogalusa Heart Study. Am J Clin Nutr 1999; 69: 308–317.38. Taylor RW, Jones IE, Williams SM, Goulding A. Evaluationof waist circumference, waist-to-hip ratio, and the conicity indexas screening tools for high trunk fat mass, as measured by dual-energy X-ray absorptiometry. Am J Clin Nutr 2000; 72: 490–495.39. Goran MI, Gower BA. Relation between visceral fat anddisease risk in children and adolescents. Am J Clin Nutr 1999; 70(Suppl.): 149S–156S.40. Yajnik CS. Fetal origins of adult disease: where do we stand?Int J Diab Dev Countries 2001; 21: 42–50.41. Franklin MF. Comparison of weight and height relations inboys from 4 countries. Am J Clin Nutr 1999; 70 (Suppl.): 157S–162S.42. World Health Organization. Physical Status: the Use andInterpretation of Anthropometry. Report of a WHO ExpertCommittee. Technical Report Series no. 854. WHO: Geneva,1995.43. McCarthy HD, Jarrett KV, Crawley HF. The development ofwaist circumference percentiles in British children aged 5.0–16.9y. Eur J Clin Nutr 2001; 55: 902–907.44. Bellizzi MC, Dietz WH. Workshop on childhood obesity:summary of the discussion. Am J Clin Nutr 1999; 70 (Suppl.):173S–175S.45. Must A, Dallal GE, Dietz WH. Reference data for obesity:85th and 95th percentiles of body mass index (wt/ht2) and tricepsskinfold thickness. Am J Clin Nutr 1991; 53: 839–846.46. Kuczmarski RJ, Ogden CL, Grummer-Strawn LM, FlegalKM, Guo SS, Wei R, Mei Z, Curtin LR, Roche AF, Johnson CL.CDC Growth Charts: United States Advance Data from Vital andHealth Statistics, no. 314. National Center for Health Statistics:Atlanta, 2000.47. Cole TJ, Bellizzi MC, Flegal KM, Dietz WH. Establishing astandard definition for child overweight and obesity worldwide:international survey. BMJ 2000; 320: 1240–1243.
48. Whitaker RC, Wright JA, Pepe MS, Seidel KD, Dietz WH.Predicting obesity in young adulthood from childhood and paren-tal obesity. N Engl J Med 1997; 337: 869–873.49. Yajnik CS. The lifecycle effects of nutrition and body size onadult adipocity, diabetes and cardiovascular disease. Obes Rev2002; 3: 217–224.50. Chinn S, Hughes JM, Rona RJ. Trends in growth and obesityin ethnic groups in Britain. Arch Dis Child 1998; 78: 513–517.51. Whincup PH, Gilg JA, Papacosta O, Seymour C, Miller GJ,Alberti KG, Cook DG. Early evidence of ethnic differences incardiovascular risk: cross sectional comparison of British SouthAsian and white children. BMJ 2002; 324: 635.52. International Diabetes Institute. The Asia-Pacific Perspective:Redefining Obesity and its Treatment. WHO Regional Office forthe Western Pacific with the International Association for theStudy of Obesity and the International Obesity TaskForce. HealthCommunications Australia: Sydney, 2002.53. Swinburn BA, Ley SJ, Plank LD. Body size and compositionin Polynesians. Int J Obes 1999; 23: 1178–1183.54. Bini V, Celi F, Berioli MG, Bacosi ML, Stella P, Giglio P,Tosti L, Falorni A. Body mass index in children and adolescentsaccording to age and pubertal stage. Eur J Clin Nutr 2000; 54:214–218.55. Taylor RW, Falorni A, Jones IE, Goulding A. Identifyingadolescents with high percentage body fat: a comparison of BMIcutoffs using age and stage of pubertal development comparedwith BMI cutoffs using age alone. Eur J Clin Nutr 2003; 57: 764–769.56. Flegal KM, Ogden CL, Wei R, Kuczmarski RL, Johnson CL.Prevalence of overweight in US children: comparison of US growthcharts from the Centers for Disease Control and Prevention withother reference values for body mass index. Am J Clin Nutr 2001;73: 1086–1093.57. Wang Y, Wang JQ. A comparison of international refer-ences for the assessment of child and adolescent overweight andobesity in different populations. Eur J Clin Nutr 2002; 56: 973–982.58. Chen W, Lin C-C, Peng C-T, Li C-I, Wu H-C, Chiang J, WuJ-Y, Huang P-C. Approaching healthy body mass index norms forchildren and adolescents from health-related physical fitness. ObesRev 2002; 3: 225–232.59. Wang Y. Is obesity associated with early sexual maturation?A comparison of the association in American boys versus girls.Pediatrics 2002; 110: 903–910.60. Popkin BM, Richards MK, Montiero CA. Stunting is associ-ated with overweight in children of four nations that are under-going the nutrition transition. J Nutr 1996; 126: 3009–3016.61. de Onis M, Blossner M. Prevalence and trends of overweightamong preschool children in developing countries. Am J Clin Nutr2000; 72: 1032–1039.62. Martorell R, Kettel Khan L, Hughes ML, Grummer-StrawnLM. Overweight and obesity in preschool children from develop-ing countries. Int J Obes 2000; 24: 959–967.63. Lobstein TJ, James WPT, Cole TJ. Increasing levels of excessweight among children in England. Int J Obes 2003; 27: 1136–1138.64. Magarey AM, Daniels LA, Boulton TJ, Prevalence of over-weight and obesity in Australian children and adolescents: reas-sessment of 1985 and 1995 data against new standardinternational definitions. Med J Aust 2001; 174: 561–564.65. Moreno LA, Fleta J, Sarria A, Bueno M. Prevalence andtrends in childhood obesity in Zaragoza (Spain). BMJ 2001; elec-tronic letters 2 February 2001 [http://bmj.com/cgi/eletters/322/7277/24 #12391].

74 Obesity in children and young people IASO obesity reviews
© 2004 The International Association for the Study of Obesity. obesity reviews 5 (Suppl. 1), 4–85
66. Tremblay MS, Katzmarzyk PT, Willms JD. Temporal trendsin overweight and obesity in Canada, 1981–1996. Int J Obes2002; 26: 538–543.67. Wang Y, Monteiro C, Popkin BM. Trends of obesity andunderweight in older children and adolescents in the UnitedStates, Brazil, China, and Russia. Am J Clin Nutr 2002; 75:971–977.68. Flegal KM, Carroll MD, Kuczmarski RJ, Johnson CL. Over-weight and obesity in the United States: prevalence and trends,1960–1994. Int J Obes 1998; 22: 39–47.69. Ogden CL, Flegal KM, Carroll MD, Johnson CL. Prevalenceand trends in overweight among US children and adolescents,1999–2000. JAMA 2002; 288: 1728–1732.70. Kain J, Uauy R, Vio F, Albala C. Trends in overweight andobesity prevalence in Chilean children: comparison of three defi-nitions. Eur J Clin Nutr 2002; 56: 200–204.71. International Obesity TaskForce with the European Child-hood Obesity Group. Obesity in Europe. IOTF: Copenhagen,2002 [http://www.iotf.org/media/euobesity.pdf].72. Lobstein TJ, Frelut M-L. Prevalence of overweight children inEurope. Obes Rev 2003; 4: 195–200.73. Perra A, Bella A, Kodra Y, Cuccia M. Nutritional status,dietary habitus, physical activity and self-perceived body image ofpre-adolescents in Catalonia, Sicily, 2002. Bollettino Epidemiolog-ico Nazionale 2002; 15: 1–5.74. Krassas GE, Tzotzas T, Tsametis C, Konstantinidis T. Preva-lence and trends in overweight and obesity among children andadolescents in Thessaloniki, Greece. J Pediatr Endocrinol Metab2001; 14 (Suppl. 5): 1319–1326, discussion 1365.75. Majem LS, Barba LS, Bartrina JA, Rodrigo CP, Santana PS.Epidemiología de la obesidad infantil y juvenil en España. Resulta-dos del estudio enKid (1998–2000). In: Majem LS, Bartrina JA(eds). Obesidad infantil y juvenil: Estudio enKid (Child and Ado-lescent Obesity: the Enkid Study). Masson: Barcelona, 2001; pp81–108.76. Manios Y, Moschandreas J, Hatzis C, Kafatos A. Health andnutrition education in primary schools of Crete: changes in chronicdisease risk factors following a 6-year intervention programme. BrJ Nutr 2002; 88: 315–324.77. Kautiainen S, Rimpelå A, Vikat A, Virtanen SM. Seculartrends in overweight and obesity among Finnish adolescents in1977–1999. Int J Obes 2002; 26: 544–552.78. Caroli M. Data presented to the IOTF Childhood Group,European Congress on Obesity, Helsinki, 29–31 May 2003.79. Oblaci ska A, Wroc awska M, Woynarowska B. Frequencyof overweight and obesity in the school-age population in Polandand health care for pupils with these disorders. Pediatria Polska1997; 72: 241–245.80. Croatian Health Service Yearbook 1998. HrvatskiZdravstveno-Statisti: Zagreb, 1998.81. Bláha P, Vignerová J. Investigation of the Growth of CzechChildren and Adolescents. National Institute of Public Health:Prague, 2002.82. Ibrahim B, Sallam S, el-Tawila S, el-Gibaly O, el-Sahn F.Transitions to Adulthood: A National Survey of Egyptian Adoles-cents, 2nd edn. The Population Council: New York, 2000 pp 25–30.83. Savva SC, Kourides Y, Tornaritis M, Epiphaniou-Savva M,Chadjigeorgiou C, Kafatos A. Obesity in children and adolescentsin Cyprus. Prevalence and predisposing factors. Int J Obes 2002;26: 1036–1045.84. al-Nuaim AR, Bamgboye EA, al-Herbish A. The pattern ofgrowth and obesity in Saudi Arabian male school children. Int JObes 1996; 20: 1000–1005.
n¢ l¢
85. Kotani K, Nishida M, Yamashita S, Funahashi T, Fujioka S,Tokunaga K, Ishikawa K, Tarni S, Matsuzawa Y. Two decades ofannual medical examinations in Japanese obese children: do obesechildren grow into obese adults? Int J Obes 1997; 21: 912–921.86. Ge K. 1992 The dietary and nutritional status of Chinesepopulation—children and adolescents. In: National Nutrition Sur-vey. People’s Medical Publishing House: Beijing, 1999.87. Luo J, Hu FB. Time trends of obesity in pre-school childrenin China from 1989 to 1997. Int J Obes 2002; 26: 553–558.88. Chu NF. Prevalence and trends of obesity among school chil-dren in Taiwan-the Taipei Children Heart Study. Int J Obes 2001;25: 170–176.89. Hong Kong Department of Health. Obesity among HongKong schoolchildren is rising. [http://news.sohu.com/79/98/news204679879.shtml], 2 December 2002.90. World Bank Data Query [http://www.worldbank.org/data/dataquery.html], accessed 30 June 2003.91. Office of World Health Reporting. Basic Indicators for allMember States. WHO: Geneva, 2000.92. Reddy SP, Panday S, Swart D, Jinabhai CC, Amosun SL,James S, Monyeki KD, Stevens G, Morejele N, Kambaran NS,Omardien RG, Van den Borne HW. Umthenthe Uhlaba Usamila– The South African Youth Risk Assessment Survey 2002 [Table22]. South African Medical Research Council: Cape Town,2003.93. Pinhas-Hamiel O, Zeitler P. Who is the wise man? The onewho foresees consequences. Childhood obesity, new associatedcomorbidity and prevention. Prev Med 2000; 31: 702–705.94. Must A, Strauss RS. Risks and consequences of childhood andadolescent obesity. Int J Obes 1999; 23: S2–S11.95. Riley DJ, Santiago T, Edelman NH. Complications of obe-sity–hypoventilation syndrome in childhood. Am J Dis Child1976; 130: 671–674.96. Mallory GB, Fiser DH, Jackson R. Sleep-associated breathingdisorders in morbidly obese children and adolescents. J Pediatr1989; 115: 892–897.97. Silvestri JM, Weese-Mayer DE, Bass MT, Kenny AS, Haupt-mann SA, Pearsall SM. Polysomnography in obese children witha history of sleep-associated breathing disorders. Pediatr Pulmonol1993; 16: 124–129.98. de la Eva RC, Baur LA, Donaghue KC, Waters KA. 2002Metabolic correlates with obstructive sleep apnea in obese sub-jects. J Pediatr, 140, 654–659.99. Rhodes SK, Shimoda KC, Waid LR, Mahlen P, Oexmann MJ,Collop NA, Willi SM. Neurocognitive deficits in morbidly obesechildren with obstructive sleep apnea. J Pediatr 1995; 127: 741–744.100. Gennuso J, Epstein LH, Paluch RA, Cerny F. The relation-ship between asthma and obesity in urban minority children andadolescents. Arch Pediatr Adolesc Med 1998; 152: 1197–1200.101. Luder E, Melnik TA, Dimaio M. Association of being over-weight with greater asthma symptoms in inner city black andHispanic children. J Pediatr 1998; 132: 699–703.102. Chinn S, Rona RJ. Prevalence and trends in overweight andobesity in three cross sectional studies of British children, 1974–94. BMJ 2001; 322: 24–26.103. Rodriguez MA, Winkleby MA, Ahn D, Sundquist J, Krae-mer HC. Identification of population subgroups of children andadolescents with high asthma prevalence: findings from the ThirdNational Health and Nutrition Examination Survey. Arch PediatrAdolesc Med 2002; 156: 269–275.104. Figueroa-Munoz JI, Chinn S, Rona RJ. Association betweenobesity and asthma in 4–11 year old children in the UK. Thorax2001; 56: 133–137.

obesity reviews Obesity in children and young people IASO 75
© 2004 The International Association for the Study of Obesity. obesity reviews 5 (Suppl. 1), 4–85
105. Stenius-Aarniala B, Poussa T, Kvarnstrom J, Gronlund EL,Ylikahri M, Mustajoki P. Immediate and long term effects ofweight reduction in obese people with asthma: randomised con-trolled study. BMJ 2000; 320: 827–832.106. Neuschwander-Tetri BA, Caldwell SH. Nonalcoholic steato-hepatitis: summary of an AASLD single topic conference. Hepa-tology 2003; 37: 1202–1219.107. Kinugasa A, Tsunamoto K, Furukawa N, Sawada T,Kusunoki T, Shimada N. Fatty liver and its fibrous changes foundin simple obesity of children. J Pediatr Gastroenterol Nutr 1984;3: 408–414.108. Rashid M, Roberts EA. Nonalcoholic steatohepatitis in chil-dren. J Pediatr Gastroenterol Nutr 2000; 30: 48–53.109. Silverman JF, Pories WJ, Caro JF. Liver pathology in diabe-tes mellitus and morbid obesity: clinical, pathological and bio-chemical considerations. Pathol Annu 1989; 24: 275–302.110. Angulo P. Medical progress: nonalcoholic fatty liver disease.N Engl J Med 2002; 346: 1221–1231.111. Marchesini G, Brizi M, Morselli-Labate AM, Bianchi G,Bugianesi E, McCullough AJ, Forlani G, Melchionda N. Associa-tion of nonalcoholic fatty liver disease with insulin resistance. AmJ Med 1999; 107: 450–455.112. Frelut ML, Rasakarivony R, Cathelineau L, Navarro J.Uneven occurrence of fatty liver in morbidly obese children:Impact of weight loss. Int J Obes 1995; 22 (Suppl. 2) : 43.113. Zaadstra BM, Seidell JC, Van Noord PA, Te Velde ER,Habbema JD, Vrieswijk B, Karbaat J. Fat and female fecundity:Prospective study of effect of body fat distribution on conceptionrates. BMJ 1993; 306: 484–487.114. Rogers J, Mitchell GW. The relation of obesity to menstrualdisturbances. N Engl J Med 1956; 247: 53–55.115. Richards GE, Cavallo A, Meyer WJD, Prince MJ, Peters EJ,Stuart CA, Smith ER. Obesity acanthosis nigricans, insulin resis-tance, and hyperandrogenemia: pediatric perspective and naturalhistory. J Pediatr 1985; 107: 893–897.116. Lazar L, Kauli R, Bruchis C, Nordenberg J, Galatzer A,Pertzelan A. Early polycystic ovary-like syndrome in girls withcentral precocious puberty and exaggerated adrenal response. EurJ Endocrinol 1995; 133: 403–406.117. Rich-Edwards JW, Goldman MB, Willett WC, Hunter DJ,Stampfer MJ, Colditz GA, Manson JE. Adolescent body massindex and infertility caused by ovulatory disorder. Am J ObstetGynecol 1994; 171: 171–177.118. Freedman DS, Khan LK, Serdula MK, Dietz WH, SrinivasanSR, Berenson GS. The relation of menarcheal age to obesity inchildhood and adulthood: the Bogalusa heart study. BMC Pediatr2003; 3: 3.119. Anderson SE, Dallal GE, Must A. Relative weight and raceinfluence average age of menarche: results from two nationallyrepresentative surveys of US girls studied 25 years apart. Pediatrics2003; 111: 844–850.120. Marshall L, Spiegelman D, Goldman M, Manson J, Cold-itz G, Barbieri R, Stampfer M, Hunter D. A prospective studyof reproductive factors and oral contraceptive use in relation tothe risk of uterine leiomyomata. Fertil. Steril 1998; 70: 432–439.121. Mcpherson CP, Sellers TA, Potter JD, Bostick RM, FolsomAR. Reproductive factors and risk of endometrial cancer. TheIowa Women’s Health Study. Am J Epidemiol 1996; 143: 1195–1202.122. Stice E, Presnell K, Bearman SK. Relation of early menarcheto depression, eating disorders, substance abuse, and comorbidpsychopathology among adolescent girls. Dev Psychol 2001; 37:608–619.
123. Graber JA, Lewinsohn PM, Seeley JR, Brooks-Gunn J. Ispsychopathology associated with the timing of pubertaldevelopment? J Am Acad Child Adolesc Psychiatry 1997; 36:1768–1776.124. Liestol K. Menarcheal age and spontaneous abortion: acausal connection? Am J Epidemiol 1980; 111: 753–758.125. American Diabetes Association. Type 2 diabetes in childrenand adolescents. Pediatrics 2000; 105: 671–680.126. Scott CR, Smith JM, Cradock MM, Pihoker C. Character-istics of youth-onset non-insulin-dependent diabetes mellitus andinsulin-dependent diabetes mellitus at diagnosis. Pediatrics 1997;100: 84–91.127. Sinha R, Fisch G, Teague B, Tamborlane WV, Banyas B,Allen K, Savoye M, Rieger V, Taksali S, Barbetta G, Sherwin RS,Caprio S. Prevalence of impaired glucose tolerance among childrenand adolescents with marked obesity. N Engl J Med 2002; 346:802–810.128. Paulsen EP, Richenderfer L, Ginsberg-Fellner F. Plasma glu-cose, free fatty acids, and immunoreactive insulin in sixty-six obesechildren. Studies in reference to a family history of diabetes mel-litus. Diabetes 1968; 17: 261–269.129. Pinhas-Hamiel O, Dolan LM, Daniels SR, Standiford D,Khoury PR, Zeitler P. Increased incidence of non-insulin-depen-dent diabetes mellitus among adolescents. J Pediatr 1996; 128:608–615.130. Fagot-Campagna A, Pettitt DJ, Engelgau MM, BurrowsNR, Geiss LS, Valdez R, Beckles GL, Saaddine J, Gregg EW,Williamson DF, Narayan KM. Type 2 diabetes among NorthAmerican children and adolescents: an epidemiologic reviewand public health perspective. J Pediatr 2000; 136: 664–672.131. McDermott R, O’Dea K, Rowley K, Knight S, Burgess P.Beneficial impact of the homelands movement on health outcomesin central Australian aborigines. Aust N Z J Public Health 1998;22: 653–658.132. Frelut ML. Type 2 diabetes and impaired glucose tolerancein obese adolescents in Europe. Data from European ChildhoodObesity Group International Congress on Obesity, Sao Paulo, 30August 2003.133. Ehtisham S, Barrett TG, Shaw NJ. Type 2 diabetes mellitusin UK children – an emerging problem. Diabet Med 2000; 17:867–871.134. Drake AJ, Smith A, Betts PR, Crowne EC, Shield JP. Type2 diabetes in obese white children. Arch Dis Child 2002; 86: 207–208.135. Fagot-Campagna A, Narayan KMV, Imperatore G. Type 2diabetes in children. BMJ 2001; 322: 377–378.136. Otani T, Yokoyama H, Higami Y, Kasahara T, Uchigata Y,Hirata Y. Age of onset and type of Japanese younger diabetics inTokyo. Diabetes Res Clin Pract 1990; 10: 241–244.137. Kitagawa T, Owada M, Urakami T, Tajima N. Epidemiol-ogy of type 1 (insulin-dependent) and type 2 (non-insulin-depen-dent) diabetes mellitus in Japanese children. Diabetes Res ClinPract 1994; 24 (Suppl.): S7–S13.138. Malecka-Tendera E, Molnar D. Hormonal and metabolicchanges. In: Burniat W, Cole T, Lissau I, Poskitt EME (eds). Childand Adolescent Obesity. Causes and Consequences; Preventionand Management. Cambridge University Press: Cambridge, 2002pp 189–220.139. Freedman DS, Srinivasan SR, Bereneson GS. Risk of Cardio-vascular complications. In: Burniat W, Cole T, Lissau I, PoskittEME (eds). Child and Adolescent Obesity. Causes and Conse-quences; Prevention and Management. Cambridge UniversityPress: Cambridge, 2002 pp 221–239.

76 Obesity in children and young people IASO obesity reviews
© 2004 The International Association for the Study of Obesity. obesity reviews 5 (Suppl. 1), 4–85
140. Jiang X, Srinivasan SR, Berenson GS. Relation of obesity toinsulin secretion and clearance in adolescents: the Bogalusa HeartStudy. Int J Obes 1996; 20: 951–956.141. Schmitz KH, Jacobs DR Jr, Hong CP, Steinberger J, MoranA, Sinaiko AR. Association of physical activity with insulin sensi-tivity in children. Int J Obes 2002; 26: 1310–1316.142. Malecka-Tendera E, Koehler B, Wiciak B, Ramos A.Impaired glucose tolerance ion obese children – a long-term pro-spective study. In: Ditschuneit H, Gries FA, Hauner H, Schusd-ziarra V, Wechsler JG (eds). Obesity in Europe 1993. John Libbey:London, 1994 pp 153–158.143. Freedman DJ, Serdula MK, Khan LK. The adult healthconsequences of childhood obesity. In: Chen C, Dietz WH (eds).Obesity in Childhood and Adolescence. Nestle Nutrition Work-shop Series Pediatric Programme, v. 49. Lippincott Williams &Wilkins: Philadelphia, 2002 pp 63–82.144. Srinivasan SR, Bao W, Wattigney WA, Berenson GS. Ado-lescent overweight is associated with adult overweight and relatedmultiple cardiovascular risk factors: the Bogalusa Heart Study.Metabolism 1996; 45: 235–240.145. Lauer RM, Lee J, Clarke WR. Factors affecting the relation-ship between childhood and adult cholesterol levels: the MuscatineStudy. Pediatrics 1988; 82: 309–318.146. Lauer RM, Clarke WR, Beaglehole R. Level, trend, andvariability of blood pressure during childhood: the Muscatinestudy. Circulation 1984; 69: 242–249.147. Hulman S, Kushner H, Katz S, Falkner B. Can cardiovascu-lar risk be predicted by newborn, childhood and adolescent bodysize? An examination of longitudinal data in urban African Amer-icans. J Pediatr 1998; 132: 90–97.148. Vanhala MJ, Vanhala PT, Keinanen-Kiukaanniemi SM,Kumpusalo EA, Takala JK. Relative weight gain and obesity as achild predict metabolic syndrom as an adult. Int J Obes 1999; 23:656–659.149. Vanhala M, Vanhala P, Kumpusalo E, Halonen P, Takala J.Relation between obesity from childhood to adulthood and themetabolic syndrome: population based study. BMJ 1998; 317: 319.150. Cook S, Weitzman M, Auinger P, Nguyen M, Dietz WH.Prevalence of a metabolic syndrome phenotype in adolescents:findings from the third National Health and Nutrition Examina-tion Survey, 1988–1994. Arch Pediatr Adolesc Med 2003; 157:821–827.151. National High Blood Pressure Education Programme Work-ing Group on Hypertension Control in Children and Adolescents.Update on the 1987 task force report on high blood pressure inchildren and adolescents: a working group report from theNational High Blood Pressure Education Programme. Pediatrics1996; 98: 649–658.152. Figueroa-Colon R, Franklin FA, Lee JY, Aldridge R, Alex-ander L. Prevalence of obesity with increased blood pressure inelementary school-aged children. South Med J 1997; 90: 806–813.153. Rames LK, Clarke WR, Connor WE, Reiter MA, Lauer RM.Normal blood pressure and the evaluation of sustained bloodpressure elevation in childhood: the Muscatine study. Pediatrics1978; 61: 245–251.154. Maffeis C, Pietrobelli A, Grezzani A, Provera S, Tato L.Waist circumference and cardiovascular risk factors in prepubertalchildren. Obes Res 2001; 9: 179–187.155. Rocchini AP. Pediatric hypertension 2001. Curr Opin Car-diol 2002; 17: 385–389.156. Coatmellec-Taglioni G, Ribiere C. Factors that influence therisk of hypertension in obese individuals. Curr Opin NephrolHypertens 2003; 12: 305–308.
157. Kondo H, Shimomura I, Matsukawa Y, Kumada M, Taka-hashi M, Matsuda M, Ouchi N, Kihara S, Kawamoto T, SumitsujiS, Funahashi T, Matsuzawa Y. Association of adiponectin muta-tion with type 2 diabetes: a candidate gene for the insulin resis-tance syndrome. Diabetes 2002; 51: 2325–2328.158. Freedman DS, Burke GL, Harsha DW, Srinivasan SR, Cre-santa JL, Webber LS, Berenson GS. Relationship of changes inobesity to serum lipid and lipoprotein changes in childhood andadolescence. JAMA 1985; 254: 515–520.159. Freedman DS, Dietz WH, Srinivasan SR, Berenson GS. Therelation of overweight to cardiovascular risk factors among chil-dren and adolescents: the Bogalusa Heart Study. Pediatrics 1999;103: 1175–1182.160. Bao W, Srinivasan SR, Wattigney WA, Bao W, Berenson GS.Usefulness of childhood low-density lipoprotein cholesterol levelin predicting adult dyslipidemia and other cardiovascular risks.The Bogalusa Heart Study. Arch Intern Med 1996; 156: 1315–1320.161. Staffieri JR. A study of social stereotype of body image inchildren. J Pers Soc Psychol 1967; 7: 101–104.162. Tiggemann M, Anesbury T. Negative stereotyping of obesityin children: The role of controllability beliefs. J Appl Soc Psychol2000; 30: 1977–93.163. Brylinsky JA, Moore JC. The identification of body buildstereotypes in young children. J Res Pers 1994; 8: 170–181.164. Falkner NH, Neumark-Sztainer D, Story M, Jeffery RW,Beuhring T, Resnick MD. Social educational, and psychologicalcorrelates of weight status in adolescents. Obes Res 2001; 9: 32–42.165. Bell SK, Morgan SB. Children’s attitudes and behavioralintentions inward a peer presented as obese: Does a medical expla-nation for the obesity make a difference? J Pediatr Psychol 2000;25: 137–145.166. Richardson SA, Hastorf AH, Goodman N, Dornsbusch SM.Cultural uniformity in reaction to physical disabilities. Am SociolRev 1961; 202: 241–247.167. Latner J, Stunkard A. Schoolchildren, stigma, and obesity.Obes Res 2001; 9: 94S.168. Gortmaker SL, Must A, Perrin JM, Sobol AM, Dietz W.Social and economic consequences of overweight in adolescenceand young adulthood. N Engl J Med 1993; 329: 1008–1012.169. Sargent JD, Blanchflower DG. Obesity and stature in ado-lescence and earnings in young adulthood: Analysis of a Britishbirth cohort. Arch Pediatr Adol Med 1994; 148: 681–687.170. Karris L. Prejudice against obese renters. J Soc Psychol 1977;101: 159–160.171. Canning H, Mayer J. Obesity: Its possible effect on collegeacceptance. N Engl J Med 1966; 275: 1172–1174.172. Canning H, Mayer J. Obesity: An influence on high schoolperformance? Am J Clin Nutr 1967; 20: 352–354.173. Strauss RS. Friendship nominations in normal and over-weight youth. Data presented by Must A. International Congresson Obesity, Sao Paulo, Brazil, 30 August 2002.174. Strauss RS, Pollack HA. Social marginalization of over-weight children. Arch Pediatr Adolesc Med 2003; 157: 746–52.175. Phillips RG, Hill AJ. Fat, plain, but not friendless: Self-esteem and peer acceptance of obese pre-adolescent girls. Int JObes 1998; 22: 287–293.176. Bagwell CL, Newcomb AF, Bukowski WM. Preadolescentfriendship and peer rejection as predictors of adult adjustment.Child Dev 1998; 69: 140–153.177. French SA, Story M, Perry CL. Self-esteem and obesity inchildren and adolescents: a literature review. Obes Res 1995; 3:479–490.

obesity reviews Obesity in children and young people IASO 77
© 2004 The International Association for the Study of Obesity. obesity reviews 5 (Suppl. 1), 4–85
178. Kimm SYS, Barton BA, Berhane K, Ross JW, Payne GH,Schreiber GB. Self-esteem and adiposity in black and white girls:The NHLBI growth and health study. Ann Epidemiol 1997; 7:550–560.179. Strauss RS. Childhood obesity and self-esteem. Pediatrics2000; 105: e15.180. Robinson TN, Chang JY, Haydel KF, Killen JD. Overweightconcerns and body dissatisfaction among third-grade children: Theimpacts of ethnicity and socioeconomic status. J Pediatr 2001;138: 181–187.181. French SA, Perry CL, Leon GR, Fulkerson JA. Self-esteemand change in body mass index over 3 years in a cohort ofadolescents. Obes Res 1996; 4: 27–33.182. Pesa JA, Syre TR, Jones E. Psychosocial differences associ-ated with body weight among female adolescents: The importanceof body image. J Adolesc Health 2000; 26: 330–337.183. Renman C, Engstrom I, Silfverdal SA, Aman J. Mental healthand psychosocial characteristics in adolescent obesity: a popula-tion-based case-control study. Acta Paediatr 1999; 88: 998–1003.184. Braet C, Mervielde I, Vandereycken W. Psychologicalaspects of childhood obesity: a controlled study in a clinical andnonclinical sample. J Pediatr Psychol 1997; 22: 59–71.185. Erickson SJ, Robinson TN, Haydel KF, Killen JD. Are over-weight children unhappy? Body mass index, depressive symptoms,and overweight concerns in elementary school children. Arch Pedi-atr Adolesc Med 2000; 154: 931–935.186. Eisenberg ME, Neumark-Sztainer D, Story M. Associationsof weight-based teasing and emotional well-being among adoles-cents. Arch Pediatr Adolesc Med 2003; 157: 733–738.187. Thompson JK, Coovert MD, Richards KJ, Johnson S, Cat-tarin J. Development of body image, eating disturbance, and gen-eral psychological functioning in female adolescents: Covariancestructure modeling and longitudinal investigations. Int J Eat Dis-ord 1995; 18: 221–236.188. Goodman E, Whitaker RC. A prospective study of the roleof depression in the development and persistence of adolescentobesity. Pediatrics 2002; 110: 497–504.189. Neumark-Sztainer D, Story M, French SA, Hannan PJ,Resnick MD, Blum R. Psychosocial concerns and health-compro-mising behaviors among overweight and non-overweight adoles-cents. Obes Res 1997; 5: 237–249.190. Mustillo S, Worthman C, Erkanli A, Keeler G, Angold A,Costello EJ. Obesity and psychiatric disorder: developmental tra-jectories. Pediatrics 2003; 111: 851–859.191. Faith MS, Matz PE, Jorge MA. Obesity–depression associa-tions in the population. J Psychosom Res 2002; 52: 1–8.192. Friedman MA, Brownell KD. Psychological correlates ofobesity: Moving to the next research generation. Psychol Bull1995; 117: 3–20.193. Richardson LP, Davis R, Poulton R, McCauley E, MoffittTE, Caspi A, Connell F. A longitudinal evaluation of adolescentdepression and adult obesity. Arch Pediatr Adolesc Med 2003;157: 739–745.194. Brewis B. Biocultural aspects of obesity in young Mexicanschoolchildren. Am J Human Biol 2003; 15: 446–460.195. Hill AJ, Lissau I. Psychosocial factors. In: Burniat W, ColeT, Lissau I, Poskitt EME (eds). Child and Adolescent Obesity.Causes and Consequences; Prevention and Management. Cam-bridge University Press: Cambridge, 2002 pp 109–127.196. Brown TA, Cash TF, Lewis RJ. Body image disturbance inadolescent binge-purgers: a brief report of a national survey in theUSA. J Child Pyschol Pschiat 1989; 30: 605–613.197. Jolliffe D. Extent of overweight among US children andadolescents from 1971 to 2000. Int J Obes 2004; 28: 4–9.
198. Wang G, Dietz WH. Economic burden of obesity in youthsaged 6–17 years: 1979–1999. Pediatrics 2002; 109: E81–1.199. Must A, Spadano J, Coakley EH, Field AE, Colditz G, DietzWH. The disease burden associated with overweight and obesity.JAMA 1999; 282: 1523–1529.200. Field AE, Coakley EH, Must A, Spadano JL, Laird N, DietzWH, Rimm E, Colditz GA. Impact of overweight on the risk ofdeveloping common chronic diseases during a 10-year period.Arch Intern Med 2001; 161: 1581–1586.201. Eisenstein EL, Shaw LK, Nelson CL, Anstrom KJ, HakimZ, Mark DB. Obesity and long-term clinical and economic out-comes in coronary artery disease patients. Obes Res 2002; 10: 83–91.202. Narbro K, Jonsson E, Larsson B, Waaler H, Wedel H, Sjos-trom L. Economic consequences of sick-leave and early retirementin obese Swedish women. Int J Obes 1996; 20: 895–903.203. Segal L, McNeil H, Burns C. The Costs of Obesity: Intan-gible Costs. Report to IOTF Steering Group, document SG, vi-3C. IOTF: London, 15 October 1999.204. Schwimmer JB, Burwinkle TM, Varni JW. Health-relatedquality of life of severely obese children and adolescents. JAMA2003; 289: 1813–1819.205. Wabitsch M. Molecular and biological factors with emphasison adipose tissue development. In: Burniat W, Cole T, Lissau I,Poskitt EME (eds). Child and Adolescent Obesity. Causes andConsequences; Prevention and Management. Cambridge Univer-sity Press: Cambridge, 2002 pp 50–68.206. Stratz CH von. Der Körper des Kindes. Ferdinand Enke:Stuttgart, 1902 cited in Wabitsch M, 2002; op cit.207. Fomon SJ, Haschke F, Ziegler EE, Nelson SE. Body compo-sition of reference children from birth to age 10 years. Am J ClinNutr 1982; 35: 1169–1175.208. Widdowson EM. Changes in body proportions and compo-sition during growth. In: Davis JA, Dobbing J (eds). ScientificFoundations of Pediatrics. William Heineman Medical: London,1975 pp 153–163.209. McLaren DS. A fresh look at some perinatal growth andnutritional standards. World Rev Nutr Dietetics 1987; 49: 87–120.210. Hofbauer KG. Molecular pathways to obesity. Int J Obes2002; 26 (Suppl. 2): S18–S27.211. Wabitsch M, Hauner H, Heinze E, Teller W. The role ofGH/IGF in adipocyte differentiation. Metabolsim 1995; 44(Suppl.): 45–49.212. Waterlow JC. Protein-Energy Malnutrition, 2nd edn.Edward Arnold: London, 1992. [Cited by Rolland-Cachera M-F,Bellisle F. Nutrition. In: Burniat W, Cole T, Lissau I, Poskitt EME(eds). Child and Adolescent Obesity. Causes and Consequences;Prevention and Management. Cambridge University Press: Cam-bridge, 2002 pp 69–92.]213. Rolland-Cachera MF. Obesity among adolescents: evidencefor the importance of early nutrition. In: Johnston FE, Zemel B,Eveleth PB (eds). Human Growth in Context. Smith Gordon:London, 1999 pp 245–258.214. Parsons TJ, Power C, Logan S, Summerbell CD. Childhoodpredictors of adult obesity: a systematic review. Int J Obes 1999;23 (Suppl. 8): S1–S107.215. Curhan GC, Willett WC, Rimm EB, Spiegelman D, AscherioAL, Stampfer MJ. Birth weight and adult hypertension, diabetesmellitus, and obesity in US men. Circulation 1996; 94: 3246–3250.216. O’Callaghan MJ, Williams GM, Andersen MJ, Bor W, Naj-man JM. Prediction of obesity in children at 5 years: a cohortstudy. J Paediatr Child Health 1997; 33: 311–316.

78 Obesity in children and young people IASO obesity reviews
© 2004 The International Association for the Study of Obesity. obesity reviews 5 (Suppl. 1), 4–85
217. Sorensen HT, Sabroe S, Rothman KJ, Gillman M, FischerP, Sorensen TI. Relation between weight and length at birth andbody mass index in young adulthood: cohort study. BMJ 1997;315: 1137.218. Barker M, Robinson S, Osmond C, Barker DJ. Birth weightand body fat distribution in adolescent girls. Arch Dis Child 1997;77: 381–383.219. Stettler N, Zemel BS, Kumanyika S, Stallings VA. Infantweight gain and childhood overweight status in a multicenter,cohort study. Pediatrics 2002; 109: 194–199.220. Curhan GC, Chertow GM, Willett WC, Spiegelman D,Colditz GA, Manson JE, Speizer FE, Stampfer MJ. Birth weightand adult hypertension and obesity in women. Circulation 1996;94: 1310–1315.221. Maffeis C, Micciolo R, Must A, Zaffanello M, Pinelli L.Parental and perinatal factors associated with childhood obesityin north-east Italy. Int J Obes 1994; 18: 301–305.222. Parsons TJ, Power C, Manor O. Fetal and early life growthand body mass index from birth to early adulthood in 1958 Britishcohort: longitudinal study. BMJ 2001; 323: 1331–1335.223. Martorell R, Stein AD, Schroeder DG. Early nutrition andlater adiposity. J Nutr 2001; 131: 874S–880S.224. Seidman DS, Laor A, Gale R, Stevenson DK, Danon YL. Alongitudinal study of birth weight and being overweight in lateadolescence. Am J Dis Child 1991; 145: 782–785.225. Fall CH, Osmond C, Barker DJ, Clark PM, Hales CN,Stirling Y, Meade TW. Fetal and infant growth and cardiovascularrisk factors in women. BMJ 1995; 310: 428–432.226. Curhan GC, Chertow GM, Willett WC, Spiegelman D,Colditz GA, Manson JE, Speizer FE, Stampfer MJ. Birthweight and adult hypertension and obesity in women. Circula-tion 1996; 94: 1310–1315. [Cited in Martorell R et al. (2001)op cit.]227. Power C, Jefferis BJ. Fetal environment and subsequent obe-sity: a study of maternal smoking. Int J Epidemiol 2002; 31: 413–419.228. Ravelli AC, van Der M, Osmond C, Barker DJ, Bleker OP.Obesity at the age of 50 y in men and women exposed to famineprenatally. Am J Clin Nutr 1999; 70: 811–816.229. Whitaker RC, Dietz WH. Role of the prenatal environmentin the development of obesity. J Pediatr 1998; 132: 768–776.230. Ong KK, Ahmed ML, Emmett PM, Preece MA, Dunger DB.Association between postnatal catch-up growth and obesity inchildhood: prospective cohort study [published erratum appearsin BMJ 2000; 320: 1244]. BMJ 2000; 320: 967–971.231. Power C, Lake JK, Cole TJ. Body mass index and heightfrom childhood to adulthood in the 1958 British born cohort. AmJ Clin Nutr 1997; 66: 1094–1101.232. Post GB, Kemper HC. Nutrient intake and biological matu-ration during adolescence. The Amsterdam growth and healthlongitudinal study. Eur J Clin Nutr 1993; 47: 400–408.233. Forbes GB, Forbes GB. Human Body Composition. Growth,Aging, Nutrition, and Activity. Springer-Verlag: New York, 1987pp 1–350.234. Falkner F, Tanner JM. Human Growth. A ComprehensiveTreatise, 2nd edn. Plenum Press: New York, 1986.235. Amiel SA, Caprio S, Sherwin RS, Plewe G, Haymond MW,Tamborlane WV. Insulin resistance of puberty: a defect restrictedto peripheral glucose metabolism. J Clin Endocrinol Metab 1991;72: 277–282.236. Daniels SR, Khoury PR, Morrison JA. The utility of bodymass index as a measure of body fatness in children and adoles-cents: differences by race and gender. Pediatrics 1997; 99: 804–807.
237. Biro FM, McMahon RP, Striegel-Moore R, CrawfordPB, Obarzanek E, Morrison JA, Barton BA, Falkner F. Impactof timing of pubertal maturation on growth in black andwhite female adolescents: The National Heart, Lung, andBlood Institute Growth and Health Study. J Pediatr 2001;138: 636–643.238. Adair LS, Gordon-Larsen P. Maturational timing and over-weight prevalence in US adolescent girls. Am J Public Health 2001;91: 642–644.239. Wang Y, Adair L. How does maturity adjustment influencethe estimates of overweight prevalence in adolescents from differ-ent countries using an international reference? Int J Obes 2001;25: 550–558.240. Dietz WH. Critical periods in childhood for the developmentof obesity. Am J Clin Nutr 1994; 59: 955–959.241. Must A, Jacques PF, Dallel GE, Bajema CJ, Dietz WH. Long-term morbidity and mortality of overweight adolescents. NewEngl J Med 1992; 327: 1350–1355.242. Torún B. Energy Requirements of Children and Adolescents.Borrador No. 5, 2002. Prepared for an Expert Consulation, FAO/OMS/UNU. FAO: Rome, 2001.243. Lake JK, Power C, Cole TJ. Child to adult body mass indexin the 1958 British birth cohort: Associations with parental obe-sity. Arch Dis Child 1997; 77: 376–381.244. Garn SM, Bailey SM, Higgins IT. Fatness similarities inadopted pairs. Am J Clin Nutr 1976; 29: 1067–1068.245. Stunkard AJ, Foch TT, Hrubec Z. A twin study of humanobesity. JAMA 1986; 256: 51–54.246. Bouchard C, Tremblay A. Genetic influences on the responseof body fat and fat distribution to positive and negative energybalances in human identical twins. J Nutr 1997; 127 (Suppl. 5):943S–947S.247. Perusse L, Chagnon YC, Weisnagel J, Bouchard C. Thehuman obesity gene map: the 1998 update. Obes Res 1999; 7:111–129.248. Ravussin E, Valencia ME, Esparza J, Bennett PH, Schulz LO.Effects of a traditional lifestyle on obesity in Pima Indians. Dia-betes Care 1994; 17: 1067–1074.249. Popkin BM, Udry JR. Adolescent obesity increases signifi-cantly in second and thrid generation US immigrants: the NationalLongitudinal Study of Adolescent Health. J Nutr 1998; 128: 701–706.250. Davison KK, Birch LL. Childhood overweight: a contextualmodel and recommendations for future research. Obes Rev 2001;2: 159–171.251. Sallis JF, Patterson TL, McKenzie TL, Nader PR. Familyvariables and physical activity in preschool children. J Dev BehavPediatr 1988; 9: 57–61.252. Drewnowski A, Popkin BM. The nutrition transition: newtrends in the global diet. Nutr Rev 1997; 55: 31–43.253. Florencio TM, Ferreira HS, de Franca AP, Cavalcante JC,Sawaya AL. Obesity and undernutrition in a very-low-incomepopulation in the city of Maceio, northeastern Brazil. Br J Nutr2001; 86: 277–284.254. Popkin BM. The nutrition transition and its health implica-tions in lower-income countries. Public Health Nutr 1998; 1: 5–21.255. Holm VA, Cassidy SB, Butler MG, Hanchett JM, GreenswagLR, Whitman BY, Greenberg F. Prader–Willi syndrome: consensusdiagnostic criteria. Pediatrics 1993; 91: 398–402.256. Driscoll DJ, Myers MF, Williams CA, Zori RT, Glenn CC,Avidano KM, Nicholls RD. A DNA methylation imprint, deter-mined by the sex of the parent, distinguishes the Angelman andPrader–Willi syndromes. Genomics 1992; 13: 917–924.

obesity reviews Obesity in children and young people IASO 79
© 2004 The International Association for the Study of Obesity. obesity reviews 5 (Suppl. 1), 4–85
257. Ohta T, Gray TA, Rogan PK, Buiting K, Gabriel JM, SaitohS, Muralidhar B, Bilienska B, Krajewska-Walasek M, Driscoll DJ,Horsthemke B, Butler MG, Nicholls RD. Imprinting-mutationmechanisms in Prader–Willi syndrome. Am J Hum Genet 1999;64: 397–413.258. Weinstein LS, Chen M, Liu J. Gs(alpha) mutations andimprinting defects in human disease. Ann N Y Acad Sci 2002; 968:173–197.259. Rousseau F, Heitz D, Biancalana V, Blumenfeld S, Kretz C,Boue J, Tommerup N, Van Der Hagen C, Dehozier-Blanchet C,Croquette ME. Direct diagnosis by DNA analysis of the fragile Xsyndrome of mental retardation. N Engl J Med 1991; 325: 1673–1681.260. Katsanis N, Lupski JR, Beales PL. Exploring the molecularbasis of Bardet–Biedl syndrome. Hum Mol Genet 2001; 10: 2293–2299.261. Farooqi IS, Jebb SA, Langmack G, Lawrence E, CheethamCH, Prentice AM, Hughes IA, McCamish MA, O’Rahilly S.Effects of recombinant leptin therapy in a child with congenitalleptin deficiency. N Engl J Med 1999; 341: 879–884.262. Clement K, Vaisse C, Lahlou N, Cabrol S, Pelloux V, Cas-suto D, Gourmelen M, Dina C, Chambaz J, Lacorte JM, Basde-vant A, Bougneres P, Lebouc Y, Froguel P, Guy-Grand B. Amutation in the human leptin receptor gene causes obesity andpituitary dysfunction. Nature 1998; 392: 398–401.263. Krude H, Biebermann H, Luck W, Horn R, Brabant G,Gruters A. Severe early-onset obesity, adrenal insufficiency and redhair pigmentation caused by POMC mutations in humans. NatGenet 1998; 19: 155–157.264. Jackson RS, Creemers JW, Ohagi S, Raffin-Sanson ML,Sanders L, Montague CT, Hutton JC, O’Rahilly S. Obesity andimpaired prohormone processing associated with mutations in thehuman prohormone convertase 1 gene. Nat Genet 1997; 16: 303–306.265. Farooqi IS, Yeo GS, Keogh JM, Aminian S, Jebb SA, ButlerG, Cheetham T, O’Rahilly S. Dominant and recessive inheritanceof morbid obesity associated with melanocortin 4 receptor defi-ciency. J Clin Invest 2000; 106: 271–279.266. Carrel AL, Myers SE, Whitman BY, Allen DB. Growthhormone improves body composition, fat utilization, physicalstrength and agility, and growth in Prader–Willi syndrome: a con-trolled study. J Pediatr 1999; 134: 215–221.267. Farooqi IS, Matarese G, Lord GM, Keogh JM, Lawrence E,Agwu C, Sanna V, Jebb SA, Perna F, Fontana S, Lechler RI,DePaoli AM, O’Rahilly S. Beneficial effects of leptin on obesity,T cell hyporesponsiveness, and neuroendocrine/metabolic dysfunc-tion of human congenital leptin deficiency. J Clin Invest 2002;110: 1093–1103.268. Grylls WK, McKenzie JE, Horwath CC, Mann JI. Lifestylefactors associated with glycaemic control and body mass index inolder adults with diabetes. Eur J Clin Nutr 2003; 57: 1386–1393.269. von Eyben FE, Mouritsen E, Holm J, Montvilas P, Dim-cevski G, Suciu G, Helleberg I, Kristensen L, von Eyben R. Intra-abdominal obesity and metabolic risk factors: a study of youngadults. Int J Obes 2003; 27: 941–949.270. Bobes J, Rejas J, Garcia-Garcia M, Rico-Villademoros F,Garcia-Portilla MP, Fernandez I, Hernandez G. Weight gain inpatients with schizophrenia treated with risperidone, olanzapine,quetiapine or haloperidol: results of the EIRE study. Schizophr Res2003; 62: 77–88.271. Kramer JR, Loney J, Ponto LB, Roberts MA, Grossman S.Predictors of adult height and weight in boys treated with meth-ylphenidate for childhood behavior problems. J Am Acad ChildAdolesc Psychiatry 2000; 39: 517–524.
272. Covar RA, Leung DY, McCormick D, Steelman J, Zeitler P,Spahn JD. Risk factors associated with glucocorticoid-inducedadverse effects in children with severe asthma. J Allergy ClinImmunol 2000; 106: 651–659.273. Oeffinger KC, Mertens AC, Sklar CA, Yasui Y, Fears T,Stovall M, Vik TA, Inskip PD, Robison LL. Childhood CancerSurvivor Study. Obesity in adult survivors of childhood acutelymphoblastic leukemia: a report from the Childhood Cancer Sur-vivor Study. J Clin Oncol 2003; 21: 1359–1365.274. Lustig RH, Post SR, Srivannaboon K, Rose SR, Danish RK,Burghen GA, Xiong X, Wu S, Merchant TE. Risk factors for thedevelopment of obesity in children surviving brain tumors. J ClinEndocrinol Metab 2003; 88: 611–616.275. Ventham JC, Reilly JJ. Childhood leukaemia: a model of pre-obesity. Proc Nutr Soc 1999; 58: 277–281.276. Nysom K, Holm K, Michaelsen KF, Hertz H, Muller J,Molgaard C. Degree of fatness after treatment for acute lympho-blastic leukemia in childhood. J Clin Endocrinol Metab 1999; 84:4591–4596.277. Brussaard JH, van Erp-Baart MA, Brants HA, Hulshof KF,Lowik MR. Nutrition and health among migrants in The Nether-lands. Public Health Nutr 2001; 4: 659–664.278. Booth ML, Wake M, Armstrong T, Chey T, Hesketh K,Mathur S. The epidemiology of overweight and obesity amongAustralian children and adolescents, 1995–97. Aust N Z J PublicHealth 2001; 25: 162–169.279. Kaplowitz HJ, Wild KA, Mueller WH, Decker M, TannerJM. Serial and parent-child changes in components of body fatdistribution and fatness in children from the London LongitudinalGrowth Study, ages two to eighteen years. Hum Biol 1988; 60:739–758.280. Wang Y, Ge K, Popkin BM. Tracking of body mass indexfrom childhood to adolescence: a 6-y follow-up study in China.Am J Clin Nutr 2000; 72: 1018–1024.281. Davison KK, Birch LL. Obesigenic families: parents’ physicalactivity and dietary intake patterns predict girls’ risk of over-weight. Int J Obes 2002; 26: 1186–1193.282. Dabelea D, Hanson RL, Lindsay RS, Pettitt DJ, Impera-tore G, Gabir MM, Roumain J, Bennett PH, Knowler WC.Intrauterine exposure to diabetes conveys risks for type 2 diabe-tes and obesity: a study of discordant sibships. Diabetes 2000;49: 2208–2211.283. Silverman BL, Rizzo TA, Cho NH, Metzger BE. Long-termeffects of the intrauterine environment. Diabet Care 1998; 21(Suppl. 2): B142–B149.284. Srinivasan SR, Frontini MG, Berenson GS. Longitudinalchanges in risk variables of insulin resistance syndrome from child-hood to young adulthood in offspring of parents with type 2diabetes: the Bogalusa Heart Study. Metabolism 2003; 52: 443–450, discussion 451–453.285. Toschke AM, Koletzko B, Slikker W Jr, Hermann M, vonKries R. Childhood obesity is associated with maternal smokingin pregnancy. Eur J Pediatr 2002; 161: 445–448 [Epub. 28 June2002].286. von Kries R, Koletzko B, Sauerwald T, von Mutius E, Barn-ert D, Grunert V, von Voss H. Breast feeding and obesity: crosssectional study. BMJ 1999; 319: 147–150.287. Ravelli GP, Stein ZA, Susser MW. Obesity in young menafter famine exposure in utero and early infancy. N Engl J Med1976; 295: 349–353.288. Strauss RS. Effects of intrauterine environment on childhoodgrowth. Br Med Bull 1997; 53: 81–95.289. Whitaker RC, Dietz WH. Role of prenatal environment inthe development of obesity. J Pediatr 1998; 132: 768–776.

80 Obesity in children and young people IASO obesity reviews
© 2004 The International Association for the Study of Obesity. obesity reviews 5 (Suppl. 1), 4–85
290. Barker DJP, Eriksson JG, Forsen T, Osmond C. Fetal originsof adult disease: strength of effects and biological basis. Int JEpidemiol 2002; 31: 1235–1239.291. Bennett F, Watson-Brown C, Thame M, Wilks R, OsmondC, Hales NH, Barker D. Shortness at birth is associated withinsulin resistance in pre-pubertal Jamaican children. Eur J ClinNutr 2002; 56: 506–511.292. Yajnik C. Interactions of perturbations of intrauterinegrowth and growth during childhood on the risk of adult-onsetdisease. Proc Nutr Soc 2000; 59: 257–265.293. UNICEF Global Database on Malnutrition, updatedSeptember 2001 [http://www.childinfo.org/eddb/malnutrition/database2.htm] accessed July 2003.294. Sawaya AL, Dallal G, Solymos G, de Sousa MH, VenturaML, Roberts SB, Sigulem DM. Obesity and malnutrition in ashantytown in the city of Sao Paulo, Brazil. Obes Res 1995; 3(Suppl. 2): 107S–115S.295. Steyn K, Bourne L, Jooste P, Fourie JM, Rossouw K, Lom-bard C. Anthropometric profile of a black population in the CapePeninsula in South Africa. East Afr Med J 1998; 75: 35–40.296. Crooks DL. Child growth and nutritional status in a high-poverty community in eastern Kentucky. Am J Phys Anthropol1999; 109: 129–142.297. Walker SP, Gaskin PS, Powell CA, Bennett FI. The effects ofbirth weight and post natal linear growth retardation on bodymass index, fatness and fat distribution in mid and late childhood.Public Health Nutr 2002; 5: 391–396.298. Schroeder DG, Martorell R, Flores R. Infant and childgrowth and fatness and fat distribution in Guatemalan adults. AmJ Epidemiol 1999; 149: 177–185.299. Walker SP, Gaskin P, Powell CA, Bennett FI, Forrester TE,Grantham-McGregor S. The effects of birth weight and post natallinear growth retardation on blood pressure at age 11–12 years. JEpidemiol Community Health 2001; 55: 394–398.300. Branca F, Ferrari M. Impact of micronutrient deficiencies ongrowth: the stunting syndrome. Ann Nutr Metab 2002; 46 (Suppl.1): 8–17.301. Hoffman DJ, Sawaya AL, Coward WA, Wright A, MartinsPA, de Nascimento C, Tucker KL, Roberts SB. Energy expendi-ture of stunted and nonstunted boys and girls living in the shan-tytowns of Sao Paulo, Brazil. Am J Clin Nutr 2000; 72: 1025–1031.302. Sawaya AL, Grillo LP, Verreschi I, de Silva AC, Roberts SB.Mild stunting is associated with higher susceptibility to the effectsof high fat diets: studies in a shantytown population in Sao Paulo,Brazil. J Nutr 1998; 128 (Suppl. 2): 415S–420S.303. Hoffman DJ, Roberts SB, Verreschi I, Martins PA, de Nasci-mento C, Tucker KL, Sawaya AL. Regulation of energy intakemay be impaired in nutritionally stunted children from the shanty-towns of Sao Paulo, Brazil. J Nutr 2000; 130: 2265–2270.304. Uauy R, Kain J. The epidemiologic transition: the need toincorporate obesity prevention into nutrition programmes. PublicHealth Nutr 2002; 5: 223–229.305. Eriksson JG, Forsén T, Tuomilehto J, Osmond C, BarkerDJP. Early adiposity rebound in childhood and risk of type 2diabetes in adult life. Diabetologia 2003; 46: 190–194.306. Williams S, Dickson N. Early growth, menarche, and adi-posity rebound. Lancet 2002; 359: 580–581.307. Dorosty AR, Emmett PM, Cowin S, Reilly JJ. Factors asso-ciated with early adiposity rebound. ALSPAC Study Team. Pedi-atrics 2000; 105: 1115–1118.308. Whitaker RC, Pepe MS, Wright JA, Seidel KD, Dietz WH.Early adiposity rebound and the risk of adult obesity. Pediatrics1998; 101: E5.
309. Freedman DS, Kettel KL, Serdula M, Srinivasan S, BerensonG. BMI rebound, childhood height and obesity among adults: theBogalusa Heart Study. Int J Obes 2001; 25: 543–549.310. Freedman DS, Khan LK, Mei Z, Dietz WH, Srinivasan SR,Berenson GS. Relation of childhood height to obesity amongadults: the Bogalusa Heart Study. Pediatrics 2002; 109: E23.311. Hardy R, Wadsworth M, Kuh D. The influence of childhoodweight and socioeconomic status on change in adult body massindex in a British national birth cohort. Int J Obes 2000; 24: 725–734.312. Popkin B, Horton S, Kim S. The Nutrition Transition andPrevention of Diet-Related Chronic Diseases in Asia and thePacific. Asian Development Bank Nutrition and DevelopmentSeries No 6. Asian Development Bank: Manila, 2001.313. Uauy R, Albala C, Kain J. Obesity trends in Latin America:transiting from under- to overweight. J Nutr 2001; 131: 893–899.314. Lissau I, Sorensen TI. Parental neglect during childhood andincreased risk of obesity in young adulthood. Lancet 1994; 343:324–327.315. Hood MY, Moore LL, Sundarajan-Ramamurti A, Singer M,Cupples LA, Ellison RC. Parental eating attitudes and the devel-opment of obesity in children. The Framingham Children’s Study.Int J Obes 2000; 24: 1319–1325.316. Agras WS, Kraemer HC, Berkowitz RI, Hammer LD. Influ-ence of early feeding style on adiposity at 6 years of age. J Pediatr1990; 116: 805–809.317. Wells JC, Stanley M, Laidlaw AS, Day JM, Stafford M,Davies PS. Investigation of the relationship between infant tem-perament and later body composition. Int J Obes 1997; 21: 400–406.318. Carey WB, Hegvik RL, McDevitt SC. Temperamental fac-tors associated with rapid weight gain and obesity in middle child-hood. J Dev Behav Pediatr 1988; 9: 194–198.319. Klesges RC, Haddock CK, Stein RJ, Klesges LM, Eck LH,Hanson CL. Relationship between psychosocial functioning andbody fat in preschool children: a longitudinal investigation. J Con-sult Clin Psychol 1992; 60: 793–796.320. Van Lenthe FJ, Snel J, Twisk JWR, Van Mechelen W,Kemper HCG. Coping personality and the development of a cen-tral pattern of body fat from youth into young adulthood: TheAmsterdam Growth and Health Study. Int J Obes 1998; 22: 861–868.321. Guillaume M, Lissau I. Epidemiology. In: Burniat W, ColeT, Lissau I, Poskitt EME (eds). Child and Adolescent Obesity.Causes and Consequences; Prevention and Management. Cam-bridge University Press: Cambridge, 2002 pp 28–49.322. Mo-Suwan L, Geater AF. Risk factors for child obesity ina transitional society in Thailand. Int J Obes 1999; 23: 272–277.323. Teasdale TW, Sørensen TI, Stunkard AJ. Intelligence andeducational level in relation to body mass index of adult males.Hum Biol 1992; 64: 99–106.324. Cavadini C, Siega-Riz AM, Popkin BM. US adolescent foodintake trends from 1965 to 1996. Arch Dis Child 2000; 83: 18–24.325. Harnack LJ, Jeffery RW, Boutelle KN. Temporal trends inenergy intake in the United States: an ecologic perspective. Am JClin Nutr 2000; 71: 1478–1484.326. Gillman MW, Rifas-Shiman SL, Camargo CA Jr, Berkey CS,Frazier AL, Rockett HR, Field AE, Colditz GA. Risk of overweightamong adolescents who were breastfed as infants. JAMA 2001;285: 2461–2467.327. Armstrong J, Reilly JJ. Child Health Information Team.Breastfeeding and lowering the risk of childhood obesity. Lancet2002; 359: 2003–2004.

obesity reviews Obesity in children and young people IASO 81
© 2004 The International Association for the Study of Obesity. obesity reviews 5 (Suppl. 1), 4–85
328. Young TK, Martens PJ, Taback SP, Sellers EA, Dean HJ,Cheang M, Flett B. Type 2 diabetes mellitus in children: prenataland early infancy risk factors among native Canadians. Arch Pedi-atr Adolesc Med 2002; 156: 651–655.329. Poulton R, Williams S. Breastfeeding and risk of overweight.JAMA 2001; 286: 1449–1450.330. Hediger ML, Overpeck MD, Kuczmarski RJ, Ruan WJ.Association between infant breastfeeding and overweight in youngchildren. JAMA 2001; 285: 2453–2460.331. Wadsworth M, Marshall S, Hardy R, Paul A. Breast feedingand obesity. Relation may be accounted for by social factors. BMJ1999; 319: 1576.332. Butte NF. The role of breastfeeding in obesity. Pediatric ClinNorth Am 2001; 48: 189–198.333. Bergmann KE, Bergmann RL, Von Kries R, Bohm O, RichterR, Dudenhausen JW, Wahn U. Early determinants of childhoodoverweight and adiposity in a birth cohort study: role of breast-feeding. Int J Obes 2003; 27: 162–172.334. Li L, Parsons TJ, Power C. Breast feeding and obesity inchildhood: cross sectional study. BMJ 2003; 327: 904–905.335. Victoria CG, Barros FC, Lima RC, Horta BL, Wells J.Anthropometry and body composition of 18 year old men accord-ing to duration of breast feeding. birth cohort study from Brazil.BMJ 2003; 327: 901–904.336. Clifford TJ. Breast feeding and obesity. BMJ 2003; 327:879–880.337. Bowman SA, Gortmaker SL, Ebbeling CB, Pereira MA,Ludwig DS. Effects of fast-food consumption on energy intake anddiet quality among children in a national household survey. Pedi-atrics 2004; 113: 112–118.338. St-Onge MP, Keller KL, Heymsfield SB. Changes inchildhood food consumption patterns: a cause for concern inlight of increasing body weights. Am J Clin Nutr 2003; 78:1068–1073.339. Prentice AM, Jebb SA. Fast foods, energy density andobesity: a possible mechanistic link. Obes Rev 2003; 4: 187–194.340. Gregory J, Lowe S. National Diet and Nutritional Survey:Young People Aged 4–18 Years, Vol. 1: Report of the Diet andNutrition Survey. The Stationery Office: London, 2000.341. Maffeis C, Pinelli L, Schultz Y. Fat intake and adiposity in8–11-year-old obese children. Int J Obes 1996; 20: 170–174.342. McGloin AF, Livingstone MBE, Greene LC, Webb SE, Gib-son JMA, Jebb SA, Cole TJ, Coward WA, Wright A, Preatice AM.Energy and fat intake in obese and lean children at varying riskof obesity. Int J Obes 2002; 26: 200–207.343. Guillaume M, Lapidus L, Lambert A. Obesity and nutritionin children. The Belgian Luxembourg Child Study IV. Eur J ClinNutr 1998; 52: 323–328.344. Tucker LA, Seljaas GT, Hager RL. Body fat percentage ofchildren varies according to their diet. J Am Diet Assoc 1997; 97:981–986.345. Magarey AM, Daniels LA, Bouton TJC, Cockington RA.Does fat intake predict adiposity in healthy children and adoles-cents aged 2–15y? A longitudinal analysis. Eur J Clin Nutr 2001;55: 471–481.346. Robertson SM, Cullen KW, Baronowski J, Baronowski T,Shaouhua H, de Moor C. Factors related to adiposity amongchildren aged 3–7y. J Am Diet Assoc 1999; 99: 939–943.347. Maffeis C, Talamini G, Tato L. Influence of diet, physicalactivity and parent’s obesity on children’s adiposity: a four-yearlongitudinal study. Int J Obes 1998; 22: 758–764.348. Rolland-Cachera MF, Deheeger M, Akrout M, Bellisle F.Influence of macronutrients on adiposity development: a follow-
up study of nutrition and growth from 10 months to 8 years ofage. Int J Obes 1995; 19: 573–578.349. Gibson SA. Associations between energy density and macro-nutrient composition in the diets of pre-school children: sugar vsstarch. Int J Obes 2000; 24: 633–638.350. Nicklas TA, Webber LS, Srinivasan SR, Berenson GS. Seculartrends in dietary intakes and cardiovascular risk factors of 10-year,-old children: The Bogalusa Heart Study (1983–1988). Am J ClinNutr 1993; 57: 930–937.351. Prynne CJ, Paul AA, Price GM, Day KC, Hilder WS, Wad-sworth ME. Food and nutrient intake of a national sample of 4-year-old children in 1950: comparison with the 1990s. PublicHealth Nutr 1999; 2: 537–547.352. Ludwig DS, Peterson KE, Gortmaker SL. Relation betweenconsumption of sugar-sweetened drinks and childhood obesity: aprospective, observational analysis. Lancet 2001; 357: 505–508.353. Raben A, Vasilaras TH, Moller AC, Astrup A. Sucrose com-pared with artifical sweetners: different effects on ad libitum foodintake and body weight after 10 wk of supplementation in over-weight subjects. Am J Clin Nutr 2002; 76: 721–729.354. Wilson JF. Lunch eating behavior of preschool children.Effects of age, gender, and type of beverage served. Physiol Behav2000; 70: 27–33.355. Jahns L, Siega-Riz AM, Popkin BM. The increasing preva-lence of snacking among US children from 1977 to 1996. J Pediatr2001; 138: 493–498.356. Marmonier C, Chapelot D, Louis-Sylvestre J. Metabolic andbehavioural consequences of a snack consumed in a satiety state.Am J Clin Nutr 1999; 70: 854–866.357. Marmonier C, Chapelot D, Louis-Sylvestre J. Effect ofmacronutrient content and energy density of sncaks consumed ina satiety state on the onset of the next meal. Appetite 2000; 34:161–168.358. Marmonier C, Chapelot D, Fantino M, Louis-Sylvestre J.Snacks consumed in a non-hungry state have poor satiating effi-ciency: influence of snack consumption on substrate utilizationand hunger. Am J Clin Nutr 2002; 76: 518–528.359. Barkeling B, Andersson I, Lindroos AK, Birkhed D, RossnerS. Intake of sweet foods and counts of cariogenic microorganismsin obese and normal-weight women. Eur J Clin Nutr 2001; 55:850–855.360. Johnstone AM, Shannon E, Whybrow S, Reid CA, StubbsRJ. Altering the temporal distribution of energy intake with isoen-ergetically dense foods given as snacks does not affect total dailyenergy intake in normal-weight men. Br J Nutr 2000; 83: 7–14.361. Blair AJ. When are calories most fattening? Appetite 1991;17: 161.362. Takahashi E, Yoshida K, Sugimori H, Miyakawa M, IzunoT, Yamagami T, Kagamimori S. Influence factors on the develop-ment of obesity in 3-year-old children based on the Toyama study.Prev Med 1999; 28: 293–296.363. Wolfe WS, Campbell CC, Frongillo EA Jr, Haas JD, MelnikTA. Overweight schoolchildren in New York State: prevalence andcharacteristics. Am J Public Health 1994; 84: 807–813.364. Siega-Riz AM, Popkin BM, Carson T. Trends in breakfastconsumption for children in the United States from 1965 to 1991.Am J Clin Nutr 1998; 67: 748S–756S.365. Ma Y, Bertone ER, Stanek EJ 3rd, Reed GW, Hebert JR,Cohen NL, Merriam PA, Ockene IS. Association between eatingpatterns and obesity in a free-living US adult population. Am JEpidemiol 2003; 158: 85–92.366. Young LR, Nestle M. The contribution of expanding portionsizes to the US obesity epidemic. Am J Public Health 2002; 92:246–249.

82 Obesity in children and young people IASO obesity reviews
© 2004 The International Association for the Study of Obesity. obesity reviews 5 (Suppl. 1), 4–85
367. Rolls BJ, Engell D, Birch LL. Serving portion size influences5 year old but not 3 year old children’s food intakes. J Am DietAssoc 2000; 100: 232–237.368. McConahy KL, Smiciklas-Wright H, Birch LL, Mitchell DC,Picciano MF. Food portions are positively related to energy intakeand body weight in early childhood. J Pediatr 2002; 140: 340–347.369. DiGuiseppi C, Roberts I, Li L. Influence of changing travelpatterns on child death rates from injury: trend analysis [publishederratum appears in BMJ 1997; 314: 1385]. BMJ 1997; 314: 710–713.370. U.S. Department of Transportation, Federal HighwayAdministration, Research and Technical Support Center. Nation-wide Personal Transportation Survey. Federal Highway Adminis-tration: Lantham, MD, 1997.371. Prescott-Clarke P, Primatesta P. Health Survey for England:the Health of Young People ’95–97. The Stationary Office: Lon-don, 1998.372. Berkey CS, Rockett HR, Field AE, Gillman MW, Frazier AL,Camargo CA Jr, Colditz GA. Activity dietary intake, and weightchanges in a longitudinal study of preadolescent and adolescentboys and girls. Pediatrics 2000; 105: E56.373. O’Loughlin J, Gray-Donald K, Paradis G, Meshefedjian G.One- and two-year predictors of excess weight gain among ele-mentary schoolchildren in multiethnic, low-income, inner-cityneighborhoods. Am J Epidemiol 2000; 152: 739–746.374. Kimm SY, Barton BA, Obarzanek E, McMahon RP, SabryZI, Waclawiw MA, Schreiber GB, Morrison JA, Similo S, DanielsSR. Racial divergence in adiposity during adolescence: the NHLBIgrowth and health study. Pediatrics 2001; 107: E34.375. Robinson TN, Hammer LD, Killen JD, Kraemer HC, WilsonDM, Hayward C, Taylor CB. Does television viewing increaseobesity and reduce physical activity? Cross-sectional and longitu-dinal analyses among adolescent girls. Pediatrics 1993; 91: 273–280.376. Dietz WH Jr, Gortmaker SL. Do we fatten our children atthe television set? Obesity and television viewing in children andadolescents. Pediatrics 1985; 75: 807–812.377. Wake M, Hesketh K, Waters E. Television computer use andbody mass index in Australian primary school children. J PaediatrChild Health 2003; 39: 130–134.378. Hernandez B, Gortmaker SL, Colditz GA, Peterson KE,Laird NM, Parra-Cabrera S. Association of obesity with physicalactivity, television programmes and other forms of video viewingamong children in Mexico city. Int J Obes 1999; 23: 845–854.379. Ruangdaraganon N, Kotchabhakdi N, Udomsubpayakul U,Kunanusont C, Suriyawongpaisal P. The association between tele-vision viewing and childhood obesity: a national survey in Thai-land. J Med Assoc Thai 2002; 85 (Suppl. 4): S1075–S1080.380. Krassas GE, Tzotzas T, Tsametis C, Konstantinidis T. Deter-minants of body mass index in Greek children and adolescents. JPediatr Endocrinol Metab 2001; 14 (Suppl. 5): 1327–1333.381. Hanley AJ, Harris SB, Gittelsohn J, Wolever TM, Saksvig B,Zinman B. Overweight among children and adolescents in aNative Canadian community: prevalence and associated factors.Am J Clin Nutr 2000; 71: 693–700.382. Gortmaker SL, Must A, Sobol AM, Peterson K, Colditz GA,Dietz WH. Television viewing as a cause of increasing obesityamong children in the United States, 1986–90. Arch Pediatr Ado-lesc Med 1996; 150: 356–362.383. Wiecha JL, Sobol AM, Peterson GE, Gortmaker SL.Household television access: Associations with screen time, read-ing and homework among youth. Ambulatory Pediatr 2001; 1:244–251.
384. Taras HL, Gage M. Advertised foods on children’s television.Arch Pediatr Adolesc Med 1995; 149: 649–652.385. Borzekowski DL, Robinson TN. The 30-second effect: anexperiment revealing the impact of television commercials on foodpreferences of preschoolers. J Am Diet Assoc 2001; 101: 42–46.386. Dietz WH. The obesity epidemic in young children: Reducetelevision viewing and promote playing. BMJ 2001; 322: 313–314.387. Coon KA, Tucker KL. Television and children’s consumptionpatterns. A review of the literature. Minerva Pediatr 2002; 54:423–436.388. Shannon B, Peacock J, Brown MJ. Body fatness, televisionviewing and calorie intake in a sample of Pennsylvania sixth gradechildren. J Nutr 1991; 23: 262–268.389. Summerbell C, Ashton V, Campbell K, Edmunds L, Kelly S,Waters E. Interventions for treating obesity in children. CochraneDatabase Syst Rev 2003; 3: CD001872.390. Knip M, Nuutinen O. Long-term effects of weight reductionon serum lipids and plasma insulin in obese children. Am J ClinNutr 1993; 57: 490–493.391. Federation of International Societies for Paediatric Gastro-enterology Hepatology and Nutrition [http://www.fispghan.org].392. Blum RW, Garell D, Hodgman CH, Jorissen TW, OkinowNA, Orr DP, Slap GB. Transition from child-centred to adulthealth-care systems for adolescents with chronic conditions: aposition paper of the society for adolescent medicine. J AdolescentHealth 1993; 14: 570–576.393. Oppong-Odiseng ACK, Heycock EJ. Adolescent health ser-vices – through their own eyes. Arch Dis Child 1997; 77: 115–119.394. Caroli M, Burniat W. Dietary management. In: BurniatW, Cole T, Lissau I, Poskitt EME (eds). Child and AdolescentObesity. Causes and Consequences; Prevention and Manage-ment. Cambridge University Press: Cambridge, 2002 pp 282–306.395. Epstein LH. Methodological issues and ten-year outcomesfor obese children. Ann NY Acad Sci 1993; 669: 237–249.396. Robinson TN. Television viewing and childhood obesity.Pediatr Clin North Am 2001; 48: 1017–1025.397. Epstein LH, Roemmich JN. Reducing sedentary behavior:role in modifying physical activity. Exerc Sport Sci Rev 2001; 29:103–108.398. Epstein LH, Koeske R, Wing RR. Adherence to exercise inobese children. J Cardiac Rehab 1983; 4: 185–189.399. Epstein LH, Wing RR, Koeske R, Ossip D, Beck S. A com-parison of lifestyle change and programmed exercise on weightand fitness changes in obese children. Behav Ther 1982; 13: 651–665.400. Bracco MM, Rocha-Ferreira MB, Morcillo AM, ColugnatiF, Jenovesi J. Energy expenditure among obese and non-obesechildren of public school. Rev Bras Cien e Mov 2002; 10: 29–35.401. Haymes EM, McCormick RJ, Buskirk ER. Heat toleranceof exercising lean and obese prepubertal boys. J Appl Physiol1975; 39: 457–461.402. Salvatoni A. Surgical treatment. In: Burniat W, Cole T,Lissau I, Poskitt EME (eds). Child and Adolescent Obesity. Causesand Consequences; Prevention and Management. Cambridge Uni-versity Press: Cambridge, 2002 pp 355–360.403. Molnár D, Malecka-Tendera E. Drug therapy. In: BurniatW, Cole T, Lissau I, Poskitt EME (eds). Child and AdolescentObesity. Causes and Consequences; Prevention and Management.Cambridge University Press: Cambridge, 2002 pp 345–354.404. Berkowitz RI, Wadden TA, Tershakovec AM, Cronquist JL.Behavior therapy and sibutramine for the treatment of adolescentobesity. JAMA 2003; 289: 1805–1812.

obesity reviews Obesity in children and young people IASO 83
© 2004 The International Association for the Study of Obesity. obesity reviews 5 (Suppl. 1), 4–85
405. Davies PSW, Evans S, Broomhead S, Clough H, Day JME,Laidlaw A, Barnes ND. Effect of growth hormone on height,weight and body composition in Prader–Willi syndrome. Arch DisChild 1998; 78: 474–476.406. Nuutinen O, Knip M. Predictors of weight reduction inobese children. Eur J Clin Nutr 1992; 46: 785–794.407. Epstein LH, Valoski A, Wing RR, McCurley J. Ten-yearfollow-up of behavioural, family-based treatment for obese chil-dren. JAMA 1990; 264: 2519–2523.408. Golan M, Weizman A, Apter A, Fainaru M. Parents as theexclusive agents of change in the treatment of childhood obesity.Am J Clin Nutr 1998; 67: 1130–1135.409. Baughcum AE, Chamberlin LA, Deeks CM, Powers SW,Whitaker RC. Maternal perceptions of overweight pre-schoolers.Pediatrics 2000; 106: 1380–1386.410. Wake M, Salmon L, Waters E, Wright M, Hesketh K. Parent-reported health status of overweight and obese Australian primaryschool children: a cross-sectional population survey. Int J Obes2002; 26: 717–724.411. Brownell KD, Kelman JH, Stunkard AJ. Treatment of obesechildren with and without their mothers: Changes in weight andblood pressure. Pediatrics 1993; 71: 515–523.412. Mellin LM, Slinkard LA, Irwin CE. Adolescent obesity inter-vention: validation of the SHAPEDOWN programme. J Am DietAssoc 1987; 87: 333–338.413. Saelens BE, Sallis JF, Wilfley DE, Patrick K, Cella JA, BuchtaR. Behavioral weight control for overweight adolescents initiatedin primary care. Obes Res 2002; 10: 22–32.414. Flodmark C-E, Lissau I. Psychotherapy. In: Burniat W,Cole T, Lissau I, Poskitt EME (eds). Child and AdolescentObesity. Causes and Consequences; Prevention and Manage-ment. Cambridge University Press: Cambridge, 2002 pp 327–344.415. Frelut M-L. Interdisciplinary residential treatment. In: Bur-niat W, Cole T, Lissau I, Poskitt EME (eds). Child and Adoles-cent Obesity. Causes and Consequences; Prevention andManagement. Cambridge University Press: Cambridge, 2002 pp377–388.416. Dietz WH. Health consequences of obesity in youth: childpredictors of adult disease. Pediatrics 1998; 101: 518–524.417. Williams CL, Campanaro LA, Squillace M, Bollella M.Management of childhood obesity in pediatric practice. Ann NYAcad Sci 1997; 817: 225–240.418. Pena M, Bacallao J, Barta L, Amador M, Johnston FE. Fiberand exercise in the treatment of obese adolescents. J AdolescHealth Care 1989; 10: 30–34.419. Archibald EH, Harrison J, Pencharz P. Body compositionchanges in obese adolescents on a protein sparing modified fast.Ped Res 1981; 15: 440–445.420. Dietz WH, Schoeller DA. Optimal dietary therapy for obeseadolescents: Comparison of protein plus glucose and protein plusfat. J Pediatrics 1982; 100: 638–644.421. Endo H, Takagi Y, Nozue T, Kuwahata K, Uemasu F,Kobayashi A. Beneficial effects of dietary intervention on serumlipid and Apolipoprotein levels in obese children. Am J Dis Child1992; 146: 651–665.422. Stallings VA, Archibald EH, Pencharz PB, Harrison JE, BellLE. Potassium magnesium and calcium balance in obese adoles-cents on a protein-sparing modified fast. Am J Clin Nutr 1988;47: 220–224.423. Brown MR, Klisy WJ, Hollander J, Campbell MA, ForbesGB. A high protein, low calorie liquid diet in the treatment of veryobese adolescents: long-term effect on lean body mass. Am J Clin.Nutr 1983; 38: 20–31.
424. Hoffman RP, Stumbo PJE, Janz KF, Nielsen DH. Alteredinsulin resistance is associated with increased dietary weight lossin obese children. Hormone Res 1995; 44: 17–22.425. Nichols JF, Bigelow DM, Canine KM. Short term weightloss and exercise training effects on glucose-induced thermogener-sis in obese adolescent males during hypocaloric feeding. Int JObes 1989; 13: 683–690.426. Rohrbacher R. Influence of a special camp programme forobese boys on weight loss, self-concept and body image. ResQuarterly 1973; 44: 150–157.427. Gately PJ, Cooke CB, Butterly RJ, Mackreth P, Carroll S.The effects of a children’s summer camp programme on weightloss with a 10-month follow up. Int J Obes 2000; 24: 1445–1452.428. Braet C, Van Winckel M. Long-term follow-up of a cognitivebehavioral treatment programme for obese children. BehaviorTherapy 2000; 31: 55–74.429. Glenny A-M, O’Meara S, Sheldon TA, Wilson C. The treat-ment and prevention of obesity: a systematic review of the litera-ture. Int J Obes 1997; 21: 715–737.430. Epstein LH, Myers MD, Raynor HA, Saelens BE. Treatmentof pediatric obesity. Pediatrics 1998; 101: 554–570.431. Cash R, Keusch GT, Lamstein J. Child Health and Survival:the UNICEF GOBI-FFF Programme. Croom-Helm: Kent, UK,1987.432. Kibel MA, Wagstaff LA. Child Health for All: a Manual forSouthern Africa. Oxford University Press: Cape Town, 1995.433. Clements A. Infant and Family Health in Australia: a Text-book for Community Health Workers, 2nd edn. Churchill Living-stone: Melbourne, 1992.434. Harvey D, Miles M, Smyth D (eds). Community ChildHealth and Paediatrics. Butterworth Heinemann: Oxford, 1995.435. Elster AB, Kuznets NJ. AMA Guidelines for Adolescent Pre-ventive Services (GAPS). Recommendations and Rationale. Amer-ican Medical Association: Illinois, 1994.436. Feldman W, Beagan BL. Screening for childhood obesity. In:Canadian Guide to Clinical Health Care. Canadian Task Force onthe Periodic Health Examination. Health Canada: Ottawa, 1994pp 334–344 [http://www.ctfphc.org/Full_Text_printable/Ch30full.htm].437. Beatty LA, Sigmon FL Jr. Well child care. In: Sloane PD,Slatt LM, Curtis P (eds). Essentials of Family Medicine, 2nd edn.Williams & Wilkin: Baltimore, 1993 pp 131–139.438. Farmer RDT, Miller DL. Lecture Notes on Epidemiologyand Community Medicine, 2nd edn. Blackwell Scientific Publica-tions: Oxford, 1983.439. NHS Centre for Reviews and Dissemination. Effective healthcare. The prevention and treatment of childhood obesity. Univer-sity of York Bulletin 2002; 7: 1–12.440. Pavlovic M. Monitoring model of nutritional status of chi-dren in Serbia: and example in the North Backa Regon. In: Pav-lovic M (ed). Nutritional Status of Children, Monographs. PublicHealth Institute: Subotica, 2002 pp 71–92.441. Jelliffe DB (ed). Child Health in the Tropics: a PracticalHandbook for Health Personnel, 5th edn. Edward Arnold: Lon-don, 1985.442. Ong BP. Evaluation of Obesity Clinic Programme for Sin-gapore Obese School Children. Dissertation submitted for theDegree of Master of Science (Public Health), National Universityof Singapore: Singapore, 1988.443. Hui LL, Nelson EA, Yu LM, Li AM, Fok TF. Risk factorsfor childhood overweight in 6- to 7-year-old Hong Kong children.Int J Obes 2003; 27: 1141–1148.444. Ebbeling CB, Rodriguez NR. Anthropometric techniques foridentification of obese children. In: Dalton S (ed). Overweight and

84 Obesity in children and young people IASO obesity reviews
© 2004 The International Association for the Study of Obesity. obesity reviews 5 (Suppl. 1), 4–85
Weight Management. The Health Professional’s Guide to Under-standing and Practice. ASPEN: Maryland, 1997 pp 486–496.445. Norton K, Olds T (eds). Anthropometrica. A Textbook ofBody Measurement for Sports and Health Courses. UNSW Press:Sydney, 2002.446. Implementing clinical practice guidelines: Can guidelines beused to improve clinical practice? Effective Health Care 1994; 1(Suppl. 8): 1–12.447. Barlow SE, Dietz WH. Obesity evaluation and treatment:Expert Committee recommendations. The Maternal and ChildHealth Bureau, Health Resources and Services Administration andthe Department of Health and Human Services. Pediatrics 1998;102: E29.448. INSERM. Obesité dépistage et prévention chez l’enfant. Edi-tions Inserm 2000; 1: 1–325. An English synopsis is available atthe INSERM website [http://www.inserm.fr ].449. Irving LM, Neumark-Sztainer D. Integrating the preventionof eating disorders and obesity: feasible or futile? Preventive Med2002; 34: 299–309.450. Harvey EL, Glenny A, Kirk SF, Summerbell CD. Improvinghealth professionals’ management and the organisation of care foroverweight and obese people. Cochrane Database Syst Rev 2001;2: CD000984.451. Nova ARA, Sala E. Long-term management of obesity inpaediatric office practice: experimental evaluation of two differenttypes of intervention. Ambulatory Child Health 2001; 7: 239–248.452. Lissau I, Burniat W, Poskitt EME, Cole T. Prevention. In:Burniat W, Cole T, Lissau I, Poskitt EME (eds). Child and Ado-lescent Obesity. Causes and Consequences; Prevention and Man-agement. Cambridge University Press: Cambridge, 2002 pp 243–269.453. Dietz WH, Gortmaker SL. Preventing obesity in children andadolescents. Ann Rev Public Health 2001; 22: 337–353.454. Dietz WH, Bland MG, Gortmaker SL, Molloy M, SchmidTL. Policy tools for the childhood obesity epidemic. J Law MedEthics 2002; 30 (Suppl. 3): 83–87.455. Garrow J. Importance of obesity. BMJ 1991; 303: 704–706.456. Neumark-Sztainer D, Story M. Recommendations fromoverweight youth regarding school-based weight control pro-grammes. J Sch Health 1997; 67: 428–433.457. Neumark-Sztainer D, Story M, Perry C, Casey MA. Fac-tors influencing food choices of adolescents: findings from focus-group discussions with adolescents. J Am Diet Assoc 1999; 99:929–937.458. WHO. World Health Organization Global School HealthInitiative, Fact Sheet No. 92. World Health Organization: Geneva.Revised June 1998 [http://www.who.int/inf-fs/en/fact092.html].459. Sahota P, Rudolf MC, Dixey R, Hill AJ, Barth JH, CadeJ. Randomised controlled trial of primary school based interven-tion to reduce risk factors for obesity. BMJ 2001; 323: 1029–1032.460. Sahota P, Rudolf MC, Dixey R, Hill AJ, Barth JH, Cade J.Evaluation of implementation and effect of primary school basedintervention to reduce risk factors for obesity. BMJ 2001; 323:1027–1029.461. Toh CM, Cutter J, Chew SK. School based intervention hasreduced obesity in Singapore. BMJ 2002; 324: 427.462. Singapore Ministry of Health. The State of Health 2001. TheReport of the Director of Medical Services Singapore. Ministry ofHealth: Singapore, 2002 p 35 [http://www.moh.gov.sg/newmoh/pdf/pub/health_report.pdf].463. Singapore Ministry of Health. National Health Survey 1998.Ministry of Health: Singapore, 1999 [http://www.moh.gov.sg/new-moh/pdf/pub/nhs.pdf].
464. Mamalakis G, Kafatos A, Manios Y, Anagnostopoulou T,Apostolaki I. Obesity indices in a cohort of primary school chil-dren in Crete: a six year prospective study. Int J Obes 2000; 24:765–771.465. French SA, Story M, Jeffery RW, Snyder P, Eisenberg M,Sidebottom A, Murray D. Pricing strategy to promote fruit andvegetable purchase in high school cafeterias. J Am Diet Assoc1997; 97: 1008–1010.466. French SA. Pricing effects on food choices. J Nutr 2003; 133:841S–843S.467. Hannan P, French SA, Story M, Fulkerson JA. A pricingstrategy to promote sales of lower fat foods in high school cafete-rias: acceptability and sensitivity analysis. Am J Health Promot2002; 17: 1–6.468. French SA, Jeffery RW, Story M, Breitlow KK, Baxter JS,Hannan P, Snyder MP. Pricing and promotion effects on low-fatvending snack purchases: the CHIPS Study. Am J Public Health2001; 91: 112–117.469. French SA, Jeffery RW, Story M, Hannan P, Snyder MP. Apricing strategy to promote low-fat snack choices through vendingmachines. Am J Public Health 1997; 87: 849–851.470. Robinson TN. Reducing children’s television viewing to pre-vent obesity: a randomized controlled trial. JAMA 1999; 282:1561–1567.471. Robinson TN. Can a school-based intervention to reducetelevision use decrease adiposity in children in grades 3 and 4?West J Med 2000; 173: 40.472. Matsudo V, Matsudo S, Andrade D, Araujo T, Andrade E,de Oliveira LC, Braggion G. Promotion of physical activity in adeveloping country: the Agita Sao Paulo experience. Public HealthNutr 2002; 5: 253–261.473. Centers for Disease Control and Prevention. Guidelines forschool health programmes to promote lifelong healthy eating.Morbidity & Mortality Weekly Report 1996; 45 (RR-9): 1–41.474. Centers for Disease Control and Prevention. Guidelines forschool and community programmes to promote lifelong physicalactivity among young people. Morbidity & Mortality WeeklyReport 1997; 46 (RR-6): 1–36.475. Charles MA Personal communication (Institut National dela Santé et de la Recherche Médicale, Paris) on 8 April 2003, basedon the Fleurbaix-Laventie Ville Santé Study.476. Gortmaker SL, Peterson K, Wiecha J, Sobol AM, Dixit S,Fox MK, Laird N. Reducing obesity via a school-based interdis-ciplinary intervention among youth: Planet Health. Arch PediatrAdolesc Med 1999; 153: 409–418.477. Micucci S, Thomas H, Vohra J. The Effectiveness of School-Based Strategies for the Primary Prevention of Obesity and forPromoting Physical Activity and/or Nutrition, the Major Modifi-able Risk Factors for Type 2 Diabetes: a Review of Reviews. PublicHealth Research, Education and Development Programme; Effec-tive Public Health Practice Project: Hamilton, Ontario, 2002.478. Dobbins M, Lockett D, Michel I, Beyers J, Feldman L, VohraJ, Micucci S. The Effectiveness of School-Based Interventions inPromoting Physical Activity and Fitness Among Children andYouth: a Systematic Review. Public Health Research, Educationand Development Programme; Effective Public Health PracticeProject: Hamilton, Ontario, 2001.479. Lytle LA, Jacobs DR, Perry CL, Klepp K-I. Achievingphysiological change in school-based intervention trials: whatmakes a preventive intervention successful? Br J Nutr 2002; 88:219–221.480. Richter KP, Harris KJ, Paine-Andrews A, Fawcett SB,Schmid TL, Lankenau BH, Johnston J. Measuring the healthenvironment for physical activity and nutrition among youth: a

obesity reviews Obesity in children and young people IASO 85
© 2004 The International Association for the Study of Obesity. obesity reviews 5 (Suppl. 1), 4–85
review of the literature and applications for community initiatives.Preventive Medicine 2000; 31: S98–S111.481. World Health Organization. Health Impact AssessmentMethods and Strategies. World Health Organization RegionalOffice for Europe: Copenhagen, [http://www.euro.who.int/health-impact] accessed March 2004.482. World Health Organization. Community participation inlocal health and sustainable development: Approaches and tech-niques. In: European Sustainable Development and Health Series:4: 1–94. World Health Organization Regional Office for Europe:Copenhagen, 1999.483. Pietinen P, Nissinen A, Vartiainen E, Tuomilehto A, UusitaloU, Ketola A, Moisio S, Puska P. Dietary changes in the NorthKarelia Project (1972–82). Prev Med 1988; 17: 183–193.484. US Department of Health and Human Services. The SurgeonGeneral’s Call to Action to Prevent and Decrease Overweight andObesity. Office of the Surgeon General, US Department of ofHealth and Human Services: Rockville, MD, 2001.485. Cockerham, WC, Rütten, A, Abel, T. Conceptualizing con-temporary health lifestyles. Moving beyond Weber. Sociol Q1997; 38: 321–342.
486. Nestle M, Jacobson MF. Halting the obesity epidemic. Apublic health policy approach. Public Health Rep 2000; 115: 12–24.487. French SA, Story M, Jeffery RW. Environmental influenceson eating and physical activity. Ann Rev Public Health 2001; 22:309–335.488. Economos CD, Brownson RC, DeAngelis MA, Foerster SB,Foreman CT, Gregson J, Kumanyika SK, Pate RR. What lessonshave been learned from other attempts to guide social change?Nutr Rev 2001; 59: S40–S56.489. American Academy of Pediatrics Committee on SchoolHealth. Policy statement: soft drinks in schools. Pediatrics 2004;113: 152–154.490. Nestle M. Food Politics. How the Food Industry InfluencesNutrition and Health. University of California Press: Berkely, CA,2002.491. World Health Organization. World Health Assembly AgendaItem A55/16. WHO: Geneva, 2002.