obesity as a national health priority area -...
TRANSCRIPT

www.co-ops.net.au
Katie Lacy, PhD
Mulgrave Country Club – Wheelers Hill Friday 4th March 2011
Acknowledgements: Steven Allender, Chad Foulkes, Melanie Nichols, Lynne Millar, Leann Birch,Barbara Rolls, Boyd Swinburn
Obesity as aNational Health Priority Area

www.co-ops.net.au
Overview• Obesity – A National Health Priority Area
– Prevalence
– Direct, indirect and intangible costs to individuals and communities
– Influences
– Promotional campaigns
• Nutrition and Obesity
– Recommendations
– Energy density
– Portion size

www.co-ops.net.au
Obesity
A National Health Priority Area

www.co-ops.net.au
National Health Priority Areas• National Health Priority Areas – Australia’s response
to the World Health Organization’s global strategy Health for All by the Year 2000
1996Cardiovascular health
Cancer controlInjury prevention and control
Mental health
1997Diabetes mellitus
1999Asthma
2002Arthritis and musculoskeletal conditions
2008Obesity
Australian Institute of Health and Welfare. 2010. http://www.aihw.gov.au/health-priority-areas/
www.co-ops.net.au
Overview• Obesity – A National Health Priority Area
– Prevalence
– Direct, indirect and intangible costs to individuals and communities
– Influences
– Promotional campaigns
• Nutrition and Obesity
– Recommendations
– Energy density
– Portion size

www.co-ops.net.au
Body Mass Index (BMI)Adults
• Underweight: BMI < 18.5
• Healthy weight: BMI ≥ 18.5 and BMI < 25
• Overweight but not obese: BMI ≥ 25 and BMI < 30
• Obese: BMI ≥ 30
World Health Organization 2000

www.co-ops.net.au
Waist CircumferenceAdults
• Increased risk (“abdominal overweight”)– Male: 94 cm or more
– Female: 80 cm or more
• Substantially increased risk– Male: 102 cm or more
– Female: 88 cm or more
National Health and Medical research Council. Clinical Practice Guidelines for the Management of Overweight and Obesity in Adults. National Health and Medical Research Council. Canberra, Australia. 2003

www.co-ops.net.au
Body Mass Index (BMI)
Children and adolescents (aged 2-18 years)
Cole et al. BMJ. 2000;320: 1240
www.co-ops.net.au
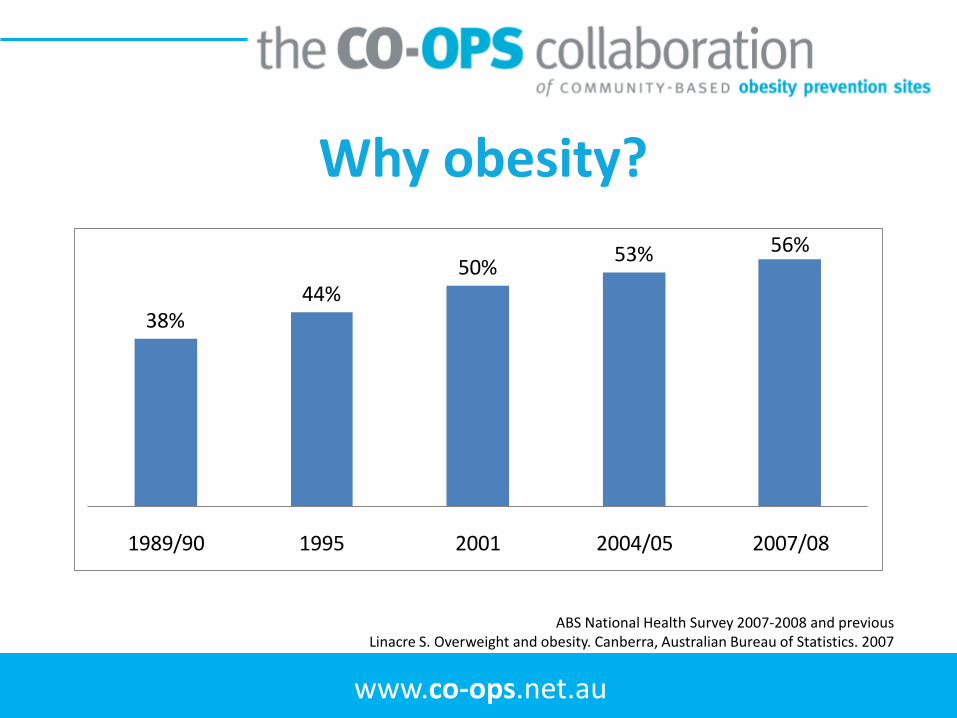
Why obesity?
38%44%
50%53% 56%
1989/90 1995 2001 2004/05 2007/08
ABS National Health Survey 2007-2008 and previousLinacre S. Overweight and obesity. Canberra, Australian Bureau of Statistics. 2007
www.co-ops.net.au

www.co-ops.net.au
Adults - BMI
Perc
ent
National Health Survey 2007-08
55%
68%

www.co-ops.net.au
Adults – waist circumference
Perc
ent
National Health Survey 2007-08
www.co-ops.net.au
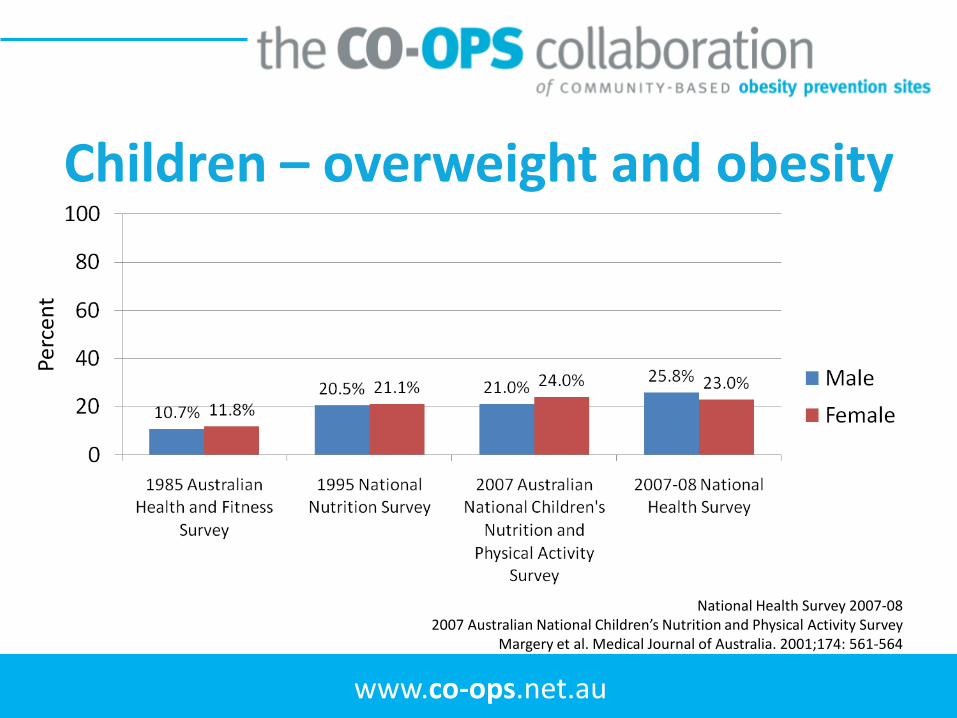
Children – overweight and obesity
Perc
ent
National Health Survey 2007-082007 Australian National Children’s Nutrition and Physical Activity Survey
Margery et al. Medical Journal of Australia. 2001;174: 561-564

www.co-ops.net.au
Secondary School Students
National Secondary Students’ Diet and Activity (NaSSDA) survey 2009-10Must and Strauss. Int J Obes Relat Metab Disord. 1999;23 Suppl 2: S2-11
Perc
ent
www.co-ops.net.au
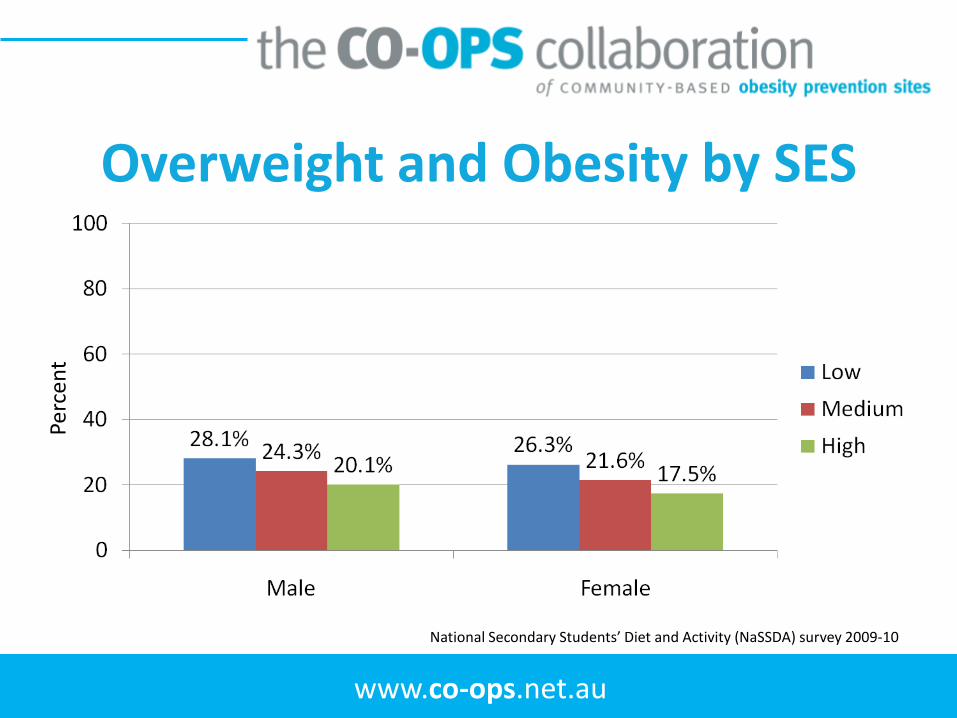
Overweight and Obesity by SES
National Secondary Students’ Diet and Activity (NaSSDA) survey 2009-10
Perc
ent
www.co-ops.net.au
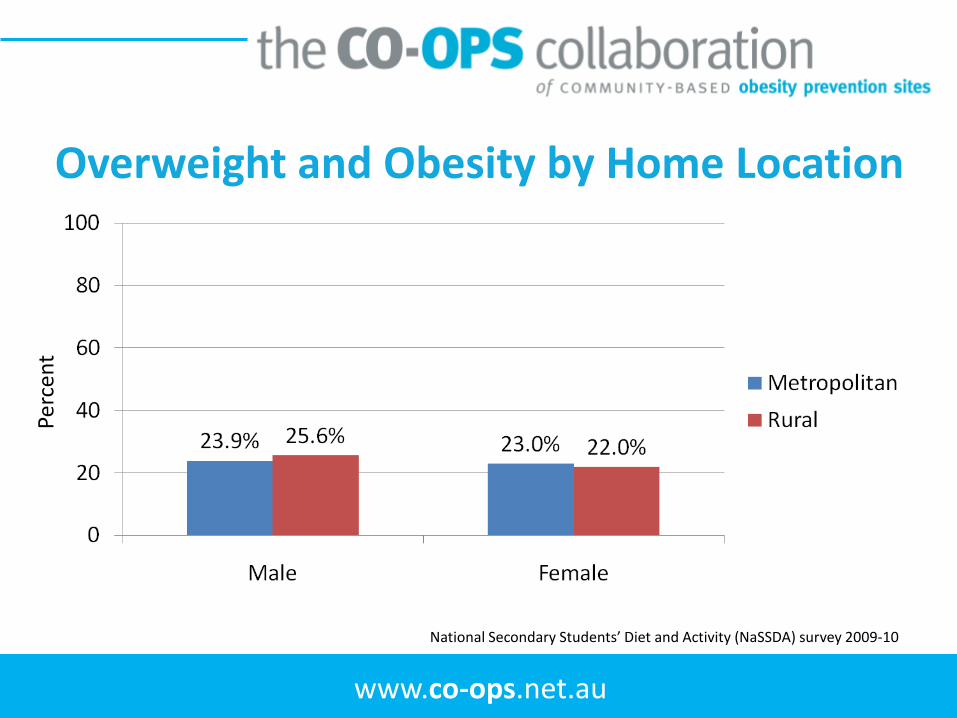
Overweight and Obesity by Home Location
National Secondary Students’ Diet and Activity (NaSSDA) survey 2009-10
Perc
ent

www.co-ops.net.au
Overview• Obesity – A National Health Priority Area
– Prevalence
– Direct, indirect and intangible costs to individuals and communities
– Influences
– Promotional campaigns
• Nutrition and Obesity
– Recommendations
– Energy density
– Portion size
www.co-ops.net.au
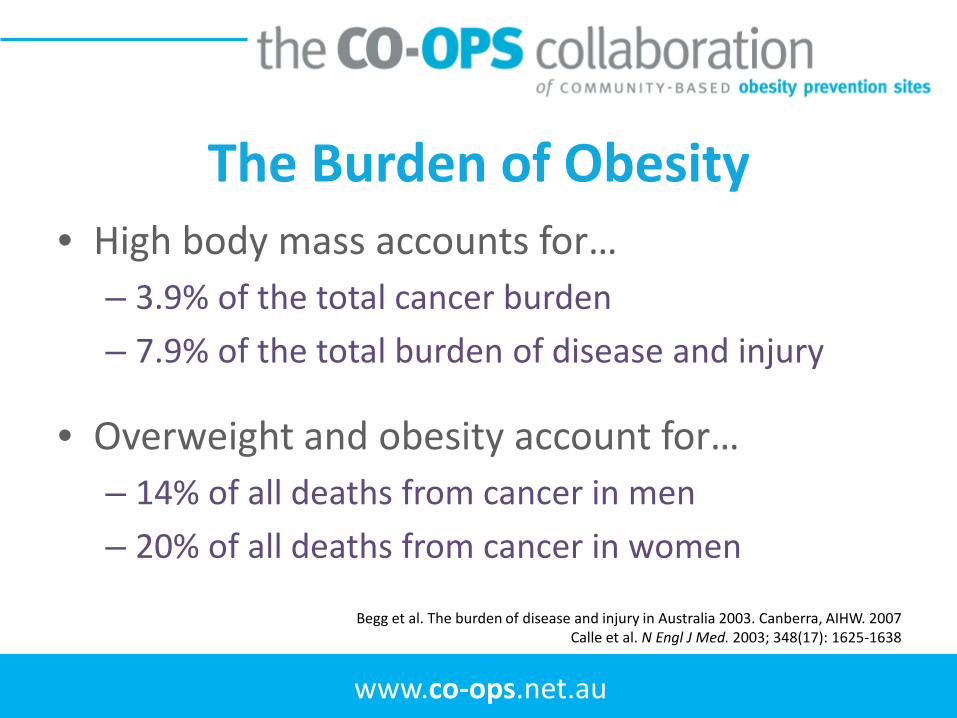
The Burden of Obesity• High body mass accounts for…
– 3.9% of the total cancer burden
– 7.9% of the total burden of disease and injury
• Overweight and obesity account for…– 14% of all deaths from cancer in men
– 20% of all deaths from cancer in women
Begg et al. The burden of disease and injury in Australia 2003. Canberra, AIHW. 2007Calle et al. N Engl J Med. 2003; 348(17): 1625-1638
www.co-ops.net.au
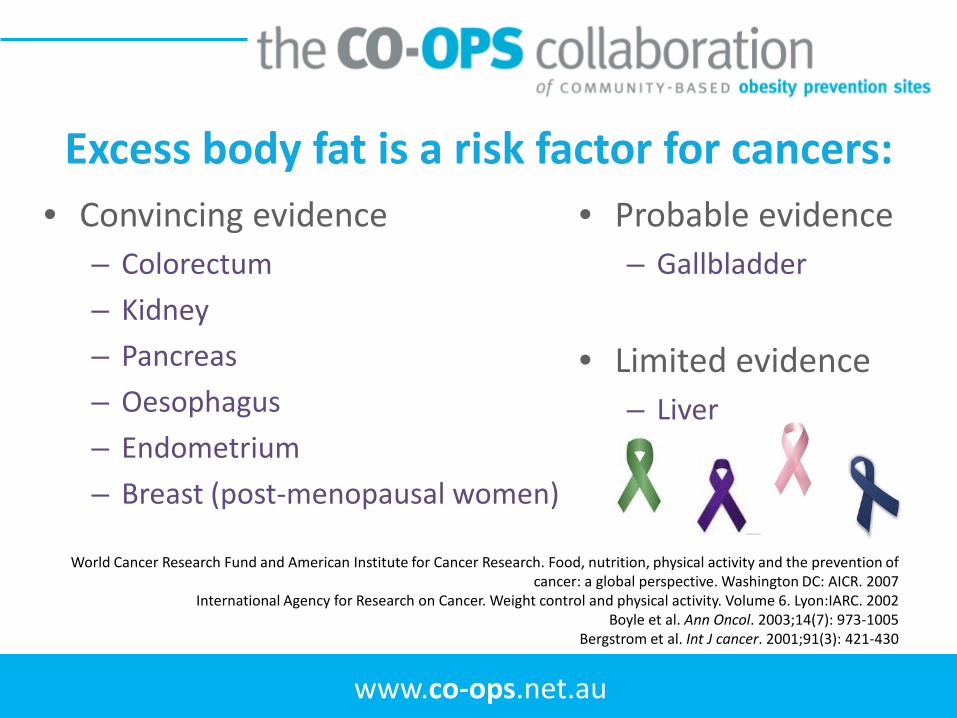
Excess body fat is a risk factor for cancers:• Convincing evidence
– Colorectum
– Kidney
– Pancreas
– Oesophagus
– Endometrium
– Breast (post-menopausal women)
• Probable evidence– Gallbladder
• Limited evidence– Liver
World Cancer Research Fund and American Institute for Cancer Research. Food, nutrition, physical activity and the prevention of cancer: a global perspective. Washington DC: AICR. 2007
International Agency for Research on Cancer. Weight control and physical activity. Volume 6. Lyon:IARC. 2002Boyle et al. Ann Oncol. 2003;14(7): 973-1005
Bergstrom et al. Int J cancer. 2001;91(3): 421-430
www.co-ops.net.au
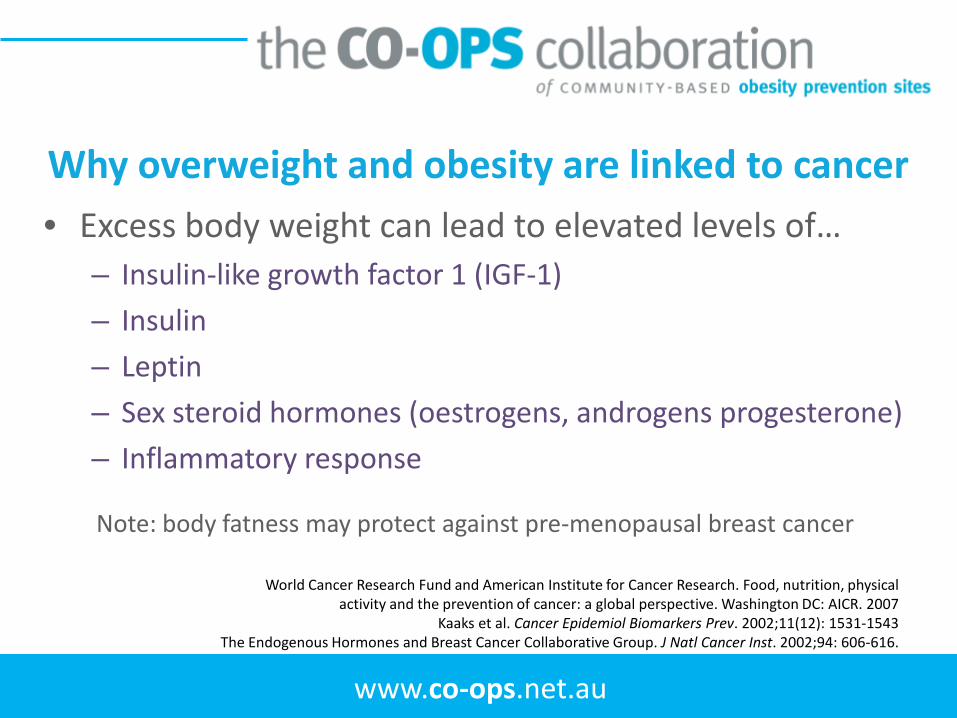
Why overweight and obesity are linked to cancer• Excess body weight can lead to elevated levels of…
– Insulin-like growth factor 1 (IGF-1)
– Insulin
– Leptin
– Sex steroid hormones (oestrogens, androgens progesterone)
– Inflammatory response
Note: body fatness may protect against pre-menopausal breast cancer
World Cancer Research Fund and American Institute for Cancer Research. Food, nutrition, physical activity and the prevention of cancer: a global perspective. Washington DC: AICR. 2007
Kaaks et al. Cancer Epidemiol Biomarkers Prev. 2002;11(12): 1531-1543The Endogenous Hormones and Breast Cancer Collaborative Group. J Natl Cancer Inst. 2002;94: 606-616.

www.co-ops.net.au
Conditions and DeterminantsObesity Poor Nutrition Physical Inactivity
Osteoarthritis
Coronary Heart Disease
Depression
Type 2 Diabetes
Osteoporosis
Stroke
Australia’s Health 2010
Note: waist circumference is an independent risk factor for Type 2 diabetes

www.co-ops.net.au
Additionally…
OverweightSleep apnoea
Hypertension
Fatty liver disease
High cholesterol
Infertility
Impotence
Stress
Measure Up. Department of Health and Ageing. 2010 http://www.measureup.gov.au/internet/abhi/publishing.nsf/Content/The+link+between+chronic+diseases-lp
www.co-ops.net.au
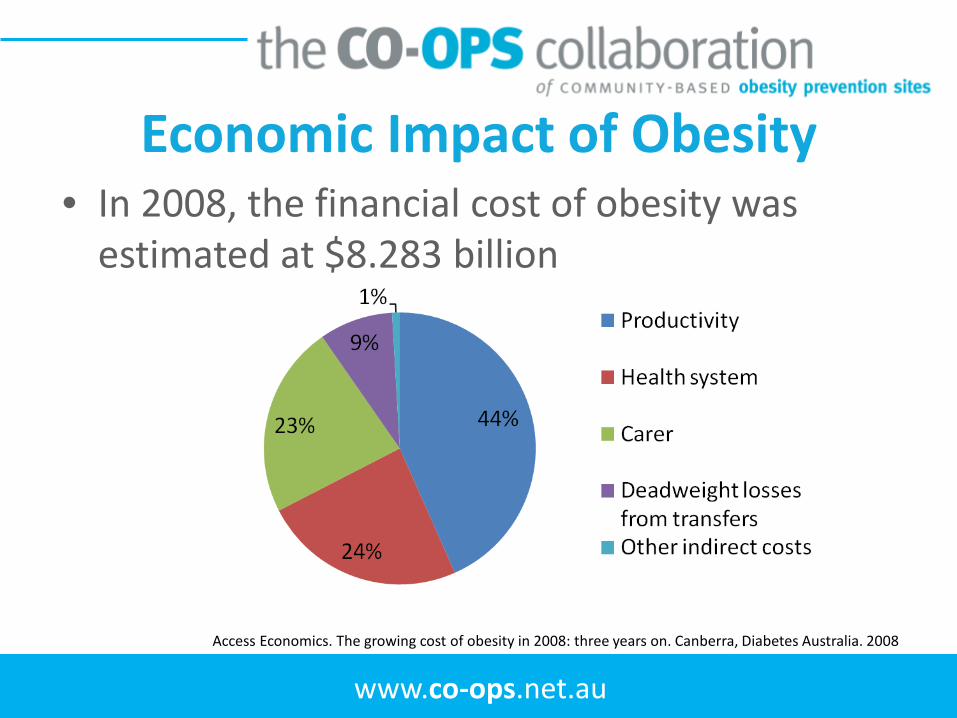
Economic Impact of Obesity• In 2008, the financial cost of obesity was
estimated at $8.283 billion
Access Economics. The growing cost of obesity in 2008: three years on. Canberra, Diabetes Australia. 2008

www.co-ops.net.au
Overview• Obesity – A National Health Priority Area
– Prevalence
– Direct, indirect and intangible costs to individuals and communities
– Influences
– Promotional campaigns
• Nutrition and Obesity
– Recommendations
– Energy density
– Portion size
www.co-ops.net.au
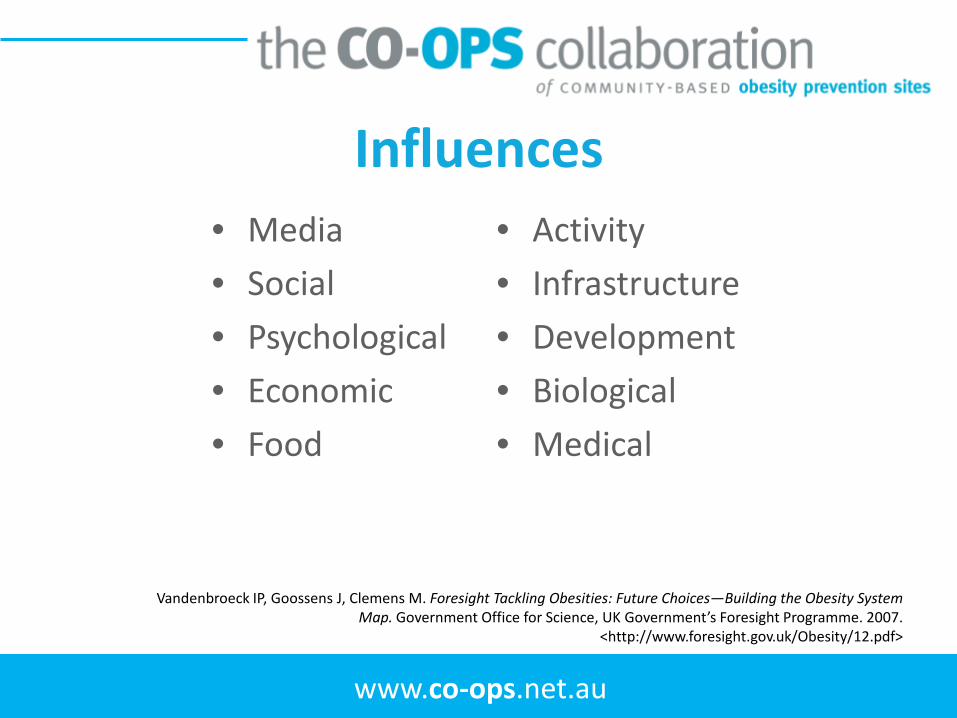
Influences• Media
• Social
• Psychological
• Economic
• Food
• Activity
• Infrastructure
• Development
• Biological
• Medical
Vandenbroeck IP, Goossens J, Clemens M. Foresight Tackling Obesities: Future Choices—Building the Obesity System Map. Government Office for Science, UK Government’s Foresight Programme. 2007.
<http://www.foresight.gov.uk/Obesity/12.pdf>

www.co-ops.net.au
Ecological Model of Predictors of Childhood Overweight
Birch and Davis. Obesity Reviews. 2001;2: 159-171
www.co-ops.net.au
Overview• Obesity – A National Health Priority Area
– Prevalence
– Direct, indirect and intangible costs to individuals and communities
– Influences
– Promotional campaigns
• Nutrition and Obesity
– Recommendations
– Energy density
– Portion size

www.co-ops.net.au
Life. Be in it.• Vision: “Make Life Worthwhile”
• Main aim: “to promote healthy active lifestyles, leisure and recreational activities that promote the prevention and control of chronic disease and thereby improve the physical and emotional well being of all Australians through ‘Fun Raising Activities’”
All artwork copyright © 1975-2011 Alex Stitt unless otherwise specified.Copyright © Recreation Australia Limited 1998-2011Licensed to Life. Be in it.™ International Pty. Ltd.All rights reserved in all forms http://www.lifebeinit.org/
www.co-ops.net.au
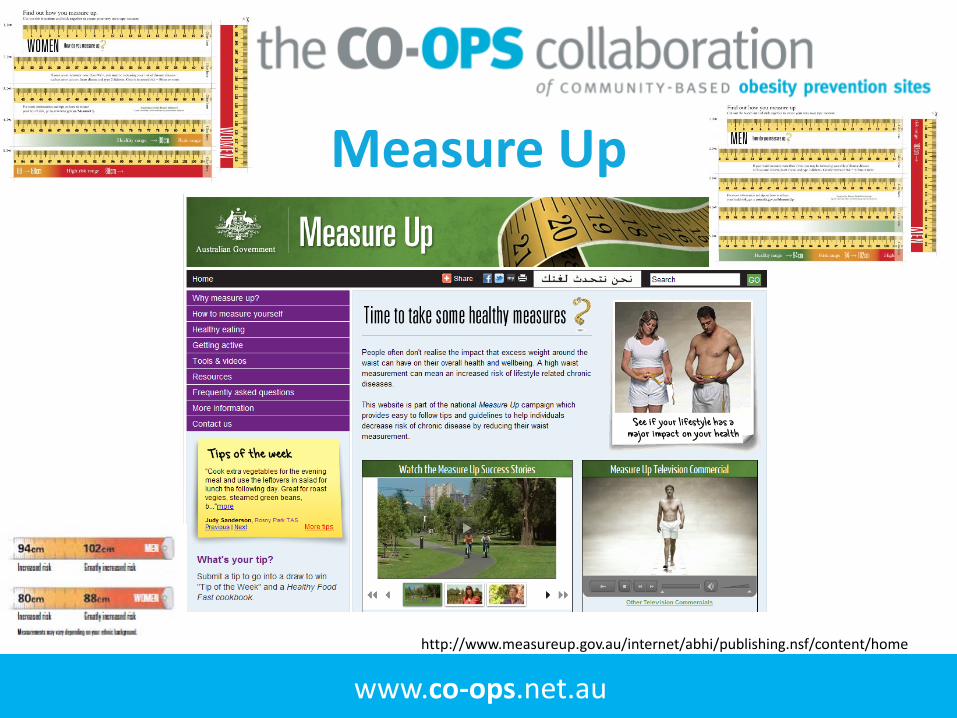
Measure Up
http://www.measureup.gov.au/internet/abhi/publishing.nsf/content/home

www.co-ops.net.au
Obesity and Nutrition

www.co-ops.net.au
Overview• Obesity – A National Health Priority Area
– Prevalence
– Direct, indirect and intangible costs to individuals and communities
– Influences
– Promotional campaigns
• Nutrition and Obesity
– Recommendations
– Energy density
– Portion size
www.co-ops.net.au
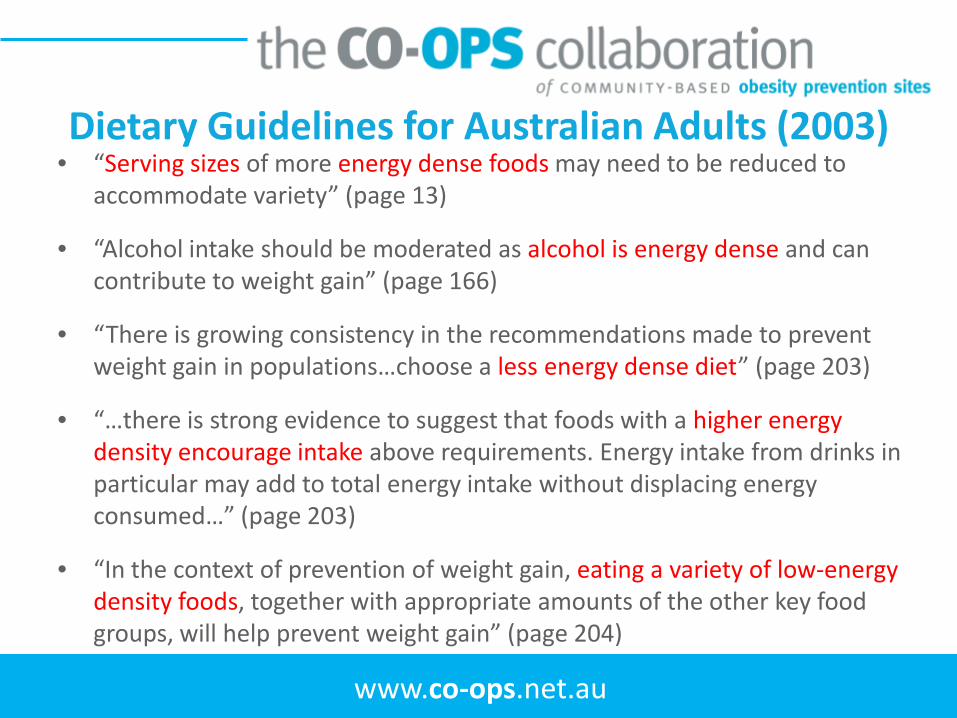
Dietary Guidelines for Australian Adults (2003)• “Serving sizes of more energy dense foods may need to be reduced to
accommodate variety” (page 13)
• “Alcohol intake should be moderated as alcohol is energy dense and can contribute to weight gain” (page 166)
• “There is growing consistency in the recommendations made to prevent weight gain in populations…choose a less energy dense diet” (page 203)
• “…there is strong evidence to suggest that foods with a higher energy density encourage intake above requirements. Energy intake from drinks in particular may add to total energy intake without displacing energy consumed…” (page 203)
• “In the context of prevention of weight gain, eating a variety of low-energy density foods, together with appropriate amounts of the other key food groups, will help prevent weight gain” (page 204)
www.co-ops.net.au
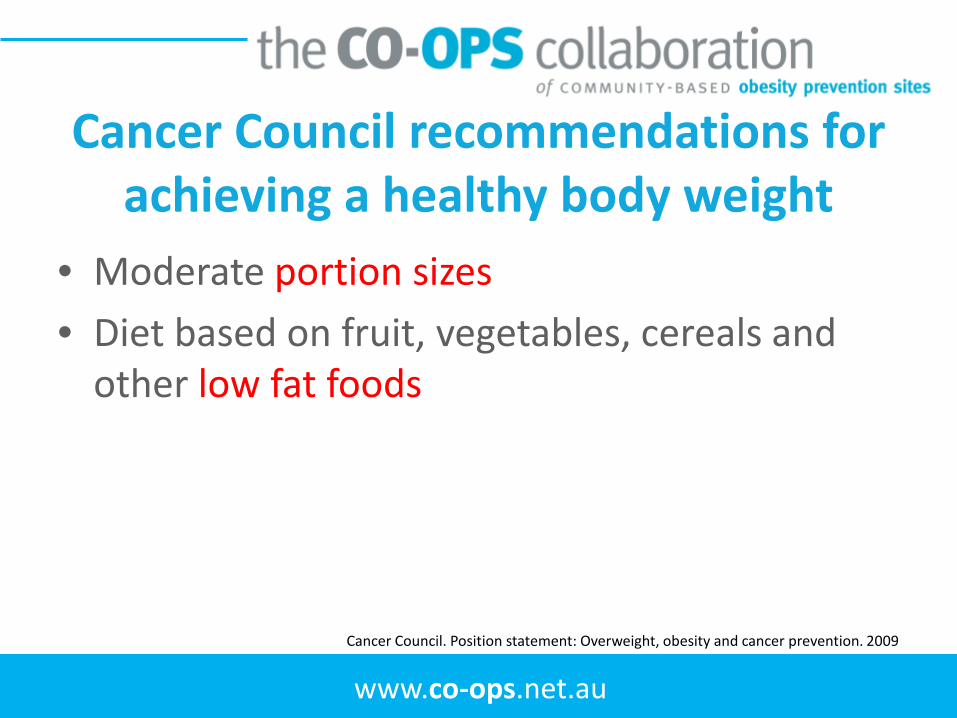
Cancer Council recommendations for achieving a healthy body weight
• Moderate portion sizes
• Diet based on fruit, vegetables, cereals and other low fat foods
Cancer Council. Position statement: Overweight, obesity and cancer prevention. 2009
www.co-ops.net.au
Overview• Obesity – A National Health Priority Area
– Prevalence
– Direct, indirect and intangible costs to individuals and communities
– Influences
– Promotional campaigns
• Nutrition and Obesity
– Recommendations
– Energy density
– Portion size
www.co-ops.net.au
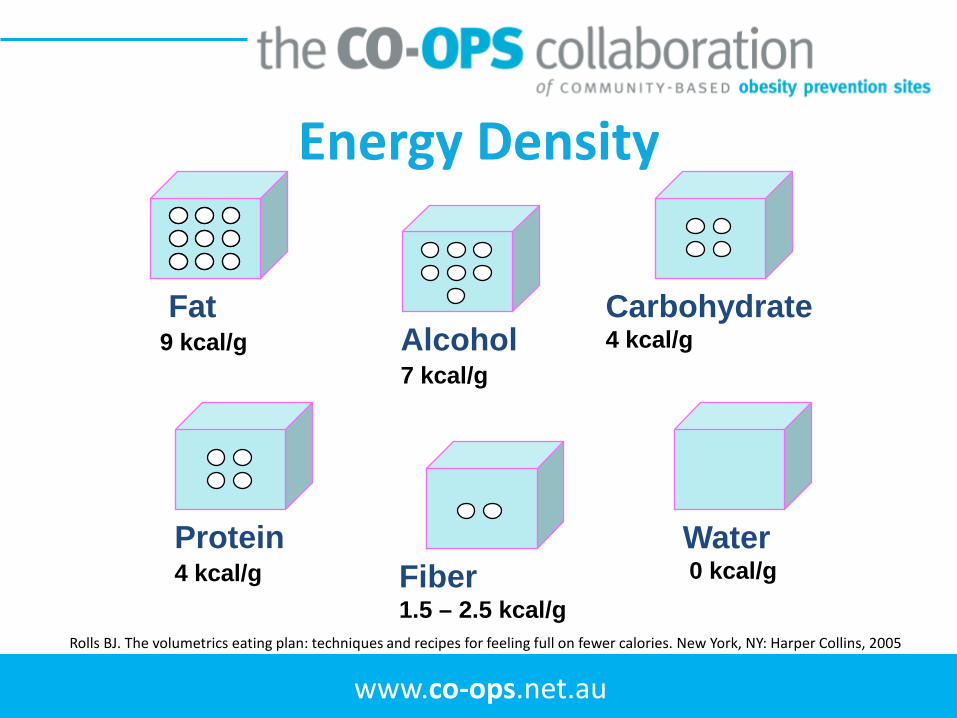
Energy Density
Water0 kcal/g
Alcohol7 kcal/g
Fat 9 kcal/g
Carbohydrate4 kcal/g
Fiber1.5 – 2.5 kcal/g
Protein4 kcal/g
Rolls BJ. The volumetrics eating plan: techniques and recipes for feeling full on fewer calories. New York, NY: Harper Collins, 2005

www.co-ops.net.au
Regular cola Diet cola
Regular cheese Reduced fat cheese

www.co-ops.net.au
Energy Density and Energy Intake
Leahy et al. J Am Diet Assoc. 2008;108:41-48
Lower-Energy-Density Meal:643 kcal
Higher-Energy-Density Meal:823 kcal
Higher-Energy-DensityMacaroni and Cheese:
2.0 kcal/gram300 grams600 kcal
Lower-Energy-DensityMacaroni and Cheese:
1.4 kcal/gram300 grams420 kcal

www.co-ops.net.au
Macaroni and Cheese
Leahy et al. J Am Diet Assoc. 2008;108:41-48
Higher-ED Lower-ED0
25
50
75
100
125
150
175a b
Food intake
grams
Higher-ED Lower-ED0
100
200
300a
b
Energy intake
kcal
25% (72 kcal)

www.co-ops.net.au
Energy density did not affect the weight of food consumed
Leahy et al. J Am Diet Assoc. 2008;108:41-48
Higher-ED Lower-ED0
50100150200250300350400450
Macaroni and cheeseApplesauceBroccoliMilk
Food intake (g)

www.co-ops.net.au
Energy density affected energy intake at the meal
Leahy et al. J Am Diet Assoc. 2008;108:41-48
Higher-ED Lower-ED0
50100150200250300350400450
Macaroni and cheeseApplesauceBroccoliMilk
Energy intake (kcal)
ab
18% (72 kcal)
www.co-ops.net.au
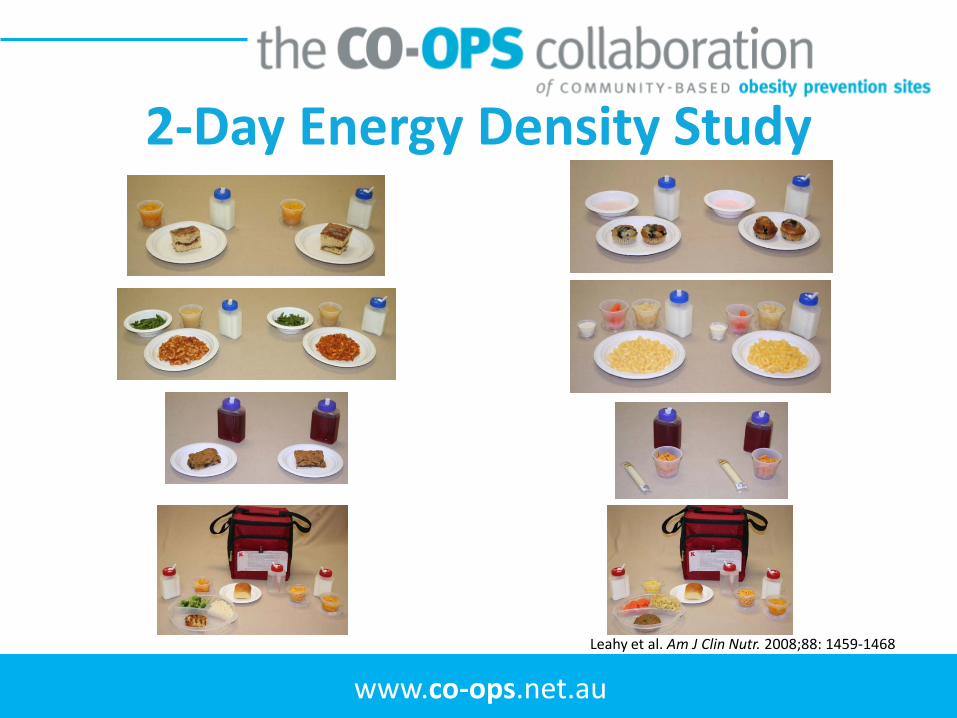
2-Day Energy Density Study
Leahy et al. Am J Clin Nutr. 2008;88: 1459-1468

www.co-ops.net.au
0
500
1000
1500
2000
2500
3000
Lower-EDHigher-ED
Bre
akfa
stLu
nch
Afte
rnoo
n sn
ack
Din
ner
Eve
ning
sna
ck
Day 1 Day 2
Bre
akfa
st
Afte
rnoo
n sn
ack
Lunc
h
Din
ner
Eve
ning
sna
ck
Not manipulated
Not manipulated
Cumulativefood intake (g)
Leahy et al. Am J Clin Nutr. 2008;88: 1459-1468
www.co-ops.net.au
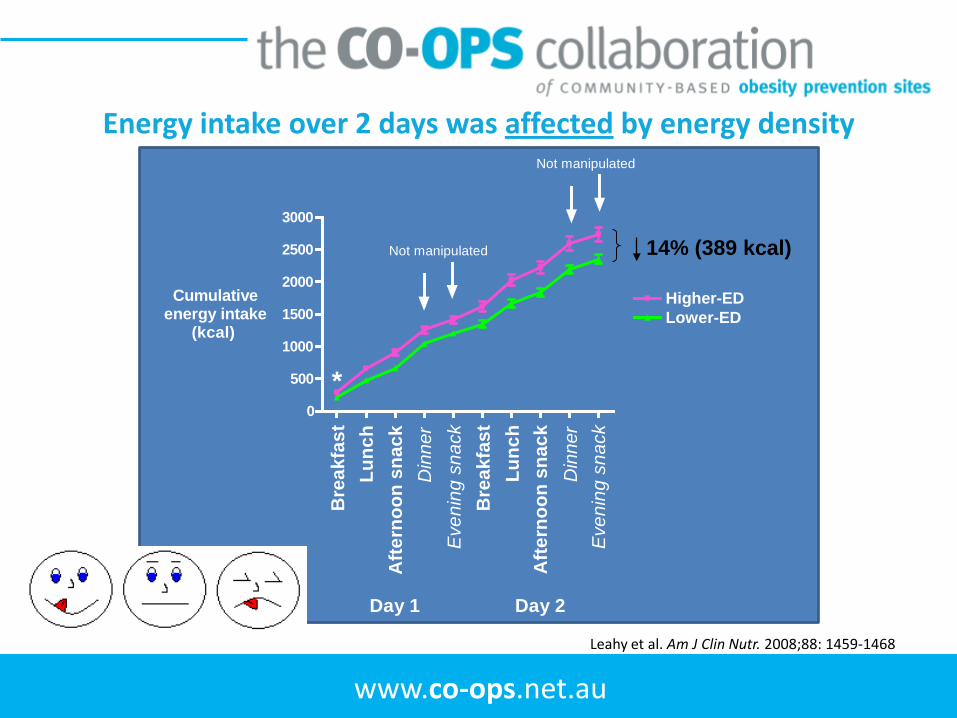
Energy intake over 2 days was affected by energy density
0
500
1000
1500
2000
2500
3000
Lower-EDHigher-ED
Bre
akfa
stLu
nch
Afte
rnoo
n sn
ack
Din
ner
Eve
ning
sna
ckB
reak
fast
Afte
rnoo
n sn
ack
Lunc
h
Din
ner
Eve
ning
sna
ck
Not manipulated
Not manipulated
Day 1 Day 2
Cumulativeenergy intake (kcal)
*
14% (389 kcal)
Leahy et al. Am J Clin Nutr. 2008;88: 1459-1468

www.co-ops.net.au
Overview• Obesity – A National Health Priority Area
– Prevalence
– Direct, indirect and intangible costs to individuals and communities
– Influences
– Promotional campaigns
• Nutrition and Obesity
– Recommendations
– Energy density
– Portion size

www.co-ops.net.au
Portion Size
USDA
Photograph courtesy of Leann L. Birch, PhD
www.co-ops.net.au
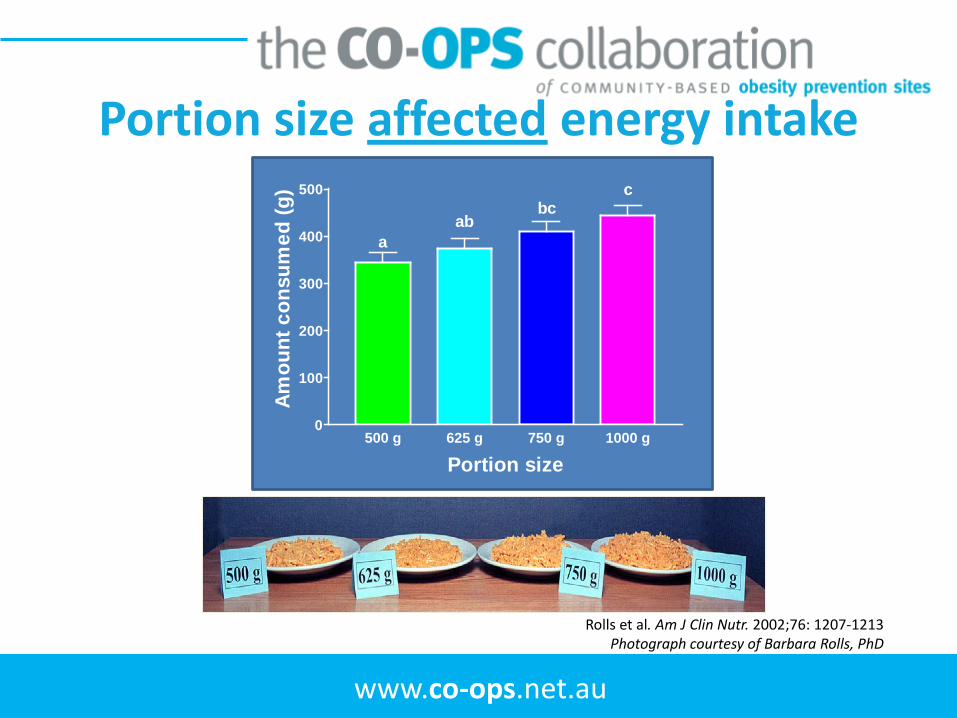
500 g 625 g 750 g 1000 g0
100
200
300
400
500
aab
bcc
Portion size
Amou
nt c
onsu
med
(g)
Portion size affected energy intake
Rolls et al. Am J Clin Nutr. 2002;76: 1207-1213Photograph courtesy of Barbara Rolls, PhD
www.co-ops.net.au
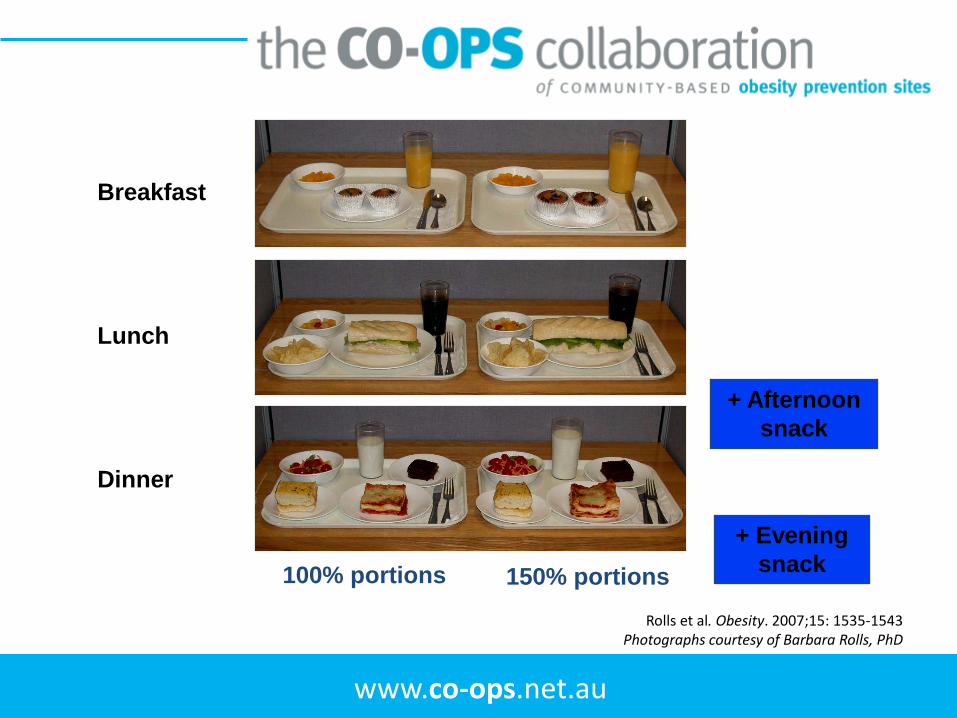
100% portions 150% portions
Breakfast
Lunch
Dinner
+ Afternoon snack
+ Evening snack
Rolls et al. Obesity. 2007;15: 1535-1543Photographs courtesy of Barbara Rolls, PhD

www.co-ops.net.au
Portion size affected energy intake for 11 days
MonTue
Wed Thu Fri SatSun
MonTue
Wed Thu0
500010000150002000025000300003500040000
Cumulative energy intake (kcal)
Women 100% portionsWomen 150% portionsMen 100% portionsMen 150% portions
4606 ± 771 kcal
5027 ± 735 kcal
Study day
Rolls et al. Obesity. 2007;15: 1535-1543

www.co-ops.net.au
Summary• Obesity is a National Health Priority Area
– High prevalence among adults and children
– Linked with a number of diseases and conditions
– Large economic impact
– Many things influence development
– Health promotion campaigns address it
• Obesity and Nutrition
– Recommendations include paying attention to energy density and portion size
– Energy density influences energy intake
– Portion size influences energy intake

www.co-ops.net.au
The CO-OPS Collaboration• Collaborative network: >900 members• Advice and support service• Resources for planning, implementation and evaluation of CBI
– Best Practice Principles– Evidence Summaries
• Web site – Resource library– Discussion forums– Project database
• Professional development: all states, in person and online and National Workshops (2008, 2009, 2010)
