obesity and physical fitness of pre-adolescent children during the academic year and the summer...
TRANSCRIPT

http://chc.sagepub.com/Journal of Child Health Care
http://chc.sagepub.com/content/10/3/199The online version of this article can be found at:
DOI: 10.1177/1367493506066481
2006 10: 199J Child Health CareAntonios D. Christodoulos, Andreas D. Flouris and Savvas P. Tokmakidis
the summer period: effects of organized physical activityObesity and physical fitness of pre-adolescent children during the academic year and
Published by:
http://www.sagepublications.com
On behalf of:
Association of British Paediatric Nurses
The official journal of the Council of Children's Nurses Inc
can be found at:Journal of Child Health CareAdditional services and information for
http://chc.sagepub.com/cgi/alertsEmail Alerts:
http://chc.sagepub.com/subscriptionsSubscriptions:
http://www.sagepub.com/journalsReprints.navReprints:
http://www.sagepub.com/journalsPermissions.navPermissions:
What is This?
- Aug 29, 2006Version of Record >>
at TEXAS TECH UNIV LIBRARY on September 28, 2014chc.sagepub.comDownloaded from at TEXAS TECH UNIV LIBRARY on September 28, 2014chc.sagepub.comDownloaded from

199
Obesity and physical fitness ofpre-adolescent children duringthe academic year and thesummer period: effects oforganized physical activity
ANTONIOS D. CHRISTODOULOS, BSc, MScDepartment of Physical Education and Sport Science, Democritus University of Thrace, Greece
ANDREAS D. FLOURIS, BSc, MScEnvironmental Ergonomics Laboratory, School of Health and Human Performance, Dalhousie
University, Canada
SAVVAS P. TOKMAKIDIS, BSc, MA, PhDDepartment of Physical Education and Sport Science, Democritus University of Thrace, Greece
Abstract
This study examined obesity and parameters of physical fitness in 178 elementary schoolchildren during an academic year as well as after thesummer holidays. Results showed significant physical fitness improve-ments during the school year, with little or no changes in the summer holidays. Children who reported less than 30 minutes of daily participationin physical activity demonstrated lower prevalence rates for overweight andobesity as well as superior fitness performance. The detrimental effect ofthe summer break on the progress of physical fitness was less in childrenwho did participate in physical activity than in those who did not. Longi-tudinal modelling using generalized estimating equations demonstratedthat physical activity is a major contributing factor for obesity over time,masking the singular effect of various fitness parameters. It is concludedthat pre-adolescent children advance in physical fitness mainly during theschool year, with physical activity being a beneficial countermeasure for thedevelopment of obesity.
Keywords children � fitness � obesity � overweight � physical activity
RESEARCH
JCHCJournal of Child Health Care
Copyright © 2006SAGE Publications
London, Thousand Oaks, CA and New Delhi
Vol 10(3) 199–212DOI: 10.1177/1367493506066481
01_CHC 10_3 8/8/06 4:21 PM Page 199
at TEXAS TECH UNIV LIBRARY on September 28, 2014chc.sagepub.comDownloaded from

IntroductionPhysical activity has been promoted as lifelong positive health behaviour inchildhood (Centers for Disease Control and Prevention, 1997), which can lay thefoundation for overall health, especially cardiovascular health (US Departmentof Health and Human Services, 2000). However, children’s participation inphysical activity declines with age (Stone et al., 1998). Physical fitness is anotherimportant factor related to health, independent from physical activity. Althoughseveral dimensions of physical fitness have been identified, the component that ismost strongly associated with health is cardiovascular endurance, defined as ‘theability to sustain moderate intensity, whole-body activity for extended time peri-ods’ (Baranowski et al., 1992: 238).
Both inadequate levels of physical activity and low aerobic fitness in childrenhave been characterized as predisposing factors for the development of obesity(Johnson et al., 2000), which has increased worldwide in recent years (Deckel-baum and Williams, 2001). This is a major source of concern among health professionals, because obese children tend to become obese adults (Togashi et al.,2002). Moreover, childhood obesity is associated with coronary heart disease risk factor profiles (Boreham et al., 2001) and increased adult morbidity andmortality, independently of adult weight (Gunnell et al., 1998).
School physical education (PE) classes provide the best opportunity to fulfilthe health-related fitness needs of virtually all children (Sallis and McKenzie,1991). However, it has been reported that, in terms of the activity undertaken,current school PE classes contribute insignificantly to long-term health(Warburton and Woods, 1996). A recent cross-sectional study (Koutedakis andBouziotas, 2003) revealed that pre-adolescent boys, who participated only in PEclasses in Greek secondary schools, had excess body fat and poor aerobic fitnesscompared with their counterparts who were engaged in extracurricular orga-nized physical activities. This suggests that the specific PE curriculum does notachieve the required levels of motor and cardiorespiratory fitness with potentialeffects on children’s health. In order to understand fully the nature of these parameters and assess for possible relationships, longitudinal data are more pertinent. In this light, this study examined changes in obesity and selected parameters of physical fitness in Greek pre-adolescent children over a one-yearperiod in relation to curricular and extracurricular physical activity. In order toinvestigate whether changes in physical fitness and obesity are affected by season-specific changes in particular types of activities (for example, structured/obligatory and recreational/spontaneous activities), the study looked at theserelationships separately for the academic year (from September to May) versusthe summer holiday (next September).
JOURNAL OF CHILD HEALTH CARE 10(3)
200
01_CHC 10_3 8/8/06 4:21 PM Page 200
at TEXAS TECH UNIV LIBRARY on September 28, 2014chc.sagepub.comDownloaded from
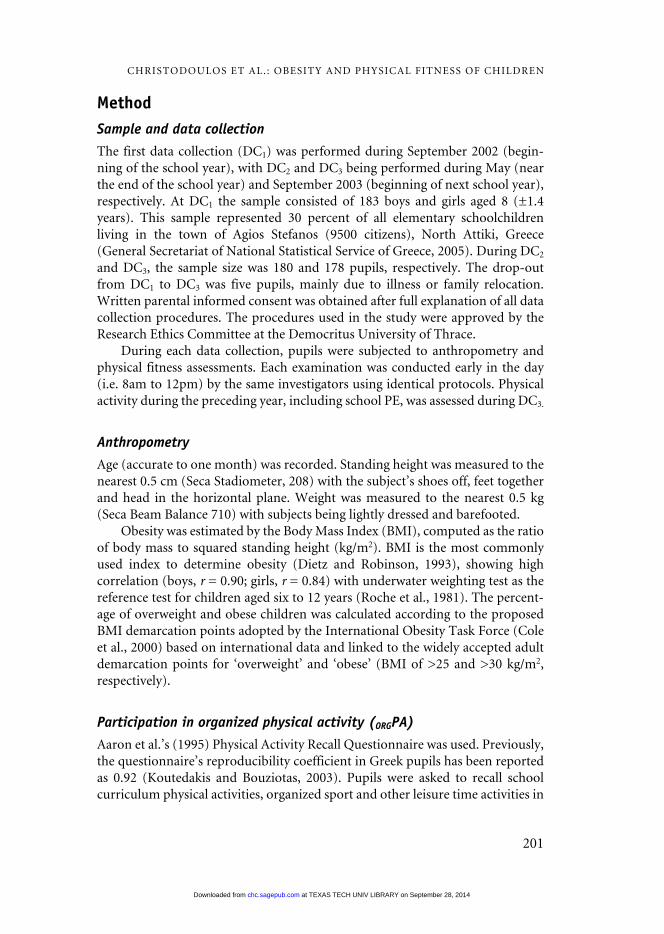
MethodSample and data collectionThe first data collection (DC1) was performed during September 2002 (begin-ning of the school year), with DC2 and DC3 being performed during May (nearthe end of the school year) and September 2003 (beginning of next school year),respectively. At DC1 the sample consisted of 183 boys and girls aged 8 (±1.4years). This sample represented 30 percent of all elementary schoolchildren living in the town of Agios Stefanos (9500 citizens), North Attiki, Greece(General Secretariat of National Statistical Service of Greece, 2005). During DC2
and DC3, the sample size was 180 and 178 pupils, respectively. The drop-outfrom DC1 to DC3 was five pupils, mainly due to illness or family relocation.Written parental informed consent was obtained after full explanation of all datacollection procedures. The procedures used in the study were approved by theResearch Ethics Committee at the Democritus University of Thrace.
During each data collection, pupils were subjected to anthropometry andphysical fitness assessments. Each examination was conducted early in the day(i.e. 8am to 12pm) by the same investigators using identical protocols. Physicalactivity during the preceding year, including school PE, was assessed during DC3.
AnthropometryAge (accurate to one month) was recorded. Standing height was measured to thenearest 0.5 cm (Seca Stadiometer, 208) with the subject’s shoes off, feet togetherand head in the horizontal plane. Weight was measured to the nearest 0.5 kg(Seca Beam Balance 710) with subjects being lightly dressed and barefooted.
Obesity was estimated by the Body Mass Index (BMI), computed as the ratioof body mass to squared standing height (kg/m2). BMI is the most commonlyused index to determine obesity (Dietz and Robinson, 1993), showing high correlation (boys, r = 0.90; girls, r = 0.84) with underwater weighting test as thereference test for children aged six to 12 years (Roche et al., 1981). The percent-age of overweight and obese children was calculated according to the proposedBMI demarcation points adopted by the International Obesity Task Force (Coleet al., 2000) based on international data and linked to the widely accepted adultdemarcation points for ‘overweight’ and ‘obese’ (BMI of >25 and >30 kg/m2,respectively).
Participation in organized physical activity (ORGPA)Aaron et al.’s (1995) Physical Activity Recall Questionnaire was used. Previously,the questionnaire’s reproducibility coefficient in Greek pupils has been reportedas 0.92 (Koutedakis and Bouziotas, 2003). Pupils were asked to recall school curriculum physical activities, organized sport and other leisure time activities in
CHRISTODOULOS ET AL. : OBESITY AND PHYSICAL FITNESS OF CHILDREN
201
01_CHC 10_3 8/8/06 4:21 PM Page 201
at TEXAS TECH UNIV LIBRARY on September 28, 2014chc.sagepub.comDownloaded from

which they participated at least 10 times during the preceding year. For all activities, pupils had to give detailed information regarding the frequency andduration of participation and the total time spent on them. The school PEteacher and parents confirmed participation.
The time spent in all activities was summed to derive an overall physicalactivity estimate (h/d). Using the recommended daily physical activity participa-tion cut-point of >30 minutes (Saris et al., 2003), the sample was divided into
ORGPA participants (ORGPA+) and non-ORGPA participants (ORGPA–). We wereunable to ascertain details of varying intensity (within sport) or duration per session of activity. However, we used the metabolic cost of each reported activity(Ainsworth et al., 2000) to calculate the time spent in intensive physical activityper day (i.e. >6 METs) for the entire year.
Physical fitnessThe parameters evaluated included cardiorespiratory fitness, lower limb explo-sive power/strength, trunk muscle endurance, agility and flexibility. Data wereobtained using the procedures described in the Eurofit Test Handbook (Eurofit,1988). The participants received verbal encouragement from the investigators inorder to achieve maximum performance. Brief descriptions of all the tests followbelow.
Cardiorespiratory fitness (CF) The 20 m Multistage Shuttle Run Test (Leger etal., 1988) was used. In brief, groups of five to 10 pupils ran back and forth on a 20 metre track at a steadily increasing pace (0.5 km/h every minute), controlledby signals from a standardized tape recording. Pupils were instructed to keeppace with the signals for as long as possible. The number of laps completed wasrecorded for each pupil and subsequently used to estimate cardiorespiratory fit-ness expressed as maximal oxygen uptake (ml•kg•min-1). This test is appropriatefor determining cardiorespiratory fitness in schoolchildren (Leger et al., 1988).
Explosive strength (ExS) The Standing Broad Jump Test was used, whichinvolves jumping for distance from a standing start, measuring the anaerobic/explosive strength of the lower limb.
Muscle endurance (ME) The maximum number of sit-ups achieved in 30 seconds was used to provide an overall estimation of abdominal muscleendurance according to standardized procedures.
Agility (AG) The 10 × 5 metre shuttle run test was applied, which measuresspeed and agility of lower limb movement.
Flexibility (FLEX) The Sit and Reach Test was utilized to provide an overallestimation of flexibility. This test involves reaching as far as possible from a sitting position and measures the flexibility of the hamstrings, buttocks andlower back.
JOURNAL OF CHILD HEALTH CARE 10(3)
202
01_CHC 10_3 8/8/06 4:21 PM Page 202
at TEXAS TECH UNIV LIBRARY on September 28, 2014chc.sagepub.comDownloaded from

Statistical analysesWilcoxon Signed Rank tests with a Bonferoni adjustment were used to comparevariables from different data collections (DC1 vs. DC2; DC2 vs. DC3; DC1 vs.DC3). Chi-square tests were used to detect differences in prevalence for ‘over-weight’ and ‘obese’ between ORGPA+ and ORGPA– children. As the data were collected across successive points in time, the Generalized Estimating Equations(GEE) (Liang and Zeger, 1986) approach was employed to examine the longitu-dinal relationship among physical activity, physical fitness and obesity. The GEEis a powerful longitudinal approach in fitting generalized linear models to non-normally but dependently distributed response variables. Using an extendedapproach for the mean structure of GEE, Fisher’s z transformation was con-ducted to establish the functional relation between the correlation coefficientsand the association parameters.
Thereafter, a general linear model framework with GEE estimation wasintroduced to investigate the longitudinal model linking obesity and parametersof physical fitness (i.e. CF, ExS, ME, AG and FLEX) through ORGPA. The BMI incontinuous format was set as the dependent variable, while the parameters ofphysical fitness were set as independent variables. Covariates for age and genderwere included in each model, while the data were clustered by time of measure-ment (i.e. DC1, DC2, DC3). Subsequently, the analysis was repeated incorporat-ing ORGPA in the list of independent variables. A reduction in the coefficient forBMI change would support the hypothesis that obesity is related to the cluster ofindependent variables (i.e. CF, ExS, AG, ME or FLEX) through the mediatingeffect of ORGPA. Analyses were carried out with Statistical Analysis Software (version 8.2). The level of significance for all statistical analyses was set at p <0.05.
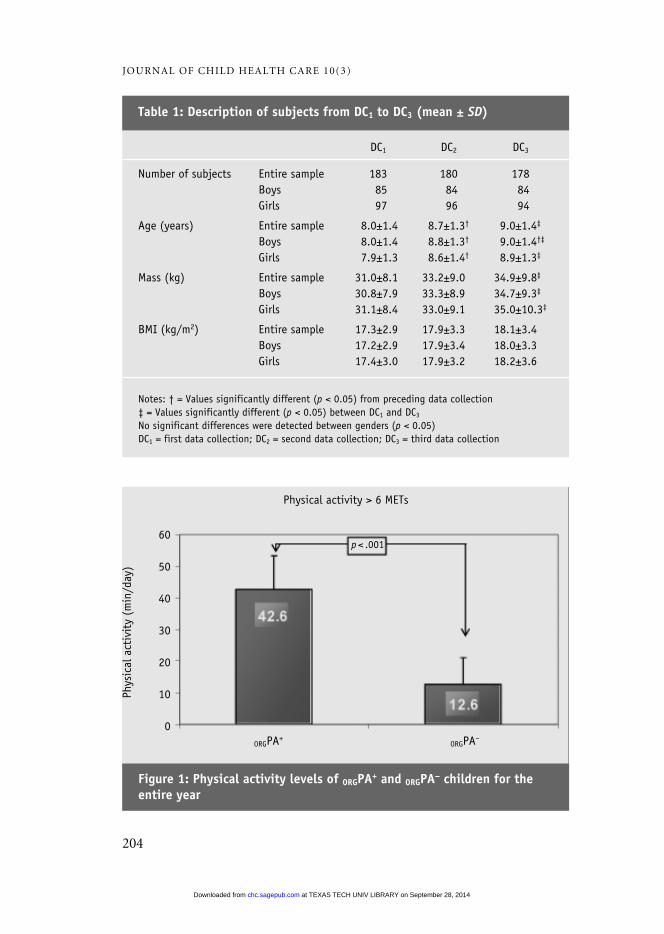
ResultsTable 1 presents descriptive data for the entire cohort. Figure 1 presents the DC3-reported levels of vigorous physical activity for ORGPA+ and ORGPA– children during the preceding school year. There were no differences in gender distribu-tion by condition. According to the criterion of >30 min/day of physical activity,approximately 46.6 percent of the survey sample (83 children) were classified assufficiently active (ORGPA+).
Table 2 demonstrates physical fitness results for ORGPA+ and ORGPA– childrenfrom DC1 to DC3. As expected, all the performance parameters in DC2 demon-strated significant improvements compared to DC1 (p < 0.05). In contrast, theexamined performance parameters showed little or no changes between DC2 andDC3 (p > 0.05). Throughout the study period ORGPA+ children demonstrated significantly superior performance in all the parameters examined (p < 0.05),
CHRISTODOULOS ET AL. : OBESITY AND PHYSICAL FITNESS OF CHILDREN
203
01_CHC 10_3 8/8/06 4:21 PM Page 203
at TEXAS TECH UNIV LIBRARY on September 28, 2014chc.sagepub.comDownloaded from
JOURNAL OF CHILD HEALTH CARE 10(3)
204
Figure 1: Physical activity levels of ORGPA+ and ORGPA– children for theentire year
60
50
40
30
20
10
0ORGPA+
ORGPA–
p < .001
DC1 DC2 DC3
Number of subjects Entire sample 183 180 178Boys 85 84 84Girls 97 96 94
Age (years) Entire sample 8.0±1.4 8.7±1.3† 9.0±1.4‡
Boys 8.0±1.4 8.8±1.3† 9.0±1.4†‡
Girls 7.9±1.3 8.6±1.4† 8.9±1.3‡
Mass (kg) Entire sample 31.0±8.1 33.2±9.0 34.9±9.8‡
Boys 30.8±7.9 33.3±8.9 34.7±9.3‡
Girls 31.1±8.4 33.0±9.1 35.0±10.3‡
BMI (kg/m2) Entire sample 17.3±2.9 17.9±3.3 18.1±3.4Boys 17.2±2.9 17.9±3.4 18.0±3.3Girls 17.4±3.0 17.9±3.2 18.2±3.6
Notes: † = Values significantly different (p < 0.05) from preceding data collection‡ = Values significantly different (p < 0.05) between DC1 and DC3
No significant differences were detected between genders (p < 0.05)DC1 = first data collection; DC2 = second data collection; DC3 = third data collection
Table 1: Description of subjects from DC1 to DC3 (mean ± SD)Ph
ysic
al a
ctiv
ity
(min
/day
)
Physical activity > 6 METs
01_CHC 10_3 8/8/06 4:21 PM Page 204
at TEXAS TECH UNIV LIBRARY on September 28, 2014chc.sagepub.comDownloaded from
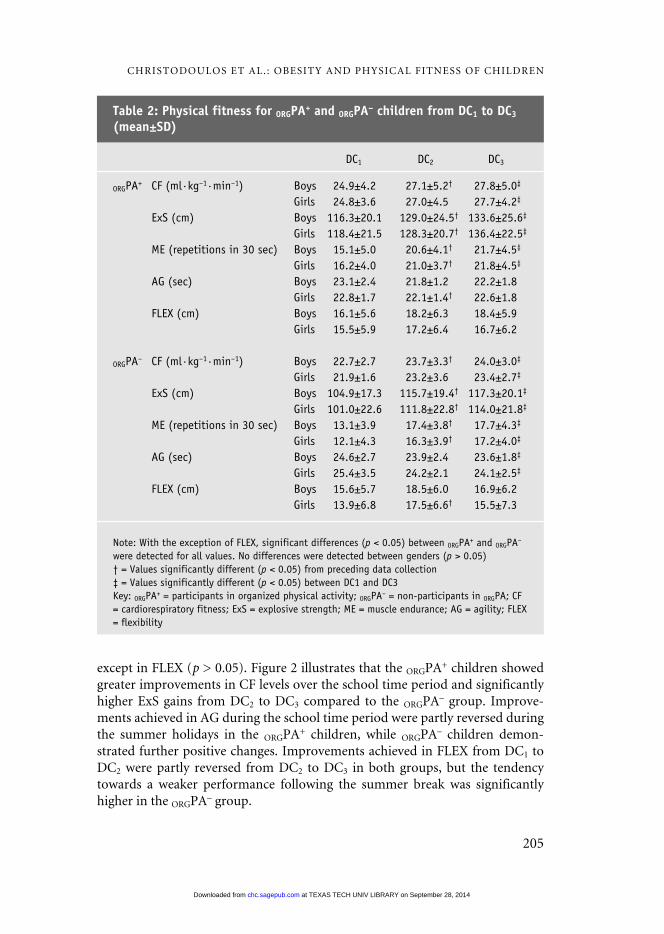
except in FLEX (p > 0.05). Figure 2 illustrates that the ORGPA+ children showedgreater improvements in CF levels over the school time period and significantlyhigher ExS gains from DC2 to DC3 compared to the ORGPA– group. Improve-ments achieved in AG during the school time period were partly reversed duringthe summer holidays in the ORGPA+ children, while ORGPA– children demon-strated further positive changes. Improvements achieved in FLEX from DC1 toDC2 were partly reversed from DC2 to DC3 in both groups, but the tendencytowards a weaker performance following the summer break was significantlyhigher in the ORGPA– group.
CHRISTODOULOS ET AL. : OBESITY AND PHYSICAL FITNESS OF CHILDREN
205
DC1 DC2 DC3
ORGPA+ CF (ml·kg–1·min–1) Boys 24.9±4.2 27.1±5.2† 27.8±5.0‡
Girls 24.8±3.6 27.0±4.5 27.7±4.2‡
ExS (cm) Boys 116.3±20.1 129.0±24.5† 133.6±25.6‡
Girls 118.4±21.5 128.3±20.7† 136.4±22.5‡
ME (repetitions in 30 sec) Boys 15.1±5.0 20.6±4.1† 21.7±4.5‡
Girls 16.2±4.0 21.0±3.7† 21.8±4.5‡
AG (sec) Boys 23.1±2.4 21.8±1.2 22.2±1.8Girls 22.8±1.7 22.1±1.4† 22.6±1.8
FLEX (cm) Boys 16.1±5.6 18.2±6.3 18.4±5.9Girls 15.5±5.9 17.2±6.4 16.7±6.2
ORGPA– CF (ml·kg–1·min–1) Boys 22.7±2.7 23.7±3.3† 24.0±3.0‡
Girls 21.9±1.6 23.2±3.6 23.4±2.7‡
ExS (cm) Boys 104.9±17.3 115.7±19.4† 117.3±20.1‡
Girls 101.0±22.6 111.8±22.8† 114.0±21.8‡
ME (repetitions in 30 sec) Boys 13.1±3.9 17.4±3.8† 17.7±4.3‡
Girls 12.1±4.3 16.3±3.9† 17.2±4.0‡
AG (sec) Boys 24.6±2.7 23.9±2.4 23.6±1.8‡
Girls 25.4±3.5 24.2±2.1 24.1±2.5‡
FLEX (cm) Boys 15.6±5.7 18.5±6.0 16.9±6.2Girls 13.9±6.8 17.5±6.6† 15.5±7.3
Note: With the exception of FLEX, significant differences (p < 0.05) between ORGPA+ and ORGPA–
were detected for all values. No differences were detected between genders (p > 0.05)† = Values significantly different (p < 0.05) from preceding data collection‡ = Values significantly different (p < 0.05) between DC1 and DC3Key: ORGPA+ = participants in organized physical activity; ORGPA– = non-participants in ORGPA; CF= cardiorespiratory fitness; ExS = explosive strength; ME = muscle endurance; AG = agility; FLEX= flexibility
Table 2: Physical fitness for ORGPA+ and ORGPA– children from DC1 to DC3
(mean±SD)
01_CHC 10_3 8/8/06 4:21 PM Page 205
at TEXAS TECH UNIV LIBRARY on September 28, 2014chc.sagepub.comDownloaded from

JOURNAL OF CHILD HEALTH CARE 10(3)
206
Figure 2: Physical fitness parameters for ORGPA+ and ORGPA– children fromDC1 to DC3
Note: With the exception of FLEX, significant differences (p < 0.05) between ORGPA+ and ORGPA–
were detected for all values. No differences were detected between genders (p < 0.05). † = Values significantly different (p < 0.05) from preceding data collection* = Values significantly different (p < 0.05) between DC1 and DC3
pred. VO2max = predicted maximal oxygen uptake; BMI = Body Mass Index
ORGPA+ORGPA–
Cardiorespiratory fitness Explosive strength
Muscle endurance Agility
Flexibility Body Mass Index
DC1 DC2 DC3 DC1 DC2 DC3
DC1 DC2 DC3 DC1 DC2 DC3
DC1 DC2 DC3 DC1 DC2 DC3
Sit
and
reac
h (c
m)
Sit-
ups
(in
30 s
ec)
pred
. VO
2max
(ml/
kg/m
in)
BMI
(kg/
m2 )
10 x
5 m
shu
ttle
run
(se
c)St
andi
ng b
oard
jum
p (c
m)
01_CHC 10_3 8/8/06 4:21 PM Page 206
at TEXAS TECH UNIV LIBRARY on September 28, 2014chc.sagepub.comDownloaded from

Significant differences were detected between ORGPA+ and ORGPA– in theprevalence rates of overweight and obesity (p < 0.05) from DC1 to DC3 (Table 3).Further, ORGPA– males demonstrated significantly increased prevalence for beingoverweight from DC1 to DC3 (p < 0.05). Although this was not the case for thefemales (p > 0.05), this is probably attributed to their concomitant increase in theprevalence for obesity, which demonstrated a considerable but statisticallyinsignificant increase (p = 0.80).
Table 4 depicts results from GEE analysis for the longitudinal model, linkingobesity and parameters of physical fitness through ORGPA. The results from thefirst model reveal that CF, ExS and ME were significantly associated with obesity(p < 0.05). In the second model, ORGPA accounted for a significant amount ofvariation in obesity (p < 0.05). Concurrently, CF ceased to be associated signifi-cantly with obesity (p > 0.05) and the level of significance for both ExS and MEwas reduced.
CHRISTODOULOS ET AL. : OBESITY AND PHYSICAL FITNESS OF CHILDREN
207
DC1 DC2 DC3
ORGPA+ Entire sample (83) OW 0.14 (0.05)‡ 0.17 (0.05) 0.15 (0.05)‡
OB 0.05 (0.05)‡ 0.04 (0.06)‡ 0.06 (0.06)‡
Males (36) OW 0.06 (0.08)‡ 0.08 (0.07)‡ 0.08 (0.07)‡
OB 0.03 (0.08)‡ 0.03 (0.08)‡ 0.03 (0.06)‡
Females (47) OW 0.20 (0.07) 0.22 (0.07)‡ 0.20 (0.07)‡
OB 0.06 (0.07)‡ 0.04 (0.07)‡ 0.07 (0.07)‡
ORGPA– Entire sample (95) OW 0.22 (0.05)‡ 0.20 (0.05) 0.23 (0.05)‡
OB 0.16 (0.05)‡ 0.19 (0.06)‡ 0.19 (0.06)‡
Males (48) OW 0.24 (0.08)‡* 0.26 (0.07)‡ 0.33 (0.07)‡*OB 0.13 (0.08)‡ 0.11 (0.08)‡ 0.11 (0.09)‡
Females (47) OW 0.20 (0.07)* 0.14 (0.07)‡ 0.14 (0.07)‡*OB 0.18 (0.07)‡ 0.26 (0.06)‡ 0.26 (0.07)‡
Note: No differences were detected between values from preceding data collection (p > 0.05)‡ = Values significantly different (p < 0.05) between ORGPA+ and ORGPA–
* = Values significantly different (p < 0.05) between DC1 and DC3
OW = overweight; OB = obese (see also Tables 1 and 2)
Table 3: Prevalence rates (±CI) of overweight and obesity for ORGPA+ andORGPA– children from DC1 to DC3
01_CHC 10_3 8/8/06 4:21 PM Page 207
at TEXAS TECH UNIV LIBRARY on September 28, 2014chc.sagepub.comDownloaded from

DiscussionThe purpose of the study was to examine changes in obesity and selected parameters of physical fitness in Greek pre-adolescent children over a one-yearperiod in relation to curricular and extracurricular physical activity. The resultsdemonstrate that children advanced significantly in physical fitness during the academic period, while little or no improvement was achieved during thesummer months. Additionally, ORGPA+ children demonstrated lower prevalencefor being overweight and obese as well as superior physical fitness performance(p < 0.05). The detrimental effect of the summer break on the progress of physi-cal fitness was less in ORGPA+ than in ORGPA– children. In parallel, longitudinal modelling using GEE demonstrated that ORGPA– is a major contributing factorfor obesity over time (p < 0.05).
The present longitudinal findings support previous cross-sectional evidencein Greece suggesting that enhanced physical activity is associated with lower bodyfat and higher levels of health-related fitness (Koutedakis and Bouziotas, 2003).We found that ORGPA– children demonstrate significantly increased prevalencefor being overweight and obese. More importantly, however, our longitudinalresults demonstrated that the latter prevalence rates increase over time. Also, CFlevels were at all time points lower in ORGPA– children. It could be inferred, there-fore, that ORGPA– is linked to obesity and to a low CF profile. A major challenge
JOURNAL OF CHILD HEALTH CARE 10(3)
208
Model 1 Model 2β (Std. error) β (Std. error)
CF –0.018 (0.009) –0.004 (0.002)ExS –0.001 (0.001)* –0.001 (0.001)†
ME –0.001 (0.001)† –0.001 (0.001)†
AG 0.002 (0.002) 0.002 (0.002)FLEX 0.001 (0.001) 0.001 (0.001)Physical activity –0.011 (0.049)†
Intercept 2.422 (0.036)* 2.545 (0.025)*Deviance 433.89 433.85WCM 0.812 0.823
Note: † = p < 0.05; * = p < 0.001GEE = generalized estimating equations; WCM = working correlation matrix among the repeatedobservations in GEE analysis (see also Tables 1 and 2)
Table 4: GEE results for parameter estimates and type 3 analysis in predicting obesity from DC1 to DC3
01_CHC 10_3 8/8/06 4:21 PM Page 208
at TEXAS TECH UNIV LIBRARY on September 28, 2014chc.sagepub.comDownloaded from

in examining relationships among physical fitness, obesity and participation inphysical activity is to establish causality, as these parameters are interrelated(Twisk et al., 2000). In addition, this phenomenon has been confirmed by thepresent data as the GEE models calculated herein for obesity revealed a largeamount of shared variance among ORGPA, CF, ExS and ME. Longitudinal designssuch as the current are advantageous in that they allow for close monitoring ofchanges over time in these clustered parameters of physical fitness and health.Our GEE analyses demonstrated that ORGPA– is a major contributing factor for obesity over time (p < 0.05), masking the singular effect of physical fitnessparameters such as CF, ExS and ME.
The results further demonstrate that improvements in AG achieved duringthe academic year were partly reversed during the summer holidays in the
ORGPA+ group. Although not reported previously in the literature, the absence of training stimuli during the summer break for the ORGPA+ children or poten-tial genetic differences between children may have confounded the results.Children in the ORGPA– group demonstrated further positive changes in AG at DC3, although they still had inferior performance compared to the ORGPA+
children.A significant improvement of FLEX was observed in both groups during the
school time, followed by a decrease during the holidays. It seems that structuredphysical activity, either in the school or sports club, contributes to a better jointflexibility, with no differences between ORGPA+ and ORGPA– children. This is consistent with previous studies in Greek children (Manios et al., 1999) and adolescents (Koutedakis and Bouziotas, 2003). Yet, there are studies that haveshowed a more significant improvement in FLEX after children’s participation inextracurricular activities (Katic et al., 2002) or increased school PE classes(Stephens and Wentz, 1998).
A possible limitation of the present study is the unequal time span betweenmeasurements. However, this design was necessary since our research questioninvolved the academic year and the summer break which are, inevitably, unequal.Further, although the methods used herein represent valid assessments of children’s physical fitness, the results of the present study are subject to somevariation inherent in these tests. Within these limitations, it is concluded thatpre-adolescent children advance in physical fitness mainly during the academicyear. Further, that extracurricular physical activity during the academic year is abeneficial countermeasure against the development of obesity and reduces the tendency towards a poorer health and performance state following the summer break. These findings suggest that physical activity should receive para-mount attention in the design of public health interventions targeting children.As the majority of physical activity in childhood takes place in organized pro-grams outside of school (Ross et al., 1985), it is likely that multiple approacheswill be required, including policy changes, environmental planning and educa-tional efforts in the family, school and community, in order to provide children
CHRISTODOULOS ET AL. : OBESITY AND PHYSICAL FITNESS OF CHILDREN
209
01_CHC 10_3 8/8/06 4:21 PM Page 209
at TEXAS TECH UNIV LIBRARY on September 28, 2014chc.sagepub.comDownloaded from

with substantial amounts of sufficient physical activity to result in multiplehealth benefits.
ReferencesAaron, D.J., Kriska, A.M., Dearwater, S.R., Cauley, J.A., Metz, K.F. and LaPorte, R.E.
(1995) ‘Reproducibility and Validity of an Epidemiologic Questionnaire to AssessPast Year Physical Activity in Adolescents’, American Journal of Epidemiology142(2): 191–201.
Ainsworth, B.E., Haskell, W.L., Whitt, M.C., Irwin, M.L., Swartz, A.M., Strath, S.J.,O’Brien, W.L., Bassett Jr, D.R., Schmitz, K.H., Emplaincourt, P.O., Jacobs Jr, D.R.and Leon A.S. (2000) ‘Compendium of Physical Activities: an Update of ActivityCodes and MET Intensities’, Medicine and Science in Sports and Exercise 32(supp.):498–516.
Baranowski, T., Bouchard, C., Bar-Or, O., Bricker, T., Heath, G., Kimm, S.Y.S., Malina,R., Obarzanek, E., Pate, R., Strong, W.B., Truman, B. and Washington, R. (1992)‘Assessment, Prevalence, and Cardiovascular Benefits of Physical Activity andFitness in Youth’, Medicine and Science in Sports and Exercise 24(6): 237–47.
Boreham, C., Twisk, J., Murray, L., Savage, M., Strain, J.J. and Cran G. (2001) ‘Fitness,Fatness, and Coronary Heart Disease Risk in Adolescents: the Northern IrelandYoung Hearts Project’, Medicine and Science in Sports and Exercise 33(2): 270–4.
Centers for Disease Control and Prevention (1997) ‘Guidelines for School andCommunity Programs to Promote Lifelong Physical Activity among YoungPeople’, Morbidity and Mortality Weekly Report 46(RR-6): 1–36.
Cole, T.J., Bellizzi, C., Flegal, K.M. and Dietz, W.H. (2000) ‘Establishing a StandardDefinition for Child Overweight and Obesity Worldwide: International Survey’,British Medical Journal 320(7244): 1240–53.
Deckelbaum, R.J. and Williams, C.L. (2001) ‘Childhood Obesity: the Health Issue’,Obesity Research 9(supp. 4): 239–43.
Dietz, W.H. and T.N. Robinson (1993) ‘Assessment and Treatment of ChildhoodObesity’, Pediatric Review 14(9): 337–44.
Eurofit (1988) European Test of Physical Fitness. Rome: Committee for the Developmentof Sport, Council of Europe.
General Secretariat of National Statistical Service of Greece (2005) Statistical Data –Census of Population 2001, URL (consulted 20 January): http://www.statistics.gr.
Gunnell, D.J., Frankel, S.J., Nanchahal, K., Peters, T.J. and Davey-Smith, G. (1998)‘Childhood Obesity and Adult Cardiovascular Mortality: a 57-year Follow-up StudyBased on the Boyd–Orr Cohort’, American Journal of Clinical Nutrition 67(6):1111–18.
Johnson, M.S., Figueroa-Colon, R., Herd, S.L., Fields, D.A., Sun, M., Hunter, G.R. andGoran M.I. (2000) ‘Aerobic Fitness, Not Energy Expenditure, InfluencesSubsequent Increase in Adiposity in Black and White Children’, Pediatrics 106(4):1–6.
Katic, R., Males, B. and Miletic, D. (2002) ‘Effect of 6-month Athletic Training onMotor Abilities in Seven-year-old Schoolgirls’, Collegium Antropologicum 26(2):533–8.
Koutedakis, Y. and Bouziotas, C. (2003) ‘National Physical Education Curriculum:
JOURNAL OF CHILD HEALTH CARE 10(3)
210
01_CHC 10_3 8/8/06 4:21 PM Page 210
at TEXAS TECH UNIV LIBRARY on September 28, 2014chc.sagepub.comDownloaded from

Motor and Cardiovascular Health-related Fitness in Greek Adolescents’, BritishJournal of Sports Medicine 37(4): 311–14.
Leger, L.A., Mercier, D., Gadoury, C. and Lambert, J. (1988) ‘The Multistage, 20-metreShuttle Run Test for Aerobic Fitness’, Journal of Sports Science 6(2): 93–101.
Liang, K.Y. and Zeger, S.L. (1986) ‘Longitudinal Data Analysis Using Generalized LinearModels’, Biometrika 73(1): 13–22.
Manios, Y., Kafatos, A. and Codrington, C. (1999) ‘Gender Differences in PhysicalActivity and Physical Fitness in Young Children in Crete’, Journal of SportsMedicine and Physical Fitness 39(1): 24–30.
Roche, A.F., Sievogel, R.M., Chumlea, W.C. and Webb, P. (1981) ‘Grading Body Fatnessfrom Limited Anthropometric Data’, American Journal of Clinical Nutrition 34(12):2831–8.
Ross, J.G., Dotson, C.O., Gilbert, G.G. and Katz, S.J. (1985) ‘After Physical Education:Physical Activity Outside of School Physical Education Programs’, Journal ofPhysical Education, Recreation and Dance 56(1): 35–9.
Sallis, J.F. and McKenzie, T.L. (1991) ‘Physical Education’s Role in Public Health’,Research Quarterly for Exercise and Sport 62(2): 124–37.
Saris, W.H., Blair, S.N., van Baak, M.A., Eaton, S.B., Davies, P.S., Di Pietro, L.,Fogelholm, M., Rissanen, A., Schoeller, D., Swinburn, B., Tremblay, A., Westerterp,K.R. and Wyatt, H. (2003) ‘How Much Physical Activity Is Enough to PreventUnhealthy Weight Gain? Outcome of the IASO 1st Stock Conference andConsensus Statement’, Obesity Revue 4(2): 101–14.
Stephens, M.B. and Wentz, S.W. (1998) ‘Supplemental Fitness Activities and Fitness inUrban Elementary School Classrooms’, Family Medicine 30(3): 220–3.
Stone, E.J., McKenzie, T.L., Welk, G.J. and Booth, M.L. (1998) ‘Effects of PhysicalActivity Interventions in Youth: Review and Synthesis’, American Journal ofPreventive Medicine 15(4): 298–315.
Togashi, K., Masuda, H., Rankinen, T., Tanaka, S., Bouchard, C. and Kamiya, H. (2002)‘A 12-year Follow-up Study of Treated Obese Children in Japan’, InternationalJournal of Obesity and Related Metabolic Disorders 26(6): 770–7.
Twisk, J.W., Kemper, H.C. and Van Mechelen, W. (2000) ‘Tracking of Activity andFitness and the Relationship with Cardiovascular Disease Risk Factors’, Medicineand Science in Sports and Exercise 32(8): 1455–61.
US Department of Health and Human Services (2000) Healthy People, 2010: NationalHealth Promotion and Disease Prevention Objectives, DHHS Publication No. PHS.Washington, DC: US Government Printing Office.
Warburton, P. and Woods, J. (1996) ‘Observation of Children’s Physical Activity LevelsDuring Primary School Physical Education Lessons’, European Journal of PhysicalEducation 1(1): 56–65.
ANTONIOS D. CHRISTODOULOS is currently a PhD candidate at DemocritusUniversity of Thrace. He has several years of experience as a physical educationinstructor. His major research interest is in the area of fitness and cardiovascularhealth in childhood, as well as obesity prevention.
ANDREAS D. FLOURIS is a doctoral student and a sessional lecturer at DalhousieUniversity. His background is in human biology and biostatistics and his research
CHRISTODOULOS ET AL. : OBESITY AND PHYSICAL FITNESS OF CHILDREN
211
01_CHC 10_3 8/8/06 4:21 PM Page 211
at TEXAS TECH UNIV LIBRARY on September 28, 2014chc.sagepub.comDownloaded from
interests include paediatric cardiovascular health, obesity prevention andbiostatistics in physiological and epidemiological research.
SAVVAS P. TOKMAKIDIS is a professor of exercise physiology at DemocritusUniversity of Thrace. His main research interests lie in exercise metabolism,cardiovascular disease, risk factors and obesity.
JOURNAL OF CHILD HEALTH CARE 10(3)
212
Correspondence to:
Savvas P. Tokmakidis, Department of Physical Education and SportScience (TEFAA), Democritus University of Thrace, Komotini 69100,Greece. [email: [email protected]]
01_CHC 10_3 8/8/06 4:21 PM Page 212
at TEXAS TECH UNIV LIBRARY on September 28, 2014chc.sagepub.comDownloaded from