obesity and extreme obesity: new insights into the black-white disparity in neonatal mortality...
Post on 21-Dec-2015
218 views
TRANSCRIPT
Obesity and Extreme Obesity: New Insights into Obesity and Extreme Obesity: New Insights into the Black-White Disparity in the Black-White Disparity in
Neonatal MortalityNeonatal Mortality
Hamisu M. Salihu, MD, PhD
Department of Epidemiology and Biostatistics Department of Epidemiology and Biostatistics
& &
Department of Obstetrics and Gynecology Department of Obstetrics and Gynecology
University of South FloridaUniversity of South Florida

Co-Authors:Amina P. Alio, PhDAmina P. Alio, PhD
Council on African American Affairs, Washington, DCCouncil on African American Affairs, Washington, DC
Roneé E. Wilson, MPHRoneé E. Wilson, MPHDepartment of Epidemiology and Biostatistics, University of Department of Epidemiology and Biostatistics, University of
South FloridaSouth Florida
Russell S. Kirby, PhDRussell S. Kirby, PhDDepartment of Maternal and Child Health, University of Department of Maternal and Child Health, University of
Alabama at Birmingham, Birmingham, ALAlabama at Birmingham, Birmingham, AL
Greg R. Alexander, ScDGreg R. Alexander, ScDDepartment of Pediatrics, University of South FloridaDepartment of Pediatrics, University of South Florida

IntroductionIntroduction
During the past two decades, the During the past two decades, the prevalence of obesity has been rising prevalence of obesity has been rising continuously in the United States, continuously in the United States, especially among womenespecially among women11
Between 1986 to 2000 the prevalence of Between 1986 to 2000 the prevalence of obesity, defined as body mass index (BMI) obesity, defined as body mass index (BMI) ≥30, doubled, while that of morbid or ≥30, doubled, while that of morbid or extreme obesity quadrupledextreme obesity quadrupled22

IntroductionIntroduction
As a result of the increases in BMI and the As a result of the increases in BMI and the strong association between obesity and years of strong association between obesity and years of life lostlife lost33, some authors have predicted that the , some authors have predicted that the steady increase in life expectancy that marked steady increase in life expectancy that marked the 20th century may halt in the 21st centurythe 20th century may halt in the 21st century44
Absent in the ongoing debate on the impact of Absent in the ongoing debate on the impact of obesity on longevity is any discussion of the obesity on longevity is any discussion of the effect of maternal obesity on survival chances of effect of maternal obesity on survival chances of the offspringthe offspring

IntroductionIntroduction
Information on the association between Information on the association between obesity and neonatal survival is scantobesity and neonatal survival is scant
Risk estimates in the published literature Risk estimates in the published literature are derived from highly homogenous are derived from highly homogenous populations populations – May not have practical application in the May not have practical application in the
racially/ethnically diverse populace of the racially/ethnically diverse populace of the United States United States

ObjectivesObjectives
To determine the impact of maternal To determine the impact of maternal obesity on neonatal survivalobesity on neonatal survival
To examine gradations of obesity as well To examine gradations of obesity as well as obesity-related black-white disparity in as obesity-related black-white disparity in neonatal survival neonatal survival

Materials and MethodsMaterials and Methods
Missouri maternally linked cohort data files were Missouri maternally linked cohort data files were used covering the period from 1978 through used covering the period from 1978 through 19971997
Singleton live births within the gestational age Singleton live births within the gestational age range of 20-44 weeks were selectedrange of 20-44 weeks were selected
Body mass index [weight (in kilograms) divided Body mass index [weight (in kilograms) divided by height (in metresby height (in metres22)] was used to define )] was used to define maternal pre-pregnancy weight groupsmaternal pre-pregnancy weight groups

Materials and MethodsMaterials and Methods
Women were assigned to the following Women were assigned to the following BMI-based categories: BMI-based categories: – Normal (18.5-24.9) Normal (18.5-24.9) – Class I obesity (30.0-34.9) Class I obesity (30.0-34.9) – Class II obesity (35.0-39.9)Class II obesity (35.0-39.9)– Class III (morbid/extreme obesity) (≥40)Class III (morbid/extreme obesity) (≥40)
Underweight mothers were excluded Underweight mothers were excluded

Materials and MethodsMaterials and MethodsDifferences between obese and non-obese Differences between obese and non-obese mothers in socio-demographic features were mothers in socio-demographic features were examined using the following characteristics: examined using the following characteristics: – Race (categorized as black or white) Race (categorized as black or white) – Maternal age (categorized as < 35 or ≥35 years)Maternal age (categorized as < 35 or ≥35 years)– Marital status (married or unmarried) Marital status (married or unmarried) – Educational status (<12 or ≥12 years) Educational status (<12 or ≥12 years) – Cigarette smoking during pregnancy (yes or no)Cigarette smoking during pregnancy (yes or no)– Adequacy of prenatal care (adequate or inadequate)Adequacy of prenatal care (adequate or inadequate)
assessed using the revised graduated index algorithmassessed using the revised graduated index algorithm
based on the trimester prenatal care began, number of visits, based on the trimester prenatal care began, number of visits, and the gestational age of the infant at birth and the gestational age of the infant at birth

Materials and MethodsMaterials and Methods
Documentation of certain morbidities on United States Documentation of certain morbidities on United States birth certificates did not become official until 1989birth certificates did not become official until 1989
Thus, comparison of the following complications was Thus, comparison of the following complications was restricted to the period 1989 through 1997:restricted to the period 1989 through 1997:– Anemia Anemia – Insulin-dependent diabetes mellitus Insulin-dependent diabetes mellitus – Other types of diabetes mellitus Other types of diabetes mellitus – Chronic hypertension Chronic hypertension – Pre-eclampsia Pre-eclampsia – EclampsiaEclampsia– Abruptio placentaAbruptio placenta– Placenta previa Placenta previa

Materials and MethodsMaterials and Methods
The outcome of interest was neonatal The outcome of interest was neonatal mortality mortality – defined as death occurring from the day of defined as death occurring from the day of
birth (day 0) to 27 days after birth (day 27)birth (day 0) to 27 days after birth (day 27)– further subdivided into:further subdivided into:
early neonatal mortality (from day 0 to day 6)early neonatal mortality (from day 0 to day 6)
late neonatal mortality (from day 7 to day 27)late neonatal mortality (from day 7 to day 27)

Statistical AnalysisStatistical Analysis
Neonatal mortality rates were computed by Neonatal mortality rates were computed by dividing the number of neonatal deaths by total dividing the number of neonatal deaths by total live births and multiplying by 1000live births and multiplying by 1000
Chi-square test was used to determine Chi-square test was used to determine differences in socio-demographic characteristics differences in socio-demographic characteristics and maternal pregnancy complications between and maternal pregnancy complications between obese and non-obese mothersobese and non-obese mothers
Chi-square for trend was applied to assess a Chi-square for trend was applied to assess a dose-response relationship between severity of dose-response relationship between severity of maternal obesity and neonatal mortality maternal obesity and neonatal mortality

Statistical AnalysisStatistical Analysis
Cox Proportional Hazards Regression models Cox Proportional Hazards Regression models were used to generate risk estimates after were used to generate risk estimates after confirming the non-violation of the proportionality confirming the non-violation of the proportionality assumption assumption
Adjusted hazards ratios were derived by loading Adjusted hazards ratios were derived by loading all variables considered to be potential all variables considered to be potential confounders into the model confounders into the model
The Robust Sandwich estimator was used to The Robust Sandwich estimator was used to adjust for intracluster correlation because the adjust for intracluster correlation because the dataset contained successive pregnanciesdataset contained successive pregnancies55

Statistical AnalysisStatistical Analysis
All tests of hypothesis were two-tailed with All tests of hypothesis were two-tailed with a type 1 error rate fixed at 5% a type 1 error rate fixed at 5%
SAS version 9.1 (SAS Institute, Cary, NC) SAS version 9.1 (SAS Institute, Cary, NC) was used to perform all analyses was used to perform all analyses
Study was approved by the Office of the Study was approved by the Office of the Institutional Review Board at the Institutional Review Board at the University of South Florida.University of South Florida.

RESULTSRESULTS

ResultsResults
Prevalence of Obesity = 9.5%Prevalence of Obesity = 9.5%– 12.8% and 8.9 % among black and white mothers 12.8% and 8.9 % among black and white mothers
respectively; p <0.01 respectively; p <0.01
Class I obesity - 82,603 or 5.9% Class I obesity - 82,603 or 5.9%
Class II obesity - 33,074 or 2.3%Class II obesity - 33,074 or 2.3%
Class III obesity - 17,699 or 1.3% Class III obesity - 17,699 or 1.3%

ResultsResults
Black preponderance regardless of obesity Black preponderance regardless of obesity subclass: subclass: – Class I (7.5% versus 5.6%; p <0.01) Class I (7.5% versus 5.6%; p <0.01) – Class II (3.2% versus 2.2%; p <0.01)Class II (3.2% versus 2.2%; p <0.01)– Class III (2.1% versus 1.1%; p <0.01)Class III (2.1% versus 1.1%; p <0.01)

Comparison of obese and non-obese mothers by selected socio-demographic characteristics, Missouri, 1978-1997
Obese (N=133,376)
%
Non-Obese (N=1,272,322)
%
P-value
Maternal Age ≥ 35 years 10.0 6.4 <0.01
Parity Multiparous 67.0 57.2 <0.01
Race Black White
20.779.3
14.885.2
<0.01
Education ≥ 12 years 80.9 79.2 <0.01
Married Yes 73.1 75.9 <0.01
Smoking Yes 22.3 26.2 <0.01
Adequate Prenatal Care Yes 43.4 39.6 <0.01
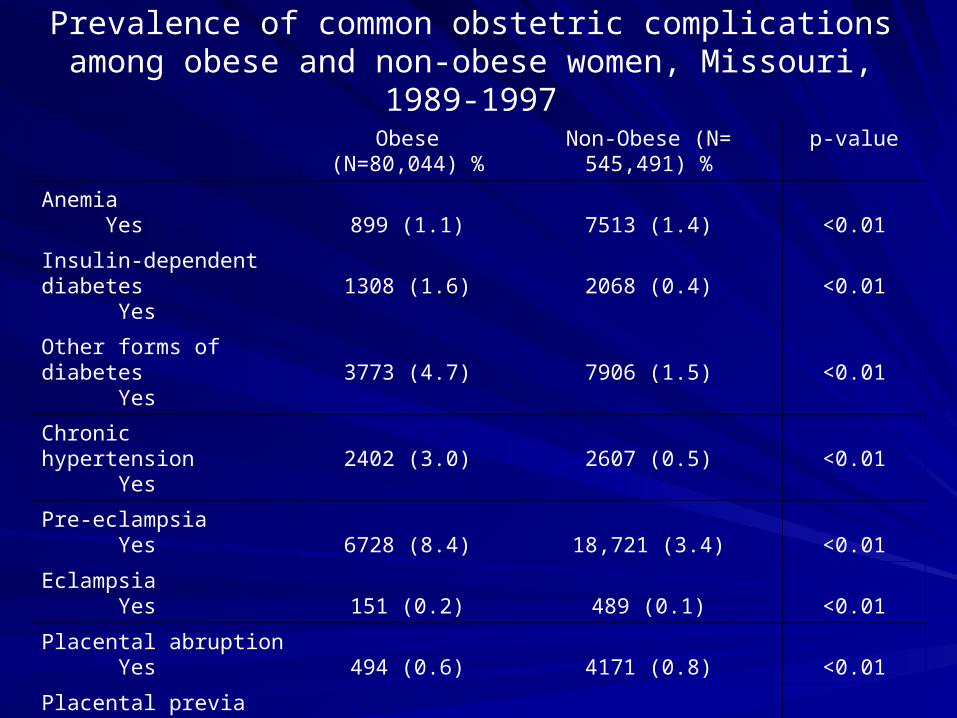
Prevalence of common obstetric complications among obese and non-obese women, Missouri, 1989-1997
Obese (N=80,044) %
Non-Obese (N= 545,491) %
p-value
Anemia Yes 899 (1.1) 7513 (1.4) <0.01
Insulin-dependent diabetes Yes
1308 (1.6) 2068 (0.4) <0.01
Other forms of diabetes Yes 3773 (4.7) 7906 (1.5) <0.01
Chronic hypertension Yes 2402 (3.0) 2607 (0.5) <0.01
Pre-eclampsia Yes 6728 (8.4) 18,721 (3.4) <0.01
Eclampsia Yes 151 (0.2) 489 (0.1) <0.01
Placental abruption Yes 494 (0.6) 4171 (0.8) <0.01
Placental previa Yes 264 (0.3) 2113 (0.4) <0.01
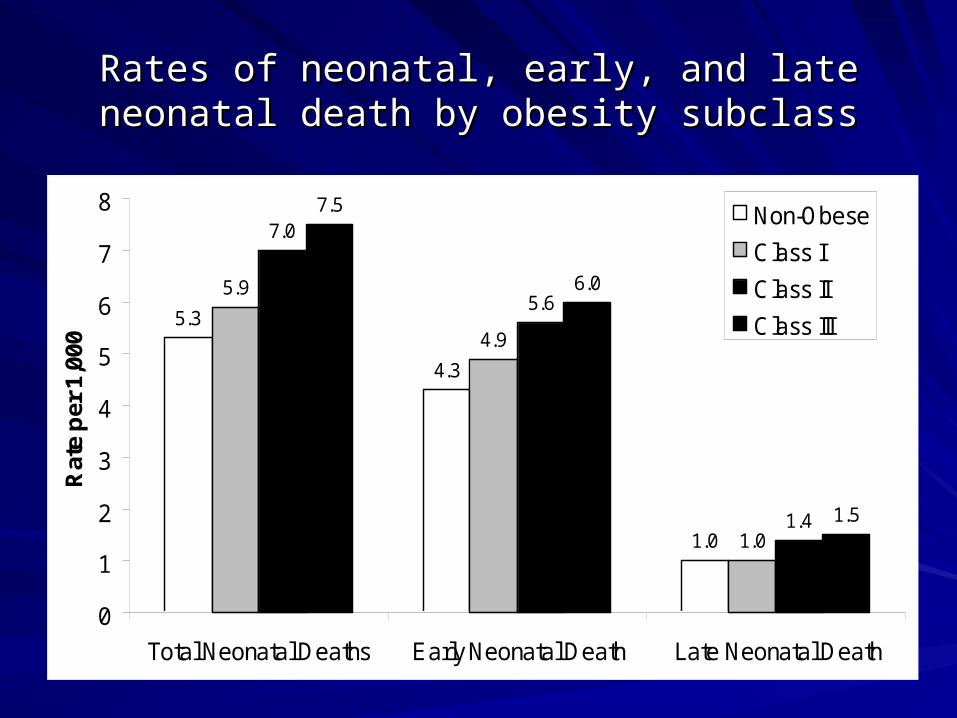
Rates of neonatal, early, and late neonatal death Rates of neonatal, early, and late neonatal death by obesity subclassby obesity subclass
5.3
4.3
1.0
5.9
4.9
1.0
7.0
5.6
1.4
7.5
6.0
1.5
0
1
2
3
4
5
6
7
8
Total Neonatal Deaths Early Neonatal Death Late Neonatal Death
Rat
e p
er 1
,000
Non-Obese
Class I
Class II
Class III
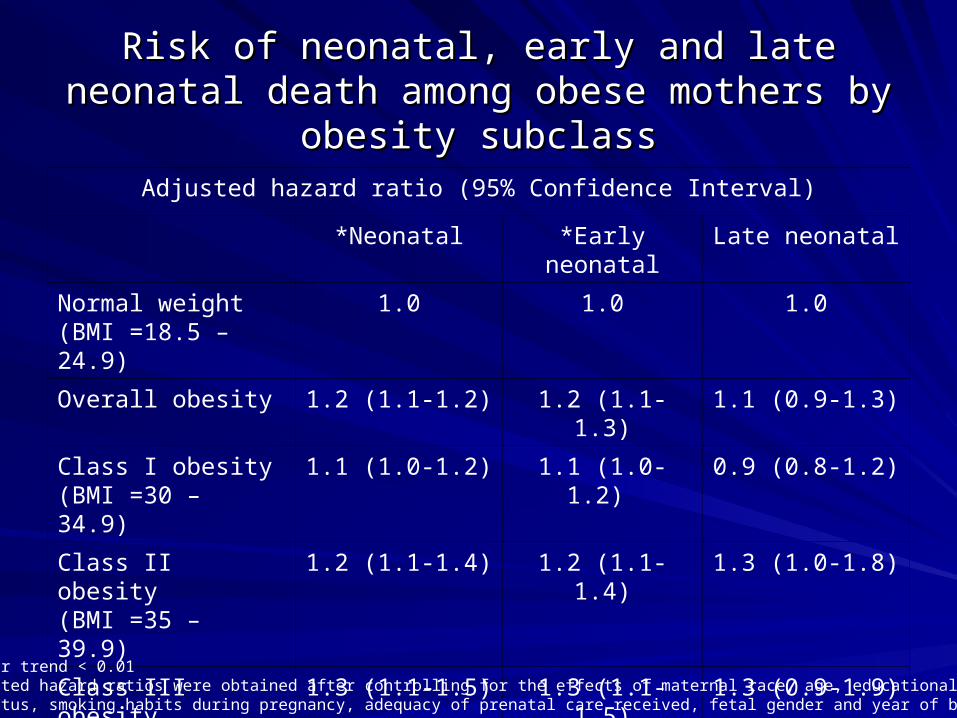
Risk of neonatal, early and late neonatal death Risk of neonatal, early and late neonatal death among obese mothers by obesity subclassamong obese mothers by obesity subclass
Adjusted hazard ratio (95% Confidence Interval)
*Neonatal *Early neonatal Late neonatal
Normal weight(BMI =18.5 – 24.9)
1.0 1.0 1.0
Overall obesity 1.2 (1.1-1.2) 1.2 (1.1-1.3) 1.1 (0.9-1.3)
Class I obesity(BMI =30 – 34.9)
1.1 (1.0-1.2) 1.1 (1.0-1.2) 0.9 (0.8-1.2)
Class II obesity(BMI =35 – 39.9)
1.2 (1.1-1.4) 1.2 (1.1-1.4) 1.3 (1.0-1.8)
Class III obesity(BMI ≥40)
1.3 (1.1-1.5) 1.3 (1.1-1.5) 1.3 (0.9-1.9)
*P value for trend < 0.01Note: Adjusted hazard ratios were obtained after controlling for the effects of maternal race, age, educational achievement,marital status, smoking habits during pregnancy, adequacy of prenatal care received, fetal gender and year of birth.

Black-White disparity risk for neonatal, early and late Black-White disparity risk for neonatal, early and late neonatal mortality associated with obesity [normal weight neonatal mortality associated with obesity [normal weight
white mothers (18.5-24.9) are the referent category]white mothers (18.5-24.9) are the referent category]
Neonatal Early Late
Adjusted hazard ratio (95% Confidence Interval)
*Black White *Black White *Black White
Overall Obesity1.8
(1.6-2.0)1.0
(0.9-1.1)1.8
(1.6-2.0)1.0
(0.9-1.1)1.6
(1.2-2.1)0.9
(0.8-1.2)
Class I1.6
(1.3-1.8)0.9
(0.8-1.1)1.6
(1.3-1.9)1.0
(0.9-1.1)1.5
(1.0-2.1)0.8
(0.6-1.0)
Class II1.9
(1.5-2.4)1.1
(0.9-1.3)2.0
(1.5-2.5)1.1
(0.9-1.3)1.6
(1.0-2.8)1.2
(0.9-1.8)
Class III2.0
(1.4-2.4)1.1
(0.9-1.4)1.9
(1.4-2.5)1.1
(0.8-1.4)1.9
(1.0-3.4)1.1
(0.7-1.9)
*P for trend < 0.01; N = number of deathsNote: Adjusted hazard ratios were obtained after controlling for the effects of maternal age, educational achievement, marital status, smoking habits during pregnancy, adequacy of prenatal care received, fetal gender and year of birth.
SummarySummaryWe found an association between maternal We found an association between maternal obesity and neonatal mortalityobesity and neonatal mortality
The positive association restricted only to obese The positive association restricted only to obese black mothers. White obese mothers did not black mothers. White obese mothers did not show an association show an association
The higher the gradation of obesity the more The higher the gradation of obesity the more pronounced the black-white risk differential for pronounced the black-white risk differential for neonatal mortalityneonatal mortality
Early rather than late neonatal death appears to Early rather than late neonatal death appears to be the major contributor to the preponderance of be the major contributor to the preponderance of neonatal deaths among obese black mothersneonatal deaths among obese black mothers

DiscussionDiscussionA potential explanation for the black-white A potential explanation for the black-white disparity is differences in access to caredisparity is differences in access to care
However, after adjusting for the adequacy of However, after adjusting for the adequacy of prenatal care received, the disparity still prenatal care received, the disparity still persistedpersisted– indicating that the obesity-associated black-white indicating that the obesity-associated black-white
disparity in neonatal mortality is independent of disparity in neonatal mortality is independent of access to prenatal care access to prenatal care
Nonetheless, access to care cannot be Nonetheless, access to care cannot be dismissed as a factor, because the adequacy of dismissed as a factor, because the adequacy of prenatal care index does not take into account prenatal care index does not take into account the quality of care received the quality of care received

DiscussionDiscussion
Results showed a higher frequency of diabetes, chronic Results showed a higher frequency of diabetes, chronic hypertension and pre-eclampsia among obese women hypertension and pre-eclampsia among obese women for those years for which data were officially available in for those years for which data were officially available in the United Statesthe United States
Contribution of these complications to adverse outcomes Contribution of these complications to adverse outcomes on the infant as reported in the literature remains unclear on the infant as reported in the literature remains unclear
However, our findings did not indicate that diabetes and However, our findings did not indicate that diabetes and hypertensive disorders might partially explain the hypertensive disorders might partially explain the association between maternal BMI and adverse association between maternal BMI and adverse pregnancy outcomespregnancy outcomes

LimitationsLimitationsLong period of follow-up which spanned almost 20 yearsLong period of follow-up which spanned almost 20 years– Different infant cohorts were aggregated and analyzed togetherDifferent infant cohorts were aggregated and analyzed together– Exposure to varying obstetric practices across the period of Exposure to varying obstetric practices across the period of
study, thus the findings might have been impacted by this cohort study, thus the findings might have been impacted by this cohort effect effect
– However, by controlling for year of birth in computing adjusted However, by controlling for year of birth in computing adjusted hazard estimates the influence of this potential source of bias on hazard estimates the influence of this potential source of bias on our results was minimized considerablyour results was minimized considerably
Inability to separate black and white non-Hispanics from Inability to separate black and white non-Hispanics from Hispanics because of the non-differentiation of ethnicity Hispanics because of the non-differentiation of ethnicity across this categorization in many of the recordsacross this categorization in many of the records
StrengthsStrengths
Population-wide study Population-wide study – Therefore, the results are minimally affected by Therefore, the results are minimally affected by
selection biases (e.g., referrals, etc), a source of selection biases (e.g., referrals, etc), a source of concern in data derived from individual health facilities concern in data derived from individual health facilities
– The findings are reasonably generalizable The findings are reasonably generalizable
This work adds new data to a domain that is still This work adds new data to a domain that is still poorly understood and under-researched poorly understood and under-researched

Public Health ImplicationsPublic Health Implications
The findings of this study have considerable The findings of this study have considerable implications in defining areas of intervention to implications in defining areas of intervention to reduce the persistent black-white disparity in reduce the persistent black-white disparity in neonatal and infant mortality in the United Statesneonatal and infant mortality in the United States
Since obesity is a modifiable condition, targeting Since obesity is a modifiable condition, targeting obese black women to reduce weight in the pre-obese black women to reduce weight in the pre-conceptional period could be a useful and conceptional period could be a useful and reasonable primary prevention strategy to curtail reasonable primary prevention strategy to curtail the excess neonatal mortality risks in blacksthe excess neonatal mortality risks in blacks

THANKSTHANKS

ReferencesReferences1.1. Sturm R. Increases in clinically severe obesity in the United States, Sturm R. Increases in clinically severe obesity in the United States,
1986-2000. Arch Intern Med 2003;163:2146-21481986-2000. Arch Intern Med 2003;163:2146-2148
2.2. Ferraro KF, Thorpe RJ, Jr, Wilkinson JA. The life course of severe Ferraro KF, Thorpe RJ, Jr, Wilkinson JA. The life course of severe obesity: does childhood overweight matter? J Gerontol B Psychol obesity: does childhood overweight matter? J Gerontol B Psychol Sci Soc Sci. 2003;58:S110-S119Sci Soc Sci. 2003;58:S110-S119
3.3. Fontaine KR, Redden DT, Wang C, Westfall AO, Allison DB. Years Fontaine KR, Redden DT, Wang C, Westfall AO, Allison DB. Years of life lost due to obesity. JAMA 2003;289:187-193of life lost due to obesity. JAMA 2003;289:187-193
4.4. Olshansky SJ, Passaro DJ, Hershow RC et al. A potential decline in Olshansky SJ, Passaro DJ, Hershow RC et al. A potential decline in life expectancy in the United States in the 21st century. N Engl J life expectancy in the United States in the 21st century. N Engl J Med 2005;352:1138-1145Med 2005;352:1138-1145
5.5. Lin DY, Wei LJ. The robust inference for the Cox proportional Lin DY, Wei LJ. The robust inference for the Cox proportional hazards model. J Am Stat Assoc 1989;84:1074-1078hazards model. J Am Stat Assoc 1989;84:1074-1078

Acknowledgements
This work was supported through a Young Clinical Scientist Award to Dr. Hamisu Salihu by the Flight Attendant Medical Research Institute (FAMRI). The funding agency did not play any role in any aspect of the study. The rest of the authors have no financial or conflict of interest disclosures to make. We thank the Missouri Department of Health and Senior Services for providing the data files used in this study.

Contact InformationContact Information
Hamisu Salihu, MD, PhDCOPH
13201 Bruce B. Downs Blvd., MDC 56Tampa, Florida 33612-3805
Tel: (205) 910-8720 / Fax: (813) 974-4719
E-mail: [email protected]